Embed Size (px)
Citation preview

Getting What You Pay For: The Productivity Impact of Incentive Pay Optimization*
Alec Levenson
Center for Effective Organizations Marshall School of Business, USC
Cindy Zoghi Bureau of Labor Statistics
Michael Gibbs University of Chicago Booth School of Business & IZA
George Benson College of Business Administration
University of Texas at Arlington [email protected]
May 18, 2010
Abstract We examine the effects of a firm’s attempt to adjust an existing incentive scheme to increase sales growth for direct store delivery workers. The altered incentive plan offered higher compensation for increased sales relative to the previous year, and lower compensation for failing to meet sales objectives. We surveyed workers at pilot and control sites before and after the change was intro-duced, gathering information on attitudes and self-reported ratchet effects, plus performance. Rel-ative to the control sites, average sales growth increased in the pilot sites by two percentage points, which provides a meaningful contribution to the firm’s profits. We find no evidence of in-creased distortion of effort or manipulation of the performance measure. Workers did not substan-tially change hours worked, the distribution of time spent on different tasks, or perform any tasks worse. We also find evidence of ratchet effects both before and after the pilot study. Workers re-port that they sometimes reduce performance to avoid having their target ratcheted up too much in the following year. We also find that an unplanned price increase midway through a fiscal year affected the extent of ratchet effects on incentives that year.
* Preliminary and incomplete; not for citation. All views expressed in this paper are those of the authors and do not necessarily reflect the views or policies of the U.S. Bureau of Labor Statistics. Gibbs gratefully acknowledges funding and hospitality from the Center for Corpo-rate Performance, Aarhus School of Business.
1
I. Introduction
Several studies have found large productivity effects from introducing pay for performance in
firms. These effects are partly due to incentive effects, and partly to sorting effects, as higher ability
workers find performance pay more appealing than lower ability workers do. Seiler (1984) finds that
workers paid by piece rate earn higher pay due in part to higher effort, and in part to a risk premium. La-
zear (2000) finds a 44% productivity increase in a windshield installation company, and attributes about
half of this to incentive effects and half to worker sorting. Paarsch and Shearer (1999, 2000) find a similar
productivity differential among tree planters who are paid piece rates, relative to those who are paid a
fixed salary. In a laboratory experiment, Cadsby, Song and Tapon (2007) find that incentive pay leads to
higher productivity among all workers, and that more risk-averse individuals both prefer a fixed salary
and are less productive under incentive pay.1
Economic theories suggest that design and implementation of even simple incentive schemes may
be complex. First, it is difficult for the firm to set the correct initial incentive intensity, since it is likely to
have imperfect information on how productive workers can be. It may then adjust the incentive intensity
once it observes the workers’ performance in response to the initial incentive. If workers anticipate this,
they may reduce effort to avoid having the rate lowered in the next period. This is known as the ratchet
effect (Roy 1952, Mangum 1962, Stiglitz 1975, Frexias, Guesnerie and Tirole 1985, Lazear 1986, Gib-
bons 1987), which may occur if the firm can commit ex ante to a fixed rate. The spinning industry in 19th
century England was able to avoid the ratchet effect through inter-firm collusion to keep piece rates fixed
(Lazonick 1981, Huberman 1986). The Lincoln Electric Company has been able to pay piece rates for
approximately one hundred years by developing a reputation for never lowering the piece rate, and offer-
ing guaranteed employment for all workers (Milgrom and Roberts 1995).
In this study, we examine the effects of a change from a linear incentive scheme to a slightly more
complex scheme, using personnel data from a large consumer products company. We study direct store 1 Harrison, Virick and William (1996) find higher turnover when sales representatives switch from a base pay plus commission reward structure to a commission-only pay system.

2
delivery workers who initially are paid a straight commission based on sales on their routes. Surveys indi-
cate that workers regularly withhold output in anticipation of ratchet effects in this firm. The firm tested a
change to the program designed to strengthen incentives and increase sales, in a pilot study. The new
compensation scheme offered a steeper incentive rate for sales around the target, plus a new base pay for
low sales. Compared to the initial pay plan, compensation was higher if sales exceeded the target, and
lower if they did not.
Prior to the program launch, average sales growth in the pilot sites was one percentage point low-
er than in the control sites. After the launch, average sales growth in the pilot sites exceeded that in the
control sites by one percentage point. Both differences are statistically and economically significant.
These results may not seem dramatic to those of other studies. However, other studies compared imple-
mentation of incentives to straight salary. We are studying the effects of smaller adjustments to an existing
incentive plan. The results do indicate the marginal changes to incentives lead to marginal changes in
effort. Moreover, the effect on firm profits of two percent greater sales growth is non-trivial. We find no
evidence of changes in distortion of effort or manipulation of the performance measure (which did not
change, though the stakes for not meeting target performance increased). Workers did not significantly
change total hours worked, the distribution of time spent on different tasks, or perform any tasks worse.
These results indicate that one way in which incentive schemes affect behavior is through the intensive
margin – working harder and more effectively for a given amount of time on the job – and not just the
extensive (time) margin.
We find some of the first empirical evidence of ratchet effects in firm incentive systems since
Roy’s famous paper (1952), both before and after the compensation system change. Target setting appears
to be linked to an employee’s prior performance, and employees are aware of this. Employees report that
they sometimes hold back performance to avoid a greater increase in next year’s target. We also find that
an unplanned price increase midway through a fiscal year affected the extent to which employees held
back performance to avoid ratcheting up of their target in the next year.
3
II. Company, Compensation Plans and Data
The company studied is in a consumer products industry and uses a direct store delivery (DSD)
system.2
Retail establishments sell a wide variety of products, so each manufacturer has minimal impact
on the flow of traffic into a store. Instead, competition for consumer dollars at the retail level takes place
among products that are substitutes in the consumer’s shopping cart: tobacco competes with alcohol, var-
ious drinks compete with each other, breakfast cereal competes with ready-to-eat breakfast items, over-
the-counter weight loss aids compete with comfort foods, etc. At the margin, manufacturers increase sales
through branding and marketing campaigns, price promotions, gaining additional shelf space at the retail
establishment, and varying the product mix available on the shelves. Of these, DSD employees can direct-
ly influence only the last two: gaining shelf space and optimizing product mix.
Under DSD, manufacturing companies take responsibility for shipping products from their
plants and warehouses directly to retailers, and for stocking the product on the shelves (versus using the
retailer’s warehouse and distribution systems). The focus of this study is the route representative, who is
responsible for four tasks: ordering the products, delivering the products to the retailer, stocking the prod-
ucts on the retailer’s shelves, and negotiating additional shelf space. With the exception of delivering the
product, all of the other tasks have a direct impact on sales, and require the driver to intelligently analyze
sales trends, manage relationships with store managers, and creatively market the product within the
store. Ordering affects product mix and avoids out-of-stock situations, stocking (location, neatness of the
display, rotating older products to the front, etc.) affects how customers choose which product to buy, and
gaining additional shelf space for displaying the product (at the expense of competing products) affects
total volume sold.
3
2 The data are confidential, including the identity of the firm, region, or specific products it sells. We cannot report actual sales, compensation, number of employees, etc., though we have full access to all detailed information. Some figures reported here are disguised (e.g., by adding or subtracting a constant to change the mean value).
3 Prices are set centrally rather than by DSD employees or store managers. That is true for most products sold in these types of retail stores.

4
A. Initial and New Pay Schemes
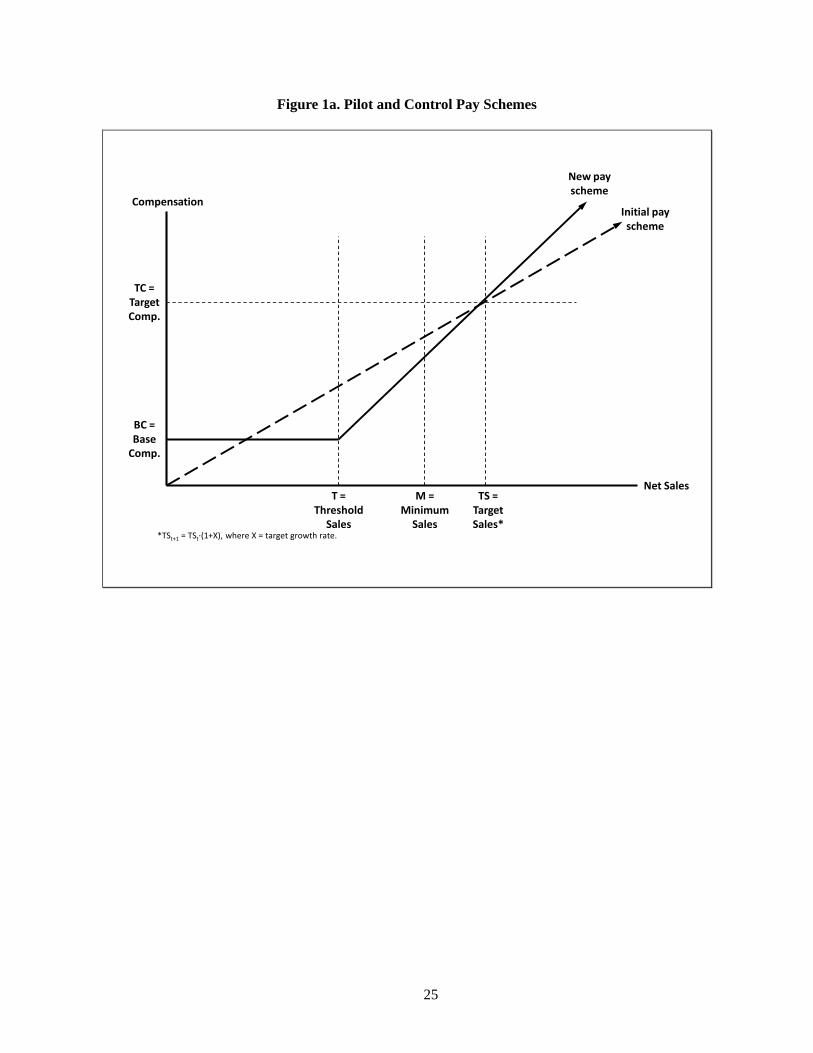
Figure 1a illustrates the original and pilot incentive schemes. Both are linear commissions on the
dollar value of net sales revenue (gross sales net of returned / unsold product). There are a number of
advantages to this scheme. It is easy to understand by employees and supervisors. There is high transpa-
rency because there is little dispute regarding the dollar volume of total sales: employees observe which
products sell at what prices, and which do not and are returned to the warehouse. Finally, the scheme is
easy to administer.
The performance measure should provide relatively well-balanced multitask incentives and thus
not distort incentives away from optimal behavior much. As long as profit margins do not vary much
across individual company products, revenue provides incentives to manage tradeoffs between sales of
different products in the same store. It also motivates the employee to effectively allocate effort to differ-
ent tasks. The measure also motivates the employee to avoid excess inventory, since unsold product is not
included in sales (the employee is not charged for the opportunity cost of excess inventory in the store or
truck, but that is likely to be a small cost for this firm’s products). Overall, this performance measure
seems to have relatively good properties for an incentive scheme for DSD employees.
The commission rate in the initial pay scheme is determined by two numbers: target compensa-
tion TC, and target sales TS. Once those are determined, the commission rate is simply the slope, TC/TS.
The company divides DSD employees into three categories based on the size of the route. Within each
category, it attempts to design specific routes – a set of stores in the same geographical location – so that
expected compensation will fall in a fairly narrow range, assuming equal ability and effort of the em-
ployee.
Target sales TS for each employee are set using the following general procedure. First, dollar
profit growth targets are set for senior management. Those cascade down to the middle and frontline
managers through the annual budget and planning process. Targets for individual employees are then
based on their manager’s growth goal, historical performance of stores on the route, and relative perfor-
mance of the driver. Historical performance is intended to account for store-specific factors affecting
5
growth possibilities. Relative performance is determined via management’s subjective assessment of
whether the employees grow their route sales at a sufficiently fast pace, given factors outside their control
such as population growth. Employees deemed to have provided relatively low effort may be given higher
growth targets in the subsequent year. Any adjustments to an individual employee’s growth target lead to
offsetting adjustments for all other routes in a geographical area. For example, if there are N routes and X
dollars are subtracted from one route’s target, X/(N–1) dollars are distributed to the targets for other
routes in that area. In practice, the most important determinant of an employee’s target sales TS is the
overall growth goal for that region.
There are two concerns with implementation of the initial incentive scheme: the strength of incen-
tives, and the possibility of ratchet effects. First, DSD jobs typically have high sales volume of small,
inexpensive products. It is not uncommon for sales on a route to average $10,000 per week or more, for
total annual sales around $500,000. DSD employees typically are high school graduates or have some
college education. Assuming target compensation of approximately $40,000, the commission rate would
need to be 8 percent; higher expected sales would mean an even lower commission rate. Thus a key ques-
tion is whether the commission rate in the initial plan provides sufficient incentive to elicit effort. For
example, additional sales of $500/week, added up over all employees’ routes, could significantly help a
company meets its profit objectives. Yet at 8 percent commission, and assuming a marginal tax rate of 33
percent, an extra $500/week in sales translates into only about $25/week extra in take-home pay. This is
one reason the company considered changing away from a simple commission rate compensation system.
The pilot pay scheme was designed to provide stronger incentives for employees to meet or ex-
ceed their targets, so that management would be better able to meet overall growth goals set for them by
higher levels of management. This was accomplished by establishing base compensation BC, or mini-
mum salary paid regardless of volume, and a steeper commission rate paid out only for sales above a thre-
shold T, as shown in Figure 1a. Interestingly, this is precisely the kind of change modeled by Oyer (2000),
with the same intention of increasing the incentive intensity in a desired range of output. For sales above
TS, compensation under the pilot scheme was higher than under the original scheme, and vice versa for

6
sales below TA. The company set the new compensation formula so that compensation would be exactly
equal in both plans when sales equaled the growth target. The base pay is intended to provide a safety net
to workers in the case of natural disasters or other calamities that might cause consumers to stop purchas-
ing products other than bare necessities for extended periods of time. In normal circumstances, workers
are expected to achieve at least minimum expected sales M > T, so that base pay B will be non-binding.
While a worker will not face termination for performing below M in a single month, consistently per-
forming below M will trigger termination (this was also true under the old system). In the pilot plan, the
worker knows BC, T, and the commission rate, but M is implicit.
The second concern is that both plans may be subject to ratchet effects. To the extent that an em-
ployee’s new target is calculated as a percentage increase from the prior year – an important component in
target setting in this company – targets will increase more for employees with higher performance and
vice versa. Once employees learn about the link between their sales and their next target, they will have
somewhat muted incentives. Even if new targets were not based in part on percentage growth, it seems
likely that employees with higher performance would tend to be given higher targets next year, which
would have the same effect. The problem is compounded if incremental increases in sales are more diffi-
cult for the employee to achieve, the higher are total sales, as seems likely.
Ratchet effects may be compounded by the firm’s practice of route “rebalancing.” If expected
sales on a route grow too large, the job may become difficult for one employee to handle in a normal
workweek. In such cases the firm adjusts the set of retail stores in the employee’s route to bring volume
back in line with the company’s view of physical limitations of DSD employees in performing the job.
Such rebalancing typically takes place at most once per year, sometimes less often. Route rebalancing is
one of the most disliked and distrusted management processes, even though it is conducted using objec-
tive criteria and linear programming routines that maximize efficiency and fairness. The company uses
lump-sum pay adjustments to ease the impact on total compensation, but those are imprecise. Moreover,
the effect of rebalancing on an employee’s target sales for the next year is unclear. While an employee’s
target sales should fall with rebalancing, the percentage growth in that target over the prior year might be
7
larger or smaller with rebalancing, depending on which stores are kept in or eliminated from the route. In
a previous survey of DSD employees in this company, one-fifth indicated that they managed sales growth
on their route to avoid rebalancing.
B. Pilot Inception and Data Collection
The company decided to initially change the compensation scheme at two of their sites. Two of
the authors, Benson and Levenson, were engaged by the company to conduct an external evaluation of the
compensation change. They had no role in design of the pilot incentive scheme. The external evaluation
entailed working closely with corporate and local management to identify issues to be addressed by the
evaluation, conduct interviews at pilot and control sites after launch of the new scheme, and design and
field two surveys to measure before-and-after impacts of the change.
The sites chosen for the pilot program were representative of the middle of the company’s distri-
bution of growth performance. They were selected to be as normal as possible, meaning that sites with
known management problems or peculiar demand or labor market characteristics (e.g., a highly depressed
local economy) were excluded. A site consists of a contiguous geographic area covering a distinct con-
sumer and labor market. For example, a small- or medium- sized city and surrounding communities might
constitute a site. To keep the span of control and complexity of site management at a reasonable level,
each site ranges from approximately 80 to 120 routes. Very large urban areas contain multiple sites, but
the area covered by each site within those large urban areas is drawn to correspond to natural community
divisions.
For each pilot site, two control sites were chosen – one that matched as closely as possible in
terms of pre-pilot performance, and one that did not necessarily match as well in pre-pilot performance
but had demand characteristics very similar to the pilot site. Prior to initiating the change, a survey was
distributed for the workers to fill out in private and return by mail to the external evaluators. Workers at
pilot and control sites were not informed of plans to experiment with a revised pay plan, nor that they
were considered to be pilot or control sites. This is important, because it means that pilot employees did

8
not alter their behavior in anticipation of a higher commission rate. Workers were given paid time to fill
out the surveys and were assured that their confidentiality would be maintained. All subsequent matching
with archival data was performed by the external evaluators. Only summary information from the surveys
that could not be linked back to any individual’s responses was reported to the company as part of the
evaluation process.
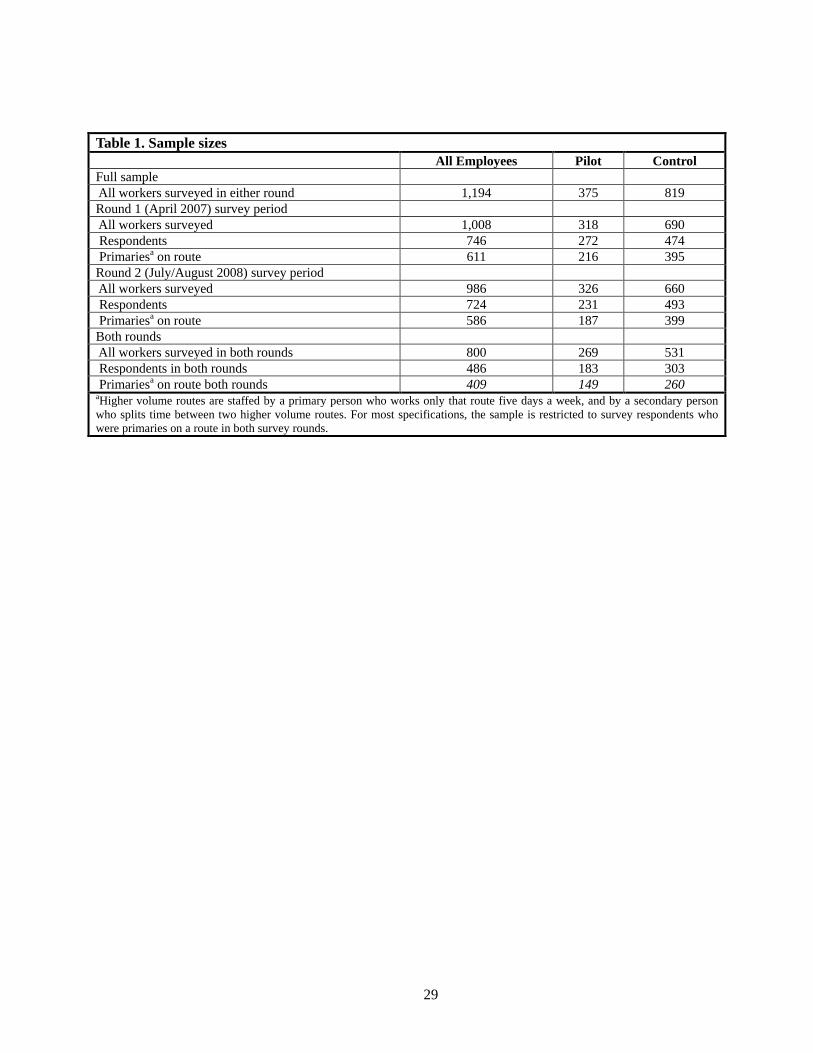
1,008 surveys were distributed and 746 were returned, for a response rate of 74 percent. Table 1
shows that of these 746 respondents, 272 were workers in the pilot sites, and 474 were in the control sites.
Additionally, only 611 (216 in pilot sites and 395 in control sites) of these are considered “primary”
workers. Higher volume routes are staffed by a primary person who works only that route five days per
week, and by a secondary person who is responsible for the other two days per week (ensuring the higher
volume routes are staffed seven days/week) and splits time between two higher volume routes. The pri-
mary person has the bulk of control over performance on the route, so we limit the analysis to primaries
only. We also exclude new hires and others who are not dedicated to specific routes and spend their time
filling in on routes where there is a temporary vacancy.
The survey obtained basic worker demographic information: age, race, gender, marital status,
number of children, and education level; years of experience in the current position, in the company at
any position, outside the company in other DSD jobs, and general experience of any kind; and informa-
tion on second-job holding and commuting. Additional questions included hours worked each week, and
how that time was spent between a number of job tasks. Finally, a large number of Likert-scaled questions
measured workers’ risk aversion, motivation, selling techniques, relationship and interactions with super-
visor, organizational support, understanding of the sales goals and pay scheme, sense of pay equity, job
satisfaction, pay satisfaction, job security and intention to quit. These questions were selected from estab-
lished constructs used within the management research literature to analyze these issues (e.g., Park and
Holloway 2003, Fang, Evans and Zou 2004; Tekleab, Bartol and Liu 2005).
The compensation change was introduced to the pilot sites in July and August 2007, after all the
surveys had been returned. Management held a site-wide meeting to announce the new pay system, and
9
supervisors subsequently spent many hours answering workers’ questions. After giving the new pay
scheme almost two years to affect workers’ performance and attitudes, the survey was repeated in May
2009. This round, 986 surveys were distributed, and 724 of them were returned, for a response rate of 75
percent. As Table 1 indicates, 231 of the second round respondents were in pilot sites, and 493 were in
control sites. Among the 586 that were considered primary route workers, 187 were in pilot sites, and 399
were in control sites. As the bottom rows of Table 1 show, of those who returned the round one survey
(746), 608 received a round two survey, with the remainder having left the company or taken a different
job within the company. 486 received and returned a round two survey—149 in pilot sites and 260 in
control sites. Since we are mainly interested in the difference-in-difference between round one and round
two at the pilot sites compared to round one and round two at control sites, this is the sample that our
remaining tables employ.
These survey data were then linked to personnel data by the external evaluators. Sales growth was
provided by the company for the specific retail establishments on the worker’s route, relative to the same
establishments in previous periods. The average percent of plan attained for several different ranges of
periods was provided, from which the number of times the workers achieved their sales plans was calcu-
lated. Additionally, supervisor ratings of the workers’ sales performance, as well as driving and delivery
performance and merchandising/customer service performance, all from the supervisor surveys, were
matched to the survey data.
Between administration of the first and second surveys, in the middle of 2008, the company insti-
tuted a price increase that was unusual in both size and timing. Price increases are usually introduced
around the beginning of the calendar year, which facilitates setting sales targets at the corporate level that
are incorporated at all levels from senior leadership down to DSD employees. Input price pressures had
been building for a while, but the company had previously resisted passing them along to customers for
fear of losing market share. By mid-2008, the recession and slower sales threatened attainment of corpo-
rate profit goals. The company decided to put through a relatively large and extensive price increase that
covered a much broader set of products than the usual end-of-year adjustments. Target sales (TS) for em-

10
ployees were not changed. The increase had not been accounted for in route planning for the year, and
represented an unexpected scenario to the local management and DSD employees. Questions about the
impact of the price increase on employees’ ability to meet sales targets were included in the second round
survey. At face value it appears that the price increase should have affected employees in the pilot and
control sites equally.
C. Descriptive Statistics
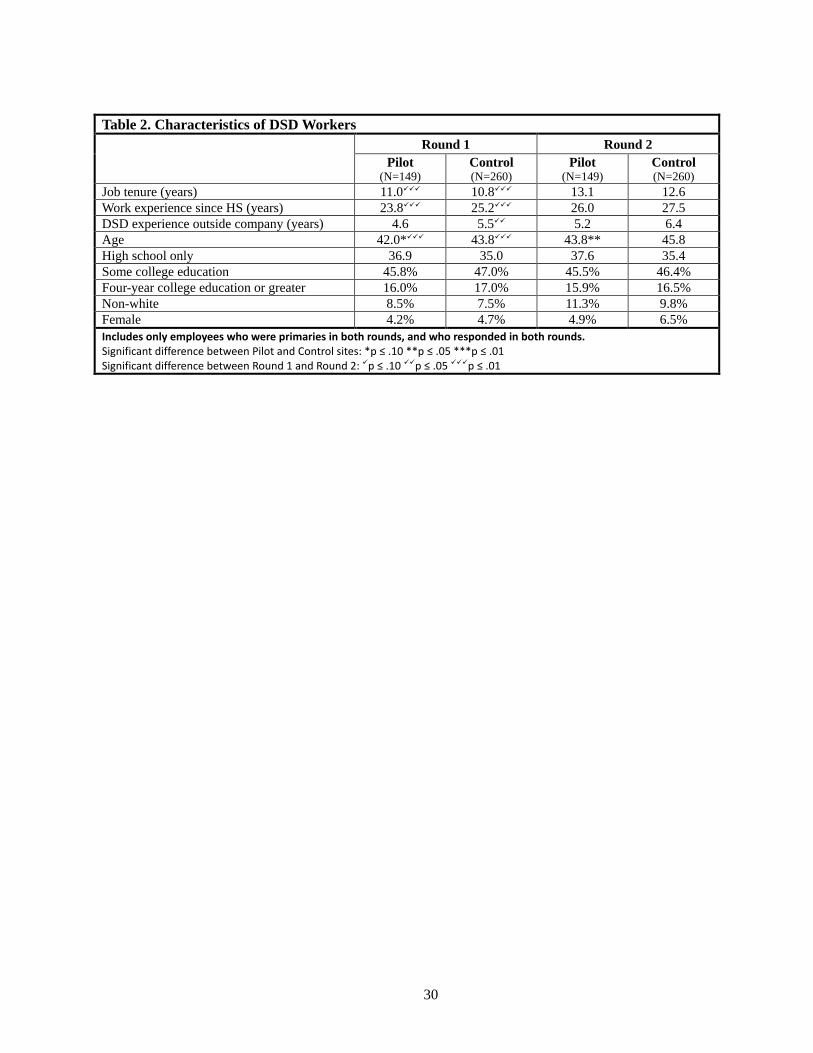
Table 2 provides summary statistics. We see that the demographics of pilot and control employees
are very similar; the only statistically significant difference is that pilot workers are slightly younger.
They are predominantly male. Around 35 percent have a high school education, 46 percent have some
college, and more than 16 percent have a Bachelor’s degree or more. Around 8-10 percent are non-white.
The employees have fairly high job tenure,4
Table 3 shows that the workers in the pilot sites seemed to understand clearly how the new pay
scheme affected their incentives. When asked how important growth potential and high volume are to
their choice of routes, they initially respond similarly to those in the control sites. After the pilot introduc-
tion, however, they indicated a much stronger preference for growth potential and a lower preference for
high volume, consistent with the incentives of the new pay scheme. Workers in pilot sites significantly
increased their stated commitment to their sales goals, which was an intention of the new incentive pro-
averaging 11 years with the company in round one, increas-
ing to 12½ to 13 years by round two. This is partly due to the exclusion of new hires, who are not prima-
ries on a route. This is also a job that encourages high tenure to some extent, because seniority determines
priority on bidding for route assignments. Primary route employees are around 42-43 years old in round
one, and have 24-25 years of general work experience, 5 of which is as a DSD worker for another compa-
ny. While Table 2 shows that these numbers change significantly between round one and round two as
expected, any differences between pilot and control groups are insignificant.
4 According to the BLS (http://www.bls.gov/news.release/tenure.nr0.htm), median job tenure for all U.S. workers was 4.0 years in 2006 and 4.1 years in 2008.
11
gram.5
Workers in the pilot sites were less likely than those in control sites to agree that goals were fair
after introduction of the pilot plan, despite answering similarly in round one. We take this as evidence of
the heightened importance of the goals in the employees’ minds, since there was no major change in the
goal-setting process. If anything, the fairness of the process might have increased because management
knew that they had to be even surer to get the process right once the compensation scheme changed. They
consequently increased their efforts in the pilot sites post-implementation to ensure that the site-wide
sales growth goal was distributed across routes in accordance with underlying business conditions and
growth potential on each route. (This was confirmed through interviews with corporate and local man-
agement at each site.) Thus the increase in stated unfairness of the goals most likely reflects their heigh-
tened importance under the new compensation scheme (see also the discussion of goal importance conse-
quences below).
Workers in the pilot sites also slightly increased their tolerance for risk in terms of route prefe-
rence. Despite the added complexity of the new pay structure, there was no significant difference in the
pilot workers’ understanding of their goal before the pilot start versus after.
III. Empirical Predictions
We now discuss the likely effects of the pilot program compared to the original incentive scheme.
Our primary interest is in incentive and ratchet effects. Figure 1b focuses on the portion of Figure 1a in
the range where virtually all employees will operate, since those with performance too close to M are
likely to be terminated quickly. Figure 1b shows indifference curves for an employee whose initial per-
formance is exactly at target sales TS. The indifference curves point toward the northwest since lower
output implies less effort/ higher leisure. At that point, the employee’s optimum effort and output will
increase by switching to the pilot pay plan, precisely the effect the firm intended. Moreover, the em-
5 Goal commitment is an index, obtained through factor analysis, of four similarly worded survey questions about a worker’s commitment to achieving the sales goal. Goal fairness is a similar index based on three questions about fairness of goal setting procedures.
12
ployee’s utility will rise. If an employee’s output were initially to the right of that point, at output higher
than TS, utility would rise with the pilot program. The opposite would hold if his output were initially
below TS. In both of those latter cases the effect on output is ambiguous because it is possible that income
effects dominate substitution effects. However, that seems quite unlikely since the change in total com-
pensation in going from the initial pay plan to the pilot is small. Therefore, we predict that performance
will be higher for employees in the pilot plan than in the initial plan. DSD jobs involve multitasking as
described above. Therefore, increased total performance could come via the extensive margin of greater
hours worked, or changes in allocation of time to different tasks. We examine both in the empirical work.
Lazear found that the range of output increased when Safelite implemented pay for performance.
We will examine whether similar effects occur in the pilot study. In Lazear’s case the logic was that lower
ability workers will be more likely to quit, and high ability worker’s more likely to apply for a job, after
Safelite implemented piece rates. Our logic is not based on selection via recruiting and turnover, but in-
stead on the different effects of the incentive change on the same set of workers. In the pilot study, work-
ers have strong incentives to achieve at least target sales each year. If they can achieve that level, they
then have marginal incentives to increase sales incrementally. Thus, we might expect that performance
becomes more skewed to higher output.
Lazear also found significant turnover from Safelite’s new pay scheme. We expect turnover to be
highest when making large changes, such as from an hourly pay rate with no incentive component to a
piece rate system, as in Safelite. In the present case, we expect the “fit” story to be less important because
compensation both before and after the change was based on incentive pay tied to the volume of sales.
What changed was the relative emphasis of different components of the incentive pay. There are two rea-
sons for potentially increased turnover as a result of the compensation scheme change. Lower productivi-
ty workers who cannot meet the new performance standards, and thus stand to receive a cut in compensa-
tion, might choose to leave voluntarily. Involuntary turnover might also increase if the company couples
the new compensation scheme with an increased performance management emphasis on meeting the
growth targets, treating below-average performance as a possible cause for termination. We test for these
13
effects by examining the productivity of leavers in the pilot versus control sites, and the workers’ and
managers’ responses to questions about termination risk.
Ratchet effects are extremely difficult to model formally, especially with closed-form solutions,
even for linear incentive schemes (Gibbons 1987).6
Ratchet effects should also depend on some other variables. The greater the expected growth in
target compensation TC next year, the smaller the ratchet effect. We have no information on worker ex-
pectations about growth in compensation during the period studied, so cannot study that prediction. If we
interpret a as worker ability, then higher ability workers should have stronger ratchet effects. We will at-
tempt to construct proxies for variation in worker talent to see if there is any evidence for such an effect.
Finding such evidence would suggest that effort and ability are complementary in producing output, in-
stead of additive. Finally, the larger the firm’s grow rate in targets r, the stronger the ratchet effect.
To illustrate why this is the case, consider how this
firm sets the commission in the second period as a function of performance in the first period, b2 =
TC/TS. Ratchet effects will occur if TS is a function of prior output. Suppose a simple model for output,
salest = a·et + εt, where a = marginal product of effort or employee ability, e = effort, and ε = performance
measurement error. Further assume, close to what the firm actually does, that TS is a simple percentage
increase r over last period output, TSt+1 = (a·et+εt)(1+r). If so, the second period commission is bt+1 =
TC/(a·et+1+εt+1)(1+r). From the perspective of period t, bt+1 is a random variable, but analysis of its proper-
ties is difficult since it has the stochastic term ε1 in its denominator. However, we can see where the rat-
chet comes from right away, since ∂b2/∂e1 = –TC/e1 < 0. The harder the employee works in period 1, the
smaller the commission in period 2.
An interesting question is how ratchet effects would be affected by using relative performance
evaluation to set targets for performance in period 2. The answer depends on how information about rela-
tive performance is set, which in turn depends on how the firm views the information in relative perfor-
mance. Suppose first that the firm views relative performance as informative about relative levels of ef- 6 Lazear (1986) analyses a closed-form ratchet effect model, but in his model the ratchet is done to base pay, not the commission rate, which makes the analysis tractable.

14
fort. It would then tend to set higher targets for workers who had relatively low performance last year,
which would tend to mitigate the ratchet effect. Slacking off lowers the base level of performance which
the firm uses to set the worker’s target next year, but it also lowers the worker’s relative performance,
which works to increase the target for next year. But suppose instead that the firm views relative perfor-
mance as informative about whether the target was set too high or too low this year (since job difficulty
varies across workers). In that case, it would tend to lower targets for workers with relatively low perfor-
mance, which would increase the ratchet effect.
IV. Worker Responses to the Pilot Compensation Plan
A. Changes in Labor Supply and Effort
Our first hypothesis is that given the small nature of the income effects, we expect sales to grow
faster in the pilot sites than the control sites after the introduction of the new compensation scheme. Table
4.A reports the changes in median sales growth and plan attainment for the pilot versus control sites. Ta-
ble 4.B reports the results of cross sectional and fixed effects estimates of sales growth. Considerable
care was taken to ensure that sales growth numbers are measured as a change in sales at the set of retail
establishments on the worker’s route, not as a change in the worker’s sales. Otherwise, a worker on a re-
engineered route might have higher sales by virtue of having a higher volume set of retail establishments,
rather than by increasing sales at the same establishments.
The results in Table 4.A indicate sales were growing 1.2 percent slower before the pilot launch in
the pilot sites. During the first year post-pilot launch, sales in the pilot sites grew 0.8 percent faster,
though the gap narrowed to 0.3 percent faster in the second year post-launch. Taken together, the net in-
crease in sales growth for the pilot sites in the first year (relative to the pre-launch period) was 2.0 percen-
tage points, compared to the control sites. For the second year, the net increase in sales growth was 1.5
percentage points. From the company’s perspective, these are meaningful increases because they
15
represent incremental sales above a fixed cost base, after accounting for the additional compensation
payout associated with the higher sales, and thus contribute disproportionately to profits.
The first column of Table 4.B includes only indicators for whether the worker is in a site with the
new pilot compensation scheme and time period indicators. Thus, the coefficient on the pilot site dummy
measures the difference in difference between performance 1) before and after the pilot start, and 2) in
pilot sites versus control sites. Sales growth increased after the pilot introduction one half percent faster
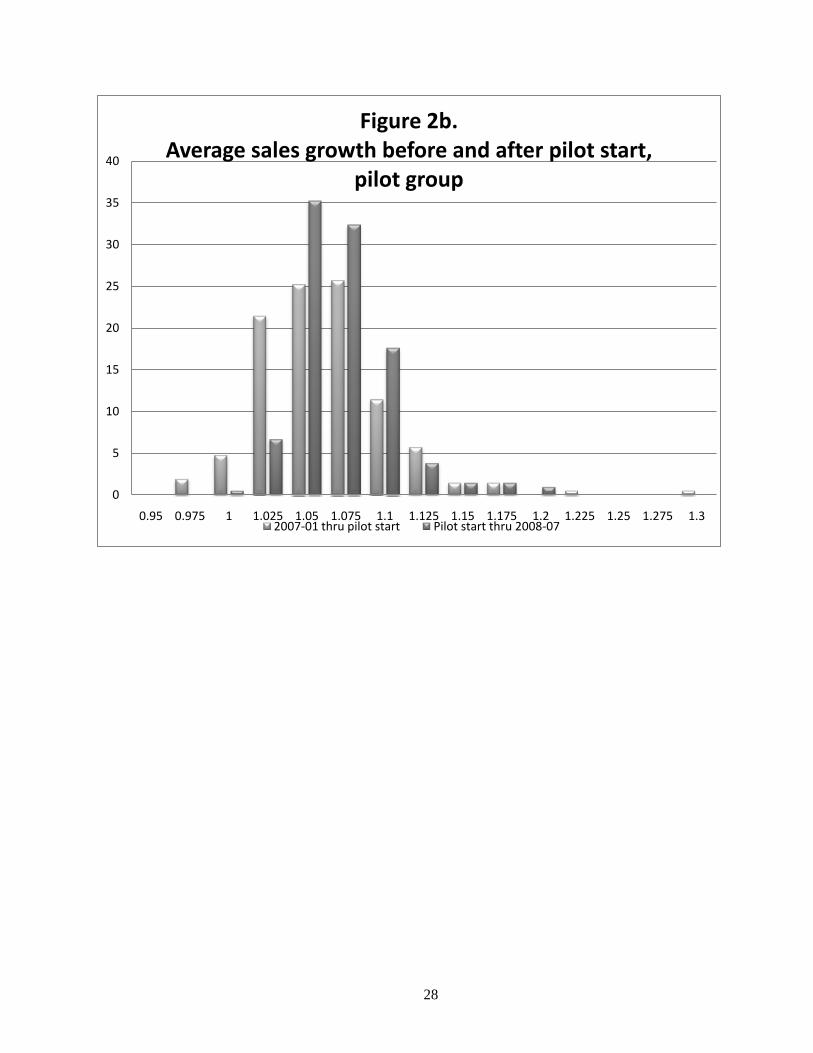
for those in pilot sites than for those in the control sites. The second hypothesis we test here is that if
ability and effort are complements, the distribution of sales growth should be more skewed to the right in
the pilot sites than in the control sites following the introduction of the new pay scheme. Figures 2a and
2b depict the distribution of average sales growth for the control group and the pilot group, respectively.
The numbers represent the six months before the pilot, and the year or so after the pilot, but before the
price change is introduced. To complement the patterns in Figures 2a and 2b, Table 5 reports the percen-
tage of people in the pilot and control sites falling into the tails of the distribution (below zero percent
growth and above ten percent growth, respectively) for the pre-pilot period, for the first year following the
pilot launch, and for the second year after that.
Given the results of Table 4.B, it is not surprising that both Figures 2a and 2b and Table 5 show
that the distribution of sales growth in the pilot sites shifted to the right in the year following the pilot
launch. There is some suggestion that the skewness also moves rightward, as evidenced by the disappear-
ance of the far left tail, representing routes that had a decrease in sales from the past year. There is also a
decrease in the density of the far right tail. However, to reach any conclusions about the overall change in
dispersion at the pilot sites, the patterns need to be compared to the performance distribution changes in
the control sites, which were similar.
The difference in differences estimates from Table 5 indicate that the density of the lower tail of
the performance distribution in the pilot sites decreased by 5.1 percentage points more than the control
sites, while the density of the upper tail of the performance distribution in the pilot sites increased by 4.1
percentage points more than the control sites. Thus the difference-in-difference-in-differences estimates

16
show that cumulative density in the tails of the performance distribution decreased by 1.0 percentage
points for the pilot sites relative to the control sites. This is counter to our third hypothesis, that the range
of output would be wider for the pilot workers than the control ones. However, this ignores the possibility
of a potential compensation scheme-induced ratchet effect differential that might have caused the top part
of the performance distribution in the pilot sites to contract more than the lower parts of the distribution,
as compared to the control sites. Thus, although we do not find much direct evidence that effort and abili-
ty are complements, we do find quite strong evidence that the substitution effects outweigh the income
effects of the new compensation scheme, resulting in an increase in the supply of labor.
Employees can increase their labor supply either by increasing the total number of hours worked
or by increasing their effort and working harder/smarter. Although in many jobs, workers do not have
control over the number of hours they work, workers in this company have a high degree of indepen-
dence, and largely set their own schedule to best accommodate the retailers they service. There are no set
hours required by the company, although routes are engineered such that it would be difficult to make the
deliveries working very short hours. The first column of table 6 shows that workers average over 50 hours
per week. The second column estimates hours worked as a function of whether the worker was in a pilot
site and an indicator for the first time period (there are two observations per worker, one for each round of
the survey). The coefficient on the pilot indicator measures a difference in differences between the hours
worked 1) before and after the introduction of the new compensation scheme, and 2) in pilot sites vs. con-
trol sites. Results show that workers in pilot sites did not increase their hours by significantly more than
those in control sites. Although we have strong evidence of an increase in labor supply, in the form of
increased productivity, the introduction of the new pay scheme had no effect on the hours worked by em-
ployees in the pilot sites.
We now consider whether the employees achieved faster sales growth by redistributing their labor
supply from the less sales-oriented parts of the job to the more sales-oriented parts. The surveys asked
workers what percent of their time was spent among a variety of tasks. The first column of table 6 shows
that employees spend the greatest amount of time on merchandising and display, around 33-34 percent,

17
followed by driving and delivery at around 20 percent. The second column shows fixed effects estimates
of the amounts of time spent on each task, as a function of whether the worker was in a site with the new
compensation scheme and the first period indicator variable. Most of the effects are not statistically sig-
nificant. The only exception is for “other” activities, which workers in the pilot sites reduced the amount
of time they spent on, relative to control sites. Since this represents a small fraction of total working time,
these results indicate that the higher sales growth found at pilot sites is not due to a shift in the distribu-
tion of hours worked across tasks. Taken together, the evidence on increased sales, total hours worked and
distribution of hours worked across tasks implies that higher productivity was accomplished through
workers supplying greater effort in the tasks they performed — they did not work longer hours, they just
worked harder and/or smarter.
B. Performance Management and Turnover
Because the employees have essentially no influence over the traffic of customers who come into
a store, a significant portion of the sales on an account are beyond their control – assuming they do not
purposefully sabotage the account. The company is well aware of this and has performance management
processes that ensure a minimum performance standard. For all intents and purposes this means that sales
on a route cannot fall below a particular level (measured in relative terms to prior year sales) without trig-
gering termination. There is no explicitly stated threshold for triggering termination because local market
factors (e.g. population growth; income growth) vary substantially, and because rare events like natural
disasters can cause the sales on a route to shrink abnormally for reasons beyond the employee’s control
for extended periods of time.
Though terminations happen, they are relatively rare and predominantly concentrated among low
tenure employees who are still in the process of learning about the job. Terminations “for cause” among
longer tenure employees are essentially indistinguishable from voluntary terminations. Once someone has
worked on a route long enough, they know how to maintain performance above the termination threshold.
Longer tenured employees who end up getting fired almost certainly were intending to quit anyway for
18
another job (or to be voluntarily unemployed) and pull back on effort to enjoy more leisure time while
they count the days to when they are pushed out.
Interviews with management representatives indicated that the performance management stan-
dards remained the same for the pilot sites when the new compensation system was introduced. Thus the
threat of termination remained unchanged in the pilot sites post pilot launch. In Table 7, we report evi-
dence that workers in the pilot sites were more concerned about meeting their goals after the new pay
scheme was introduced. The variable goal important consequences indexes several survey questions on
the negative repercussions of failing to meet sales goals, including general negative consequences, career
limitations, and potential termination. Between round one and round two, workers in pilot sites became
significantly more concerned about the consequences of not making their goals, while workers in control
sites became less so, undoubtedly due to the 2008 price change that made it easier for them to attain their
sales goal.
Examining the specific question about potential termination, in the pilot sites the mean response
increased by a statistically significant amount from 2.81 to 3.08 while it remained essentially unchanged
in the control sites, 2.82 versus 2.86. In a separate survey administered to supervisors, the comparable
question about termination risk due to missing sales plan goals was not significantly different at pilot and
control sites and did not change from round one to round two, confirming the management interview re-
sults about termination risks. This suggests that the institution of a compensation penalty for sales below
the target (for the new compensation scheme compared to the old one) sent a strong signal to the em-
ployees that the company cared about the sales growth targets. The employees in turn may have misinter-
preted the compensation emphasis change to include tougher performance management standards that
could lead to termination. Thus part of the behavior change in the pilot sites could have been driven not
just by responses to the compensation changes but also by a perceived termination threat.
Despite this perceived job insecurity, Table 7 also shows that workers in the pilot sites were no
less satisfied with their jobs or with their pay before the pilot introduction than after, although the price
increases seem to have improved the sense of well-being of workers in the control group. Table 8 esti-

19
mates the probability of leaving the company, as a function of being in one of the pilot sites. The first
column indicates no higher likelihood of leaving for those workers in pilot sites, with no additional con-
trols. Such a result might arise, however, if the pilot were launched in sites where there was more dissa-
tisfaction among workers. To address this, the survey asked a number of questions about job satisfaction,
including specific questions about workers’ intention to turnover. A composite variable was created out of
two highly correlated Likert scaled questions: “I am seriously thinking about quitting my job” and “I in-
tend to quit my job,” which are coded as follows: 1 = strongly disagree, 2 = disagree, 3 = neither, 4 =
agree, 5 = strongly agree.
The second column of Table 8 shows how the probability of leaving is affected by intending to
leave beforehand. Although the coefficient is positive, it is not significant, which either implies that
workers are not fully forthright in answering such questions, or that their attitudes were subsequently
changed. The third column shows that controlling for the propensity to leave does not change the result
that workers in the pilot sites are no more likely to leave than those in control sites. In the fourth column,
we interact the intention to turnover with the pilot indicator. The coefficient on intention to turnover indi-
cates that those in control sites who intend to turnover are, in fact, more likely to turnover. Those in pilot
sites are on average more likely to leave, but those with a higher intention to quit are actually less likely
to subsequently do so.
Columns 5 and 6 divide the sample into pilot sites and control sites to show the same relationship
between intention to turnover and leaving as in column 4. Only in the case of the control sites does inten-
tion to turnover lead to leaving; in pilot sites, those who plan to quit are no more likely to do so. The re-
sults for the control sites are consistent with extensive evidence in the management literature showing a
positive relationship between intention to turnover and actual turnover. Thus the counterintuitive results
for the pilot sites suggests that the introduction of the new compensation scheme may have led workers
who otherwise would have quit to delay leaving, at least temporarily. The opportunity to perform under
different incentives may have been sufficient to induce some of these workers to change their minds and
work at the company at least a little while longer.

20
In assessing the productivity effects of the new compensation scheme, it is important to account
for turnover. If workers with lower performance leave the company following the introduction of the
pilot program, it might appear that the pilot enhances the productivity of workers, when in fact the re-
maining workers are no more productive than in the control sites. To assess this, we compare the produc-
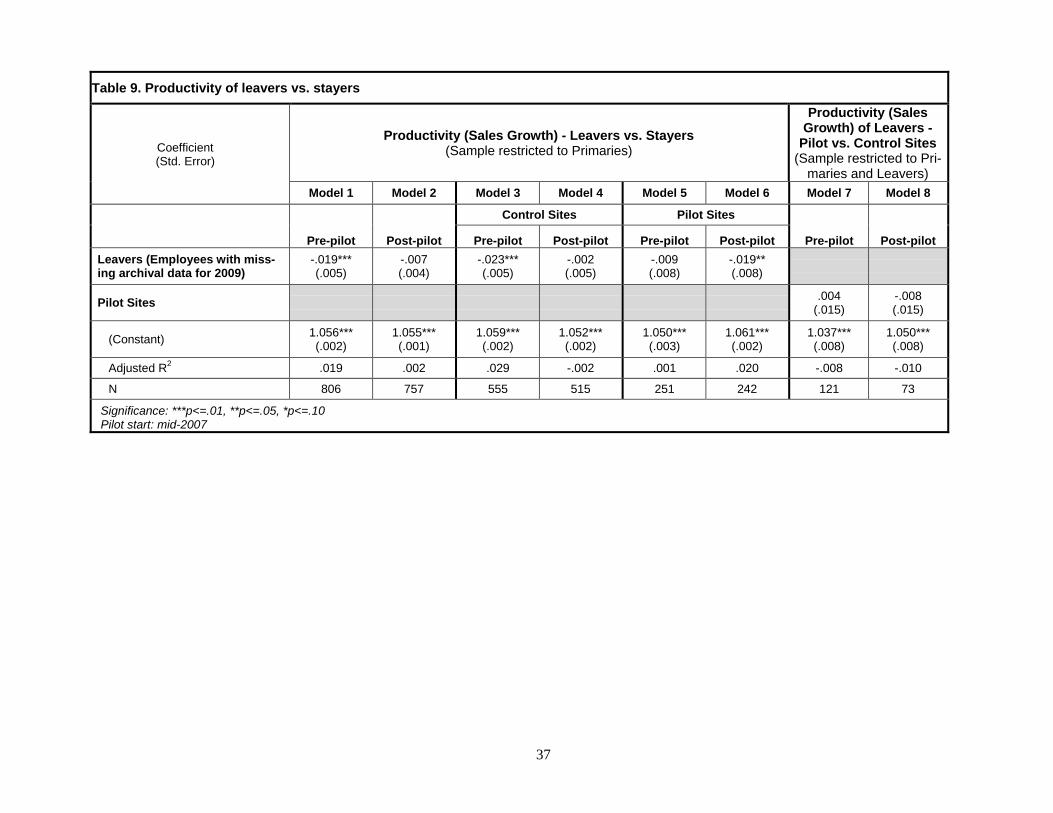
tivity of leavers versus stayers at pilot versus control sites. Table 9 estimates ordinary least squares re-
gressions of sales growth as a function of whether the worker left in a later period. Column 1 measures
sales growth in the period before the introduction of the pilot, while column 2 measures sales growth in
the period after the introduction of the pilot. Leavers are defined as those who do not have sales data for
2009. Leavers at all sites are significantly less productive in the pre-pilot period, but no more or less pro-
ductive than stayers following the pilot introduction. In columns 3-6, we disaggregate the analysis into
workers at pilot sites and control sites. In the control sites, leavers are those who were less productive in
the first period, while in the pilot sites, leavers are those who are less productive in the second period,
following the introduction of the pilot. Columns 7 and 8 show that there are no significant productivity
difference in either period between those leavers in pilot and control sites.
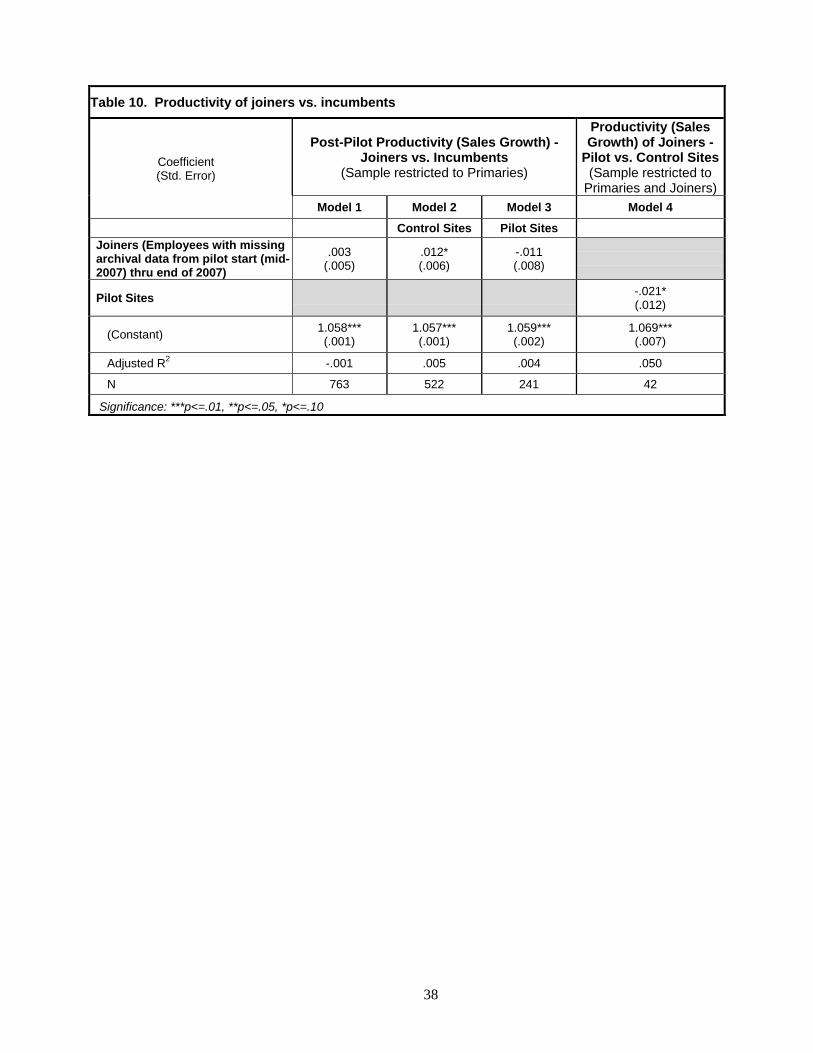
In addition to workers leaving the company, there are new hires in the company. The new com-
pensation scheme may attract a more motivated worker, since it rewards high effort workers more. Thus,
there may be productivity differences in new hires. Table 10 compares the post-pilot productivity for
workers who did not have sales data from the pilot start through the end of 2007 and those who were
present from 2007 through 2009. Column 1 estimates sales growth for all sites as a function of whether
the worker was a new hire. Among all sites, joiners were no more or less productive than incumbents.
Columns 2 and 3 disaggregate the analysis into pilot site workers and controls. The coefficients on join-
ers have opposite signs, with joiners in the control site being a statistically significantly 1.2% more pro-
ductive; and, while not statistically significant, joiners in the pilot sites are less productive. Column 4
directly measures the difference in productivity of joiners in pilot versus control sites, by restricting the
sample to joiners and including a control for whether the worker joined a pilot site. Workers who joined
pilot sites were over 2% less productive than those who joined control sites.
21
C. The Ratchet Effect
Table 11 reports employee survey responses to two sets of questions about quota restriction and
the ratchet effect. The top panel shows that there is a fairly substantial ratchet effect before the compensa-
tion scheme change, and that it is higher at the pilot sites: almost a quarter (23.5 percent) of employees at
the control sites indicate that either they or someone they know manage the sales growth on their routes to
avoid having accounts taken away by route rebalancing, compared to more than a third (35.7 percent) of
employees at the pilot sites. The responses in round two are essentially the same. A similar discrepancy in
the pilot versus control sites exists for people reporting only about their own behaviors (first row). The
differences in initial self-reported ratchet effects could be due to differences in trust of the route rebalanc-
ing process at the two groups of sites. Consistent with that, initial pay satisfaction and perceived pay fair-
ness is lower at the pilot sites than at the control sites (Table 7).
A separate set of questions on the round two survey measured ratchet effects in response to the
unexpected 2008 mid-year price increase. Similar to the pattern in the top of the table, the pilot sites’ em-
ployees are more likely to report quota restriction (“slacking off”) because the price increase made it easi-
er to meet the sales plan goals.
In subsequent drafts we will analyze the relationship between self-reported ratchet effects and
changes in productivity related to the compensation scheme change.
V. Conclusion
In this study, we examine the effects of a change from a linear piece rate scheme to a more com-
plex compensation scheme, using personnel data from a large consumer products company. We study
direct store delivery workers who initially were paid a straight commission based on sales on their routes.
In a number of locations, a new payment scheme was introduced which offered higher incentives for in-
creased sales relative to the previous year, as well as higher penalties for failing to meet sales objectives.
Workers at both treatment and control sites were surveyed both before and after the change is introduced,
gathering information on attitudes and self-reported ratchet effects.

22
Prior to the program launch, average sales growth in the pilot sites was one percentage point low-
er than in the control sites. After the pilot launch, average sales growth in the pilot sites exceeded that in
the control sites by one percentage point. Both differences are statistically and economically significant.
The workers did not substantially change the distribution of time spent on different job tasks. Nor did they
perform any of their tasks worse. Rather, it appears that the linear incentive pay simply did not elicit max-
imum worker effort, and that the new compensation scheme elicited greater effort.

23
VI. References
Cadsby, C. Bram, Song, Fei and Tapon, Francis (2007) “Sorting and incentive effects of pay for perfor-mance: An experimental investigation,” Academy of Management Journal, 50:2, 387-405.
Fang, Eric, Evans, Kenneth R., and Zou, Shaoming (2004), “The Moderating Effect of Goal-Setting Cha-racteristics on the Sales Control Systems – Job Performance Relationship,” Journal of Business Research, 58, 1214-1222.
Frexias, Xavier, Roger Guesnerie and Jean Tirole (1985), “Planning Under Incomplete Information and the Ratchet Effect,” Review of Economic Studies, 52, 173-191.
Gibbons, Robert (1987), “Piece-Rate Incentive Schemes,” Journal of Labor Economics, 5:4(1), 413-429.
Harrison, David A., Virick, Meghna, and William, Sonja (1996) “Working without a net: Time, perfor-mance, and turnover under maximally contingent rewards,” Journal of Applied Psychology, 81:4, 331-345.
Huberman, Michael (1986), “Invisible Handshakes in Lancashire: Cotton Spinning in the First Half of the Nineteenth Century,” Journal of Economic History, 46:4, 987-998.
Lazear, Edward P. (1986), “Salaries and Piece Rates,” Journal of Business, 59:3, 405-431.
Lazear, Edward P. (1996), “Performance Pay and Productivity,” National Bureau of Economic Research (Cambridge, MA) Working Paper No. 5672, July.
Lazear, Edward P. (2000), “Performance Pay and Productivity,” American Economic Review, 90:5, 1346-1361.
Lazonick,William (1981) “Competition, Specialization and Industrial Design,” Journal of Economic His-tory, 14:1, 31-38.
Mangum, Garth (1962) “Are Wage Incentives Becoming Obsolete?,” Industrial Relations, 2, 73-96.
Milgrom, Paul and John Roberts (1995), “Complementarities and Fit: Strategies, Structure, and Organiza-tional Change in Manufacturing,” Journal of Accounting and Economics, 19, 179-208.
Oyer, Paul (1998). “Fiscal Year Ends and Nonlinear Incentive Contracts: The Effect on Business Seaso-nality,” Quarterly Journal of Economics, 113(1): 149-185.
Oyer, Paul (2000). “A Theory of Sales Quotas with Limited Liability and Rent Sharing,” Journal of Labor Economics, 18(3), 405-426.
Paarsch, Harry J. and Shearer, Bruce S. (1999), “The Response of Worker Effort to Piece Rates: Evidence from the British Columbia Tree Planting Industry,” Journal of Human Resources, 34:4, 643-667.
Paarsch, Harry J. and Shearer, Bruce S. (2000), “Fixed Wages, Piece Rates, and Incentive Effects: Statis-tical Evidence from Payroll Records,” International Economic Review, 41:1, 59-92.
Park, Jeong-Eun and Holloway, Betsy B. (2003), “Adaptive Selling Behavior Revisited: An Empirical Examination of Learning Orientation, Sales Performance, and Job Satisfaction,” Journal of Per-sonal Selling & Sales Management, 23:3, 239-251.
Roy, Donald (1952), “Quota Restriction and Goldbricking in a Machine Shop,” American Journal of So-ciology, 57:5, 427-442.
Seiler, Eric (1984). “Piece Rate vs. Time Rate: The Effect of Incentives on Earnings,” Review of Econom-ics & Statistics, 66(3), 363-376.
Stiglitz, Joseph E. (1975) “Incentives, Risk and Information: Notes Toward a Theory of Hierarchy,” Bell Journal of Economics, 6:2, 552-579.

24
Tekleab, Amanuel G., Bartol, Kathryn M. and Liu, Wei (2005), “Is It Pay Levels or Pay Raises that Matter to Fairness and Turnover?” Journal of Organizational Behavior, 26, 899-921.
25
Figure 1a. Pilot and Control Pay Schemes
Compensation
Net SalesTS =
Target Sales*
TC = Target Comp.
Initial pay scheme
New pay scheme
*TSt+1 = TSt·(1+X), where X = target growth rate.
T =Threshold
Sales
M = Minimum
Sales
BC =Base
Comp.

26
Figure 1b. Incentive Effects of Pilot Scheme
Net SalesTS =
Target Sales*
Initial pay scheme
New pay scheme
M = Minimum
Sales
•
•

27
0
5
10
15
20
25
30
35
40
0.95 0.975 1 1.025 1.05 1.075 1.1 1.125 1.15 1.175 1.2 1.225 1.25 1.275 1.3
Figure 2a.Average sales growth before and after pilot start,
control group
2007-01 thru pilot start Pilot start thru 2008-07
28
0
5
10
15
20
25
30
35
40
0.95 0.975 1 1.025 1.05 1.075 1.1 1.125 1.15 1.175 1.2 1.225 1.25 1.275 1.3
Figure 2b.Average sales growth before and after pilot start,
pilot group
2007-01 thru pilot start Pilot start thru 2008-07
29
Table 1. Sample sizes All Employees Pilot Control Full sample All workers surveyed in either round 1,194 375 819 Round 1 (April 2007) survey period All workers surveyed 1,008 318 690 Respondents 746 272 474 Primariesa on route 611 216 395 Round 2 (July/August 2008) survey period All workers surveyed 986 326 660 Respondents 724 231 493 Primariesa on route 586 187 399 Both rounds All workers surveyed in both rounds 800 269 531 Respondents in both rounds 486 183 303 Primariesa on route both rounds 409 149 260 aHigher volume routes are staffed by a primary person who works only that route five days a week, and by a secondary person who splits time between two higher volume routes. For most specifications, the sample is restricted to survey respondents who were primaries on a route in both survey rounds.
30
Table 2. Characteristics of DSD Workers
Round 1 Round 2 Pilot
(N=149) Control (N=260)
Pilot (N=149)
Control (N=260)
Job tenure (years) 11.0 10.8 13.1 12.6 Work experience since HS (years) 23.8 25.2 26.0 27.5 DSD experience outside company (years) 4.6 5.5 5.2 6.4 Age 42.0* 43.8 43.8** 45.8 High school only 36.9 35.0 37.6 35.4 Some college education 45.8% 47.0% 45.5% 46.4% Four-year college education or greater 16.0% 17.0% 15.9% 16.5% Non-white 8.5% 7.5% 11.3% 9.8% Female 4.2% 4.7% 4.9% 6.5% Includes only employees who were primaries in both rounds, and who responded in both rounds. Significant difference between Pilot and Control sites: *p ≤ .10 **p ≤ .05 ***p ≤ .01 Significant difference between Round 1 and Round 2: p ≤ .10 p ≤ .05 p ≤ .01

31
Table 3. Worker’s opinions of compensation plans Round 1 Round 2
Pilot (N=149)
Control (N=260)
Pilot (N=149)
Control (N=260)
Using the numbers 1 (most important) through 6 (least important), please rank order the importance of the following route characteristics in determining your ideal route: • Growth Potential 2.21 2.16 1.80** 2.09 • High Volume 2.15 2.15 3.80*** 2.14 Response scale: 1=‘Strongly Disagree’, 2=‘Disagree’, 3=’Neither’, 4=‘Agree’, 5=‘Strongly Agree’ Goal Fairness 2.85 2.82 2.37*** 3.08 Goal Commitment 3.88 3.97 4.07 3.99 I understand exact level of my assigned performance goals 3.73 3.72 3.74 3.82 I prefer a low risk/high security route with steady sales over a route that offers high risks 3.08 3.21 3.24 3.12
I prefer to remain on a route that has problems rather than take risk of working a new route 2.56 2.60 2.73 2.67
Includes only employees who were primaries in both rounds, and who responded in both rounds. Significant difference between Pilot and Control sites: *p ≤ .10 **p ≤ .05 ***p ≤ .01 Significant difference between Round 1 and Round 2: p ≤ .10 p ≤ .05 p ≤ .01 Note: Significant difference (p ≤ .01) between Growth Potential rank (1.80) and High Volume rank (3.80) for Round 2 Pilot sites.

32
Table 4.A. Median Sales Growth and Plan Attainment
Pilot
(N=210) Control (N=426)
Sales Growth (compared to same periods prior year) Sales growth from beginning of 2007 through pilot Start (mid-2007) 4.7%*** 5.9%
Sales growth from pilot start (mid-2007) through mid-2008 5.6%*** 4.9%
Sales growth from mid-2008 through mid-2009 5.8% 5.5%
Plan Attainment % Plan attainment from beginning of 2007 through Pilot Start (mid-2007) -0.9% 0.9%
% Plan attainment from pilot start (mid-2007) through mid-2008 3.0%*** 1.4%
% Plan attainment from mid-2008 through mid-2009 3.8%*** 3.3%
Includes only employees who were primaries in both rounds. Significant difference between Pilot and Control sites: *p ≤ .10 **p ≤ .05 ***p ≤ .01

33
Table 4.B. Regression Estimates of Sales Growth at Pilot vs. Control Sites
Sales Growth (Sample restricted to Primaries in both rounds) Model 1 Model 2 Model 3
Pilot Site after implementation of new com-pensation system (Yes=1)
.005*** (.002)
.005** (.002)
.008*** (.002)
Pre-Pilot Time Period (Yes=1) .004** (.002)
.005** (.002)
End of Pilot Time Period (Yes=1) .002 (.002)
.002 (.002)
Married (Yes=1) .004* (.002)
Non-white (Yes=1) -.002 (.003)
Female (Yes=1) .004 (.004)
Some College (Yes=1) -.001 (.002)
Bachelor’s Degree or higher (Yes=1) -.004 (.003)
Total years of experience working at Company -.000 (.000)
Years of work experience since high school -.000 (.000)
Years of prior route experience prior to joining Company -.000
(.000)
(Constant) 1.052*** (.001)
1.055*** (.004)
1.054*** (.001)
Adjusted R2 .003 .005
N 1905 1645 1905
Fixed Effects Model No No Yes
Standard errors in parentheses. Significance: ***p<=.01, **p<=.05, *p<=.10
Table 5 Percentage of Low and High Sales Growth Performers
Percent Pilot
(N=210) Control (N=426)
Low Sales Growth (below zero percent growth) compared to same periods prior year • from beginning of 2007 through Pilot Start (mid-2007) 6.7 4.2 • from Pilot start (mid-2007) through mid-2008 0.5*** 3.1 • from mid-2008 through mid-2009 2.4 3.1 High Sales Growth (above ten percent growth) compared to same periods prior year • from beginning of 2007 through Pilot Start (mid-2007) 9.5 11.0 • from Pilot start (mid-2007) through mid-2008 7.6 5.0 • from mid-2008 through mid-2009 6.2 6.4 Includes only employees who were primaries in both rounds. Significant difference between Pilot and Control sites: *p ≤ .10 **p ≤ .05 ***p ≤ .01

34
Table 6. Fixed Effects Estimates of Hours Worked and Time Spent on Various Tasks at Pilot vs. Control Sites
Mean Coefficient on Pilot Site After Imple-
mentation (Indicator Variable)
Average hours worked per week 51.03 0.759 (.565)
Considering the total hours you work per week, what percentage of your time is spent on each of the following (total must add up to 100%): • Planning 9.33 0.619
(1.074) • Delivery/Driving (excluding sales activities) 20.25 0.704
(2.082) • Sales (excluding delivery/driving activities) 15.19 1.514
(1.636) • Merchandising/Customer Service 34.60 1.255
(2.452) • Meetings, training, 1 with 1s 5.57 0.665
(.622) • Synching data and completing paper-work 5.80 -0.700
(.565) • Working product in your remote loca-tion (if applicable) 6.32 -1.085
(.839) • Shopping distribution center for prod-uct replenishments (if applicable) 0.85 -0.360
(.359) • Other 2.09 -2.612*
(1.395) Includes only employees who were primaries in both rounds, and who re-sponded in both rounds. Standard errors in parentheses. Significance: ***p<=.01, **p<=.05, *p<=.10

35
Table 7. Worker’s Attitudes – Goal Importance Consequences and Job Aspects Round 1 Round 2
Pilot (N=149)
Control (N=260)
Pilot (N=149)
Control (N=260)
Response scale unless otherwise noted: 1=‘Strongly Disag-ree’, 2=‘Disagree’, 3=’Neither’, 4=‘Agree’, 5=‘Strongly Agree’
Goal Importance Consequences 3.00 3.10 3.34*** 3.00 Intention to Turnover 2.34 2.21 2.20*** 1.89 Pay Satisfaction 2.45* 2.63 2.68*** 3.14 Pay Equity‡ 2.78*** 3.06 2.94*** 3.54 Job Satisfaction 3.67 3.72 3.67*** 3.94 Includes only employees who were primaries in both rounds, and who responded in both rounds. Significant difference between Pilot and Control sites: *p ≤ .10 **p ≤ .05 ***p ≤ .01 Significant difference between Round 1 and Round 2: p ≤ .10 p ≤ .05 p ≤ .01 ‡1=‘Very Unfair’, 2=‘Unfair’, 3=‘Neither’, 4=‘Fair’, 5=‘Very Fair’

36
Table 8. Probability of leaving
Coefficient (Std. Error)
Logit Analysis of Leavers (Sample restricted to Primaries)
Model 1 Model 2 Model 3 Model 4 Model 5 Control Sites
Model 6 Pilot Sites
Pilot Sites -.279 (.216) -.143
(.271) 1.390** (.671)
Intention to Turnover .164 (.119)
.165 (.119)
.363** (.144)
.363** (.144)
-.300 (.238)
Interaction: Pilot Sites & Intention to Turnover -.663**
(.278)
(Constant) -1.588*** (.113)
-2.395*** (.314)
-2.349*** (.324)
-2.838*** (.398)
-2.838*** (.398)
-1.448*** (.540)
Pseudo R2 .002 .004 .005 .019 .022 .012 N 814 594 594 594 383 211
Significance: ***p<=.01, **p<=.05, *p<=.10 Leavers=Missing archival data for 2009.
37
Table 9. Productivity of leavers vs. stayers
Coefficient (Std. Error)
Productivity (Sales Growth) - Leavers vs. Stayers (Sample restricted to Primaries)
Productivity (Sales Growth) of Leavers -
Pilot vs. Control Sites (Sample restricted to Pri-
maries and Leavers) Model 1 Model 2 Model 3 Model 4 Model 5 Model 6 Model 7 Model 8
Pre-pilot Post-pilot
Control Sites Pilot Sites
Pre-pilot Post-pilot Pre-pilot Post-pilot Pre-pilot Post-pilot Leavers (Employees with miss-ing archival data for 2009)
-.019*** (.005)
-.007 (.004)
-.023*** (.005)
-.002 (.005)
-.009 (.008)
-.019** (.008)
Pilot Sites .004 (.015)
-.008 (.015)
(Constant) 1.056*** (.002)
1.055*** (.001)
1.059*** (.002)
1.052*** (.002)
1.050*** (.003)
1.061*** (.002)
1.037*** (.008)
1.050*** (.008)
Adjusted R2 .019 .002 .029 -.002 .001 .020 -.008 -.010
N 806 757 555 515 251 242 121 73
Significance: ***p<=.01, **p<=.05, *p<=.10 Pilot start: mid-2007
38
Table 10. Productivity of joiners vs. incumbents
Coefficient (Std. Error)
Post-Pilot Productivity (Sales Growth) - Joiners vs. Incumbents
(Sample restricted to Primaries)
Productivity (Sales Growth) of Joiners -
Pilot vs. Control Sites (Sample restricted to
Primaries and Joiners) Model 1 Model 2 Model 3 Model 4
Control Sites Pilot Sites Joiners (Employees with missing archival data from pilot start (mid-2007) thru end of 2007)
.003 (.005)
.012* (.006)
-.011 (.008)
Pilot Sites -.021* (.012)
(Constant) 1.058*** (.001)
1.057*** (.001)
1.059*** (.002)
1.069*** (.007)
Adjusted R2 -.001 .005 .004 .050
N 763 522 241 42
Significance: ***p<=.01, **p<=.05, *p<=.10

39
Table 11. Self-Reported Ratchet Effects % indicating “yes” Round 1 Round 2
General ratchet effect Pilot (N=149)
Control (N=260)
Pilot (N=149)
Control (N=260)
(A) Do you ever manage your sales growth to avoid having accounts taken away by route rebalancing? 20.6%*** 9.6% 16.3%** 8.1%
(B) Do you know of other employees who manage their sales growth to avoid having accounts taken away by route reba-lancing?
27.8% 20.8% 29.05** 18.0%
Either self (A) or “know of others” (B) 35.7%** 23.5% 33.3%** 21.0%
Ratchet effect in response to 2008 price increase Pilot (N=104)
Control (N=164)
(C) Due to the 2008 price increases, I slacked off because it was easier to make plan 6.7% 3.0%
(D) Due to the 2008 price increases, I know of other em-ployees who slacked off because it was easier to make plan 15.5%** 7.3%
Either self (C) or “know of others” (D) 19.4%** 9.8% Includes only employees who were primaries in both rounds, and who responded in both rounds (top and bottom of table). Sample for bottom of table further restricted to employees who responded to both sets of questions (general ratchet effect + ratchet effect in response to 2008 price increase). Significant difference between Pilot and Control sites: *p ≤ .10 **p ≤ .05 ***p ≤ .01 Significant difference between Round 1 and Round 2: p ≤ .10 p ≤ .05 p ≤ .01


![Incentive pay and productivity[4]](https://img.pdfslide.us/doc/110x75/577d2f201a28ab4e1eb0dd23/incentive-pay-and-productivity4.jpg)