Embed Size (px)
Citation preview

A CPI Report
Getting to India’s Renewable Energy Targets: A Business Case for Institutional Investment
Labanya Prakash JenaChavi MeattleGireesh Shrimali
March 2018

About CPIWith deep expertise in policy and finance, CPI works to improve the most important energy and land use practices around the world. Our mission is to help governments, businesses, and financial institutions drive growth while addressing climate risk. CPI works in places that provide the most potential for policy impact including Brazil, Europe, India, Indonesia, and the United States.
CPI’s India program is registered with the name, “Climate Policy Foundation” under Section 8 of the Companies Act, 2013.
DescriptorsSector Renewable energy financeRegion IndiaKeywords Institutional investors, Climate investment, energy finance, energy infrastructure, foreign
investment, India, innovative finance, low-carbon development, renewable energyRelated CPI Reports
Reaching India’s Renewable Energy Target: The Role of Institutional Investors, Driving Foreign Investment to India’s Renewable Energy Targets: A Payment Security Mechanism to Address Off-Taker Risk
Contact Gireesh Shrimali [email protected]
Acknowledgements
The authors acknowledge the valuable contributions made by Mr. Dipak Dasgupta (Distinguished Fellow, TERI), Mr. Pradeep Singh (Advisor to Government – Infrastructure Development, J&K Government), and Mr. Deepak Gupta (Shakti Sustainable Energy Foundation).
We also thank the representatives of pension funds, insurance companies, banks, infrastructure devel-opment funds, regulatory authorities, renewable energy developers, and other participants who par-ticipated in our interviews. This material has been funded by Shakti Sustainable Energy Foundation; however the views expressed do not necessarily reflect the Foundation’s official policies. The authors would like to thank Dr. Barbara Buchner and Mr. Dhruba Purkayastha for an internal review, Vivek Sen, Ruairi Mcloughlin, and Divjot Singh for their discussions and advices. Thanks also to Elysha Davila, Angel Jacob, Charith Konda, Amira Hankin, and Tim Varga for their editing and graphics.
Copyright © 2018 Climate Policy Initiative www.climatepolicyinitiative.org
All rights reserved. For private circulation only.
About Shakti Sustainable Energy FoundationShakti Sustainable Energy Foundation works to strengthen the energy security of India by aiding the design and implementation of policies that support energy efficiency and renewable energy. For more details, please visit www.shaktifoundation.in.
The views/analysis expressed in this report do not necessarily reflect the views of Shakti Sustainable Energy Foundation. The Foundation also does not guarantee the accuracy of any data included in this publication nor does it accept any responsibility for the consequences of its use.
3A CPI Report
March 2018 Getting to India’s Renewable Energy Targets: A Business Case for Institutional Investment
Executive Summary
1 Excess returns are defined as the difference between the expected return on capital and the cost of capital.
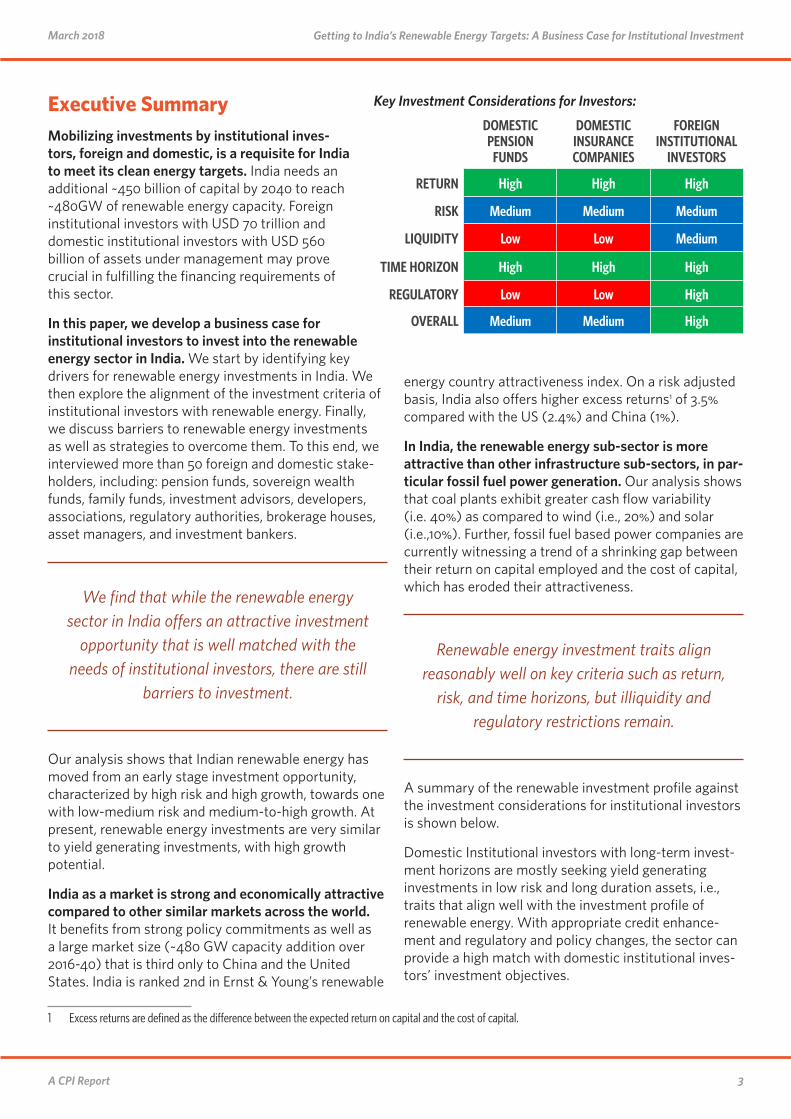
Mobilizing investments by institutional inves-tors, foreign and domestic, is a requisite for India to meet its clean energy targets. India needs an additional ~450 billion of capital by 2040 to reach ~480GW of renewable energy capacity. Foreign institutional investors with USD 70 trillion and domestic institutional investors with USD 560 billion of assets under management may prove crucial in fulfilling the financing requirements of this sector.
In this paper, we develop a business case for institutional investors to invest into the renewable energy sector in India. We start by identifying key drivers for renewable energy investments in India. We then explore the alignment of the investment criteria of institutional investors with renewable energy. Finally, we discuss barriers to renewable energy investments as well as strategies to overcome them. To this end, we interviewed more than 50 foreign and domestic stake-holders, including: pension funds, sovereign wealth funds, family funds, investment advisors, developers, associations, regulatory authorities, brokerage houses, asset managers, and investment bankers.
We find that while the renewable energy sector in India offers an attractive investment
opportunity that is well matched with the needs of institutional investors, there are still
barriers to investment.
Our analysis shows that Indian renewable energy has moved from an early stage investment opportunity, characterized by high risk and high growth, towards one with low-medium risk and medium-to-high growth. At present, renewable energy investments are very similar to yield generating investments, with high growth potential.
India as a market is strong and economically attractive compared to other similar markets across the world. It benefits from strong policy commitments as well as a large market size (~480 GW capacity addition over 2016-40) that is third only to China and the United States. India is ranked 2nd in Ernst & Young’s renewable
energy country attractiveness index. On a risk adjusted basis, India also offers higher excess returns1 of 3.5% compared with the US (2.4%) and China (1%).
In India, the renewable energy sub-sector is more attractive than other infrastructure sub-sectors, in par-ticular fossil fuel power generation. Our analysis shows that coal plants exhibit greater cash flow variability (i.e. 40%) as compared to wind (i.e., 20%) and solar (i.e.,10%). Further, fossil fuel based power companies are currently witnessing a trend of a shrinking gap between their return on capital employed and the cost of capital, which has eroded their attractiveness.
Renewable energy investment traits align reasonably well on key criteria such as return,
risk, and time horizons, but illiquidity and regulatory restrictions remain.
A summary of the renewable investment profile against the investment considerations for institutional investors is shown below.
Domestic Institutional investors with long-term invest-ment horizons are mostly seeking yield generating investments in low risk and long duration assets, i.e., traits that align well with the investment profile of renewable energy. With appropriate credit enhance-ment and regulatory and policy changes, the sector can provide a high match with domestic institutional inves-tors’ investment objectives.
Key Investment Considerations for Investors:
DOMESTIC PENSION
FUNDS
DOMESTIC INSURANCE COMPANIES
FOREIGN INSTITUTIONAL
INVESTORS
RETURN High High High
RISK Medium Medium Medium
LIQUIDITY Low Low Medium
TIME HORIZON High High High
REGULATORY Low Low High
OVERALL Medium Medium High

4A CPI Report
Getting to India’s Renewable Energy Targets: A Business Case for Institutional InvestmentMarch 2018
For foreign institutional investors, the renewable energy investment landscape has changed from small size and high risk-high return investments to large size and medium risk- moderate return investments. Although the expected return from renewable energy projects has come down from 20% to 15%, this still matches their overall India market portfolio return requirements. Higher returns are still possible through equity invest-ments at the corporate level.
However, despite this apparent match, there are still barriers for institutional investment in renewable energy.
The key challenges, ranked by severity of the risk, faced by both domestic and foreign institutional investors include:
1. Off-taker risk due to unwillingness and inability to pay, or refusal to off-take power, by the primary off-takers, the DISCOMS;
2. Currency risk resulting from the need to finance renewable energy projects in India with foreign capital (e.g. USD), which exposes the borrower/investor to the risk of currency devaluation of INR as the cash flow of the project is INR;
3. Lack of adequate liquid vehicles related to the inability to sell investments at a fair price at any time;
4. Low credit ratings, related to renewable energy debt vehicles not meeting minimum regulatory criteria on ratings;
5. High perceived risk, related to the lack of histori-cal performance data about the renewable energy sector;
6. Small investment size, related to not meeting investors’ minimum investment size criteria, leading to high transaction cost;
In order to scale institutional investment in renewable energy to its potential,
policymakers and regulators will need to address some of these barriers. Institutional investors, themselves, can also work toward investment practices that overcome other
barriers.
To address the aforementioned barriers, based on a preliminary assessment, we suggest potential solu-tions for various stakeholders, as below.
In addition, there are medium to longer-term solutions that regulators as well as institutional investors can employ to drive greater institutional investment in renewable energy. For regulators, these include intro-ducing carbon disclosure or green ratings into existing disclosure and ratings systems. For investors, these include revising sectoral target allocations or intro-ducing theme-based investment practices.
This paper highlights the renewable energy opportunity in India, several key barriers for institutional investment, and the potential paths to address these barriers but further research is warranted. In particular, developing a risk management framework to assess and manage climate risk for investors, conducting an exploratory study on a not-for-profit fee based financial interme-diary, conducting theme-based investment research studies in various climate sectors, and engaging in further feasibility and impact analysis of various solu-tions. CPI, through its future work, intends to continue to work and delve deeper to actualize these potential solutions.

5A CPI Report
March 2018 Getting to India’s Renewable Energy Targets: A Business Case for Institutional Investment
BARRIER PROPOSED SOLUTION IMPLEMENTER
Off taker risk A transparent payment security mechanism along with adequate risk coverage.
Central and State Government agencies like Solar Energy Corporation of India (SECI) etc.
Currency risk A foreign exchange (FX) hedging facility backed by an FX tail risk guarantee.
Eligible Public Sector Financial Institution, i.e. Indian Renewable Energy Development Agency (IREDA) and India Infrastructure Finance Company (IIFCL)
Lack of adequate liquid financial securities
Encourage banks and Non-Banking Financial Companies (NBFCs) to securitize their renewable energy loan portfolio.
Reserve Bank of India (RBI), Central government agencies like Ministry of New and Renewable Energy (MNRE)
Low Credit Ratings
Greater clarity on the transaction structure along with initial subsidization of guarantees and transaction fees of PCG-backed bonds can uplift credit rating to the minimum regulatory criteria for investment by institu-tional investors
Ministry of Finance (MoF), MNRE and other eligible (Public Sector) Financial Institutions
High perceived risk
Build renewable energy specialized direct investment team. Institutional Investors
Small investment size
Create a not-for-profit, fee-based intermediary to source deals, structure deals, and conduct due diligence on behalf of investors seeking direct investment in the renewable energy sector.
MNRE and Foundations

6A CPI Report
Getting to India’s Renewable Energy Targets: A Business Case for Institutional InvestmentMarch 2018
Contents1. Introduction 7
2. Drivers of renewable energy investment in India 92.1 Maturing renewable energy sector and strengthening macroeconomic fundamentals 92.2 Renewable energy sector offers greater cash flow stability compared with other infrastructure sectors 12
3. Aligning institutional investors’ objectives with renewable energy sector investment traits 153.1 Domestic Pension Funds 163.2 Insurance Companies 173.3 Foreign Institutional Investors 183.4 Investment pathways for institutional investors to gain exposure to renewable energy 19
4. Key barriers faced by institutional investors and suggested solutions 204.1 Overview 204.2 Barriers and suggested solutions 204.3 The way forward for insurance regulators 234.4 Next steps for Institutional investors 24
5. Concluding thoughts 25
6. References 26
Appendix A: National renewable energy targets by countries 29
Appendix B: Capital Asset Pricing Model 30
Appendix C: Cash flow variability of coal, wind, and solar plant models 31
Appendix D: Infrastructure comparison 32
Appendix E: Key Barriers - Responses from the interviewees 34
Appendix F: Core –Satellite Investment Strategy 35
7A CPI Report
March 2018 Getting to India’s Renewable Energy Targets: A Business Case for Institutional Investment
1. Introduction
2 CPI Analysis
India’s energy demand is increasing, and there is political will to develop the clean energy
sector, but meeting targets will be challenging due to financing barriers
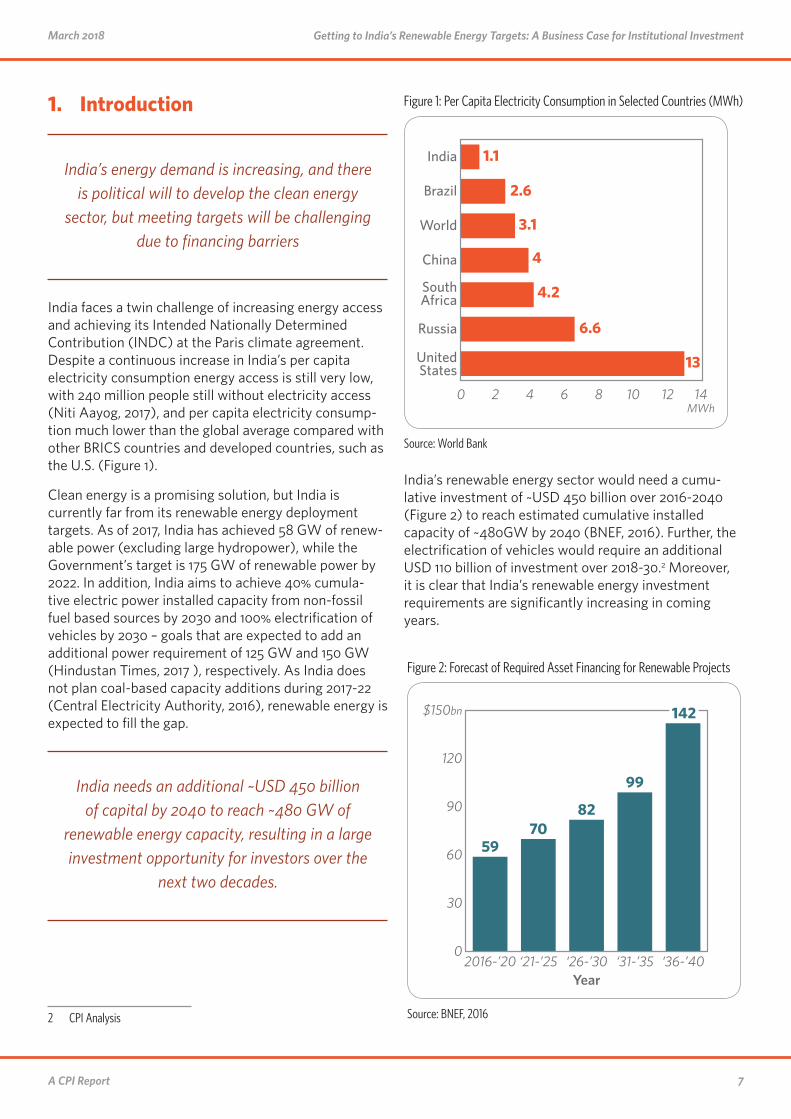
India faces a twin challenge of increasing energy access and achieving its Intended Nationally Determined Contribution (INDC) at the Paris climate agreement. Despite a continuous increase in India’s per capita electricity consumption energy access is still very low, with 240 million people still without electricity access (Niti Aayog, 2017), and per capita electricity consump-tion much lower than the global average compared with other BRICS countries and developed countries, such as the U.S. (Figure 1).
Clean energy is a promising solution, but India is currently far from its renewable energy deployment targets. As of 2017, India has achieved 58 GW of renew-able power (excluding large hydropower), while the Government’s target is 175 GW of renewable power by 2022. In addition, India aims to achieve 40% cumula-tive electric power installed capacity from non-fossil fuel based sources by 2030 and 100% electrification of vehicles by 2030 – goals that are expected to add an additional power requirement of 125 GW and 150 GW (Hindustan Times, 2017 ), respectively. As India does not plan coal-based capacity additions during 2017-22 (Central Electricity Authority, 2016), renewable energy is expected to fill the gap.
India needs an additional ~USD 450 billion of capital by 2040 to reach ~480 GW of
renewable energy capacity, resulting in a large investment opportunity for investors over the
next two decades.
India’s renewable energy sector would need a cumu-lative investment of ~USD 450 billion over 2016-2040 (Figure 2) to reach estimated cumulative installed capacity of ~480GW by 2040 (BNEF, 2016). Further, the electrification of vehicles would require an additional USD 110 billion of investment over 2018-30.2 Moreover, it is clear that India’s renewable energy investment requirements are significantly increasing in coming years.
Figure 1: Per Capita Electricity Consumption in Selected Countries (MWh)
0 2 4 6 8 10 12 14MWh
United States
Russia
South Africa
China
World
Brazil
India 1.1
2.6
3.1
4
4.2
6.6
13
Source: World Bank
Figure 2: Forecast of Required Asset Financing for Renewable Projects
0
30
60
90
120
$150bn
‘36-’40‘31-’35‘26-’30‘21-’252016-’20Year
5970
82
99
142
Source: BNEF, 2016

8A CPI Report
Getting to India’s Renewable Energy Targets: A Business Case for Institutional InvestmentMarch 2018
Foreign and domestic institutional investors are well positioned to bridge these financing requirements in the renewable energy space, but are not investing at the expected levels
Foreign and domestic institutional investors may be an attractive source of capital (CPI, 2016). For the purpose of this report, institutional investors include insurance companies, pension funds, sovereign wealth funds, foundations, endowments, and investment managers. The sheer magnitude of assets under management (AUM) controlled by these institutional investors makes them an important source of financing. In India, domestic institutional investors hold an AUM of USD 564.1 billion. Globally, foreign institutional investors manage an AUM of more than USD 70 trillion (World Bank, 2017).
Nonetheless, globally, institutional investors have underinvested in the infrastructure sector. A survey of around 99 pension funds globally, infrastructure invest-ments in unlisted3 equity and debt was 1.1% of their AUMs (OECD, 2015a). And only nine pension funds reported exposure to renewable electricity, with 1%-19% of their infrastructure investments into renewable energy (OECD, 2016). The situation is similar to, if not worse, in India.
3 An unlisted security is a financial instrument that is not traded on an exchange, while listed security is traded on an exchange
This report aims to make a business case for insti-tutional investors, domestic and foreign, to invest or increase investments in renewable energy sector in India. This report is divided into four parts:
• Section 2 identifies drivers for renewable energy investments in India and competitive structure of the industry;
• Section 3 discusses alignment of investment criteria of institutional investors with renewable energy investments;
• Section 4 identifies key barriers faced by institutional investors and highlights suggested solutions
We conducted primary interviews with around 50 stake-holders. These included foreign (24) and domestic (25) stakeholders like pension funds, sovereign wealth funds, family funds, investment advisories, developers, associ-ations, regulatory authorities, brokerage houses, asset managers, and investment banks.
Table 1: Asset under Management (AUM) for domestic institutional investors (USD billion)
Life Insurance 372.6 (66%)
Non- Life Insurance 26.1 (5%)
National Pension System 16.3 (3%)
Employees’ Provident Fund Organization (EPFO) 149.1 (26%)
Total 564.1
Source: IRDA, PFRDA, latest estimates
9A CPI Report
March 2018 Getting to India’s Renewable Energy Targets: A Business Case for Institutional Investment
2. Drivers of renewable energy investment in India
4 http://www.ey.com/Publication/vwLUAssets/EY-RECAI-49-May-2017/$FILE/EY-RECAI-49-May-2017.pdf
In this section, we provide a more general discussion of why renewable energy in India is an attractive invest-ment for all investors, including institutional investors. In the next section, we then provide a stronger case for institutional investment in renewable energy in India.
2.1 Maturing renewable energy sector and strengthening macroeconomic fundamentals
India has one of the highest national renewable energy targets – 175 GW by 2022 – second only to China (see Appendix A). Furthermore, India has set an ambitious target of increasing the share of renewable generation capacity to 40% by 2030. These targets are backed by supporting policies and fiscal incentives, including feed in tariffs, guaranteed grid access, tax reliefs, and net metering polices (OECD, 2017a).
Due to these aggressive targets and supporting policies, India is among the top 10 countries in terms of new renewable energy investments (FS UNEP, 2017). India needs ~USD450 billion of capital over a period of 2016-2040 (BNEF 2016).
Additionally, from a risk-management perspective, India’s renewable market is well-diversified in terms of location of its projects. No single Indian state accounts for more than 12% of the total renewable energy power solar targets for 2022 (MNRE 2017). Wind projects,
despite having a tendency for spatial concentration, are also well spread across seven states with an average share of 14%.
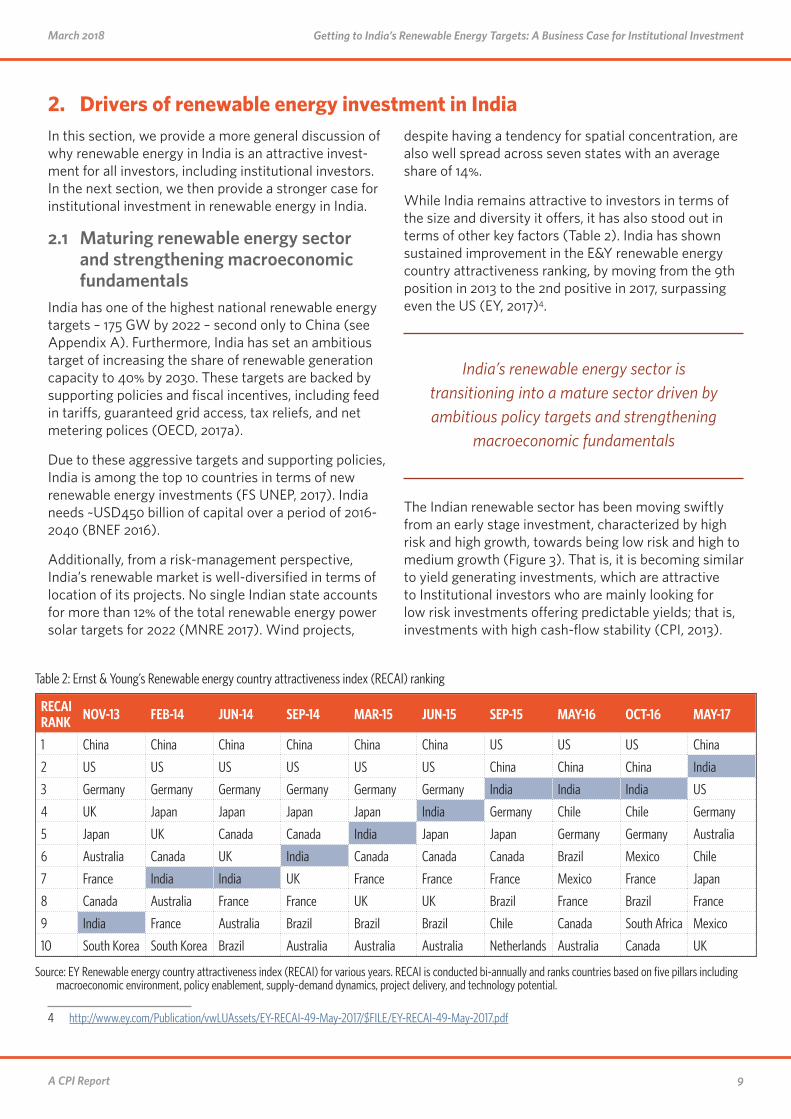
While India remains attractive to investors in terms of the size and diversity it offers, it has also stood out in terms of other key factors (Table 2). India has shown sustained improvement in the E&Y renewable energy country attractiveness ranking, by moving from the 9th position in 2013 to the 2nd positive in 2017, surpassing even the US (EY, 2017)4.
India’s renewable energy sector is transitioning into a mature sector driven by ambitious policy targets and strengthening
macroeconomic fundamentals
The Indian renewable sector has been moving swiftly from an early stage investment, characterized by high risk and high growth, towards being low risk and high to medium growth (Figure 3). That is, it is becoming similar to yield generating investments, which are attractive to Institutional investors who are mainly looking for low risk investments offering predictable yields; that is, investments with high cash-flow stability (CPI, 2013).
Table 2: Ernst & Young’s Renewable energy country attractiveness index (RECAI) ranking
RECAI RANK NOV-13 FEB-14 JUN-14 SEP-14 MAR-15 JUN-15 SEP-15 MAY-16 OCT-16 MAY-17
1 China China China China China China US US US China
2 US US US US US US China China China India
3 Germany Germany Germany Germany Germany Germany India India India US
4 UK Japan Japan Japan Japan India Germany Chile Chile Germany
5 Japan UK Canada Canada India Japan Japan Germany Germany Australia
6 Australia Canada UK India Canada Canada Canada Brazil Mexico Chile
7 France India India UK France France France Mexico France Japan
8 Canada Australia France France UK UK Brazil France Brazil France
9 India France Australia Brazil Brazil Brazil Chile Canada South Africa Mexico
10 South Korea South Korea Brazil Australia Australia Australia Netherlands Australia Canada UK
Source: EY Renewable energy country attractiveness index (RECAI) for various years. RECAI is conducted bi-annually and ranks countries based on five pillars including macroeconomic environment, policy enablement, supply–demand dynamics, project delivery, and technology potential.

10A CPI Report
Getting to India’s Renewable Energy Targets: A Business Case for Institutional InvestmentMarch 2018
Figure 3: Renewable energy sector stages with risk-return mapping
0
100
200
300
400
500GW
2040203520302025202020152010
Early Stage Expansionary Stage Stabilization Stage
RISK
High growth and low or negative profit margin but high expected return
High risk (technology, policy, financing risks, etc)
High to medium growth and stabilizing profit margin with moderate expected return
Low risk (performance, resource, and policy risk lowers but disruptive technology risk still exists)
Low growth and stable profit margin with normal returns
Very low risk (little innovation, stable policy and pricing)
Yearlyrenewable
energy projections
GROWTH CAPACITY
Source: BNEF, 2016 and CPI analysis
Figure 5: Excess returns on renewable investments
Japan
1.0%
2.0%
3.0%
4.0%
5.0%
AustraliaBrazil
CanadaChile
China
FranceGermany
India(175 GW)
Mexico
UnitedKingdom
UnitedStates
Expected return minus cost of
capital
20 GW
100 GW200 GW
NATIONAL TARGETS
Source: CPI Analysis

11A CPI Report
March 2018 Getting to India’s Renewable Energy Targets: A Business Case for Institutional Investment
A country’s investment attractiveness may be mea-sured by excess returns (World Bank, 2004), defined as the difference between the expected return on capital invested and the weighted average cost of capital (see Appendix B for details). We find that India offers excess returns of 3.5%; whereas, US and China, comparably large markets, offer lower excess returns, at 2.4% and 1.0%, respectively (Figure 5). While some markets provide higher excess returns than India—for example,
5 The national renewable energy targets are taken as a proxy for their market size. It is important to note that several countries do not report national targets in terms of capacity, also it varied by different target years; numbers based on authors’ calculation and information available as on August 2017.
Mexico, Canada, and Chile provide higher than 4.2%—they are much smaller markets5 than India.
India’s key economic indicators have been continuously improving (Figure 4), resulting in an upgrade of its sovereign rating by Moody’s from Baa2 from Baa3 (Nov 2017). Further, in World Economic Forum’s global com-petitiveness index, India ranked 40 out of 137 countries (WEF, 2017). India also moved up 30 places to the 100th position in World Bank’s ease of doing business index (World Bank, 2017a).
Figure 4: Key macroeconomic indicators of Indian economy
Middle East & North Africa
Latin America & Caribbean
Falling Fiscal Deficit (%)
2017-‘18
2016-‘17
2015-‘16
2014-‘15
2013-‘14
2012-‘13
2011-‘12
2010-‘11
2009-‘10
2008-‘09
3
4
5
6
7%
3.2%
Moderating Inflation (annual %)
2
4
6
8
10
12%
2017201620152014201320122011201020092008
3%
Narrowing Current Account Deficit (% of GDP)
-6
-5
-4
-3
-2
-1
0%
201620152014201320122011201020092008
-0.7
30
40
50
60
70
80
JAN2008
MAR2017
Appreciating Exchange Rate (USD INR) High FDI Flows (USD bn)
0
10
20
30
40
50
60
70bn
2016-’17
2015-’16
2014-’15
2013-’14
2012-’13
2011-’12
2010-’11
60
-2
0
2
4
6
8
10
12
20172016201520142013201220112010
WorldSub-Saharan Africa
South Asia
Middle East & North AfricaLatin America & Caribbean
India
Europe & Central Asia
East Asia & Pacific
High GDP Growth (annual %)
Source: Reserve Bank of India, Ministry of Statistics and Program Implementation - Government of India, World Bank
12A CPI Report
Getting to India’s Renewable Energy Targets: A Business Case for Institutional InvestmentMarch 2018
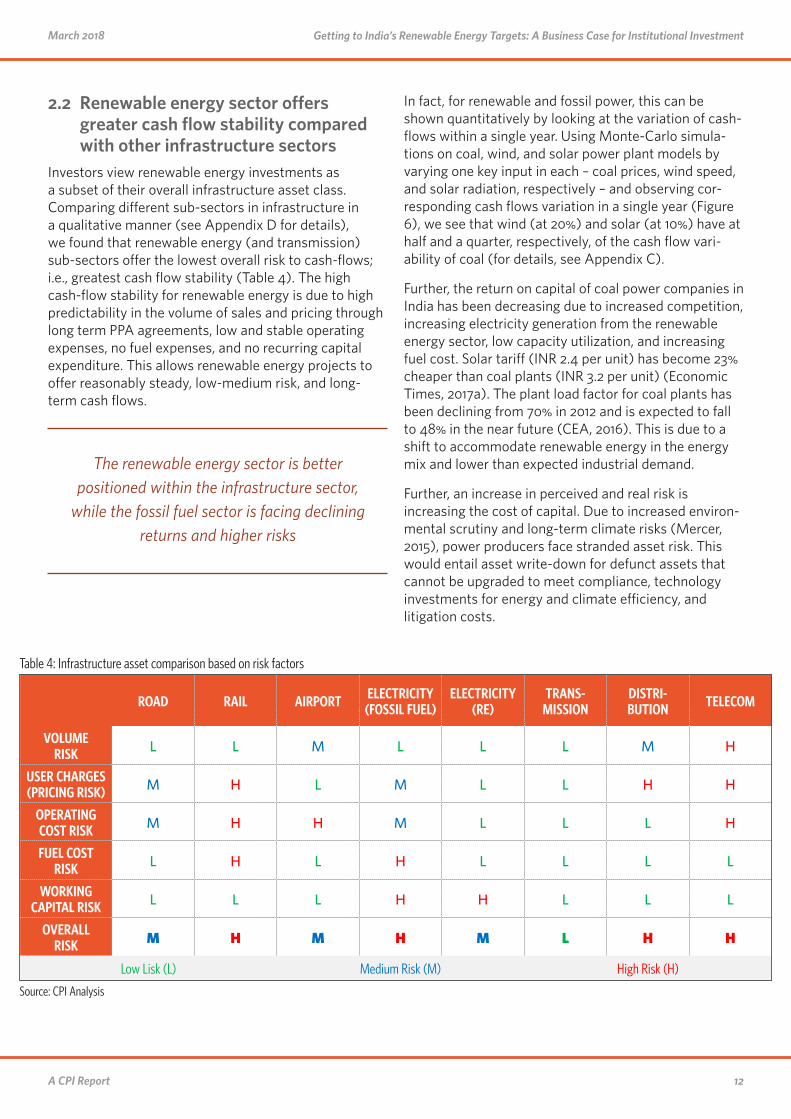
2.2 Renewable energy sector offers greater cash flow stability compared with other infrastructure sectors
Investors view renewable energy investments as a subset of their overall infrastructure asset class. Comparing different sub-sectors in infrastructure in a qualitative manner (see Appendix D for details), we found that renewable energy (and transmission) sub-sectors offer the lowest overall risk to cash-flows; i.e., greatest cash flow stability (Table 4). The high cash-flow stability for renewable energy is due to high predictability in the volume of sales and pricing through long term PPA agreements, low and stable operating expenses, no fuel expenses, and no recurring capital expenditure. This allows renewable energy projects to offer reasonably steady, low-medium risk, and long-term cash flows.
The renewable energy sector is better positioned within the infrastructure sector,
while the fossil fuel sector is facing declining returns and higher risks
In fact, for renewable and fossil power, this can be shown quantitatively by looking at the variation of cash-flows within a single year. Using Monte-Carlo simula-tions on coal, wind, and solar power plant models by varying one key input in each – coal prices, wind speed, and solar radiation, respectively – and observing cor-responding cash flows variation in a single year (Figure 6), we see that wind (at 20%) and solar (at 10%) have at half and a quarter, respectively, of the cash flow vari-ability of coal (for details, see Appendix C).
Further, the return on capital of coal power companies in India has been decreasing due to increased competition, increasing electricity generation from the renewable energy sector, low capacity utilization, and increasing fuel cost. Solar tariff (INR 2.4 per unit) has become 23% cheaper than coal plants (INR 3.2 per unit) (Economic Times, 2017a). The plant load factor for coal plants has been declining from 70% in 2012 and is expected to fall to 48% in the near future (CEA, 2016). This is due to a shift to accommodate renewable energy in the energy mix and lower than expected industrial demand.
Further, an increase in perceived and real risk is increasing the cost of capital. Due to increased environ-mental scrutiny and long-term climate risks (Mercer, 2015), power producers face stranded asset risk. This would entail asset write-down for defunct assets that cannot be upgraded to meet compliance, technology investments for energy and climate efficiency, and litigation costs.
Table 4: Infrastructure asset comparison based on risk factors
ROAD RAIL AIRPORT ELECTRICITY (FOSSIL FUEL)
ELECTRICITY (RE)
TRANS-MISSION
DISTRI-BUTION TELECOM
VOLUMERISK L L M L L L M H
USER CHARGES (PRICING RISK) M H L M L L H H
OPERATING COST RISK M H H M L L L H
FUEL COST RISK L H L H L L L L
WORKING CAPITAL RISK L L L H H L L L
OVERALLRISK M H M H M L H H
Low Lisk (L) Medium Risk (M) High Risk (H)
Source: CPI Analysis

13A CPI Report
March 2018 Getting to India’s Renewable Energy Targets: A Business Case for Institutional Investment
Figure 6: Cash flow variation in coal, wind and solar power plants
-50
-40
-30
-20
-10
0
10
20
30
40
50%
Coal Plant
Wind Plant
Solar Plant
Source: Numbers are derived from simulated financial models (CPI)
Figure 7: Return on capital and cost of capital for major fossil based power companies
NTPC TATA POWER
JSW NLC
5
10
15
20%
‘16‘15‘14‘13‘12‘11‘10‘096
8
10
12%
‘16‘15‘14‘13‘12‘11‘10‘09
5
10
15
20
25%
‘16‘15‘14‘13‘12‘11‘10‘099
11
13
15%
‘16‘15‘14‘13‘12‘11‘10‘09
Return on capital employedCost of capital (WACC)TrendlineActual
TrendlineActual
Source: Bloomberg, CPI Analysis

14A CPI Report
Getting to India’s Renewable Energy Targets: A Business Case for Institutional InvestmentMarch 2018
Given the above risks, it is in the interest of the institu-tional investors to gradually rebalance their portfolio in favor of climate friendly investments, in India and else-where. Institutional investors allocate assets to different sectors based on their strategic allocation policies. The power sector, which is historically been dominated by fossil fuel, typically constitutes a large portion of
6 Data collected from last 9 years (2008-2016) annual reports of Life Insurance Corporation.
institutional investors’ portfolio.6 The deteriorating financial performance—eroding company profitability due to decreasing return on capital and increasing cost of capital—of the fossil fuel power companies (Figure 7) warrants rebalancing of the institutional investors’ portfolios.

15A CPI Report
March 2018 Getting to India’s Renewable Energy Targets: A Business Case for Institutional Investment
3. Aligning institutional investors’ objectives with renewable energy sector investment traits
7 We have excluded other two objectives like unique circumstances of particular investors and tax concerns from our analysis. Pension and insurance funds are usually exempted from taxation on investment income and realized capital gains, while unique circumstances depend on the specific status of investors.
Institutional investors are bound by their fiduciary duties meant to maximize financial returns to their beneficiaries, without taking excessive risks, while also meeting their liabilities over the long-run. In this section, we not only explore a couple of related themes on making renewable energy investments in India attrac-tive to institutional investors (Sections 3.1-3.3), we also provide a summary of different pathways available for renewable energy investments (Section 3.4).
We evaluated the match of institutional investor criteria with characteristics of renewable investments based on five objectives (Maginn et al, 2016) pursued by inves-tors: returns, risk, liquidity, time horizons, and regulatory considerations.7 Table 5 and Table 6 provide a matching analysis for domestic pension funds and domestic insurance companies followed by foreign institutional investors in Table 7. A separate analysis is provided for domestic pension funds and domestic insurance companies given significant differences in respective investment criteria.
The renewable energy sector is a long-term and low-medium risk investment. This
matches reasonably well with the risk, return, and long investment horizon requirements of institutional investors. Regulations pertaining
to securities’ ratings, listing, and liquidity, however, may restrict institutional investors’
investments in renewable energy sector.
We found that the investment requirements of domestic pension funds and insurance companies, which mostly seek yield generating investments in low-risk, long-du-ration assets align well with the investment profile of renewable energy. However, certain sector specific issues, such as off-taker risk and limited availability of listed securities, restrict the flow of investments. These barriers can be addressed through policy and regulatory interventions as highlighted in Section 4.2.
Over time renewable energy investment has also become more suitable to foreign institutional investors as the sector matured from small size, high risk-high return investment to large size, medium risk-moderate return investment. Although the expected returns from renewable energy projects have come down from 20% to 15%, this still matches investors’ overall India market portfolio return requirements.

16A CPI Report
Getting to India’s Renewable Energy Targets: A Business Case for Institutional InvestmentMarch 2018
3.1 Domestic Pension FundsTable 5: Domestic pension funds investment criteria matching with the renewable energy investment profile
Source: CPI analysis based on the information available as of writing.a Needs long – duration securities, low risk fixed income instruments to meet long duration liabilities; also invest in equity to improve portfolio’s performanceb Equity investment at the corporate level could yield an even higher return.c However, Pension funds generally buy assets to hold them for long time to match the long maturity structure of liabilities. So, liquidity may not be a primary concern of
pension funds.
CRITERIA PENSION FUNDS’ REQUIREMENT(A)
RENEWABLE ENERGY (RE) INVESTMENT TRAITS(B)
PENSION FUNDS’ SUITABILITY WITH RE INVESTMENTS MATCH
RETURNa
Expected return on fixed income: 7.5%-8.2%Expected return on equity: 14%-16%.
Fixed income return: 7.5%-12% depending on the stage of financing and ratings. Equity return: 13%-18% depending on the invest-ment stage and asset quality.b
Significant overlap of investor expectations and renewable energy characteristics
High
RISK
Preference for low–medium risk investmentsAlso care about following risks:Asset-liability mismatch: Inability to pay at promised pay-outs on timeShort fall: Assets value becoming less than liabilities
Steady and predictable cash flows at the project level reduce asset-liability mismatch and short fall risks. However, sector specific risks (e.g., off-take risk) need to be managed to reduce risk perception (see Section 4.2).
With appropriate policy/regula-tory changes, sectoral risks can be mitigated appropriately (see Section 4.2).
Medium
LIQUIDITYNeed to hold excess cash (or liquid assets) to meet contingent claims.c
Historically, most investment opportunities are unlisted; however, listed options (e.g., IDFs) are becoming available (see Section 4.2.4). However, these listed options are not main stream yet.
With appropriate policy/regula-tory support, listed options will become more mainstream (see Section 4.2)
Low
INVESTMENT HORIZON More than 10 years Between 10-25 years
Significant overlap of investor expectations and renewable energy characteristics
High
REGULATORY
Not allowed to invest in debt rated lower than AA domestic rating; are seldom allowed for investment in illiquid assets.
Most renewable project debt is rated below AA, due to sector specific risks.Appropriate structuring (e.g., via IDFs) and risk mitigation is required
With appropriate policy/regula-tory support, appropriate ratings can be achieved.
Low

17A CPI Report
March 2018 Getting to India’s Renewable Energy Targets: A Business Case for Institutional Investment
3.2 Insurance CompaniesTable 6: Insurance companies investment criteria matching with the renewable energy investment profile
CRITERIA INSURANCE COMPANIES’ REQUIREMENT
RENEWABLE ENERGY (RE) INVESTMENT TRAITS
INSURANCE COMPANIES’ SUITABILITY WITH RE INVESTMENTS
MATCH
RETURNa
Expected return on fixed income: 7.5%-8.5%Expected return on equity: 15%-16%.
Fixed income return: 7.5%-12% depending on the stage of financing and ratings. Equity return:b 13%-20% depending on the investment stage and asset quality.
Significant overlap of investor expectations and renewable energy characteristics
High
RISK
Preference for low–medium risk investments Also care about following risks: Reinvestment: Reinvesting at lower rate than the initial rate Credit: Bond Issuer default. Climate: Inability to incorporate climate change projections (See Section 4.4).
Long duration of renewable investment can reduce reinvestment risk significantly; plus renewable investment reduces climate risk.However, sector specific risks (e.g., off-take risk) need to be managed to reduce risk perception (see Section 4).
With appropriate policy/regula-tory changes, sectoral risks can be mitigated appropriately (see Section 4).Insurance regulators from various countries are developing best practices to address climate risks (UN Environment 2017). IRDA can come out with certain guidelines for insurance companies (See Section 4.3)
Medium
LIQUIDITYNeed to hold excess cash (or liquid assets) to meet contingent claimsc.
Historically, most investment opportunities are unlisted; however, listed options (e.g., IDFs) are becoming available (see Section 4.2.4). However, these listed options are not main stream yet.
With appropriate policy/regula-tory support, listed options will become more mainstream (see Section 4.2)
Low
HORIZON2-40 years (depending on insurance plans)
10-25 yearsSignificant overlap of investor expectations and renewable energy characteristics
High
REGULATORYNot allowed to invest in debt rated lower than AA domestic rating; Also allowed to invest in listed equity
Most renewable project debt is rated below AA, due to sector specific risks.Appropriate structuring (e.g., via IDFs) and risk mitigation is required
With appropriate policy/regula-tory support, appropriate ratings can be achieved.
Low
Source: CPI analysis based on the information available as of writing. a Most investments are in fixed income securitiesb Equity investment at the corporate level could yield an even higher returnc Contingent claim is payment dependent on realization of uncertain future events
18A CPI Report
Getting to India’s Renewable Energy Targets: A Business Case for Institutional InvestmentMarch 2018
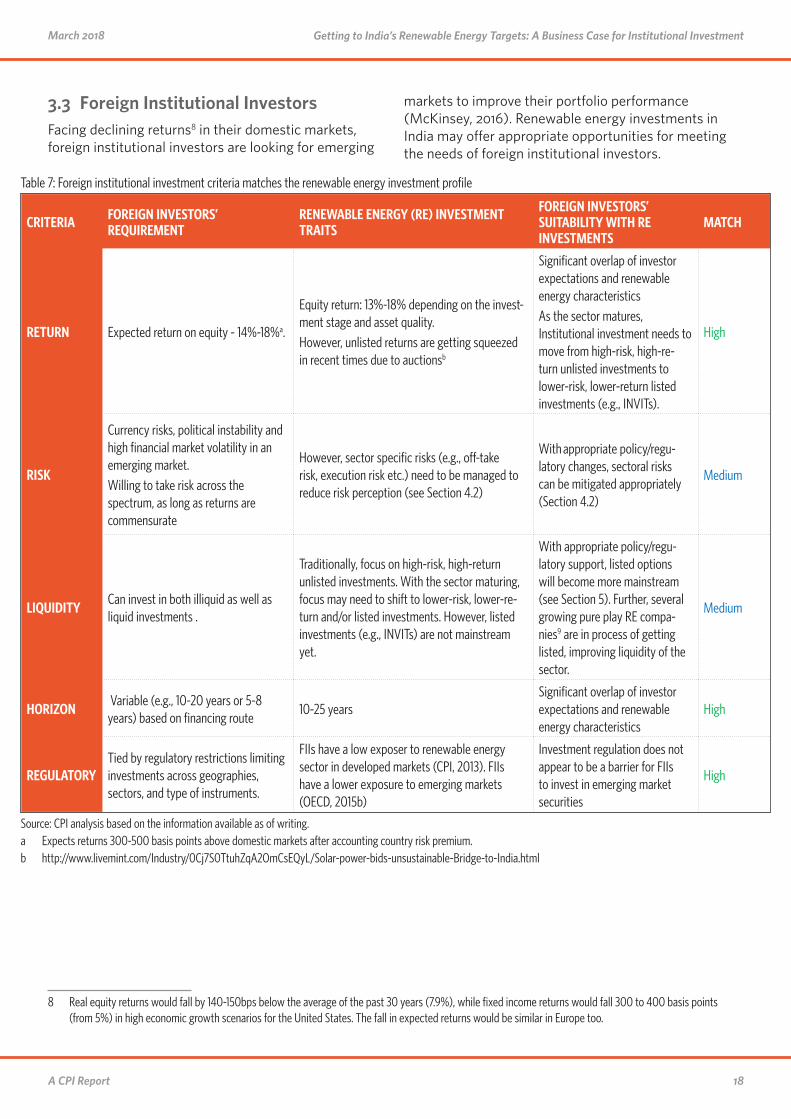
3.3 Foreign Institutional Investors Facing declining returns8 in their domestic markets, foreign institutional investors are looking for emerging
8 Real equity returns would fall by 140-150bps below the average of the past 30 years (7.9%), while fixed income returns would fall 300 to 400 basis points (from 5%) in high economic growth scenarios for the United States. The fall in expected returns would be similar in Europe too.
markets to improve their portfolio performance (McKinsey, 2016). Renewable energy investments in India may offer appropriate opportunities for meeting the needs of foreign institutional investors.
Table 7: Foreign institutional investment criteria matches the renewable energy investment profile
CRITERIA FOREIGN INVESTORS’ REQUIREMENT
RENEWABLE ENERGY (RE) INVESTMENT TRAITS
FOREIGN INVESTORS’ SUITABILITY WITH RE INVESTMENTS
MATCH
RETURN Expected return on equity - 14%-18%a.
Equity return: 13%-18% depending on the invest-ment stage and asset quality. However, unlisted returns are getting squeezed in recent times due to auctionsb
Significant overlap of investor expectations and renewable energy characteristicsAs the sector matures, Institutional investment needs to move from high-risk, high-re-turn unlisted investments to lower-risk, lower-return listed investments (e.g., INVITs).
High
RISK
Currency risks, political instability and high financial market volatility in an emerging market.Willing to take risk across the spectrum, as long as returns are commensurate
However, sector specific risks (e.g., off-take risk, execution risk etc.) need to be managed to reduce risk perception (see Section 4.2)
With appropriate policy/regu-latory changes, sectoral risks can be mitigated appropriately (Section 4.2)
Medium
LIQUIDITYCan invest in both illiquid as well as liquid investments .
Traditionally, focus on high-risk, high-return unlisted investments. With the sector maturing, focus may need to shift to lower-risk, lower-re-turn and/or listed investments. However, listed investments (e.g., INVITs) are not mainstream yet.
With appropriate policy/regu-latory support, listed options will become more mainstream (see Section 5). Further, several growing pure play RE compa-nies9 are in process of getting listed, improving liquidity of the sector.
Medium
HORIZON Variable (e.g., 10-20 years or 5-8 years) based on financing route
10-25 yearsSignificant overlap of investor expectations and renewable energy characteristics
High
REGULATORYTied by regulatory restrictions limiting investments across geographies, sectors, and type of instruments.
FIIs have a low exposer to renewable energy sector in developed markets (CPI, 2013). FIIs have a lower exposure to emerging markets (OECD, 2015b)
Investment regulation does not appear to be a barrier for FIIs to invest in emerging market securities
High
Source: CPI analysis based on the information available as of writing. a Expects returns 300-500 basis points above domestic markets after accounting country risk premium.b http://www.livemint.com/Industry/0Cj7S0TtuhZqA2OmCsEQyL/Solar-power-bids-unsustainable-Bridge-to-India.html

19A CPI Report
March 2018 Getting to India’s Renewable Energy Targets: A Business Case for Institutional Investment
3.4 Investment pathways for institutional investors to gain exposure to renewable energy
An investor can gain exposure in the renewable energy sector through various listed and unlisted debt/lending opportunities, equity, and structured pathways. Listed instruments are easy to find in the market. Unlisted investments are made either directly9 into companies or projects or indirectly10 through unlisted funds. The
9 Direct investing is defined as investing in which the future asset owner makes the decision to take part in a specific investment (WEF, 2014)10 Indirect investing is made through securities or funds
following are some of the pathways that allow institu-tional investors to invest in renewable energy:
• Investment through corporate equity and debt (both at the project and corporate level, green bonds, and AIF structure are suitable for FIIs
• Investment through corporate and project debt/lending, InvIT, IDFs, and NBFCs are suitable for DIIs
Table 10 provides a summary of different ways institu-tional investors can invest in India renewable energy.
Table 10: Investment universe for investors, domestic institutional investors (DII) and foreign institutional investors (FII) in renewable sector and suitability.
INVESTMENT CATEGORY
LISTED / UNLISTED INSTRUMENT
SUITABILITY WHETHER THE INSTRUMENT MEET INVESTORS’ INVESTMENT OBJECTIVES (RETURN, RISK, INVESTMENT HORIZON, LIQUIDITY, AND REGULATORY REQUIREMENTS)
Fixed Income
Listed Corporate Debt + Suitable for both domestic institutional investors (DIIs) and
foreign institutional investors (FIIs). − Rating, due to sector level risks, is a constraint.
Listed Project Debt + Suitable for DIIs. − Rating, due to sector level risks, is a constraint. − Size of project debt could be a constraint.
Unlisted Corporate and Project Lending + Suitable for domestic insurance companies and FIIs. − Domestic pension funds are not allowed. − Size could be a constraint for FIIs.
ListedGreen Bonds + Suitable for investments by both DIIs and FIIs;
− Need to become mainstream
ListedInfrastructure Debt Fund (IDF) – Investing heavily in RE sector
+ Suitable for DIIs. − Not suitable for FII, due to low yields.
Equity
Listed Corporate − Not suitable for DIIs. + Suitable for FIIs; − There are not many options yet
Unlisted Corporate − DIIs not allowed to invest. + Suitable for FIIs.
Unlisted Project − DIIs are not allowed. ± Suitable for FII − Size would be a constraint
Investment Vehicle
Alternative Investment Fund (AIF) who are investing in RE sector – Both Debt and Equity
+ Suitable for DIIs (Allowed to invest in AIFs). + Suitable for smaller FIIs
NBFCs like IREDA – Both Debt and Equity
+ Suitable for both DIIs and FIIs − There is only a single NBFC exclusively lending to RE sector
Infrastructure Investment Trust (InvITs)
+ Suitable for both DIIs and FIIs given yield generation − There is not a single renewable energy specific InvIT

20A CPI Report
Getting to India’s Renewable Energy Targets: A Business Case for Institutional InvestmentMarch 2018
4. Key barriers faced by institutional investors and suggested solutions
11 http://pib.nic.in/newsite/printrelease.aspx?relid=130261
4.1 OverviewAs we see in Section 3, investment in renewable energy may become more attractive for institutional investors, provided certain barriers are addressed. In this section, we examine these barriers and explore potential solu-tions, including efforts over time, to these barriers. We note that our solutions are not the final word; however, this discussion is a starting point for removing key bar-riers to institutional investment in renewable energy.
In order to indicate the significance of the various barriers to institutional investment in Indian renewable energy, we have prioritized the barriers according to their severity level, using a ranking system of 1 to 5, with 1 being the most severe (Table 8). These rankings are based on a simplistic count of interviewees reporting these barriers as a concern (see Appendix E for details).
4.2 Barriers and suggested solutionsWe now discuss each of these barriers, including solutions attempted so far, issues with current solu-tions, and way forward. These solutions warrant further research to assess their feasibility and impact. CPI, through its future work, intends to continue to work and delve deeper to actualize these potential solutions.
Off-taker risk:
This occurs due to delays in payment for power pur-chased by the primary off-takers, the state DISCOMS. DISCOMs have an accumulated loss of INR 3.8 lakh crore and outstanding debt of INR 4.3 lakh crore (as on Mar’2015).11 A primary reason for this is the bad financial situation of the DISCOMs due to inefficient economic and operational practices (India Ratings and Research, 2017a). A long-term solution is to fix the root-causes, as it is now tried by the Ujwal DISCOM Assurance Yojana
(UDAY). Though UDAY has shown promise in reducing operational inefficiencies and improving financial per-formance in selected cases (Economic Times, 2017b), it is still early to measure the effectiveness of the UDAY scheme in reducing the off-take risk. This indicates that, in the short-to-midterm, alternate solutions need to be explored.
A promising option is tripartite agreements between the central government, state governments, and the Reserve Bank of India (Bridge to India, 2017). These ensure, in case of state DISCOM delays, payments from central government to the beneficiary of the agreement, while withholding from the corresponding state gov-ernments. However, currently these agreements are available only for public-sector intermediaries – NTPC and SECI – between renewable power developers and state DISCOMs. Therefore, NTPC and SECI contracts are considered attractive (India Ratings and Research, 2017b)).
In cases when NTPC and SECI are not present as inter-mediaries, a credible payment security mechanism may be required (CPI, 2016a), either by the corresponding state, or via a standalone payment security mechanism (PSM). Though such payment security has been pro-vided in the highly successful Rewa auction in Madhya Pradesh (Business Line, 2016), they are not common-place yet. As an alternative, standalone PSMs may prove to be an attractive option (CPI, 2016a). However, it is still early days for these standalone PSMs, and they need to be designed appropriately and transparently to ensure they provide the appropriate risk mitigation (Shrimali and Reicher, 2017).
Currency risk:
Currency risk is a potential issue when labilities are in a foreign currency (e.g., USD), but operating cash flows are in a local currency (e.g., INR). Due to expected and unexpected devaluation in the local currency, borrowers face currency risk. This risk is typically addressed by purchasing a currency swap in the market. However, not only are these market-based swaps expensive (e.g., approx. 7% pts) they also may not be available for longer durations (e.g., beyond 5 years) (The Lab, 2016a).
To address this issue, many promising solutions have been proposed, including using a risk buffer to manage currency volatility (CPI, 2015) as well as using tail risk guarantees (The Lab, 2016b). These solutions show
Table 8: Barriers faced by institutional investors in the renewable energy sector.
RANKING FOREIGN DOMESTIC
1 Off-taker risk Off-taker risk
2 Currency risk Low credit ratings
3 Lack of financial securities High perceived risk
4 High perceived risk Lack of financial securities
5 Small size of investment Regulatory/policy risks

21A CPI Report
March 2018 Getting to India’s Renewable Energy Targets: A Business Case for Institutional Investment
promise in reducing the cost of currency hedging by up to 50%, while providing a leverage of up to 10X for public money. However, these solutions still need to be imple-mented in appropriate public-private partnerships.
Low credit ratings:
Because of sector specific risks, including off-taker risk, the perception of overall risk of renewable energy vehi-cles may be higher than what is required to get to the AA domestic rating – the minimum rating required by institutional investors to invest. Though there is a spe-cific solution, in the form of a partial credit guarantee (PCG) offered by IIFCL (Business Standard, 2016a), this is not considered successful yet, with only two renew-able energy issuances so far, and those in 2016.
Issues with the PCG include the following: Investors are still not clear about the transaction structure and the yield of bonds is still not attractive given the quantum of guarantee (CPI, 2016a). One of the key issues with these credit enhanced bonds is that, though these bonds are priced appropriately in the market, the net benefit compared to bank debt does not justify the transaction costs. As an example, with PCG, the benefit is a maximum of 1.50%. With cost of PCG at least 0.5% and cost of transaction at least 0.5%, the net benefit of at most 0.5% does not justify the hassle of a bond issuance.12
In this context, we believe that the following initiatives may prove helpful. First, targeted awareness programs may provide greater clarity on the transaction struc-ture of PCG-backed bonds. Second, initial subsidization of guarantees and transaction fees may encourage issuers to actively pursue PCG-backed bonds instead of pursuing alternate avenues. Once a sizeable (PCG in renewable energy sector) market is created and the proof of concept is in place, the cost of guarantee (diversification benefits) and transaction fee (size and learning benefits) can be reduced (Gozzi et al, 2016).
Lack of financial securities:
A key reason for low investment levels from domestic institutional investors in the renewable energy sector is lack of investable securities as most developers are borrowing and not issuing securities.
12 CPI Analysis13 IDFs offer an opportunity for investment in illiquid and low rated infrastructure sectors including renewable energy sector through their unique structures. They
source debt capital through issuance of debt from investors, particularly from institutional investors14 This structure allows yield seeking and low risk institutional investors to invest in mostly illiquid operational assets.15 The lending arm of the Indian Ministry of New and Renewable Energy
Institutional investors typically look for listed (and liquid) vehicles to make majority of their investments. In India, policymakers have been aware of the need for these vehicles, and they have been gradually created, both for debt (green bonds, IDFs13) as well as equity (InvITs14) financial vehicles. So, the issue appears to be not so much of the presence of these vehicles, but of getting them to work for institutional investment in renewable energy. In this context, common issues include availability of (mostly de-risked) operational projects (Business Line, 2017) as the sector matures over time as well as the credit quality of vehicles.
For debt, IDFs (especially IDF-NBFCs) appear to be the suitable vehicles for institutional investment in renew-able energy. Though current IDFs are not specialized in renewable energy, they do hold a large (~30%) per-centage of renewable energy assets (Annual reports of IDF-NBFCs). Green bonds also provide an avenue for investments, and India’s green bond issuances stood at USD 3.2 billion (CBI April, 2017). However, most of the green bond offerings have been at corporate level, with only a few project bonds offered so far.
In this context, one of the promising solutions is to incentivize banks and Non-Banking Financial Companies (NBFCs), for instance Indian Renewable Energy Development Agency (IREDA),15 to securitize their renewable energy project loan portfolio. The Government can cover the cost related to securitiza-tion of renewable energy loan pools (transaction cost) and subsidize partial guarantee fees on bonds issued through securitization structures. These incentives will encourage NBFCs and banks to securitize their loans exposed to the renewable energy sector. Further, the Reserve Bank of India (RBI) can reduce risk weightage on renewable energy loans, which results in reducing regulatory capital requirements of banks and NBFCs for renewable energy loans. This will result in improving return of assets of banks and free up their regulated capital to lend more to the renewable energy sector. This could be suitable avenue for future work to explore how portfolios of assets can be warehoused and securi-tized for bond offering.
For equity, InvITs provide suitable vehicles for insti-tutional investors seeking yield in renewable energy. However, it is still early days for InvITs, let along renewable energy ones. Currently, there are only two

22A CPI Report
Getting to India’s Renewable Energy Targets: A Business Case for Institutional InvestmentMarch 2018
functional InvITs in the Indian market and both are not from the renewable energy sector, and investors are still trying to get comfortable with these vehicles. However, some renewable energy InvITs are being explored, while facing competition from corporate level public issuances16.
High Perceived Risk:
Investors are hesitant to invest in the Indian renewable energy sector due to lack of historical performance record and lack of understanding of the risks at various stages in the renewable energy sector.
A possible solution could be institutional investors building a renewable energy specialized direct invest-ment team, which can conduct due diligence of renew-able energy projects (CPI, 2013). Building a direct investment team in big emerging markets is likely to be a good value proposition for large foreign institutional investors to do project financing. Similarly, for domestic institutional investors, such direct investment teams will allow for careful evaluation of direct exposure in illiquid infrastructure assets.
Small Size of Investment:
The size of investment deal is an important factor for institutional investors in order to justify their high due diligence and transaction costs. Minimum size for direct investment of domestic institutional investors and foreign institutional investors is USD 1 million and USD 100 million, respectively.
Securitization can address small loan size barrier to a great extent and transition the securities of renewable energy sector into investable securities for domestic pension and insurance funds (India Lab, 2016b). The existing small loan pool of renewable energy assets can be bundled, securitized, and sold as asset-backed secu-rities, which can address the issue of small size. In addi-tion, diversification benefits of pooled funds, diversified by states and by developers, can improve the ratings of securities. In addition, tranching of asset-backed securi-ties can improve certain classes of securities.
16 https://economictimes.indiatimes.com/markets/stocks/news/acme-group-looking-to-raise-capital-through-invit/articleshow/58859606.cms17 http://niti.gov.in/writereaddata/files/Manu%20Srivastava.pdf
Another solution could be building a not-for-profit, fee-based intermediary to source deals, structure deals, and conduct due diligence on behalf of investors seeking direct investment in the renewable energy sector. Such an intermediary would be able to address the investment size needs of varied investor types – small, medium, and large. It would allow matching of long term investors of capital (demand side) with on-board project developers, independent power producers, com-panies, and projects (supply side).
Regulatory / Policy risk:
The investors in this sector are facing multiple regula-tory and policy risks like uncertainty around continuity of numerous government incentives. Policy stability and clear signals can mitigate these risks and concerns among investors (CPI, 2016a). The recently closed REWA bid is an example, wherein a three tier payment security mechanism, state guarantee, deemed gener-ation clause, termination compensation, etc. incorpo-rated in the contract17 helped reduce uncertainty for investors.
Renegotiation Risk:
A new risk that has emerged over time is the renegotia-tion of contracts. Due to an unprecedented decrease in solar tariffs because of decline in both technology and finance costs, in recent months, several state-owned power distribution utilities (DISCOMs) are rescinding and revisiting on their previously agreed power pur-chase agreements (PPAs), which were contracted at higher tariffs. Although the PPAs are legally binding, this sends wrong signals to companies and investors.
Possible solutions include development of a strong PPA (eliminating all the loopholes in the PPA), making PPAs contractually enforceable in the court of law, speedier resolution of suits related to PPAs in the courts, and making renegotiation not an apparent option in the PPA (India Ratings, 2017c). In case of non-honoring of commitment from either party, a well calibrated quick resolution mechanism should be in place.

23A CPI Report
March 2018 Getting to India’s Renewable Energy Targets: A Business Case for Institutional Investment
4.3 The way forward for insurance regulators
In the longer-term, insurance regulators can consider introducing certain guidelines to protect beneficiaries against climate risks. These guidelines are discussed below, but it is worth noting that they warrant further research to assess their feasibility in terms of whether institutional investors could follow them, and also their potential impact on renewable energy financing. CPI, through its future work, intends to continue to assess these guidelines.
Issue guidelines on developing risk management frameworks to manage climate risk
Domestic insurance companies are not currently incorporating climate risk in their investment deci-sion making18. However, numerous studies indicate that climate risk will have adverse impacts on several sectors these investors currently have exposure to climate risk (Mercer 2016). Investors should assess their portfolio exposure to sectors that are likely to be adversely affected by risks emanating from climate change in coming years (Andersson et al. 2016). This will give them a head start to gradually diversify from such high carbon sectors. In addition, investors should also consider investment opportunities in sectors such as renewable energy amongst others that could mitigate climate risk in their portfolios.
Introduce investment regulation for carbon footprint disclosure
Institutional investors across the world, along with fulfilling their fiduciary duty of maximizing returns, are moving towards socially responsible investing. This entails divesting stakes from high carbon sectors and
18 Based on interviews with institutional investors
diversifying to climate friendly sectors in their portfolio. Given many investors’ long-term portfolio exposure to climate risk (Energy Policy, 2011) (e.g. stranding of fossil fuel assets), the need for socially responsible investing makes both business and social sense. A mandate requiring institutional investors to disclose the carbon footprints of their portfolios will allow both investors and companies to assess the true impact of climate change risk on their portfolios and activities in the long run and take investment decisions accordingly. Also, it will allow retail investors, who contribute to the corpus of pension funds and insurance companies, to make an informed choice on their insurance and pension policies. Ultimately, such disclosures can accelerate finances into low carbon infrastructure sectors including renewable energy sector.
Create a mandate to assign green ratings in addition to credit ratings for financial securities
In addition to the mandatory credit rating, all companies should provide green ratings on their financial securi-ties. These ratings would allow investors who evaluate environmental aspects in their investment decision making to make more informed decisions around securities. To introduce such a mandate, the govern-ment could provide incentives to companies or rating agencies to introduce green ratings. The Government of India subsidizes credit rating costs for micro and small enterprises to access credit markets and reduce their financing costs, allowing these small companies to compete with larger players (Onicra). A similar subsidy for green ratings for the renewable energy sector could be instrumental as companies in this sector are usually small or medium and also need long term debt funding at competitive rates. This type of policy would align with the Government’s priority to grow the renewable energy sector.

24A CPI Report
Getting to India’s Renewable Energy Targets: A Business Case for Institutional InvestmentMarch 2018
4.4 Next steps for Institutional investorsInstitutional investors can follow certain practices to better leverage opportunities in renewable energy sector:
Relax maximum sectoral allocations in favor of strategic sub sectoral allocations
Institutional investors generally have target allocations in various sectors in accordance with their long-term strategic asset allocation policies (Hertrich, 2013). Renewable energy is considered to be a part of the power sector19, which is limiting investors to invest more in renewable energy, especially when the sector is expe-riencing high growth. The traditional long term strategic asset allocation is largely based on historical perfor-mance, and often fails to take into account emerging trends in various sectors (Sharpe, 2010). As rapid tech-nological innovations changes an industry’s dynamic rapidly, back-ward looking strategic asset allocations would underperform compared to the broader market, and possibly generate lower return than minimum required returns (Blackrock, 2016a).
19 Data collected from last 9 years (2008-2016) annual reports of Life Insurance Corporation.
The power sector is a case in point. The power sector is going through a transition phase as renewable energy contribution to the overall energy mix is increasing at a rapid pace and this trend will continue for the next two decades (BNEF, 2016). The existing power portfolio of investors (mostly exposed to fossil based power) would underperform due to declining demand for fossil based power; resulting in underperformance of investors’ power portfolio. Therefore, investors should consider increased investments in subsectors like renewable energy within their overall portfolios either by increasing subsector allocations, or increasing exposure to the power sector more generally as they cannot sell off entire fossil fuel based power assets immediately.
Invest in forward-looking, theme-based avenues:
The previous suggestion leads us to a broader point for more forward looking and theme-based investments by institutional investors as compared to backward looking investments based on historical performance and benchmarks. Such theme-based investments yield results in the long run (Responsible Investor, 2014), fitting well with institutional investor’s long investment horizons. Renewable energy sector amongst other climate risk mitigating sectors could be part of such theme-based investments (Blackrock, 2016b).

25A CPI Report
March 2018 Getting to India’s Renewable Energy Targets: A Business Case for Institutional Investment
5. Concluding thoughts In order to meet its national renewable energy targets, India needs to mobilize around ~USD 450 billion of financing capital over 2016-2040. In this study, we found that renewable energy in India is an attractive oppor-tunity for institutional investors. Renewable energy is characterized by long investment horizons and reason-ably predictable returns. These characteristics, along with strong policy commitments and robust long-term growth prospects of the sector, provide a strong poten-tial match for institutional investment, which seeks low-risk, long-duration assets.
Despite this apparent match, institutional investors are facing numerous barriers to their investment in the sector. Some of the key barriers faced by investors include off-taker risk, regulation, lack of adequate liquid financial securities, and limited understanding of the renewable energy sector. Foreign institutional investors are additionally constrained by currency risk and lack of adequate size of investments.
We have outlined some initial potential solutions from the policy, regulatory, and investor perspectives, which require future research. In particular, potential research could focus on the following topics:
• Developing a risk management framework for institutional investors to assess and manage climate risk;
• Conducting an exploratory study on the feasi-bility, structuring, and functioning of a not-for-profit fee based financial intermediary to source deals and projects for investors seeking direct investment in renewable energy sector;
• Engaging in theme-based investment research studies in various climate mitigation and adoption sectors; and
• Conducting a study on regulations of capital flows from institutional investors into climate sector
• Engaging in further feasibility and impact analysis of various solutions.

26A CPI Report
Getting to India’s Renewable Energy Targets: A Business Case for Institutional InvestmentMarch 2018
6. References Amenc, N., P. Malaise, and L. Martellini. 2004. Revis-
iting core-satellite investing: A dynamic model of relative risk management. Journal of Portfolio Management
Amenc. N., Goltz. F., and A. Grigoriu, 2010. Risk Control through Dynamic Core-Satellite Portfolios of ETFs: Applications to Absolute Return Funds and Tacti-cal Asset Allocation. EDHEC-Risk Institute
Andersson, M. Bolton, P. and Samama F. 2016. Hedging Climate Risk. Financial Analysts Journal
Blackrock. 2016a. The Mainstreaming of Renewable Power Sector growth of an infrastructure sector. https://www.blackrock.com/au/intermediaries/literature/market-commentary/blackrock-the-mainstreaming-of-renewable-power-en-au.pdf
Blackrock Investment Institute. 2016b. Adapting portfo-lios to climate change: Implications and strategies for all investors.
Bloomberg New Energy Finance. 2016. New Energy Outlook.
Bridge to India. 2017. SECI gets a significant boost to its credit rating. http://www.bridgetoindia.com/seci-gets-significant-boost-credit-rating/
Business Line. 2016. Three-layer safety mesh brings down Rewa solar power tariffs. http://www.thehin-dubusinessline.com/companies/threelayer-safe-ty-mesh-brings-down-rewa-solar-power-tariffs/article9640454.ece
Business Standard. 2016a. IIFCL’s credit enhancement debuts with renewable energy issuance; http://www.business-standard.com/article/companies/iifcl-s-credit-enhancement-debuts-with-renew-able-energy-issuance-115092301088_1.html
Central Electricity Authority - Ministry of Power. Dec 2016. Draft National Electricity Plan. http://www.cea.nic.in/reports/committee/nep/nep_dec.pdf
Centre for study of Science, Technology and Policy. 2016. Policy note on Re-assessment of India’s On-shore Wind Power Potential. http://www.cstep.in/uploads/default/files/publications/stuff/c1d1ec51806ba5d1716b15b01d89e4f9.pdf
Clayman.M.R. Fridon. M.S. Troughton. G.H. Scanlan. M. 2016. Corporate Finance, 2ed: A Practical Ap-proach. Willey
Climate Bonds Initiative. 2017. Bonds & Climate Change: State of the Market
Climate Policy Initiative. 2013. The Challenge of Institutional Investment in Renewable Energy. http://climatepolicyinitiative.org/wp-content/uploads/2013/03/The-Challenge-of-Institution-al-Investment-in-Renewable-Energy.pdf
Climate Policy Initiative. 2015. Reaching India’s Renew-able Energy Targets Cost-Effectively: A Foreign Exchange Hedging Facility.
Climate Policy Initiative. Dec 2016. Reaching India’s Renewable Energy Targets: The Role of Institu-tional Investors. https://climatepolicyinitiative.org/publication/reaching-indias-renewable-ener-gy-targets-role-institutional-investors/
Climate Policy Initiative. 2016a. Driving Foreign Invest-ment to Renewable Energy in India: A Payment Security Mechanism to Address Off-Taker Risk
Damodaran. A. 2008. Damodaran on Valuation. 2ed. Willey
Economic Times. 2017a. Solar power tariff drops to historic low at Rs 2.44 per unit. https://economic-times.indiatimes.com/industry/energy/power/solar-power-tariff-drops-to-historic-low-at-rs-2-44-per-unit/articleshow/58649942.cms
Economic Times. 2017b. Discoms save Rs 15K crore under UDAY scheme.http://economictimes.indiatimes.com/industry/energy/power/discoms-save-rs-15k-crore-under-uday-scheme/article-show/60084903.cms
Energy Policy. 2011. Strategic choices for renewable energy investment: Conceptual framework and opportunities for further research
EY. Various years. EY Renewable energy country attractiveness index. http://www.ey.com/gl/en/industries/power---utilities/renewable-ener-gy-country-attractiveness-index
Frankfurt School-UNEP Centre/BNEF. 2017. Global trends in renewable Energy Investment. http://fs-unep-centre.org/sites/default/files/publi-cations/globaltrendsinrenewableenergyinvest-ment2017.pdf
Gozzi. J.C. and Schmukler. S. 2016. Public Credit Guar-antees and Access to Finance. Warwick Economics Research Paper Series

27A CPI Report
March 2018 Getting to India’s Renewable Energy Targets: A Business Case for Institutional Investment
Hertrich. C. 2013. Asset Allocation Considerations for Pension Insurance Funds: Theoretical Analysis and Empirical Evidence. Springer.
Hindustan Times. Jun 2017. SoftBank’s India solar am-bitions may gain from PM Modi’s electric vehicle push
ICRA. 2017. India Infradebt Limited Rating. https://www.icraresearch.in/Credit_Perspective/DownloadRa-tionalFile?RationalId=35249
India Ratings and Research. 2017a. Ujwal DISCOM Assurance Yojana (UDAY) , Green Shoots in Fi-nancial Performance of Discoms Visible, Although Challenges Remain. https://www.indiaratings.co.in/PressRelease?pressReleaseID=28369&ti-tle=UDAY%3A-Green-Shoots-in-Financial-Perfor-mance-of-Discoms-Visible%2C-Although-Chal-lenges-Remain
India Ratings and Research. 2017b. Assigns IRB InvIT Fund a Long Term Senior Debt Rating of ‘IND AAA’. https://www.indiaratings.co.in/PressRe-lease?pressReleaseID=26142&title=India-Rat-ings-Assigns-IRB-InvIT-Fund-a-Long-Term-Se-nior-Debt-Rating-of-%E2%80%98IND-AAA%E2%80%99%3B-Outlook-Stable
India Ratings and Research. 2017c. Market Wire: Strong Payment Mechanism Partly Contributes to Solar Tariff Free Fall; Solar Projects Funding To Ease.
Maginn. JL, Tuttle. DL., and DW. McLeavey et al. Managing Investment Portfolios, 3ed: A Dynamic Process. 2016.Wiley.
McKinsey Global Institute. 2016. Diminishing Returns: Why Investors May Need to Lower their Expecta-tions.https://www.mckinsey.com/~/media/mck-insey/industries/private%20equity%20and%20principal%20investors/our%20insights/why%20investors%20may%20need%20to%20lower%20their%20sights/mgi-diminishing-returns-full-re-port-may-2016.ashx
McKinsey. 2014. From indexes to insights: The rise of thematic investing.
Mercer. 2015. Investing in a time of climate Change. https://www.mercer.com/content/dam/mercer/attachments/global/investments/mercer-cli-mate-change-report-2015.pdf
MNRE. 2017. Tentative State-wise break-up of Renew-able Power target. http://mnre.gov.in/file-manag-er/UserFiles/Tentative-State-wise-break-up-of-Renewable-Power-by-2022.pdf
NITI Aayog - Government of India. 2017. Draft National Energy Policy. http://niti.gov.in/writereaddata/files/new_initiatives/NEP-ID_27.06.2017.pdf
OECD. 2015b. Risk and Return characteristics of infra-structure investment in Low Income Countries. https://www.oecd.org/g20/topics/development/Report-on-Risk-and-Return-Characteristics-of-In-frastructure-Investment-in-Low-Income-Coun-tries.pdf
OECD. 2016. Business and Finance Outlook (Chapter 5). http://www.oecd.org/investment/investment-pol-icy/BFO-2016-Ch5-Green-Energy.pdf
OECD. 2017a. Economic Outlook for Southeast Asia, China and India.. http://www.keepeek.com/Digital-Asset-Management/oecd/development/economic-outlook-for-southeast-asia-china-and-india-2017_saeo-2017-en#page34
Onicra. http://www.onicra.com/ASPX/Credit-Rat-ing-FAQs.aspx
Responsible-investor.com. 2014. Clean Thematic Investing
Roth Capital Partners, 2016
Sharpe. W.F. 2010. Adaptive Asset Allocation Policies. Financial Analysts Journal. CFA Institute
Shrimali, G. and D. Reicher. 2017. Instruments to Mit-igate Financial Risk in Indian Renewable Energy Investments. Standford – Precourt Institute for Energy.
Singleton, J. Clay 2005. Core-Satellite Portfolio Man-agement. New-York: McGraw-Hill.
The Lab – India Innovation Lab for Green Finance. 2016a. FX Hedging Facility Lab Instrument Analy-sis
The Lab – India Innovation Lab for Green Finance. 2016b. Rooftop Solar Private Sector Financing Facility
World Bank. 2004. Global Development Finance – harnessing Cyclical Gains for Development
World Bank. 2017. Matching institutional investors and infrastructure investments. http://blogs.worldbank.org/ppps/matching-institutional-inves-tors-and-infrastructure-investments
World Bank. 2017a. Doing Business http://www.doing-business.org/rankings

28A CPI Report
Getting to India’s Renewable Energy Targets: A Business Case for Institutional InvestmentMarch 2018
World Economic Forum. 2014. Direct Investing by Insti-tutional Investors: Implications for Investors and Policy-Makers. http://www3.weforum.org/docs/WEFUSA_DirectInvestingInstitutionalInvestors.pdf
World Economic Forum. 2017. The Global Competitive-ness Report 2017-2018. http://reports.weforum.org/global-competitiveness-index-2017-2018/
https://www.unenvironment.org/news-and-stories/press-release/insurance-supervisors-devel-op-best-practices-address-climate-risk

29A CPI Report
March 2018 Getting to India’s Renewable Energy Targets: A Business Case for Institutional Investment
Appendix A: National renewable energy targets by countries
Source: Global Trends in Renewable Energy Investment 2017 Report, REN21 Renewables Global Status Report (GSR) 2017 , World Bank and country specific government reports.
COUNTRY NEW RE INVT. 2016 (USD BN) NATIONAL TARGETS FOR RE SHARE OF ELECTRICITY
GENERATED FROM RE
NATIONAL TARGET FOR SHARE OF ELECTRICITY GENERATED FROM RE
China 78.3Solar - > 110GW Wind - >210GW by 2020
5% No national targets
US 46.4No national target 30% renewables electricity use by 2025
8.4% No national targets
UK 24.0 Wind offshore - 38GW by 2030 23% No national targets
Japan 14.4 - 7.9% 22-24% by 2030
Germany 13.2Wind onshore - 2.5GW ann. Wind offshore - 6.5 GW by 2020 Solar PV - 2.5GW ann.
31% 40–45% by 2025
India 9.7Solar -100 GWWind – 60 GWBiomass – 10GW by 2022
6.6% 40% by 2030
Brazil 6.8Wind - 24GW by 2024 Bio power
12% 23% by 2030
South Africa 4.5* RE - 17.8 GW by 2030 - 9% by 2030
Mexico 4.0* 20 GW by 2030 8.9% 35% by 2024
Canada 1.7 No national targets 7.3% No national targets
France 2.6Solar - 8GW by 2020 Wind - 25 GW by 2030
19% 40% by 2030

30A CPI Report
Getting to India’s Renewable Energy Targets: A Business Case for Institutional InvestmentMarch 2018
Appendix B: Capital Asset Pricing Model
20 http://pages.stern.nyu.edu/~adamodar/
We obtained the cost of equity for countries by using the modified capital asset pricing model (CAPM) and adjusted the inflation and the country risk premium for each country (Damodaran, 2008). The comparable (to power producers in selected countries) global indepen-dent power produce (IPP) beta coefficient of 1.25 (Roth Capital Partners, 2016) is adjusted by country specific debt to equity ratio in the renewable energy sector to obtain unlevered beta. Subsequently, we can use this unlevered beta to obtain the required asset return/cost of asset by using the aforementioned CAPM model (Clayman et al, 2016). This asset return can then be compared to the expected asset return (internal rate of return of renewable energy projects) by the inves-tors. Since the expected rate of return it is not directly available, we can obtain it through primary interviews of investors and research reports.
To calculate the cost of equity, we have used a modified capital asset pricing model (CAPM) by adjusting the country risk and inflation differential. The equation can be written as:
Re = Rf + Be * ((Rm - R f) + Cf) + π • Re is the levered cost of equity capital
• Rf is the risk free rate of return
• Be is the beta coefficient measuring the volatility of stock’s return relative to the market’s return.
• Rm is the expected return on the market portfolio
• (Rm - Rf) is the mature market risk premium
• Cf is the country risk premium
• π is the inflation differential
Data Sources: The risk free rate of return (Rf) is the U.S. 10-year bond yield. The beta coefficient (Be) is the com-parable global independent power produce (IPP) beta coefficient of 1.25. The expected return on the market portfolio (Rm) is the average of the S&P 500 minus the risk free rate of return for 2011-2016. This reflects the matured market risk premium of the U.S. market. To this market risk premium, based on the sovereign rating of each country (Moody’s credit ratings). We have added the default rate as reported by the Damodaran - Stern School of Business20 estimates of country risk premium as it modifies this premium to reflect the additional risk of the equity market. It adjusts the premium by multiplying the country respective default spread by the equity market volatility for that particular market. By comparing an emerging market equity index to an emerging market government bond index which stands at 1.23, we were able to value this estimated market volatility. We obtained the inflation differential by taking the difference between the OECD inflation forecast for the countries and the US inflation’s forecast.

31A CPI Report
March 2018 Getting to India’s Renewable Energy Targets: A Business Case for Institutional Investment
Appendix C: Cash flow variability of coal, wind, and solar plant models
21 Coal prices were taken as annual averages of Coal, Australian thermal coal (12,000- btu/pound, less than 1% sulfur, 14% ash, FOB Newcastle/Port Kembla, US$ per metric ton)
22 For wind speed, we have used capacity utilization data from a wind power developer. These capacity utilization factor corroborates well with other secondary sources on national averages (CSTEP, 2016).
23 Solar radiation were annual average for Direct Normal Irradiance data obtained from Solar Energy Centre, Ministry of New and Renewable Energy. 24 The exception is projects that have integrated battery systems (where needs change every 5-8 years depending on usage). Even so, declining battery prices in
recent times should further help the economics of battery integrated renewable energy projects.
We conducted simulations on coal, wind, and solar power plant models by varying one key input in each - coal prices,21 wind speed,22 and solar radiation,23 respec-tively and observing corresponding cash flows variation in a single year. The coal plant exhibited the largest cash flow variability of +-40% as compared to wind (+-20%) and solar (+-10%) when varying the inputs.
Each dot in the figure below represents an observation for cash flow variation in plants for different input prices in a single year. Although variability of cash flows vary from project to project, individual renewable energy projects still have greater predictability in cash flow generation compared with individual fossil fuel based power projects due to their inherent characteristics, particularly low operating costs compared to high oper-ating costs of fossil fuel based power plants.
The cash flow predictability for renewable energy stems for two aspects.
1. Revenue: Predictability on the revenue side stems from three factors: production /generation, demand, and price. Together, lower volatility of solar radiation and wind flows, zero input cost, proven technology and performance guarantees from equipment manufacturers make renewable energy production relatively predictable. In addition, insurance companies are available to manage resource risk, which can reduce energy generation risk even further. The long-term legal
power purchase agreement (PPA) eliminates risk associated with demand and ensures fixed tariffs or increasing tariffs over the PPA period. A PPA term generally varies between 15-25 years in line with the expected lifetime of solar PV modules and wind turbine. Consequently, the predictable energy generation along with contractual supply and price make revenue generation highly predictable.
2. Cost: For the most part, renewable energy projects do not have recurring capital expenditures.24 This means that overall, renewable energy has very low operational and maintenance expenses. For example, for ground mounted solar or rooftop solar, depending on the size and tariff structure of the projects, operational and maintenance costs range between 5%-20% revenue. An exception to recurring capital requirements are projects that have integrated battery systems, wherein the battery needs to be changed every 5-8 years depending on its usage. However, declining battery prices recently should certainly help the economics of battery integrated renewable energy projects in coming years. Operation and maintenance expenses for renewable energy are also reasonably predictable given that they are generally labor costs, with minimal input costs. Any unpredictability can be further reduced by entering into a long-term operation and maintenance contract with an appropriate service provider.

32A CPI Report
Getting to India’s Renewable Energy Targets: A Business Case for Institutional InvestmentMarch 2018
Appendix D: Infrastructure comparison We conducted analysis of different sub-sectors of the infrastructure sector, using several parameters affecting cash flow predictability of the sub-sectors. This analysis is a combination of qualitative and quantitative analysis including reasonable assumptions when numbers were not readily available. It is important to note that the
degree of impact of each factor on cash flows would differ across infrastructure categories due to differences in cost structures. For instance, change in fuel cost would have minimal effect on road sector as compared to railways or fossil fuel based electricity generation. Source: CPI Analysis
ROAD TRANSPORTATION RAIL TRANSPORTATION AIR TRANSPORTATION ELECTRICITY
(FOSSIL FUEL)
VOLUME RISK
Low: Flow of traffic doesn’t vary significantly. Patronage risk may exist.
Low: Since 2007, passenger volume growth has varied between -2% to +7% and the freight traffic growth varied between 0.5% to 8%.
Medium: Since 2007, passenger volumes has varied between -11% to +23%. This volume depends on the attractiveness of destination (leisure trips) and economic sentiment of the passen-gers (business trips). However, air transportation has a natural monopoly as barrier to entry is high
Low: Predictable due to long term PPAs. However, additional capacity creation in the recent years without a PPA is putting pressure on the revenue created due to its low demand and decrease in price
USER CHARGES/
OTHER REVENUE
Medium: Setting of user charges is influenced by popu-list demands.
High: Setting of user charges is influenced by populist demands. High margin pricing of the AC segment is shifting this segment’s customers to airlines.
Low: Decided by a government authority (AERA), but not political as customers are from the high income group.
Medium: Predictable due to long term PPAs. But, excess capacity (more than contractual sales volume) makes merchant price low (sales of excess power generation than PPA)
OPERATING COST
(EXCLUDING FUEL)
Medium: Operating cost accounts for15-21% of revenue
High: 30-33% of revenue (staff wages) and 22% on pension expenses. Considered high and unmanageable, not under the control of railways and keeps increasing with each Pay Commission revision.
High: 40-50% of revenue – spent on utilities and communication, staff, and maintenance
Medium: 8-15% of revenue
FUEL COST Low
High: Varies between 17-23% of revenue depending on fuel prices and cost of electricity.
Low:Less than 10% of revenue
High: 35%-45% of revenue. Can be very risky in the absence of a long term fuel supply agreement.
WORKING CAPITAL
Low: Revenue is collected at the point of sales
Low: Revenue collected before recognition of sales
Low: Airlines pay the flight or freight landing and parking fees to the airport quickly. Non-aeronautic revenues such as retail sales, parking, rental income, etc. are collected at the point of sales or in a month
High: Delay in payment from DISCOMs
OVERALL Medium High Medium High
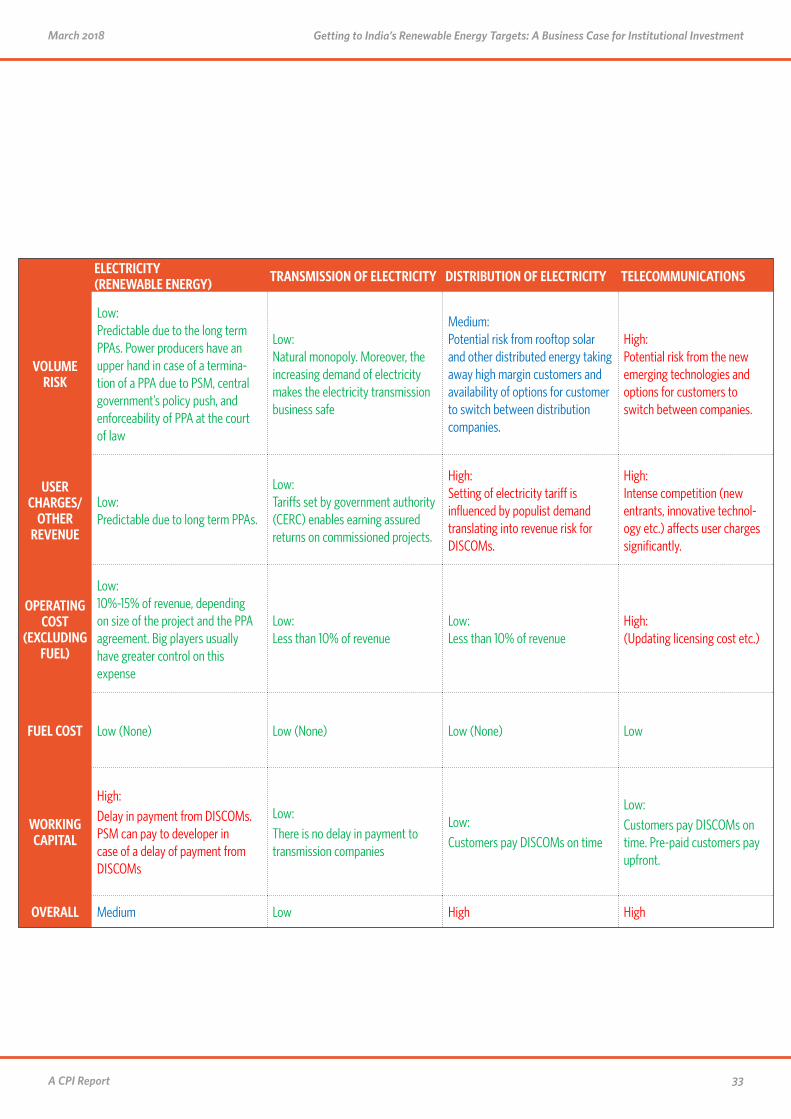
33A CPI Report
March 2018 Getting to India’s Renewable Energy Targets: A Business Case for Institutional Investment
ELECTRICITY (RENEWABLE ENERGY) TRANSMISSION OF ELECTRICITY DISTRIBUTION OF ELECTRICITY TELECOMMUNICATIONS
VOLUME RISK
Low: Predictable due to the long term PPAs. Power producers have an upper hand in case of a termina-tion of a PPA due to PSM, central government’s policy push, and enforceability of PPA at the court of law
Low: Natural monopoly. Moreover, the increasing demand of electricity makes the electricity transmission business safe
Medium: Potential risk from rooftop solar and other distributed energy taking away high margin customers and availability of options for customer to switch between distribution companies.
High: Potential risk from the new emerging technologies and options for customers to switch between companies.
USER CHARGES/
OTHER REVENUE
Low: Predictable due to long term PPAs.
Low: Tariffs set by government authority (CERC) enables earning assured returns on commissioned projects.
High: Setting of electricity tariff is influenced by populist demand translating into revenue risk for DISCOMs.
High: Intense competition (new entrants, innovative technol-ogy etc.) affects user charges significantly.
OPERATING COST
(EXCLUDING FUEL)
Low: 10%-15% of revenue, depending on size of the project and the PPA agreement. Big players usually have greater control on this expense
Low: Less than 10% of revenue
Low: Less than 10% of revenue
High: (Updating licensing cost etc.)
FUEL COST Low (None) Low (None) Low (None) Low
WORKING CAPITAL
High:Delay in payment from DISCOMs. PSM can pay to developer in case of a delay of payment from DISCOMs
Low:There is no delay in payment to transmission companies
Low:Customers pay DISCOMs on time
Low:Customers pay DISCOMs on time. Pre-paid customers pay upfront.
OVERALL Medium Low High High
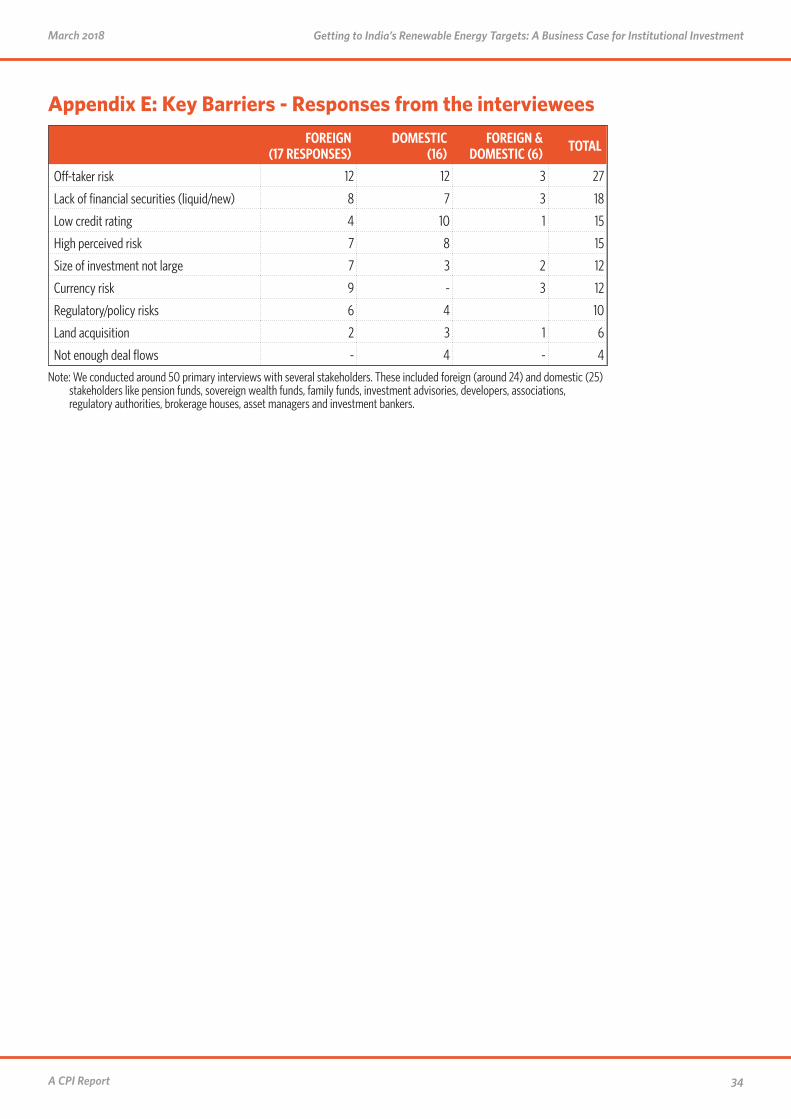
34A CPI Report
Getting to India’s Renewable Energy Targets: A Business Case for Institutional InvestmentMarch 2018
Appendix E: Key Barriers - Responses from the interviewees
FOREIGN (17 RESPONSES)
DOMESTIC (16)
FOREIGN & DOMESTIC (6) TOTAL
Off-taker risk 12 12 3 27
Lack of financial securities (liquid/new) 8 7 3 18
Low credit rating 4 10 1 15
High perceived risk 7 8 15
Size of investment not large 7 3 2 12
Currency risk 9 - 3 12
Regulatory/policy risks 6 4 10
Land acquisition 2 3 1 6
Not enough deal flows - 4 - 4
Note: We conducted around 50 primary interviews with several stakeholders. These included foreign (around 24) and domestic (25) stakeholders like pension funds, sovereign wealth funds, family funds, investment advisories, developers, associations, regulatory authorities, brokerage houses, asset managers and investment bankers.

35A CPI Report
March 2018 Getting to India’s Renewable Energy Targets: A Business Case for Institutional Investment
Appendix F: Core –Satellite Investment Strategy
25 Annual reports of LIC
The pension funds can consider a Core-Satellite invest-ment approach, which offers flexibility in structuring portfolios to meet long-term goals. The principle of Core-Satellite investment approach is that the major portion of the capital is allocated to a cost efficient passive portfolio (core portfolio) (Amenc, 2004). The core portfolio is attuned to the investors’ long-term strategic aims, and assets which reflect the appetite for risks (Amenc et al, 2010). The portfolio should be well diversified across different asset classes, positioned to ensure that risks and returns are optimally balanced in line with investment goals. By means of diversification across asset classes, regions, sectors and credit risks, the investors can reduce the overall probability of a neg-ative performance. The core portfolio closely follows the investor benchmarks and should generate the expected (average) return (Maginn et al, 2016). Pension funds can invest a major portion of the assets in core portfolio.
While a minor portion of the capital can be allocated to a specific asset class based on certain investment themes known as satellite portfolio. The satellite portfolio would generate an above-average return and
/or reduce the overall portfolio risk by diversification (Singleton). This investment in the satellite portfolio, would offer tremendous potential of growth, but with higher risk compared to the core portfolio. Satellite portfolio would be considered as a capital appreciating asset in the long run. Thematic investment strategy is a well calculated bet on high probability of occurrence of future events (See Section 4.4.2).
Climate mitigating sector which includes renewable energy equity investment can be an asset class in sat-ellite portfolio given its growth potential. For instance, Life Insurance Corporation (LIC) invests a small portion in the power sector (7.5% of the total)25, it can still adopt the core /satellite investment approach as the renew-able energy sector is a part of the power sector. The renewable energy sector will be a natural hedge against fossil generated power utilities (See section 2.2). Also, theme based investments has thematic risk factors (McKinsey, 2014), with the renewable energy utility sector investment as an exception since it behaves like a traditional utility with low volatility of return (See section 2.2) but with tremendous potential for growth.