Embed Size (px)
Citation preview

Getting the Most from Your DNA Analysis from Purification to Downstream Analysis Eric B. Vincent, Ph.D. February 2013
1

Presentation Outline
Genomic Analysis
• Purification
• Quantitation
• Qualification
• Analysis Methods
• Key considerations at each step
• Ways to overcome major challenges
2
Deoxyribonucleic Acid

DNA Analysis Each Step Affects the Quality of the Final Data
3
Purify Quantify
PCR Amplify
qPCR
Whole Genome Sequencing
Microarray
Cloning

Downstream Assays Different Tools Based on Experimental Needs
PCR qPCR Sequencing Arrays
Cloning SNP Genotyping SNP detection SNP Detection
Sanger Sequencing: • Confirmation
• Identification
• Targeted
regions/application
Methylation Analysis Mutation Discovery Comparative Genomic Hybridization
STR Analysis (ID) Mutation detection De Novo Genome Sequencing
Loss of Heterozygosity
Methylation Analysis Pathogen identification
Microbiome Research Pathogen Identification
Genotype Confirmation (KOs)
Chromatin Immoprecipitation
Chromatin Immoprecipitation
Methylation Analysis
4

Downstream Applications Importance of Input DNA Characteristics
5
PCR qPCR Sequencing Arrays
Quantity of DNA + + ++ +++
Integrity of DNA
+/- Depending on amplicon
- Typically small amplicons
+++ More important with longer read technologies, but many providers assume large fragments
++ Typically small fragments, but providers expect minimum fragment sizes
Lack of Inhibitors ++ ++ +++ ++
Accurate Quantitation ++ +++ +++ +++
Purification - Setting the Stage for Downstream Success
6

DNA Purification Technologies All Provide Advantages Depending on Specific Needs
Manual Small
automated 96 well manual
Automated
7
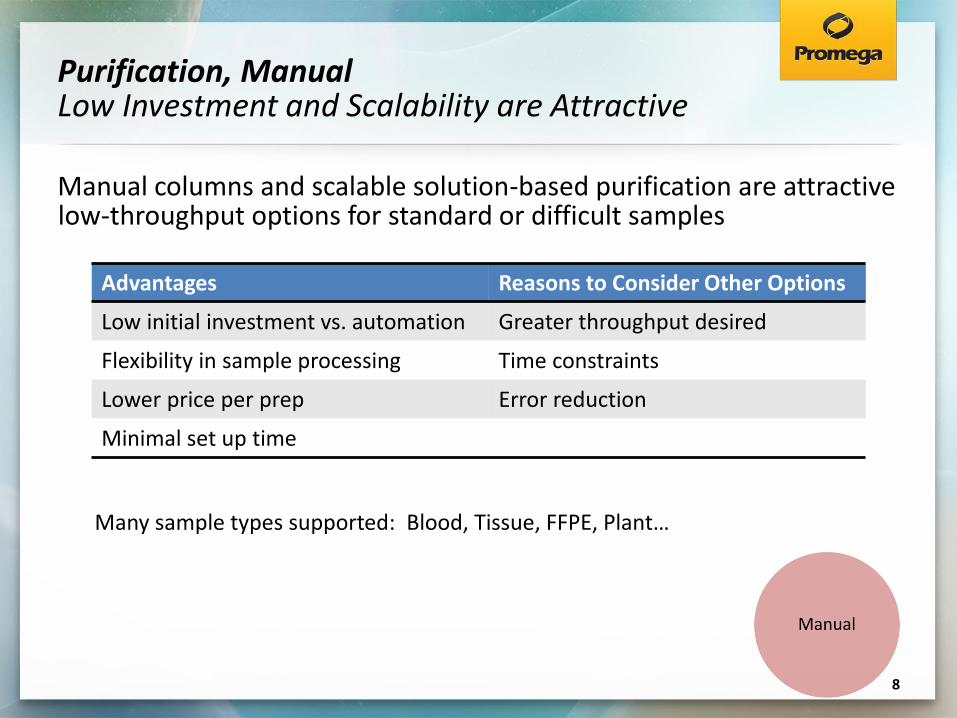
Purification, Manual Low Investment and Scalability are Attractive
Manual columns and scalable solution-based purification are attractive low-throughput options for standard or difficult samples
8
Advantages Reasons to Consider Other Options
Low initial investment vs. automation Greater throughput desired
Flexibility in sample processing Time constraints
Lower price per prep Error reduction
Minimal set up time
Many sample types supported: Blood, Tissue, FFPE, Plant…

DNA Purification, Small Scale Automation Small Automated Systems Offer Major Benefits
Small, dedicated purification instruments allow individuals to automate purification and increase productivity
9
Advantages Reasons to Consider Other Options
Minimal initial investment Not enough throughput to justify
Frees time for other activities Even greater throughput desired
Fewer purification errors Input sample volume incompatibility
Increases sample throughput
Maxwell® 16: 5 minute setup – 30-45 minutes to extract 1-16 samples
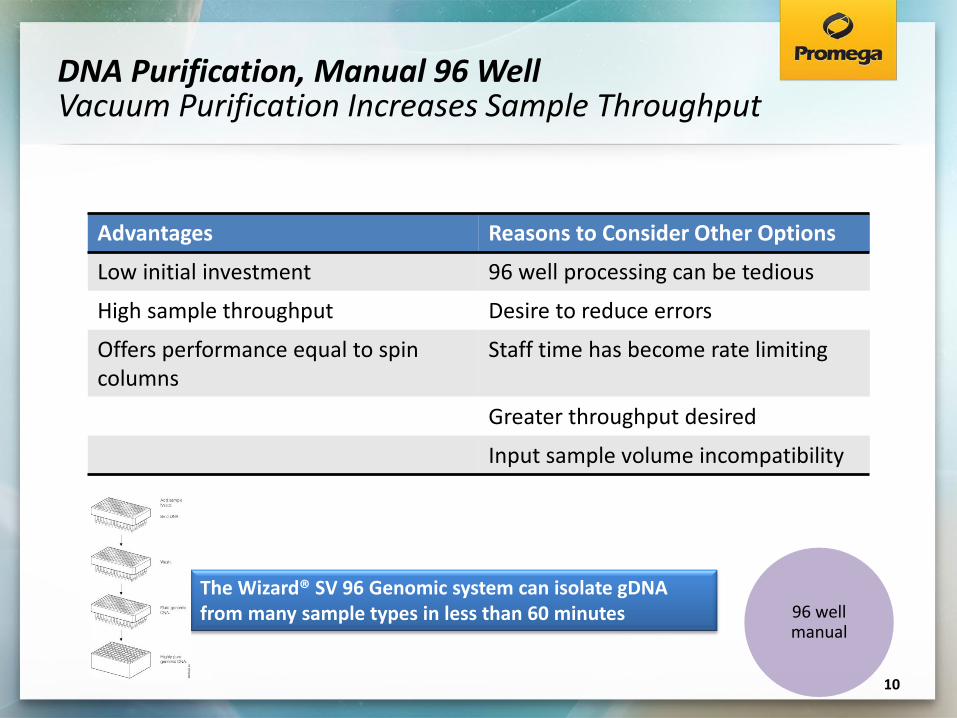
DNA Purification, Manual 96 Well Vacuum Purification Increases Sample Throughput
10
Advantages Reasons to Consider Other Options
Low initial investment 96 well processing can be tedious
High sample throughput Desire to reduce errors
Offers performance equal to spin columns
Staff time has become rate limiting
Greater throughput desired
Input sample volume incompatibility
96 well manual
The Wizard® SV 96 Genomic system can isolate gDNA from many sample types in less than 60 minutes

DNA Purification, Automated 96 Well Increases Laboratory Throughput and Lowers Costs
11
Advantages Reasons to Consider Other Options
Increases laboratory productivity High initial cost
Aids in sample tracking Not enough throughput to justify
Increases consistency of results
Can automate many activities
Automated

Automated Purification Reduces Errors by Removing Repetitive Manual Processes
12
Array male/female
samples Extract gDNA
Amplify male target
• Process small samples in 96 well plates rapidly – including sample transfer!
No Cross-contamination is Observed
Consistent Purification Regardless of Input Sample Volume
No male DNA detected in
female samples
The ReliaPrep™ SV 96 HT gDNA Isolation System can process 96 samples with no operator intervention

DNA Purification Yield, Integrity & Purity are Critical to Success
Key Challenges
• Purifying sufficient DNA from:
• Small samples
• Difficult samples
• Degraded samples
• DNA integrity
• Isolating pure DNA
• No enzyme inhibitors to affect downstream applications
13

DNA Purification Extraction of Quality DNA from FFPE Samples
14
Genomic DNA purified from a single 10µm mouse brain section using either the ReliaPrep™ FFPE gDNA Miniprep System or competitor kit
ReliaPrep™ FFPE Miniprep System Helps Preserve the Integrity of Your FFPE DNA
10µl purified gDNA used as template in multiplex PCR (GoTaq® Hot Start). Fragments ranging from 100-400bp detected.
More Sensitive qPCR Assays Amplification of Large Targets
Maxwell® 16: The same level of performance is available in an easy-to-use format

Quantitation - A Simple but Critical Step in DNA Analysis
15

DNA Quantitation and Quality Determination Important but Often Underappreciated
16
UV Absorbance
• Spectrophotometer
• NanoDrop®/NanoVue™
Fluorescent Dye-based Quantitation
• Plate Reader
• Hand-held Instruments
Gel Electrophoresis
• Agarose
• Pulse Field Agarose Electrophoresis
Agilent 2100 Bioanalyzer
What information does each method give us……
What information does each method not give us……
What are the advantages and disadvantages of each method…..

UV Absorbance Spectroscopy Rapid Assessment of Concentration and Purity
17
NanoVue™ (GE Healthcare)
Spectrophotometers (various manufacturers)
NanoDrop® (Thermo Scientific)
Measure nucleic acid: Concentration Purity
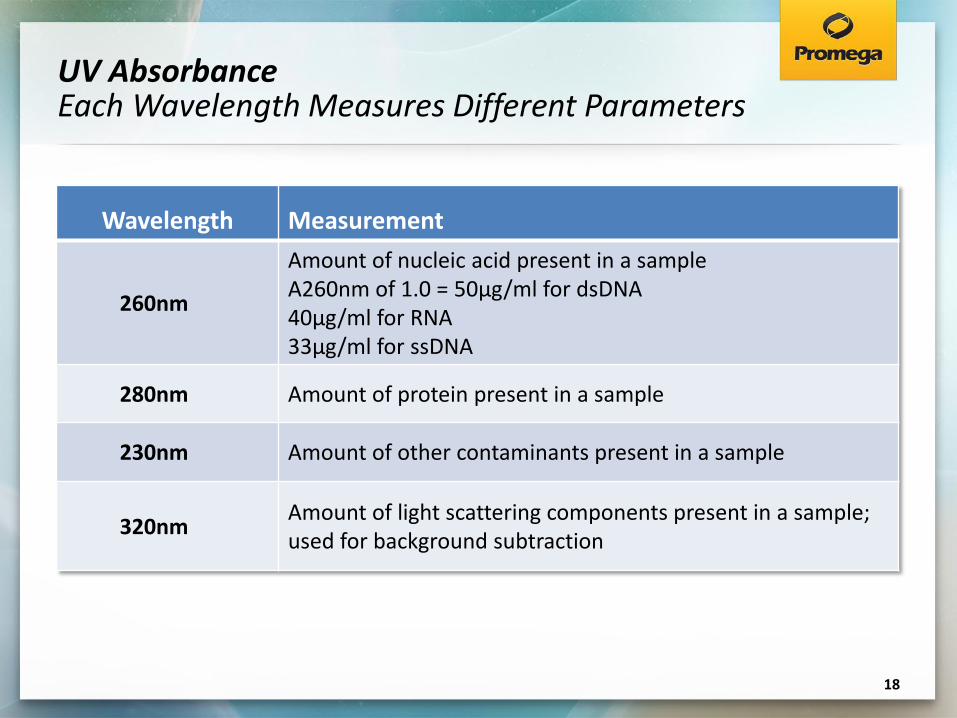
UV Absorbance Each Wavelength Measures Different Parameters
Wavelength Measurement
260nm
Amount of nucleic acid present in a sample A260nm of 1.0 = 50μg/ml for dsDNA 40μg/ml for RNA 33μg/ml for ssDNA
280nm Amount of protein present in a sample
230nm Amount of other contaminants present in a sample
320nm Amount of light scattering components present in a sample; used for background subtraction
18
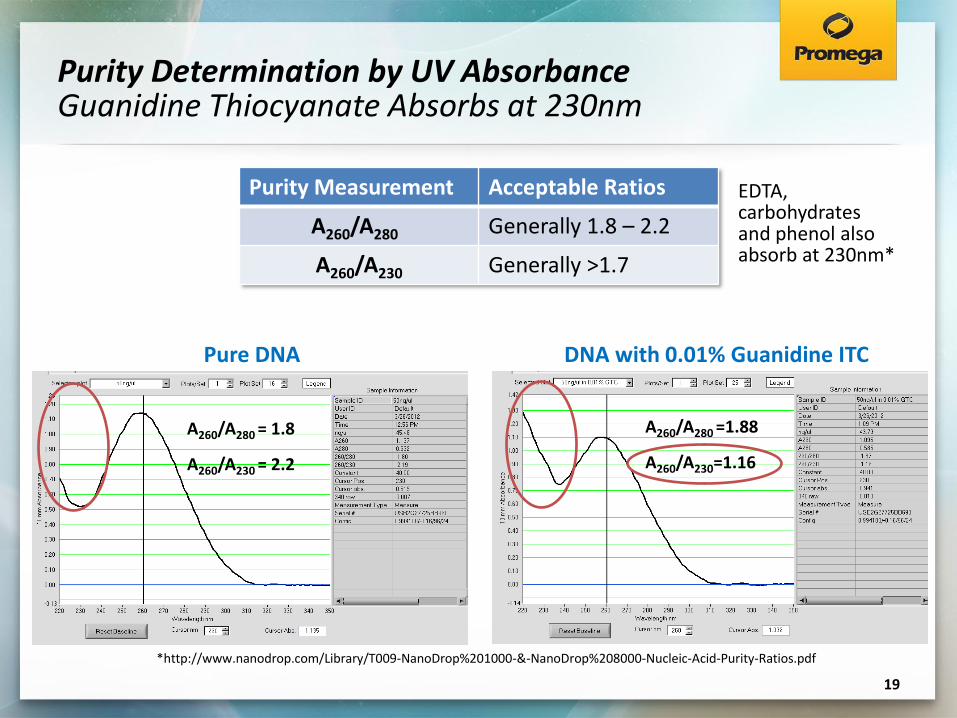
Purity Determination by UV Absorbance Guanidine Thiocyanate Absorbs at 230nm
Purity Measurement Acceptable Ratios
A260/A280 Generally 1.8 – 2.2
A260/A230 Generally >1.7
19
Pure DNA DNA with 0.01% Guanidine ITC
A260/A280 = 1.8
A260/A230 = 2.2
A260/A280 =1.88
A260/A230=1.16
EDTA, carbohydrates and phenol also absorb at 230nm*
*http://www.nanodrop.com/Library/T009-NanoDrop%201000-&-NanoDrop%208000-Nucleic-Acid-Purity-Ratios.pdf

UV Absorbance - NanoDrop® Measures Small Volumes with Good Sensitivity
Features:
Measures the absorbance of small volume samples
0.5 – 2μl of sample required
190nm – 840nm wavelength range
Wide detection range
• 2ng/μl minimum (DNA)
• 15,000ng/μl maximum (DNA)
Measurements in less than 30 seconds
No other reagents or accessories required
20

UV Absorbance – NanoDrop® An Easy to Use, Popular System
Choose Read Type: DNA
21
Read: • Water • Blank • Sample
Output: • Spectra • Table
- Yields - Purity ratios - ABS readings

UV Absorbance – Disadvantages Detects all Nucleic Acid with no specificity
• Lack of Specificity
• Cannot distinguish between dsDNA, RNA or ssDNA
• RNA contamination cannot be determined
• Overestimation of DNA concentration due to contaminants
• Many contaminants absorb at 260nm
• No information on integrity
• Nucleotides and small DNA fragments still contribute to the 260nm reading
22

Fluorescent Dye Quantification The Most Sensitive Approach
23
• Dye binds dsDNA – the resulting conformation shift produces in fluorescence when excited
• Fluorescence is directly proportional to the amount of dsDNA in the sample
• Higher signal = more DNA present
• Unbound dye does not fluoresce
• Low background increases sensitivity
Incubate at room temp for 5 minutes
504nm Excitation
Emits @ 531nm
504nm
X Unbound dye
Easy Protocol: Add, Mix, Measure

Fluorescent Dye Assay Formats Assay in Tubes or Plates to Match Your Workflow
24
1. Dilute Dye to make working solution (1:200)
2. Prepare standards and unknown samples
3. Add dye to samples and standards – incubate
4. Measure fluorescence
1:200 dilution
1xTE
1:200 dilution
1xTE
The QuantiFluor™ dsDNA System can be used in single tube as well as 96 well plate formats

Fluorescent Dye-based Quantification Wide Dynamic Range
25
Low Concentration Standard Curve High Concentration Standard Curve
Quantitate from 50pg/ml to 1µg/ml with QuantiFluor™ dsDNA System
The QuantiFluor™ dsDNA System Provides sensitive quantitation of dsDNA
Fluorescent Dye Quantitation – Disadvantages No Information on Purity or Integrity
Must create high or low concentration standards
Does not detect ssDNA; which can be problematic for some assays
No information on purity
• Separate dye-based quantification systems are available for RNA and protein
No information on integrity
Fluorescent dyes are potentially hazardous
26

Gel Electrophoresis Most Common Analysis Method
• Agarose and sometimes acrylamide gel electrophoresis
• Nucleic acid fragments separated by size
• Fragments are visualized by staining with a fluorescent dye that binds DNA, commonly excited by a UV light
- Ethidium Bromide, SYBR® Green, SYBR® Gold and Diamond™ Nucleic Acid Dyes
• Amount of DNA can be estimated
- Estimate relative intensity of fluorescence compared to a standard(s)
- Gel densitometry
27

Gel Electrophoresis Assess Integrity and RNA/oligo Contamination
28
Qualitative Analysis
• DNA integrity (minimal smearing)
• Intact gDNA may be:
• Viewed as a slow migrating band in standard agarose gels
• Separated on pulsed field gel apparatus designed to separate very large DNA molecules
• RNA contamination can sometimes be observed
Hela 293 Hela 293
Marker
1 x 1
04
1 x 1
05
1 x 1
06
5 x 1
06
1 x 1
04
1 x 1
05
1 x 1
06
5 x 1
06
Marker
1 x 1
04
1 x 1
05
1 x 1
06
5 x 1
06
1 x 1
04
1 x 1
05
1 x 1
06
5 x 1
06
- RNase + RNase

DNA Purification Methods Affect Final gDNA Size Assessed by Gel Electrophoresis
29
Similar gDNA Size Estimation Using a 0.8% Agarose Gel
23.1kb 9.4kb 6.6kb 4.4kb
2.3kb 2.0kb
Silica Column Method
ReliaPrep™ gDNA
Purification Precipitation
Method

DNA Purification Methods Affect Final gDNA Size Assessed by Gel Electrophoresis
30
23.1kb 9.4kb 6.6kb 4.4kb
2.3kb 2.0kb
0.8% Agarose Gel
23.1kb 9.4kb 6.6kb 4.4kb
2.3kb 2.0kb
Silica Column Method
ReliaPrep™ gDNA
Purification Precipitation
Method 350kb 300kb 250kb 200kb 150kb 100kb 50kb
CHEF Gel Reveals Greater Size Range
Expands to

Gel Electrophoresis Drawbacks and Alternatives to Ethidium Bromide
• Low cost, but requires significant amount of handling and time
• Typically requires a few nanograms of DNA
• Minimum detectable mass varies by stain
• SYBR® Green II, SYBR® Gold and Diamond™ dyes are more sensitive then ethidium bromide
• SYBR® Green II, SYBR® Gold, and Diamond™ dyes can be viewed as safer alternatives to ethidium bromide, a known carcinogen
31

Agilent 2100 Bioanalyzer Microfluidics to Analyze 1μl of Sample
• Uses microfluidics to analyze DNA, RNA, protein, and cells using sample specific chips
• Samples are combined with a fluorescent dye and added into wells in the chip
• Size separated by electrophoresis
32
• The samples are detected by fluorescence, and electropherograms & gel-like images are provided for sizing and quantification
• 1μl of sample is required
• 11-12 samples are run per chip
• Analysis is complete in 30-40 minutes

Agilent 2100 Bioanalyzer DNA Analysis High Sensitivity Fragment Analysis
DNA Analysis Kits
• High Sensitivity DNA Kit - dsDNA fragments from 50 - 7000bp (5-500 pg/µl)
• DNA 12000 - dsDNA fragments from 100 to 12000bp (0.5-50 ng/µl)
• DNA 7500 Kit - dsDNA fragments from 100 to 7500bp (0.5-50 ng/µl)
• DNA 1000 Kit - dsDNA fragments from 25 to 1000bp (0.5-50 ng/µl)
Information provided:
• Sizes of DNA fragments
• Concentration of each fragment
• Gel-like image
33
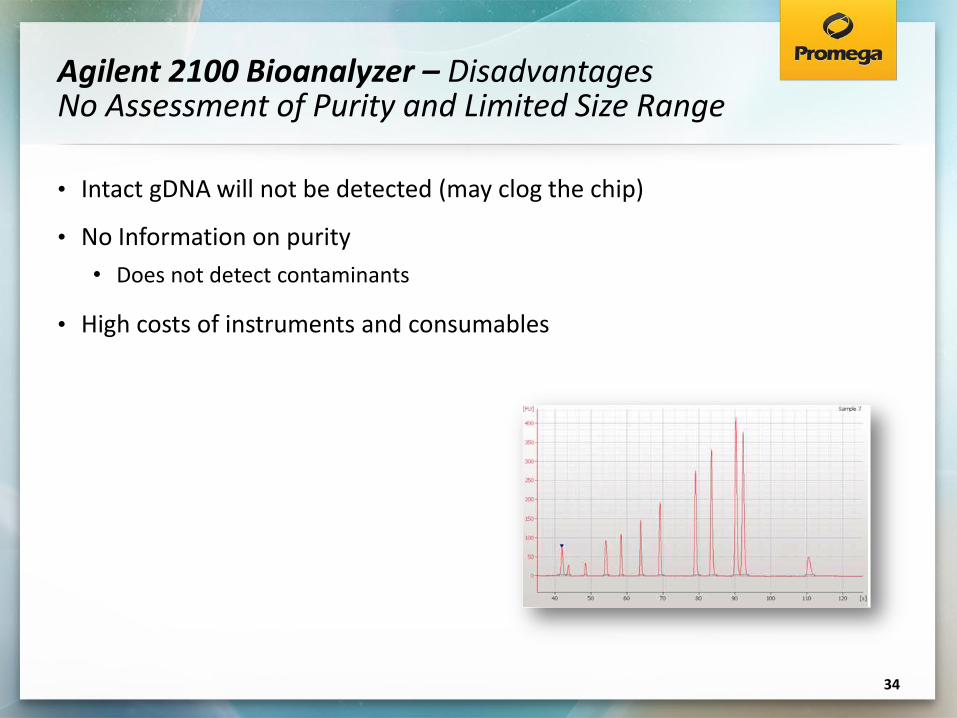
Agilent 2100 Bioanalyzer – Disadvantages No Assessment of Purity and Limited Size Range
• Intact gDNA will not be detected (may clog the chip)
• No Information on purity
• Does not detect contaminants
• High costs of instruments and consumables
34

Summary: Each Method Provides Different Information
Data UV Spec Fluorescent
Dye Agilent
Bioanalyzer Gel
Electrophoresis
Concentration Y Y Qualitative
Integrity N N Y - but only
smaller sizes
Y - but most resolution
requires special apparatus
Specificity N Y N but can view N but can view
Presence of Inhibitors
Y N N N
Cost
Instrument can be $$$
but no reagent cost
Instrument and reagent
Most expensive Low cost
35

DNA Analysis Methods Choose a Method that Best Matches Your Needs
36

DNA Analysis Methods Multiple Options Available
Key questions to ask yourself:
• How many targets do I want to measure?
• Am I interested in whole genome analysis?
• Am I interested in identifying new mutations?
• Do I want information on target size, integrity?
• Do I want highly quantitative data or is qualitative assessment OK?
37
PCR Amplify
qPCR
Whole Genome Sequencing
Microarray
Cloning

Southern Blot Provides Information on Fragment Size & Copy Number
38
DNA sample
Fragment with restriction enzyme(s)
Transfer to membrane
Hybridize with Probe Wash Detect Signal
Electro-phoresis
Advantages: • Provides fragment size and can provide copy number • May help identifying possible pseudogenes
Disadvantages: • Requires a lot of sample • Time consuming • Throughput
Target DNA (size abundance)
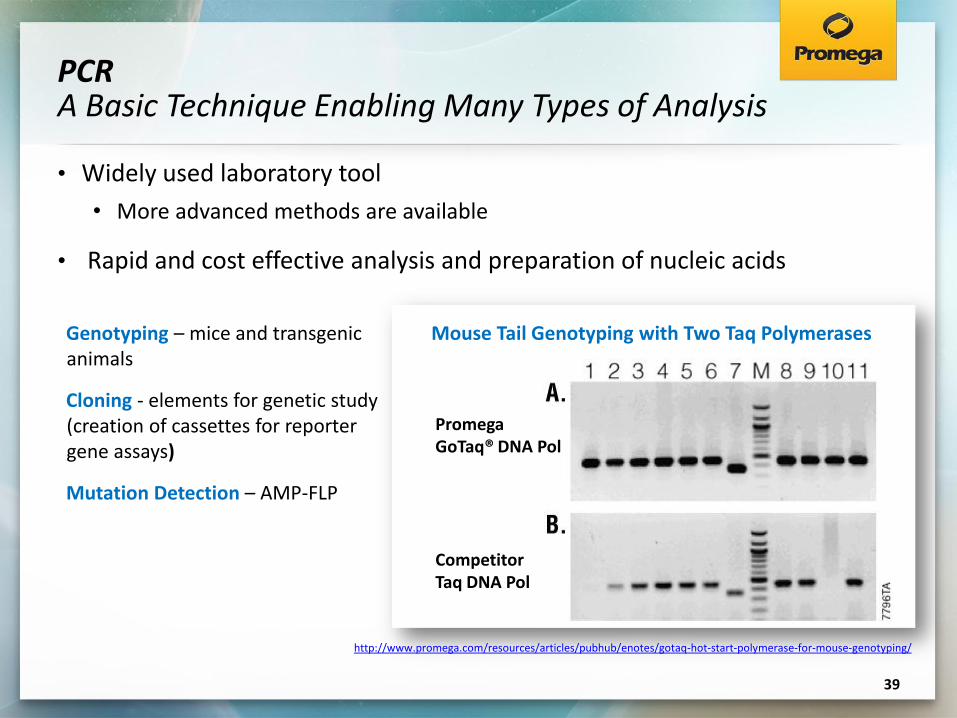
PCR A Basic Technique Enabling Many Types of Analysis
39
Genotyping – mice and transgenic animals
Cloning - elements for genetic study (creation of cassettes for reporter gene assays)
Mutation Detection – AMP-FLP
Mouse Tail Genotyping with Two Taq Polymerases
Promega GoTaq® DNA Pol
http://www.promega.com/resources/articles/pubhub/enotes/gotaq-hot-start-polymerase-for-mouse-genotyping/
Competitor Taq DNA Pol
• Widely used laboratory tool
• More advanced methods are available
• Rapid and cost effective analysis and preparation of nucleic acids

Taq is Taq, Right? Enzyme Choice & Rxn Conditions Make a Difference!
40
Standard Taq (L) vs. GoTaq®(r) DNA polymerase with different targets
GoTaq® Long PCR Master Mix
Amplifying Targets up to 30kb
Improvement by Optimizing Conditions • Annealing temperature • Mg+ concentration • PCR additives...
Improved Results with a Specialized Enzyme

PCR Rapid but Requires Gel Analysis
41
Advantages: • Rapid analysis • Inexpensive • Relatively sensitive Disadvantages: • Time consuming • Throughput • Requires gel analysis which is
labor intensive
Sensitive Amplification of a gDNA Target

End-Point vs. Real-Time PCR Low vs. Highly Quantitative Analysis
End-Point PCR is detected in the variable plateau phase.
Real-Time PCR can detect product in exponential phase allowing more precise quantitation.
Exponential
Linear
Plateau

qPCR Highly Quantitative and Sensitive Analysis
43
Robust enzyme and buffer systems in GoTaq® qPCR Systems enables sensitive detection of downstream targets
GoTaq® qPCR master mix allows sensitive detection of targets down to one copy
Titration of Input DNA
GoTaq® qPCR Mastermix can provide earlier Cq values compared to other qPCR mixes

Fluorescence Brighter Signal Produces More Sensitive Assays
44

qPCR Highly Sensitive Analysis of Limited Targets/Rxn
45
Advantages: • Sensitivity • Highly quantitative measurements • Some multiplexing is possible • Wide Dynamic range • Can be often used with degraded
samples Disadvantages: • Limited number of targets assessed per
reaction
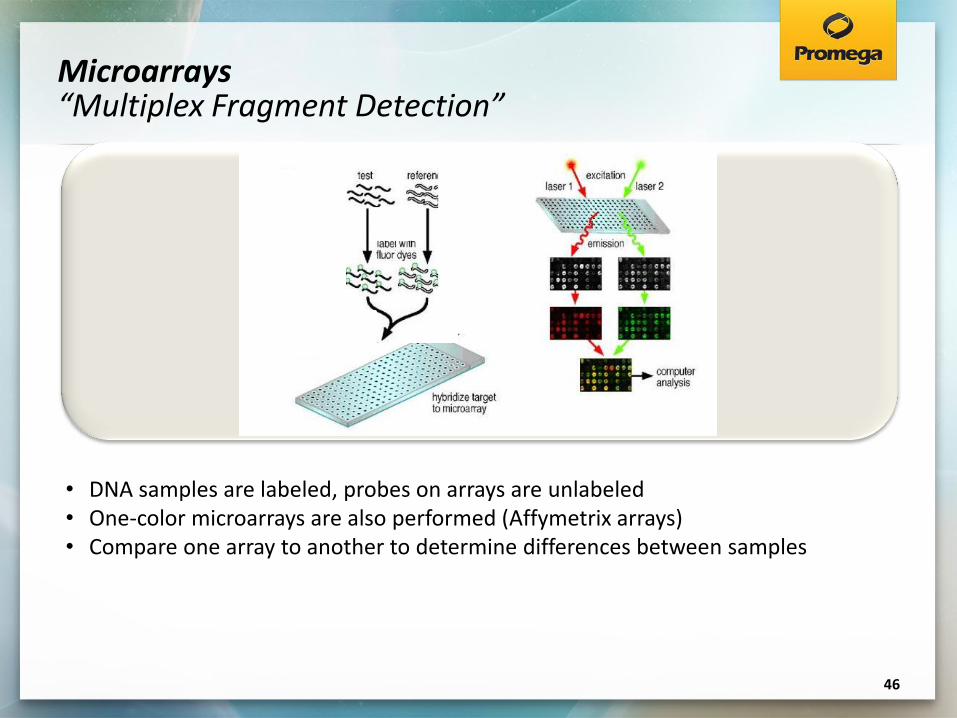
Microarrays “Multiplex Fragment Detection”
46
• DNA samples are labeled, probes on arrays are unlabeled • One-color microarrays are also performed (Affymetrix arrays) • Compare one array to another to determine differences between samples

Microarray Applications Well Suited for Structural Studies
• Comparative genomic hybridization (CGH): analysis of copy number changes
• Gene ID: can be used to rapidly ID unknown organisms
• Chromatin Immunoprecipitation: ID protein binding sites
• SNP detection: Can screen samples for millions of sites at a time
47
Sample 1 (Cy3 labeled) Sample 2 (Cy5 labeled) Overlay

Microarrays Good Genomic Coverage but Low Sample Throughput
48
Advantages: • Can provide good coverage • Can be quite flexible (if you can
make your own arrays) • Reasonable data analysis
Disadvantages: • Requires a lot of sample • CGH cannot detect changes in small
regions • Time consuming • Cost – some technologies are
expensive • Low throughput
http://upload.wikimedia.org/wikipedia/commons/thumb/1/15/ACGH_profile_of_the_IMR32_neuroblastoma_cell_line.svg/2000px-ACGH_profile_of_the_IMR32_neuroblastoma_cell_line.svg.png
aCGH Profile of the IMR32 Neuroblastoma Cell Line

Next-Gen Sequencing A New “Gold Standard”?
Many methods, many applications, many considerations
Several technologies exist and additional technologies are in development for large scale sequencing of genomes with many applications:
• SNP discovery
• Mutation discovery/detection
• Identity
• Methylation
Ultimately, sequencing data is dependent on the integrity and quality of the starting material
49

Sequencing Library Prep Considerations
Genomic DNA Purification
Fragment DNA
Repair Fragment Ends
dA Tail Fragment Ends
Adapter Ligation
Size Select / Gel Purify
PCR Enrichment
While the DNA is fragmented in the first step in preparation, protocols assume certain degrees of intactness. Inhibitors of downstream enzymes can effect the production of libraries – best to use a purification kit that provides pure, intact DNA

Whole Genome Sequencing The Most Data per Experiment but at a High Cost
51
Advantages • Provides the most information in a single experiment • Absolute quantitation of sequence changes • Absolute quantitation of previously undiscovered genes Disadvantages • Expensive • Requires extensive bioinformatic support = $$$ • Also requires large data storage capabilities

Summary
52
• ReliaPrep™ FFPE gDNA Miniprep System
• Wizard® Genomic DNA • Maxwell 16® Instrument
and Kits
• QuantiFluor™ dsDNA System
• GoTaq® qPCR Master Mixes
• GoTaq qPCR Probe qPCR Master Mixes
• pGEM T-Easy Vector
• Wizard® SV Gel and PCR Clean up System
Purify Quantify
PCR Amplify
qPCR
Whole Genome Sequencing
Microarray
Cloning • GoTaq® DNA
Polymerase • GoTaq® Hot Start
DNA Polymerase • GoTaq® Long PCR
Master Mix

Thank You