Embed Size (px)
Citation preview

General rights Copyright and moral rights for the publications made accessible in the public portal are retained by the authors and/or other copyright owners and it is a condition of accessing publications that users recognise and abide by the legal requirements associated with these rights.
• Users may download and print one copy of any publication from the public portal for the purpose of private study or research. • You may not further distribute the material or use it for any profit-making activity or commercial gain • You may freely distribute the URL identifying the publication in the public portal
If you believe that this document breaches copyright please contact us providing details, and we will remove access to the work immediately and investigate your claim.
Downloaded from orbit.dtu.dk on: Jun 23, 2018
Getting Started with WAsP 9
Mortensen, Niels Gylling; Heathfield, D.N.; Myllerup, Lisbeth; Landberg, Lars; Rathmann, Ole Steen
Publication date:2007
Document VersionPublisher's PDF, also known as Version of record
Link back to DTU Orbit
Citation (APA):Mortensen, N. G., Heathfield, D. N., Myllerup, L., Landberg, L., & Rathmann, O. (2007). Getting Started withWAsP 9. Risø National Laboratory. (Risø-I; No. 2571(EN)).
Getting Started with WAsP 9
Niels G. Mortensen, Duncan N. Heathfield, Lisbeth Myllerup, Lars Landberg and Ole Rathmann
Risø-I-2571(EN)
Risø National Laboratory Technical University of Denmark
Roskilde, Denmark September 2007
Author: Niels G. Mortensen, Duncan N. Heathfield, Lisbeth Myllerup, Lars Landberg and Ole Rathmann Title: Getting Started with WAsP 9 Department: Wind Energy
Risø-I-2571(EN) September 2007
Contract no.: n/a
Groups own reg. no.: 1130 600-1
Sponsorship: n/a
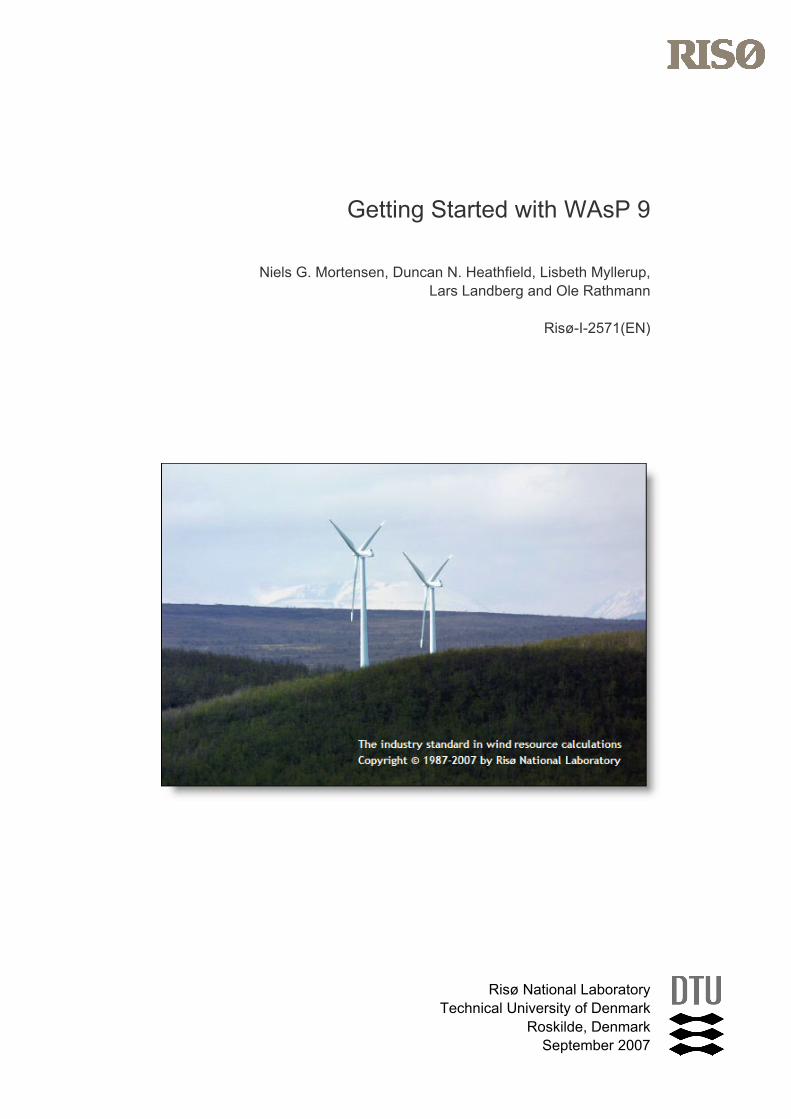
Cover: Wind turbines close to Viscaria, Kiruna, Sweden. Photo by Gunnar Britse, www.Windpowerphotos.com
Pages: 68 Tables: 0 References: 0
Abstract (max. 2000 char.): The Wind Atlas Analysis and Application Program (WAsP) is a PC-program for horizontal and vertical extrapolation of wind data. The program contains a complete set of models to calculate the effects on the wind of sheltering obstacles, surface roughness changes and terrain height variations. The analysis part consists of a transformation of an observed wind climate (speed and direction distributions) to a wind atlas data set. The wind atlas data set can subsequently be applied for estimation of the wind climate and wind power potential, as well as for siting of specific wind turbines. The WAsP 9 Help Facility includes a Quick Start Tutorial, a User's Guide and a Technical Reference. It further includes brief descriptions of and links to the Observed Wind Climate Wizard, the WAsP Climate Analyst tool, the WAsP Map Editor tool, the WAsP Turbine Editor tool, the Air Density Calculator and various scripting tools. This report consists of edited excerpts from the electronic version of the WAsP 9 help facility: Mortensen, N.G., D.N. Heathfield, L. Myllerup, L. Landberg and O. Rathmann (2007). Wind Atlas Analysis and Application Program: WAsP 9 Help Facility. Risø National Laboratory, Technical University of Denmark, Roskilde, Denmark. 353 topics. ISBN 978-87-550-3607-9. Printed in Denmark by Schultz Grafisk, 2007
Information Service Department Risø National Laboratory Technical University of Denmark P.O. Box 49 DK-4000 Roskilde Denmark Telephone +45 46774004 [email protected] Fax +45 46774013 www.risoe.dk
i
Table of Contents
INTRODUCTION ....................................................................................................................1
Welcome ............................................................................................................................1
What is WAsP? ...................................................................................................................1
WAsP 9 installation ............................................................................................................ 3
The distribution disk ........................................................................................................... 3
Downloading from the Web.................................................................................................. 3
Storing the installation files ................................................................................................. 3
Running the setup programs................................................................................................ 3
System requirements.......................................................................................................... 3
Upgrading from WAsP version 8.3......................................................................................... 3
Install as an administrator ................................................................................................... 4
A note for WAsP Engineering users ....................................................................................... 4
Problems...? ...................................................................................................................... 4
WAsP 9 licencing................................................................................................................4
How to install your licence ................................................................................................... 4
Using a licence on multiple computers................................................................................... 5
Multiple licences on the same computer ................................................................................ 5
When to insert the dongle ................................................................................................... 5
Licencing system problems ................................................................................................5
Sorry, the licence could not be installed ................................................................................ 5
Licence Manager cannot ‘see’ the dongle ............................................................................... 5
More detailed information.................................................................................................... 6
Contacting us for more help................................................................................................. 6
Getting started... ................................................................................................................7
Keeping your installation up to date...................................................................................... 7
Trademarks and copyrights.................................................................................................. 7
What's new in WAsP 9?......................................................................................................7
System requirement changes............................................................................................... 7
Getting Started with WAsP 9
ii
New hierarchy member types............................................................................................... 7
Calculation behaviour.......................................................................................................... 8
Wind farms........................................................................................................................ 8
Resource grids ................................................................................................................... 9
Miscellaneous..................................................................................................................... 9
Known issues .....................................................................................................................9
Copyright and trademarks................................................................................................10
License Agreement...........................................................................................................10
Acknowledgements ..........................................................................................................10
WASP HELP FACILITY .........................................................................................................11
The WAsP help facility......................................................................................................11
WebHelp ......................................................................................................................... 11
Context-sensitive help .....................................................................................................11
Complete on-line documentation......................................................................................12
Plan for future editions ....................................................................................................12
QUICK START TUTORIAL .....................................................................................................13
Introduction.....................................................................................................................13
The GUI essentials ...........................................................................................................13
Just the basics... .............................................................................................................. 13
Opening a new WAsP workspace ........................................................................................ 13
Working with the workspace hierarchy ................................................................................ 14
Saving the workspace and members ................................................................................... 17
A step-by-step example ...................................................................................................18
Introduction..................................................................................................................... 18
The situation.................................................................................................................... 18
Working with WAsP to provide a prediction .......................................................................... 19
Calculating the wind atlas.................................................................................................. 19
Estimating wind power ...................................................................................................... 22
Estimating wind farm production ........................................................................................ 25
Mapping the wind resource ................................................................................................ 28

Table of Contents
iii
There's a lot more to learn... ............................................................................................33
Sample data and workspaces ...........................................................................................34
Sample workspace #1: Waspdale ....................................................................................... 34
Sample workspace #2: Windfarm....................................................................................... 35
Sample workspace #3: ResourceGrid.................................................................................. 35
WASP USER'S GUIDE...........................................................................................................37
The WAsP user interface ..................................................................................................37
Overview of the WAsP user interface................................................................................... 37
Use the right-hand mouse button! ...................................................................................... 37
Menu and toolbars............................................................................................................ 38
WAsP workspaces............................................................................................................. 39
Working with workspaces .................................................................................................. 39
The workspace hierarchy .................................................................................................41
About the workspace hierarchy .......................................................................................... 41
What is a hierarchy member? ............................................................................................ 41
Introducing the hierarchy members .................................................................................... 42
Modelling with the hierarchy members ................................................................................ 44
Patterns of association ...................................................................................................... 45
Legitimate parent-child associations ................................................................................... 48
Associated members have the same number of sectors ......................................................... 49
Working with the hierarchy..............................................................................................50
Hierarchy members' methods............................................................................................. 50
Inserting members ........................................................................................................... 50
Moving members.............................................................................................................. 51
Removing members.......................................................................................................... 52
Saving members .............................................................................................................. 52
Members' properties ......................................................................................................... 52
Refreshing the workspace hierarchy display ......................................................................... 52
Function keys................................................................................................................... 53
Mouse keys ..................................................................................................................... 53

Getting Started with WAsP 9
iv
Carrying on… ................................................................................................................... 53
MODELLING WITH WASP ....................................................................................................55
Introduction.....................................................................................................................55
Read on….........................................................................................................................55
FEEDBACK AND SUPPORT....................................................................................................57
Reporting problems..........................................................................................................57
Don't hesitate .................................................................................................................. 57
Before you contact us… ..................................................................................................... 57
Reporting problems .......................................................................................................... 57
Making suggestions..........................................................................................................58
Contacting the WAsP team...............................................................................................58
OTHER INFORMATION SOURCES .........................................................................................59
Risø readings in wind power meteorology........................................................................59
Wind power meteorology in general .................................................................................... 59
Wind measurements ......................................................................................................... 59
WAsP and wind modelling.................................................................................................. 59
Wind atlases .................................................................................................................... 60
Short term prediction........................................................................................................ 60
On the Web ......................................................................................................................60
Wind atlases, wind data and wind characteristics.................................................................. 60
Topographical and elevation data ....................................................................................... 61
Wind turbine and rotor blade manufacturers ........................................................................ 61
WASP FORMS ......................................................................................................................62
1
Introduction
Welcome
In 1987 the Wind Energy and Atmospheric Physics Department at Risø National Laboratory introduced WAsP – a powerful tool for wind data analysis, wind atlas generation, wind climate estimation, wind farm power production calculations and siting of wind turbines. Over the years, the program has become the industry standard for wind resource assessment and siting of wind turbines and wind farms and it has been employed in more than 100 countries around the world.
A new release of this indispensable tool for everybody working with wind energy is now available – WAsP 9 for Windows 2000, XP and Vista. The program has been developed by the same team who worked out the Danish Windatlas, the European Wind Atlas, the Wind Atlases for Egypt and previous versions of the WAsP programs.
The algorithms at the heart of the WAsP software have been tested and applied for more than 20 years in many different parts of the world. As time has passed, most of our efforts have been devoted to refining the WAsP algorithms and supporting the existing software. Meanwhile, user interface design standards have moved on. Many users (and prospective users) have indicated their desire for an updated user interface. WAsP for Windows was intended to meet these demands.
WAsP is 100% 32-bit Windows software, which runs under Windows 2000, XP and Vista. It conforms to standard Windows software user-interface conventions, making it easy to learn and easy to use.
We recommend that you work through the Quick Start Tutorial – to see for yourself what WAsP 9 is all about. If you're already familiar with a previous version of WAsP, you may read here about the new features of version 9.
As it says in the License Agreement and Copyright Statement, the WAsP software is provided 'as is' and 'does not represent a commitment on the part of Risø National Laboratory, DTU' etc. However, we are of course aware that the programs may contain errors, programming bugs and inconsistencies – especially with the introduction of this major upgrade. Therefore, we guarantee that we will do our best to check, maintain and correct the programs in the WAsP package, and that we'll make available or distribute corrected versions to registered users of the software.
We wish you the best of luck with your wind projects and hope WAsP 9 can help you reach your goals.
The WAsP Team @ Risø
What is WAsP?
WAsP is a PC-program for the vertical and horizontal extrapolation of wind climate statistics. It contains several models to describe the wind flow over different terrains and close to sheltering obstacles. Conceptually, WAsP consists of five main calculation blocks:
Analysis of raw data. This option enables an analysis of any time-series of wind measurements to provide a statistical summary of the observed, site-specific wind climate. This part is implemented in separate software tools: the Observed Wind Climate (OWC) Wizard and the WAsP Climate Analyst.
Generation of wind atlas data. Analyzed wind data can be converted into a regional wind climate or wind atlas data set. In a wind atlas data set the wind observations have been 'cleaned' with respect to site-specific conditions. The wind atlas data sets are site-independent and the wind distributions have been reduced to some standard conditions.
Wind climate estimation. Using a wind atlas data set calculated by WAsP or one obtained from another source – e.g. the European Wind Atlas – the program can estimate the wind climate at any specific point by performing the inverse calculation as is used to generate a wind atlas. By introducing descriptions of the terrain around the predicted site, the models can predict the actual, expected wind climate at this site.
Estimation of wind power potential. The total energy content of the mean wind is calculated by WAsP. Furthermore, an estimate of the actual, annual mean energy production of a wind turbine can be obtained by providing WAsP with the power curve of the wind turbine in question.
Getting Started with WAsP 9
2
Calculation of wind farm production. Given the thrust coefficient curve of the wind turbine and the wind farm layout, WAsP can finally estimate the wake losses for each turbine in a farm and thereby the net annual energy production of each wind turbine and of the entire farm, i.e. the gross production minus the wake losses.
The program thus contains analysis and application parts, which may be summarised as follows:
Analysis
time-series of wind speed and direction —> observed wind climate (OWC)
observed wind climate + met. station site description —> regional wind climate (RWC, wind atlas data sets)
Application
regional wind climate + site description —> predicted wind climate (PWC)
predicted wind climate + power curve —> annual energy production (AEP) of wind turbine
Wind farm production
predicted wind climates + WTG characteristics —> gross annual energy production of wind farm
predicted wind climates + WTG characteristics + wind farm layout —> wind farm wake losses
gross annual energy productions + wake losses —> net annual energy production of wind farm
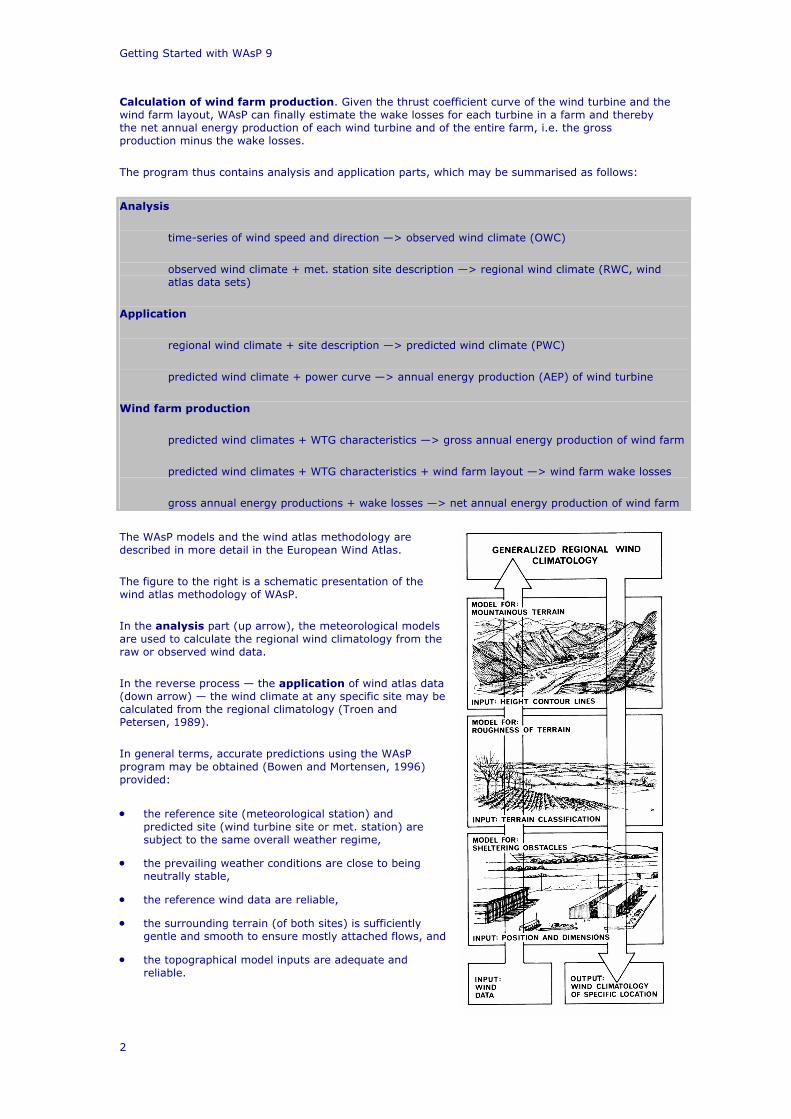
The WAsP models and the wind atlas methodology are described in more detail in the European Wind Atlas.
The figure to the right is a schematic presentation of the wind atlas methodology of WAsP.
In the analysis part (up arrow), the meteorological models are used to calculate the regional wind climatology from the raw or observed wind data.
In the reverse process — the application of wind atlas data (down arrow) — the wind climate at any specific site may be calculated from the regional climatology (Troen and Petersen, 1989).
In general terms, accurate predictions using the WAsP program may be obtained (Bowen and Mortensen, 1996) provided:
• the reference site (meteorological station) and predicted site (wind turbine site or met. station) are subject to the same overall weather regime,
• the prevailing weather conditions are close to being neutrally stable,
• the reference wind data are reliable,
• the surrounding terrain (of both sites) is sufficiently gentle and smooth to ensure mostly attached flows, and
• the topographical model inputs are adequate and reliable.

Introduction
3
WAsP 9 installation
This brief guide describes the general release of the installation program for WAsP 9. Great care has been taken to ensure that this installation will run successfully, but as with all Windows software installations, there is a risk that running it could upset the normal functioning of your system. It is recommended that you exercise some caution in choosing when to run this installation program. Please contact the Risø WAsP team before installing if you need any specific advice. To use the full range of features in a software product from Risø, you must have a valid product licence. The installation is therefore divided into two separate steps:
1. Installing the WAsP software
2. Installing the WAsP licence
The distribution disk
You will normally get the WAsP 9 installation on a CD. The CD has three installation files which will install the following products:
• WAsP 9
• The WAsP 9 Map Editor
• The WAsP Climate Analyst
The installation files are standard MSI (Windows Installer) files.
Downloading from the Web
The latest releases of the WAsP software installation files are freely available from the “Download | WAsP” section at www.wasp.dk. Here the MSI files may be contained in zip-archives, from which you must extract them after downloading.
Storing the installation files
We recommend in all cases that you make and keep local copies of the MSI files on your PC’s own hard drive − preferably in a dedicated “installation folder” created for the purpose − and that you use these local files when installing. This will ensure immediate access to the installation files in case of subsequent installation upgrades or set-up changes.
A suitable location for a WAsP installer folder could be “\WAsP\Installers” in the common user profile “C:\Documents and Settings\All users”.
Running the setup programs
Run each of the three installations by double-clicking on the MSI files and follow the instructions.
System requirements
WAsP 9.0 will work with Windows 2000, Windows XP (home and professional) and Windows Vista, installed on a reasonably-specified PC bought within the last couple of years.
Upgrading from WAsP version 8.3
We suggest that you un-install WAsP 8.3 and the corresponding Map Editor before running the WAsP 9 installations, but if you prefer, installing WAsP 9.0 without uninstalling WAsP 8.3 is perfectly safe as well: the two programs will run together without interference. You can remove WAsP 8.3 (and the corresponding Map Editor) later, but make sure that you have access to the WAsP 9.0 installation MSI files when you un-install WAsP 8.3.
Getting Started with WAsP 9
4
Install as an administrator
You must have administrator rights on the Windows system to perform the installation.
You can choose to install the software for all users of the computer, not just yourself. If you do, then the software will be configured separately for additional users when they first run it. At this point there must also be access to the WAsP 9.0 installation MSI files.
Each user needs separately to set up a WAsP licence under their account, also if a common WAsP licence is shared by all the users.
A note for WAsP Engineering users
If you have WAsP Engineering installed, please make sure that you have upgraded to version 1.2 or 2.0 before installing WAsP 9.0, because there is a risk of some incompatibility between WAsP Engineering 1.0 and WAsP 9.0. Get the latest release of WAsP Engineering from the “Download | WAsP” section at www.wasp.dk.
Problems...?
Check the known issues list and FAQ at the WAsP web site www.wasp.dk.
Or, e-mail us for technical help and advice at [email protected]. This requires a valid WAsP support agreement.
WAsP 9 licencing
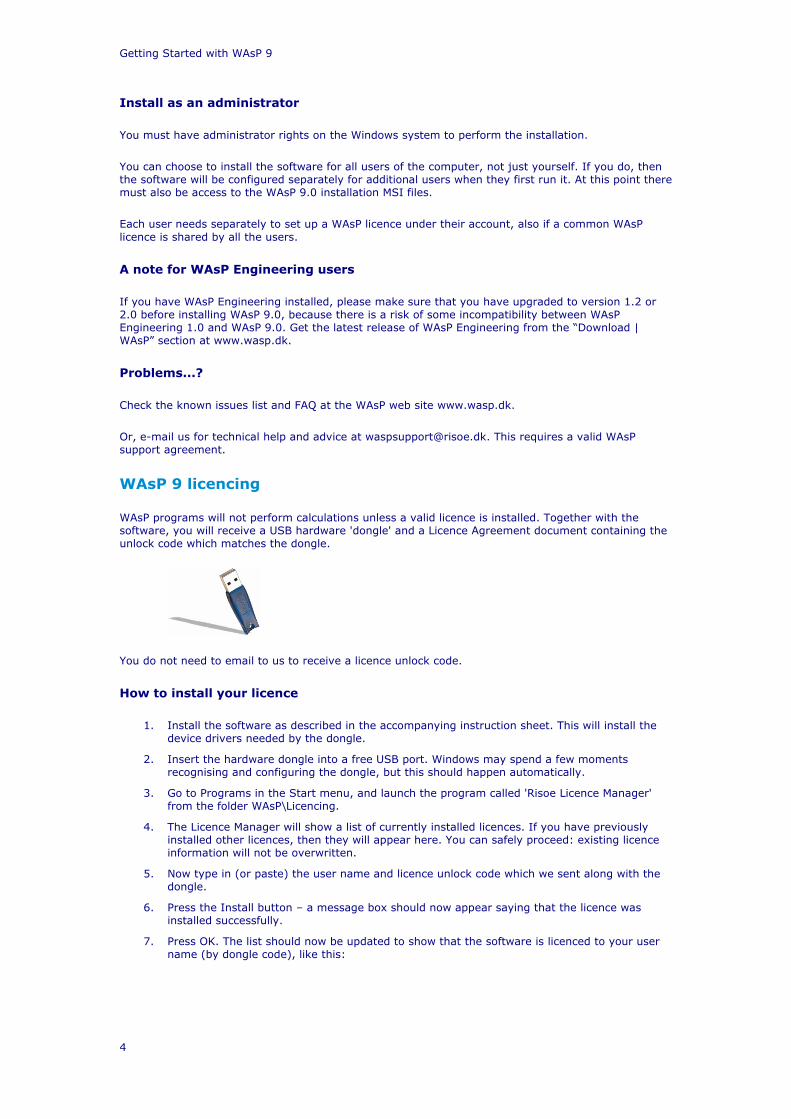
WAsP programs will not perform calculations unless a valid licence is installed. Together with the software, you will receive a USB hardware 'dongle' and a Licence Agreement document containing the unlock code which matches the dongle.
You do not need to email to us to receive a licence unlock code.
How to install your licence
1. Install the software as described in the accompanying instruction sheet. This will install the device drivers needed by the dongle.
2. Insert the hardware dongle into a free USB port. Windows may spend a few moments recognising and configuring the dongle, but this should happen automatically.
3. Go to Programs in the Start menu, and launch the program called 'Risoe Licence Manager' from the folder WAsP\Licencing.
4. The Licence Manager will show a list of currently installed licences. If you have previously installed other licences, then they will appear here. You can safely proceed: existing licence information will not be overwritten.
5. Now type in (or paste) the user name and licence unlock code which we sent along with the dongle.
6. Press the Install button – a message box should now appear saying that the licence was installed successfully.
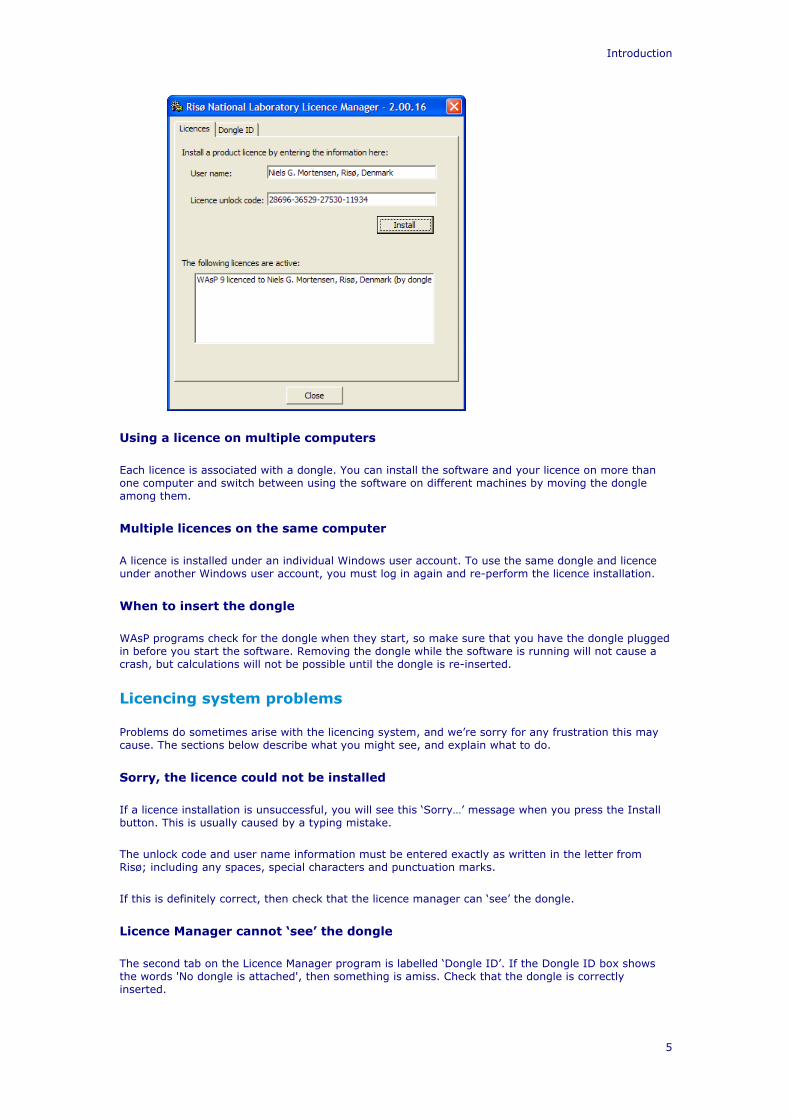
7. Press OK. The list should now be updated to show that the software is licenced to your user name (by dongle code), like this:
Introduction
5
Using a licence on multiple computers
Each licence is associated with a dongle. You can install the software and your licence on more than one computer and switch between using the software on different machines by moving the dongle among them.
Multiple licences on the same computer
A licence is installed under an individual Windows user account. To use the same dongle and licence under another Windows user account, you must log in again and re-perform the licence installation.
When to insert the dongle
WAsP programs check for the dongle when they start, so make sure that you have the dongle plugged in before you start the software. Removing the dongle while the software is running will not cause a crash, but calculations will not be possible until the dongle is re-inserted.
Licencing system problems
Problems do sometimes arise with the licencing system, and we’re sorry for any frustration this may cause. The sections below describe what you might see, and explain what to do.
Sorry, the licence could not be installed
If a licence installation is unsuccessful, you will see this ‘Sorry…’ message when you press the Install button. This is usually caused by a typing mistake.
The unlock code and user name information must be entered exactly as written in the letter from Risø; including any spaces, special characters and punctuation marks.
If this is definitely correct, then check that the licence manager can ‘see’ the dongle.
Licence Manager cannot ‘see’ the dongle
The second tab on the Licence Manager program is labelled ‘Dongle ID’. If the Dongle ID box shows the words 'No dongle is attached', then something is amiss. Check that the dongle is correctly inserted.
Getting Started with WAsP 9
6
If you are running 64-bit Windows, then this can be a problem. Please contact WAsP support for help fixing this.
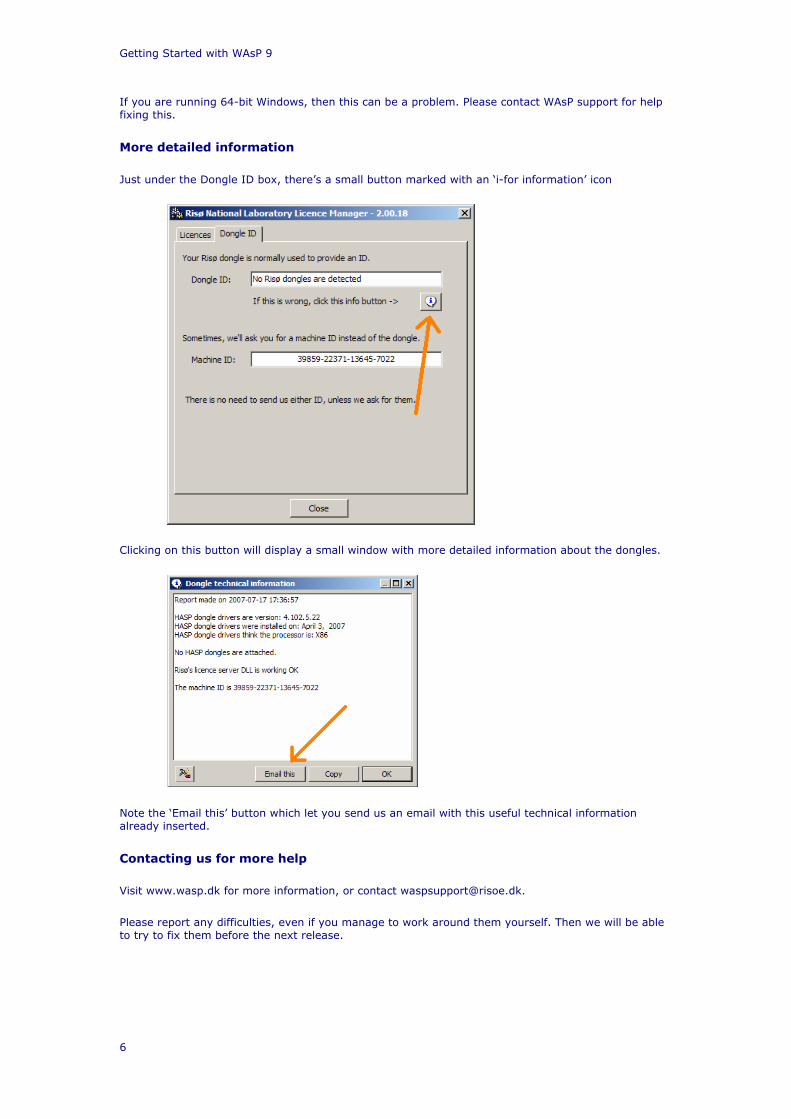
More detailed information
Just under the Dongle ID box, there’s a small button marked with an ‘i-for information’ icon
Clicking on this button will display a small window with more detailed information about the dongles.
Note the ‘Email this’ button which let you send us an email with this useful technical information already inserted.
Contacting us for more help
Visit www.wasp.dk for more information, or contact [email protected].
Please report any difficulties, even if you manage to work around them yourself. Then we will be able to try to fix them before the next release.
Introduction
7
Getting started...
We suggest you start by reading through the 'Introduction' section of the WAsP help facility. Next, we recommend that you work through the Quick Start Tutorial – to see for yourself what WAsP 9 is all about.
The documentation and User's Guide to the WAsP 9 program are contained in the WAsP help facility. Here you should be able to find most of the information required to run WAsP. The European Wind Atlas (Troen and Petersen, 1989) contains background information that may not be included in the help file with this release.
If you have problems using the WAsP software please send e-mail to [email protected]. If you do not have e-mail, you may send a fax to the number given on the reverse side. You should also check the list of known issues at www.wasp.dk or the list of Frequently Asked Questions (FAQ).
Keeping your installation up to date
The most recent version of the WAsP 9 program can be downloaded from www.wasp.dk, possibly in the form of an update file to the main installation on the CD-ROM. Note, that it will only run on the PC computer where the original WAsP installation was made. Updates of other WAsP 9 files and programs may be available as well (WAsP help facility, Turbine Editor etc.).
Trademarks and copyrights
Company and product names mentioned in this installation guide may be trademarks or registered trademarks of their respective companies. Please observe the copyright statements provided with each software package on the WAsP 9 CD-ROM.
What's new in WAsP 9?
Compared to previous versions, WAsP 9 contains new functionality, an improved user interface, an improved help facility and several new or updated auxiliary software packages. The most profound changes may be listed under the following headings:
• Spatial image underlays
• Nested wind farms
• Wind farm power curves
• Resource grid masking
• Resource grid performance improvements
• Enhanced Map Editor
• A new WAsP Climate Analyst tool
These, and some other minor changes, are described in more detail below.
System requirement changes
Windows XP or later is recommended. It is no longer possible to install and use this software on Window 98, ME and NT4. Various updates and patches from Microsoft may be required for WAsP to be installed and run on Windows 2000.
New hierarchy member types
Spatial images
• These are bitmap image files which can be used as map underlays
• They can be inserted in various places in the hierarchy

Getting Started with WAsP 9
8
• More than one image can be associated with the same vector map
• Add them to the hierarchy by opening a JPG or BMP from file
• The spatial location of the image is read from an SCL file with a matching file name
• The WAsP Map Editor can be used to establish the SCL files
Turbine site groups
• Wind farms can now have sub-groups into which turbine sites can be organised
• These sub-groups are called 'Turbine site groups'
• A turbine site group becomes a wind farm automatically if it's not a sub-group of another wind farm
• A wind farm moved to be a child of another wind farm becomes a turbine site group automatically
• Turbine site groups are similar to wind farms, but wake calculation results are not available
Reference sites
• A new hierarchy member, called 'Reference site' is introduced
• The main purpose is to support the calculation of wind farm power curves
• Reference sites are similar to turbine sites, but don't calculate production using a power curve
• They can be inserted in various places in the hierarchy, but only one can be at any given level
Notes
• A note is just a snippet of text which can be added anywhere in the hierarchy
Calculation behaviour
Project level calculation
• The project-level calculation command 'Do all feasible calculations for all project members' now forcefully recalculates all the members of the project, regardless of whether their results are due for recalculation or not.
Wind farms
Nested groups
• Wind farms now support nesting: sub-groups can be arranged under the wind farm
• Different sub-groups can have different associated WTGs and obstacle groups, etc.
• An organiser tool helps to sort and order the children of a wind farm if it gets too untidy
• Wake effects are calculated among all of the turbine sites in a nested wind farm
Wind farm power curve
• The wind farm power curve is now calculated for a given reference site location
Introduction
9
Resource grids
Calculation masks
• Grids are still defined as rectangles, but a 'mask' can now be defined for the calculation. Masked areas won't be calculated
• Masks can be defined by selecting map polygons, or by using a Surfer grid map (which may be generated by WAsP)
• Access this feature via the 'Edit mask' button in the resource grid window
New results
• Grids of dRIX values can now be calculated
• Obstacle effects are now included in the calculations
• Sector-wise results can now be displayed
• The colour palette used to display the grid results can now be pivoted (centred) around a given value
• All version 9 resource grids are WRG export-ready (for WindFarmer)
• A detailed statistical panel shows provides more insight into the grid data
Calculations
• The site effects, wind climate and AEP are now handled as separate calculations, so you can make site assessment grids without an atlas.
• If a grid is re-configured, existing valid results are preserved as far as possible, to minimise the re-calculation task
• If only the associated atlas (regional wind climate) is changed, then the site effects are not recalculated
• If only the associated WTG is changed, then only the AEP results are recalculated
• The grid calculation routines have been changed to make them generally faster
Miscellaneous
• It's now possible to open BNA and BLN files
• Vector maps can include boundary lines which are shown on the map
• Height contour labels can be shown on vector maps
• A bunch of new scripts...
Known issues
You should check the lists of known issues and frequently asked questions at the WAsP home page. It is important to note the following:
• WAsP uses an air density of 1.225 kgm-3 when calculating power density. Similarly, power production is calculated for this standard air density if one of the sample power curves is used.
• Only if the power curve is specified for the actual site air density, or an existing power curve has been scaled to the site air density (this is only recommended for some turbines though), will the wind turbine power production calculated by WAsP correspond to this air density. In 'real' projects it is strongly recommended to obtain a site-specific power curve from the manufacturer.

Getting Started with WAsP 9
10
• Any changes to the map made in the WAsP Map Editor are not automatically used in WAsP; the map must be saved from the map editor and reloaded into WAsP for the changes to take place.
• The present version of the help facility may not be entirely up-to-date. Updated versions of the help file and other WAsP components will be made available on www.wasp.dk.
Copyright and trademarks
Wind Atlas Analysis and Application Program (WAsP). Copyright © 1987-2007 by Risø National Laboratory, Technical University of Denmark (DTU), Roskilde, Denmark.
All rights reserved. No part of this publication may be reproduced, stored in a retrieval system, or transmitted in any form or by any means, without the express written permission of Risø DTU. The information in this manual is subject to change without notice and does not represent a commitment on the part of Risø DTU. The WAsP program and associated software is furnished under a license agreement and may be used or copied only in accordance with the terms of this agreement.
Neither Risø DTU nor any person acting on behalf of Risø DTU is responsible for the use, which might be made of the information presented in this publication.
Product names mentioned herein may be trademarks or registered trademarks of their respective companies.
License Agreement
The use of WAsP is governed by a License Agreement made by and between Risø National Laboratory, Roskilde, Denmark (hereinafter referred to as Licensor) and the Licensee. The Licence Agreement is included separately in the WAsP package.
The WAsP program is password-protected. By installing the software and entering a unique user name and product unlock code; the Licensee is agreeing to become bound by the terms of this License Agreement.
Acknowledgements
The WAsP program was originally developed, designed and implemented by Ib Troen, Niels G. Mortensen and Erik L. Petersen from Risø National Laboratory, with financial support from the Commission of the European Communities (DGXII).
The present Windows-version was developed by a team consisting of Lars Landberg, Niels G. Mortensen, Ole Rathmann and Lisbeth Myllerup from the Wind Energy Department at Risø DTU, Sofus S. Mortensen from Lambda Soft (DK) and Duncan N. Heathfield, Ray Drummond and Jukka Kivistö from World in a Box Finland OY.
The ruggedness index concept was originally developed and tested by Anthony J. Bowen from the University of Canterbury, New Zealand.
Front page photo shows two wind turbines close to Viscaria, Kiruna, Sweden. Photo by Gunnar Britse, www.Windpowerphotos.com.
Artistic drawings by Søren Rasmussen.
11
WAsP Help Facility
The WAsP help facility
This help facility should eventually become the complete, on-line User's Guide and Technical Reference for the WAsP program. The main characteristics of the WAsP Help Facility are:
• Based on Microsoft HTML help
o Requires Internet Explorer 4.0 or later for full functionality
• Complete on-line documentation
o Text, tables and images
o Table of contents, index and keywords
o Books and topics can be printed
• Fast and easy to use
o Context-sensitive help (F1-help)
o Full-text search facility
• Hyperlinks to topics, URL's and e-mail addresses
• Easy to update and distribute
The help facility can be invoked and used in two different ways: as context-sensitive help or as a stand-alone application/document.
The present version of the help facility may not be entirely up-to-date. In addition, the help facility is far from static, but is being developed continuously. New versions will be made available at the WAsP home page and you'll receive a notification when this happens – if you have informed us about your e-mail address.
WebHelp
A WebHelp version of the help facility can also be reached from the WAsP home page. This version may be more up to date than the present file, and it can further be viewed on virtually any browser and platform. For all platforms, including Windows 98 or later and Macintosh, use:
• Internet Explorer 5.0 or later
• Netscape Navigator 4.0 or later
• Opera 6.0 or later
• Konquerer 3.0.3 or later (Linux only)
• Safari (Macintosh only)
• Mozilla (all versions)
Context-sensitive help
Pressing the F1-key on your keyboard invokes context-sensitive help for the active window or dialog. This works in the WAsP program as well as for the Observed Wind Climate Wizard. The WAsP Map Editor and the WAsP Climate Analyst have their own separate help facilities.
From the WAsP program you are guided directly to the User's Guide part of the help facility; to a point from which you should be able to find the answer you're looking for. Use the Contents tab to navigate the help facility via the table of contents, or use the related topics controls present on most F1-help entry pages.
You can also use the Index tab to navigate via the keywords of the index or you can use the full-text search facility by choosing Search.
Getting Started with WAsP 9
12
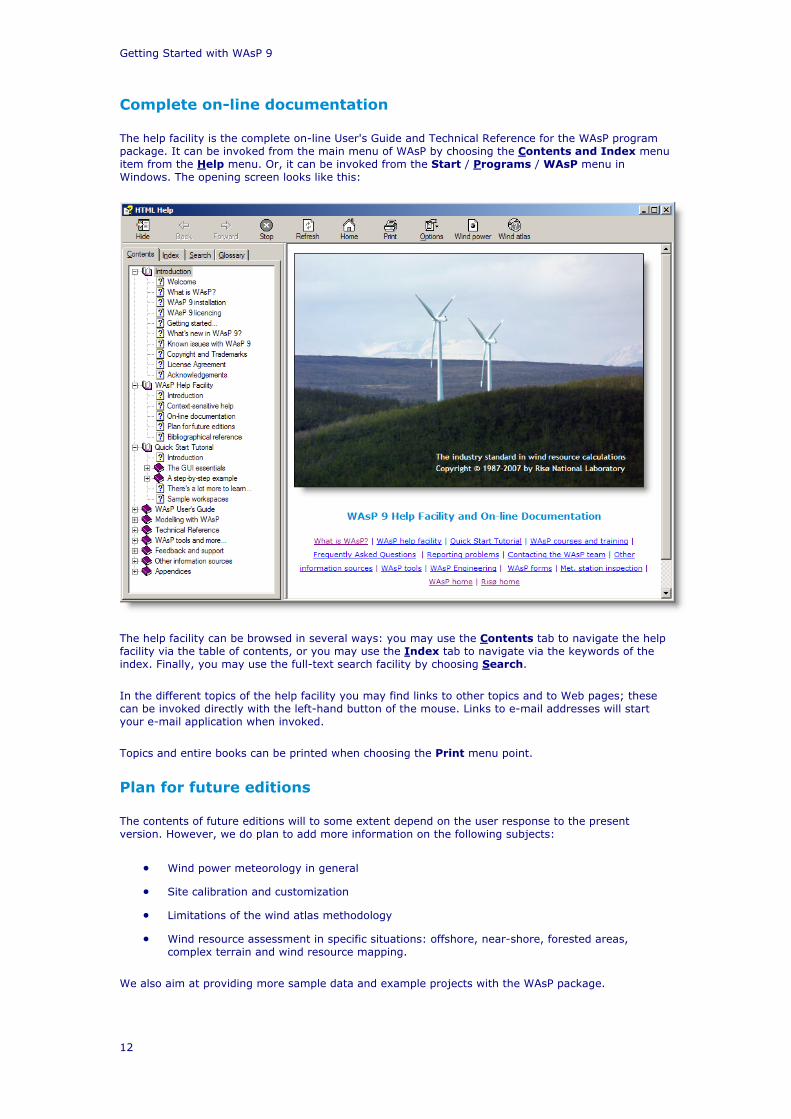
Complete on-line documentation
The help facility is the complete on-line User's Guide and Technical Reference for the WAsP program package. It can be invoked from the main menu of WAsP by choosing the Contents and Index menu item from the Help menu. Or, it can be invoked from the Start / Programs / WAsP menu in Windows. The opening screen looks like this:
The help facility can be browsed in several ways: you may use the Contents tab to navigate the help facility via the table of contents, or you may use the Index tab to navigate via the keywords of the index. Finally, you may use the full-text search facility by choosing Search.
In the different topics of the help facility you may find links to other topics and to Web pages; these can be invoked directly with the left-hand button of the mouse. Links to e-mail addresses will start your e-mail application when invoked.
Topics and entire books can be printed when choosing the Print menu point.
Plan for future editions
The contents of future editions will to some extent depend on the user response to the present version. However, we do plan to add more information on the following subjects:
• Wind power meteorology in general
• Site calibration and customization
• Limitations of the wind atlas methodology
• Wind resource assessment in specific situations: offshore, near-shore, forested areas, complex terrain and wind resource mapping.
We also aim at providing more sample data and example projects with the WAsP package.
13
Quick Start Tutorial
Introduction
This section of the WAsP help facility is intended to provide a very brief introduction to the essential features and uses of WAsP, in particular how to use the Graphical User Interface (GUI).
A concise explanation of the most basic techniques is followed by a simple step-by-step example.
New users will get an idea of what WAsP is for and how to use it. Existing users of older versions of WAsP will be introduced to the new ways of working.
The GUI essentials
Just the basics...
This section is not intended to be a complete guide to using WAsP. Instead, you are introduced to just enough of the basics to let you work through the simple step-by-step example.
Read through the following sections in order
1. WAsP workspaces 2. Working with the workspace hierarchy 3. Saving the workspace members
This brief introduction is followed by the step-by-step example.
Opening a new WAsP workspace
When you first open WAsP, you are presented with an empty window. To start work, you need to open a workspace. In WAsP, all work is performed within the context of a workspace. Workspaces can be created, saved and re-opened. To open a new workspace, select New workspace from the File menu.
Getting Started with WAsP 9
14
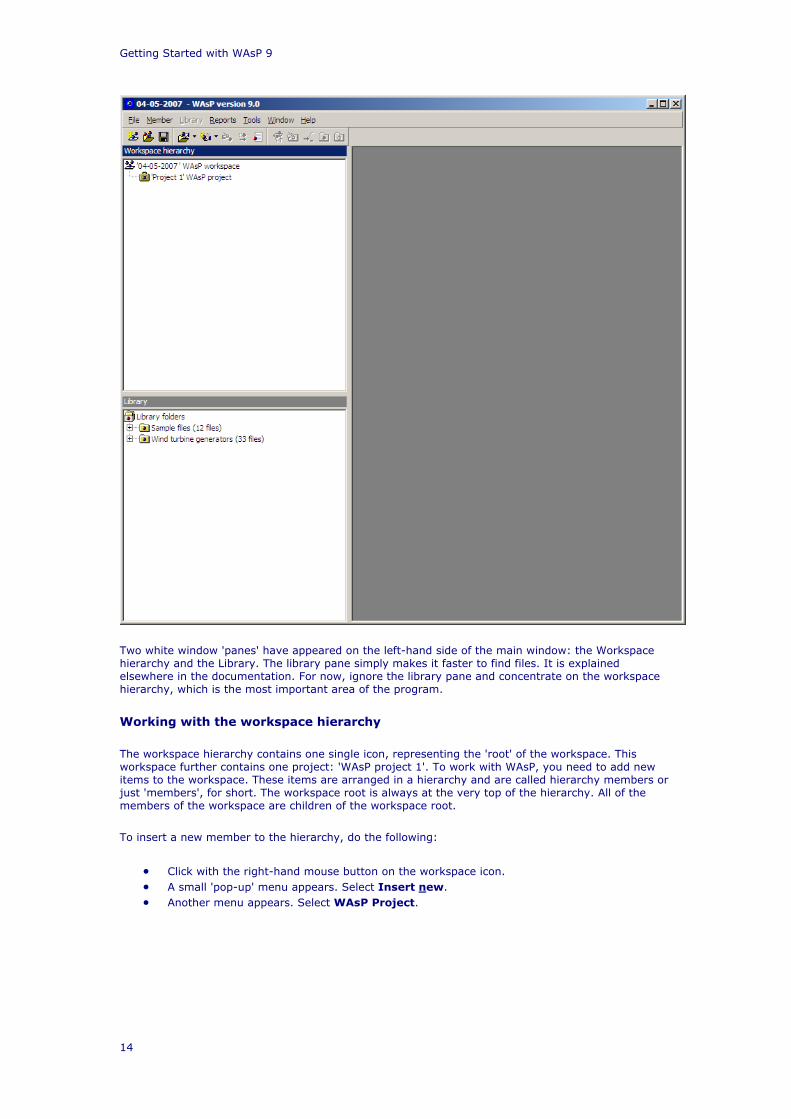
Two white window 'panes' have appeared on the left-hand side of the main window: the Workspace hierarchy and the Library. The library pane simply makes it faster to find files. It is explained elsewhere in the documentation. For now, ignore the library pane and concentrate on the workspace hierarchy, which is the most important area of the program.
Working with the workspace hierarchy
The workspace hierarchy contains one single icon, representing the 'root' of the workspace. This workspace further contains one project: 'WAsP project 1'. To work with WAsP, you need to add new items to the workspace. These items are arranged in a hierarchy and are called hierarchy members or just 'members', for short. The workspace root is always at the very top of the hierarchy. All of the members of the workspace are children of the workspace root.
To insert a new member to the hierarchy, do the following:
• Click with the right-hand mouse button on the workspace icon. • A small 'pop-up' menu appears. Select Insert new. • Another menu appears. Select WAsP Project.
Quick Start Tutorial
15
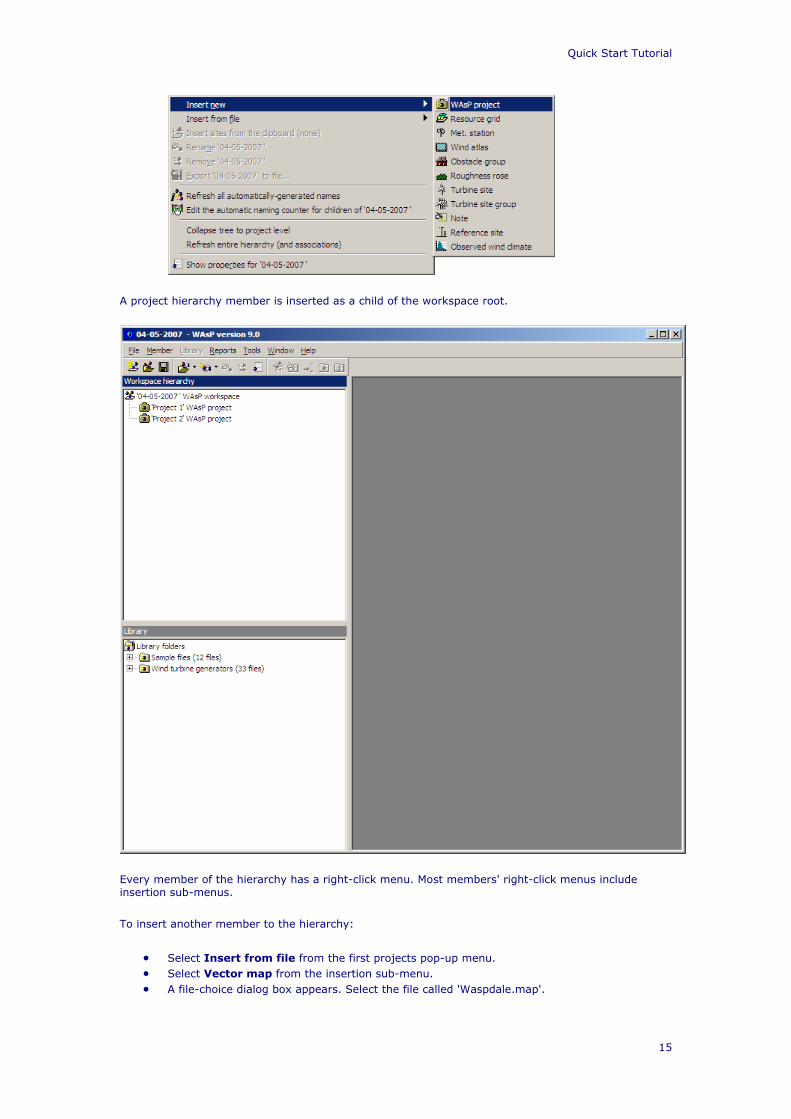
A project hierarchy member is inserted as a child of the workspace root.
Every member of the hierarchy has a right-click menu. Most members' right-click menus include insertion sub-menus.
To insert another member to the hierarchy:
• Select Insert from file from the first projects pop-up menu. • Select Vector map from the insertion sub-menu. • A file-choice dialog box appears. Select the file called 'Waspdale.map'.
Getting Started with WAsP 9
16
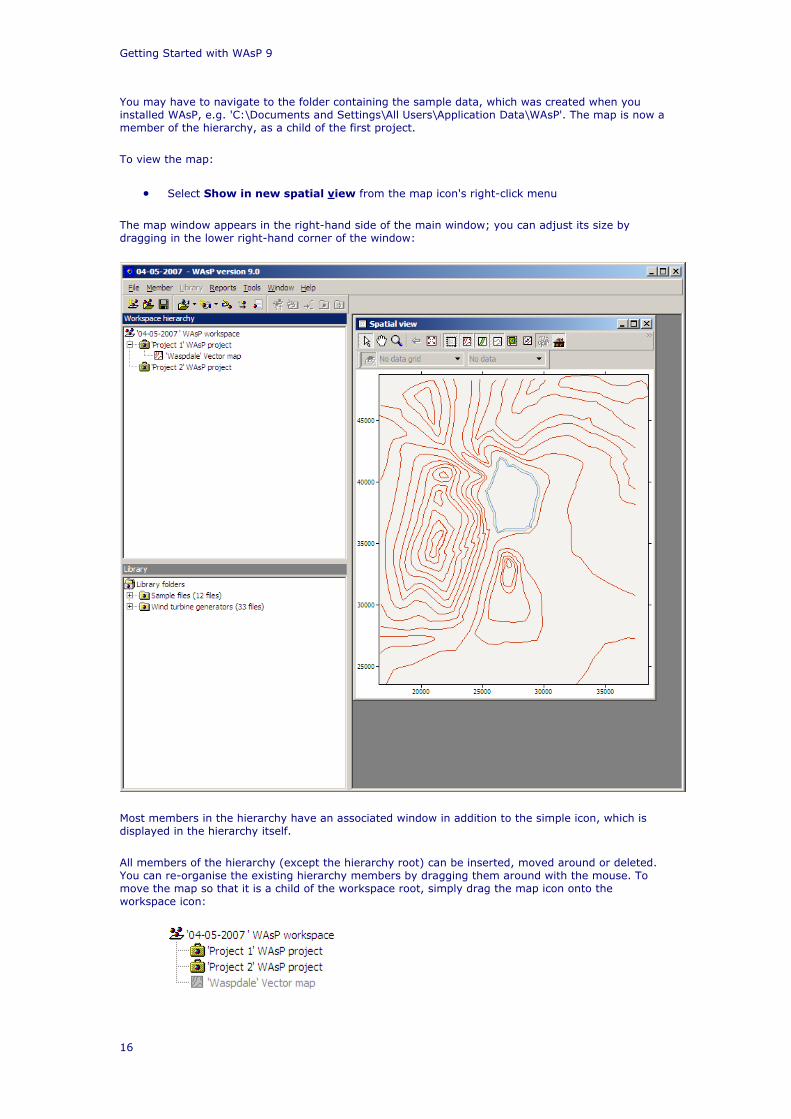
You may have to navigate to the folder containing the sample data, which was created when you installed WAsP, e.g. 'C:\Documents and Settings\All Users\Application Data\WAsP'. The map is now a member of the hierarchy, as a child of the first project.
To view the map:
• Select Show in new spatial view from the map icon's right-click menu
The map window appears in the right-hand side of the main window; you can adjust its size by dragging in the lower right-hand corner of the window:
Most members in the hierarchy have an associated window in addition to the simple icon, which is displayed in the hierarchy itself.
All members of the hierarchy (except the hierarchy root) can be inserted, moved around or deleted. You can re-organise the existing hierarchy members by dragging them around with the mouse. To move the map so that it is a child of the workspace root, simply drag the map icon onto the workspace icon:
Quick Start Tutorial
17
The map and the project are now both children of the workspace root. There are constraints on where different types of hierarchy member can be placed in the hierarchy, but most types of member (including maps) are allowed to be children of the workspace root. Members in the workspace root (except for projects) are passive data files, i.e. they do not have any influence on the calculations in the projects.
You have already learned the most important techniques for working with WAsP!
It is largely a matter of manipulating the members of the workspace hierarchy using the mouse. Learning to use WAsP is now simply a question of getting to know the various members of the workspace hierarchy and understanding how to use them.
Saving the workspace and members
Several members of the workspace may be inserted from associated data files. However, when you work with a hierarchy member in WAsP, you are dealing with a copy of the data and you can make changes to anything. The changes to the data are not written to the file unless you save or export them. The workspace hierarchy and the data it contains are saved in a WAsP workspace hierarchy file (*.wwh).
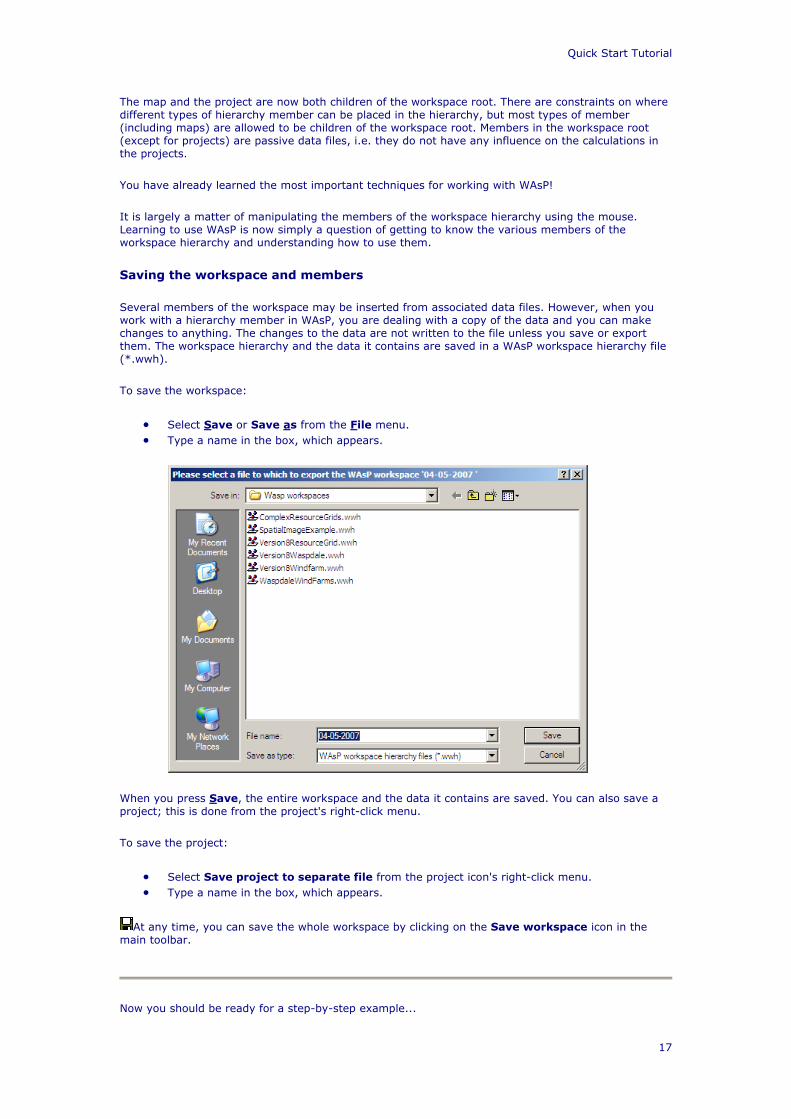
To save the workspace:
• Select Save or Save as from the File menu. • Type a name in the box, which appears.
When you press Save, the entire workspace and the data it contains are saved. You can also save a project; this is done from the project's right-click menu.
To save the project:
• Select Save project to separate file from the project icon's right-click menu. • Type a name in the box, which appears.
At any time, you can save the whole workspace by clicking on the Save workspace icon in the main toolbar.
Now you should be ready for a step-by-step example...
Getting Started with WAsP 9
18
A step-by-step example
Introduction
The example works through a complete wind turbine siting operation, starting with some measured wind data and ending up with a prediction of the power yield from erecting a turbine at a specific site.
Next, you will set up a wind farm consisting of several wind turbines and predict the annual energy production from this farm, including the losses caused by the rotor wakes. Finally, we'll map the wind resource over an area.
You can find the data used for the example in the folder containing the sample data, which was created when you installed WAsP, e.g. 'C:\Documents and Settings\All Users\Application Data\WAsP\Sample data'.
At the bottom of each page is a Proceed... link, which will take you to the next page in the example.
The situation
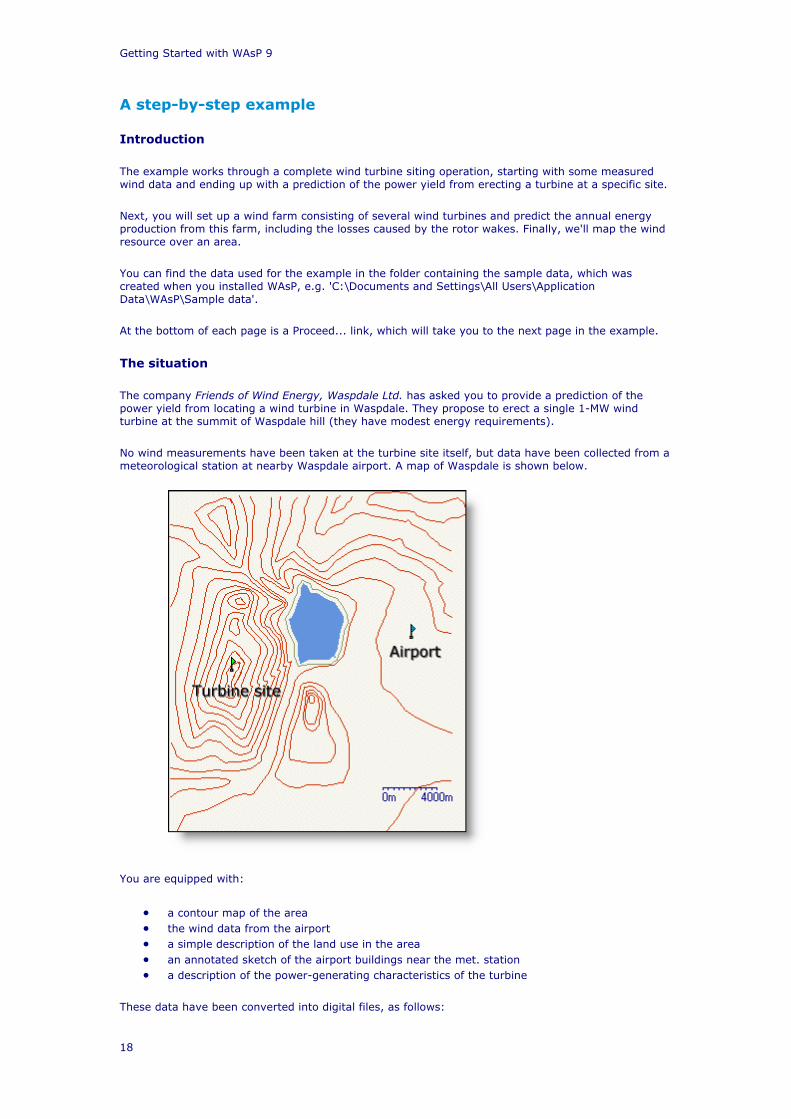
The company Friends of Wind Energy, Waspdale Ltd. has asked you to provide a prediction of the power yield from locating a wind turbine in Waspdale. They propose to erect a single 1-MW wind turbine at the summit of Waspdale hill (they have modest energy requirements).
No wind measurements have been taken at the turbine site itself, but data have been collected from a meteorological station at nearby Waspdale airport. A map of Waspdale is shown below.
You are equipped with:
• a contour map of the area • the wind data from the airport • a simple description of the land use in the area • an annotated sketch of the airport buildings near the met. station • a description of the power-generating characteristics of the turbine
These data have been converted into digital files, as follows:

Quick Start Tutorial
19
• a digital map of elevations and roughness • a data file containing wind data • a data file describing the buildings at the airport • a data file containing a power production curve for the turbine
Working with WAsP to provide a prediction
From engineering data, you know how much power will be generated by the turbine at a given wind speed. If the plan was to erect the turbine at exactly the same place where the meteorological data had been collected, then it would be a really simple task to work out how much power to expect.
However, just from looking at the map it is obvious that the proposed turbine site is completely different from the meteorological station at the airport: the properties of the meteorological station itself will affect the wind data recorded there. In addition, the properties of the turbine site will have an effect on the way that the wind behaves near the turbine. It is also unlikely that the hub height of the turbine would be the same as the height of the anemometer.
What you need is a way to take the wind climate recorded at the meteorological station, and use it to predict the wind climate at the turbine site. That is what WAsP does.
Using WAsP, you can analyze the recorded wind data, correcting for the recording site effects to produce a site-independent characterization of the local wind climate. This site-independent characterization of the local wind climate is called a wind atlas data set or regional wind climate. You can also use WAsP to apply site effects to wind atlas data to produce a site-specific interpretation of the local wind climate.
Providing a prediction in the Waspdale case will therefore be a two-stage process. First, the data from the meteorological station need to be analyzed to produce a wind atlas, and then the resulting wind atlas needs to be applied to the proposed turbine site to estimate the wind power.
Calculating the wind atlas
Setting up a met. station
To begin, you need to open a new workspace in WAsP. A new project is automatically inserted in this workspace. Save the workspace and project, calling them both 'Waspdale'. Return to the GUI essentials if you don't know how to do this.
Now insert a new wind atlas as a child of the project (right-click on the project, choose Insert new and then Wind atlas). The wind atlas will be generated from a meteorological station; a new met. station hierarchy member has already been inserted as a child of the wind atlas.
The workspace should now look like this:
WAsP now requires:
• a description of the data-recording site • a summary of the wind data recorded at the site
Adding wind observations
You now need to insert some wind data to the hierarchy.
Select the met. station and use Insert from file to insert an Observed wind climate member. You will be asked to provide the name of a file to use. Navigate to the folder containing the sample data, which was created when you installed WAsP, and select the file called 'Waspdale.tab'.
Getting Started with WAsP 9
20
You can read more about how to create observed wind climate files from raw data measurements elsewhere in the documentation.
The workspace should now look like this:
You can provide a new name for the wind atlas – and other members of the hierarchy – by right-clicking and choosing Rename. Here, call the wind atlas 'Waspdale'.
Describing the site
Now WAsP needs to know about the site where the data were collected. First, introduce a map as a child of the project. You should use the project's Insert from file method, then Vector map and then select the file called 'Waspdale.map'. Now you need to locate the met. station in the map.
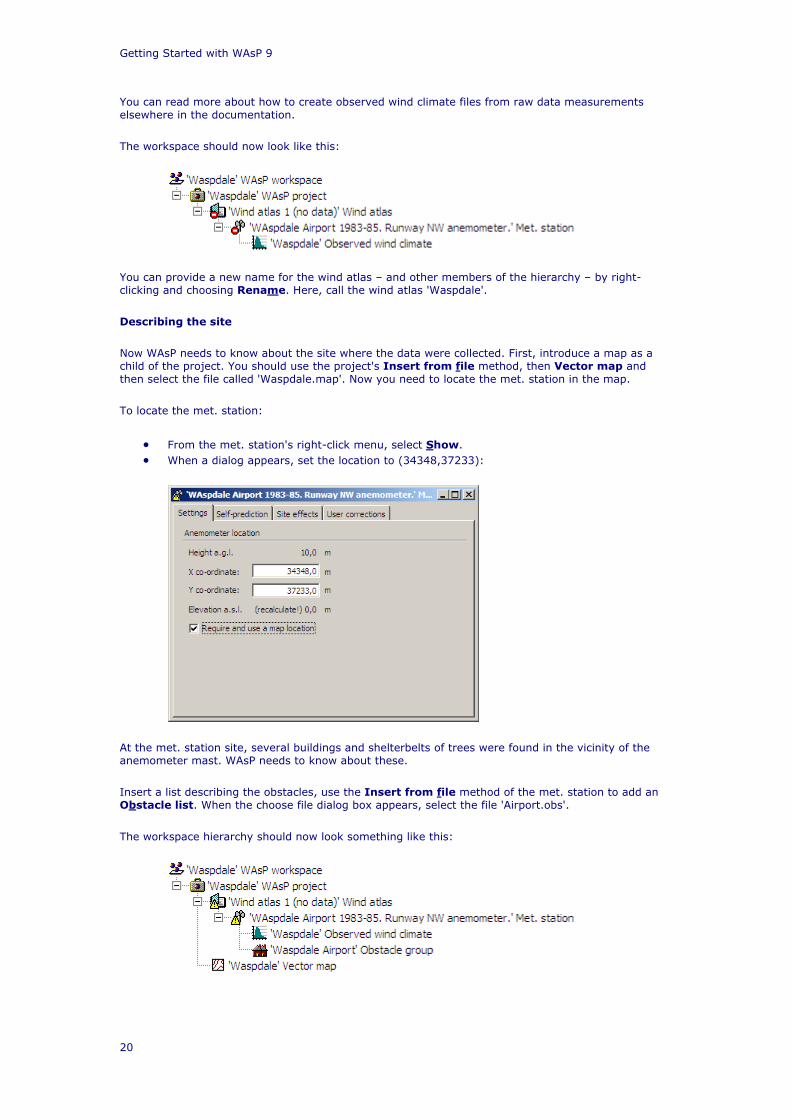
To locate the met. station:
• From the met. station's right-click menu, select Show. • When a dialog appears, set the location to (34348,37233):
At the met. station site, several buildings and shelterbelts of trees were found in the vicinity of the anemometer mast. WAsP needs to know about these.
Insert a list describing the obstacles, use the Insert from file method of the met. station to add an Obstacle list. When the choose file dialog box appears, select the file 'Airport.obs'.
The workspace hierarchy should now look something like this:
Quick Start Tutorial
21
The atlas calculation
WAsP is now ready to calculate the wind atlas for Waspdale, but before proceeding, pause to examine the members of the hierarchy which are contributing to the analysis:
The map, the observed wind climate and the obstacle list all contain data and can be viewed. Each has a command called Show on its right-click menu, which will open the window associated with the member. Open each one and have a look. To see where the met. station is in the map, select the Show in a new spatial view command from the met. station's right-click menu; clicking on the little anemometer icon in the map's toolbar will show or hide the met. station in the map.
Generating the wind atlas
Now get WAsP to generate the wind atlas (or regional wind climate as it's also called). From the wind atlas' right-click menu, select the Calculate wind atlas command. When the calculation is finished, the small yellow warning sign shown at the wind atlas icon has gone. This indicates that the calculations for the wind atlas are up to date.
You could also have chosen Do all feasible calculations for all project members [F9] in the project's right-click menu to update all calculations within the project.
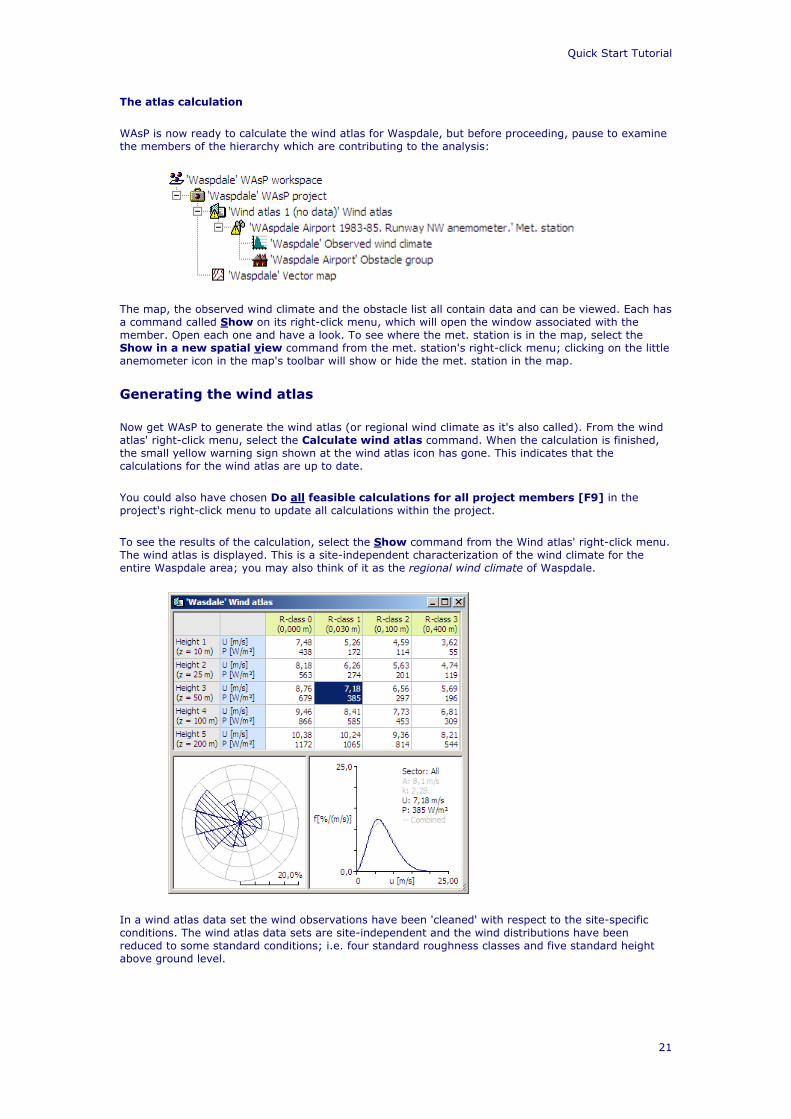
To see the results of the calculation, select the Show command from the Wind atlas' right-click menu. The wind atlas is displayed. This is a site-independent characterization of the wind climate for the entire Waspdale area; you may also think of it as the regional wind climate of Waspdale.
In a wind atlas data set the wind observations have been 'cleaned' with respect to the site-specific conditions. The wind atlas data sets are site-independent and the wind distributions have been reduced to some standard conditions; i.e. four standard roughness classes and five standard height above ground level.
Getting Started with WAsP 9
22
Estimating wind power
Setting up a turbine site
Now that the project contains a wind atlas with site-independent wind climate data, we can apply those data to the proposed turbine site. WAsP will adjust the data for the situation found at the turbine site, and will produce a prediction of the wind climate for the site itself.
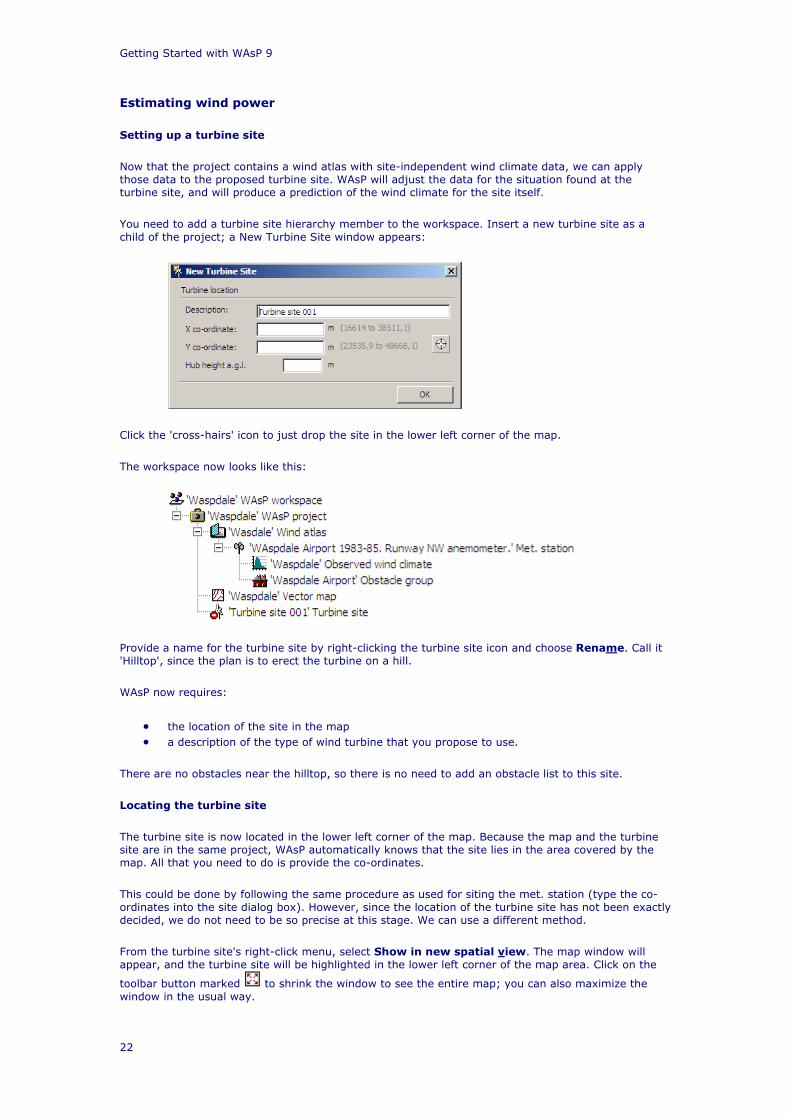
You need to add a turbine site hierarchy member to the workspace. Insert a new turbine site as a child of the project; a New Turbine Site window appears:
Click the 'cross-hairs' icon to just drop the site in the lower left corner of the map.
The workspace now looks like this:
Provide a name for the turbine site by right-clicking the turbine site icon and choose Rename. Call it 'Hilltop', since the plan is to erect the turbine on a hill.
WAsP now requires:
• the location of the site in the map • a description of the type of wind turbine that you propose to use.
There are no obstacles near the hilltop, so there is no need to add an obstacle list to this site.
Locating the turbine site
The turbine site is now located in the lower left corner of the map. Because the map and the turbine site are in the same project, WAsP automatically knows that the site lies in the area covered by the map. All that you need to do is provide the co-ordinates.
This could be done by following the same procedure as used for siting the met. station (type the co-ordinates into the site dialog box). However, since the location of the turbine site has not been exactly decided, we do not need to be so precise at this stage. We can use a different method.
From the turbine site's right-click menu, select Show in new spatial view. The map window will appear, and the turbine site will be highlighted in the lower left corner of the map area. Click on the
toolbar button marked to shrink the window to see the entire map; you can also maximize the window in the usual way.
Quick Start Tutorial
23
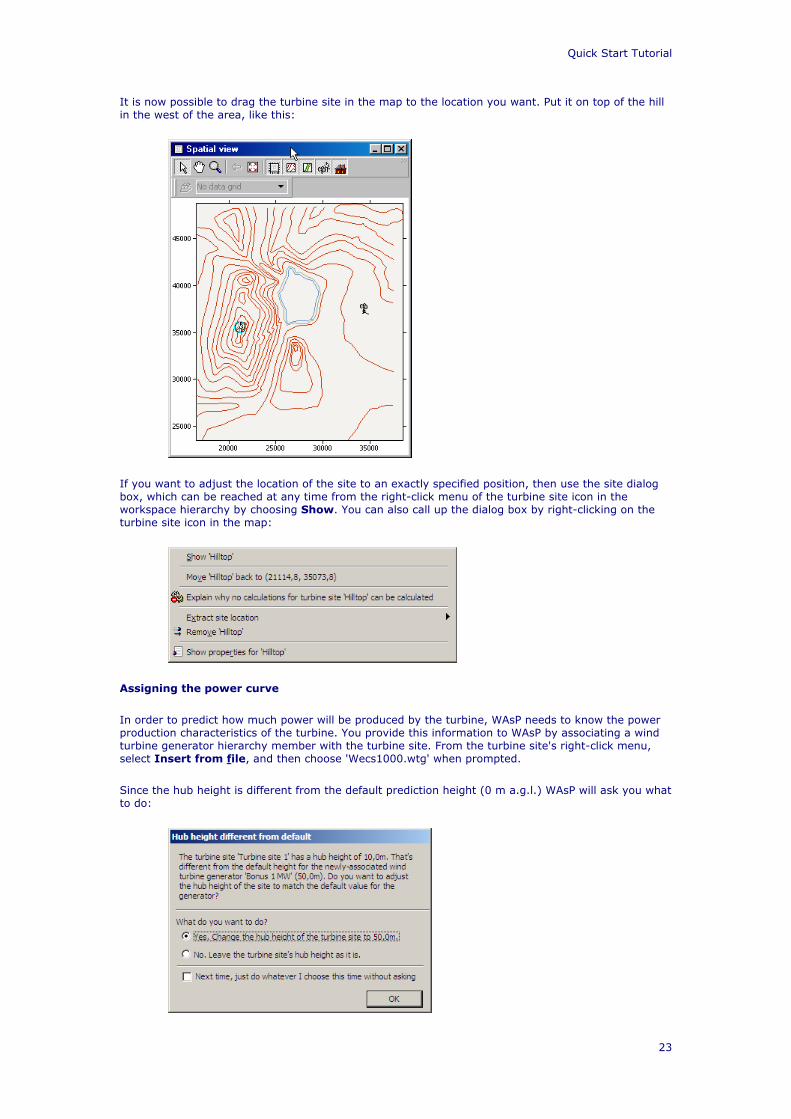
It is now possible to drag the turbine site in the map to the location you want. Put it on top of the hill in the west of the area, like this:
If you want to adjust the location of the site to an exactly specified position, then use the site dialog box, which can be reached at any time from the right-click menu of the turbine site icon in the workspace hierarchy by choosing Show. You can also call up the dialog box by right-clicking on the turbine site icon in the map:
Assigning the power curve
In order to predict how much power will be produced by the turbine, WAsP needs to know the power production characteristics of the turbine. You provide this information to WAsP by associating a wind turbine generator hierarchy member with the turbine site. From the turbine site's right-click menu, select Insert from file, and then choose 'Wecs1000.wtg' when prompted.
Since the hub height is different from the default prediction height (0 m a.g.l.) WAsP will ask you what to do:
Getting Started with WAsP 9
24
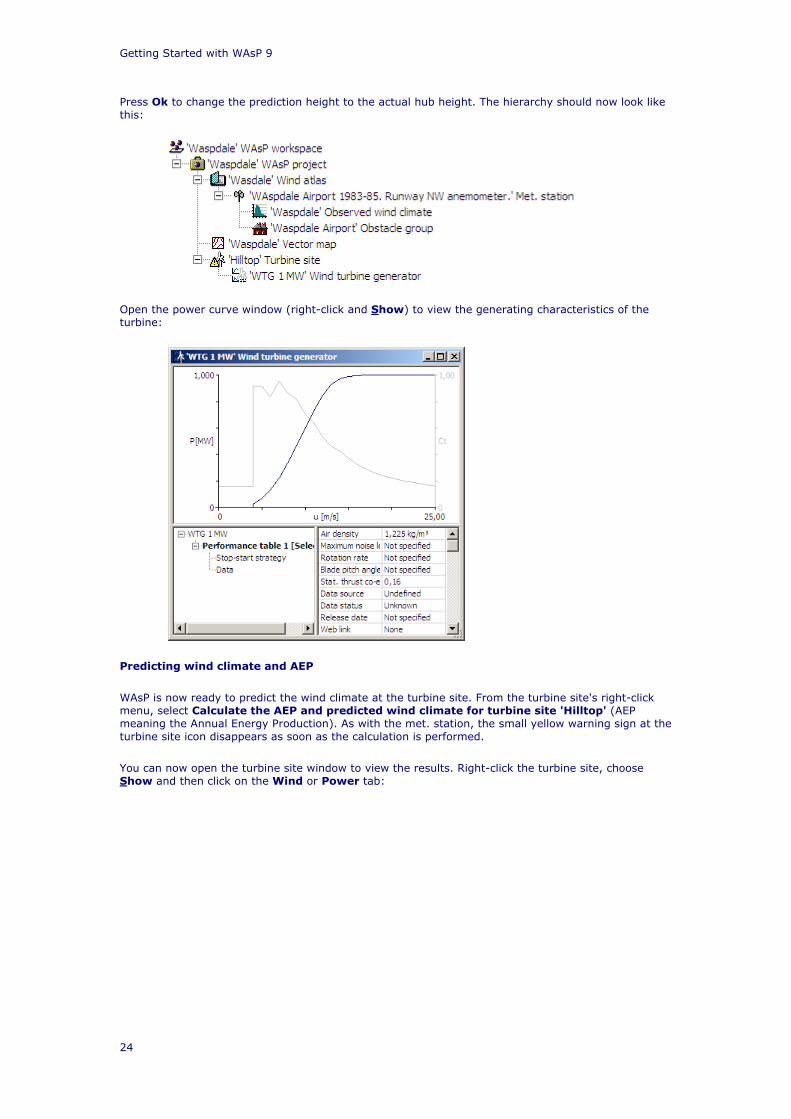
Press Ok to change the prediction height to the actual hub height. The hierarchy should now look like this:
Open the power curve window (right-click and Show) to view the generating characteristics of the turbine:
Predicting wind climate and AEP
WAsP is now ready to predict the wind climate at the turbine site. From the turbine site's right-click menu, select Calculate the AEP and predicted wind climate for turbine site 'Hilltop' (AEP meaning the Annual Energy Production). As with the met. station, the small yellow warning sign at the turbine site icon disappears as soon as the calculation is performed.
You can now open the turbine site window to view the results. Right-click the turbine site, choose Show and then click on the Wind or Power tab:
Quick Start Tutorial
25
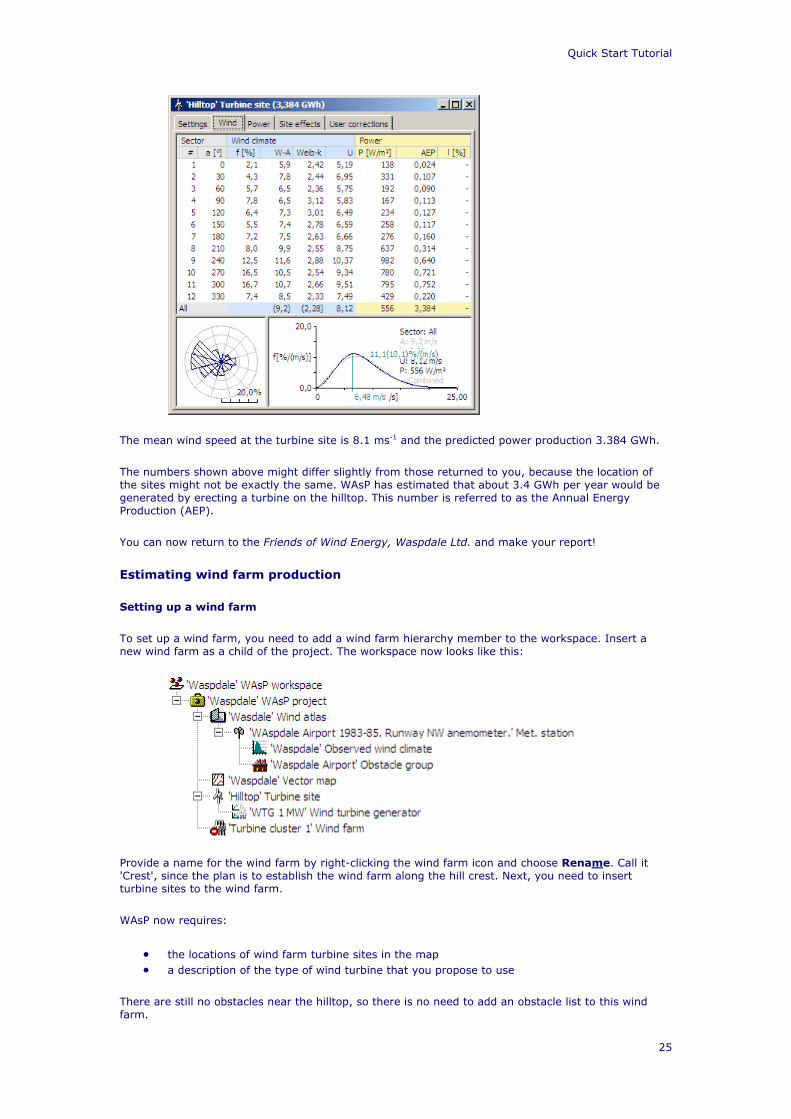
The mean wind speed at the turbine site is 8.1 ms-1 and the predicted power production 3.384 GWh.
The numbers shown above might differ slightly from those returned to you, because the location of the sites might not be exactly the same. WAsP has estimated that about 3.4 GWh per year would be generated by erecting a turbine on the hilltop. This number is referred to as the Annual Energy Production (AEP).
You can now return to the Friends of Wind Energy, Waspdale Ltd. and make your report!
Estimating wind farm production
Setting up a wind farm
To set up a wind farm, you need to add a wind farm hierarchy member to the workspace. Insert a new wind farm as a child of the project. The workspace now looks like this:
Provide a name for the wind farm by right-clicking the wind farm icon and choose Rename. Call it 'Crest', since the plan is to establish the wind farm along the hill crest. Next, you need to insert turbine sites to the wind farm.
WAsP now requires:
• the locations of wind farm turbine sites in the map • a description of the type of wind turbine that you propose to use
There are still no obstacles near the hilltop, so there is no need to add an obstacle list to this wind farm.
Getting Started with WAsP 9
26
Locating the turbine sites
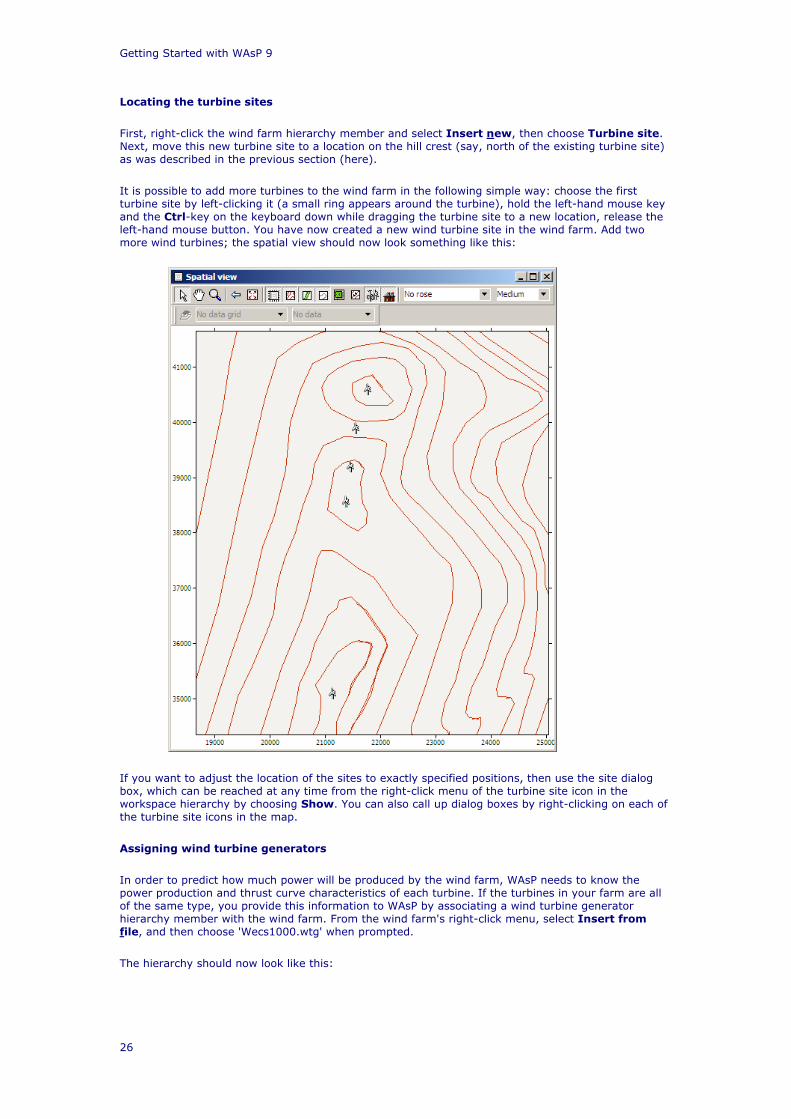
First, right-click the wind farm hierarchy member and select Insert new, then choose Turbine site. Next, move this new turbine site to a location on the hill crest (say, north of the existing turbine site) as was described in the previous section (here).
It is possible to add more turbines to the wind farm in the following simple way: choose the first turbine site by left-clicking it (a small ring appears around the turbine), hold the left-hand mouse key and the Ctrl-key on the keyboard down while dragging the turbine site to a new location, release the left-hand mouse button. You have now created a new wind turbine site in the wind farm. Add two more wind turbines; the spatial view should now look something like this:
If you want to adjust the location of the sites to exactly specified positions, then use the site dialog box, which can be reached at any time from the right-click menu of the turbine site icon in the workspace hierarchy by choosing Show. You can also call up dialog boxes by right-clicking on each of the turbine site icons in the map.
Assigning wind turbine generators
In order to predict how much power will be produced by the wind farm, WAsP needs to know the power production and thrust curve characteristics of each turbine. If the turbines in your farm are all of the same type, you provide this information to WAsP by associating a wind turbine generator hierarchy member with the wind farm. From the wind farm's right-click menu, select Insert from file, and then choose 'Wecs1000.wtg' when prompted.
The hierarchy should now look like this:
Quick Start Tutorial
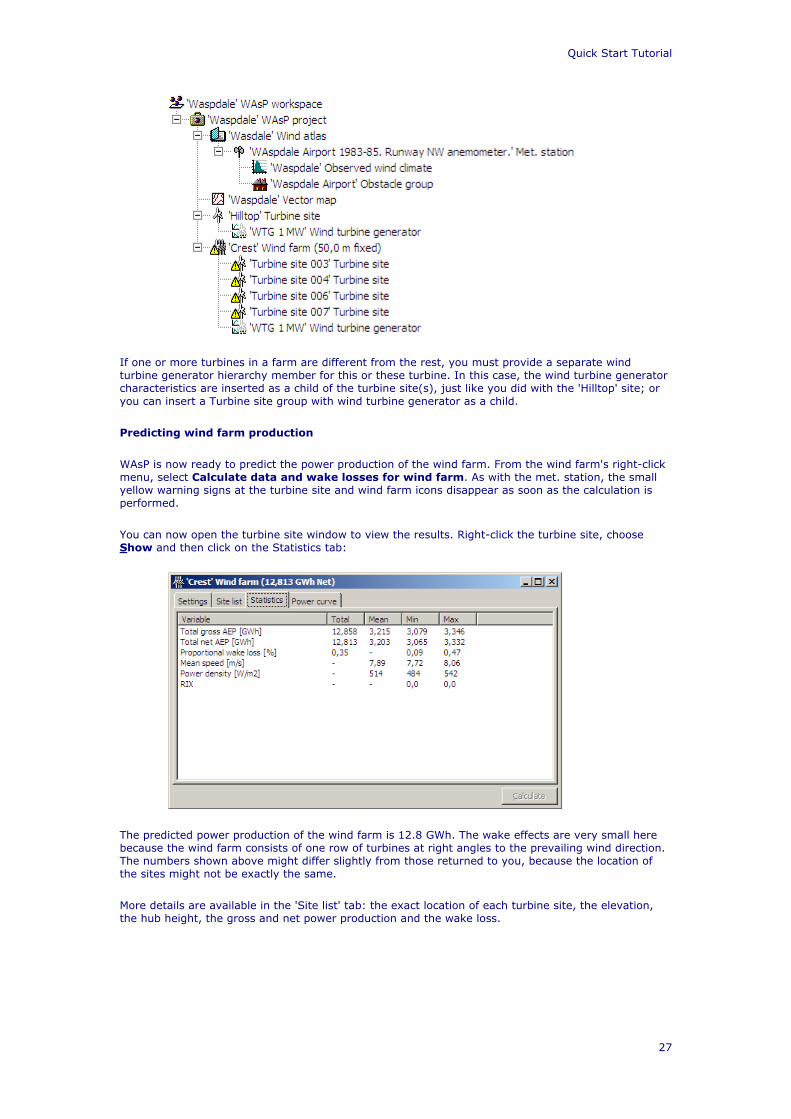
27
If one or more turbines in a farm are different from the rest, you must provide a separate wind turbine generator hierarchy member for this or these turbine. In this case, the wind turbine generator characteristics are inserted as a child of the turbine site(s), just like you did with the 'Hilltop' site; or you can insert a Turbine site group with wind turbine generator as a child.
Predicting wind farm production
WAsP is now ready to predict the power production of the wind farm. From the wind farm's right-click menu, select Calculate data and wake losses for wind farm. As with the met. station, the small yellow warning signs at the turbine site and wind farm icons disappear as soon as the calculation is performed.
You can now open the turbine site window to view the results. Right-click the turbine site, choose Show and then click on the Statistics tab:
The predicted power production of the wind farm is 12.8 GWh. The wake effects are very small here because the wind farm consists of one row of turbines at right angles to the prevailing wind direction. The numbers shown above might differ slightly from those returned to you, because the location of the sites might not be exactly the same.
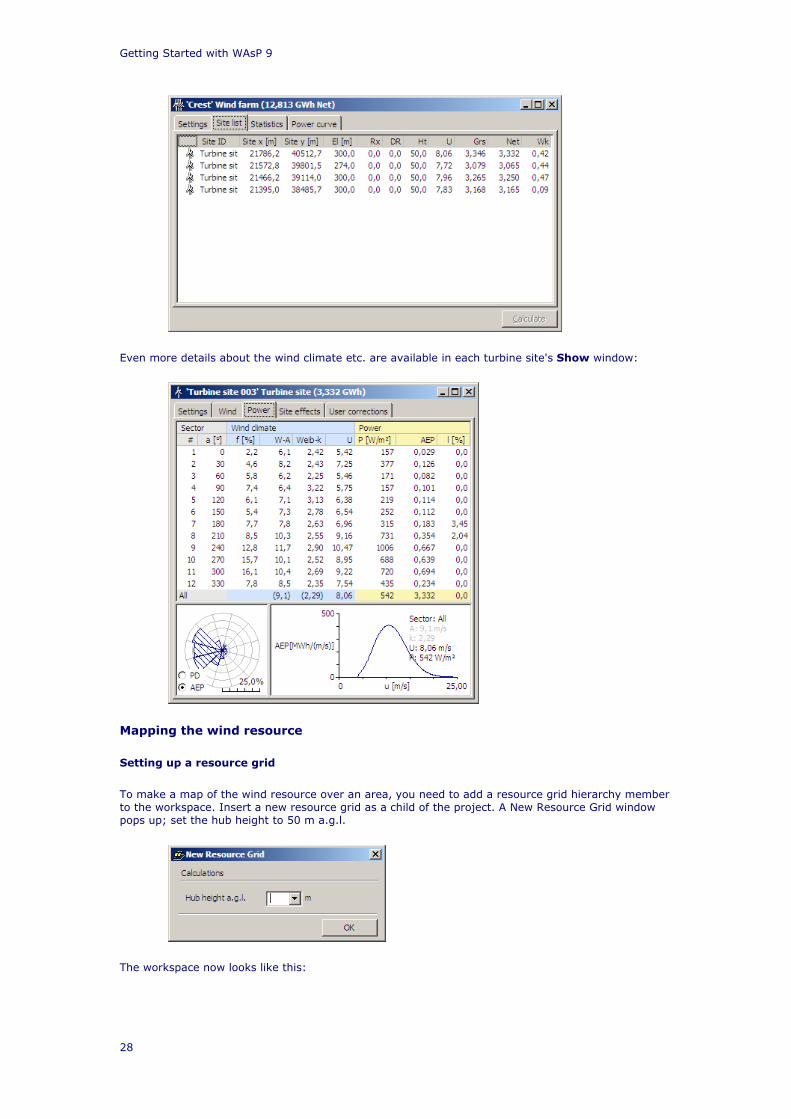
More details are available in the 'Site list' tab: the exact location of each turbine site, the elevation, the hub height, the gross and net power production and the wake loss.
Getting Started with WAsP 9
28
Even more details about the wind climate etc. are available in each turbine site's Show window:
Mapping the wind resource
Setting up a resource grid
To make a map of the wind resource over an area, you need to add a resource grid hierarchy member to the workspace. Insert a new resource grid as a child of the project. A New Resource Grid window pops up; set the hub height to 50 m a.g.l.
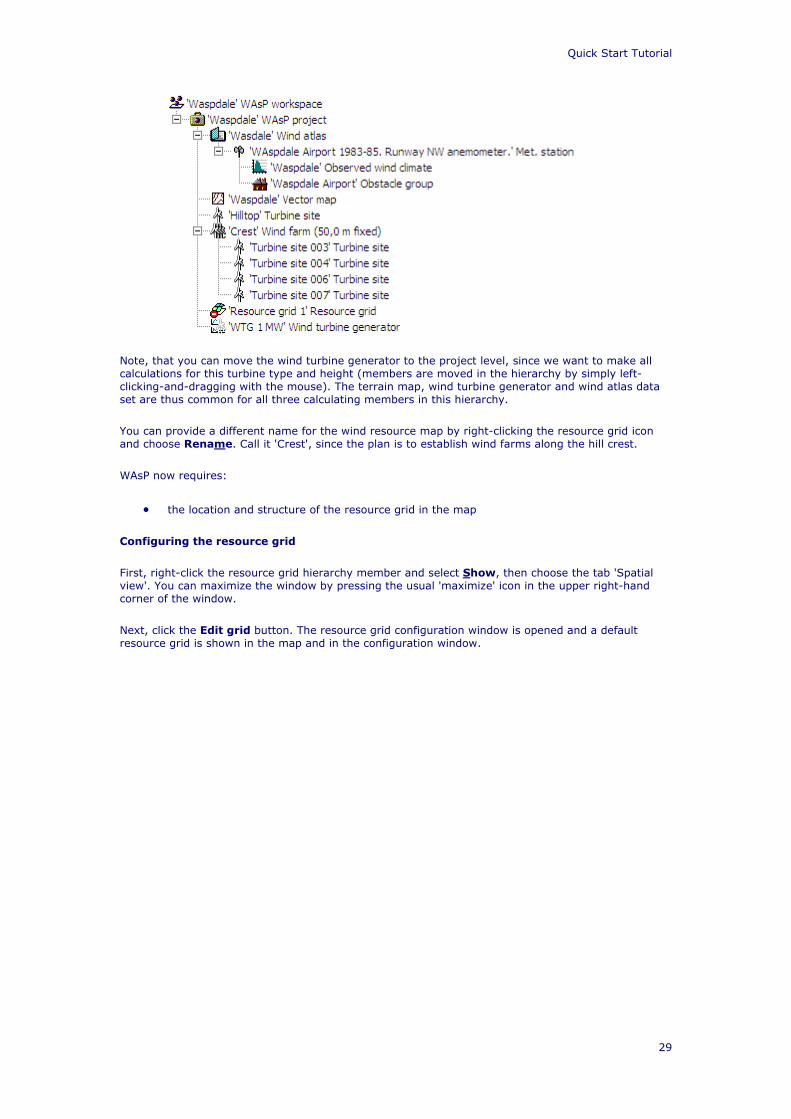
The workspace now looks like this:
Quick Start Tutorial
29
Note, that you can move the wind turbine generator to the project level, since we want to make all calculations for this turbine type and height (members are moved in the hierarchy by simply left-clicking-and-dragging with the mouse). The terrain map, wind turbine generator and wind atlas data set are thus common for all three calculating members in this hierarchy.
You can provide a different name for the wind resource map by right-clicking the resource grid icon and choose Rename. Call it 'Crest', since the plan is to establish wind farms along the hill crest.
WAsP now requires:
• the location and structure of the resource grid in the map
Configuring the resource grid
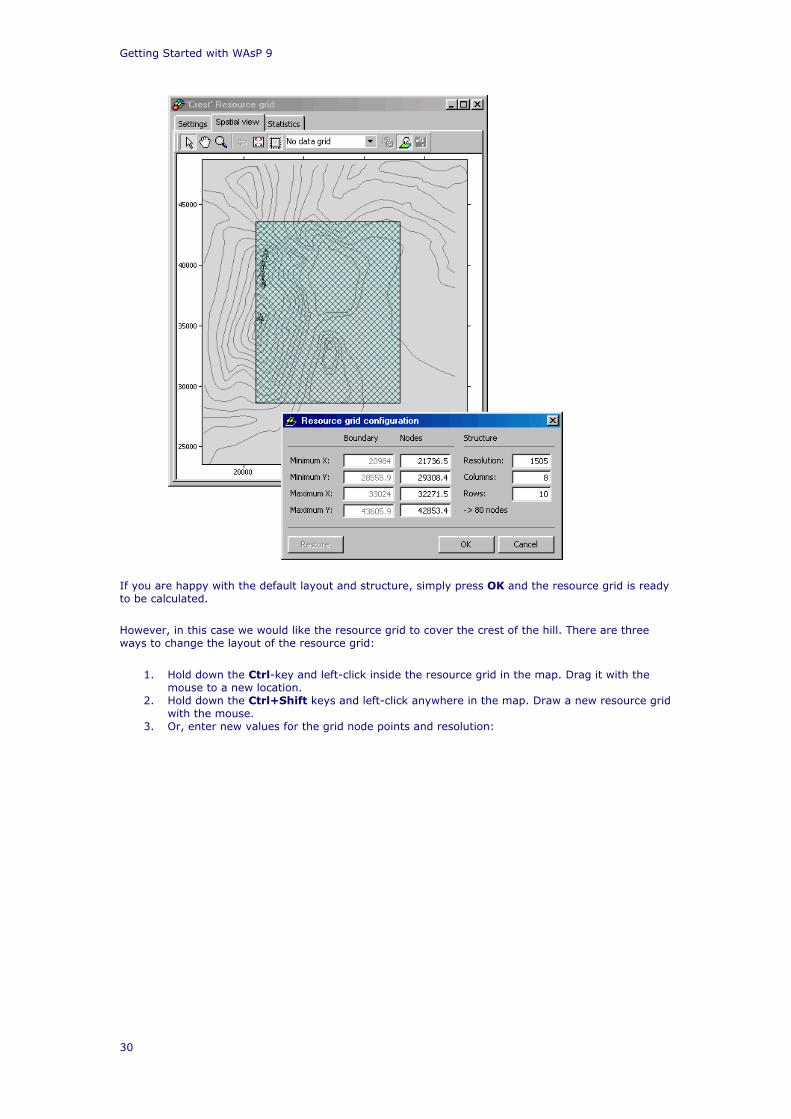
First, right-click the resource grid hierarchy member and select Show, then choose the tab 'Spatial view'. You can maximize the window by pressing the usual 'maximize' icon in the upper right-hand corner of the window.
Next, click the Edit grid button. The resource grid configuration window is opened and a default resource grid is shown in the map and in the configuration window.
Getting Started with WAsP 9
30
If you are happy with the default layout and structure, simply press OK and the resource grid is ready to be calculated.
However, in this case we would like the resource grid to cover the crest of the hill. There are three ways to change the layout of the resource grid:
1. Hold down the Ctrl-key and left-click inside the resource grid in the map. Drag it with the mouse to a new location.
2. Hold down the Ctrl+Shift keys and left-click anywhere in the map. Draw a new resource grid with the mouse.
3. Or, enter new values for the grid node points and resolution:
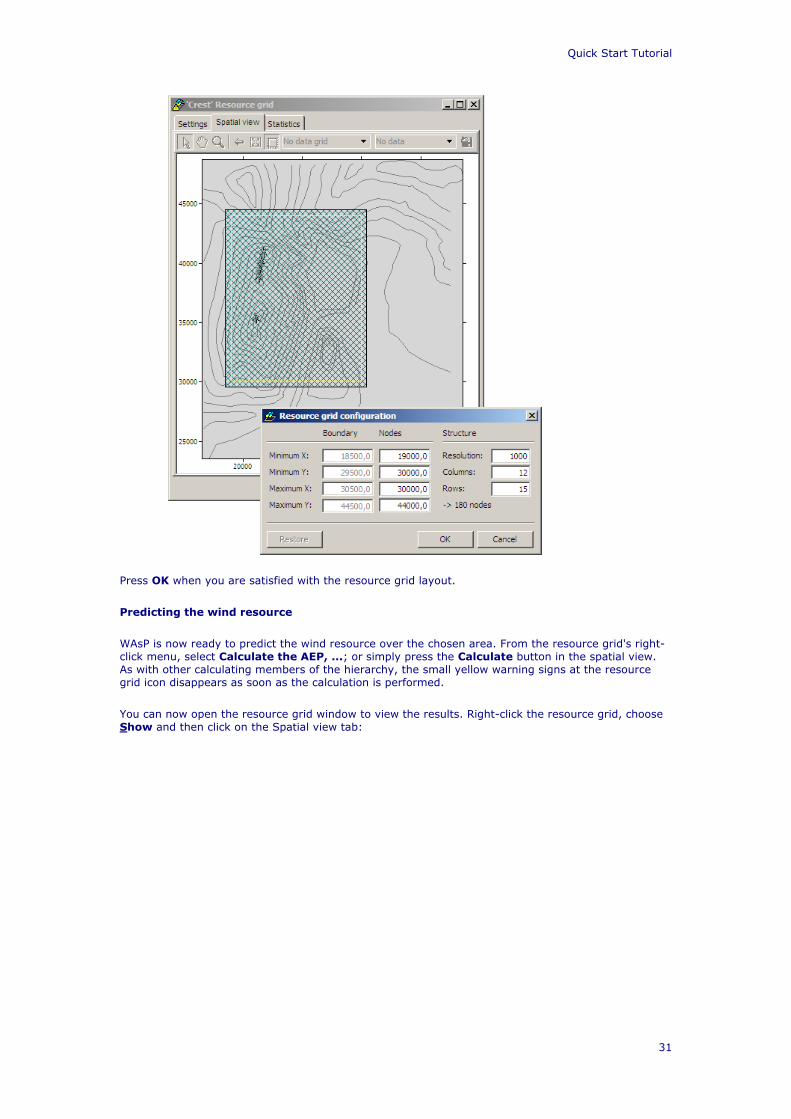
Quick Start Tutorial
31
Press OK when you are satisfied with the resource grid layout.
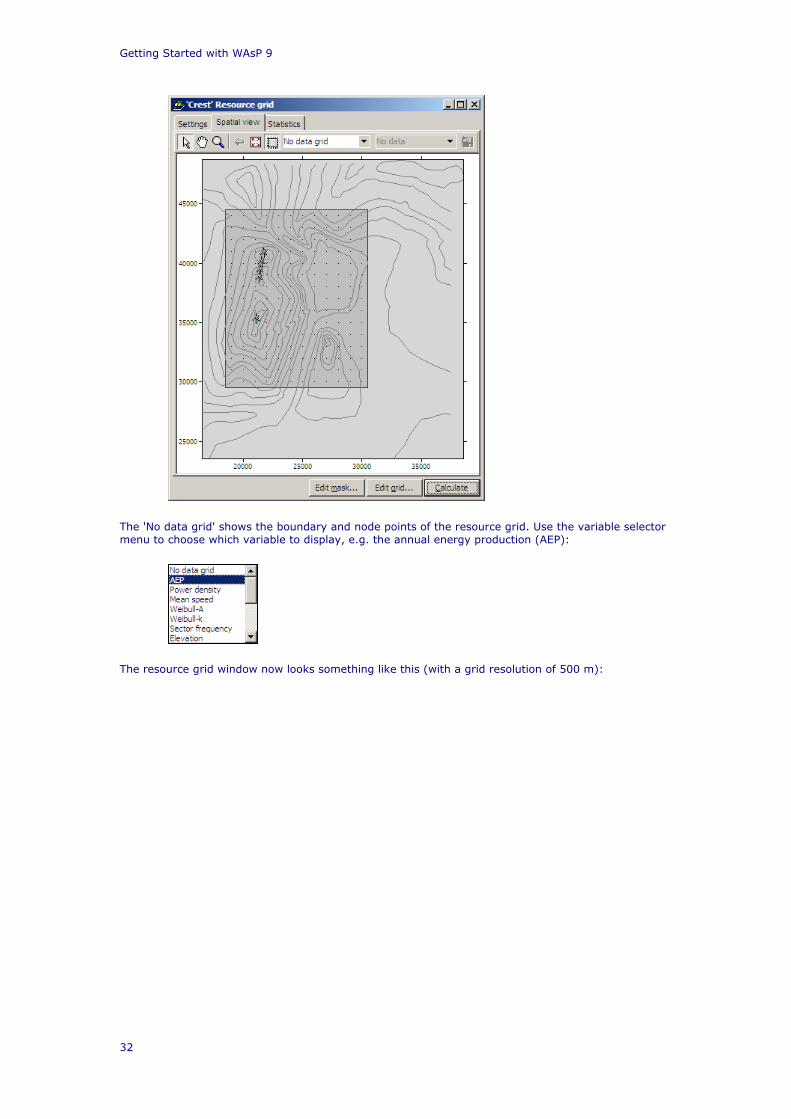
Predicting the wind resource
WAsP is now ready to predict the wind resource over the chosen area. From the resource grid's right-click menu, select Calculate the AEP, ...; or simply press the Calculate button in the spatial view. As with other calculating members of the hierarchy, the small yellow warning signs at the resource grid icon disappears as soon as the calculation is performed.
You can now open the resource grid window to view the results. Right-click the resource grid, choose Show and then click on the Spatial view tab:
Getting Started with WAsP 9
32
The 'No data grid' shows the boundary and node points of the resource grid. Use the variable selector menu to choose which variable to display, e.g. the annual energy production (AEP):
The resource grid window now looks something like this (with a grid resolution of 500 m):
Quick Start Tutorial
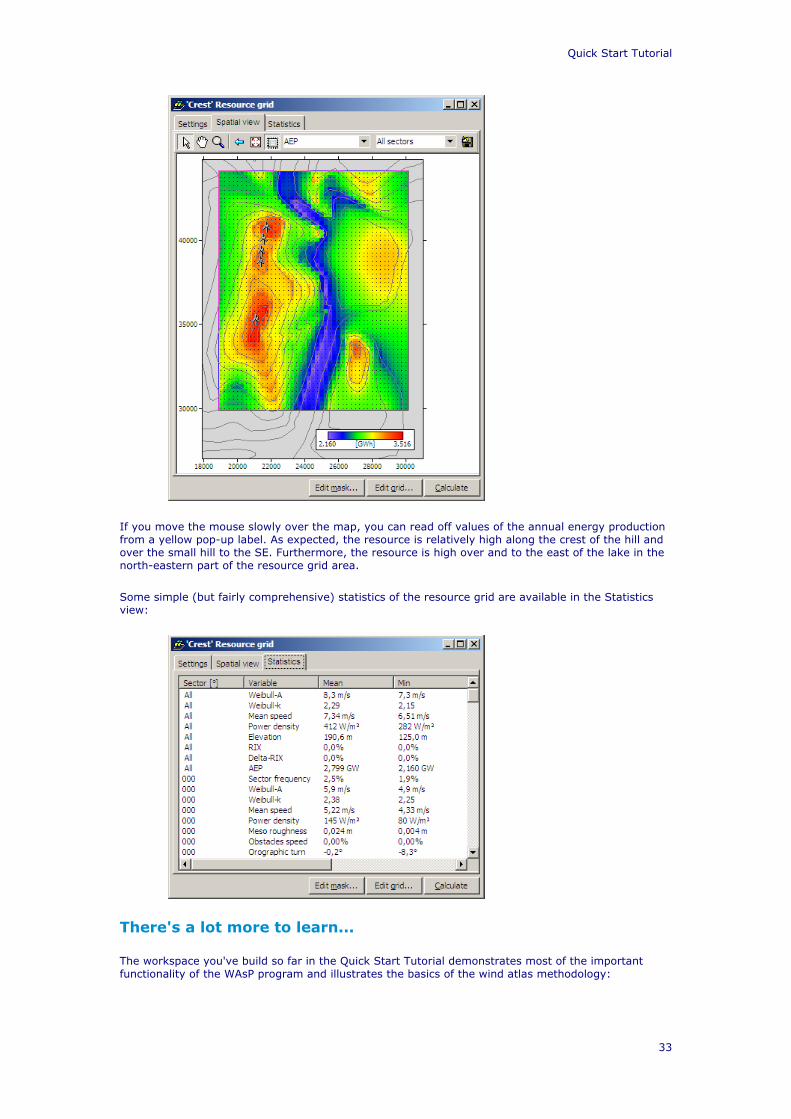
33
If you move the mouse slowly over the map, you can read off values of the annual energy production from a yellow pop-up label. As expected, the resource is relatively high along the crest of the hill and over the small hill to the SE. Furthermore, the resource is high over and to the east of the lake in the north-eastern part of the resource grid area.
Some simple (but fairly comprehensive) statistics of the resource grid are available in the Statistics view:
There's a lot more to learn...
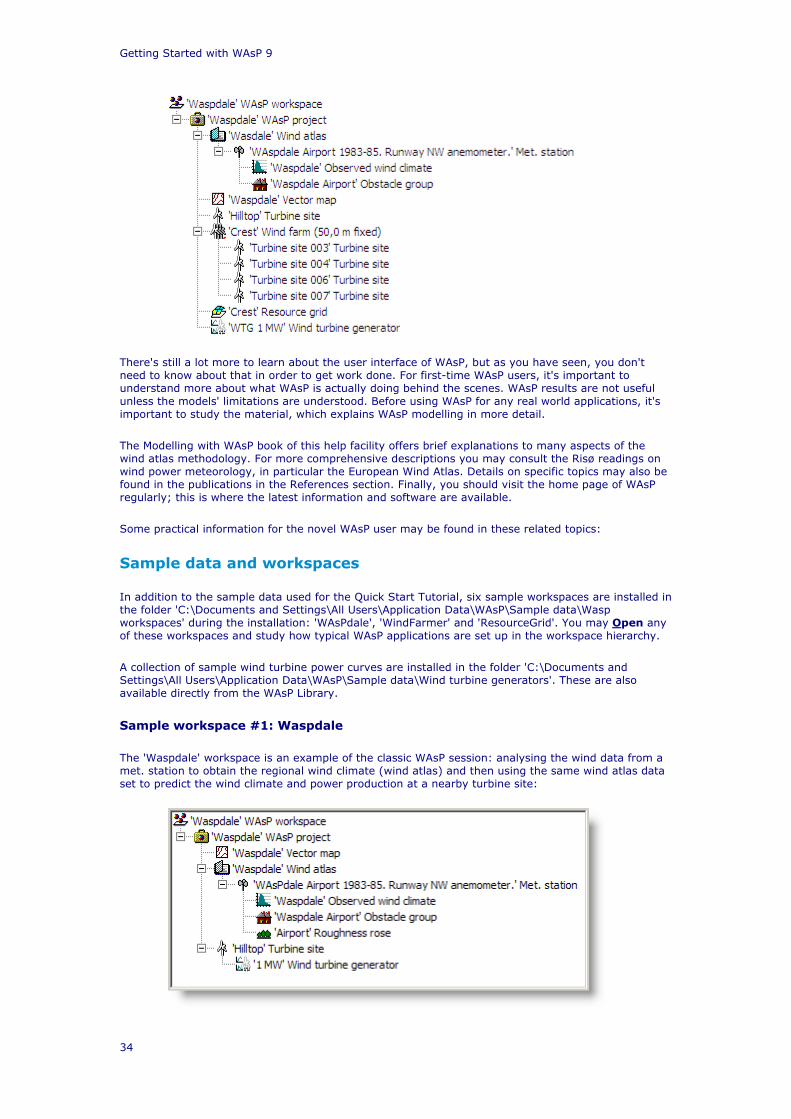
The workspace you've build so far in the Quick Start Tutorial demonstrates most of the important functionality of the WAsP program and illustrates the basics of the wind atlas methodology:
Getting Started with WAsP 9
34
There's still a lot more to learn about the user interface of WAsP, but as you have seen, you don't need to know about that in order to get work done. For first-time WAsP users, it's important to understand more about what WAsP is actually doing behind the scenes. WAsP results are not useful unless the models' limitations are understood. Before using WAsP for any real world applications, it's important to study the material, which explains WAsP modelling in more detail.
The Modelling with WAsP book of this help facility offers brief explanations to many aspects of the wind atlas methodology. For more comprehensive descriptions you may consult the Risø readings on wind power meteorology, in particular the European Wind Atlas. Details on specific topics may also be found in the publications in the References section. Finally, you should visit the home page of WAsP regularly; this is where the latest information and software are available.
Some practical information for the novel WAsP user may be found in these related topics:
Sample data and workspaces
In addition to the sample data used for the Quick Start Tutorial, six sample workspaces are installed in the folder 'C:\Documents and Settings\All Users\Application Data\WAsP\Sample data\Wasp workspaces' during the installation: 'WAsPdale', 'WindFarmer' and 'ResourceGrid'. You may Open any of these workspaces and study how typical WAsP applications are set up in the workspace hierarchy.
A collection of sample wind turbine power curves are installed in the folder 'C:\Documents and Settings\All Users\Application Data\WAsP\Sample data\Wind turbine generators'. These are also available directly from the WAsP Library.
Sample workspace #1: Waspdale
The 'Waspdale' workspace is an example of the classic WAsP session: analysing the wind data from a met. station to obtain the regional wind climate (wind atlas) and then using the same wind atlas data set to predict the wind climate and power production at a nearby turbine site:

Quick Start Tutorial
35
Note, that both the met. station and the turbine site are located in the same map; this is typical, but not necessary. The regional wind climate is assumed to be the same at both sites.
Sample workspace #2: Windfarm
The 'Windfarm' workspace is an example of another typical application: an existing wind atlas data set is used to predict the power production of several wind farms (or different layouts) in a given area:
Note, that the wind atlas, map and power curve are common to both wind farms.
Sample workspace #3: ResourceGrid
The 'ResourceGrid' workspace is an example of how to investigate the variation in the wind resource over an area: an existing wind atlas data set is used to predict the wind climate and power production of several wind turbine sites in a given area:
Again, the wind atlas, map and power curve are common to all the modelled wind turbine sites. The turbine sites are arranged in a regular grid and the resource grid can be used to establish a wind speed or power production map of the area – suitable for micro-siting of the actual turbine sites in a wind farm.

37
WAsP User's Guide
The WAsP user interface
Overview of the WAsP user interface
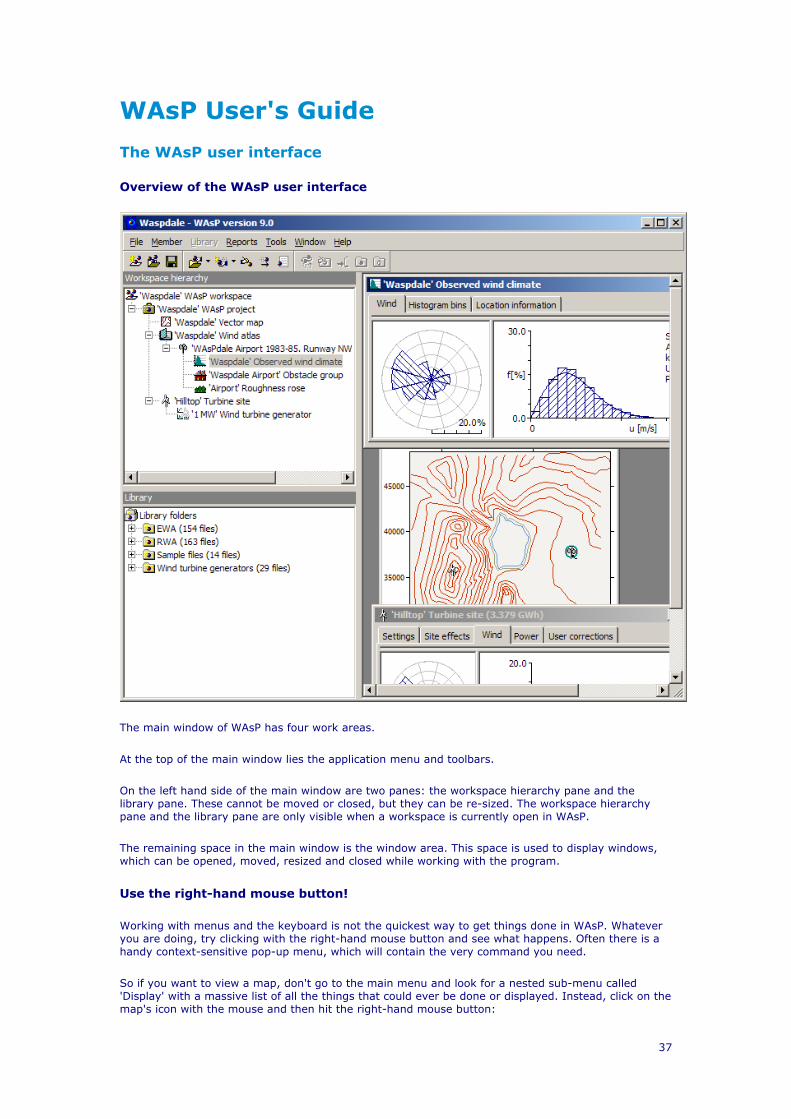
The main window of WAsP has four work areas.
At the top of the main window lies the application menu and toolbars.
On the left hand side of the main window are two panes: the workspace hierarchy pane and the library pane. These cannot be moved or closed, but they can be re-sized. The workspace hierarchy pane and the library pane are only visible when a workspace is currently open in WAsP.
The remaining space in the main window is the window area. This space is used to display windows, which can be opened, moved, resized and closed while working with the program.
Use the right-hand mouse button!
Working with menus and the keyboard is not the quickest way to get things done in WAsP. Whatever you are doing, try clicking with the right-hand mouse button and see what happens. Often there is a handy context-sensitive pop-up menu, which will contain the very command you need.
So if you want to view a map, don't go to the main menu and look for a nested sub-menu called 'Display' with a massive list of all the things that could ever be done or displayed. Instead, click on the map's icon with the mouse and then hit the right-hand mouse button:
Getting Started with WAsP 9
38
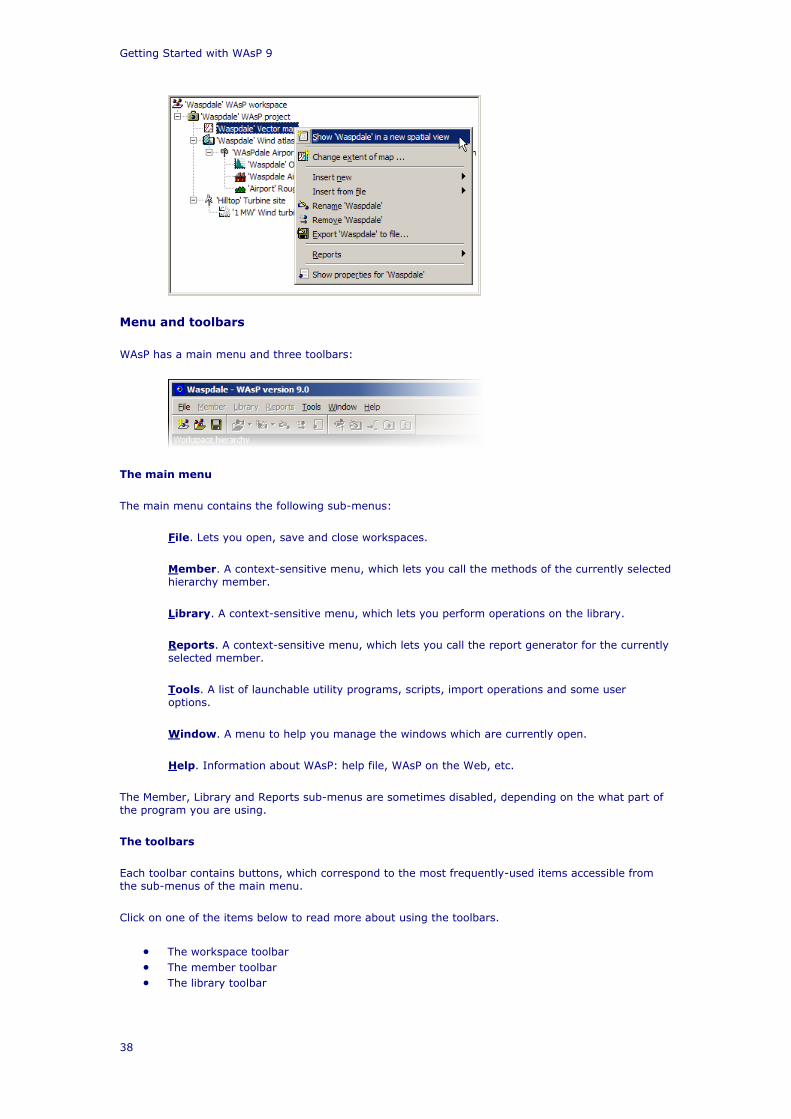
Menu and toolbars
WAsP has a main menu and three toolbars:
The main menu
The main menu contains the following sub-menus:
File. Lets you open, save and close workspaces.
Member. A context-sensitive menu, which lets you call the methods of the currently selected hierarchy member.
Library. A context-sensitive menu, which lets you perform operations on the library.
Reports. A context-sensitive menu, which lets you call the report generator for the currently selected member.
Tools. A list of launchable utility programs, scripts, import operations and some user options.
Window. A menu to help you manage the windows which are currently open.
Help. Information about WAsP: help file, WAsP on the Web, etc.
The Member, Library and Reports sub-menus are sometimes disabled, depending on the what part of the program you are using.
The toolbars
Each toolbar contains buttons, which correspond to the most frequently-used items accessible from the sub-menus of the main menu.
Click on one of the items below to read more about using the toolbars.
• The workspace toolbar • The member toolbar • The library toolbar
WAsP User's Guide
39
The toolbars can be moved around or closed. WAsP will remember the way that you organize the toolbars between runs.
WAsP workspaces
In WAsP, all work is performed within the context of a workspace. Workspaces can be created, saved and re-opened. When you start WAsP, you need to re-open or create a workspace before you can do any work.
A workspace contains one or more projects and may contain members (data files) that are not used in any project. The data files at the workspace level are thus not used for any calculations in any projects.
Workspaces are saved as single files, which have the extension 'wwh'. A workspace file contains the workspace data in a single ZIP archive. These files are small, self-contained, and guaranteed to be complete. A copy is a copy, so backing up is easy.
When a file is imported to WAsP to add a member to the hierarchy (for example a map or wind atlas), the data are copied into the workspace, and the original data file is thereafter independent. WAsP remembers where the file came from and every time a workspace is opened, the previously imported files are checked. If they're still where they originally were, and if their data have been updated since they were imported, then you get a warning and an opportunity to re-import them.
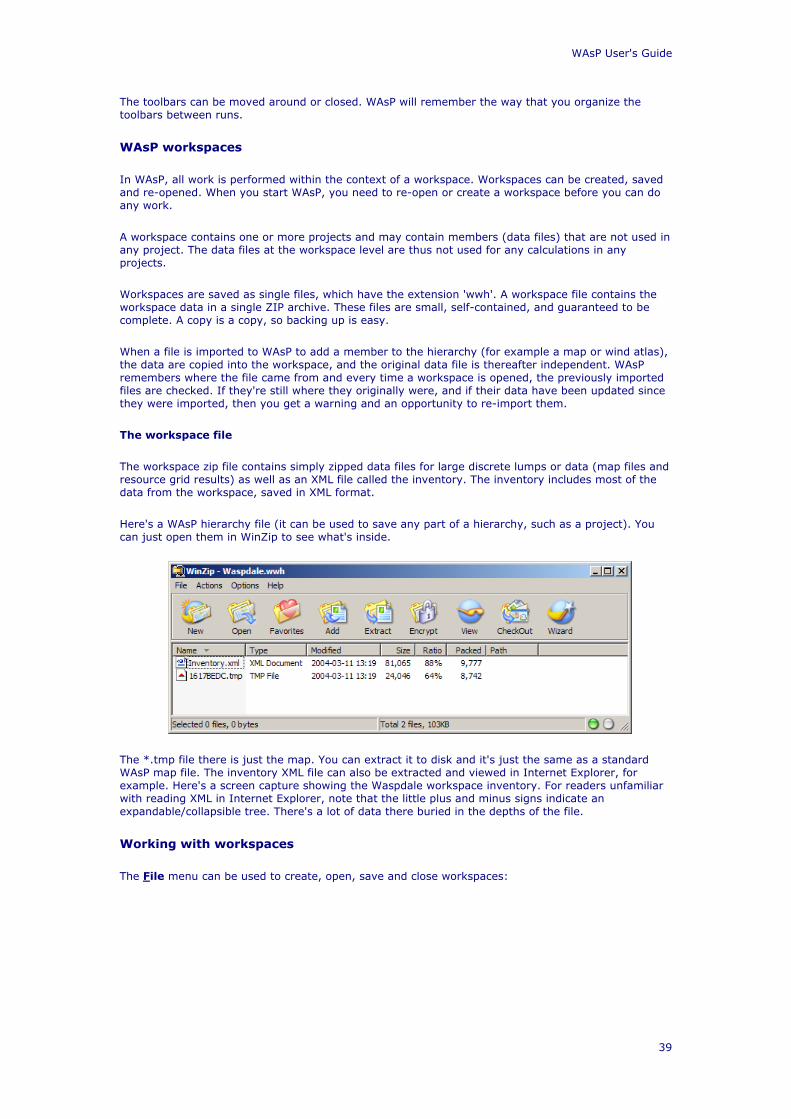
The workspace file
The workspace zip file contains simply zipped data files for large discrete lumps or data (map files and resource grid results) as well as an XML file called the inventory. The inventory includes most of the data from the workspace, saved in XML format.
Here's a WAsP hierarchy file (it can be used to save any part of a hierarchy, such as a project). You can just open them in WinZip to see what's inside.
The *.tmp file there is just the map. You can extract it to disk and it's just the same as a standard WAsP map file. The inventory XML file can also be extracted and viewed in Internet Explorer, for example. Here's a screen capture showing the Waspdale workspace inventory. For readers unfamiliar with reading XML in Internet Explorer, note that the little plus and minus signs indicate an expandable/collapsible tree. There's a lot of data there buried in the depths of the file.
Working with workspaces
The File menu can be used to create, open, save and close workspaces:
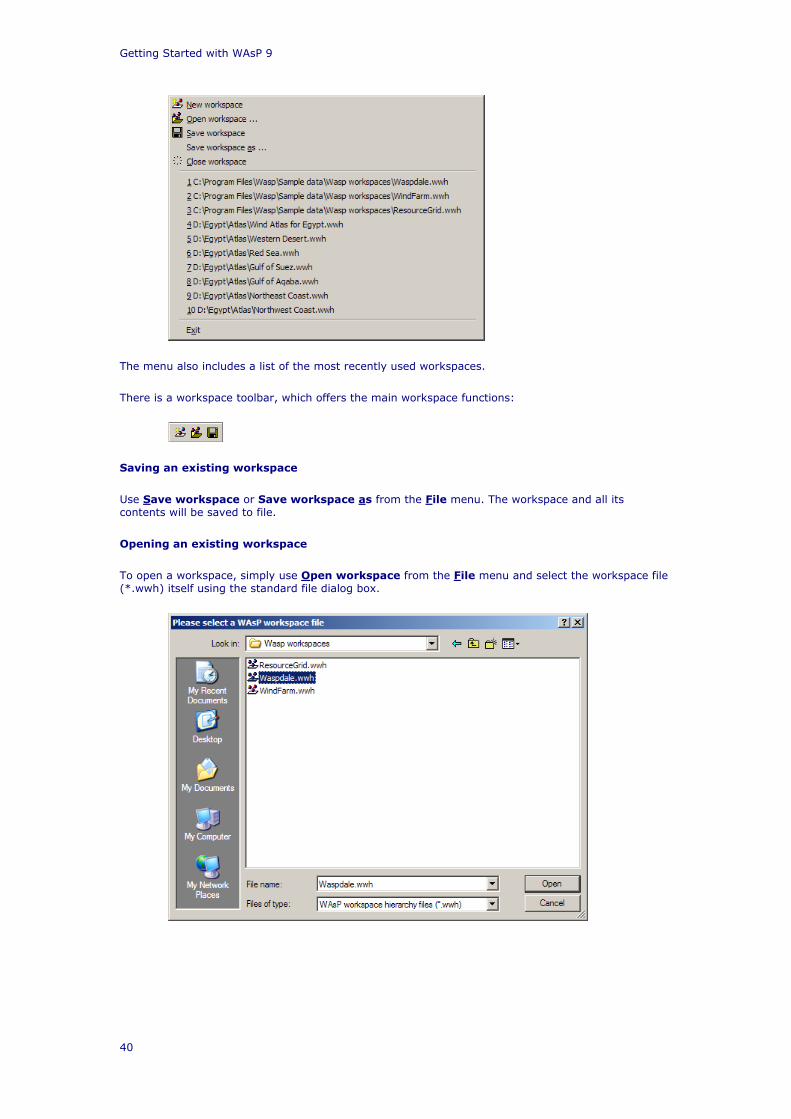
Getting Started with WAsP 9
40
The menu also includes a list of the most recently used workspaces.
There is a workspace toolbar, which offers the main workspace functions:
Saving an existing workspace
Use Save workspace or Save workspace as from the File menu. The workspace and all its contents will be saved to file.
Opening an existing workspace
To open a workspace, simply use Open workspace from the File menu and select the workspace file (*.wwh) itself using the standard file dialog box.
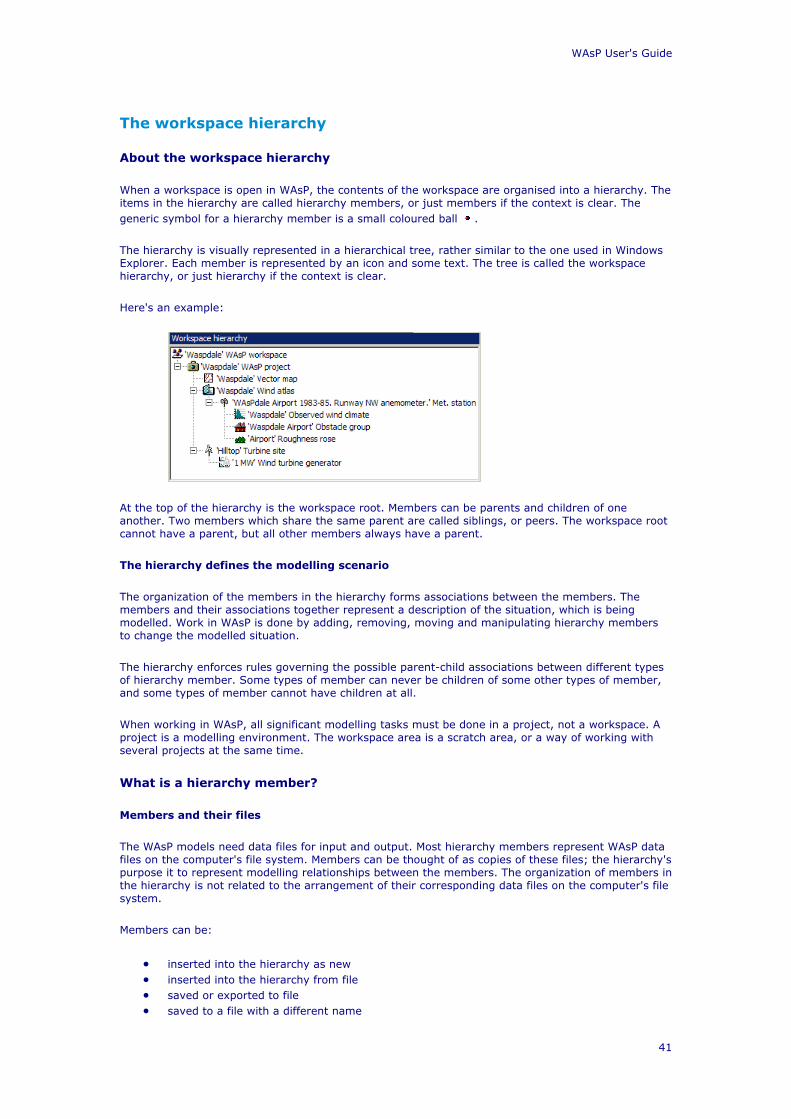
WAsP User's Guide
41
The workspace hierarchy
About the workspace hierarchy
When a workspace is open in WAsP, the contents of the workspace are organised into a hierarchy. The items in the hierarchy are called hierarchy members, or just members if the context is clear. The generic symbol for a hierarchy member is a small coloured ball .
The hierarchy is visually represented in a hierarchical tree, rather similar to the one used in Windows Explorer. Each member is represented by an icon and some text. The tree is called the workspace hierarchy, or just hierarchy if the context is clear.
Here's an example:
At the top of the hierarchy is the workspace root. Members can be parents and children of one another. Two members which share the same parent are called siblings, or peers. The workspace root cannot have a parent, but all other members always have a parent.
The hierarchy defines the modelling scenario
The organization of the members in the hierarchy forms associations between the members. The members and their associations together represent a description of the situation, which is being modelled. Work in WAsP is done by adding, removing, moving and manipulating hierarchy members to change the modelled situation.
The hierarchy enforces rules governing the possible parent-child associations between different types of hierarchy member. Some types of member can never be children of some other types of member, and some types of member cannot have children at all.
When working in WAsP, all significant modelling tasks must be done in a project, not a workspace. A project is a modelling environment. The workspace area is a scratch area, or a way of working with several projects at the same time.
What is a hierarchy member?
Members and their files
The WAsP models need data files for input and output. Most hierarchy members represent WAsP data files on the computer's file system. Members can be thought of as copies of these files; the hierarchy's purpose it to represent modelling relationships between the members. The organization of members in the hierarchy is not related to the arrangement of their corresponding data files on the computer's file system.
Members can be:
• inserted into the hierarchy as new • inserted into the hierarchy from file • saved or exported to file • saved to a file with a different name
Getting Started with WAsP 9
42
• removed from the hierarchy
When WAsP works with hierarchy members, nothing is written to the members' original file contents until the changes are explicitly exported. This is because WAsP works with copies of the data files or, for some hierarchy members, simply holds all the information in memory.
When a member is removed from the hierarchy, the corresponding file (from which is was inserted) is not deleted from the file system.
Different members, different rôles
Some members preserve information about the arrangement of their children. When these members are re-opened, they automatically re-open all of their children into the workspace too. The workspace root itself is one such member, so when a workspace is re-opened, all of the members which were in the workspace the last time it was saved will be re-opened and their relationships restored. Projects also preserve information about their children between runs.
Other members are largely responsible for holding data, and do not preserve information about the organization of the hierarchy. These hierarchy members have windows which can be opened in the right hand side of the main window, allowing their data to be viewed and, in some cases, manipulated.
Introducing the hierarchy members
There are several types of hierarchy member, which can appear in the workspace. The list below provides a brief introduction to them. They are explained in more detail elsewhere.
Workspace root
There is always one (and only one) root in each workspace. It sits at the top of the hierarchy and has no parent. The workspace root can have members of any type as its children, but. When a previously saved workspace is opened, all of the children of the workspace are also re-opened.
Project
Projects are used to manage related groups of hierarchy members. Projects offer several facilities, which make it easy to perform operations that are relevant to all of the members of the project. Projects are always children of the workspace root. When a previously saved project is opened, all of the children of the project are also re-opened, so entire projects can be saved and used in other workspaces.
Vector map
WAsP uses vector maps to get information about the orography and roughness characteristics of the landscape in which the modelling is being done. Maps can appear in various places in the workspace hierarchy, but typically each project will have one map.
Spatial image
Spatial images are bitmap image files which can be used as map underlays. They can be inserted in various places in the hierarchy and more than one can be associated with the same vector map.
, Wind atlas (regional wind climate)
Wind atlases (or regional wind climates) are the central members in the hierarchy. A WAsP wind atlas contains data describing a site-independent characterization of the wind climate for an area. The WAsP models are devoted to analysing wind data collected from met. stations to produce wind atlases and applying the atlas to estimate the wind climate (and power production) at turbine sites.

WAsP User's Guide
43
A wind atlas is illustrated using a closed book icon if the atlas is simply a static data file. An open book icon is used if the wind atlas is associated with a met. station which might re-calculate and thereby change the atlas.
Met. station
A meteorological station (met. station for short) is used to calculate a wind atlas. It represents a data collection site located somewhere in an associated map. A met. station does not have any data except its location in the map and user-specified corrections. It is associated with a wind climate which has been observed at the station. It may be associated with a list of obstacles surrounding the station and a description of the roughness lengths of the surrounding area.
A set of user corrections can be associated with a met. station. It provides a way of informing WAsP about some site-specific adjustments which cannot be described using the other hierarchy members.
Observed wind climate
A summary of the wind data recorded at a met. station is called an observed wind climate (or OWC for short). The summary consists of a wind rose (wind direction frequency distribution) and several wind speed frequency distributions – one for each sector.
Turbine site
A turbine site is used to estimate the power production which would result from locating a turbine somewhere in an associated map. A turbine site does not have any data except its location in the map, the hub height of the turbine and user-specified corrections. A turbine site may be associated with a list of obstacles surrounding the station and also a description of the roughness lengths of the surrounding area.
A set of user corrections can be associated with a turbine site. It provides a way of informing WAsP about some site-specific adjustments which cannot be described using the other hierarchy members.
Turbine site group
Wind farms can now have sub-groups into which turbine sites can be organised. These sub-groups are called 'Turbine site groups'. They are similar to wind farms, but wake calculations are not available.
Wind farm
Wind farms are collections of turbine sites which are calculated in a batch. Wind farms offer a convenient way to work with several sites together. In addition to estimates of the wind climate and power production of the wind farm and wind turbines, the wind farm member also holds information about the wake losses in the wind farm.
Reference site
Reference sites are used to support the calculation of a wind farm power curve, i.e. the production of a given wind farm as a function of the wind speed and direction at the reference site. Reference sites are similar to turbine sites, since they calculate a predicted wind climate for a particular point.
Resource grid
Resource grids are collections of 'light-weight' turbine sites calculated in a batch, but here the sites are arranged in a regular grid covering an area. The extension of the grid and the grid cell size may be chosen to map the wind climate or wind resource anywhere in the map – and with as much detail as is required.
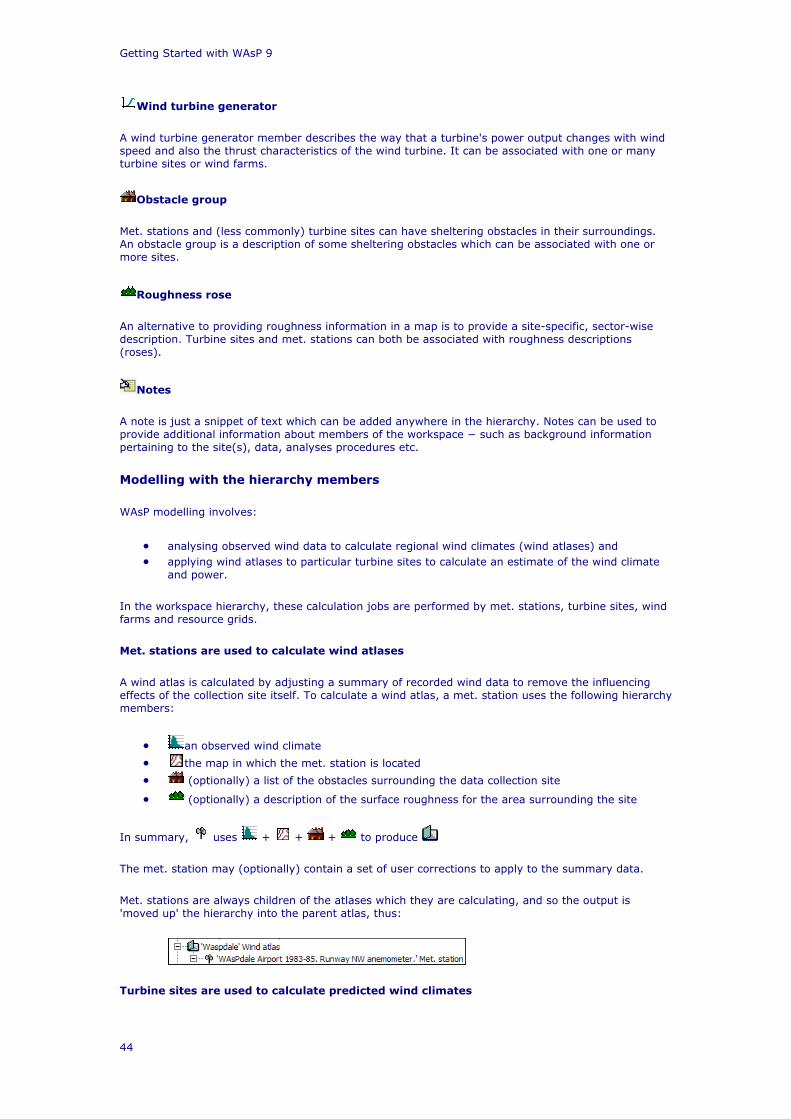
Getting Started with WAsP 9
44
Wind turbine generator
A wind turbine generator member describes the way that a turbine's power output changes with wind speed and also the thrust characteristics of the wind turbine. It can be associated with one or many turbine sites or wind farms.
Obstacle group
Met. stations and (less commonly) turbine sites can have sheltering obstacles in their surroundings. An obstacle group is a description of some sheltering obstacles which can be associated with one or more sites.
Roughness rose
An alternative to providing roughness information in a map is to provide a site-specific, sector-wise description. Turbine sites and met. stations can both be associated with roughness descriptions (roses).
Notes
A note is just a snippet of text which can be added anywhere in the hierarchy. Notes can be used to provide additional information about members of the workspace − such as background information pertaining to the site(s), data, analyses procedures etc.
Modelling with the hierarchy members
WAsP modelling involves:
• analysing observed wind data to calculate regional wind climates (wind atlases) and • applying wind atlases to particular turbine sites to calculate an estimate of the wind climate
and power.
In the workspace hierarchy, these calculation jobs are performed by met. stations, turbine sites, wind farms and resource grids.
Met. stations are used to calculate wind atlases
A wind atlas is calculated by adjusting a summary of recorded wind data to remove the influencing effects of the collection site itself. To calculate a wind atlas, a met. station uses the following hierarchy members:
• an observed wind climate
• the map in which the met. station is located
• (optionally) a list of the obstacles surrounding the data collection site
• (optionally) a description of the surface roughness for the area surrounding the site
In summary, uses + + + to produce
The met. station may (optionally) contain a set of user corrections to apply to the summary data.
Met. stations are always children of the atlases which they are calculating, and so the output is 'moved up' the hierarchy into the parent atlas, thus:
Turbine sites are used to calculate predicted wind climates
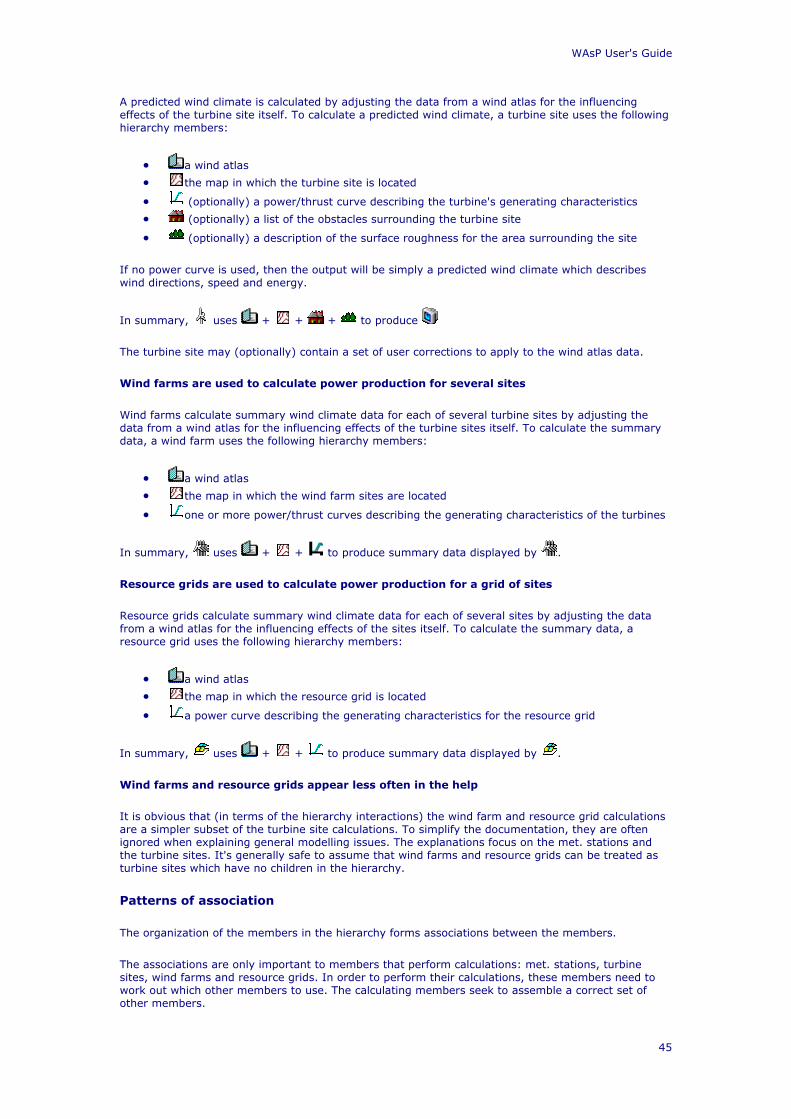
WAsP User's Guide
45
A predicted wind climate is calculated by adjusting the data from a wind atlas for the influencing effects of the turbine site itself. To calculate a predicted wind climate, a turbine site uses the following hierarchy members:
• a wind atlas
• the map in which the turbine site is located
• (optionally) a power/thrust curve describing the turbine's generating characteristics
• (optionally) a list of the obstacles surrounding the turbine site
• (optionally) a description of the surface roughness for the area surrounding the site
If no power curve is used, then the output will be simply a predicted wind climate which describes wind directions, speed and energy.
In summary, uses + + + to produce
The turbine site may (optionally) contain a set of user corrections to apply to the wind atlas data.
Wind farms are used to calculate power production for several sites
Wind farms calculate summary wind climate data for each of several turbine sites by adjusting the data from a wind atlas for the influencing effects of the turbine sites itself. To calculate the summary data, a wind farm uses the following hierarchy members:
• a wind atlas
• the map in which the wind farm sites are located
• one or more power/thrust curves describing the generating characteristics of the turbines
In summary, uses + + to produce summary data displayed by .
Resource grids are used to calculate power production for a grid of sites
Resource grids calculate summary wind climate data for each of several sites by adjusting the data from a wind atlas for the influencing effects of the sites itself. To calculate the summary data, a resource grid uses the following hierarchy members:
• a wind atlas
• the map in which the resource grid is located
• a power curve describing the generating characteristics for the resource grid
In summary, uses + + to produce summary data displayed by .
Wind farms and resource grids appear less often in the help
It is obvious that (in terms of the hierarchy interactions) the wind farm and resource grid calculations are a simpler subset of the turbine site calculations. To simplify the documentation, they are often ignored when explaining general modelling issues. The explanations focus on the met. stations and the turbine sites. It's generally safe to assume that wind farms and resource grids can be treated as turbine sites which have no children in the hierarchy.
Patterns of association
The organization of the members in the hierarchy forms associations between the members.
The associations are only important to members that perform calculations: met. stations, turbine sites, wind farms and resource grids. In order to perform their calculations, these members need to work out which other members to use. The calculating members seek to assemble a correct set of other members.
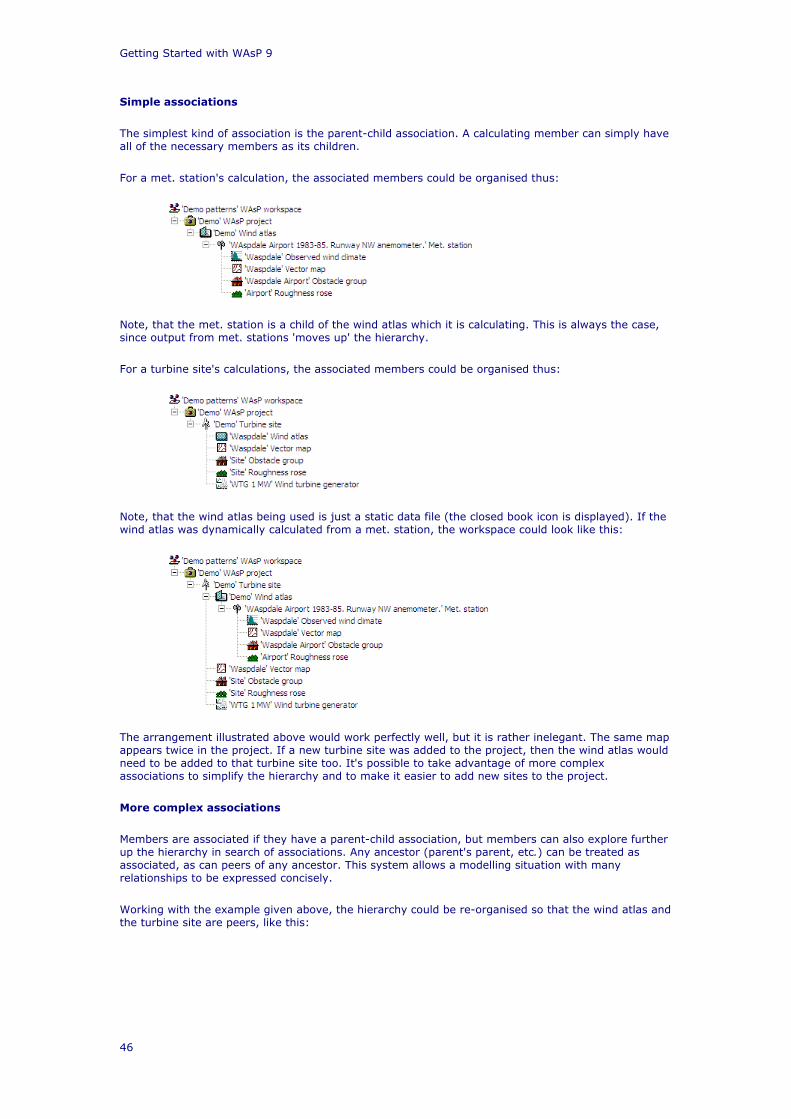
Getting Started with WAsP 9
46
Simple associations
The simplest kind of association is the parent-child association. A calculating member can simply have all of the necessary members as its children.
For a met. station's calculation, the associated members could be organised thus:
Note, that the met. station is a child of the wind atlas which it is calculating. This is always the case, since output from met. stations 'moves up' the hierarchy.
For a turbine site's calculations, the associated members could be organised thus:
Note, that the wind atlas being used is just a static data file (the closed book icon is displayed). If the wind atlas was dynamically calculated from a met. station, the workspace could look like this:
The arrangement illustrated above would work perfectly well, but it is rather inelegant. The same map appears twice in the project. If a new turbine site was added to the project, then the wind atlas would need to be added to that turbine site too. It's possible to take advantage of more complex associations to simplify the hierarchy and to make it easier to add new sites to the project.
More complex associations
Members are associated if they have a parent-child association, but members can also explore further up the hierarchy in search of associations. Any ancestor (parent's parent, etc.) can be treated as associated, as can peers of any ancestor. This system allows a modelling situation with many relationships to be expressed concisely.
Working with the example given above, the hierarchy could be re-organised so that the wind atlas and the turbine site are peers, like this:

WAsP User's Guide
47
Modelling output is moving up the hierarchy because the met. station is writing results to the atlas and along the hierarchy because the atlas and the turbine site are peers. This pattern allows more turbine sites to be added to the project without needing to replicate the atlas, as follows:
In the hierarchy illustrated above, the same map appears in three places. By making the map a peer of the turbine sites and wind atlas, it can be shared by the turbine sites and the met. station. The same power curve also appears twice. It, too, can be made a peer of the two turbine sites and can then be used by both of them, thus:
It is not possible for sites to share site-specific information, such as obstacle lists and observed wind climates which by definition are unique to the site itself.
If a member is associated with more than one member of the same type, then the nearest relative is the one used. This allows a group of peers to use the same member, but one or more of them can use a different member. For example, several turbine sites could be using the same power curve but one of them could use a different type, as shown in the hierarchy illustrated below:
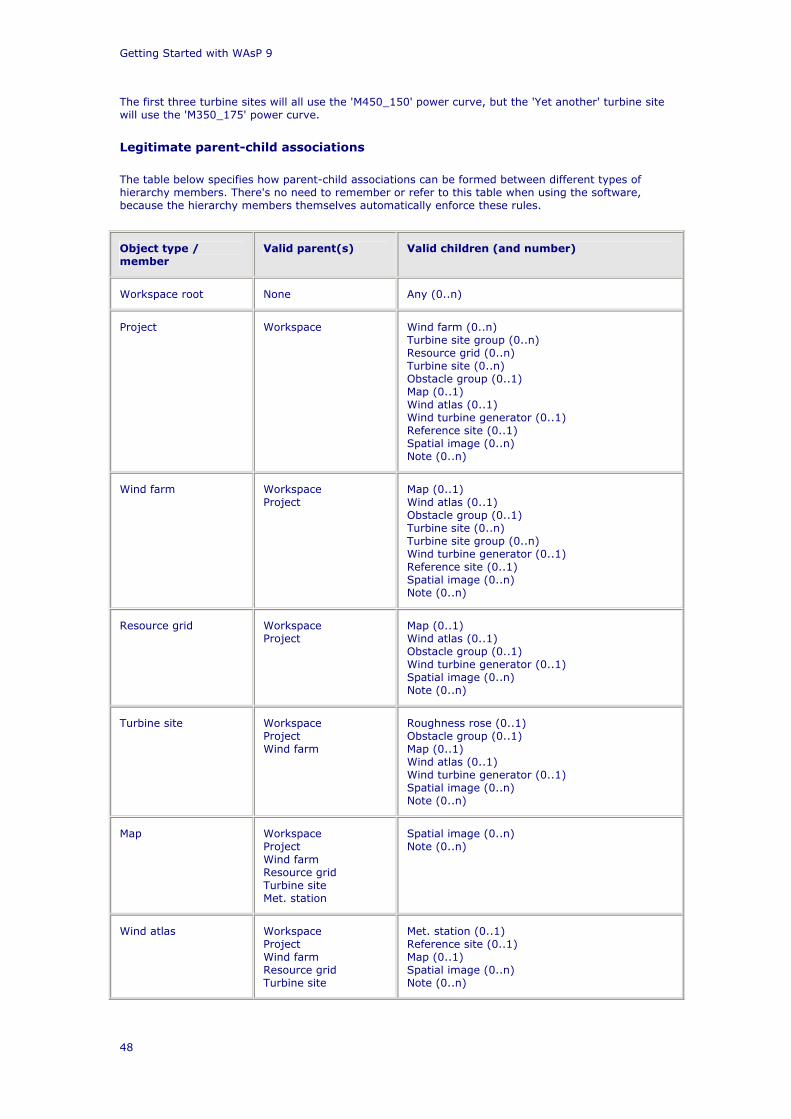
Getting Started with WAsP 9
48
The first three turbine sites will all use the 'M450_150' power curve, but the 'Yet another' turbine site will use the 'M350_175' power curve.
Legitimate parent-child associations
The table below specifies how parent-child associations can be formed between different types of hierarchy members. There's no need to remember or refer to this table when using the software, because the hierarchy members themselves automatically enforce these rules.
Object type / member
Valid parent(s) Valid children (and number)
Workspace root None Any (0..n)
Project Workspace Wind farm (0..n) Turbine site group (0..n) Resource grid (0..n) Turbine site (0..n) Obstacle group (0..1) Map (0..1) Wind atlas (0..1) Wind turbine generator (0..1) Reference site (0..1) Spatial image (0..n) Note (0..n)
Wind farm Workspace Project
Map (0..1) Wind atlas (0..1) Obstacle group (0..1) Turbine site (0..n) Turbine site group (0..n) Wind turbine generator (0..1) Reference site (0..1) Spatial image (0..n) Note (0..n)
Resource grid Workspace Project
Map (0..1) Wind atlas (0..1) Obstacle group (0..1) Wind turbine generator (0..1) Spatial image (0..n) Note (0..n)
Turbine site Workspace Project Wind farm
Roughness rose (0..1) Obstacle group (0..1) Map (0..1) Wind atlas (0..1) Wind turbine generator (0..1) Spatial image (0..n) Note (0..n)
Map Workspace Project Wind farm Resource grid Turbine site Met. station
Spatial image (0..n) Note (0..n)
Wind atlas Workspace Project Wind farm Resource grid Turbine site
Met. station (0..1) Reference site (0..1) Map (0..1) Spatial image (0..n) Note (0..n)

WAsP User's Guide
49
Met. station Workspace Wind atlas
Observed wind climate (0..1) Roughness rose (0..1) Obstacle group (0..1) Map (0..1) Spatial image (0..n) Note (0..n)
Observed wind climate Workspace Met. station
Note (0..n)
Roughness rose Workspace Turbine site Met. station
Note (0..n)
Obstacle group Workspace Project Wind farm Turbine site Met. station
Note (0..n) Spatial image (0..n)
Wind turbine generator
Workspace Project Wind farm Resource grid Turbine site
Note (0..n)
Note Any other objects Note (0..n)
Reference site Workspace Roughness rose (0..1) Obstacle group (0..1) Map (0..1) Wind atlas (0..1) Spatial image (0..n) Note (0..n)
Turbine site group Workspace Map (0..1) Wind atlas (0..1) Obstacle group (0..1) Turbine site (0..n) Turbine site group (0..n) Wind turbine generator (0..1) Reference site (0..1) Spatial image (0..n) Note (0..n)
Spatial image Workspace Note (0..n)
Associated members have the same number of sectors
The WAsP models represent the world in sectors. The number of sectors used for the modelling is not fixed but data structured with 8 sectors is of course incompatible data structured with 12 sectors. So, all associated hierarchy members which are being used together for modelling must have the same number of sectors.
The number of sectors used is determined by the structure of the observed wind climate, since this feeds directly into the wind atlas and then on through the turbine sites to determine the structure of the predicted wind climates:

Getting Started with WAsP 9
50
The number of sectors in an observed wind climate is determined when it is first generated from raw data using the OWC Wizard.
Working with the hierarchy
Hierarchy members' methods
The member's menus
Each hierarchy member has a menu of commands, or methods. This menu is headed Member and appears as a sub-menu of the main menu. It further appears as a pop-up menu if a member is clicked with the right mouse button.
This menu is the most important tool for working with WAsP. Depending on which hierarchy member is selected, the contents of the menu presented will be different. Some members do not offer all of these methods, and some offer extra methods in addition to those shown. The illustration below shows a basic member's menu (for a wind atlas) and a project members menu.
Wind atlas member's menu
Project member's menu
The members' toolbar
There is also a hierarchy member toolbar which offers buttons for some of the most common hierarchy member methods:
The buttons (from left to right) correspond to the menu items Insert from file, Insert new, Rename, Remove and Show properties.
Viewing a member's interface window
Any member which has its own user interface window will have a method called Show at the top of its menu. Clicking this will bring up the window in the window area on the right-hand side of the main window. It's possible to have several windows open at once and to leave them open while doing other work.
Inserting members
To insert a member to the workspace hierarchy
• Select the hierarchy member which will be the parent of the member to be inserted.

WAsP User's Guide
51
• From the parent member's menu, select either Insert from file or Insert new. A secondary menu will appear, listing the types of hierarchy member which are legitimate children of the parent member. The 'from file' insertion menu looks like this (for a met. station):
• Select the type of member to insert. If the Insert from file menu was used, then a file selection dialog box will appear. Select the file you wish to use to create the hierarchy member. If the Insert new menu was used, then the new member will be created immediately.
• The new member will be added to the hierarchy as a child of the parent member.
The member-specific insertion menus
Depending on the type of parent member, the insertion sub-menus will contain different types of insertable member. Some members cannot be inserted as new members, and can only be inserted from file, so sometimes the Insert from file or Insert new sub-menus contain different lists.
Maps and wind turbine generators cannot be created or edited from within the WAsP application, so these types of member never appear on the Insert new sub-menu.
Although WAsP cannot create and edit observed wind climates directly, observed wind climates do appear on the 'insert new' menu for met. stations. When an observed wind climate hierarchy member is inserted as new, the OWC Wizard is automatically launched to guide you through the process of creating a new observed wind climate file.
Inserting from the member methods toolbar
Clicking on one of the two insertion buttons on the member methods toolbar also causes the a list of insertable member types to be displayed as a drop-down list.
Inserting from the library
An alternative way to insert members from file is to open and drag them from the library.
Moving members
Moving members from one place in the hierarchy to another is a simple matter of dragging with the mouse.
As the dragged hierarchy member is moved over potential 'target' parent members, the mouse pointer changes. If it would be impossible for the dragged member to be a child of the target, a 'no drop' icon is displayed, otherwise, the mouse pointer is the same as the hierarchy member being dragged.
This is what the 'no-drop' icon looks like.
If a member is dropped onto a parent which cannot accept it, the move operation is not completed.
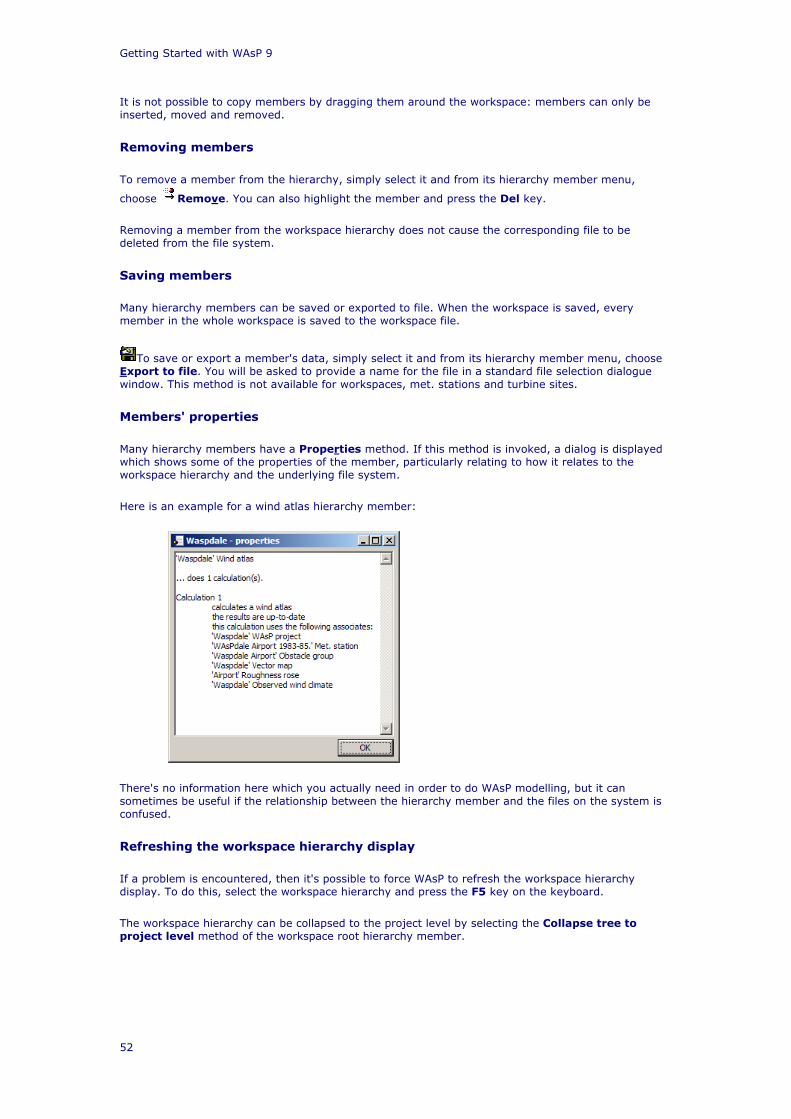
Getting Started with WAsP 9
52
It is not possible to copy members by dragging them around the workspace: members can only be inserted, moved and removed.
Removing members
To remove a member from the hierarchy, simply select it and from its hierarchy member menu,
choose Remove. You can also highlight the member and press the Del key.
Removing a member from the workspace hierarchy does not cause the corresponding file to be deleted from the file system.
Saving members
Many hierarchy members can be saved or exported to file. When the workspace is saved, every member in the whole workspace is saved to the workspace file.
To save or export a member's data, simply select it and from its hierarchy member menu, choose Export to file. You will be asked to provide a name for the file in a standard file selection dialogue window. This method is not available for workspaces, met. stations and turbine sites.
Members' properties
Many hierarchy members have a Properties method. If this method is invoked, a dialog is displayed which shows some of the properties of the member, particularly relating to how it relates to the workspace hierarchy and the underlying file system.
Here is an example for a wind atlas hierarchy member:
There's no information here which you actually need in order to do WAsP modelling, but it can sometimes be useful if the relationship between the hierarchy member and the files on the system is confused.
Refreshing the workspace hierarchy display
If a problem is encountered, then it's possible to force WAsP to refresh the workspace hierarchy display. To do this, select the workspace hierarchy and press the F5 key on the keyboard.
The workspace hierarchy can be collapsed to the project level by selecting the Collapse tree to project level method of the workspace root hierarchy member.

WAsP User's Guide
53
Function keys
A few keyboard function keys and key combinations are recognised by WAsP:
F1 invoke context-sensitive help for the active window.
F2 start rename operation for selected hierarchy member.
F5 refresh the workspace hierarchy and library displays.
F9 do all feasible calculations for selected hierarchy member.
Del delete the highlighted item.
Space bar
scroll the selection of a highlighted item, e.g. through the sectors in the OWC or PWC displays.
Ctrl+C copy the contents of the active window to the Windows clipboard.
Ctrl+V paste the contents of the Windows clipboard.
Mouse keys
Left-click selection, e.g. of hierarchy member.
Right-click invoke menu for selected hierarchy member.
Double-click
Carrying on…
Read on in the electronic version of the WAsP User’s Guide and on-line help system! Here, you can read much more about:
• The hierarchy members • The Library pane • Program options

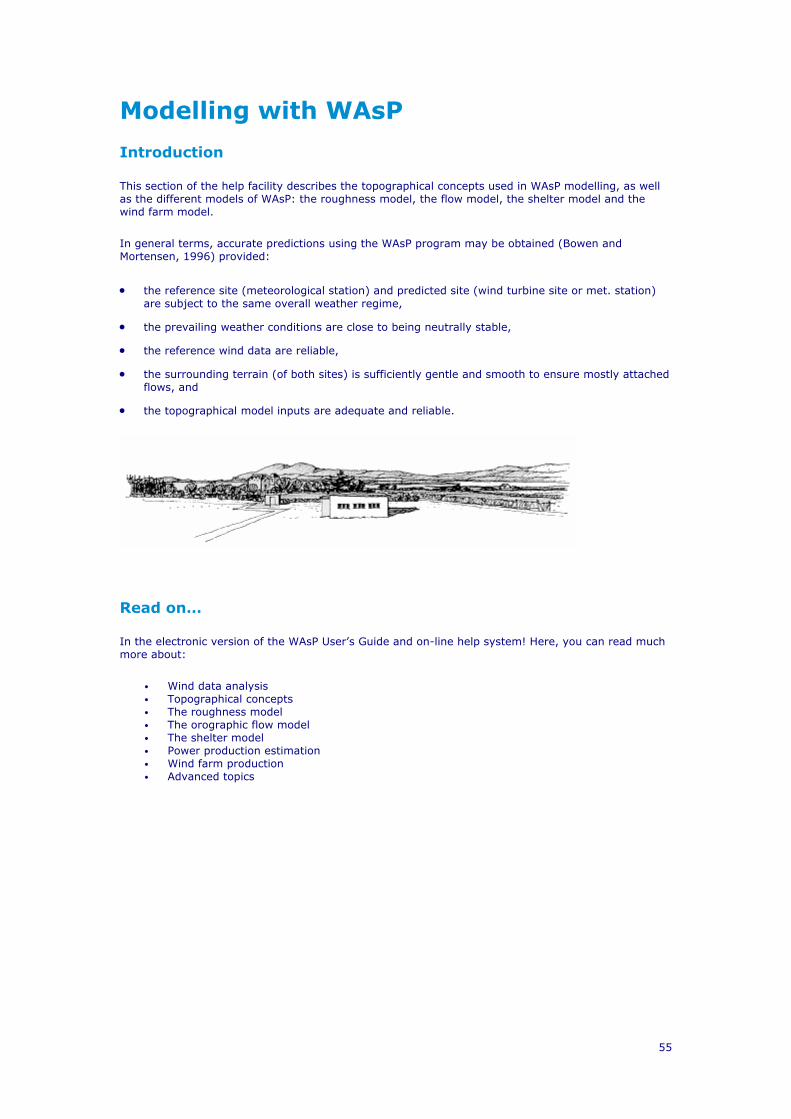
55
Modelling with WAsP
Introduction
This section of the help facility describes the topographical concepts used in WAsP modelling, as well as the different models of WAsP: the roughness model, the flow model, the shelter model and the wind farm model.
In general terms, accurate predictions using the WAsP program may be obtained (Bowen and Mortensen, 1996) provided:
• the reference site (meteorological station) and predicted site (wind turbine site or met. station) are subject to the same overall weather regime,
• the prevailing weather conditions are close to being neutrally stable,
• the reference wind data are reliable,
• the surrounding terrain (of both sites) is sufficiently gentle and smooth to ensure mostly attached flows, and
• the topographical model inputs are adequate and reliable.
Read on…
In the electronic version of the WAsP User’s Guide and on-line help system! Here, you can read much more about:
• Wind data analysis • Topographical concepts • The roughness model • The orographic flow model • The shelter model • Power production estimation • Wind farm production • Advanced topics

57
Feedback and support
Reporting problems
If you have any problems using the WAsP software, please send an e-mail to [email protected]. If you do not have e-mail, you may send a fax to the number given here.
Don't hesitate
Don't hesitate to send some feedback, even if you are not sure whether it is a bug, a suggestion or just a question. Information about any user difficulty is really valuable, even if they are not caused by program errors. Some users are shy making of bug reports because they wrongly assume that the error it is somehow 'their fault', because they don't fully understand the program. Please, don't hesitate to report a problem to us.
Before you contact us…
Before you contact us, please make sure that you have the latest version of WAsP and that your problem has not been dealt with already. So,
• Check the bugs list and FAQ
A list of known issues is maintained at www.wasp.dk. You may also want to check the list of Frequently Asked Questions (FAQ) which will be maintained at the same address.
• Check that you have the latest version
The latest version of the WAsP program can be downloaded from www.wasp.dk; sometimes in the form of an update file to the main installation on the CD-ROM.
Reporting problems
If you decide that your problem or suggestion has not been dealt with already, please follow the guidelines below:
• Provide the version number
Let us know which version of WAsP you are using (please provide the full version number). Please also mention which operating system and Internet Explorer versions you are running. This information is available in the Help menu, by choosing WAsP on this computer...
• Tell us how to reproduce the error
Before you report the problem, try to make it happen again. Include a description of how to reproduce the bug when you send the bug report.
• Provide the program's own error description
When WAsP shows you an error message, you can request details. When the details are showing, you can press the 'Copy' button to put a complete exception report onto the Windows system clipboard. Paste this into the e-mail you send.
• Provide the file
If the software is having problems with a particular file, then please send it (zipped) along with the description. If the file is bigger than 100 KB, then e-mail first so that we can arrange a more appropriate way of transferring the file.
• Provide the whole project

Getting Started with WAsP 9
58
To fix a bug, it is sometimes helpful to be able to reproduce the situation you're describing. The easiest thing is to have the whole project. You can export the whole project or workspace to a directory on your computer and send it along with the feedback message. Again, if the resulting file is bigger than 100 KB, then send an e-mail first and we can arrange another way of transferring the file.
Making suggestions
The future development of WAsP could depend on you! Even though we have many ideas ourselves for the future development of the WAsP program, its user interface and built-in models, we welcome very much your suggestions and requests for new features.
Which features to include and how to implement them depend strongly on the response we get from the WAsP users. Please e-mail or fax your comments and suggestions to the addresses given here.
Contacting the WAsP team
For general inquiries, sales support, shipping, invoicing etc. send an e-mail to [email protected].
For licence-related inquiries, send your dongle ID number to [email protected], quoting your user name.
If you have any problems using the WAsP software, please send an e-mail to [email protected]. This way your problem and questions will be registered properly and distributed to the right person in the WAsP team.
Web: www.wasp.dk www.windatlas.dk www.waspengineering.dk www.mesoscale.dk www.risoe.dk/vea
Fax: +45 46 77 59 70
Phone: +45 46 77 50 97 Ms. Rikke Nielsen or Ms. Lone Wigh
Post: Wind Energy Department
Risø National Laboratory
Technical University of Denmark
P.O. Box 49, VEA-118
DK-4000 Roskilde
Denmark
59
Other information sources
Risø readings in wind power meteorology
This is a list of selected papers, reports and published conference proceedings authored by or in collaboration with the staff of the Wind Power Meteorology Program of the Wind Energy Department.
Wind power meteorology in general
Petersen, E.L., N.G. Mortensen, L. Landberg, J. Højstrup and H.P. Frank (1998). Wind Power Meteorology. Part I: Climate and turbulence. Wind Energy 1, 2-22.
Petersen, E.L., N.G. Mortensen, L. Landberg, J. Højstrup and H.P. Frank (1998). Wind Power Meteorology. Part II: Siting and Models. Wind Energy 1, 55-72.
Troen, I. and E.L. Petersen (1989). European Wind Atlas. ISBN 87-550-1482-8. Risø National Laboratory, Roskilde. 656 pp.
Wind measurements
Kristensen, L. (1998). Cup anemometer behavior in turbulent environments. J. Atmos. Ocean. Tecnol. 15, 5-17.
Kristensen, L. (1999). The perennial cup anemometer. Wind Energy 2, 59-75.
Mortensen, N.G. (1994). Wind measurements for wind energy applications – a review. Wind Energy Conversion 1994. Proceedings of the 16th British Wind Energy Association Conference, Stirling, June 15-17, 353-360.
Mortensen, N.G. (1994). Flow-response characteristics of the Kaijo Denki omni-directional sonic anemometer (DAT 300/TR-61B), Risø-R-704(EN), Risø National Laboratory, Roskilde, Denmark, 32 pp.
Mortensen, N.G., and J. Højstrup (1995). The Solent sonic – response and associated errors. Ninth Symposium on Meteorological Observations and Instrumentation, Charlotte, NC, March 27-31, 501-506.
WAsP and wind modelling
Bowen, A.J. and N.G. Mortensen (1996). Exploring the limits of WAsP: the Wind Atlas Analysis and Application Program. Proceedings of the 1996 European Union Wind Energy Conference and Exhibition, Göteborg, Sweden, May 20-24, 584-587.
Bowen, A.J. and N.G. Mortensen (2004). WAsP prediction errors due to site orography. Risø-R-995(EN). Risø National Laboratory, Roskilde. 65 pp.
Dellwik, E. L. Landberg and N.O. Jensen (2005). WAsP in the forest. Wind Energy 9 , 211-218.
Dellwik, E., L. Landberg and N.O. Jensen (2004). WAsP in the forest. In: Scientific proceedings. 2004 European Wind Energy Conference and Exhibition, London (GB), 22-25 Nov 2004. (European Wind Energy Association, London, 2004) p. 63-66.
Frank, H.P. and L. Landberg (1997). Modelling the wind climate of Ireland. Boundary-Layer Meteorol. 85, 359-378.
Giebel, G. and S.-E. Gryning (2004). Shear and stability in high met masts, and how WAsP treats it. EWEA special topic conference "The science of making torque from wind", Delft (NL), 19-21 April 2004.
Landberg, L. (2000). The mast on the house. Wind Energy 3, 113-119.
Getting Started with WAsP 9
60
Mortensen, N.G. and E.L. Petersen (1998). Influence of topographical input data on the accuracy of wind flow modeling in complex terrain. Proceedings of the 1997 European Wind Energy Conference and Exhibition, Dublin, Ireland, October 6-9, 317-320.
Mortensen, N.G., A.J. Bowen and I. Antoniou (2006). Improving WAsP predictions in (too) complex terrain. Proceedings of the 2006 European Wind Energy Conference and Exhibition, Athens, Greece, February 27 to March 2.
Rathmann, O., N.G. Mortensen, L. Landberg and A. Bowen (1996). Assessing the accuracy of WAsP in non-simple terrain. Wind Energy Conversion 1996. Proceedings of the 18th British Wind Energy Association Conference, Exeter, England, 25-27 September 1996, 413-418.
Walmsley, J.L., I. Troen, D.P. Lalas and P.J. Mason (1990). Surface-layer flow in complex terrain: Comparison of models and full-scale observations. Boundary-Layer Meteorol. 52, 259-281.
Wind atlases
Mortensen, N.G. and Usama Said Said (1996). Wind Atlas for the Gulf of Suez. Measurements and modeling 1991-95. ISBN 87-550-2143-3. Risø National Laboratory, Roskilde, and New and Renewable Energy Authority, Cairo. 114 pp.
Mortensen, N.G., U. Said Said, H.P. Frank, L. Georgy, C.B. Hasager, M. Akmal, J.C. Hansen and A. Abdel Salam (2003). Wind Atlas for the Gulf of Suez. Measurements and Modelling 1991-2001. New and Renewable Energy Authority, Cairo, and Risø National Laboratory, Roskilde. ISBN 87-550-3195-1. 196 pp.
Mortensen, N.G., J.C. Hansen, J. Badger, B.H. Jørgensen, C.B. Hasager, L. Georgy Youssef, U. Said Said, A. Abd El-Salam Moussa, M. Akmal Mahmoud, A. El Sayed Yousef, A. Mahmoud Awad, M. Abd-El Raheem Ahmed, M. A.M. Sayed, M. Hussein Korany, M. Abd-El Baky Tarad (2005). Wind Atlas for Egypt, Measurements and Modelling 1991-2005. New and Renewable Energy Authority, Egyptian Meteorological Authority and Risø National Laboratory. ISBN 87-550-3493-4. 258 pp.
Mortensen, N.G., P. Nielsen, L. Landberg, O. Rathmann and M. Nielsen (1999). A detailed and verified wind resource atlas for Denmark. Proceedings of the Tenth International Conference on Wind Engineering, Copenhagen, Denmark, 21-24 June. 2013-2018.
Troen, I. and E.L. Petersen (1989). European Wind Atlas. ISBN 87-550-1482-8. Risø National Laboratory, Roskilde. 656 pp.
Petersen, E.L., I. Troen, S. Frandsen and K. Hedegaard (1981). Windatlas for Denmark. A rational method for wind energy siting, Risø-R-428, Risø National Laboratory, Roskilde, Denmark. 229 pp.
Short term prediction
Landberg, L., and S.J. Watson (1994). Short-term prediction of local wind conditions. Boundary-Layer Meteorol. 70, 171-195.
Landberg, L. (1999). Short-term prediction of the power production from wind farms. J. Wind Eng. Ind. Aerodyn. 80, 207-220.
On the Web
For general information about wind power, as well as links to other web sites related to wind power, a good place to start is www.windpower.org, the award-winning home page of the Danish Wind Industry Association.
Wind atlases, wind data and wind characteristics
For information on the wind climate of a particular country or region, you might check the list of wind atlases given here or on www.windatlas.dk. National or state meteorological services may also be able to help you; the national weather services are organised in the World Meteorological Organization. For information on the detailed wind and turbulence characteristics of a given site or type of site, you might check the Database on Wind Characteristics.
Appendices
61
Topographical and elevation data
The topographical information needed by WAsP consists of a roughness map and a height contour map. These digital maps are usually constructed by digitisation of ordinary, large-scale topographical (paper) maps. However, elevation and/or land-use information may already be available in digital form, in which case this information may be converted into WAsP-compatible maps. The national or state survey and cadastre should be able to help you find out whether such data exist.
World coast lines
The coastline is a very important elevation and roughness-change line; you can download the geographical coordinates of coastlines around the world using the Coastline Extractor. You can also download the coordinates of lakes, rivers and political boundaries from this site. An example of a map based on these data is given here.
World elevation data
Global elevation and land-cover data are also available over the Internet, e.g. from the Distributed Active Archive Center of the USGS EROS Data Center. The 'Global 30 Arc-Second Elevation Data Set' contains spot heights of node points in a grid with 30 arc-second resolution (926 m or smaller). These data are not detailed enough for WAsP flow modelling, but may be used for overview maps of a region or country; an example of such a map is given here.
Shuttle Radar Topography Mission elevation data have recently become available for all land areas between 57°S and 60°N. These grid data can be used to establish height contour maps for the WAsP flow model, though some editing close to the sites is still required. You can read more about the SRTM mission and data on the Shuttle Radar Topography Mission home page. The gridded elevation data can be downloaded from the SRTM ftp site. How to establish a WAsP orography map from the data is described on the WAsP web page. These instructions may seem somewhat elaborate, but the procedure can be done in less than an hour. New procedures and software are being developed.
Wind turbine and rotor blade manufacturers
For specific information on the characteristics of a particular wind turbine, you should contact the manufacturer directly. A list of major Danish wind turbine and rotor blade manufacturers is given below.
Contact details Internet home page E-mail address
Siemens Wind Power A/S www.powergeneration.siemens.com [email protected]
Vestas Wind Systems A/S www.vestas.com [email protected]
LM Glasfiber A/S www.lmglasfiber.com [email protected]
The WAsP library contains sample (historic) wind turbine power and thrust curves from the manufacturers mentioned above.
Getting Started with WAsP 9
62
WAsP forms A number of sample forms are provided in the 'Forms' folder of the main WAsP directory. These forms may be used to record characteristics of the wind speed and direction data, the anemometer or wind turbine site, the meteorological station, the near-by obstacles, the surrounding roughness and for exchange of data storing units/cards on a met. station or for keeping a logbook. The forms are:
1. Data Description Form
2. Site Description Form
3. Site Sketch Map
4. Site Sector Photographs
5. Station Description Form
6. Obstacle Description Form
7. Roughness Description Form
8. Data Storing Unit Exchange Form
9. Data Acquisition System Logbook
10. Met. station inspection checklist
The Roughness Description Form is used for the site-specific roughness description or roughness rose. However, most often the roughnesses are specified in the form of roughness change lines in a map; to establish these, a copy of the topographical map is most useful.
These forms should be considered as samples or templates; you may adapt each form to your specific needs. The Data Storing Unit Exchange Form was developed specifically for Aanderaa systems, but can easily be adapted to other systems/data-loggers.