Embed Size (px)
Citation preview
Getting Started with SAS® Viya® 3.5 for Python
RequirementsTo use Python with SAS Cloud Analytic Services, the client machine that runs Python must meet the following requirements:
n Use 64-bit Linux or 64-bit Windows.
n Use a 64-bit version of Python, such as the Anaconda platform from Continuum Analytics.
n Use Python version 2.7.x or 3.4+. The single Python package from SAS, SWAT, is compatible with both versions.
The SAS Scripting Wrapper for Analytics Transfer (SWAT) package is available for download from http://support.sas.com/downloads/package.htm?pid=1977. Information for installing is available from a README that is included in the download.
For information about installing with pip or conda, see https://github.com/sassoftware/python-swat#installation.
You can view your currently installed version by running the following statement:
print(swat.__version__)
The following list includes additional resources:
n SWAT package information and Jupyter Notebook examples for getting started are available from https://github.com/sassoftware. See the python-swat and sas-viya-programming repositories. The software does not require Jupyter Notebook, but the examples in this document were developed with Jupyter.
n SWAT package documentation and API: https://sassoftware.github.io/python-swat/. The package documentation includes comprehensive documentation for getting started, working with data, package classes, and troubleshooting.
n SAS® Viya™: The Python Perspective
There is additional information that is common with other programming languages and authenticating with the server.

See Alson “Create an Authinfo File” in Client Authentication Using an Authinfo File
n SAS Viya: System Programming Guide
Connect and Start a Session
How ToTo enable a Python program to work with SAS Cloud Analytic Services, you must establish a connection with the server.
You need the host name and port that the CAS controller is listening on. You must also have created an authinfo file so that you can specify your credentials to the controller.
Example Code 1 Binary Connection
import swats = swat.CAS("cloud.example.com", 5570)
SWAT is the name for the package that is used for connecting to the server. The package includes classes and methods that are documented in other parts of this document and in the package documentation.
If a server is listening on the host name and port that are specified, and you authenticate, then the swat.CAS class makes a connection to the server, starts a session on the same hosts as the server, and returns the connection object. As a documentation convention, the variable "s" is used to represent your CAS session.
In addition to the binary connection, the SWAT package can make a REST connection. In most cases, the preferred method is to connect to the HTTP server that proxies the REST interface for CAS. Depending on your network topology and firewalls, it might be possible to connect directly to the REST interface for CAS.
Example Code 2 REST Connection with HTTP Server
s = swat.CAS("https://webserver.example.com/cas-shared-default-http/")
n SAS Viya uses an HTTP server to proxy requests to services. By default, the HTTP server is configured to use TLS. The HTTP server can use a self-signed certificate that is generated automatically or your administrator might have supplied a certificate.
n The best practice in this case is to connect to CAS through the HTTP server. The cas-shared-default-http portion of the URL applies to a typical SAS Viya deployment. If the deployment instance did not use the default deployment name, then that portion of the URL is different.
Example Code 3 REST Connection Directly to CAS
s = swat.CAS("http://cloud.example.com:8777", protocol='http')
n In some network topologies, you might have network connectivity with the CAS controller. The CAS controller listens on port 8777 for REST connections. The port number is configurable and can be different.
2
n Specify HTTPS in the URI and for the protocol argument if the CAS controller is configured to use TLS.
If the HTTP server or CAS is configured to use TLS, see Encryption in SAS Viya: Data in Motion for the following information:
n information about trusted certificates and the default location of the certificates
n information about when you might need to set the CAS_CLIENT_SSL_CA_LIST environment variable
Troubleshooting Connection Errors
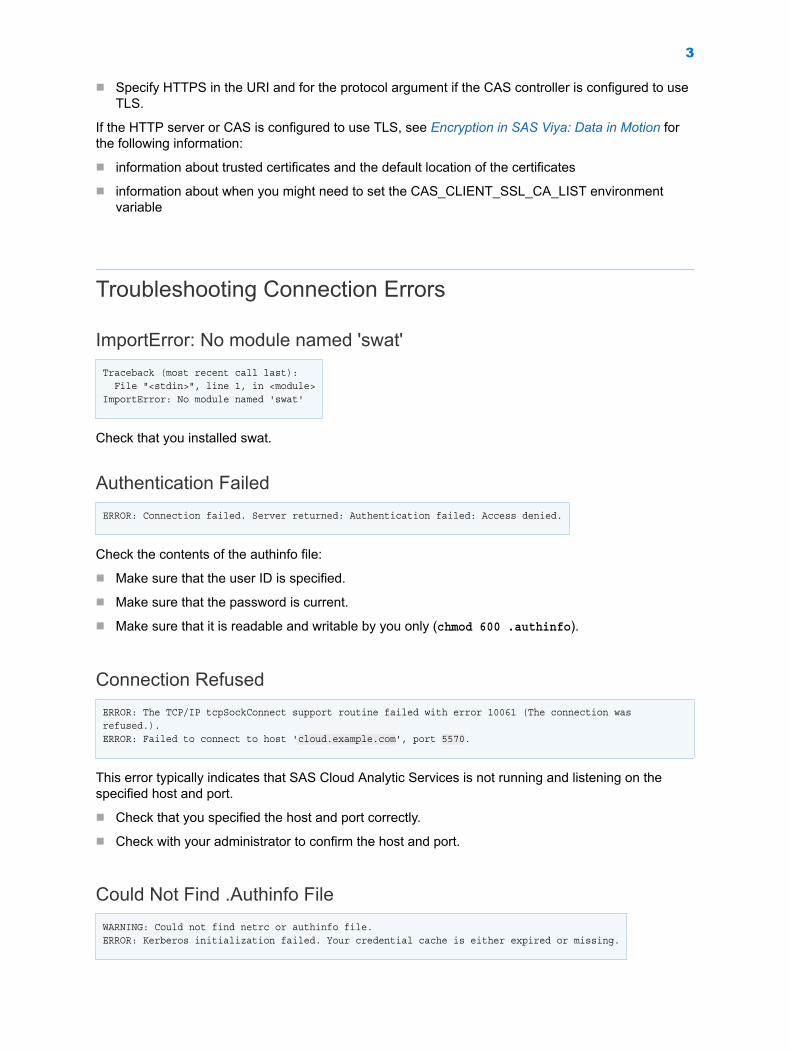
ImportError: No module named 'swat'Traceback (most recent call last): File "<stdin>", line 1, in <module>ImportError: No module named 'swat'
Check that you installed swat.
Authentication FailedERROR: Connection failed. Server returned: Authentication failed: Access denied.
Check the contents of the authinfo file:
n Make sure that the user ID is specified.
n Make sure that the password is current.
n Make sure that it is readable and writable by you only (chmod 600 .authinfo).
Connection RefusedERROR: The TCP/IP tcpSockConnect support routine failed with error 10061 (The connection was refused.).ERROR: Failed to connect to host 'cloud.example.com', port 5570.
This error typically indicates that SAS Cloud Analytic Services is not running and listening on the specified host and port.
n Check that you specified the host and port correctly.
n Check with your administrator to confirm the host and port.
Could Not Find .Authinfo FileWARNING: Could not find netrc or authinfo file.ERROR: Kerberos initialization failed. Your credential cache is either expired or missing.
3
n Make sure that your authinfo file is created on the client machine. Do not create the file on the server machines.
n On Linux clients, the software searches for $HOME/.authinfo and $HOME/.netrc.
n If you receive only the second part of the message that begins with ERROR: Kerberos initialization failed., then the authinfo file was found. However, the host name or host name and port combination for the connection could not be matched in the authinfo file.
SSL Routines FailedSWATError: ("bad handshake: Error([('SSL routines', 'ssl3_get_server_certificate', 'certificate verify failed')],)",)
n If you attempted to connect to a specified port, such as 5570 or 8777, see whether you can make a REST connection through the HTTP server. The HTTP server might use certificates that are signed by a well-known CA such as Verisign, Digicert, and so on.
n If you receive this error with a REST connection through the HTTP server or when you must make a binary connection, then you need access to the certificate authority that signed the certificates.
Contact the server administrator for either the trustedcerts.pem or vault-ca.crt file. Specify the path to file in the CAS_CLIENT_SSL_CA_LIST environment variable.
n For more information about CAS and TLS, see Encryption in SAS Viya: Data in Motion.
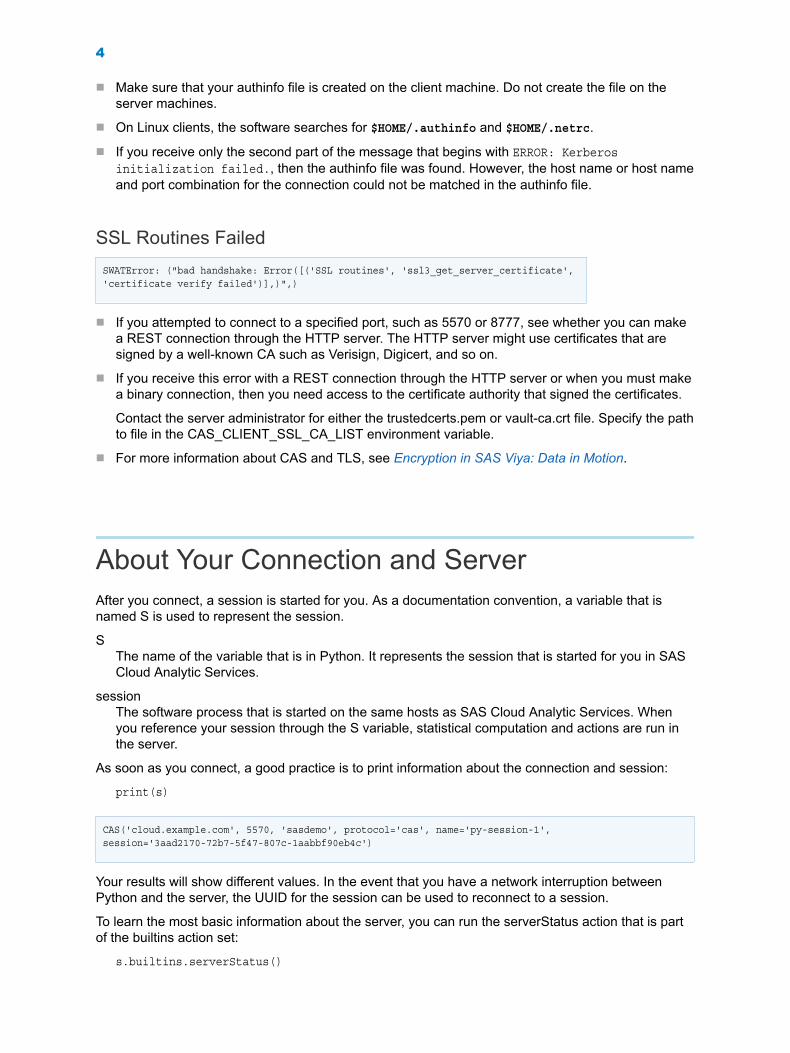
About Your Connection and ServerAfter you connect, a session is started for you. As a documentation convention, a variable that is named S is used to represent the session.
SThe name of the variable that is in Python. It represents the session that is started for you in SAS Cloud Analytic Services.
sessionThe software process that is started on the same hosts as SAS Cloud Analytic Services. When you reference your session through the S variable, statistical computation and actions are run in the server.
As soon as you connect, a good practice is to print information about the connection and session:
print(s)
CAS('cloud.example.com', 5570, 'sasdemo', protocol='cas', name='py-session-1', session='3aad2170-72b7-5f47-807c-1aabbf90eb4c')
Your results will show different values. In the event that you have a network interruption between Python and the server, the UUID for the session can be used to reconnect to a session.
To learn the most basic information about the server, you can run the serverStatus action that is part of the builtins action set:
s.builtins.serverStatus()
4

Output 1 Show the Server Status
This example shows a distributed server that uses eight machines. Distributed servers perform massively parallel processing. If the nodestatus information for your results shows a single row with a role of controller, then you are connected to a single-machine server. The single-machine server performs symmetric multi-processing, so this architecture is often referred to as SMP. Both architectures can perform the same analytics; the distributed server is better suited to analyzing large data sets.
Frequently Used SWAT Classes
CASResultsTo introduce the classes that are part of SWAT, put the results of the serverStatus action in a variable and display the type:
5

As shown, the class is CASResults. The class is a subclass of Python's dictionary. One aspect of the serverStatus action is that the results include a table that is named Server. That table shows the number of actions that were run. The following figure shows how you can access that table from the result and display it:
This is an introduction to the CASResults class. There are more examples that demonstrate how to work with results in this document.
CASTableThe CASTable class represents an in-memory table in SAS Cloud Analytic Services.
A simple way to work with a CASTable is to use the upload_file method that can download a file from a website, transfer it to the server, and then import it.
TIP An instance of the CASTable class represents an in-memory table in the server. An instance of the class does not contain the actual data from the table. In the preceding example, Titanic3 is not a DataFrame in Python that includes rows and columns of data. Titanic3 is a variable that represents an in-memory table. The in-memory table on the server includes the rows and columns of data.
CASTable objects can accept the name of an action, such as table.columnInfo. Your session can then run the action on the table.
6

Because the purpose of the server is to analyze data, the CASTable class is designed to provide a syntactic shortcut for running actions. The following two programming snippets are functionally equivalent.
Example Code 4 Using a CASTable Object to Run an Action
titanic3.table.columnInfo()
Example Code 5 Running an Action and Specifying the Table Parameter
s.table.columnInfo(table="titanic3")
You can use a CASTable object to run an action and then save the result in a CASResults instance.
In the preceding example, the SummaryResults variable is a CASResults object. In many cases, an action produces many tabular results in the CASResults object. These tabular results are SASDataFrame objects. They are a subclass of Pandas DataFrame with SAS metadata such as labels, titles, and columns. Otherwise, they are equivalent.
7

Additional ClassesSee the API reference for the SWAT package to learn more about the CASResults class, the CASTable class, and additional classes.
https://sassoftware.github.io/python-swat/api.html
Working with ResultsAs described in “Frequently Used SWAT Classes” on page 5, when you run an action, the action returns an instance of the CASResults class.
Error CheckingExample Code 6 Check for an Existing Caslib
info = s.table.caslibInfo() # 1
if info.severity == 0 and any(info.CASLibInfo['Name'].isin(['hr'])): # 2
s.table.dropCaslib(caslib="hr")
s.table.addCaslib( # 3
caslib="hr", dataSource={ "srcType":"oracle", "path":"oradb", "user":"SCOTT", "password":"tiger", "schema":"HR" })
1 The table.caslibInfo action is run in the session that is referenced in S. The results of the action are stored in the Info variable. That variable is an instance of the CASResults class.
2 The severity field is set to indicate the success or failure for the action. A value of 0 indicates that the action ran successfully. For more information, see “Severity and Reason Codes” in SAS Viya: System Programming Guide.
3 The table.addCaslib action is used to enable access to an Oracle database. The caslib is added with session-scope so that only this session can use the caslib and access Oracle data through it.
Accessing Keys in CASResultsAfter running the code in the preceding section, the Info variable is an instance of the CASResults class. Most actions include at least one SASDataFrame instance in the results. The keys() method returns the name that you can use to access the instance.
Example Code 7 CASResults Keys Method
info.keys()
8
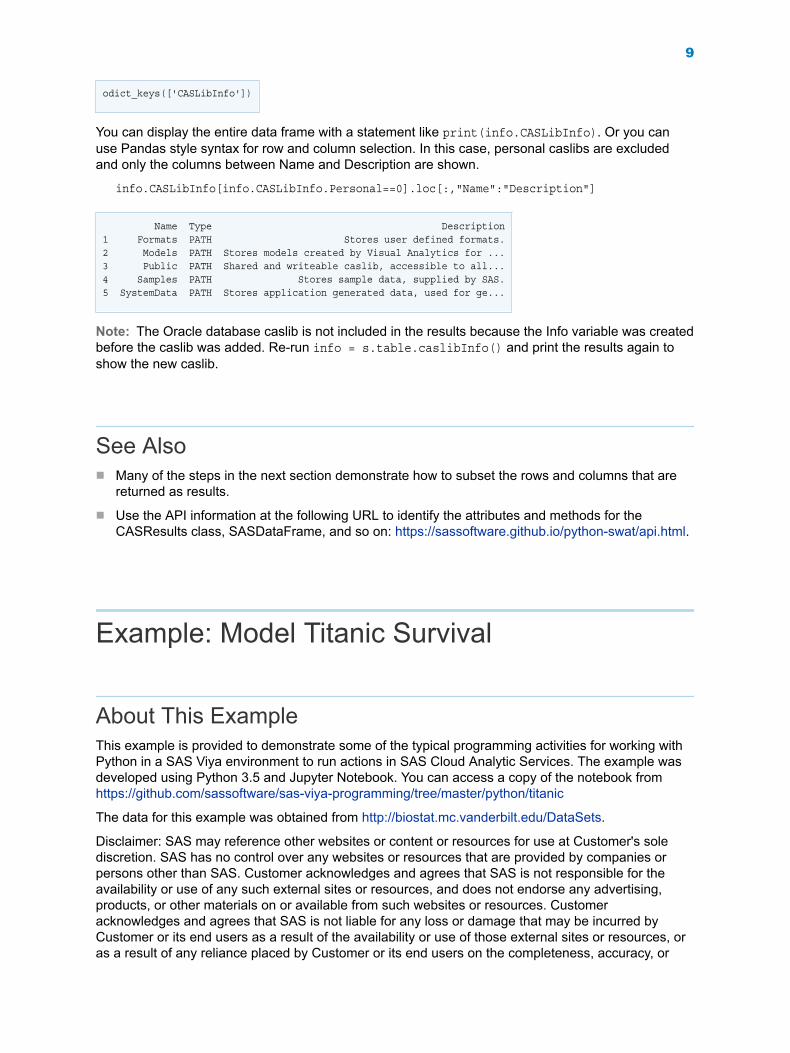
odict_keys(['CASLibInfo'])
You can display the entire data frame with a statement like print(info.CASLibInfo). Or you can use Pandas style syntax for row and column selection. In this case, personal caslibs are excluded and only the columns between Name and Description are shown.
info.CASLibInfo[info.CASLibInfo.Personal==0].loc[:,"Name":"Description"]
Name Type Description1 Formats PATH Stores user defined formats.2 Models PATH Stores models created by Visual Analytics for ...3 Public PATH Shared and writeable caslib, accessible to all...4 Samples PATH Stores sample data, supplied by SAS.5 SystemData PATH Stores application generated data, used for ge...
Note: The Oracle database caslib is not included in the results because the Info variable was created before the caslib was added. Re-run info = s.table.caslibInfo() and print the results again to show the new caslib.
See Alson Many of the steps in the next section demonstrate how to subset the rows and columns that are
returned as results.
n Use the API information at the following URL to identify the attributes and methods for the CASResults class, SASDataFrame, and so on: https://sassoftware.github.io/python-swat/api.html.
Example: Model Titanic Survival
About This ExampleThis example is provided to demonstrate some of the typical programming activities for working with Python in a SAS Viya environment to run actions in SAS Cloud Analytic Services. The example was developed using Python 3.5 and Jupyter Notebook. You can access a copy of the notebook from https://github.com/sassoftware/sas-viya-programming/tree/master/python/titanic
The data for this example was obtained from http://biostat.mc.vanderbilt.edu/DataSets.
Disclaimer: SAS may reference other websites or content or resources for use at Customer's sole discretion. SAS has no control over any websites or resources that are provided by companies or persons other than SAS. Customer acknowledges and agrees that SAS is not responsible for the availability or use of any such external sites or resources, and does not endorse any advertising, products, or other materials on or available from such websites or resources. Customer acknowledges and agrees that SAS is not liable for any loss or damage that may be incurred by Customer or its end users as a result of the availability or use of those external sites or resources, or as a result of any reliance placed by Customer or its end users on the completeness, accuracy, or
9
existence of any advertising, products, or other materials on, or available from, such websites or resources.
Get the Dataimport pandas as pdimport matplotlib.pyplot as pltfrom IPython.core.display import display, HTML%matplotlib inline
import swats = swat.CAS("cloud.example.com", 5570)
titanic3 = s.CASTable("titanic3", replace=True); # 1
# 2
s.upload_file('http://biostat.mc.vanderbilt.edu/wiki/pub/Main/DataSets/titanic3.csv', casout=titanic3)
type(titanic3) # 3
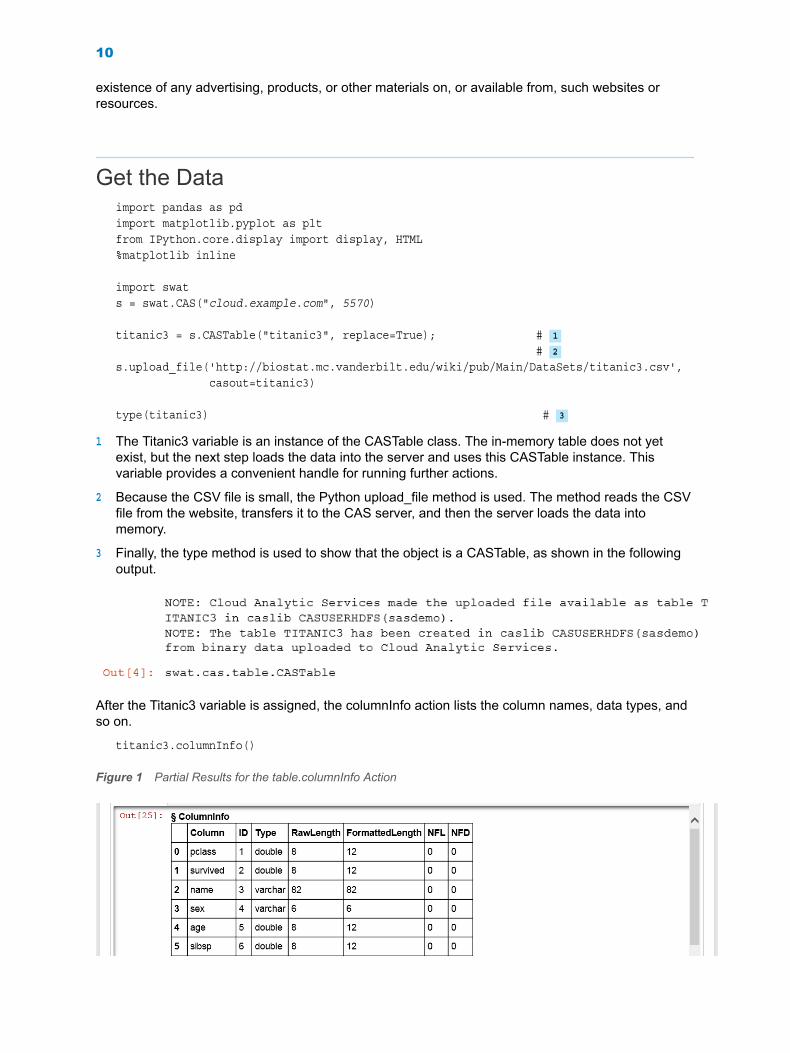
1 The Titanic3 variable is an instance of the CASTable class. The in-memory table does not yet exist, but the next step loads the data into the server and uses this CASTable instance. This variable provides a convenient handle for running further actions.
2 Because the CSV file is small, the Python upload_file method is used. The method reads the CSV file from the website, transfers it to the CAS server, and then the server loads the data into memory.
3 Finally, the type method is used to show that the object is a CASTable, as shown in the following output.
After the Titanic3 variable is assigned, the columnInfo action lists the column names, data types, and so on.
titanic3.columnInfo()
Figure 1 Partial Results for the table.columnInfo Action
10
Add a Computed ColumnSome of the columns in the data are problematic for modeling:
n The Name column should not have a bearing on the analysis.
n The Boat and Body columns are proxies for the response variable, Survived.
n The Cabin column is similar to Name in that it is too specific to be generalized. A computed column, Deck, is created because it is slightly more general than Cabin.
# create a computed variable
titanic3.computedVars = ["deck"] # 1
titanic3.computedVarsProgram = \ "if cabin ne '' then deck = ksubstr(cabin,1,1); else deck = '';"
numeric=['pclass', 'survived', 'age', 'sibsp', 'parch', 'fare']
# Remove boat and body because they are proxies for survived# Remove ticket and cabin. Use the computed column, deck, instead.char = ['sex', 'deck', 'embarked', 'home.dest']
all = numeric + char
1 The language for the computedVarsProgram parameter is called CMP and is very similar to the SAS DATA step. The computed column is shown later, in results of the table.columnInfo action on page 13.
BY-Group Analysis: Descriptive StatisticsThe simple.summary action is used to provide some descriptive statistics. The groupby method is set on the Titanic3 object so that the statistics are shown for survivors and those that did not survive.
# numeric was defined earlierresults = titanic3[numeric].groupby("survived").simple.summary()
resultColumns = ['Column', 'Min', 'Max', 'N', 'NMiss', 'Mean', 'Sum', 'Std', 'StdErr'];
display(HTML("<h3>Perished</h3>"))display(results['ByGroup1.Summary'][resultColumns]) # 1
display(HTML("<h3>Survived</h3>"))display(results['ByGroup2.Summary'][resultColumns])
1 Results is a CASResults object that includes the results of the summary action. Because a group-by analysis was performed, the ByGroup1 value is used to index into the results. The results for each group are further subset to show only the columns between the column name and the standard error.
11

Figure 2 Descriptive Statistics for the Titanic Data Set, by Values of the Survived Column
Sample the Datas.builtins.loadActionSet("sampling")
# the sampling.stratified action does not accept the vars parameter,# copyVars is used to select the columns to copy to the output tableif 'vars' in titanic3.params: del titanic3.vars
# temporarily set a groupBy parameterwith titanic3:
12
titanic3.groupBy={"survived"} titanic3.sampling.stratified( partInd=True, # 1
samppct=40, # 2
seed=1234, output={ "casout":{"name":"titanic3part", "replace":True}, "copyVars":all } )
titanic3.table.dropTable() # 3
titanic3part = s.CASTable("titanic3part") # 4
ci = titanic3part.columnInfo()display(ci)
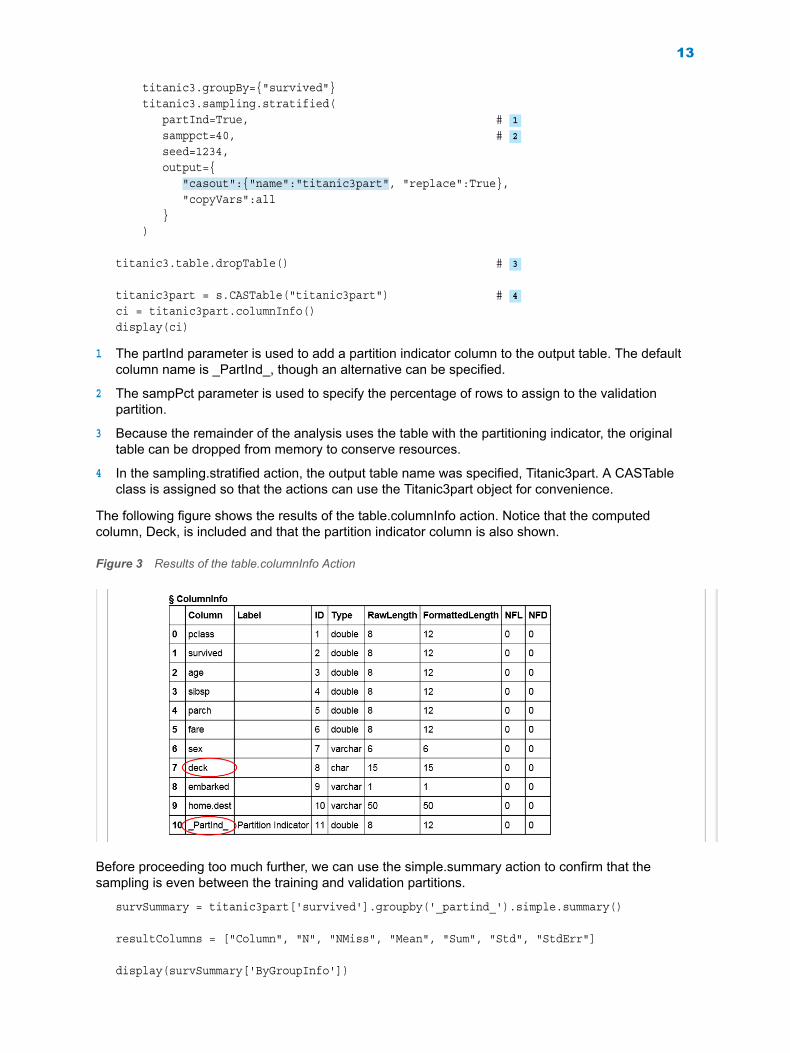
1 The partInd parameter is used to add a partition indicator column to the output table. The default column name is _PartInd_, though an alternative can be specified.
2 The sampPct parameter is used to specify the percentage of rows to assign to the validation partition.
3 Because the remainder of the analysis uses the table with the partitioning indicator, the original table can be dropped from memory to conserve resources.
4 In the sampling.stratified action, the output table name was specified, Titanic3part. A CASTable class is assigned so that the actions can use the Titanic3part object for convenience.
The following figure shows the results of the table.columnInfo action. Notice that the computed column, Deck, is included and that the partition indicator column is also shown.
Figure 3 Results of the table.columnInfo Action
Before proceeding too much further, we can use the simple.summary action to confirm that the sampling is even between the training and validation partitions.
survSummary = titanic3part['survived'].groupby('_partind_').simple.summary() resultColumns = ["Column", "N", "NMiss", "Mean", "Sum", "Std", "StdErr"]
display(survSummary['ByGroupInfo'])
13

display(survSummary['ByGroup1.Summary'][resultColumns])display(survSummary['ByGroup2.Summary'][resultColumns])
As long as each partition has approximately .38 for the mean, then the survivor rows are distributed evenly in the partitions.
Figure 4 Descriptive Statistics for the Survived Column, by Values of the Partition Indicator Column
Train a Model
s.builtins.loadActionSet("decisionTree") # 1
training = titanic3part.query('0 = _partind_') # 2
trainingResults = training.forestTrain( target="survived", inputs=all, nominals=char + ["pclass", "survived"], casOut={"name":"forestModel", "replace":True}, seed=1234, binOrder=True, varImp=True )
display(trainingResults)
1 The builtins.loadActionSet action is used to ensure that the decisionTree actions are available to the session.
2 The table is filtered to restrict the rows to the training data only.
The casOut parameter that is shown in the example is used to store the model as an in-memory table. The next step of this example is to show how to score data with the model.
14

Figure 5 Model Information, Variable Importance, and Output Table for the Model
Use the Model for ScoringIn this example, both the training data and the validation data are scored. This is done so that we can assess the effectiveness of the model for predicting whether someone survives on the Titanic.
forestModel = s.CASTable("forestModel")
titanic3part.forestScore( modelTable=forestModel, copyVars=["_partind_", "survived"], casOut={"name":"forestScored", "replace":True},
15

vote='prob')
The in-memory table, ForestModel, is used as the model. The scoring output is stored in an in-memory table that is named ForestScored.
Figure 6 Scoring Information and Output Table for Scoring
Assess the ModelThe assess action is part of the percentile action set. You can run the loadActionSet action to ensure that the action is available to your session.
s.builtins.loadActionSet("percentile")
forestScored = s.CASTable("forestScored") # 1
forestScored.groupBy="_PartInd_" # 2
forestScored.computedVars=["P1", "P0"] # 3
forestScored.computedVarsProgram=''' if '1' eq strip(_RF_PredName_) then do; P1 = _RF_PredP_; P0 = 1 - _RF_PredP_; end; else do; P1 = 1 - _RF_PredP_; P0 = _RF_PredP_; end;''' # 4
forestScored.percentile.assess( casOut={"name":"forestAssess", "replace":True}, nbins=10, cutStep = 0.01, inputs=['P1'], response='survived', event='1', pVar=['P0'], pEvent='0')
1 An instance of the CASTable class is created to refer to the ForestScored table.
16
2 In contrast with earlier examples, no with block is used. The CASTable object is set with a groupBy parameter that organizes the data by the two unique values of the _PartInd_ column. This enables the assess action to differentiate between the training data and the validation data.
3 Two computed columns are added. P1 is used to show the calculated probability that the row identifies a survivor.
4 The compPgm parameter includes the CMP programming statements that are needed to assign values to P1 and P0.
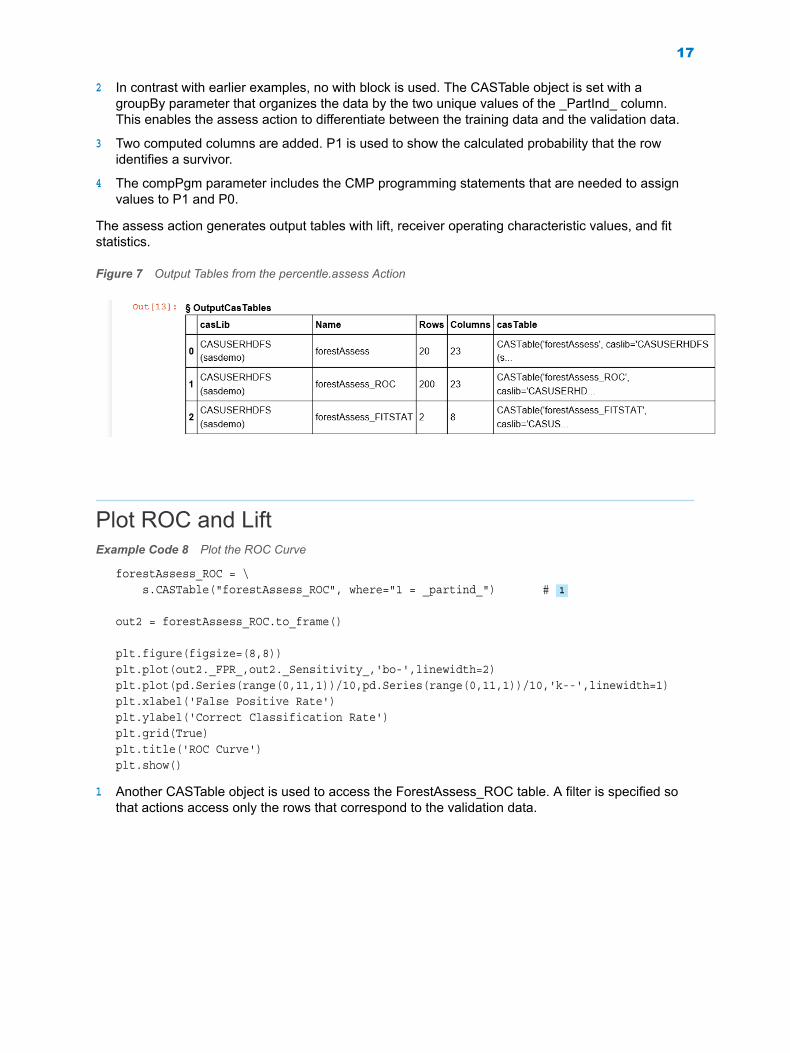
The assess action generates output tables with lift, receiver operating characteristic values, and fit statistics.
Figure 7 Output Tables from the percentle.assess Action
Plot ROC and LiftExample Code 8 Plot the ROC Curve
forestAssess_ROC = \ s.CASTable("forestAssess_ROC", where="1 = _partind_") # 1
out2 = forestAssess_ROC.to_frame()
plt.figure(figsize=(8,8))plt.plot(out2._FPR_,out2._Sensitivity_,'bo-',linewidth=2)plt.plot(pd.Series(range(0,11,1))/10,pd.Series(range(0,11,1))/10,'k--',linewidth=1)plt.xlabel('False Positive Rate')plt.ylabel('Correct Classification Rate')plt.grid(True)plt.title('ROC Curve')plt.show()
1 Another CASTable object is used to access the ForestAssess_ROC table. A filter is specified so that actions access only the rows that correspond to the validation data.
17
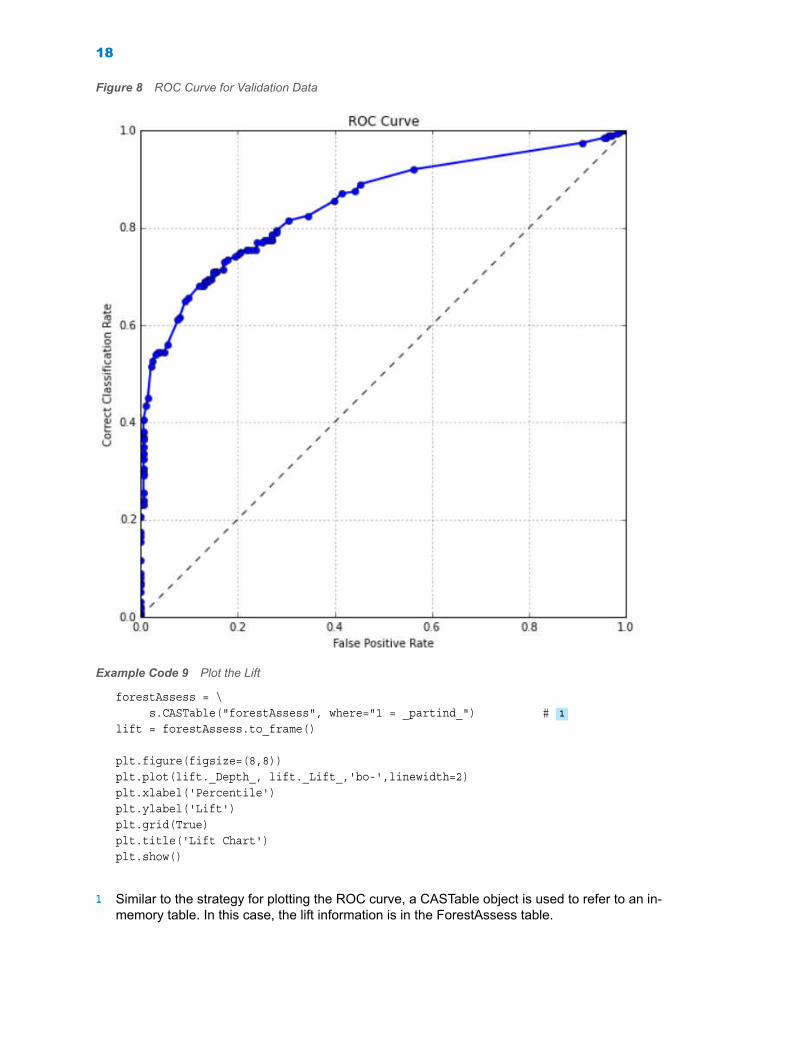
Figure 8 ROC Curve for Validation Data
Example Code 9 Plot the Lift
forestAssess = \ s.CASTable("forestAssess", where="1 = _partind_") # 1
lift = forestAssess.to_frame()
plt.figure(figsize=(8,8))plt.plot(lift._Depth_, lift._Lift_,'bo-',linewidth=2)plt.xlabel('Percentile')plt.ylabel('Lift')plt.grid(True)plt.title('Lift Chart')plt.show()
1 Similar to the strategy for plotting the ROC curve, a CASTable object is used to refer to an in-memory table. In this case, the lift information is in the ForestAssess table.
18

Figure 9 Lift Chart for Validation Data
Ending Your SessionAfter you complete your analysis, you should end your session so that you do not continue to consume resources that you are not using:
n All session-scoped tables are dropped from memory. All the tables in this example are scoped to your session only.
n The session that is running in SAS Cloud Analytic Services is terminated. The server can free the resources that were used for your session.
Run the terminate method to close the connection to the server and terminate the session:
s.terminate()
19

Where to Go from HereTask Refer to:
Data management and manipulation, server management, and administration
SAS Viya: System Programming Guide
Prepare, model, and assess SAS Visual Analytics: Programming Guide
Build and compare models SAS Visual Statistics: Programming Guide
Tune, analyze complex data, and perform advanced statistical operations
SAS Visual Data Mining and Machine Learning: Programming Guide
SAS Visual Data Mining and Machine Learning: Deep Learning Programming Guide
Text mine, contextual extraction, sentiment analysis, and search
SAS Visual Text Analytics: Programming Guide
SAS Visual Analytics: Programming Guide
SAS Visual Data Mining and Machine Learning: Programming Guide
SAS® and all other SAS Institute Inc. product or service names are registered trademarks or trademarks of SAS Institute Inc. in the USA and other countries. ® indicates USA registration. Other brand and product names are trademarks of their respective companies. Copyright © 2019, SAS Institute Inc., Cary, NC, USA. All Rights Reserved. November 2019 3.5-P1:caspg3
20