Embed Size (px)
Citation preview

Getting Started with Data-Driven Decision Making: A Workbook JANUARY 2 13
An NTEN Workbook prepared by
www.nten.org | 1020 SW Taylor Street | Suite 800 | Portland, Oregon 97205 | p: 415.397.9000 | f: 415.814.4056

Introduction
GETTING STARTED WITH DATA-DRIVEN DECISION-MAKING · JANUARY 2013
Over the last few years, NTEN has been working with nonprofits to understand how to better wrangle all the data they’re creating and that’s available to them into improved results—more mission impact. In 2010, we organized an online workshop we affectionately titled “Taming the Data Monster.” That workshop focused on the data and “story” side of the equation: how to translate the data you have into a snapshot of the work you are doing today (and yesterday). The workshop was designed for the Communications and IT Staff who have the task of collecting and distributing data in effective and meaningful ways. But what about the steps an organization has to take before collecting or analyzing the data? How do we determine which data matters in the
first place, and how that data will impact the direction of our work?
In 2012, NTEN was able to survey a sample of US nonprofits to find out how they were doing when it comes to being data-driven: were they collecting data and tracking metrics? Were they finding that data useful for making organizational decisions? With the financial support of Google and the research expertise of Idealware, we published the 2012 State of Nonprofit Data report which indicated that nonprofits weren’t having success with those strategic steps in the equation: almost all nonprofits were collecting and tracking some type of metrics, but only a small fraction were finding that data useful for making decisions that impacted their programmatic work. Clearly, there was a disconnect between the tactical work of collecting and tracking data and the strategic work of defining and using the data for the organization’s mission.
With this workbook, we hope to provide nonprofit leaders with a set of worksheets that will help guide thinking and planning around more effective data strategies.
While these worksheets are part of the strategic process of defining the right questions, metrics, and plans for effecting data-driven decisions, and this workbook is designed for nonprofit leaders—executive directors, board members, and other organizational leadership staff who develop strategies and are responsible for making organizational decisions—it will be helpful to include input and discussion from various staff. For example, worksheets 4 and 5, especially, could benefit from input from your program, communications, and data or IT team members.
Overall, we acknowledge that it’s important that your entire team buys-in to the strategy—data collection,
analysis, and reiteration is a cultural shift for many of us, and it’s something that can’t be done once or intermittently or inconsistently across your organization if we’re going to be more effective. All of this takes investment of time and resources as well as vision. That’s why this workbook includes worksheets that will help you think through the “onboarding” and budgeting processes as well.
You may want to go through this workbook separately for various projects or go through it again to re-define or update your metrics. In any case, we hope you’ll find this workbook helpful for launching or improving data strategies that will impact your organization’s work.
We’d like to thank Google for providing financial support for this project, and Idealware for helping us produce this workbook.
Annaliese Hoehling Publications Director, NTEN

Table of Contents
PAGE 1 GETTING STARTED WITH DATA-DRIVEN DECISION-MAKING · JANUARY 2013
Welcome ................................................................................................................................................................ 2
Worksheets
1. Define Your Action Question.................................................................................................................... 3
2. What Does This Question Mean To Your Organization? ............................................................................... 5
3. How Will You Know What the Right Metrics Are? ...................................................................................... 6
4. What Could You Measure? ................................................................................................................................. 7
5. What Data Do You Have? ............................................................................................................................. 9
6. Find The Metrics That Make Sense For You ................................................................................................ 10
7. The Metric Creation Process ............................................................................................................................... 11
8. Define a Process for Using Them to Make Decisions ................................................................................. 12
9. Create an Implementation Action Plan ........................................................................................................ 13
About NTEN and Idealware .................................................................................................................................. 15

PAGE 2 GETTING STARTED WITH DATA-DRIVEN DECISION-MAKING · JANUARY 2013
Welcome
Could you use more help thinking through how to use data to help your organization make decisions? If so, you’re not alone. Our recent report on how nonprofits are using data showed that although some organizations are relying heavily on data, a number were doing very little to measure their work.
Measuring may not be as difficult as you suspect. When we talked to experts, they agreed that simply starting to track a few strategic metrics was a huge step toward a more data-based culture. Once your staff has data that they can use to make decisions, they will often start to want more. A few, straightforward metrics can start the
snowball to a more broad-based program.
Getting started isn’t a trivial process, however. What metrics will be useful and actionable—but not require a ton of time to collect and understand? How do you define and communicate data in order for your organization to make decisions?
This workbook will help you with those questions. If you have a vague idea of what you’d like to measure, you can start with the first worksheet and proceed in order through the workbook. It will walk you through the process of choosing and refining initial metrics, defining how you will collect the data, and explaining how to disseminate that data for decision making. If you’re further down the path than that, feel free to pick and choose the worksheets that make sense for your needs. You may just want to think about the process for creating and using your metrics or narrow down a list of metrics that will have the most impact.
As you’re thinking about data-based decision making for your organization, don’t forget the other resources in this research series. The 2012 State of Nonprofit Data report provides information about what nonprofits are doing with data and the factors that contribute to (or impede) success. We’ve also gathered ten case studies outlining how ten different organizations are using data to make decisions. They are available online in NTEN’s case study section..
Don’t feel overwhelmed by data. The journey to data-based decision making, like any, begins with the first step. In this case, you can begin with the first worksheet. Once you start defining the metrics that will help your organization, you may find that it’s easier than you thought.

1. Define Your Action Question
PAGE 3 NONPROFIT DATA DECISION-MAKING WORKBOOK • JANUARY 2013
This workbook is designed to help you hone some of the
metrics that will be practical and meaningful for you in a
particular area. To focus your efforts more productively,
start by identifying the general area you want to use
this workbook to explore in more detail. Choose an item
from the box to the right that resonates with you, or
define your own based on a topic your organization has
been talking about.
What’s an area you want to explore?
Recruiting patients
Now define a particular action question within that area. It’s not going to be easy—your action question must be specific enough to be measurable and to help you decide how to move forward, but also important enough to really matter to your organization. Let’s start by brainstorming.
What are some tactical questions you’d ideally like to be able to answer in this area that would help your organization improve?
1. How can we improve patient attendance?
2. How can we increase number of referrals?
3. How can we increase patient case load?
4. How can we increase number of units per day?
5. How can occupational therapy increase patient motivation?
WHAT MAKES A GOOD QUESTION?
Stumped as to the type of question
we’re looking for? Try to think of
something that will help your organi-
zation improve and that you can have
an impact on—but that can also be
tested and measured. For example,
“How can we improve fundraising?” is
too broad—it’s not easy to pin down
what you would specifically do to
affect or measure it. “What’s our email
open rate?” is too narrow and it’s not
clear how it relates to organization
goals. Look for a question that’s both
important and detailed enough to be
testable, such as “Is our blog worth the
time we spend on it?” or “How can we
improve program attendance?”
POSSIBLE ORGANIZATIONAL AREAS FOR EXPLORATION
• Recruiting clients
• Efficiency of a process
• Projecting future income
• A specific program
• Annual campaign
• Facebook outreach
• Email list-building
• Staff development
• Staff recruitment
... Or choose your own

PAGE 4 NONPROFIT DATA DECISION-MAKING WORKBOOK • JANUARY 2013
Let’s drill a little more deeply into those questions. Refer to the questions you defined above by number.
QUESTION
Will the answer to this question help you improve as an organization?
Will your actions as an organization affect the answer to this question?
Can numbers help you answer the question?
Is the question testable? Can you create a hypothesis about a potential answer, and then test it?
Yes/ No
Why or why not?
Yes/ No
Why or why not?
Yes/ No
Why or why not?
Yes/ No
Why or why not?
1.
Yes Lately having too many cancellations and no shows
Yes The more or less patients we see affect productivity
Yes It is based on numbers
Yes Increasing patient motivation can increase attendance
2.
Yes Not receiving enough of new referrals
Yes The number of new referrals brings in more patients per therapist
Yes It is based on numbers
Yes Increasing marketing can bring in new referrals
3.
Yes Not enough patients for every therapist
Yes Therapists are not getting enough hours and units
Yes It is based on numbers
Yes Increasing patient attendance and referrals increase patient case load for each therapist
4.
Yes Schedule conflicts affect number of units
Yes Can help increase number of units per day
Yes It is based on numbers
Yes Changing or working with schedule and time can improve number of units
5.
Yes Patients are not motivated
Yes Increase motivation and thus attendance
yes Can be based on percentages
Yes Can be tested against other type of media
Think through the answers you gave above. For one or more of the questions, were you able to answer “Yes” in all of the boxes? If so, pick one of those questions to explore with this workbook, or combine multiple questions together to define one overarching question. (Note that if you combine multiple questions into one, you might want to plug it into the table above to make sure it fits all the criteria.)
Write your question here: How can we increase patient attendance, referrals and patient case load?
Did you answer “No” to at least one of the criteria for all of your questions in the table above? If so, those questions will be difficult to answer using metrics. Brainstorm some other questions that are important but also measurable to get to a place where you can define an action question that will be the framework for the remainder of this workbook.

PAGE 5 NONPROFIT DATA DECISION-MAKING WORKBOOK • JANUARY 2013
Board
Other
ED/CEO
Other Other Program Directors
Fundraising/ Marketing Directors
Other Line Staff Line Staff
Other
2. What Does This Question Mean To Your Organization?
What would different people in your organization want to know about this question in
terms of how it affects their own jobs? How much does each care about the information
at all? It’s likely that there are a number of different perspectives about it. Not sure what
people would like to know? Ask them...
In the mock organization chart below, do two things:
• In the small box in the upper left, define how important the information would be to each type of role in your organization (High, Medium, or Low).
• In the larger space in each box, list some of the key pieces of information that a person in that role in particular might be interested in seeing. Don’t worry about what’s possible or practical just yet, simply brainstorm what they’d ideally like to see.
Now that you’ve thought that through, do a reality check: Do other people care about this question too? If you’re the only person who really cares, is it an important question for your organization?
FOR EXAMPLE
High
• Summary of
attendance numbers
• High level
demographics
High
-Higher number of patients per therapist -Increased number of units -Higher productivity
-Higher productivity -Insurance approvals -Higher number of evaluations
-Higher number of patients to fill up schedule -Higher number of evaluations
-Higher number of patients under caseload
-Higher number of patients under case load
-Increase number of referrals
High High
High High High

PAGE 6 NONPROFIT DATA DECISION-MAKING WORKBOOK • JANUARY 2013
3. How Will You Know What the Right Metrics are?
Soon we’ll define metrics to help you answer your question. Metrics provide a numerical
yardstick to help you determine whether your efforts are making a difference—and if so,
in what direction. Before we go too far down that road, think through how you’ll judge
whether the metrics will actually help you define what you really want to know.
There are different ways to think about this. Pick one of the questions below that seems
to make the most sense in the context of your overall action question and write a brief description of what success will look like in this process.
1. What specific decisions do you want to be able to make based on the answer to your question?
Increase marketing to bring in more referrals and thus increase patient caseload.
Increase patient motivation to increase number of patient attendance.
2. ...OR What things will you need to understand in order to feel you have real knowledge to address your question?
Its important to understand what type of media, equipment or materials are needed to help patients to be more consistent. Knowing what their interest are, what they like and what specific things motivate them will assist in increasing attendance and case load.
3. ...OR Will any answer to your question feel like success, or will you need to achieve a specific result to feel successful?
In order to feel a sense of success, an increased motivation and attendance has to be observed at least with current patients.

PAGE 7 NONPROFIT DATA DECISION-MAKING WORKBOOK • JANUARY 2013
4. What Could You Measure?
There are a lot of different things you could measure for any given thing. Brainstorm the
different actions you could take that might have an impact on your overall question and
the metrics you could use to measure it. A metric is a number—often either a count or a
percentage—that measures your success in an area.
1. WHAT ACTIONS COULD YOU TAKE THAT WOULD HAVE AN IMPACT ON YOUR ACTION QUESTION?
Action
What metric could you use to
measure this?
Do you have the ability to affect the measurement? Is it something you
could change through your actions?
If you were to measure this,
how many people in your organization would care?
To what extent would seeing a measurement
for this help you improve your organization?
To what extent would
your org’s actions quickly result in a
change to the measurement?
Now sum up the last
three columns to create a Usefulness
Score
For instance, # participants, %
satisfaction, # units provided.
Answer Yes or No.
1= Almost No One
5= The Whole Organization
1= Only slightly 5= Completely transformed
1= Very hard to see change
5= Actions visibly change metric almost
immediately
Increase patient motivation
80% Yes 5 5 5 15
Continuing Ed. Courses in OT
80% Yes 5 5 5 15
Help marketing 20% Yes 4 4 5 13
Build good relationship with patient
80% Yes 5 4 4 13
2. WHAT ACTIONS COULD YOUR CONSTITUENTS TAKE THAT WOULD AFFECT YOUR ACTION QUESTION?
Action
What metric could you use to
measure this?
Do you have the ability to affect the measurement? Is it something you
could change through your actions?
If you were to measure this,
how many people in your organization would care?
To what extent would seeing a measurement
for this help you improve your organization?
To what extent would
your org’s actions quickly result in a
change to the measurement?
Now sum up the last
three columns to create a Usefulness
Score
For instance, # participants, %
satisfaction, # units provided.
Answer Yes or No.
1= Almost No One
5= The Whole Organization
1= Only slightly 5= Completely transformed
1= Very hard to see change
5= Actions visibly change metric almost
immediately
Help be creative
70% Yes 5 5 5 15
Continuing Ed. Course in Speech Therapy
80% Yes 5 5 5 15
Giving patient choice of appt. date and time
70% Yes 5 5 5 15

PAGE 8 NONPROFIT DATA DECISION-MAKING WORKBOOK • JANUARY 2013
4. What Could You Measure?
Get other dept to help with marketing
20% Yes 4 4 5 13

PAGE 9 NONPROFIT DATA DECISION-MAKING WORKBOOK • JANUARY 2013
3. WHAT ACTIONS COULD OTHER PEOPLE TAKE THAT WOULD AFFECT YOUR ACTION QUESTION EVEN IF THEY AREN’T IMMEDIATELY ASSOCIATED WITH YOUR ORGANIZATION?
Action
What metric could you use to measure
this?
Do you have the ability to affect the measurement? Is it
something you could change through
your actions?
If you were to measure this,
how many people in your organization would care?
To what extent would seeing a measurement
for this help you improve your organization?
To what extent would
your org’s actions quickly result in a
change to the measurement?
Now sum up the last
three columns to create a Usefulness
Score
For instance, # participants, %
satisfaction, # units provided.
Answer Yes or No.
1= Almost No One 5= The Whole Organization
1= Only slightly 5= Completely transformed
1= Very hard to see change
5= Actions visibly change metric almost
immediately
Insurance approval
40% No 5 5 5 15
Not appealing case
30% Yes 5 5 5 15
Not switching doctors
30% Yes 5 5 5 15
Draw a line through anything in the table above that you said in the third column you didn’t have control over. Here you should be focused on being able to measure and improve your own actions, so measurement of external factors is less relevant.
For the rest of the rows, based on which have the highest total score in the righthand column and your gut reaction to how well the total score reflects reality, choose six that seem promising for exploring your action question. For each, copy the metric, from the second column, and the overall sum for that row into into the table below.
Metric Sum (Usefulness Score) Increase patient motivation 80% 15
Help marketing 20% 13
Build good relationship with patients 80% 13
Help be creative 70% 15
Giving patient choice of appointment date and time 70% 15
Get other departments to help with marketing 20% 13

PAGE 10 NONPROFIT DATA DECISION-MAKING WORKBOOK • JANUARY 2013
5. What Data Do You Have?
The next step in this process is to identify the data sources for the metrics you’ve said
you’d like to track (if you can’t collect the data, then you won’t be able to track that
metric). For each of the six metrics you defined on the previous page, think through the
data you have that relates.
Metric (from previous
worksheet).
What related data is currently
manually entered into a system?
What related data is automatically
tracked by a system?
What additional relevant data about actions, perceptions, or processes could
your staff collect that they aren’t currently
collecting?
What related data could you get from
other organizations or public sources?
Looking across what you’ve written for each column, score the overall ease of
collecting data to get this metric.
1= Would require vast new
investment 10= We already have it
Increase patient motivation 80%
Data log to manually record therapeutic equipment and supplies we buy
No system utilized to compute data automatically
Buying latest therapeutic equipment such as game boards, cause n effect toys, balls
Comparing therapy equipment with other clinics
6
Help marketing 20%
Hours of Marketing Marketer keep track of information in log
No system utilized to compute data automatically
Marketing on new locations Find new ways of marketing
Research areas of greater needs Doctor clinics
5
Build good relationship with patients 80%
Visual Observation No system utilized to compute data automatically
How much they know about the subject
Research on how to build good relationships with patients and caregivers
10
Help be creative 70%
Data log to manually record craft supplies and activities
No system utilized to compute data automatically
What patients like or are interested in regards to crafts
Research new craft activities and supplies for holidays or special occasions
8
Giving patient choice of appointment date and time 70%
Data manually recorded in scheduler book
No system utilized to compute data automatically
Buy software that helps compute data faster and easier
Types of software available to best suit the needs of our patients
5
Get other departments involved in marketing 20%
Visual Observation No system utilized to compute data automatically
Suggest new ways for marketing
Research latest way of marketing
10
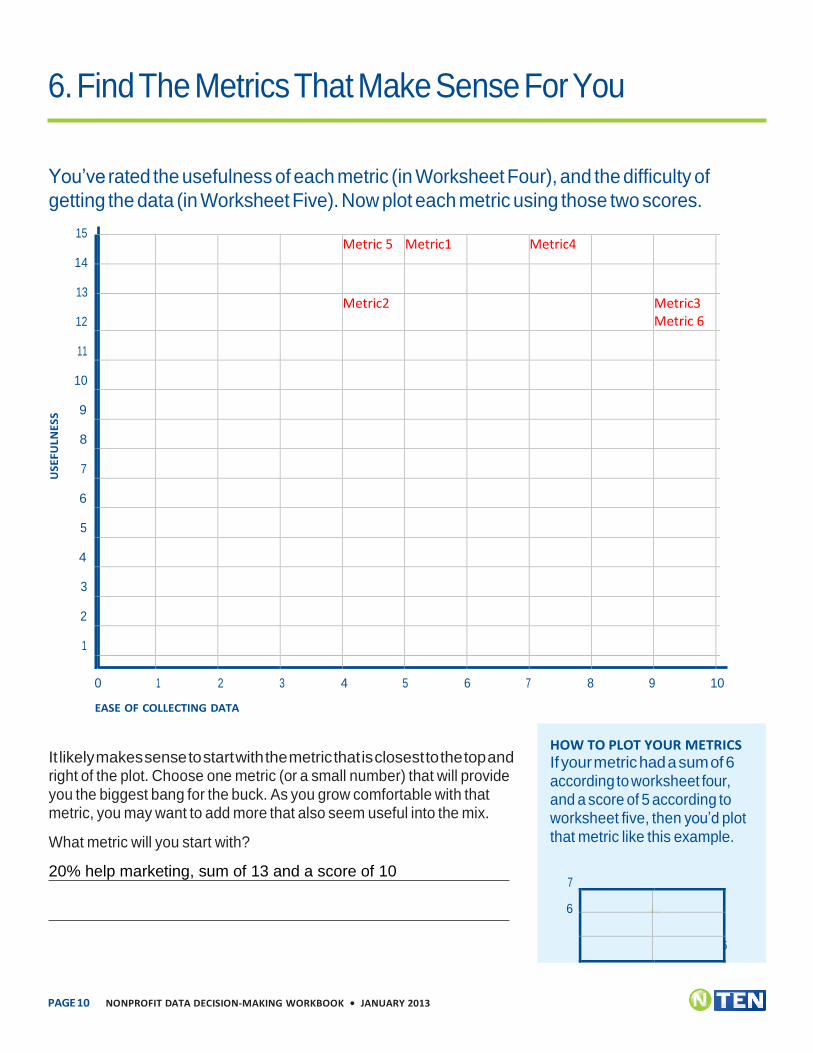
6. Find The Metrics That Make Sense For You
PAGE 10 NONPROFIT DATA DECISION-MAKING WORKBOOK • JANUARY 2013
HOW TO PLOT YOUR METRICS If your metric had a sum of 6 according to worksheet four, and a score of 5 according to worksheet five, then you’d plot that metric like this example.
7
6
5 6
You’ve rated the usefulness of each metric (in Worksheet Four), and the difficulty of
getting the data (in Worksheet Five). Now plot each metric using those two scores.
15
14
13
12
11
10
9
8
7
6
5
4
3
2
1
0 1 2 3 4 5 6 7 8 9 10
EASE OF COLLECTING DATA
It likely makes sense to start with the metric that is closest to the top and right of the plot. Choose one metric (or a small number) that will provide you the biggest bang for the buck. As you grow comfortable with that metric, you may want to add more that also seem useful into the mix.
What metric will you start with?
20% help marketing, sum of 13 and a score of 10
US
EF
ULN
ES
S
Metric 5 Metric1 Metric4
Metric2 Metric3 Metric 6

7. The Metric Creation Process
PAGE 11 NONPROFIT DATA DECISION-MAKING WORKBOOK • JANUARY 2013
Even if the data is readily at hand, the metrics won’t create and distribute themselves.
It’s important to map out the flow of how the data will become an accurate metric—both
to make sure you’ve thought it through, and to acknowledge the actual work that will be
required from your staff to ensure success. Think through this process for your metric.
How will you spot-check to ensure the metric accurately reflects reality?
By making sure correct data is being collected, measures are interpreted correctly and verifying if metric is useful.
Who’s in charge of this whole process?
Occupational Therapist Practitioner
Who creates the metric from the data?
Occupational Therapy Practitioner and Marketer
Who distributes it?
Occupational Therapy Practitioner and Marketer
Where is it stored?
Front Office for easier access
How is this data entered into a system?
Data needs to be entered manually by therapists or marketer
What’s the incentive to ensure it’s entered?
Increased patient case load, working hours, higher salary
Data Sources
Therapy Websites, Research, Doctors Clinics, Ability of staying competitive

PAGE 12 NONPROFIT DATA DECISION-MAKING WORKBOOK • JANUARY 2013
8. Define A Process for Using Them to Make Decisions
You not only need a process for creating your metrics—you need a process to actually use
them. This is one of the most critical steps. If a metric measures in a forest with no one
around to hear it, it does not make a sound...
How frequently will you check in on whether the metrics themselves are an effective way to measure what you’re trying to measure?
To be effective, data will be check every week to make sure we are not wasting time and losing on productivity.
How frequently will you create the metrics? Every Month
Who will they be distributed to?
To all Therapy Providers and Marketer
In what meetings will they be used?
Case Conference Meetings and Staff Meetings
How frequently will you plan to adjust your actions based on what the metrics say?
Every one or two weeks depending on necessary changes What decisions shouldn’t
be made without them?
No decision should be made without them

PAGE 13 NONPROFIT DATA DECISION-MAKING WORKBOOK • JANUARY 2013
9. Create an Implementation Action Plan
Congratulations! You’ve defined a strategy to create and use metrics to measure a
core question for your organization. But a strategy is one thing, and implementation is
another—to speed you on your way to a successful rollout of your metrics, think through
the implementation steps.
People You’ll Need to Get Onboard Who are the core individuals who will need to buy in? Think through both the official people who need to be onboard and the other people who might become barriers if they’re not included. List them below. Then think through the right way to include them in the process: Email? Presentation? Discussion?
Person or Group Method of Including Them
Chief Executive Officer/Administrator Email
Patient/Patient Care Giver Discussion
Occupational Therapy Registered/Certified Occupational Therapy Assistants Presentation/Staff Meeting
Speech Pathologist/Speech Pathologist Assistant Presentation/Staff Meeting
Front Office Staff Presentation/Staff Meeting
Marketer Presentation/Staff Meeting
Processes You’ll Need to Define On the previous worksheets, did you define processes for collecting, analyzing, or distributing metrics that need to be more fully fleshed out? If so, define what they are and how you’ll put more detail around them. Maybe another meeting? More documentation? A larger project?
Process Method of Defining
N/A

PAGE 14 NONPROFIT DATA DECISION-MAKING WORKBOOK • JANUARY 2013
Things You’ll Need to Allocate a Budget For Have you defined a process that involves things that you don’t already have–for example, a survey tool, a bar code scanner, a new staff member, or maybe a consultant to think it all through? Itemize anything new that needs to be paid for, and what process you’ll need to go through to select and purchase the product.
Item to Buy Purchase Process
New Therapy Equipment On-line Orders
New Craft Supplies Retail Stores
Office/ Appointment Software Retail Store/On-line Order
Printing Services for New Ways of Marketing Printing Service Provider
Other Things You’ll Need to Make Happen Are there other things that need to happen before you can move forward? List them here along with useful details.
Additional Step Details
Administration/Management Approval Waiting Period for Response
Increased Budget for Ordering Supplies Fund Availability
Increased Budget for Marketing Fund Availability
Get Staff on Board Waiting for Response
Those are your next steps–but they’re probably not in the right order.
Go back through that list and decide what you should do first: Talk to some people? Define a process? Put a number 1 next to that step. Determine what’s next and put a number 2 next to it. Continue through the whole list until you have an entire action plan in approximately the correct order.
And then… go start with the first item on your list!

PAGE 15 NONPROFIT DATA DECISION-MAKING WORKBOOK • JANUARY 2013
About NTEN NTEN, a 501(c)(3) nonprofit, is the membership organization of nonprofit technology professionals. As a community of nonprofit professionals, we aspire to a world where nonprofit groups of all types and sizes use technology strategically and confidently to fulfill their missions. Together, the NTEN community helps members put technology to work so they can bring about the change they want to see in the world.
NTEN facilitates the exchange of knowledge and information within our community. We connect our members to each other, provide professional development opportunities, educate our constituency on issues of technology use in nonprofits, and spearhead groundbreaking research, advocacy, and education on technology issues affecting our entire community.
About Idealware Idealware, a 501(c)(3) nonprofit, provides thoroughly researched, impartial and accessible resources about software to help nonprofits make smart software decisions. By synthesizing vast amounts of original research into credible and approachable information, Idealware helps nonprofits make the most of their time and financial resources.
Idealware specializes in combining traditional research techniques like interviews and surveys with software- selection methodologies—like detailed ratings of software tools against a rubric—to generate important new knowledge on affordable budgets. We then package our findings into approachable reports, articles, and trainings that help nonprofits make the on-the-ground decisions important to them.