Embed Size (px)
Citation preview
Getting Started in Physics Education Research 1
Getting Started in Qualitative Physics Education Research
Valerie K. Otero* and Danielle Boyd Harlow**
*School of Education, University of Colorado at Boulder, 249 UCB, Boulder, CO 80309-0249
**Gevirtz Graduate School of Education, University of California, Santa Barbara, CA 93106-9490
Abstract:
In this article, we introduce strategies and procedures for collecting and analyzing qualitative data and discuss other aspects of qualitative research such as the role of theory. There are multiple traditions of qualitative research, each with its own methods and terminology. Here, we provide a generic approach to qualitative research that is consistent with most qualitative research traditions. This article consists of nine sections: 1) Introduction, 2) Research Questions and Study Design, 3) Collecting Data, 4) Processing Data, 5) Coding and Analyzing Data, 6) Multiple Representations and Making Inferences, 7) Theoretical perspectives, 8) An Illustration of the Research Process and 9) Validity and Reliability in Qualitative Research. Throughout this article, strategies and examples are provided to help researchers that are both new and veterans to Physics Education Research (PER) to get started in qualitative PER.
Otero & Harlow Qualitative Research
Getting Started in Physics Education Research 2
1. Introduction
Many studies in PER have produced convincing quantitative results that have informed our understanding of how students learn physics. For example, PER studies have demonstrated higher learning gains in courses that use methods of interactive engagement than in courses that use traditional lecture methods, identified gender differences in students’ scores on standard assessments, and shown differences in students expectations for learning physics and that these views decline over a single semester.1-9 While these types of studies are very useful and provide much information about teaching and learning physics, researchers often want more detail that can help them better understand these types of replicable trends. This is why many PER researchers decide to engage in qualitative research studies. Qualitative research studies use different types of data and analysis methods than quantitative studies, but like quantitative studies, they use evidence to make and support claims about physics learning and teaching.
In this article we provide an introduction to strategies and procedures for collecting and analyzing qualitative data and discuss other aspects of qualitative research such as theoretical framing. There are many different traditions of qualitative research, such as discourse analysis, phenomenology, grounded theory, narrative analysis, and ethnography, to name a few.10-16 Each of these traditions of qualitative research has some things in common with the others, but each is replete with its own language, jargon, and terminology, often difficult for the novice researcher to work with. Hence, in this article we provide a generic approach to qualitative research that will allow researchers that are both new and veterans to the PER community to get started in qualitative PER.
Inductive analysis is a generic method for concisely representing features of interest in a mountain of qualitative data. Inductive analysis is the type of analysis in which the researcher seeks to derive trends, concepts, themes, or a model through multiple reads of the data. In a deductive approach, the researcher typically applies a priori criteria or assumptions and seeks to determine whether the data are consistent with them. Most qualitative analyses involve a little bit of both. In this article we will spend a majority of the time discussing the inductive analytic method. There are at least three reasons for doing inductive analyses:17
Otero & Harlow Qualitative Research
Getting Started in Physics Education Research 3
1. To condense extensive and varied raw text data into a brief, summary format,
2. To establish clear links between the research objectives and the summary findings derived from the raw data and to ensure that these links are both transparent (able to be demonstrated to others) and defensible (justifiable given the objectives of the research),11 and
3. To develop a model or theory about the underlying structure of experiences or processes that are evident in the text data (raw text).
The terms “model” and “theory” in qualitative research are typically used very differently than the way they are used in physics and in quantitative research. In qualitative research, the terms “theory” and “model” often refer to a generalized descriptive model of the data, a shorthand way of summarizing and conceptualizing the salient features of the data. After developing a descriptive model, the researcher can relate this model back to the theoretical framework in order to produce an explanatory model of the phenomenon in question. In this section we outline some of the differences between qualitative and quantitative research. In section 2, we discuss research questions and study design. Sections 3 and 4 take a detailed look at methods for collecting and processing qualitative data. In section 5 we discuss various methods for coding the data toward the development of a generalized descriptive model and in section 6 we discuss how inferences can be made from different representations of the data. Theoretical “framing” of a research study is discussed in section 7 and we explore the impact that theoretical frameworks have on all parts of the research process. A detailed example illustrating how a descriptive model that results from the coding and analysis can be transformed into an explanatory model is provided in section 8 and, finally, in section 9 we address issues of validity and reliability.
Before we begin to discuss how qualitative data is collected, analyzed and interpreted, it is useful to take a look at some of the differences between quantitative and qualitative data analysis. Some of these differences are listed in Table 1.18 As even Cook & Reichardt admit, this table presents the two research stances as more of a dichotomy than is typically actually the case. While Table 1 provides a useful place for starting a discussion about qualitative research, most research does not fit neatly into either side of the table.
Otero & Harlow Qualitative Research
Getting Started in Physics Education Research 4
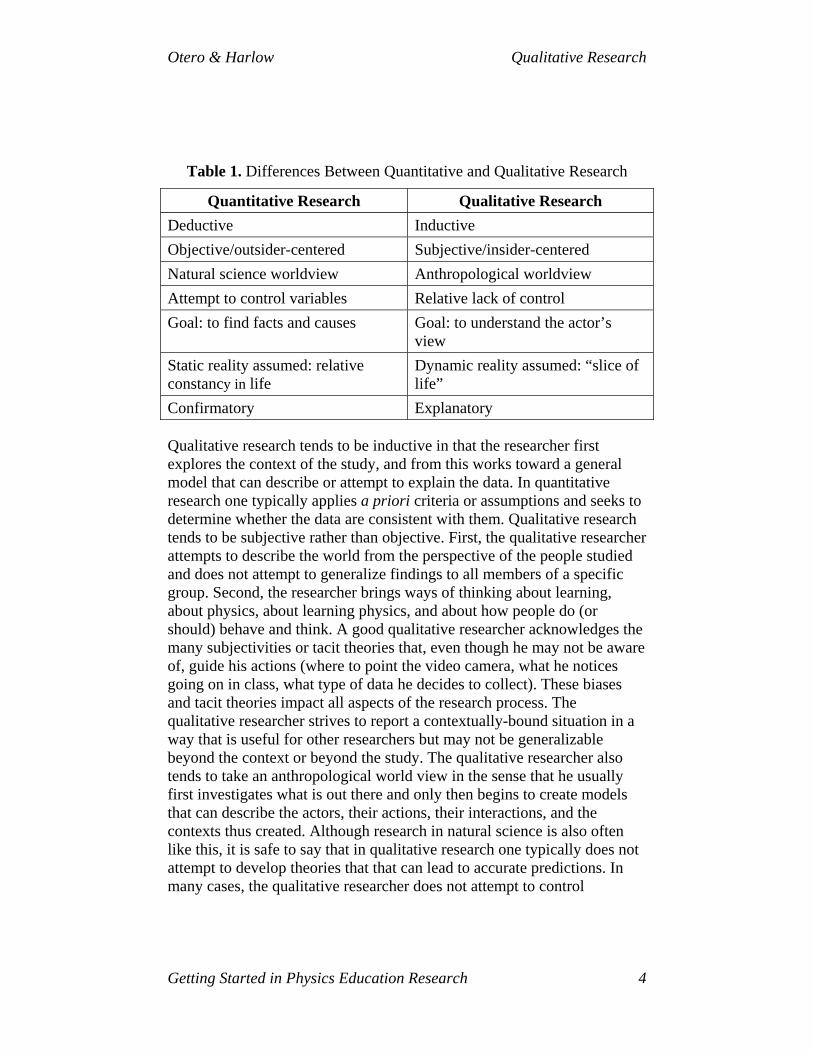
Table 1. Differences Between Quantitative and Qualitative Research
Quantitative Research Qualitative Research Deductive Inductive Objective/outsider-centered Subjective/insider-centered Natural science worldview Anthropological worldview Attempt to control variables Relative lack of control Goal: to find facts and causes Goal: to understand the actor’s
view Static reality assumed: relative constancy in life
Dynamic reality assumed: “slice of life”
Confirmatory Explanatory
Qualitative research tends to be inductive in that the researcher first explores the context of the study, and from this works toward a general model that can describe or attempt to explain the data. In quantitative research one typically applies a priori criteria or assumptions and seeks to determine whether the data are consistent with them. Qualitative research tends to be subjective rather than objective. First, the qualitative researcher attempts to describe the world from the perspective of the people studied and does not attempt to generalize findings to all members of a specific group. Second, the researcher brings ways of thinking about learning, about physics, about learning physics, and about how people do (or should) behave and think. A good qualitative researcher acknowledges the many subjectivities or tacit theories that, even though he may not be aware of, guide his actions (where to point the video camera, what he notices going on in class, what type of data he decides to collect). These biases and tacit theories impact all aspects of the research process. The qualitative researcher strives to report a contextually-bound situation in a way that is useful for other researchers but may not be generalizable beyond the context or beyond the study. The qualitative researcher also tends to take an anthropological world view in the sense that he usually first investigates what is out there and only then begins to create models that can describe the actors, their actions, their interactions, and the contexts thus created. Although research in natural science is also often like this, it is safe to say that in qualitative research one typically does not attempt to develop theories that that can lead to accurate predictions. In many cases, the qualitative researcher does not attempt to control
Otero & Harlow Qualitative Research
Getting Started in Physics Education Research 5
variables, preferring instead to observe the context as it is. However, there are times when a researcher wants to use qualitative techniques to conduct studies that are quasi-experimental. If so, the researcher will need to take some measures to control variables, although this looks very different than in quantitative research. Typically, in qualitative research the researcher establishes controls by defining a “matched sample” of participants. A matched sample is a group of individuals who have similar backgrounds as the study group but differ in ways that are relevant to the study. For example, a researcher might wish to study the effects that a retention program had on female graduate students. The researcher can establish a control group by finding female graduate students of similar age, GPA, and science backgrounds who did not take part in the retention program.
We say that qualitative research assumes a dynamic reality rather than a static reality because every descriptive or explanatory model that is created only claims to describe or explain a particular situation with particular subjects at a particular time. While it may be possible to make assumptions about other populations on the basis of a qualitative research study, the study only claims to describe the situation at hand. Very seldom does a qualitative research study seek to confirm results. There are studies that seek replication, but replication is difficult due to the contextual nature of these studies. Qualitative research can provide what is known as a “thick description” of a situation and the actors that shape it.19 This thick description can be extremely valuable for making further inferences about the types of motivations and actions that drive observable behaviors in similar situations. Overall, qualitative research is different from, but complementary to, quantitative research and both have their costs and benefits. In the sections that follow, we hope to point out the many benefits of qualitative research and demonstrate how it contributes to the PER literature base.
2. Research Questions and Study Design
A researcher typically begins a qualitative study with a research idea rather than with specific research questions. The research idea represents a broad sense of what the researcher is interested in knowing more about. The research questions are more specific than the research idea and have to do with what can actually be observed or measured in a particular research context. It usually takes careful consideration of the research idea and research context to come up with the actual research questions that will be investigated, and the research questions are sometimes changed
Otero & Harlow Qualitative Research
Getting Started in Physics Education Research 6
throughout the process of data collection and analysis. Some qualitative research traditions recommend that the researcher does not go in with specific research questions.13 According to this reasoning, the research questions will emerge from the study context and participants and less bias is introduced if the questions are established later. Peshkin describes an evolutionary stance whereby qualitative researchers enter a research setting with some ideas about what they will find and yet remain open to changing the research question or focus as they become more familiar with the research setting.20 We do not take a stand on whether the research questions or study design should be established before or after the study begins; there are good arguments for both and bias is introduced to the study no matter what you do, as we will discuss later.
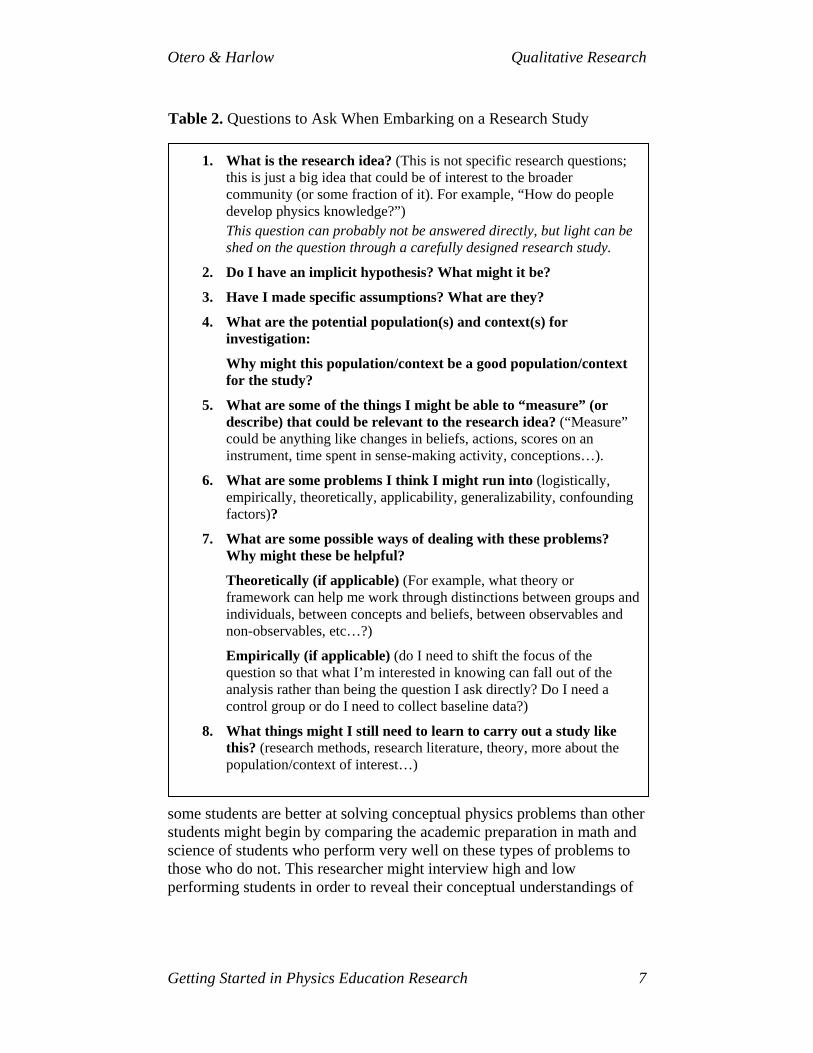
It is not always clear whether the theory drives the research design or whether the study design drives one’s choice of theoretical perspectives. Most often it is a bit of both. In either case, the research questions and the answers to these questions are situated within the work of a broader community. Table 2 presents some questions that the researcher might ask oneself when beginning to develop research questions.
In the first question, the “research idea” represents the broad issue to which the researcher hopes the findings can contribute but that he probably could not resolve on his own. By recognizing the research idea, the researcher can begin to frame a study, recognize his own interests, and begin to craft specific research questions that can contribute to the broader question of interest to a larger community. For example, the researcher might want to know why courses that use interactive engagement yield higher learning gains than those that use traditional lecture methods, or he may wish to investigate the costs and benefits of using computer simulators versus laboratory apparatus in the physics classroom. Both of these questions are big questions and would be difficult to answer in a reasonable amount of time and with the resources and settings available to a single researcher. However, as we see below, the researcher can design some questions and a study that can shed light on these bigger issues.
Questions 2 and 3 in Table 2 ask the researcher to do his best to reveal, often to himself, his theoretical assumptions relevant to the research idea. These assumptions could relate, for example, to his views of learning, his experience teaching and learning physics, or his knowledge of related research literature. As the researcher works to reveal tacit assumptions, his framing begins to come clear and questions begin to come into focus. For example, a researcher interested in investigating the broad issue of why
Otero & Harlow Qualitative Research
Getting Started in Physics Education Research 7
1. What is the research idea? (This is not specific research questions; this is just a big idea that could be of interest to the broader community (or some fraction of it). For example, “How do people develop physics knowledge?”) This question can probably not be answered directly, but light can be shed on the question through a carefully designed research study.
2. Do I have an implicit hypothesis? What might it be?
3. Have I made specific assumptions? What are they?
4. What are the potential population(s) and context(s) for investigation:
Why might this population/context be a good population/context for the study?
5. What are some of the things I might be able to “measure” (or describe) that could be relevant to the research idea? (“Measure” could be anything like changes in beliefs, actions, scores on an instrument, time spent in sense-making activity, conceptions…).
6. What are some problems I think I might run into (logistically, empirically, theoretically, applicability, generalizability, confounding factors)?
7. What are some possible ways of dealing with these problems? Why might these be helpful?
Theoretically (if applicable) (For example, what theory or framework can help me work through distinctions between groups and individuals, between concepts and beliefs, between observables and non-observables, etc…?)
Empirically (if applicable) (do I need to shift the focus of the question so that what I’m interested in knowing can fall out of the analysis rather than being the question I ask directly? Do I need a control group or do I need to collect baseline data?)
8. What things might I still need to learn to carry out a study like this? (research methods, research literature, theory, more about the population/context of interest…)
some students are better at solving conceptual physics problems than other students might begin by comparing the academic preparation in math and science of students who perform very well on these types of problems to those who do not. This researcher might interview high and low performing students in order to reveal their conceptual understandings of
Table 2. Questions to Ask When Embarking on a Research Study
Otero & Harlow Qualitative Research
Getting Started in Physics Education Research 8
the topics addressed in the conceptual questions. This researcher has made the assumption that success in solving conceptual physics problems is related to the extent to which the student understands the physics. This seems like a reasonable assumption and the researcher has designed the study to with a purposeful sampling method, selecting students on the extremes of performance. However, another researcher interested in the same question might begin by interviewing students in attempts of understand differences in ways that they view their role as a student in a physics class at a university. This researcher might also investigate what students actually think they are being asked to do when they are confronted with a physics problem, and only later check to see how this sample of students actually performed on conceptual exams. This researcher has assumed that there may be more to success in a physics course than content knowledge alone and that social and cultural issues (such as what it means to be a physics student) might be associated with success in solving a physics problem in a classroom setting. Both of the studies discussed above will yield results that will contribute to the community’s understanding of differences in students’ performance on conceptual physics problems, but each study will require different methods, and each study makes specific assumptions about what constitutes learning and success in physics classrooms. The sooner the researcher makes his or her assumptions explicit, the easier it is to catch potential pitfalls in the research design.
Question 4 in Table 2 is designed to help the researcher focus her research questions on the population in which she is interested. Is she interested in non-physics majors or physics majors? Is she interested in physics students or physics teachers? The answer to this question will not only determine the particular physics course in which she conducts her research but also the direction that her questions will take. A whole different set of questions can be asked about undergraduate students in a course for non-majors than about physics graduate students in their final year of graduate school. In addition, the researcher has to be realistic about the population(s) to which she has access. This too, will greatly determine the scope of the research questions.
Question 5 in Table 2 gets to the heart of what a research question is. It asks what things might be measurable or observable, given the research idea, the research contexts, and the potential study populations available to the researcher. The research question must be focused and must suggest some type of measurement. The term “measurement” here should be defined broadly. For example, the researcher might have access to the
Otero & Harlow Qualitative Research
Getting Started in Physics Education Research 9
recitation sections in which the University of Washington Tutorials for Introductory Physics are implemented. The researcher could “measure” qualitatively how the students interact with the activity documents and ways in which they interact with one another by videotaping them as they work through a tutorial. One can imagine that the researcher can observe certain trend-like behaviors within the group or among individuals that make up the group (after watching the videotape several times). These trends represent signals or measurements that can later be compared to one another or to similar measurements that used different groups in the same context or different contexts.
Questions 6 and 7 help the researcher anticipate possible problems and ways of dealing with them either theoretically or empirically. For example, a researcher might want to compare a group of physics students working only with computer simulators (no laboratory apparatus) to a group of physics students working only with laboratory apparatus, but institutional constraints will not allow for the creation of these treatment groups. Therefore, the researcher is stuck observing students as they move through some activities that involve the simulator, some activities that involve the laboratory apparatus, and some in which they are using both at the same time. This will prevent him from asking certain questions, however, he can deal with issues either theoretically or empirically. Empirically, he might ask the instructor if half the class can do the simulator first then the laboratory apparatus and the other half of the class can do the laboratory apparatus first and then the computer simulator. This type of modification slightly changes the direction of the research; thus, the researcher must be thinking of these types of threats ahead of time so he can account for them in his research questions and research design. To deal with these issues theoretically, the researcher might draw on a theoretical perspective such as a resource perspective (discussed in more detail later) and re-think his study so that he looks at differences in the cognitive resources that are cued by the laboratory apparatus versus the computer simulator.
Finally, Question 8 asks the researcher what he might still need to learn in order to carry out his research program. Of course, there is always more learning that can be done, but the researcher should come to terms with this as early as possible so that the data collected is as useful as possible in the construction of a descriptive and explanatory model of the phenomenon of interest.
Otero & Harlow Qualitative Research
Getting Started in Physics Education Research 10
Once the researcher has decided on a research idea and has developed initial research questions (even if these do not end up being the final research questions), he must determine how, when, and what type of data to collect to help answer his question.
3. Collecting Data
Qualitative studies involve the collection of descriptive non-numerical data. In this section, we first discuss issues to consider when planning data collection and gaining access to research contexts. We then describe issues specific to five common sources of qualitative data: observations, interviews, artifacts, surveys, and electronic forums. Finally, we conclude this section with a discussion of the concerns specific to collecting data through video recording.
3.1 General issues with data collection
3.1.1 What is the unit of analysis? (What data will be collected?)
Researchers who do qualitative studies may seek to understand how individuals think or how they interact with others. Alternatively, they may look at group dynamics or how the context and individuals reciprocally influence one another, or they may look at classrooms or institutions. In each of these cases, the unit of analysis (also referred to as grain size) differs considerably. The unit of analysis is what the researcher wants to study and should guide appropriate data collection. For example, if a researcher observing a group of children constructing electric circuits wanted to understand Jenna’s ideas about current, then the researcher would focus his observations on Jenna. In this case, the unit of analysis would be one child, Jenna. Alternatively, if the researcher was seeking to understand how a group of students collaboratively arrived at an understanding of parallel circuits, then the unit of analysis would be the entire group and his observations would focus on the interactions and statements that represent the entire group. The unit of analysis can be as small as the individual (or the ideas of the individual) or as large as the institution (or the culture in which the institution is embedded.) As will be discussed in the section on analyzing data, it is usually possible to analyze a single set of data with a variety of units of analysis. Determining the grain size for data collection is only the first time the researcher must be cognizant of the unit of analysis.
Otero & Harlow Qualitative Research
Getting Started in Physics Education Research 11
3.1.2 How much data will you collect?
Qualitative data collection is often limited by the time and expense necessary to collect and analyze it. Ideally, enough data has been collected when additional data does not reveal anything new. Realistically, external constraints such as the end of the semester or end of funding will impact decisions about when data collection ends. The number of participants in qualitative studies is necessarily much smaller than that of quantitative studies. In some cases, researchers may choose to study only one individual or context. Other studies may look across a handful or dozens of individuals or contexts. The fact that qualitative research often deals with small numbers of participants means that it is often desirable to purposefully select participants who will provide the greatest insight into the research problem. This differs from the random selection of participants often used in quantitative studies that are used for generalization across populations. When purposefully sampling, the researcher carefully chooses his subjects according to some pre-selected criteria. Patton describes a variety of possible criteria for choosing subjects. These include, among others, extreme cases, information-rich cases, maximum variation, typical cases, convenience samples, and criterion samples which select all the participants that meet a particular sample.21 The selection criteria for the research participants should be done carefully considered with respect to the research questions. For example, if the intent of the study is to understand the best practices in solving physics problems, one may choose to recruit only students who are in the top quarter of the class or who score the highest on a particular exam. In contrast, another study of problem solving skills may choose to sample by selecting participants that represent the widest range of experiences or abilities with the selected topic.
3.2 Types of data
In qualitative research, many types of data are collected. For example, classroom observation data may help a researcher understand what an instructor actually does while teaching a physics course, whereas an interview of the instructor may shed light on the instructors’ goals and intentions. Here, we describe the primary methods by which qualitative data is collected and highlight some of the advantages and concerns specific to each method.
Otero & Harlow Qualitative Research
Getting Started in Physics Education Research 12
3.2.1 Interviews
Interviews are an important method of collecting data. Critical steps taken prior to and during an interview include 1) determining the type of interview, 2) developing an interview protocol, and 3) asking questions.
Determine the type of interview. Interviews most often take the form of a researcher asking questions of an individual participant. However, interviews may take a variety of forms. Several types of interview formats that may be useful in PER studies are listed below.
Types of Interviews:
• Individual
• Focus Group
• Unstructured
• Semi-structured
• Structured
• Think-aloud interview
• Stimulated-recall interview
• Artifact-based interview
Individual vs. Focus Group. In an individual interview, one interviewer asks questions of one interviewee. Individual interviews allow for researchers to attribute ideas and thoughts to a single participant. Focus group interviews involve more than one interviewee. Focus groups have been used extensively by marketing research because participants are sometimes trigged by other participants’ responses generating a wider range of responses.22 One downside of focus group interviews is that ideas and opinions cannot be attributed to an individual.
Unstructured vs. Semi-structured vs. Structured Interviews. Interviews vary in the degree to which the interview as a whole and the individual questions are structured. Some researchers have just a general list of topics that they would like to discuss but let the conversation flow in as natural a way as possible. Others have a list of questions that they ask in as much of the same way as possible with every participant.
Otero & Harlow Qualitative Research
Getting Started in Physics Education Research 13
Very open-ended questions or prompts allow the participant the freedom to respond in many different ways. For example, when responding to the prompt, “Please tell me about your teaching,” the interviewee may talk about the topics she teaches, the challenges she faces teaching a particular group of students, or about the changes she wants to make to her classroom next year. This form of questioning may lead to unexpected information and rich descriptions. However, it may be inefficient at gathering the particular type of data the researcher desires. At the other end of the spectrum, very structured questions may constrain the responses of the participant to such a degree that the information obtained may be no richer than what could be obtained with a survey. For example, the question, “What text book do you use?” requires only a couple of words from the respondent. Semi-structured interviews fall in between these two extremes or use questions of both types. An example of a semi-structured prompt might be, “Please describe your most effective physics lesson.” This type of question facilitates comparison across multiple participants but also allows the participant to answer with more depth. One may also choose to ask a structured question and follow it up with a semi-structured question (e.g., “What textbook do you use?” could be followed by “And what do you find to be the strengths of that textbook?”).
Other Formats: Think aloud, Stimulated-recall, and Artifact-based interview. Think aloud, stimulated-recall and artifact-based interviews all use external artifacts or experiences to focus the interviewee’s attention. An artifact is anything created or modified by the subjects such as homework, tests, drawings, etc. In a think-aloud interview, the participant is engaged in an activity (e.g., using a computer simulation, solving a physics problem) and is asked to articulate his thoughts while engaged in the activity.23 This format has been used to understand problem solving practices, to evaluate software, and to understand what students are thinking as they interact with computer simulations or physics problems.24,25
In stimulated recall interviews, the participant watches herself on video and talks about what she was thinking about at the time. This sort of method could be used, for example, with video recordings of students learning or with video tapes of teachers teaching to better understand instructional decisions or the knowledge they draw on while teaching.26
Stimulated recall interviews are also often used to help the researcher check his inferences about students’ ideas, intentions, or behaviors. In an artifact-based interview, the participant discusses and responds to
Otero & Harlow Qualitative Research
Getting Started in Physics Education Research 14
questions based on a particular artifact, such as a completed homework assignment, a lesson plan, a test, or a graph.27
Develop an interview protocol. Prior to conducting an interview, a researcher should consider both the format and the content of the interview. That is, the researcher should decide whether a flexible format in which the participant can talk about any topic or a more closely moderated interview format will be more likely to elicit the desired data. This information (unstructured, semi-structured, or structured format) and the questions or topics of discussion for the interview should be included on an interview protocol. An interview protocol is a written tool that an interviewer uses to guide the interview. It is particularly important to develop an interview protocol when conducting research as a team. When multiple people are separately conducting interviews, a standard protocol that is used by all interviewers will facilitate comparisons across interviews. Generally, an interview protocol consists of three parts: an introduction, a set of questions or topics, and a closing statement. The introduction should introduce the researcher and the study (unless the participant is already familiar with the researcher and/or study) and lay out the desired behavior of the participant. If the interview will be recorded, asking the interviewee’s permission to do so should also be done at this point. The date and time are also often included. For example, a research protocol might begin with the following opening statement:
“Thank you for agreeing to participate in this interview. I am a graduate student (or professor) at State University and am studying undergraduate science and math majors’ perceptions of graduate school. Do you consent to me asking you some questions about your current experiences and your views of graduate school? Please feel free to ask for clarification of any question that you do not understand. Also, you should not feel confined to answer only the questions asked. They are meant to be conversation starters.”
Writing out an introductory statement ensures that all interview subjects are given the same instructions. Notice that in the introductory statement above, the interviewee was advised not to feel constrained by the particular question. A researcher with different research goals might provide different expectations.
The second part of the interview protocol (the questions to be asked), is the most important part of the protocol. Careful consideration of the questions will increase the likelihood of useful responses. Questions may
Otero & Harlow Qualitative Research
Getting Started in Physics Education Research 15
either be very specific such as, “What is your current major?” or open-ended such as, “Why did you decide to major in physics?” When constructing the interview protocol, a researcher should also consider the order of the questions. Often, it is helpful to begin the interview with easier, more structured questions to give the interviewee time to become comfortable before expecting him to answer more open-ended questions.
Finally, the interview protocol should include a closing. This may be as simple as the statement, “Thank you for participating in this interview.” Additionally, the closing statement may include a final question asking if the interviewee has anything to add or a request for permission to contact the interviewee in the future if additional questions arise.
Conduct the Interview. During the interview, the interviewer should be aware of the flow of the conversation and probe the interviewee for clarification or more depth. In semi-structured interviews, the researcher should be flexible in following the protocol, making sure to acquire the desired data but following interesting topics when presented. It is also important for the researcher to be aware of common conversational habits such as finishing the other person’s sentences or asking leading questions that would be undesirable in an interview and significantly bias the data. It is very natural to impose one’s own interests upon an interview and researchers can unintentionally move the interview in a different direction than the interviewee was moving. It is critical to check oneself constantly throughout the interview to make sure that one’s comments are kept to a minimum and are as generic as possible. Examples of comments that can lead the interviewee to expand on his thinking include generic statements such as a long drawn out, “sooo” or explicit statements such as “please say more about that.” In interviews with multiple participants at the same time (focus group interviews), the researcher has the additional responsibility of attending to group dynamics and making sure all participants have the opportunity to talk. In all interview situations, the researcher must gain the trust of the participant(s) and establish rapport.
During an interview, it is useful to have paper and pens available in case the participant can express something better in a drawing than in words. A participant may want to draw a graph to describe how a student represented her ideas (if the interviewee is a teacher) or to draw diagrams to represent her own thinking. A teacher might want to draw the layout of a classroom she teaches in or thinks would be ideally suited for physics learning. The researcher can later take a photo of the drawing with a
Otero & Harlow Qualitative Research
Getting Started in Physics Education Research 16
digital camera or scan the drawing to keep a computer record of it so it can be used as data and easily located during analysis.
Record the Interview. While opinions differ as to whether it is better to record interviews through the use of handwritten notes or through audio or video recording devices, we take the position that it is highly desirable to record an interview (with the participant’s consent). While some participants may find the equipment intrusive, this discomfort generally fades quickly and the quality of data collectable through audio and video recording is far superior to what can be accomplished through note taking alone. While audio taping is often sufficient for interviews, video taping has the advantage of recording the participant’s facial expressions, gestures, and drawings that the participants may create to illustrate her point. Video recording interviews is also important when using think-aloud interviews to investigate how learners interact with computer simulations, physical equipment, or other tools in a learning context. If the interview is being recorded with audio or video equipment, make sure that it is turned on and operating prior to the interview.
In summary, while planning for an interview, the researcher should consider the number of interviewees that will be interviewed at a time and the degree of structure of the interview in addition to the more obvious challenging of determining questions and discussion topics that will elicit useful data. This information should be documented in an interview protocol. During an interview, the researcher should remain conscious of his role in the conversation and avoid steering the discussion in ways that bias the data unnecessarily.
3.2.2 Surveys
Surveys are an efficient method of gathering data. In the respect that a survey or questionnaire is a method of asking questions of participants, it serves much the same role as an interview. The advantage of surveys over interviews is that they require less time to administer and thus data may be collected from a greater number of participants. Surveys should be tested with a sample from the same population as the participants (often in a think-aloud format) so that researchers can reasonably expect that the questions are interpreted by the participants as the researchers intended. Surveys can be administered in person, through the mail, in paper-and-pencil format, or electronically using websites that are designed to distribute surveys (e.g., QuestionProTM, GoogleTM Forms,
Otero & Harlow Qualitative Research
Getting Started in Physics Education Research 17
SurveyMonkeyTM) or classroom management systems (e.g., BlackboardTM, MoodleTM, WebCTTM, SakaiTM).
3.2.3 Artifacts
Artifacts can be important sources of data. Artifacts may include, for example, lesson plans, student drawings of their ideas, worked out problem sets, course syllabi, instructor comments on student work, or student or instructor journals. These sorts of artifacts may be collected directly or may be collected electronically through scanning or by taking photographs of the artifacts with a digital camera. Photographs of classrooms (including the things that teachers choose to hang on the wall or the layout of the classroom) may provide valuable information about the learning environment. Artifacts such as completed homework assignments and tests can be valuable for checking the validity of claims made from other forms of data.
3.2.4 Electronic Sources of Data
Conversations on threaded discussion boards and in electronic chat rooms, as well as students’ responses to online homework, are an additional source of data. As online forums become a more prevalent learning context, understanding what happens in these contexts will be important. In addition, the interactions between participants in collaborative online forums may provide important insights into more general questions about teaching, learning, and interaction.
3.2.5 Observations
Observations provide an opportunity for a researcher to collect information about an activity as it occurs. During an observation, the following steps must be taken prior to and during a qualitative observation: 1) determining the role that the researcher will play in the learning context, 2) creating or adopting an observation protocol, and 3) recording the observation. Each of these steps is described in detail below.
Determining the role of the researcher. When observing, the researcher should be aware of his or her role, which can range from fully participating in the context (often termed participant-observer) to participating in the learning context as little as possible or not at all, though some would argue that it is impossible to completely eliminate the researcher’s influence on the research context. Proponents of participant-
Otero & Harlow Qualitative Research
Getting Started in Physics Education Research 18
observer models argue that engaging as a full participant in a context allows a researcher to gain greater access and insights into the situation, as is often done in anthropological research. In educational research, this may mean that the researcher is also a teacher, student, or an assistant in the classroom. This may make collecting data at the time of the observation challenging, and researchers adopting a participant-observer role may choose to write up field notes soon after observing or may choose to enlist assistance in recording the observation. Spradley’s book, Participant Observation, includes a detailed description of how to do fieldwork using the method of participant observation.28
Researchers may instead choose not to participate in the research context, but rather to remain as unobtrusive as possible. The role of non-participant observer allows for the researcher to collect data at the time of the observation. Many researchers take a role that falls somewhere between these two extremes of participant observer and non-participant or move flexibly between these roles.
Observation Protocols: Focusing the Observation. Observation protocols are developed prior to an observation to focus the observer’s attention on relevant aspects of the research context. The structured focus afforded by observation protocols is especially important in complex learning environments such as classrooms. In addition, for research groups, protocols increase the likelihood that multiple observers will pay attention to the same elements of the context. Depending on the goals of the study, observations may range from focused (e.g., noting the number and content of clicker questions asked by an instructor) to very open ended (e.g., observing how students and teachers respond to a new classroom format). Likewise, protocols range from lists of topics that deserve attention to more constrained tables and checklists on which observed activities are noted and tallied. Researchers may choose to develop an observation protocol or may use a protocol developed by another research team (e.g., the Reformed Teaching Observation Protocol (RTOP). The RTOP consists of 5 categories ranging from “lesson design” to “classroom culture.” Within each category a handful of specific items are presented and the observer uses a Likert scale to note whether the item is present in the instructional episode or not.29 Note that this type of protocol quantifies qualitative data. Borrowing protocols facilitates comparisons across multiple research studies but may not match the goals of any one research program as ideally as a new protocol developed for a specific study. However, many widely used existing protocols have undergone extensive validity studies.
Otero & Harlow Qualitative Research
Getting Started in Physics Education Research 19
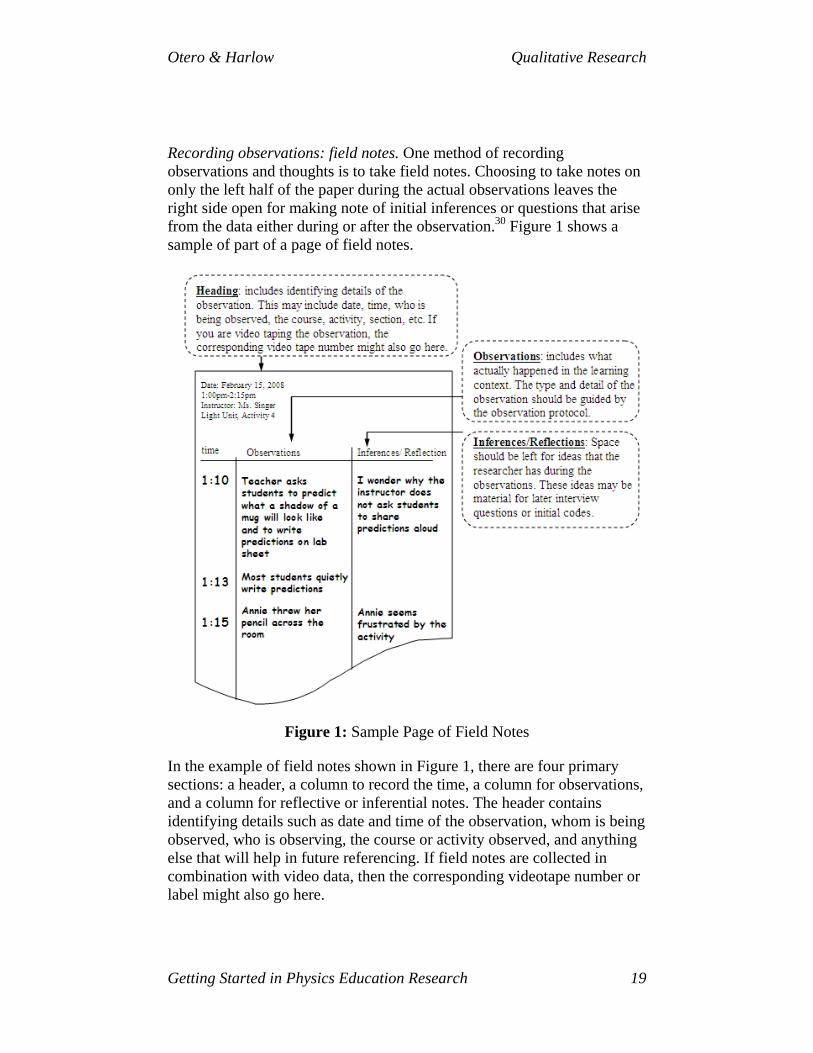
Recording observations: field notes. One method of recording observations and thoughts is to take field notes. Choosing to take notes on only the left half of the paper during the actual observations leaves the right side open for making note of initial inferences or questions that arise from the data either during or after the observation.30 Figure 1 shows a sample of part of a page of field notes.
Figure 1: Sample Page of Field Notes
In the example of field notes shown in Figure 1, there are four primary sections: a header, a column to record the time, a column for observations, and a column for reflective or inferential notes. The header contains identifying details such as date and time of the observation, whom is being observed, who is observing, the course or activity observed, and anything else that will help in future referencing. If field notes are collected in combination with video data, then the corresponding videotape number or label might also go here.
Otero & Harlow Qualitative Research
Getting Started in Physics Education Research 20
In the example, the statements written in the observation column describe only what the observer saw and heard and does so as objectively as possible. The nature and level of detail of the recorded observations should be determined by the observation protocol. At this point, a researcher should take care to distinguish between observations (e.g., “Annie threw her pencil across the room” and inferences (e.g., “Annie was frustrated by the activity”).
In the right-hand column of this sample are inferences and reflections by the observer that occur during the observation or when reading field notes after the observation. In the example shown in Figure 1, the researcher made a note that he wondered why the instructor made a particular instructional decision that could be clarified in a follow-up interview. This would also be an appropriate place to write inferences made from the observations (e.g., “Annie seemed frustrated by the activity.”) Other items that might be written in this column would include initial thoughts about themes or patterns that could be checked in the data later or that might influence the nature of future observations.
Observations may also be recorded through video recording, which has some advantages over field notes alone, as well as many additional concerns.
3.3 Special considerations for video and audio recording of data
Video recording is an efficient method of capturing interactions and actions. As such, video taping of observations is becoming increasingly popular in the PER community and within the wider education community. Video recordings have many advantages over field notes alone. Field notes are inherently selective because, by their very nature, the researcher chooses what to write down, documenting what interests him at the time of the observation and failing to document most of what goes on in a classroom. Videos may be watched over and over again by multiple observers, allowing for patterns to be recognized that may have been missed during an observation. In addition, video data provides a richer representation of an event - recording not only talk, but also gestures, body language and facial expressions.
Otero & Harlow Qualitative Research
Getting Started in Physics Education Research 21
3.3.1 Prior to collecting data
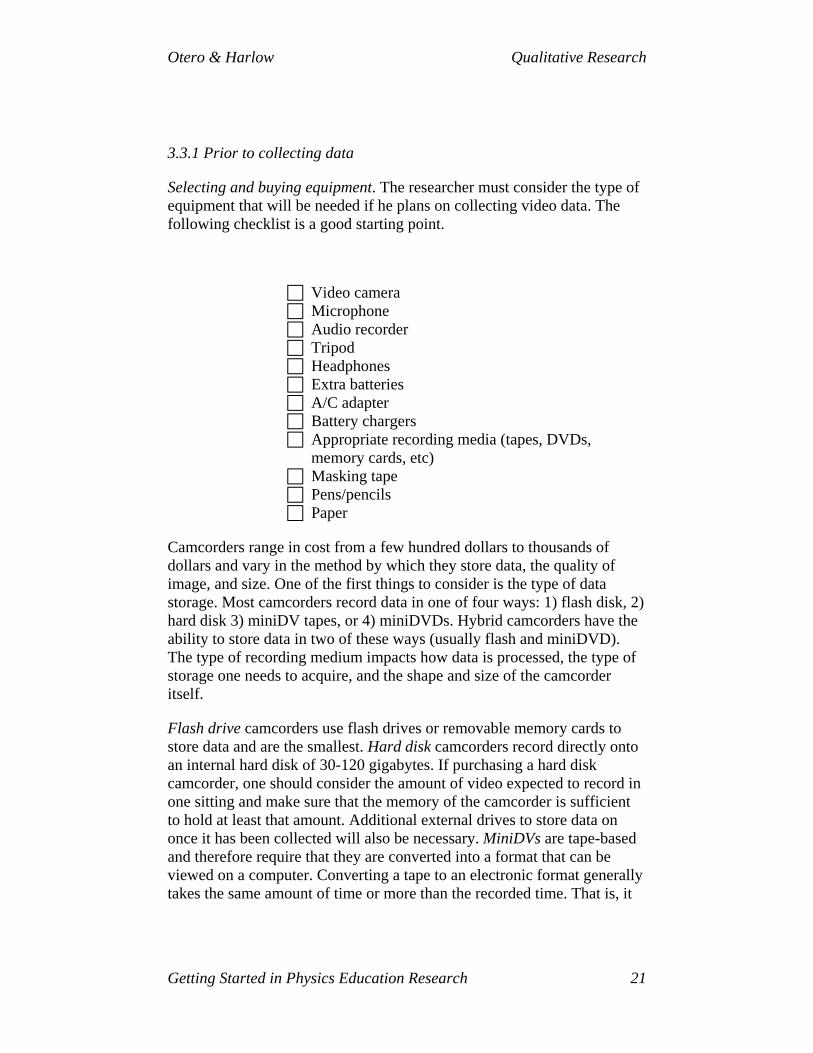
Selecting and buying equipment. The researcher must consider the type of equipment that will be needed if he plans on collecting video data. The following checklist is a good starting point.
Video camera Microphone Audio recorder Tripod Headphones Extra batteries A/C adapter Battery chargers Appropriate recording media (tapes, DVDs, memory cards, etc)
Masking tape Pens/pencils Paper
Camcorders range in cost from a few hundred dollars to thousands of dollars and vary in the method by which they store data, the quality of image, and size. One of the first things to consider is the type of data storage. Most camcorders record data in one of four ways: 1) flash disk, 2) hard disk 3) miniDV tapes, or 4) miniDVDs. Hybrid camcorders have the ability to store data in two of these ways (usually flash and miniDVD). The type of recording medium impacts how data is processed, the type of storage one needs to acquire, and the shape and size of the camcorder itself.
Flash drive camcorders use flash drives or removable memory cards to store data and are the smallest. Hard disk camcorders record directly onto an internal hard disk of 30-120 gigabytes. If purchasing a hard disk camcorder, one should consider the amount of video expected to record in one sitting and make sure that the memory of the camcorder is sufficient to hold at least that amount. Additional external drives to store data on once it has been collected will also be necessary. MiniDVs are tape-based and therefore require that they are converted into a format that can be viewed on a computer. Converting a tape to an electronic format generally takes the same amount of time or more than the recorded time. That is, it
Otero & Harlow Qualitative Research
Getting Started in Physics Education Research 22
will take 60 minutes to convert a 60-minute tape into a file that is editable on your computer. It may take additional time to compress the file into a format such as MPEG. MiniDVD’s have an advantage over MiniDV’s in that they can be instantly uploaded to your computer for editing. However, unlike the other formats, raw video files cannot be easily accessed on a miniDVD. The way miniDVDs are made requires that the data are already compressed before they are written onto the DVD. Therefore, once the mini-DVD is made, one cannot easily access the raw data and this makes it difficult to edit high-quality formats. Another consideration when choosing a camcorder is the placement of the tape or DVD in the camera. Some cameras are designed so that the camera must be removed from a tripod in order to eject and change a tape, which can interrupt data collection.
Many cameras do not have sufficient audio capabilities for collecting reasonable classroom data. Thus, it may be necessary to purchase external microphones. Microphones differ according to whether they are unidirectional (detect sound only from a single direction) or omni-directional (pick up sound from all directions). Microphones also come in different shapes and sizes based on whether they are designed to be placed on a desk, attached directly to the camcorder or clipped to a shirt. Additionally, one may want to purchase a digital audio recorder (or an attachment microphone for an mp3 player that will allow it to record sound) for use in interviews. Finally, one will need a tripod and headphones for video recording, a bag full of extra batteries, tapes or miniDVD’s (if appropriate), battery chargers, masking tape, markers, and A/C adaptors.
Checking operation of equipment. A common problem in video recording is equipment failure. One should always bring along extra batteries (and AC adaptor when available) for both the camera and microphones. Bring tape to secure microphones to desks or to tape wires to the floor. Check that the equipment works prior to the observation or interview.
Developing a protocol – determining what will be recorded. Video collection is not immune to the effect of the researcher’s subjectivities. Video recordings are limited by where the camera is pointed and the field of view. Choosing to follow the teacher with the camera results in the loss of information about what the students who do not happen to be interacting with the teacher are doing. Zooming in on a student’s paper may allow the researcher to read what a student writes, but may miss gestures that a student uses to explain her reasoning to a classmate.
Otero & Harlow Qualitative Research
Getting Started in Physics Education Research 23
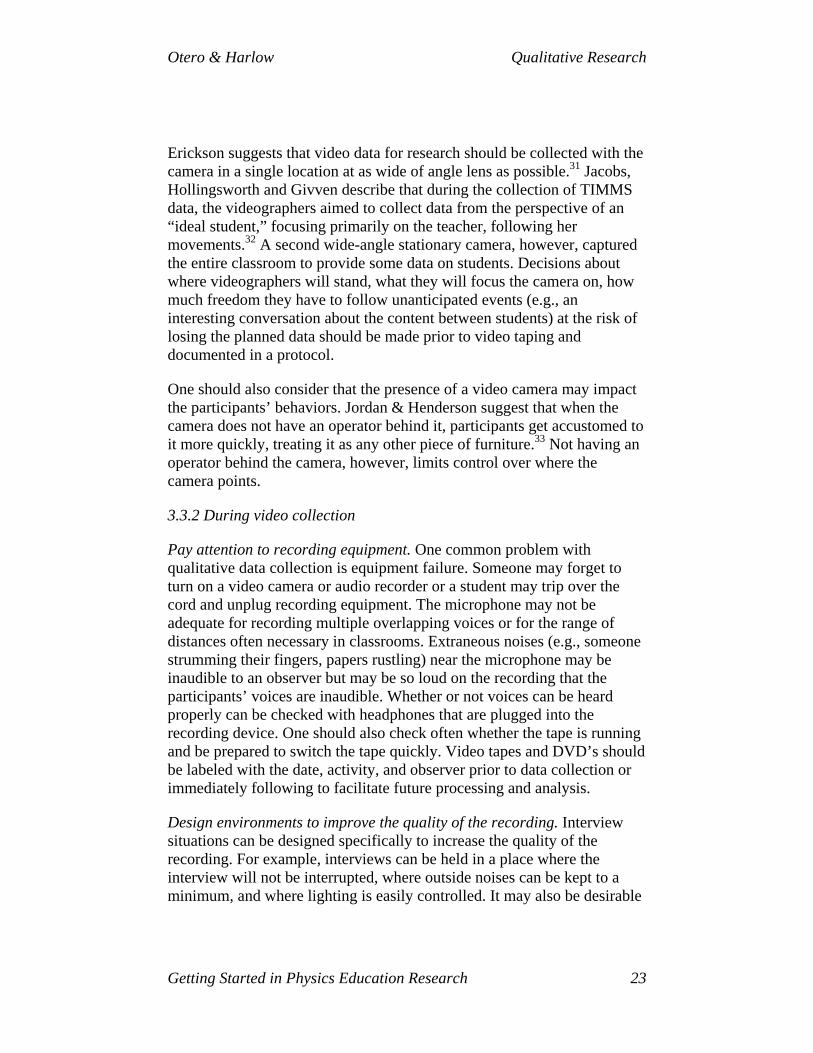
Erickson suggests that video data for research should be collected with the camera in a single location at as wide of angle lens as possible.31 Jacobs, Hollingsworth and Givven describe that during the collection of TIMMS data, the videographers aimed to collect data from the perspective of an “ideal student,” focusing primarily on the teacher, following her movements.32 A second wide-angle stationary camera, however, captured the entire classroom to provide some data on students. Decisions about where videographers will stand, what they will focus the camera on, how much freedom they have to follow unanticipated events (e.g., an interesting conversation about the content between students) at the risk of losing the planned data should be made prior to video taping and documented in a protocol.
One should also consider that the presence of a video camera may impact the participants’ behaviors. Jordan & Henderson suggest that when the camera does not have an operator behind it, participants get accustomed to it more quickly, treating it as any other piece of furniture.33 Not having an operator behind the camera, however, limits control over where the camera points.
3.3.2 During video collection
Pay attention to recording equipment. One common problem with qualitative data collection is equipment failure. Someone may forget to turn on a video camera or audio recorder or a student may trip over the cord and unplug recording equipment. The microphone may not be adequate for recording multiple overlapping voices or for the range of distances often necessary in classrooms. Extraneous noises (e.g., someone strumming their fingers, papers rustling) near the microphone may be inaudible to an observer but may be so loud on the recording that the participants’ voices are inaudible. Whether or not voices can be heard properly can be checked with headphones that are plugged into the recording device. One should also check often whether the tape is running and be prepared to switch the tape quickly. Video tapes and DVD’s should be labeled with the date, activity, and observer prior to data collection or immediately following to facilitate future processing and analysis.
Design environments to improve the quality of the recording. Interview situations can be designed specifically to increase the quality of the recording. For example, interviews can be held in a place where the interview will not be interrupted, where outside noises can be kept to a minimum, and where lighting is easily controlled. It may also be desirable
Otero & Harlow Qualitative Research
Getting Started in Physics Education Research 24
to hold interviews in locations that facilitate participants sharing of their thoughts. If holding multiple interviews with the same person, returning to the same location may decrease discomfort. Holding interviews with teachers in the classrooms they teach in may help them to recall what they were thinking as they taught because they are able to use visual cues of the classroom to prompt their thinking.
3.4 Gaining Access and Ethical Considerations
Privacy and informed consent. Once the researcher has decided upon the type of data he will collect, the type of recording method, and the participants that he would like to recruit, he will need to gain access to the study context. Each institution should have an Institutional Review Board (IRB) that reviews research plans and consent forms for any research that involves human subjects. Gaining access to school districts may require researchers to meet the requirements of both the university’s internal review board for research on human subjects as well as the school district’s requirements.
In most cases, researchers are required to obtain informed consent from any individual participating in a research study, as well as parental permission forms for minors involved in the study. Informed consent means that that the participants have been informed of the procedures that they will undergo and the risks and benefits of participating, and that they have agreed to participate. Additional waivers may be necessary for video data in which individuals can be identified. When using video data, researchers often must specify how long they will keep the video data and who will be permitted to view it. If unrestricted consent is sought and obtained, researchers have more freedom to reanalyze and repurpose video data after the research study for which it was obtained is complete.
In addition to informed consent, one needs to consider the privacy of participants. Measures to protect privacy may range from removing any identifying details from the data to using pseudonyms for the participants and institution under study. Specific measures required may vary by institution and study. For studies involving students, respecting privacy may also require the researchers to refuse to share data with the students’ instructors or to postpone sharing of data until after grades have been posted.
Researchers should consult the review boards of all institutions involved well before the research is scheduled to begin to avoid delays in beginning
Otero & Harlow Qualitative Research
Getting Started in Physics Education Research 25
research. In general, a description of all procedures that the subjects will be involved in, all consent forms, parental permission forms, and interview/observation protocols must be approved prior to collecting data. This may take weeks or months, depending on the institution.
Additional ethical considerations for video taping. When filming, it is possible that while many of the students in the learning context under investigation will have signed consent forms (and acquired parental permission forms, if relevant), some may not have signed the consent forms. If this is the case, measures should be taken to ensure that the students who do not wish (or do not have permission) to be on video tape are out of the field of view. They may, for example, be grouped together at a table which is not visible to the camera. Alternatively, post-processing may be used to delete scenes in which the students appear in the video or to blur their faces. The measures to accommodate these students should be documented in the protocols submitted to the institutional review board.
4. Processing Data Once the data has been collected (or during collection), a qualitative researcher begins the process of condensing or summarizing the data. In this section we discuss the first steps towards condensing the raw data.
Video and audio recordings are generally processed into a text-based form which can be further analyzed. Processing data not only prepares the data to be analyzed, it is also the first step of analysis. Erickson suggests that the first stage of video analysis should be reviewing the videotape continuously without stopping it and writing field notes known as “content logs.”31 A content log is a list of events that are on the tape. The level of detail may vary depending on the needs of the researcher (for an example, see Jorden and Henderson’s 1995 paper).33
In order to analyze effectively, video data is often turned into a typed transcript of all of the words that the study subjects said and the gestures they made. A transcript of video or audio data represents what was recorded and, while researchers may return to the video frequently during analysis, much of the analysis is done on and with typed transcripts. Thus, deciding what and how to transcribe should be done with care, and the actual transcript should be as complete and accurate as possible.
Otero & Harlow Qualitative Research
Getting Started in Physics Education Research 26
4.1 Deciding what to transcribe
Depending on the research goals, one may choose to transcribe all the data or only relevant sections of video or audio tapes. As stated earlier, one way that researchers know that they have enough data is that additional data do not reveal anything new. The amount of data necessary will depend upon the research questions and objectives. Initial sampling occurs prior to data collection when the researcher decides how many participants or contexts he will study and how many observations and interviews will be collected. Additional sampling of the data will occur at the transcribing stage. This selecting of what to transcribe should be done purposefully and carefully, if at all. One may limit the data transcribed to a particular activity or lesson or by interesting interactions. For example, if one wishes to know how students in a Tutorial setting interact when the TA is present, the researcher may watch video tapes of students working in a Tutorial setting, noting the times when a TA is present and then choose only to transcribe these segments of video data. Or perhaps the researcher will only look at, and transcribe, how an instructor begins a lesson. The researcher may choose only to transcribe student talk when students are on task or when students engage in a particular type of activity, such as interacting with a computer simulation. One should select events to transcribe cautiously, especially if the decisions involve medium to high inference. For example, a researcher who chooses to only transcribe events in which students are engaged in “sense-making” has already made some decisions, often based on tacit theoretical perspectives, about what constitutes sense-making behavior, introducing bias into the data set by making decisions about what to transcribe.
Even if one chooses to transcribe all the data collected, decisions about what to transcribe must be made. One may choose to transcribe just the words or to transcribe the words and gestures, or even the words, gestures and direction of gaze of the participants. One must also make decisions about whether to pay attention to changes in tone of voice or speed of talk. Because of the myriad decisions made in choosing what to transcribe and what not to transcribe, transcribing is the first step of analysis; it is not just pre-processing. When deciding the level of detail to transcribe, a researcher is deciding what will count as data and what will not count.
4.2 Creating the transcript
Depending on the decisions made about what to transcribe, transcripts may include a column for spoken discourse, as well as a column for
Otero & Harlow Qualitative Research
Getting Started in Physics Education Research 27
nonverbal discourse including, for example, gesturing and direction of gaze. Considering first just spoken discourse, when transcribing, it is important to be as faithful to the talk as possible. Ideally, the person who collected the data would transcribe because he or she would be the most likely to be able to fill in gaps. A transcriber who is not familiar with the situation may not accurately represent the data. A common error is mishearing a word (hearing “neutron” instead of “Newton”) or selecting an inappropriate homonym to type (for example, “pull” when the speaker intended “pole” or vice versa). It is even important to transcribe sounds such as “hmm”, long pauses in speech, and words such as “like” even when the words appear to be insignificant habits of speech. These all may be indicative of participants hesitating or thinking that may become important during analysis and provide clues to what the participants are thinking. Wearing high-quality headphones while listening to the recording will help. Sometimes even transcribers with knowledge of the field and excellent audio equipment may not always be able to understand what the speakers say.
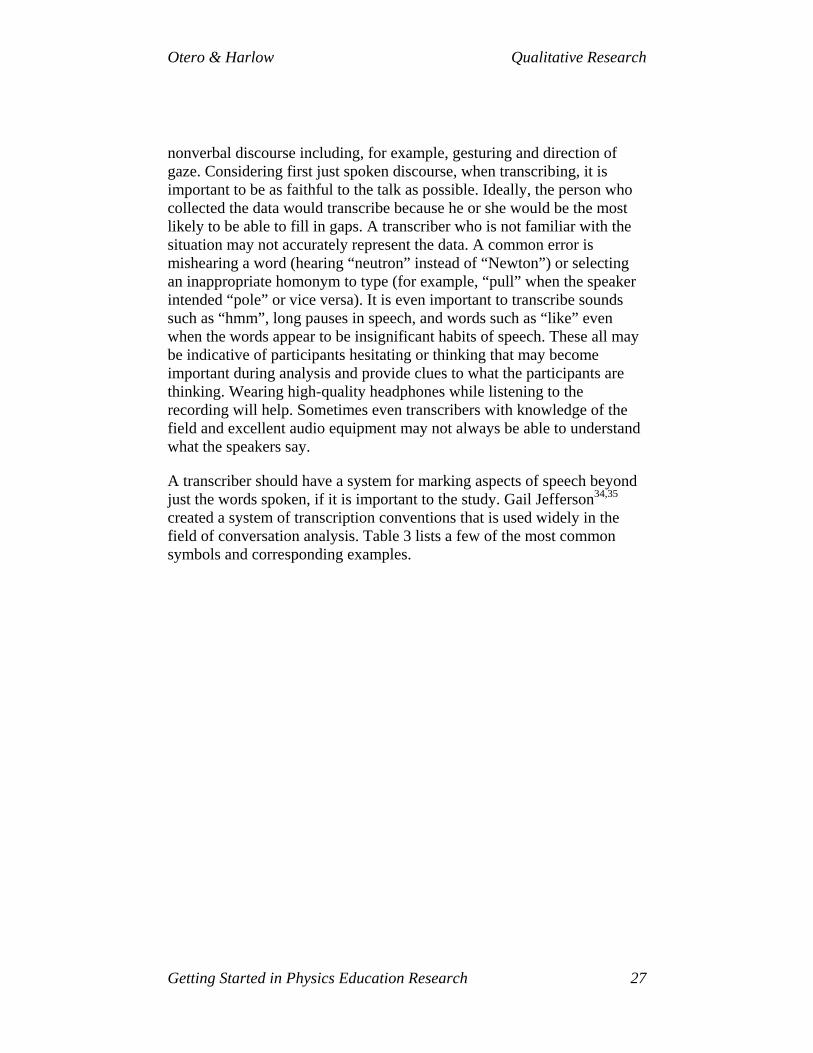
A transcriber should have a system for marking aspects of speech beyond just the words spoken, if it is important to the study. Gail Jefferson34,35 created a system of transcription conventions that is used widely in the field of conversation analysis. Table 3 lists a few of the most common symbols and corresponding examples.
Otero & Harlow Qualitative Research
Getting Started in Physics Education Research 28
Table 3: Sample Conventions Adapted from Jefferson System for Transcription (reproduced in Jefferson34 and more detail included in her later work35).
Symbol Meaning Example [ ] Overlapping
speech 1 Mark I think that the force [is
transferred] 2 Jill [no the energy] is
transferred from the foot to the ball
Mark begins to say that the force is transferred, and Jill starts talking over him. In this case, Jill said “no the energy” at the same time Mark said “is transferred.” Jill continues talking after Mark has stopped.
= Continuous utterances
1 Mark I think that the force is = 2 Jill Energy3 Mark =transferred
Mark makes the statement “I think the force is transferred” but between the words “is” and “transferred,” Jill says “energy.
(.) (2.0)
Short pause. A number in parentheses indicates the duration of pause.
1 Mark I think that the force (.) or energy
2 Jill I think it must be (2.0) energy
In line one, Mark pauses briefly between the words “force” and “or.” In line 2, Jill pauses for 2 full seconds between the words “be” and “energy.”
: Stretching of sounds
1 Shay Well: it could be inertia
Shay draws out the word “well.” (e.g., “Welllllllll”)
(( )) Indicates notes or sounds that are not easy to transcribe
((Shay scratches head with pen))
__ Underlining indicates emphasis
1 Alli The forces are unbalanced Alli emphasizes “un” in the word “unbalanced.”
CAPs Capitals indicate louder words
1 Alli The FORCES are unbalanced Alli says the word “forces” louder than the rest of the statement.
Otero & Harlow Qualitative Research
Getting Started in Physics Education Research 29
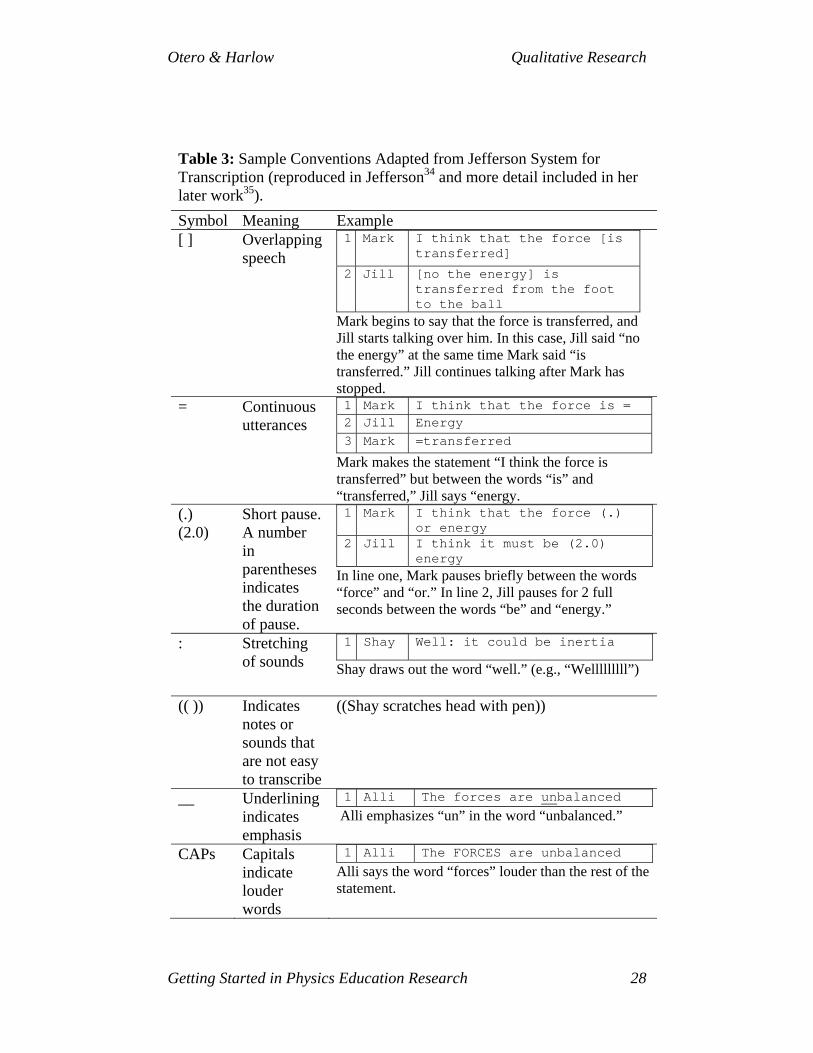
Transcripts may also be organized in different ways to better understand the data. One may, for example, create a transcript that follows chronologically. Each turn of speech is on a new line. In the example shown in Figure 2, the first column contains a time stamp, the second column indicates the speaker (a letter is used to represent each speaker), and the third column contains the words that the speakers say.
Figure 2: Example of a Transcript
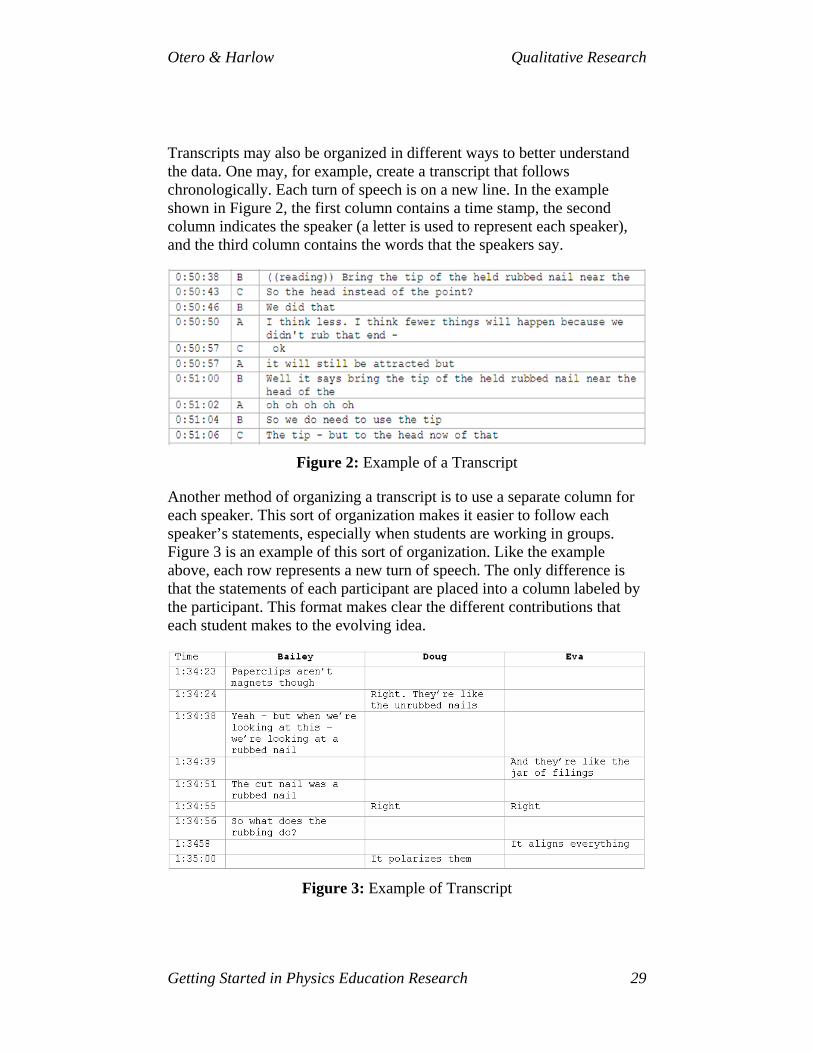
Another method of organizing a transcript is to use a separate column for each speaker. This sort of organization makes it easier to follow each speaker’s statements, especially when students are working in groups. Figure 3 is an example of this sort of organization. Like the example above, each row represents a new turn of speech. The only difference is that the statements of each participant are placed into a column labeled by the participant. This format makes clear the different contributions that each student makes to the evolving idea.
Figure 3: Example of Transcript
Otero & Harlow Qualitative Research
Getting Started in Physics Education Research 30
These are just two examples. Other methods of arranging text on a page may be more suited to different types of analysis. If more than spoken words are important to the study, these may be included in line with the text in double brackets. For example the line of transcript, “I think that this ((lifts metal ball)) will fall more quickly than this ((points at plastic ball))” notes the student’s statement as well as the gestures. Alternatively, gestures or gaze may be included in a separate column. Scherr’s36 work on gestures shows an alternative method of describing non-verbal communication. She depicts gestures by drawing the motion of the hands or body directly on frames selected from a video clip.
Software for transcribing. A variety of software packages have been developed to aid in transcription. In considering which to use, one should consider a number of factors including cost (which ranges from free to thousands of dollars), the format of the data, whether the transcript will need to be turned into subtitles for presentation, and whether one wants to be able to analyze and transcribe with the same data. Some examples of transcription software are listed below.
Transana (http://www.transana.org/) Noldus Observer (http://www.noldus.com/site/doc200401012) InqScribe (http://www.inqscribe.com/)
Alternatively, researchers are increasingly using voice recognition software such as Dragon Naturally Speaking™ to transcribe their data for them. Although it eliminates the large amount of time spent on typing, it adds some time up front training the software to recognize one’s voice. One should note, however, that such voice recognition software usually only recognizes one or a handful of voices that the user has trained the software to recognize. Thus, the researcher must listen to the video or audio recording and read the participants’ words aloud for the software to function properly.
5. Coding and Analyzing Data
Ultimately, the goal of conducting qualitative research is to find meaning. This is often done through the process of coding text-based data to categorize data and meaning found within the data. In this section we focus on the mechanics and common methods of coding transcripts. However, one should keep in mind that this is just one method of finding
Otero & Harlow Qualitative Research
Getting Started in Physics Education Research 31
meaning and focuses only on transcripts. Finding meaning in qualitative data may take a variety of other forms.
While some of the summarizing and condensing of data occurs during the processing stage, the majority occurs during the coding and analysis stage. In this section, we discuss some scholarly traditions from which many qualitative methods are derived, how data are coded, and then how these codes are worked with. Note that in qualitative analysis, analysis does not generally occur in discrete steps, but rather the many strategies discussed occur somewhat simultaneously.
5.1 Coding The primary method for analyzing qualitative data is through a process of coding. Coding transcripts or other text-based data is the process of going through a transcript in detail in hopes of finding words, statements, or events that can be sorted and labeled using a cover term (code). Ultimately, the researcher will use these codes to find patterns and meaning in the data. “Coding forces the researcher to make judgments about the meaning of contiguous blocks of text.”37 Cresswell recommends the following steps for a researcher who is beginning to code his data: 1) read transcripts, noting initial ideas; 2) Pick one transcript and think about the meanings and write meanings in 2-3 word phrases; 3) Begin coding by identifying segments of text that relate to a particular code; 4) Make a list of all the codes and group them together; 5) Go back to the data and try to code using this scheme, refining or removing codes whenever necessary. These steps are described in more detail below.30
Dividing speech into chunks. Prior to or while coding, speech must be broken up into appropriate and manageable chunks. Eventually each chunk will be examined in order to assign codes. The codes will be later used to make inferences about the data and claims. In this section we are considering the grain size of the text that is coded. This is called the unit of coding. The particular text that is being coded is called a text segment.
A text segment is a piece of text (a phrase, a sentence, a paragraph, or a word) that relates to a particular code or label. Codes are labels and they may pertain to many different categories. Codes could, for example, relate to concepts (e.g., gravity, forces, magnetism) or activities (collecting evidence, making claims, cleaning up equipment), or ideas (the earth is flat, the earth is a sphere, the earth is a pancake).
Otero & Harlow Qualitative Research
Getting Started in Physics Education Research 32
In the section of transcript below, three teachers (Ms. Bee, Ms. May, and Mr. Cruz) were analyzing videos of children talking about forces. Each row represents a turn a speech, meaning what the teacher said during his or her turn to speak. In line 2, Ms. May’s statement, “they probably think it’s a transfer” is a turn of speech.
1 Ms. Bee I put that for before the ball was kicked the student would probably think that there’s no force acting on the ball, and then right after it’s kicked, they might feel like the foot is causing the force which is making the ball move
2 Ms. May they probably think it’s a transfer 3 Ms. Bee ye:ah 4 Mr. Cruz Transfer of energy 5 Ms. May Transfer of force 6 Mr. Cruz coming from the force 7 Ms. May Which they’ll confuse with energy 8 Ms. Bee If it’s if it’s moving, it’ll have a force, kind of like basically
they’re just relating motion with force. Plus we (moves fingers to all three group members) kind of did the same thing=
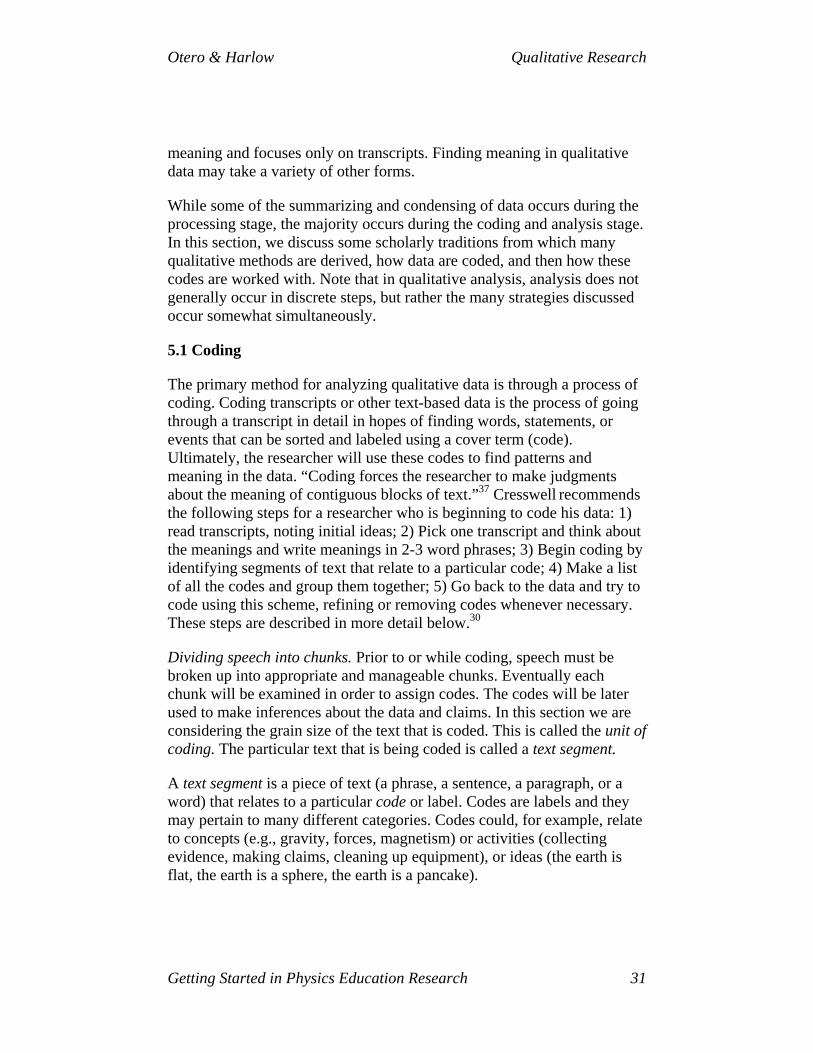
Consider line 8 in which Ms. Bee said, “[the children think that] If it’s if it’s moving, it’ll have a force, kind of like basically they’re just relating motion with force. Plus we (moves fingers to all three group members) kind of did the same thing.” Each of these two sentences might be coded separately, as shown in figure 4.
Figure 4: Example of How Text Might be Coded
Above, the first sentence was coded as identifying students’ ideas because the speaker is claiming that the elementary students think that motion implies force and the second was coded as reflecting because the speaker is reflecting on the ideas that she and the other teachers had about force in an activity earlier in the chapter.
Otero & Harlow Qualitative Research
Getting Started in Physics Education Research 33
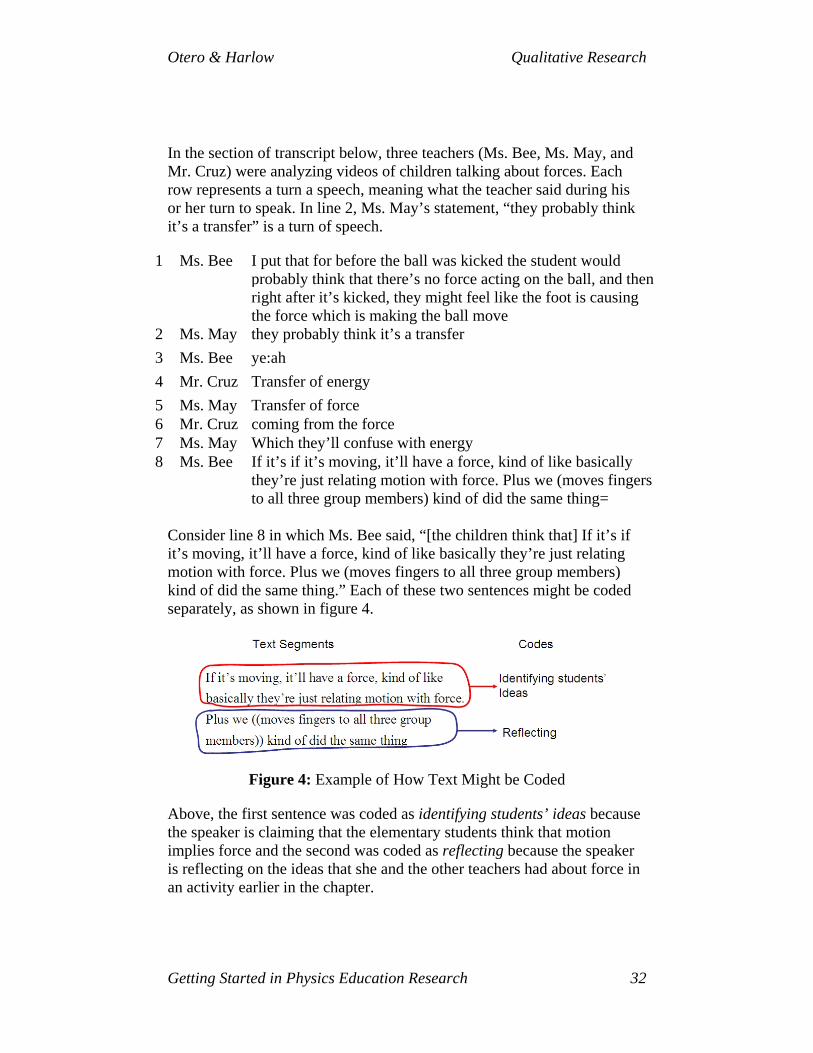
As mentioned previously, the size of the text segment that is assigned a code (unit of coding) may be an utterance, word, a message unit, a turn of speech, a sentence, or even an entire transcript (see figure 5).
Figure 5: Example of Different Sizes of Text Segments
Message units are often a useful grain size. Message units are ‘small chunks’ of verbal and non-verbal communication which convey a single idea.38,39 This way, multiple messages contained in longer turns of speech could be coded separately. In the example in Figure 4, we would say that the unit of coding is message unit and that “Plus we kind of did the same thing” is a text segment that is coded as “reflecting.” This is just an example of one way that this text might be coded. One might instead be interested in how specific words are used or what a student does in an entire turn of speech.
Sections of transcript assigned codes may also be larger than a turn of speech. One may choose to analyze an interaction, an event that has an identifiable beginning and end (such as “beginning class” or “using the simulator”) or a larger event such as an entire activity, class period, or unit.
5.2 Developing a coding scheme
A priori versus generative codes. Depending on the research question, coding schemes are developed either before coding (a priori) or during coding (generative). A priori codes are useful when the researcher is looking for something in particular in the data or testing hypotheses. Generative codes are useful when the researcher is looking at the data to discover what is there. In actuality, coding schemes are often a combination of a priori and generative codes.
A priori coding schemes may come from a number of sources. They may be developed out of prior work by other scholars, course goals, one’s own
Otero & Harlow Qualitative Research
Getting Started in Physics Education Research 34
theories and assumptions, or some other pre-determined schema. For example, in determining whether or not a particular group of students exhibited ideas that are congruent with commonly articulated ideas about forces, the researcher might first look to previous research on the naive and sophisticated ideas about forces commonly articulated by students learning physics. The researcher would then start with these pre-determined sets of common student ideas and look through her data (e.g., observations, interview transcripts, or exam papers) and mark places where she saw evidence for a particular science idea. Because a priori codes are determined prior to coding, the emergent nature of qualitative research means one must be willing to modify these pre-determined codes if the data do not support them. In contrast, generative codes are generated as part of the coding process. Both generative and a priori methods are useful for different research projects. What is important is that the researcher is clear about what she is using and that this is reported in her methods.
Generative coding. Often in qualitative research, the goal is to understand a particular phenomenon by looking at data and seeing what is there. Generative coding is iterative and methods of developing codes vary. Some researchers literally cut up (with scissors) transcripts of interviews and observations into manageable chunks and literally sort the data into piles on the floor based on initial categories consisting of statements that seem to be similar. For example, the researcher may end up with a stack of statements in which students were discussing experimental procedure. The chunks of data in each category would then be read separately and resorted into smaller or larger categories. As the researcher becomes more and more familiar with his data, new categories may emerge or multiple categories may be collapsed. Alternatively one may choose to read the data and make notes about the themes that are noticed. The data could then be color coded with highlighters and colored pens to denote where data related to a particular theme is found.
Computer software designed for the purpose of coding allows for researchers to engage in a similar process electronically (NVivoTM and Atlas.tiTM are two commonly used programs). The transcription software mentioned earlier, TransanaTM also includes a set of coding tools.
5.3 Working with codes
After coding, a qualitative researcher attempts to establish links between the codes and to further reduce the codes with the goal of obtaining the
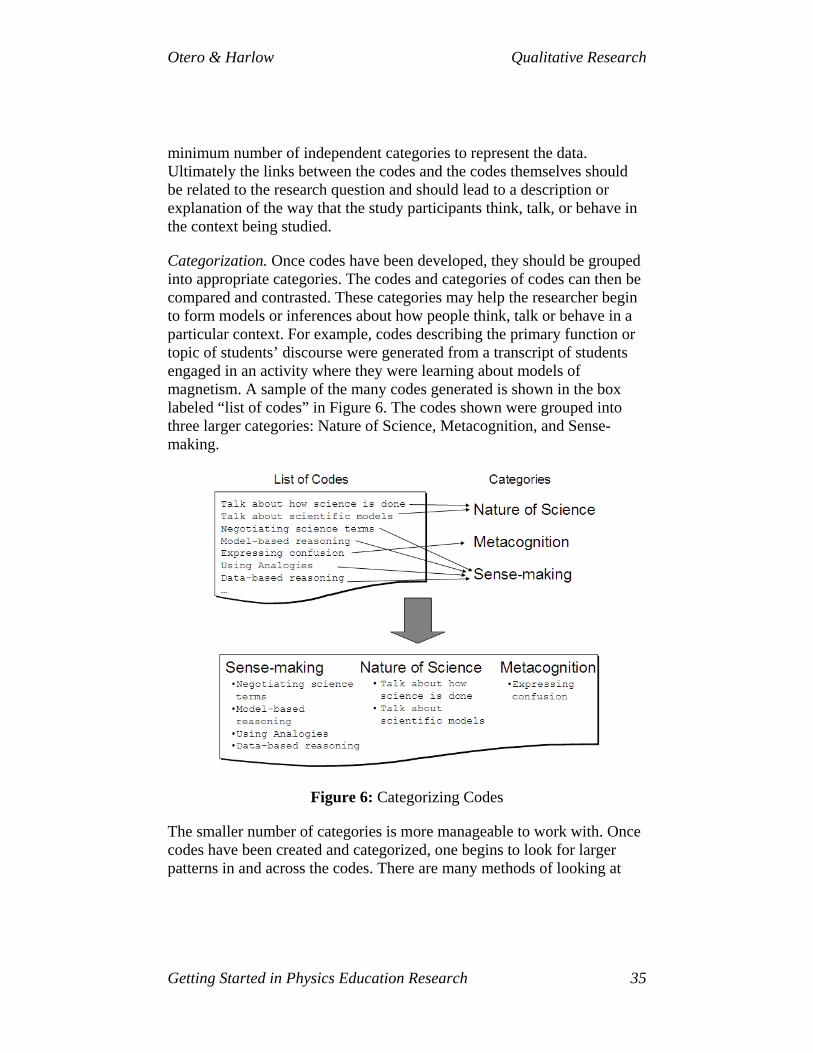
Otero & Harlow Qualitative Research
Getting Started in Physics Education Research 35
minimum number of independent categories to represent the data. Ultimately the links between the codes and the codes themselves should be related to the research question and should lead to a description or explanation of the way that the study participants think, talk, or behave in the context being studied.
Categorization. Once codes have been developed, they should be grouped into appropriate categories. The codes and categories of codes can then be compared and contrasted. These categories may help the researcher begin to form models or inferences about how people think, talk or behave in a particular context. For example, codes describing the primary function or topic of students’ discourse were generated from a transcript of students engaged in an activity where they were learning about models of magnetism. A sample of the many codes generated is shown in the box labeled “list of codes” in Figure 6. The codes shown were grouped into three larger categories: Nature of Science, Metacognition, and Sense-making.
Figure 6: Categorizing Codes
The smaller number of categories is more manageable to work with. Once codes have been created and categorized, one begins to look for larger patterns in and across the codes. There are many methods of looking at
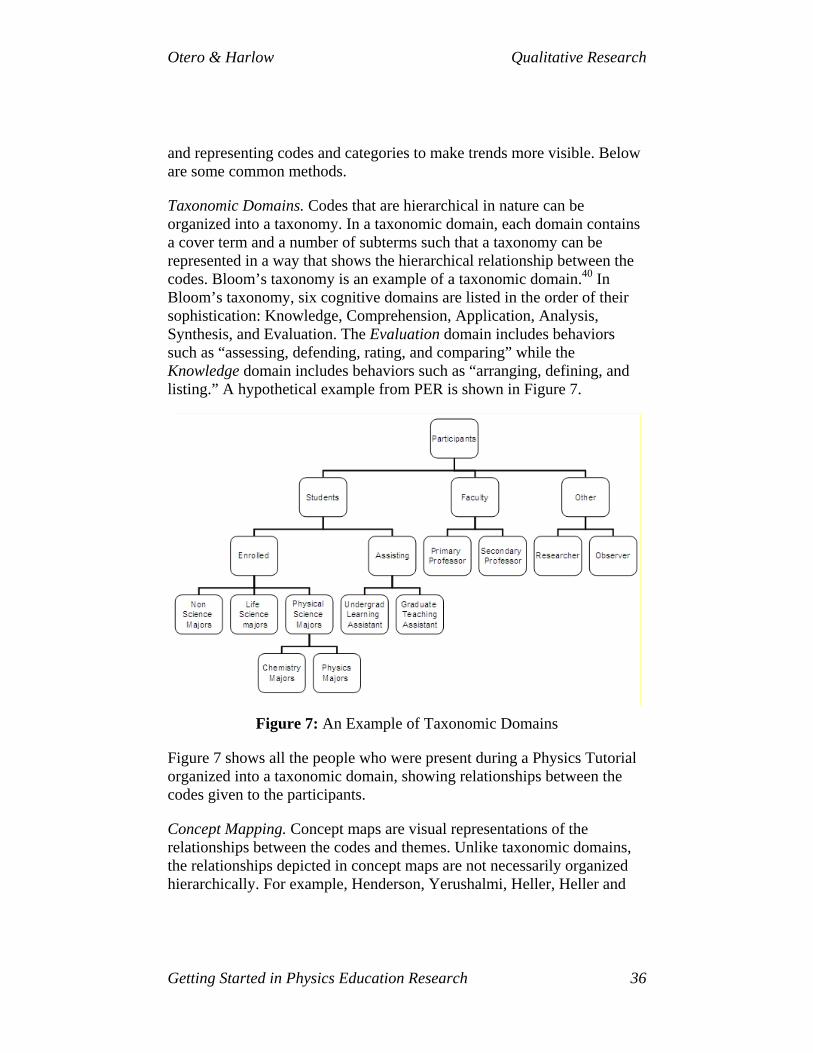
Otero & Harlow Qualitative Research
Getting Started in Physics Education Research 36
and representing codes and categories to make trends more visible. Below are some common methods.
Taxonomic Domains. Codes that are hierarchical in nature can be organized into a taxonomy. In a taxonomic domain, each domain contains a cover term and a number of subterms such that a taxonomy can be represented in a way that shows the hierarchical relationship between the codes. Bloom’s taxonomy is an example of a taxonomic domain.40 In Bloom’s taxonomy, six cognitive domains are listed in the order of their sophistication: Knowledge, Comprehension, Application, Analysis, Synthesis, and Evaluation. The Evaluation domain includes behaviors such as “assessing, defending, rating, and comparing” while the Knowledge domain includes behaviors such as “arranging, defining, and listing.” A hypothetical example from PER is shown in Figure 7.
Figure 7: An Example of Taxonomic Domains
Figure 7 shows all the people who were present during a Physics Tutorial organized into a taxonomic domain, showing relationships between the codes given to the participants.
Concept Mapping. Concept maps are visual representations of the relationships between the codes and themes. Unlike taxonomic domains, the relationships depicted in concept maps are not necessarily organized hierarchically. For example, Henderson, Yerushalmi, Heller, Heller and
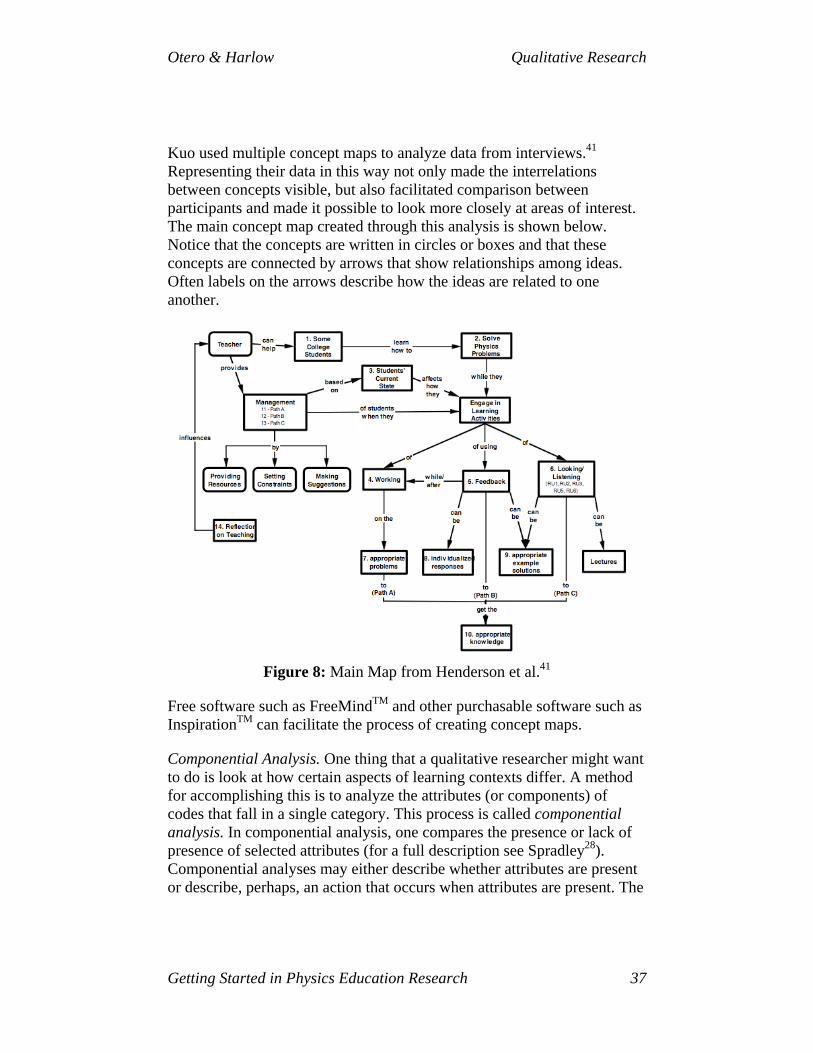
Otero & Harlow Qualitative Research
Getting Started in Physics Education Research 37
Kuo used multiple concept maps to analyze data from interviews.41 Representing their data in this way not only made the interrelations between concepts visible, but also facilitated comparison between participants and made it possible to look more closely at areas of interest. The main concept map created through this analysis is shown below. Notice that the concepts are written in circles or boxes and that these concepts are connected by arrows that show relationships among ideas. Often labels on the arrows describe how the ideas are related to one another.
Figure 8: Main Map from Henderson et al.41
Free software such as FreeMindTM and other purchasable software such as InspirationTM can facilitate the process of creating concept maps.
Componential Analysis. One thing that a qualitative researcher might want to do is look at how certain aspects of learning contexts differ. A method for accomplishing this is to analyze the attributes (or components) of codes that fall in a single category. This process is called componential analysis. In componential analysis, one compares the presence or lack of presence of selected attributes (for a full description see Spradley28). Componential analyses may either describe whether attributes are present or describe, perhaps, an action that occurs when attributes are present. The
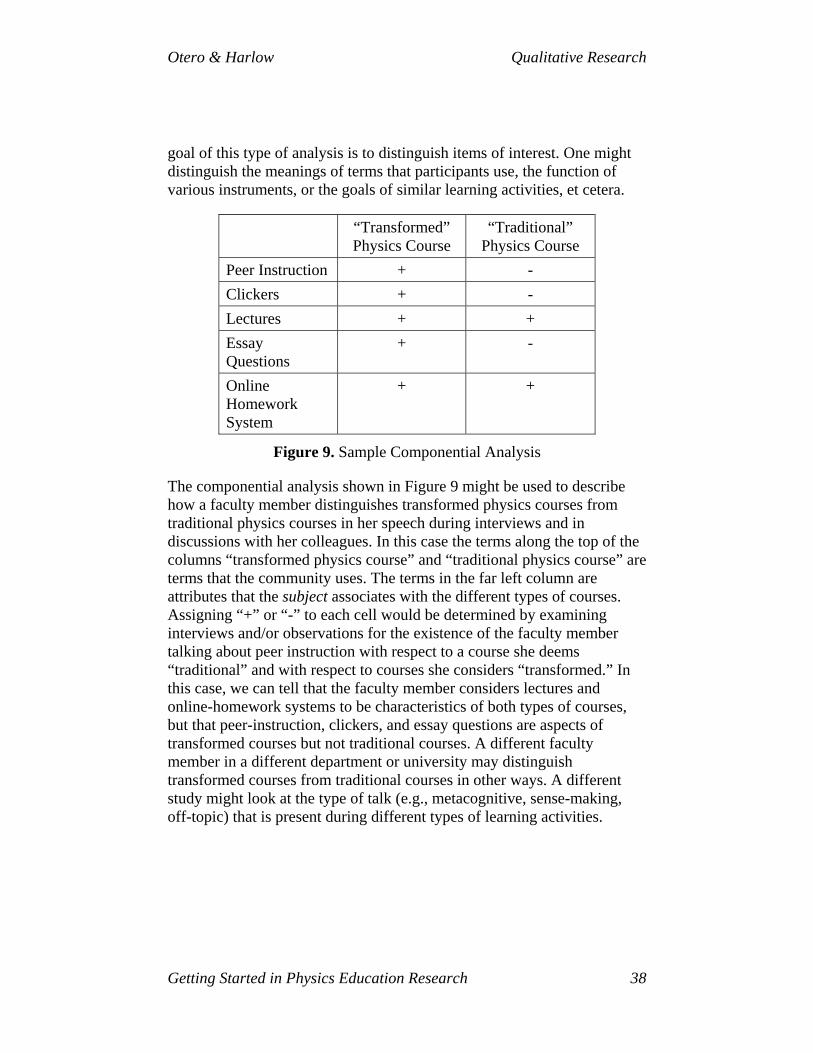
Otero & Harlow Qualitative Research
Getting Started in Physics Education Research 38
goal of this type of analysis is to distinguish items of interest. One might distinguish the meanings of terms that participants use, the function of various instruments, or the goals of similar learning activities, et cetera.
“Transformed” Physics Course
“Traditional” Physics Course
Peer Instruction + - Clickers + - Lectures + + Essay Questions
+ -
Online Homework System
+ +
Figure 9. Sample Componential Analysis
The componential analysis shown in Figure 9 might be used to describe how a faculty member distinguishes transformed physics courses from traditional physics courses in her speech during interviews and in discussions with her colleagues. In this case the terms along the top of the columns “transformed physics course” and “traditional physics course” are terms that the community uses. The terms in the far left column are attributes that the subject associates with the different types of courses. Assigning “+” or “-” to each cell would be determined by examining interviews and/or observations for the existence of the faculty member talking about peer instruction with respect to a course she deems “traditional” and with respect to courses she considers “transformed.” In this case, we can tell that the faculty member considers lectures and online-homework systems to be characteristics of both types of courses, but that peer-instruction, clickers, and essay questions are aspects of transformed courses but not traditional courses. A different faculty member in a different department or university may distinguish transformed courses from traditional courses in other ways. A different study might look at the type of talk (e.g., metacognitive, sense-making, off-topic) that is present during different types of learning activities.
Otero & Harlow Qualitative Research
Getting Started in Physics Education Research 39
5.4 Conclusion
There is a range of methodological approaches used in qualitative data analysis. The specific steps should make sense for the data and research questions associated with each particular research project. The fact that there is a range of appropriate methods means that a researcher must be very explicit and detailed in describing the methods of analysis that lead to the researcher’s claims. It is not enough to state that the data were analyzed through “qualitative methods” because this does not sufficiently explain the process. In their paper, “Learning and Teaching Science as Inquiry: A Case Study of Elementary School Teachers’ Investigations of Light,” van Zee and her colleagues make the qualitative method they used very apparent.42 They discuss how they divided the data into episodes and provide examples of their categorization.
The codes and patterns observed in the codes can be used to develop a descriptive model of the phenomenon being investigated. Taxonomic domains, concept maps, and componential analyses all represent descriptive models. On the other hand, a researcher may use the frequencies of the codes themselves to make descriptive statements such as, “Students spend 10% of their discussion time in sense-making during laboratory activities that use equipment and 40% of their discussion time sense-making in activities which use a computer simulator.” A descriptive model does just that - it describes the phenomenon in terms of characteristics appropriate for the research question. Sometimes, a descriptive model is the researcher’s desired final outcome. The utility of such research resulting in descriptive models is exemplified by Walsh, Howard, and Bowe43 who provide a descriptive model of students’ approaches to problem solving and compare it to a similar descriptive model developed by Tuminaro and Redish.44 However, it is often the case that the researcher seeks to explain the phenomenon involving human subjects.
In order to create an explanatory model, the researcher must represent and re-represent his findings and link these findings to one another and to a learning theory. In the following sections, we discuss how inferences are made from findings and then we illustrate the process of developing an explanatory model though the use of a specific example from PER.
Otero & Harlow Qualitative Research
Getting Started in Physics Education Research 40
6. Multiple Representations and Making Inferences
After developing a coding scheme it is beneficial to represent the data in a concise, summarizing way as shown in Figures 6, 7, and 8. Representations can be critical in helping the researcher make inferences from the data and in ultimately constructing an explanatory model, when appropriate. In the preceding section we discussed ways to code the data and ways in which these codes could be organized into representations that summarize the findings. We now discuss how to interpret these summary findings and how to make inferences from the data.
As is the case in any kind of research, in qualitative studies claims are made and must be supported with evidence from the data. Claims in qualitative research are often based on a preponderance of similar occurrences in the data. These claims may be supported by frequency measures. For example, a qualitative researcher might interview 40 physics students and make the claim that these students were thinking about electric current as a fluid. The researcher might even provide some illustrative examples of what students said that led him to believe that they were thinking about electricity as a fluid. Frequency measures may help his audience understand what he means when he says that “they” were thinking about electricity as a fluid. He could state that 30 of the 40 students interviewed, or 75% of the students interviewed, seemed to view electricity this way.
The example in Figure 9 showed how a physics faculty member attributes different characteristics to courses she considers “transformed” or “traditional.” In the figure this faculty member attributes peer instruction, clickers, lectures, essay questions, and online homework to transformed courses but only attributes lectures and online homework to traditional physics courses. Based on these data alone, it would be inappropriate to make the inference that physics faculty members attribute only lectures and online homework to traditional courses. The data shown in Figure 9 only represents one faculty member, but imagine that the researcher has created such tables for all of the 15 faculty members interviewed. The data could then be re-represented as shown in Table 4, where the numbers represents how many of the 15 physics faculty members interviewed used each term to describe a transformed or a traditional physics course.
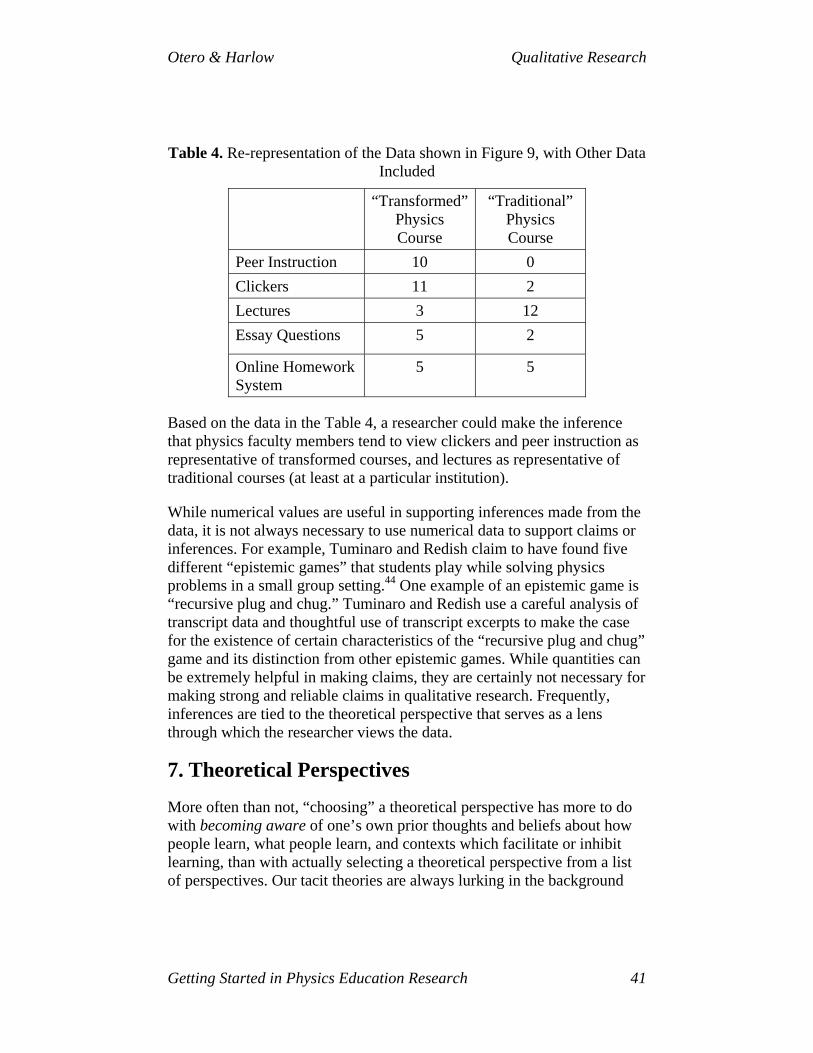
Otero & Harlow Qualitative Research
Getting Started in Physics Education Research 41
Table 4. Re-representation of the Data shown in Figure 9, with Other Data Included
“Transformed” Physics Course
“Traditional” Physics Course
Peer Instruction 10 0 Clickers 11 2 Lectures 3 12 Essay Questions 5 2
Online Homework System
5 5
Based on the data in the Table 4, a researcher could make the inference that physics faculty members tend to view clickers and peer instruction as representative of transformed courses, and lectures as representative of traditional courses (at least at a particular institution).
While numerical values are useful in supporting inferences made from the data, it is not always necessary to use numerical data to support claims or inferences. For example, Tuminaro and Redish claim to have found five different “epistemic games” that students play while solving physics problems in a small group setting.44 One example of an epistemic game is “recursive plug and chug.” Tuminaro and Redish use a careful analysis of transcript data and thoughtful use of transcript excerpts to make the case for the existence of certain characteristics of the “recursive plug and chug” game and its distinction from other epistemic games. While quantities can be extremely helpful in making claims, they are certainly not necessary for making strong and reliable claims in qualitative research. Frequently, inferences are tied to the theoretical perspective that serves as a lens through which the researcher views the data.
7. Theoretical Perspectives
More often than not, “choosing” a theoretical perspective has more to do with becoming aware of one’s own prior thoughts and beliefs about how people learn, what people learn, and contexts which facilitate or inhibit learning, than with actually selecting a theoretical perspective from a list of perspectives. Our tacit theories are always lurking in the background
Otero & Harlow Qualitative Research
Getting Started in Physics Education Research 42
and have great influence on how we see things and on the claims we make.
Many claims can be made and many trends can be found in almost any data set. However, trends may or may not be interesting or useful. A simple count of the number of times a particular activity occurs is only interesting if it says something substantive and relevant to the research question. For example, a researcher might find that one physics student in a group made 80% of the statements that were transcribed for that group. This finding is of little interest unless the researcher frames the research study in a way in which one group member talking with great frequency is a significant indicator of a broader claim. This could be the case if the researcher was interested in gender roles in the physics classroom and the student responsible for 80% of the discourse was the only male in the group. So while many trends can be found in data, one is always looking for “a difference that makes a difference,” to quote Edwin Hutchins. In any social setting there are many interesting things going on. However, it is up to the researcher to frame the research in such a way in which trends in the data have some meaning and lend support to a broader issue of interest to the community. This is the role of theoretical framing.
7.1 Framing the study
A researcher frames his research study for several reasons. First, the researcher must place the work within PER as a part of a broader discussion about a phenomenon or idea of interest to the community. Second, the researcher must demonstrate the value of the research beyond the observation of simple events that have been counted and graphed. That is, it is the researcher’s job to help the community understand how his work moves like-minded scholars forward in their mission or inquiry. This is accomplished by making a data-based argument which is framed in a way that reveals how the observations that were made can be used more broadly toward answering a larger question and contributing to the PER community.
There exist three types of frameworks that can be used to frame a PER study: theoretical frameworks, practical frameworks, and conceptual frameworks;45 each is described in detail below with a brief discussion about the advantages and disadvantages of each.
Theoretical Frameworks are constructed by using established, coherent theoretical perspectives. Examples of theoretical perspectives are
Otero & Harlow Qualitative Research
Getting Started in Physics Education Research 43
Vygotsky’s theory of concept formation, schema theory, classical conceptual change models, phenomenological primitives, and coordination classes.46-51 Mestre and his colleagues provide an example of research that is framed with the coordination class theory.52 These researchers applied the coordination class theory to explain why students’ answers to isomorphic questions are dependent on the type of representation that is provided (a simulation of two balls rolling down a ramp versus a sequence of static snap-shots of the ball’s motion). They used coordination class theory to argue that the different representations cued different cognitive elements for the students and therefore the students responded differently in the isomorphic situations. Some advantages of using established theoretical perspectives to frame a qualitative research study is that use of a common theoretical perspective facilitates communication among researchers, encourages systematic research programs, and demonstrates progress among like-minded scholars. Disadvantages are that data are often stripped of their context and local meaning, may not be functional outside the academic discipline, and may not be helpful for day-to-day practice.
Practical Frameworks are constructed with practical improvements in mind where findings lead to changes in practice, informed by accumulated practical knowledge. An example of this is the work of the Physics Education Research Group at the University of Washington.53,54 These types of studies attempt to be agnostic about a theoretical stance, and instead seek to investigate what students are thinking regarding a specific concept in physics, given a specific problem statement. As a result of the new understandings gained from the research on students’ ideas or difficulties, instructional interventions are designed and their effects measured. If measured effects are relatively large, the researchers conclude that the “difficulties” that they identified were treated by the intervention since the intervention which was based on these inferences was successful. This is referred to as a practical framework because, like Design Research, attempts are made to avoid biasing the findings through theoretical orientations.55 Although it is impossible to avoid theoretical bias altogether, studies framed with a practical framework do their best. An advantage of using practical frameworks is that this type of research typically has direct, practical application and immediate utility in classroom or school settings. A disadvantage is that it is difficult to generalize results beyond the context in which the research was conducted because it becomes difficult to find a systematic way to engage in discourse about the findings beyond the study context. For example, if
Otero & Harlow Qualitative Research
Getting Started in Physics Education Research 44
students are found to have particular difficulties with a problem in electricity and magnetism, it is difficult to make the claim that these difficulties extend beyond the particular problem that was posed to the students in the study.
Conceptual Frameworks are the most common and easiest to use. Conceptual frameworks consist of arguments that include several different theoretical perspectives and/or robust findings from practical research and a justification for adopting these perspectives or findings for the current research study. An example is Duit, Roth, Komerek, & Wilbers’s study in which they incorporated discourse analysis into classical conceptual change views.56 In doing so, they were able to consider socio-cultural elements of learning to attend to the social and material setting in which conceptual change regarding chaotic systems took place. An advantage of this type of framing is its flexibility and the fact that conceptual frameworks discourage unwarranted conclusions because the conceptual framework is often based on the nature of the data and findings of the study at hand. A disadvantage of conceptual frameworks is that using them runs the risk of too many similar, but subtly different, conceptual frameworks existing within a community, leading away from general agreement on a theoretical perspective(s) on learning. Other PER publications explicitly discuss the utility of multi-perspective, conceptual frameworks.57
7.2 Theoretical perspectives used in PER
Several theoretical perspectives on cognition and learning have been used in PER. Although this article is not intended to review cognitive theory, two perspectives that are commonly used in PER are elaborated below. The two theoretical perspectives were developed in parallel and each informed, in some respects, the development of the other. Both perspectives have benefits and limitations and have roots in the learning sciences including the work in developmental psychology, philosophy of science, computer science, education and educational psychology, and psychology among many others.58-61
The first perspective, which we refer to as the “unitary perspective,” models human ideas as large-scale, theory-like, concepts or beliefs that are applied consistently in different contexts. It follows that learning is defined in terms of change in, or replacement of, these large-scale concepts or beliefs. The “resource perspective” on the other hand, models human ideas as “manifold structures” made up of collections of smaller
Otero & Harlow Qualitative Research
Getting Started in Physics Education Research 45
pieces that are activated differently in different situations.62 It follows that learning is the process by which a similar set(s) of resources are reliably activated in isomorphic situations. A unitary perspective distinguishes between conceptions, beliefs, epistemologies, ontologies, and cultures and tends to view each as stable states of an individual. That is, an individual has a particular epistemology, and individual has a particular conception or belief. Moreover, it is assumed that what an individual articulates is approximately the same “size” as the cognitive element it represents. When using a resource perspective, the researcher must take into account the context in which the human acts and the operative parts of the context, sometimes involving the statement of the physics problem, the type of physical setting (large lecture or group), and other subtle features of a learning environment. Individuals read-out certain features of the environment as important and this then activates a certain set of resources that lead to a response. In this view, what an individual articulates is typically a much larger grain-size than the cognitive elements (including ontological, epistemological, and conceptual resources) that make it up. According to Hammer et al.,62
Our framework ascribes cognitive objects to individual minds, but at a finer grain-size than concepts or abilities as people experience them. In this view, knowledge and experience are emergent, analogous to other emergent phenomena in complex systems, in which the “things” we see—traffic jams, birds flocking, and so on—emerge from many small agents acting in local concert. In other words, we need to be alert to the tendency to “thingify” experience (Minsky, 1986; Wilensky & Resnick,1999) (p. 92).
In contrast to the unitary perspective, instead of prescribing a culture, a belief, or an epistemology to an individual, a researcher using a resource perspective looks for epistemological, cultural, conceptual, social, and linguistic resources. As is the case with the wave and particle models of light in physics, both the unitary and the resources perspectives on cognition and learning serve different purposes in PER, depending upon what questions the researcher is interested in answering and how he frames his research study.
Both the unitary and resource perspectives on cognition and learning are thought of as “cognitive” or “in-the-head” theoretical perspectives in contrast to socio-cultural perspectives on learning, which are increasingly being used in PER. In general, the difference between cognitive and socio-cultural perspectives is that while cognitive perspectives focus on the
Otero & Harlow Qualitative Research
Getting Started in Physics Education Research 46
activation and evolution of cognitive elements and/or cognitive structures in response to contextual features, socio-cultural perspectives focus more on the role of the contextual features in the learning process. With a socio-cultural perspective, learning is not strictly limited to evolving patterns of activity that primarily take place inside the head; instead, learning can also be thought of in terms of changes in an individual’s patterns of participation within a community (such as the community of a classroom or the community of physics as a whole). Researchers using socio-cultural perspectives are likely to be interested in evolving language practices, evolving social practices, and the development of individual and social identities. An example of a socio-cultural perspective that has been used in PER is Vygotsky’s theory of concept formation.46 According to this perspective, learners bring experience-based “concepts” to a learning situation and are presented with academic “concepts.” Experience-based concepts are unconscious generalizations, expressed in everyday language, that derive meaning directly from experience. For example, a child may understand the meaning of the term “brother,” but be unable to articulate that a “brother is a male having a parent in common with another.” Academic concepts are typically abstracted from many particular experiences, are expressed in formal language, and meaning is derived from agreed upon language, symbols, and tool use. Learning is then the process by which academic concepts become connected to the experiences of the learner and related experience-based concepts become generalized beyond the experiences to which they are tied. Through this process, the language used to describe a similar idea that was generated through experiences becomes consistent with the language used to describe this idea within the scientific community.63,64 Socio-cultural perspectives focus more on how an individual appropriates the language and practices of a community, than on what “knowledge” is activated in a given context. Still other socio-cultural perspectives view learning as participation in a community of practice.65 Such perspectives do not discuss what happens in the heads of individuals and instead define learning in terms of changes in trends in behavior among an individual or group of individuals.66-68
7.3 The influence of theoretical perspectives on the research process
One’s theoretical perspective (whether it is made explicit or whether it is tacit) influences all aspects of the research process including the research questions, data collection and analysis, and inferences made from the data. Each of these is discussed in detail below.
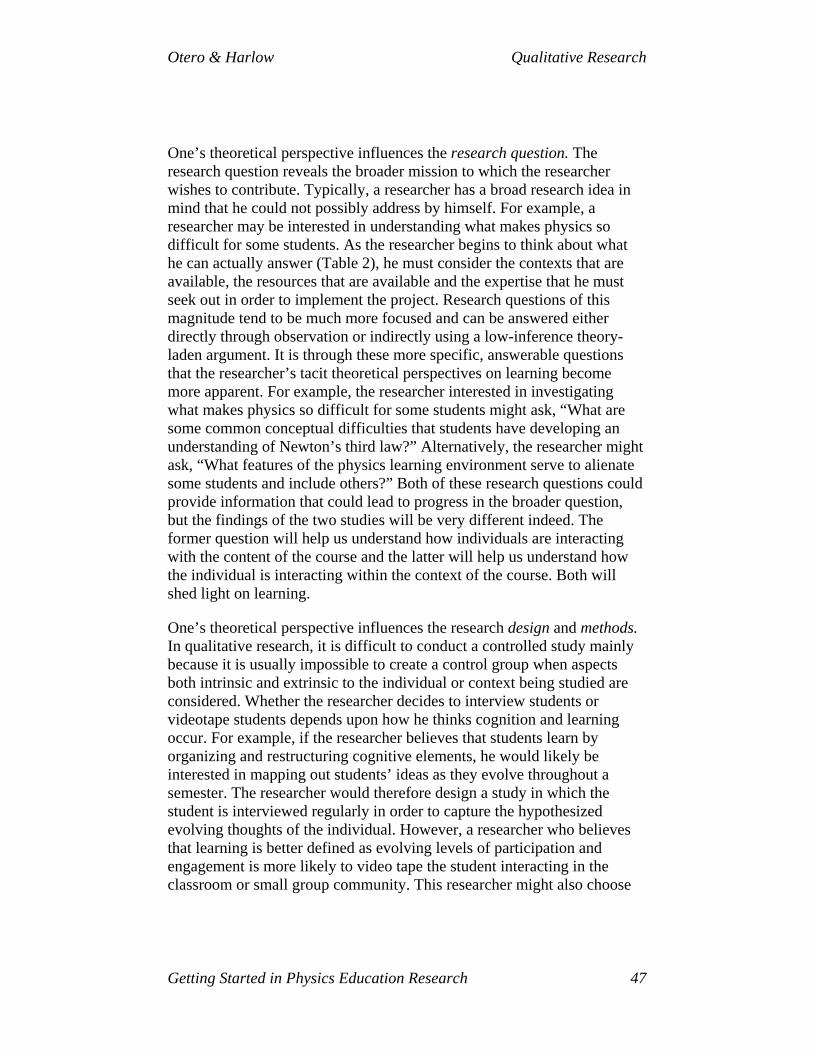
Otero & Harlow Qualitative Research
Getting Started in Physics Education Research 47
One’s theoretical perspective influences the research question. The research question reveals the broader mission to which the researcher wishes to contribute. Typically, a researcher has a broad research idea in mind that he could not possibly address by himself. For example, a researcher may be interested in understanding what makes physics so difficult for some students. As the researcher begins to think about what he can actually answer (Table 2), he must consider the contexts that are available, the resources that are available and the expertise that he must seek out in order to implement the project. Research questions of this magnitude tend to be much more focused and can be answered either directly through observation or indirectly using a low-inference theory-laden argument. It is through these more specific, answerable questions that the researcher’s tacit theoretical perspectives on learning become more apparent. For example, the researcher interested in investigating what makes physics so difficult for some students might ask, “What are some common conceptual difficulties that students have developing an understanding of Newton’s third law?” Alternatively, the researcher might ask, “What features of the physics learning environment serve to alienate some students and include others?” Both of these research questions could provide information that could lead to progress in the broader question, but the findings of the two studies will be very different indeed. The former question will help us understand how individuals are interacting with the content of the course and the latter will help us understand how the individual is interacting within the context of the course. Both will shed light on learning.
One’s theoretical perspective influences the research design and methods. In qualitative research, it is difficult to conduct a controlled study mainly because it is usually impossible to create a control group when aspects both intrinsic and extrinsic to the individual or context being studied are considered. Whether the researcher decides to interview students or videotape students depends upon how he thinks cognition and learning occur. For example, if the researcher believes that students learn by organizing and restructuring cognitive elements, he would likely be interested in mapping out students’ ideas as they evolve throughout a semester. The researcher would therefore design a study in which the student is interviewed regularly in order to capture the hypothesized evolving thoughts of the individual. However, a researcher who believes that learning is better defined as evolving levels of participation and engagement is more likely to video tape the student interacting in the classroom or small group community. This researcher might also choose
Otero & Harlow Qualitative Research
Getting Started in Physics Education Research 48
to interview a student, but not to investigate the evolution of the student’s conceptions, but instead to investigate differences in the way the student views his role in the class.
One’s theoretical perspective influences the process and products of data analysis. Whether the researcher collects audio-taped interview data, video-taped observational data, field notes, survey data, or some combination thereof, she must make decisions regarding which aspects of the data are important. This process is highly influenced by how she has framed the study. For example, from a set of interview transcripts focused on students’ understanding of Newton’s third law, a researcher might pay attention not only to the answer the student gave, but also to the specific question that was posed to the student. In this case, the researcher was influenced by the “resources” theoretical perspective and framed the study according to this perspective. The resource perspective contends that contextual features (often including the problem statement) cue different elements of the students’ thinking, including what the student thought she was being asked to do (make sense of something or provide an answer). All these cued elements contribute to the answer the student ultimately articulates. On the other hand, a researcher who has framed the study in terms of a socio-cultural perspective might be more interested in investigating how students gain status and power in the classroom setting. This researcher might look for changes in discourse strategies, physical demeanor, and gestures as a means for understanding how the student is positioning himself in this social situation. From this, the researcher would likely make inferences about how power structures influence a student’s perceived possible set of roles in the classroom, and how this influences this student’s interactions, self-perceptions, and chances for engaging in sense-making and problem solving with a group of students. Indeed, this inference is very different from one having to do with the development of cognitive structures (schema) or cuing of cognitive resources.
One’s theoretical perspective explicitly influences the interpretation of the findings and inferences made from data. For example, a piece of video data might show a student stating, “the car stopped because the force ran out.” Many interpretations can be made from this statement. Consider those listed below:
1. The student has the misconception that force is “impetus-like” and is in fact an entity that is transferred to the car from the hand during the push. This “impetus” ultimately begins to runs out as the car slows down and stops.
Otero & Harlow Qualitative Research
Getting Started in Physics Education Research 49
2. The situation activated a variety of resources for the student, among them the frequently correct notion of maintaining agency—the idea that effort must be continued in order to maintain an effect. The idea of maintaining agency is a good idea, but would be more useful if applied to energy rather than force.
3. The student is attempting to retrofit the terminology being promoted in class to his experience-based views of what is going on. He thinks the “umph” ran out but uses the word “force” because that is the topic of class. The student has applied ideas of energy and used the term being promoted in class.
As is clear from the three examples here, three different conclusions are drawn from the same piece of data, a single statement made by a student. Each of these conclusions is tied closely to the way in which the researcher views students and the process of classroom learning which typically informs the way the researcher has framed the study. The fact that multiple inferences can be made from the same set of data (although this is not always the case) does not discredit qualitative research, instead it illustrates the need for the researcher to be explicit to himself and in his writing about the perspective(s) that might have influenced his interpretation of the data.
In PER there are many possible theoretical perspectives from which to draw and each could lead the researcher to value different aspects of the data or to draw different conclusions from the same data.
We have presented a very broad overview of theoretical perspectives in PER. For a more detailed discussion on theoretical perspectives the reader is directed to research review articles.69-72 We turn now to an illustration of the entire research process. We illustrate how the codes, the representation of codes, the quantification of codes, and the use of theory can lead to the development of an explanatory model of a learning phenomenon in the subject of electrostatics.
8. An illustration of the research process In this section, one of the authors, Otero, describes first-hand the process she went through to move from a descriptive model to an explanatory model.
Otero & Harlow Qualitative Research
Getting Started in Physics Education Research 50
Toward an explanatory model of a learning phenomenon
Beginning the research process
I was interested in investigating differences in how a computer simulator versus laboratory apparatus impacted students’ learning in an inquiry-based, conceptual physics course designed for non-science majors].63,64 In this case, my role was as a participant-observer in that addition to researching (observing) the class, I was also participating as an assistant to the instructor. I focused on the unit on electrostatics and in particular, on students’ development of a model for charging insulators by rubbing them together. There was no textbook used for the course; instead the students were expected to produce their own explanations of phenomena on the basis of their experiments with laboratory apparatus and with simple computer simulator visualizations.
I began my study simply by investigating how students’ mental models about charging insulators by rubbing evolved over the course of the semester. Because I was more interested in understanding a few students’ ideas in great depth rather than a more cursory understanding of many students, I did not attempt to get a large sample of students but instead focused on two groups of three students. I selected two different grain-sizes for analysis: 1) the behavior of the two groups of students and 2) each individual student’s evolution of ideas about electrostatics. I collected three types of data: I interviewed each student individually using audio-tape records, video-taped both groups throughout each class period throughout the unit on electrostatics, and collected all of their written work including tests, homework, workbooks, and pictures they constructed during interviews. I transcribed both the video data and the audio-taped interview data in their entirety.
I used a generative coding scheme, recognizing some common student behaviors which I coded as model-based reasoning, experience-based reasoning, performing experiments, and logistics. It should be clear already, that some selection occurred at this stage. As shown in the table below, I coded mostly for what students were doing with respect to the scientific content and scientific behaviors. Different interests could have led me to code for gender differences, time that each group member spoke, or even the color of shirts the students were wearing. As I was coding the data, several codes that represented what the students were doing as they worked with laboratory apparatus and computer simulations emerged. As demonstrated in Figure 9, these codes were
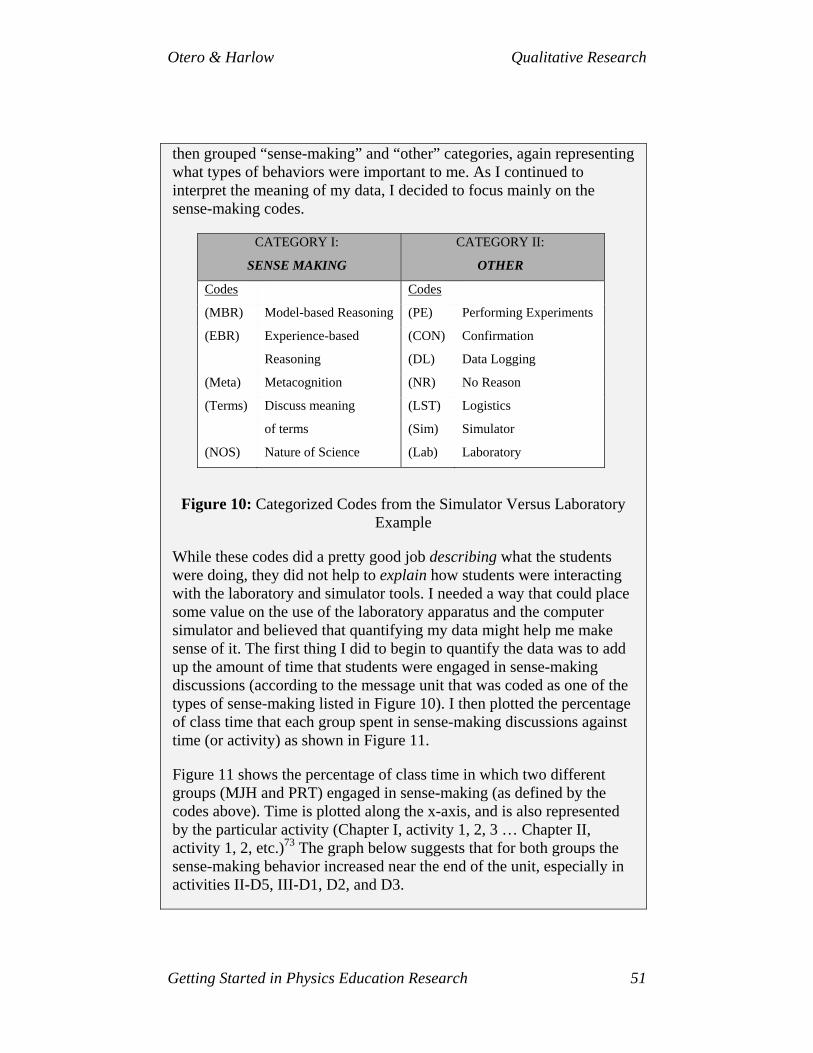
Otero & Harlow Qualitative Research
Getting Started in Physics Education Research 51
then grouped “sense-making” and “other” categories, again representing what types of behaviors were important to me. As I continued to interpret the meaning of my data, I decided to focus mainly on the sense-making codes.
CATEGORY I:
SENSE MAKING
CATEGORY II:
OTHER
Codes Codes
(MBR) Model-based Reasoning (PE) Performing Experiments
(EBR) Experience-based (CON) Confirmation
Reasoning (DL) Data Logging
(Meta) Metacognition (NR) No Reason
(Terms) Discuss meaning (LST) Logistics
of terms (Sim) Simulator
(NOS) Nature of Science (Lab) Laboratory
Figure 10: Categorized Codes from the Simulator Versus Laboratory Example
While these codes did a pretty good job describing what the students were doing, they did not help to explain how students were interacting with the laboratory and simulator tools. I needed a way that could place some value on the use of the laboratory apparatus and the computer simulator and believed that quantifying my data might help me make sense of it. The first thing I did to begin to quantify the data was to add up the amount of time that students were engaged in sense-making discussions (according to the message unit that was coded as one of the types of sense-making listed in Figure 10). I then plotted the percentage of class time that each group spent in sense-making discussions against time (or activity) as shown in Figure 11.
Figure 11 shows the percentage of class time in which two different groups (MJH and PRT) engaged in sense-making (as defined by the codes above). Time is plotted along the x-axis, and is also represented by the particular activity (Chapter I, activity 1, 2, 3 … Chapter II, activity 1, 2, etc.)73 The graph below suggests that for both groups the sense-making behavior increased near the end of the unit, especially in activities II-D5, III-D1, D2, and D3.
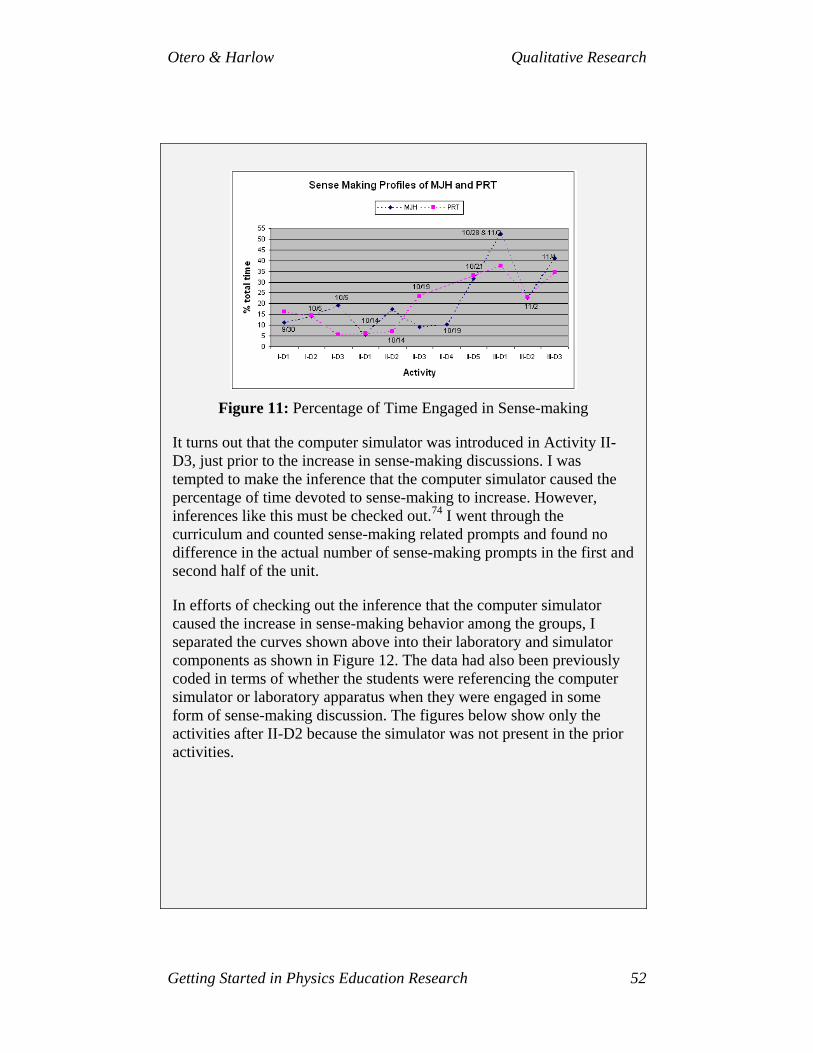
Otero & Harlow Qualitative Research
Getting Started in Physics Education Research 52
Figure 11: Percentage of Time Engaged in Sense-making
It turns out that the computer simulator was introduced in Activity II-D3, just prior to the increase in sense-making discussions. I was tempted to make the inference that the computer simulator caused the percentage of time devoted to sense-making to increase. However, inferences like this must be checked out.74 I went through the curriculum and counted sense-making related prompts and found no difference in the actual number of sense-making prompts in the first and second half of the unit.
In efforts of checking out the inference that the computer simulator caused the increase in sense-making behavior among the groups, I separated the curves shown above into their laboratory and simulator components as shown in Figure 12. The data had also been previously coded in terms of whether the students were referencing the computer simulator or laboratory apparatus when they were engaged in some form of sense-making discussion. The figures below show only the activities after II-D2 because the simulator was not present in the prior activities.
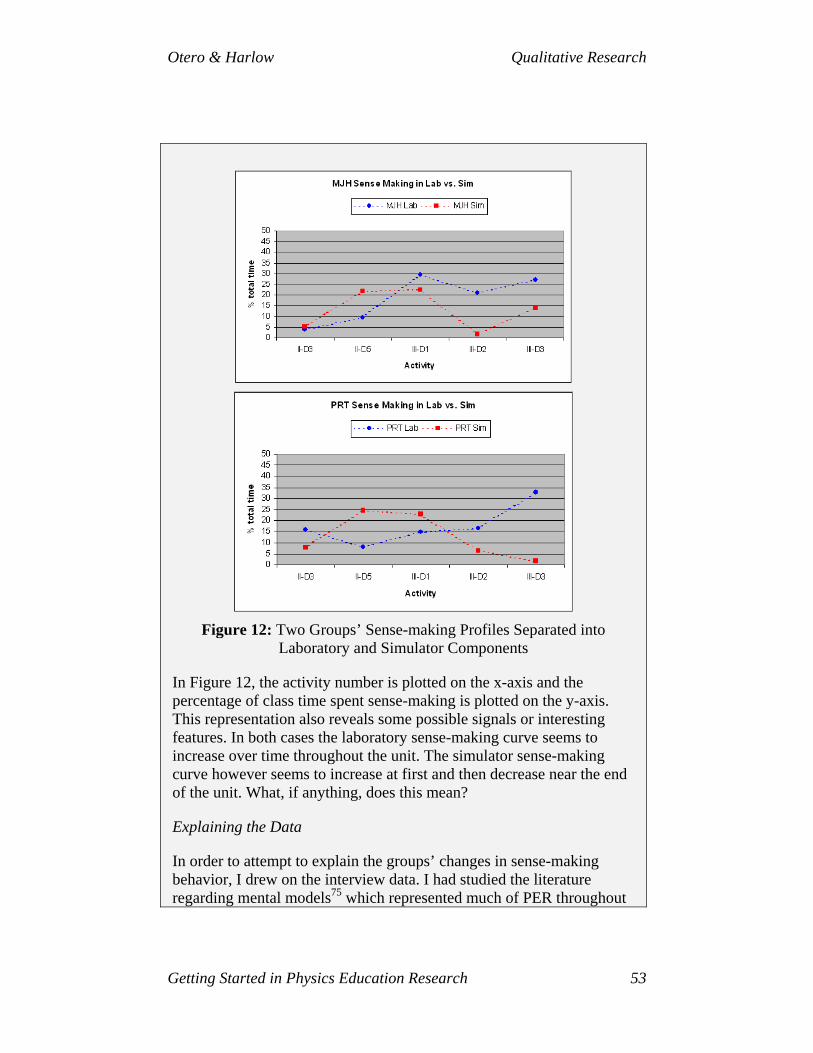
Otero & Harlow Qualitative Research
Getting Started in Physics Education Research 53
Figure 12: Two Groups’ Sense-making Profiles Separated into
Laboratory and Simulator Components
In Figure 12, the activity number is plotted on the x-axis and the percentage of class time spent sense-making is plotted on the y-axis. This representation also reveals some possible signals or interesting features. In both cases the laboratory sense-making curve seems to increase over time throughout the unit. The simulator sense-making curve however seems to increase at first and then decrease near the end of the unit. What, if anything, does this mean?
Explaining the Data
In order to attempt to explain the groups’ changes in sense-making behavior, I drew on the interview data. I had studied the literature regarding mental models75 which represented much of PER throughout
Otero & Harlow Qualitative Research
Getting Started in Physics Education Research 54
the 1980s and 1990s and took the perspective that students had “mental models” that were sometimes consistent and sometimes inconsistent with scientific ideas. Influenced by this literature, I coded the interview data in terms of the type of mental model each student seemed to articulate regarding how insulators are charged by rubbing them together. At first I just went through and coded what looked like a mental model and later only considered those mental models that were consistently used, that is, the model was articulated at least three times by the same person in the video data, the interview data, and/or the written work. I ended up finding a total of 12 mental models, each of which was consistently used (as defined above) by at least one of the 6 students in the study. These data were then represented in two graphical representations - one for each group as shown in Figure 13. In the model evolution profiles in Figure 13, time is represented on the x-axis and the various models are shown on the y-axis. The representation below seems to indicate a hierarchical distribution of the models. The lower-valued models shown on the y-axis are models that state only the conditions that could lead to the observation of two objects attracting after being rubbed together. The models shown near the top of the y-axis provide a mechanism to explain the observation. The one-way transfer model is the scientific model and is given the highest location on the y-axis. Less sophisticated models are placed lower on the y-axis. The purpose here is to work toward an explanatory model for the possible effect shown in Figure 12, namely, that the percentage of time that the groups spent sense-making using the laboratory apparatus increased over time whereas the simulator sense-making seemed to increase at first and then decrease by the end of the unit.
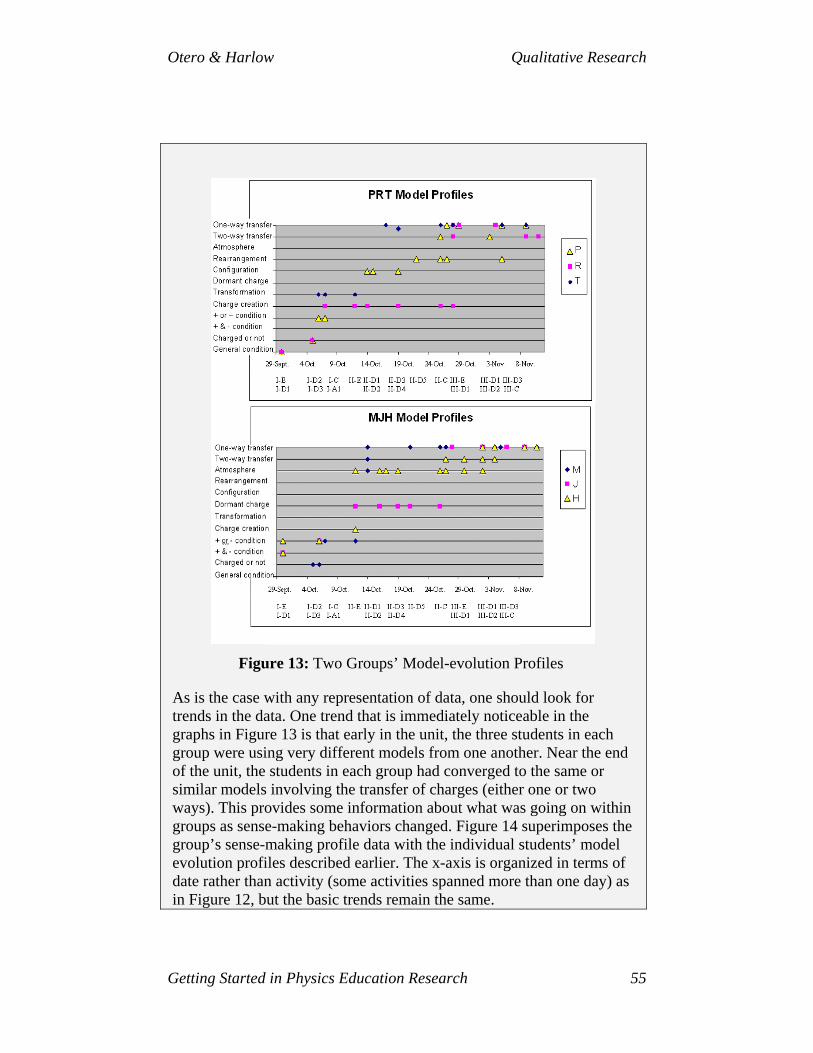
Otero & Harlow Qualitative Research
Getting Started in Physics Education Research 55
Figure 13: Two Groups’ Model-evolution Profiles
As is the case with any representation of data, one should look for trends in the data. One trend that is immediately noticeable in the graphs in Figure 13 is that early in the unit, the three students in each group were using very different models from one another. Near the end of the unit, the students in each group had converged to the same or similar models involving the transfer of charges (either one or two ways). This provides some information about what was going on within groups as sense-making behaviors changed. Figure 14 superimposes the group’s sense-making profile data with the individual students’ model evolution profiles described earlier. The x-axis is organized in terms of date rather than activity (some activities spanned more than one day) as in Figure 12, but the basic trends remain the same.
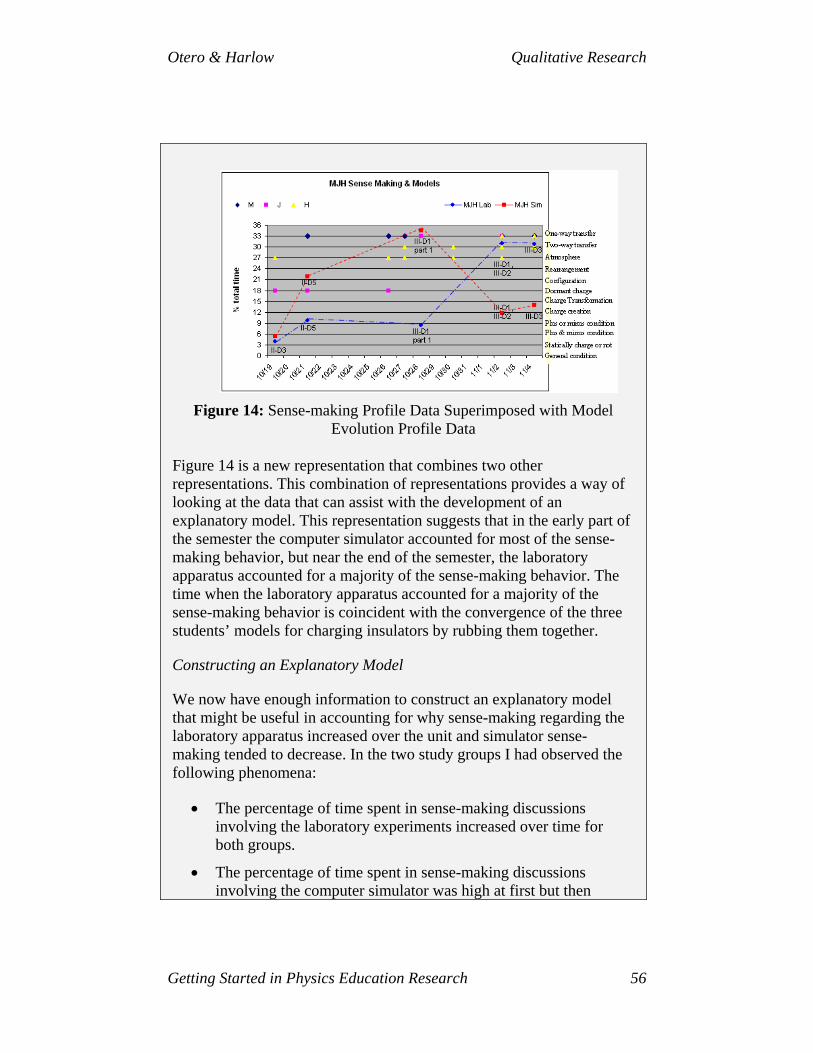
Otero & Harlow Qualitative Research
Getting Started in Physics Education Research 56
Figure 14: Sense-making Profile Data Superimposed with Model
Evolution Profile Data Figure 14 is a new representation that combines two other representations. This combination of representations provides a way of looking at the data that can assist with the development of an explanatory model. This representation suggests that in the early part of the semester the computer simulator accounted for most of the sense-making behavior, but near the end of the semester, the laboratory apparatus accounted for a majority of the sense-making behavior. The time when the laboratory apparatus accounted for a majority of the sense-making behavior is coincident with the convergence of the three students’ models for charging insulators by rubbing them together.
Constructing an Explanatory Model
We now have enough information to construct an explanatory model that might be useful in accounting for why sense-making regarding the laboratory apparatus increased over the unit and simulator sense-making tended to decrease. In the two study groups I had observed the following phenomena:
• The percentage of time spent in sense-making discussions involving the laboratory experiments increased over time for both groups.
• The percentage of time spent in sense-making discussions involving the computer simulator was high at first but then
Otero & Harlow Qualitative Research
Getting Started in Physics Education Research 57
decreased over time for both groups.
• Near the end of the unit, all of the students were consistently using a one or two-way charge transfer model for charging insulators by rubbing them together.
• In each group, the students’ models converged around the time that the laboratory sense-making accounted for most of the sense-making behavior.
In order to construct an explanatory model that could establish clear links between research questions and the summary findings and to ensure that links are transparent and defensible I had to choose a theoretical perspective or develop a conceptual framework.
I drew on Edward Hutchins’s theoretical perspective of distributed cognition, which considers the learners, tools (in this case laboratory apparatus and computer simulators), and the learning environment to be a socio-cultural, cognitive system which generates knowledge.76 Being familiar with this perspective, I noticed that the role of the laboratory apparatus and the computer simulator seemed to shift near the end of the semester, about the same time that the models of each student in each group converged to a transfer model. I interpreted these findings in the following theoretically-bound way.
Early in the unit, students all had models for charging insulators by rubbing them together that were very different from one another. The students may not have even been aware of the differences in their thinking. When they engaged in discourse, they relied heavily on the computer simulator, which presented red and blue lines of varied thickness to represent different types and amounts of charge on the surface of insulators and within conductors. During the times when the students’ models were different from one another, they relied on the computer simulator to help them generate ideas, that is, the computer simulator played a generative role. They would then test out these ideas by performing a quick laboratory experiment. That is, the laboratory apparatus had a confirmatory role. However, after the students’ models converged and each of the students was aware of his or her own model, and each of the students was aware that the other students’ models were similar, and each group of students had developed agreed upon language with which to discuss the phenomenon, each group was able to reason directly from the laboratory apparatus. That is, the laboratory apparatus began to take on a generative role, even as the
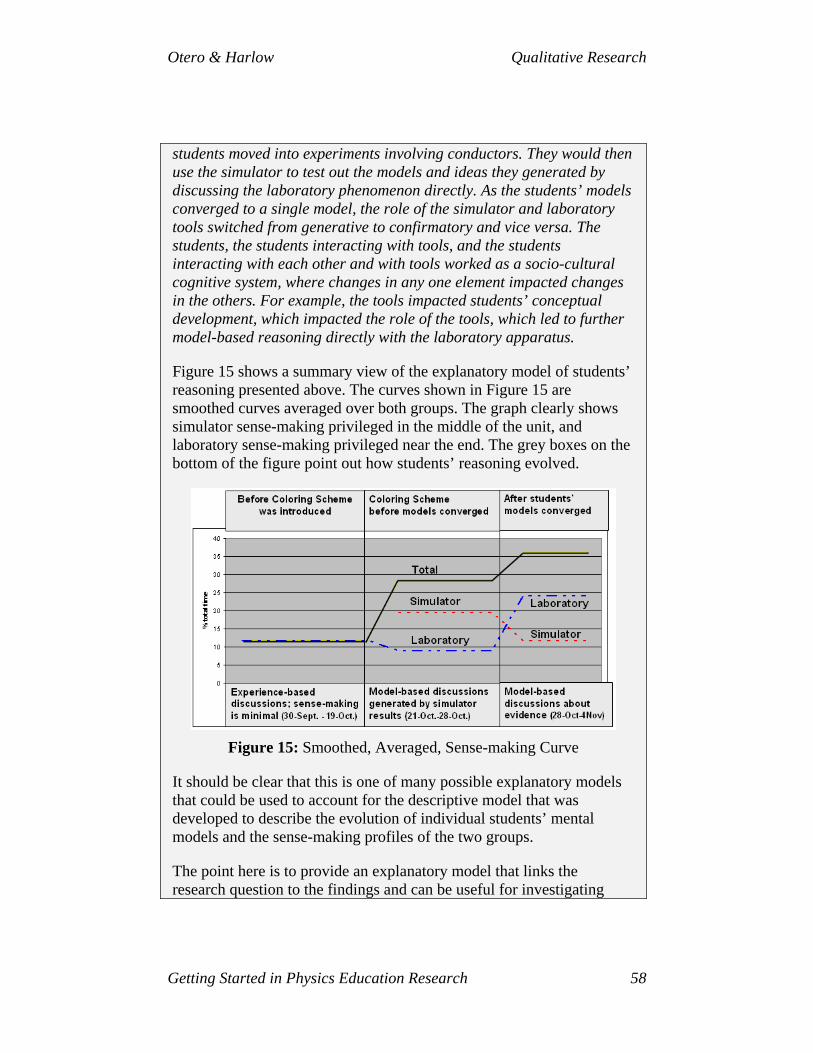
Otero & Harlow Qualitative Research
Getting Started in Physics Education Research 58
students moved into experiments involving conductors. They would then use the simulator to test out the models and ideas they generated by discussing the laboratory phenomenon directly. As the students’ models converged to a single model, the role of the simulator and laboratory tools switched from generative to confirmatory and vice versa. The students, the students interacting with tools, and the students interacting with each other and with tools worked as a socio-cultural cognitive system, where changes in any one element impacted changes in the others. For example, the tools impacted students’ conceptual development, which impacted the role of the tools, which led to further model-based reasoning directly with the laboratory apparatus.
Figure 15 shows a summary view of the explanatory model of students’ reasoning presented above. The curves shown in Figure 15 are smoothed curves averaged over both groups. The graph clearly shows simulator sense-making privileged in the middle of the unit, and laboratory sense-making privileged near the end. The grey boxes on the bottom of the figure point out how students’ reasoning evolved.
Figure 15: Smoothed, Averaged, Sense-making Curve
It should be clear that this is one of many possible explanatory models that could be used to account for the descriptive model that was developed to describe the evolution of individual students’ mental models and the sense-making profiles of the two groups.
The point here is to provide an explanatory model that links the research question to the findings and can be useful for investigating
Otero & Harlow Qualitative Research
Getting Started in Physics Education Research 59
similar situations. For a more detailed description of the research described in the example above, please see full papers.63,64 For now, we hope that this illustration has brought to life the qualitative research process, from coding data to constructing an explanatory model. In the following section, we elaborate the role of theoretical perspectives in influencing all parts of the research process.
It is very satisfying to construct an explanatory model for a learning phenomenon under investigation. However, it is difficult to gain confidence in explanatory models. Gaining confidence in claims and explanations is greatly assisted by validity and reliability checks. Testing for validity and reliability is also a critical part of the research process that begins as early as coding.
8. Validity and Reliability in Qualitative Research
8.1 Validity
Validity is the trustworthiness of inferences drawn from data. Traditionally, internal validity had been defined as the credibility of inferences that experimental treatments cause effects under certain well-defined circumstances. External validity had traditionally been defined as generalizing the effects observed under experimental conditions to other populations and contexts. In qualitative research, internal validity can be addressed by implementing research methods that increase the likelihood of eliciting an accurate view of the participants’ reality. Validity can be increased by using multiple sources of data to support claims and conclusions (triangulation) such as students’ written work, classroom video tape, and audio/video taped interviews.
8.2 Reliability
Reliability refers to the extent to which studies can be replicated. The nature of qualitative research limits reliability in the traditional sense. Qualitative PER is multilayered, constantly changing, and involves multiple populations (faculty and students with diverse goals and preparation, universities, K-12 schools, and the influences of communities and families). Internal reliability requires that within a single study, multiple observers of the same phenomenon come to the same conclusion.77 Instead of seeking replication in the traditional sense,
Otero & Harlow Qualitative Research
Getting Started in Physics Education Research 60
qualitative research often seeks to describe a slice of life as accurately as possible. When a researcher describes a slice of life, she provides a thick description of elements in the environment, what the actors say and do, and many other relevant interactions. One way to test for reliability is for the researcher to sit with the research subjects to check the accuracy of her descriptions of the actors, their actions, and the context in which they act.
8.3 Gaining confidence in claims
Qualitative researchers use several strategies to gain confidence in their claims. During coding, researchers check for inter-rater reliability. During analysis, they triangulate data. Following analysis they engage in member checking. These three strategies are described below.
Inter-rater reliability is a process to make sure that the coding process is as objective as possible. Once the coding scheme has been developed and the codes have been described, researchers may ask another person to use the coding scheme to code a section of transcript. The two researchers then compare the degree to which their coding is similar. If there is great disagreement, the coding scheme requires refinement or better definitions of the codes.
Triangulating claims is a process of comparing data of different types (e.g., interview and observation) and across multiple times (comparing one observation to another) and multiple participants. One may look at both observations and interviews to gain a better understanding of a student’s ideas.
Member checking is the process of checking interpretations with participants. A researcher might ask a participant to review research findings and interpretations and provide feedback on whether the findings and descriptions are accurate and complete.
Other strategies for gaining confidence in claims
• Make all assumptions and perspectives explicit to yourself and others.
• Keep good notes to see how your perspective has changed from initial assumptions.
• Describe your role in the research setting.
Otero & Harlow Qualitative Research
Getting Started in Physics Education Research 61
• Utilize multiple viewings of videotape and multiple researchers.
• Transcribe everything.
8.4 A note about numbers.
While many qualitative research designs do not rely on counting anything, one may often want to integrate quantities into qualitative designs. One may count the time that students are engaged in a particular activity or count the number of instances of students supporting claims with evidence. Chi’s paper, Quantifying Qualitative Analysis of Verbal Data describes the process she follows in analyzing text-based data.78
8.5 Summary
Qualitative research is a time-consuming and rewarding process. Like other types of research it is systematic; claims are made and supported, and measures are taken to gain confidence in one’s claims. In all reports of qualitative research it is best to describe not only the research context in great detail but the theoretical perspective that the researcher thinks might be influencing the decisions she makes throughout the research process. Like other types of research, one’s results and inferences should be transparent to the reader. Although qualitative research is not generalizable or predictive in ways that quantitative research is, we hope to have presented enough information for the reader to see the utility and value of qualitative research.
As you embark on qualitative research remember one thing, be true to yourself and to the community. Qualitative research is never done, but the work you do can be of great value to others. Most of all, have fun!
1 R. Hake, "Interactive-engagement Versus Traditional Methods: A Six-
thousand-student Survey of Mechanics Test Data for Introductory Physics Courses," Am. J. Phys. 66, 64 (1998).
2 R. K. Thornton and D. R. Sokoloff, "Assessing Student Learning of Newton's Laws: The Force and Motion Conceptual Evaluation and the Evaluation of Active Learning Laboratory and Lecture Curricula," Am. J. Phys. 66, 338 (1998).
3 S. Pollock and N. Finkelstein, "Sustaining Educational Reforms in Introductory Physics," Phys Rev. ST Phys. Educ. Res. 4, 10110 (2008).
Otero & Harlow Qualitative Research
Getting Started in Physics Education Research 62
4 S. Pollock, N. Finkelstein, and L. Kost, "Reducing the Gender Gap in the Physics Classroom: How Sufficient is Interactive Engagement?" Phys Rev. ST-PER 3 (2007).
5 M. Lorenzo, C. Crouch, and E. Mazur, "Reducing the Gender Gap in the Physics Classroom," Am. J. Phys. 74, 118 (2006).
6 J. Doktor and K. Heller, in Physics Education Research Conference (Edmonton, Canada, 2008).
7 E. Redish, J. Saul, and R. Steinberg, "Student Expectations in Introductory Physics," Am. J. Phys. 66, 212 (1998).
8 W. Adams, K. Perkins, N. Podolefsky, et al., "A New Instrument for Measuring Student Beliefs About Physics and Learning Physics: the Colorado Learning Attitudes about Science Survey," Phys Rev. ST-PER 2, 101010 (2006).
9 E. Redish, Teaching Physics with the Physics Suite (Wiley, 2003). 10 J. L. Lemke, Talking Science: Language, Learning, and Values (Ablex
Publishing Corporation, Norwood, NJ, 1990). 11 J. P. Gee, An Introduction to Discourse Analysis: Theory and Method
(Routledge, London, 2005). 12 G. Psathas, Phenomenological Sociology: Issues and Applications
(Wiley, New York, 1973). 13 A. Strauss and J. Corbin, Basics of Qualitative Research: Grounded
Theory Procedures and Techniques (Sage Publications, Newbury Park, CA, 1990).
14 B. Glaser and A. Strauss, The Discovery of Grounded Theory: Strategies for Qualitative Research (Aldine, Chicago, 1967).
15 C. K. Riessman, Narrative Analysis (Qualitative Research Methods) (Sage Publications, Inc, Newberry Park, 1993).
16 M. LeCompte and J. Preissle, Ethnography and Qualitative Design in Educational Research (Academic Press, San Diego, 1993).
17 D. R. Thomas, "A General Inductive Approach for Qualitative Data Analysis," Am. J. Eval. 27, 237 (2006), p. 238.
18 T. D. Cook and C. S. Reichardt, Qualitative and Quantitative Methods in Evaluation Research (Sage Publications, Thousand Oaks, 1979).
19 C. Geertz, The Interpretation of Cultures: Selected Essays (Basic Books, New York, 1973).
20 A. Peshkin, "From Title to Title: The Evolution of Perspective in Naturalistic Inquiry", Anth. & Ed. Qtrly. 16, 214 (1985).
21 M. Q. Patton, Qualitative Evaluation and Research Methods (Sage Publications, Newbury Park, CA, 1990).
22 D. W. Stewart and P. N. Shamdasani, Focus Groups: Theory and Practice (Sage, London, 1990).
Otero & Harlow Qualitative Research
Getting Started in Physics Education Research 63
23 C. Lewis and J. Rieman, Task Centered User Interface Design: A Practical Introduction (1993).
24 A. De Groot, Thought and Choice in Chess (Mouton, The Hague, 1965). 25 A. Newell and H. A. Simon, Human Problem Solving (Prentice-Hall,
Englewood Cliffs, NJ, 1972). 26 D. C. Smith and D. Neale, "The Construction of Subject Matter
Knowledge in Primary Science Teaching," Teach. & Teach. Ed. 5, 1 (1989).
27 C. Henderson, E. Yerushalmi, V. Kuo, et al., "Physics Faculty Beliefs and Values About the Teaching and Learning of Problem Solving. II. Procedures for Measurement and Analysis," Phys Rev. ST-PER 2 (2007).
28 J. Spradley, Participant Observation (Thompson Learning, Toronto, 1980).
29 D. Sawada, M. Pilburn, E. Judson, et al., "Measuring Reform Practices in Science and Mathematics Classrooms: The Reformed Teaching Observation Protocol," Sch. Sci. & Math. 102, 245 (2002).
30 J. W. Creswell, Educational Research: Planning, Conducting, and Evaluating Quantitative and Qualitative Research (Pearson, Upper Saddle River, 2005).
31 F. Erickson, in Handbook of Complementary Methods in Education Research, edited by J. Green, G. Camilli and P. Elmore (Lawrence Earlbaum, Mahwah, NJ, 2006).
32 J. Jacobs, H. Hollingsworth, and K. Givvin, "Video-Based Research Made "Easy": Methodological Lessons Learned from the TIMSS Video Studies," Field Meth. 19, 284 (2007).
33 B. Jordan and A. Henderson, "Interaction Analysis: Foundations and Practice," J. Learn. Sci. 4, 39 (1995).
34 G. Jefferson, "Is 'no' an Acknowledgment Token? Comparing American and British uses of (+)/(-) Tokens," J. Pragmatics 34, 1345 (2002).
35 G. Jefferson, in Conversation Analysis: Studies from the First Generation, edited by G. H. Lerner (John Benjamins, Amsterdam/Philadelphia, 2004), p. 13.
36 R. Scherr, "Gesture Analysis for Physics Education Researchers," Phys Rev. ST-PER 4, 1 (2008).
37 G. Ryan and H. Bernard, in Handbook of Qualitative Research, edited by N. K. Denzin and Y. S. Lincoln (Sage, Thousand Oaks, 2000).
38 R. Bleicher, K. G. Tobin, and C. J. McRobbie, "Opportunities to Talk Science in a High School Chemistry Classroom," Res. Sci. Ed. 33 (2003).
Otero & Harlow Qualitative Research
Getting Started in Physics Education Research 64
39 J. Gumperz, in The Social Construction of Literacy, edited by J. Cook-Gumperz (Cambridge University Press, Cambridge, England, 1986), p. 45.
40 B. S. Bloom, (McKay, New York, 1956). 41 C. Henderson, E. Yerushalmi, K. Heller, et al., in AAPT Physics
Education Research Conference (Madison, WI, 2003). 42 E. H. van Zee, D. Hammer, M. Bell, et al., "Learning and Teaching
Science as Inquiry: A Case Study of Elementary School Teachers’ Investigations of Light," Sci. Ed. 89, 1007 (2005).
43 L. Walsh, R. G. Howard, and B. Bowe, "An Investigation of Introductory Physics Students' Approaches to Problem Solving," Phys Rev. ST Phys. Educ. Res 3, 020108 (2007).
44 J. Tuminaro and E. Redish, "Elements of a Cognitive Model of Physics Problem Solving: Epistemic Games," Phys Rev. ST-PER 3 (2007).
45 M. A. Eisenhart, in Proceedings of the Thirteenth Annual Meeting of Psychology of Mathematics Education – North America, edited by R. Underhill (Psychology of Mathematics Education, Blacksburg, VA, 1991).
46 L. Vygotsky, Thought and Language (MIT Press, Cambridge, Mass, 1962).
47 G. Rumelhart, Schemata: the Building Blocks of Cognition, Theoretical Issues in Reading Comprehension (1980).
48 G. Posner, K. Strike, P. Hewson, et al., "Accommodation of a Scientific Conception: Toward a Theory of Conceptual Change," Sci. Ed. 66, 211 (1982).
49 K. Strike and G. Posner, in Philosophy of Science, Cognitive Psychology, and Educational Theory and Practice, edited by R. A. Duschl and R. J. Hamilton (SUNY Press, Albany, NY, 1992), p. 147.
50 A. diSessa, in Constructivism in the Computer Age, edited by G. Forman and P. Putall (Erlbaum, Hillsdale, NJ, 1988).
51 A. diSessa and M. Sherin, "What Changes in Conceptual Change?" Int. J. Sci. Ed. 20, 1155 (1998).
52 J. Mestre, T. Thaden-Koch, R. Dufrensne, et al., in International School of Physics "Enrico Fermi": Course CLVI Research on Physics Education, edited by E. Redish and M. Vicentini (Italian physics society, Varenna, Italy, 2003), p. 367.
53 L. McDermott and P. Shaffer, "Research as a Guide for Curriculum Development: An Example from Introductory Electricity, Part II: Design of Instructional Strategies," Am. J. Phys. 60, 1003 (1992).
Otero & Harlow Qualitative Research
Getting Started in Physics Education Research 65
54 L. McDermott and P. Shaffer, "Research as a Guide for Curriculum Development: An Example from Introductory Electricity, Part I: Investigation of Student Understanding," Am. J. Phys. 60, 994 (1992).
55 Design-Based Research Collective, "Design-based Research: An Emerging Paradigm for Educational Inquiry," Ed. Res. 32, 5 (2003).
56 R. Duit, W.-M. Roth, M. Komerek, et al., "Conceptual Change cum Discourse Analysis to Understand Cognition in a Unit on Chaotic Systems: Toward an Integrative Perspective on Learning Science," Int. J. Sci. Ed. 20, 1059 (1998).
57 N. S. Rebello, D. Zollman, A. Allbaugh, et al., in Transfer of Learning: A Modern Multidisciplinary Perspective, edited by J. Mestre (Information Age Publishing, Greenwich, CT, 2005), p. 217.
58 J. Piaget, The Equilibration of Cognitive Structures: the Central Problem of Intellectual Development (University of Chicago press, Chicago, 1985).
59 T. Kuhn, The Structure of Scientific Revolutions (University of Chicago Press, Chicago, 1962).
60 M. L. Minsky, Society of Mind (Simon and Schuster, New York, 1986). 61 F. C. Bartlett, Remembering (University of Chicago Press, Chicago,
1932). 62 D. Hammer, A. Elby, R. Sherr, et al., in Transfer of Learning: A Modern
Multidisciplinary Perspective, edited by J. Mestre (Information Age Publishing, Greenwich, CT, 2004).
63 V. Otero, in International School of Physics "Enrico Fermi": Course CLVI Research on Physics Education, edited by E. Redish and M. Vicentini (Italian Physics Society, Varenna, Italy, 2004), p. 447.
64 V. Otero, in Conference Proceedings of the International School of Physics "Enrico Fermi": Course CLVI Research on Physics Education, edited by E. Redish and M. Vicentini (Italian Physics Society, Varenna, Italy, 2004), p. 409.
65 J. Lave and E. Wenger, Situated Learning: Legitimate Peripheral Participation (Cambridge University Press, Cambridge, 1991).
66 J. Lave, Cognition in Practice: Mind, Mathematics and Culture in Everyday Life (Cambridge University Press, New York, 1988).
67 E. B. Moje, T. Collazo, R. Carrillo, et al., " 'Maestro, What is '"Quality"?' ": Language, Literacy, and Discourse in Project-Based Science, J. Res. Sci. Teach. 38, 469 (2001).
68 L. Fleck, Genesis and Development of a Scientific Fact (University of Chicago Press, Chicago, 1935/1979).
Otero & Harlow Qualitative Research
Getting Started in Physics Education Research 66
69 J. G. Greeno, A. M. Collins, and L. B. Resnick, in Handbook of Educational Psychology, edited by D. C. Berliner and R. C. Calfee (Macmillan, New York, 1996), p. 15.
70 C. Fosnot, in Constructivism: Theory, Perspectives, and Practice, edited by C. Fosnot (Teachers College Press, New York, 1997).
71 P. H. Scott, J. T. Asoko, and J. Leach, in The Handbook of Research on Science Education, edited by S. J. Abell and N. G. Lederman (Erlbaum, 2007).
72 C. W. Anderson, in The Handbook of Research on Science Education, edited by S. Abell and N. G. Lederman, p. 3.
73The activities in this curriculum are labeled as Elicitation (E), Development (D), Application (A), or whole class Consensus (C) discussions. So activity labels show the Chapter, the type of activity, and the number of the activity in the sequence: II-D1 is chapter II, Development activity #1.
74 There are other possible inferences that can be made. For brevity we simply consider one here.
75 D. Genter and A. Stevens, Mental Models (Erlbaum, Hillsdale, NJ, 1983).
76 E. Hutchins, "How a Cockpit Remembers its Speed," Cog. Sci. 19, 265 (1995).
77 K. R. Howe and M. A. Eisenhart, "Standards for Qualitative (and Quantitative) Research: a Prolegomenon," Ed. Res. 19, 2 (1990).
78 M. Chi, "Quantifying Qualitative Analysis of Verbal Data: A Practical Guide for the Analysis of Verbal Data," J. Learn. Sci. 6, 271 (1997).


![Skaffold - storage.googleapis.com · [getting-started getting-started] Hello world! [getting-started getting-started] Hello world! [getting-started getting-started] Hello world! 5](https://img.pdfslide.us/doc/110x75/5ec939f2a76a033f091c5ac7/skaffold-getting-started-getting-started-hello-world-getting-started-getting-started.jpg)