Embed Size (px)
Citation preview


Authors
Meredith Fergus Manager of Financial Aid Research Tel: 651-259-3963 [email protected]
Jennifer Trost Research Analyst Tel: 651-259-3917 [email protected]
Lisa Vu Research Intern
About Minnesota SLEDS
Minnesota is developing the Minnesota Statewide Longitudinal Education Data System (SLEDS) matching student data from prekindergarten through completion of postsecondary education and into the workforce. SLEDS will facilitate analysis to address a range of educational programmatic and delivery methods to gauge their effectiveness, and ease the design of targeted improvement strategies that help students.
SLEDS brings together data from education and workforce to:
Identify the most viable pathways for individuals in achieving successful outcomes in education and work;
Inform decisions to support and improve education and workforce policy and practice, and
Assist in creating a more seamless education and workforce system for all Minnesotans.
The Minnesota P-20 Education Partnership governs the SLEDS system. The project is managed jointly by the Minnesota Office of Higher Education (OHE), Minnesota Departments of Education (MDE), and Employment and Economic Development (DEED).

Table of Contents Table of Contents .....................................................................................................................................................1
Acknowledgments ....................................................................................................................................................3
Executive Summary..................................................................................................................................................4
Getting Prepared Data ............................................................................................................................................4
Defining Developmental Education .........................................................................................................................5
Findings: What the Data Tells Us ............................................................................................................................5
Introduction ...............................................................................................................................................................9
Getting Prepared Data ............................................................................................................................................9
Background on Developmental Education ......................................................................................................... 12
Defining Developmental Education ...................................................................................................................... 12
College Mission and Developmental Education Programs .................................................................................. 13
Identifying Students Who Need Developmental Education ................................................................................. 14
Student Perspectives of Developmental Education .......................................................................................... 16
Importance of Placement Exams / Assessments ................................................................................................. 16
Lack of Consistency in Determining Developmental Education Needs ............................................................... 17
Increased College Costs ...................................................................................................................................... 17
Added Time to Degree or Program Completion ................................................................................................... 18
Conclusion ............................................................................................................................................................ 18
State-Level Findings.............................................................................................................................................. 19
College Enrollment of Public High School Graduates .......................................................................................... 19
Developmental Education Course-Taking of Public High School Graduates ...................................................... 21
Trends in Developmental Education Over Time .................................................................................................. 22
College Outcomes ................................................................................................................................................ 24
Gender…. ............................................................................................................................................................. 25
Race/Ethnicity....................................................................................................................................................... 28
Language Spoken at Home .................................................................................................................................. 30
Economic Status................................................................................................................................................... 33
High School Type Attended .................................................................................................................................. 35
Testing…. ............................................................................................................................................................. 37
How does Minnesota Compare with Other States? ........................................................................................... 40
Additional Tables ................................................................................................................................................... 45
Table 3: College Enrollment of 2006-2012 Public High School Graduates ......................................................... 45
Table 4: Developmental Education Course-taking of 2006-2012 Public High School Graduates ....................... 49
Table 5: Developmental Education Credits .......................................................................................................... 53
Table 6: Where do Students Take Their Developmental Courses? Number of Students Enrolling in Developmental Education by College Offering Courses ...................................................................... 55
Table 7: College Enrollment of Public High School Graduates by Gender .......................................................... 56
1

Table 8: Developmental Education Course-taking of Public High School Graduates by Gender ....................... 57
Table 9: College Enrollment of Public High School Graduates by Race/Ethnicity ............................................... 58
Table 10: Developmental Education Course-taking of Public High School Graduates by Race/Ethnicity .......... 61
Table 11: College Enrollment of Public High School Graduates by Primary Language Spoken at Home .......... 63
Table 12: Developmental Education Course-taking of Public High School Graduates by Home Primary Language ............................................................................................................................................. 66
Table 13: College Enrollment of Public High School Graduates by Limited English Proficiency Status ............. 68
Table 14: Developmental Education Course-taking of Public High School Graduates by Limited English Proficiency Status ................................................................................................................................ 69
Table 15: College Enrollment of Public High School Graduates by Economic Status......................................... 70
Table 16: Developmental Education Course-taking of Public High School Graduates by Economic Status ...... 72
Table 17: College Enrollment of Public High School Graduates by District Type and Schools Classification .... 73
Table 18: Developmental Education Course-taking of Public High School Graduates by District Type and Schools Classification .......................................................................................................................... 76
Table 19: College Enrollment of Public High School Graduates by Accountability Test Proficiency ................... 78
Table 20: Developmental Education Course-taking of Public High School Graduates by Accountability Test Proficiency ............................................................................................................................................ 80
Table 21: ACT Composite Scores ........................................................................................................................ 82
Table 22: Persistence of High School Graduates by Developmental Education Status ...................................... 83
2

Acknowledgments
Thanks to staff from the Minnesota Department of Education, Minnesota State Colleges and Universities
and the University of Minnesota. Special thanks for the staff of MN.IT services and IBusinessSolutions,
Inc. in providing data and data quality for this report. Kudos to Jen Fox, OHE Communications for
successfully incorporating feedback from all stakeholders.
3

Executive Summary
Minnesota is a state highly regarded for the academic achievement of both our K-12 and college
students. Nationally, Minnesota ranks high in high school graduation rates and college attainment, but
there are significant disparities among students of color and low income students. For the state’s fast-
growing populations – people from communities of color and families of modest financial means – the
pathway to jobs requiring college education or training continues to have obstacles.
For Minnesota to remain globally competitive, our education and workforce systems need to ensure
every high school student is on track to pursue the education necessary for careers of the future. There is
a need to redesign the transition between high school and college in order to improve student outcomes.
The transition from high school to college can be more difficult for some students than others. States
continue to report high numbers of students requiring remediation; Minnesota is not exempt from this
trend. Examining Minnesota public high school graduates from the Classes of 2006-2012 who enrolled
in postsecondary education and those enrolled in developmental education, this report provides insight
into the academic readiness of Minnesota public high school graduates.
Getting Prepared Data
Getting Prepared fulfills the legislative mandate regarding developmental education data (Minnesota
Statute 13.32, subdivisions 3 and 6). It provides summary information about Minnesota public high
school graduates who enrolled in developmental courses within two years of their high school
graduation at Minnesota postsecondary institutions.
Previous reports were limited to information about public high school graduates enrolled in
developmental courses only at public institutions - Minnesota State Colleges and Universities (MnSCU)
or the University of Minnesota. Getting Prepared 2014, includes new data on enrollments at Minnesota
private colleges and out-of-state college enrollments and additional student demographic and high
school academic performance data. Linking individual student level data on Minnesota public high
school graduates from 2005 to 2012 with fall term Minnesota Office of Higher Education college
enrollment data and full year enrollment data from the National Student Clearinghouse enabled the
ability to provide additional data.
Data for the 2014 report was provided by the Minnesota Statewide Longitudinal Education Data System
(SLEDS), managed jointly by the Office of Higher Education (OHE), Minnesota Departments of
Education (MDE) and Employment and Economic Development (DEED). SLEDS links student data
from pre-kindergarten through completion of postsecondary and into the workforce to enable educators
and policymakers to gauge the effectiveness of programs and design targeted improvement strategies.
Getting Prepared 2014 tracked graduates enrolled in both Minnesota public and private
postsecondary institutions; this means the overall percent of Minnesota public high school
graduates requiring developmental education in college is most accurately reported as 28 percent
for the class of 2011 and 24 percent for the class of 2012 (using preliminary data).1
1 Getting Prepared 2010 estimated that 40 percent of 2008 Minnesota public high school graduates enrolled in developmental education
when graduates enrolled only in Minnesota public postsecondary institutions were analyzed. Using SLEDS data, Getting Prepared 2014
found 37 percent of 2008 Minnesota public high school graduates enrolled in developmental education courses in public postsecondary
institutions. This figure declined to 35 percent for 2011 Minnesota public high school graduates in public postsecondary institutions.
SLEDS currently is limited to fall term developmental education data, so it would be expected that SLEDS generated developmental
education rates could be one to two percentage points higher when spring and summer data are included in future reports.
4

Defining Developmental Education
In this report, “developmental education” is a term used to refer to programs offered by postsecondary
institutions to prepare students for success in college-level work. “Developmental education,” the term
used in Minnesota Statutes 13.32, can imply courses which repeat material taught earlier that the student
did not learn adequately the first time. For many educators, “developmental education” is a broader term
that encompasses pre-college-level education and other academic support services that the student may
benefit from for any reason.
It should be noted that while postsecondary institutions typically assess the academic readiness of high
school graduates for college level academic coursework, students can enroll in a variety of technical
programs requiring less than college-level skills in reading, writing and/or math. Many students are able
to graduate with postsecondary occupational certificates or diplomas and obtain a living wage job
without being assessed college ready.
One clear consensus is that developmental education is costly both in terms of programmatic
expenditures and opportunity costs for students who must spend additional time finishing developmental
education requirements before starting degree-specific courses. Minnesota secondary and postsecondary
education is currently working to address alignment issues to better prepare our future workforce.
Findings: What the Data Tells Us
Unless otherwise indicated the term “college” is used to reference any type of postsecondary institution,
including both academic and vocational training.
Overall, Minnesota does well in moving students from public high school to college. However, gaps in
enrollment exist for key groups of students, including students of color and lower income students.
Getting Prepared 2014 provides policymakers a more accurate measure of college readiness. The data
clearly indicate that almost all graduates enrolling in developmental education are served by Minnesota
State Colleges and Universities (MnSCU). In fact, among enrollees at public two-year community and
technical colleges, the percent of recent graduates needing developmental education increased; though,
overall developmental education rates for the state are stable. This is, in part, due to a decrease in the
percent of recent graduates at four-year colleges enrolling in developmental education. Disparities in
enrollment in developmental education exist for key groups of students, again students of color, non-
native speakers and lower income students.
College Enrollment
Most public high school graduates enrolled in college within two years after graduation. (Page 19)
77 percent of public high school graduates in 2011 enrolled in college within two years of
graduation.
2011 graduates of color enrolled in college within the first two years at lower rates than their White peers. (Page 28)
79 percent for White graduates
78 percent for Asian graduates
72 percent for Black or African American graduates
58 percent for Hispanic or Latino graduates
58 percent for American Indian graduates
5

Graduates who spoke English at home or who were English proficient had higher rates of college enrollment within two years of graduating than other primary language groups. (Page 30)
78 percent of graduates speaking English at home enrolled in college 77 percent of graduates speaking Somali at home enrolled in college 76 percent of graduates speaking Hmong at home enrolled in college 61 percent of graduates considered limited English proficient enrolled in college 55 percent of graduates speaking Spanish at home enrolled in college
2011 graduates enrolled in free lunch enrolled in college within two years of graduating in smaller percentages than graduates who had enrolled in reduced lunch or not at all. (Page 33)
81 percent of graduates not enrolled in free or reduced price lunch 72 percent of graduates enrolled in reduced price lunch 63 percent of graduates enrolled in free lunch
2011 graduates from non-traditional schools enrolled in college at lower rates than graduates of traditional public high schools. (Page 35)
79 percent of graduates from traditional public high schools 52 percent of graduates from charter schools 40 percent of graduates from distance learning programs 31 percent of graduates from alternative schools
Developmental Education
28 percent of 2011 public high school graduates enrolled in one or more developmental courses within two years of graduating high school. (Page 21)
Across all Minnesota colleges and universities, the percent of recent high school graduates who enrolled
in developmental education has remained relatively stable at 28 to 30 percent between 2006 and 2011.
State rates mask differences in developmental education course-taking within college sectors. (Page 23)
Among graduates enrolled in developmental education:
85 percent enrolled at Minnesota public two-year colleges 12 percent enrolled at Minnesota State Universities 2 percent enrolled at private colleges in Minnesota 1 percent enrolled at the University of Minnesota 1 percent enrolled at not-for-profit colleges in Minnesota
Public two-year colleges show a steady increase in the percent of high school graduates participating in developmental education courses within two years after high school graduation from 49 percent in 2006 to 55 percent in 2011. (Page 23)
Minnesota public two-year colleges have open admission policies and admit all students with a high
school diploma in order to serve a larger population. This open admissions policy results in two-year
colleges attracting students with a broad range of preparedness.
6

Public four-year colleges show a steady decrease in the percent of recent graduates participating in developmental education courses. (Page23)
State universities show a decrease in the number of students enrolled in developmental education
between 2006 (26%) and 2011 (20%).
The University of Minnesota shows a decrease in its developmental education enrollment from 7
percent in 2006 to 2 percent in 2011.
Students in developmental education persisted at rates comparable to other students. (Page 24)
For the class of 2011, developmental education enrollees persisted in college at rates 2 to 4
percentage points higher than peers for every sector of postsecondary institution except at private
not-for-profit institutions.
Race/Ethnicity
2011 graduates of color enrolled in developmental education at higher rates than white students. (Page 29)
55 percent for Black or African American graduates 45 percent for Hispanic or Latino graduates 39 percent for Asian graduates 38 percent for American Indian/Alaskan Native graduates 24 percent for White graduates
Language
Graduates whose primary home language was not English or who were identified as having limited English proficiency enrolled in developmental education at rates higher than English speakers. (Page 31)
69 percent of graduates speaking Somali at home 26 percent of graduates speaking English at home 50 percent of graduates speaking Hmong at home 50 percent of graduates speaking Spanish at home
Economic Status
2011 graduates enrolled in free price lunch had the highest rates of developmental education across Minnesota institutions (47%). The gap in developmental education enrollment between free lunch students and all other students was approximately 20 percentage points and appears to be increasing. (Page 34)
47 percent of graduates enrolled in free lunch 37 percent of graduates enrolled in reduced price lunch 24 percent of graduates enrolled in regular lunch
7

Testing
Public high school graduates meeting the standards on statewide accountability tests have higher college enrollment rates and lower developmental education rates as compared to students not meeting the standards. (Page 38)
Math
90 percent of students meeting math standards enrolled in college and only 9 percent enrolled in
developmental education within 2 years
68 percent of students not meeting math standards enrolled in college and 47 percent enrolled in
developmental education within 2 years Reading
82 percent of students meeting reading standards enrolled in college and 21 percent enrolled in
developmental education within 2 years
56 percent of students not meeting reading standards enrolled in college and 62 percent enrolled
in developmental education within 2 years
The average ACT scores of students enrolled in developmental education are lower than the scores of the entering class as a whole. (Page 39)
In developmental education, ACT composite scores ranged from 17.3 at private for-profit
colleges to 19.9 at the University of Minnesota.
Compared to ACT composite scores for all students ranging from 19.7 at private for-profit
colleges to 25.5 at the University of Minnesota.
Data by individual public high school can be found in Appendix A (college enrollment) and
Appendix B (developmental course-taking).
8

Introduction
Minnesota is a state highly regarded for the academic achievement of both our K-12 and college
students. Nationally, Minnesota ranks high in high school graduation rates and college attainment, but
there are significant disparities among students of color and low income students. This means our state’s
fast-growing populations – people from communities of color and families of modest financial means –
are the least prepared for jobs requiring college education or training.
By 2020, it is projected that 74 percent of all the jobs in Minnesota will require some college education
or other type of post-high school training; and half of those positions will require a bachelor’s degree or
beyond (Carnevale, 2013). In 2012, only 48 percent of Minnesota’s 18 to 64 year old eligible workforce
population had an associate degree or higher (U.S. Census Bureau, 2012, American Community Survey
5-Year Estimates).
For Minnesota to remain globally competitive, our education and workforce training systems need to
ensure every high school student is on track to pursue the education necessary for the careers of the
future. Our state agencies must collaborate and partner in ways to leverage resources and the capacity to
meet the needs of students, parents, businesses and communities across the state. Redesigning the
transition between high school and college will help improve student outcomes.
Participation in developmental education is one measure of the academic readiness of high school
graduates for college level coursework. The prevalence of developmental education, what form it should
take, high school versus college responsibilities and financing issues need the attention of Minnesota
policymakers.
One clear consensus is that developmental education is costly both in terms of programmatic
expenditures and opportunity costs for students who spend time finishing developmental education
requirements before starting degree-specific courses. The following are questions for state policymakers
to consider regarding developmental education:
How is “college readiness” defined at the high school and college levels?
Can we prevent or minimize the need for college developmental education while students are
still in high school?
How do we evaluate developmental education in terms of student success?
Getting Prepared fulfills the legislative mandate regarding developmental education data (Minnesota
Statute 13.32, subdivisions 3 and 6). It provides summary information about Minnesota public high
school graduates who enrolled in developmental courses within two years of their high school
graduation at Minnesota postsecondary institutions.
Getting Prepared Data
Data for this report was, for the first time, provided by the Minnesota Statewide Longitudinal Education
Data system (SLEDS), managed jointly by the Minnesota Office of Higher Education (OHE), Minnesota
Departments of Education (MDE) and Employment and Economic Development (DEED). SLEDS links
student data from pre-kindergarten through completion of college and into the workforce to enable
educators and policymakers to gauge the effectiveness of programs and design targeted improvement
strategies.
9

Previous reports were limited to information about public high school graduates enrolled in
developmental courses only at public institutions - Minnesota State Colleges and Universities (MnSCU)
or the University of Minnesota. Getting Prepared 2014, includes new data on enrollments at Minnesota
private colleges and out-of-state college enrollments and additional student demographic and high
school academic performance data. Linking individual student level data on Minnesota public high
school graduates from 2005 to 2012 with fall term Minnesota Office of Higher Education college
enrollment data and full year enrollment data from the National Student Clearinghouse enabled the
ability to provide additional data.
High school enrollment and graduate data included 474,000 public high school graduates records
from 2005 to 2012. Graduates are defined as a student with a status end code of “8” or “9” in the
specified year. The data used for Getting Prepared analyzed college enrollment data for high school
students based on the student’s “Status End” code at a given point in time and is not comparable
to graduation rate cohort data commonly used by the Minnesota Department of Education
(MDE). For example, students graduating from high school in 2011 may be members of different MDE
graduation rate cohorts (2009, 2010 or 2011) depending on whether they took 4, 5 or 6 years to
graduate.
College enrollment data included 966,000 fall term records from the Minnesota Office of Higher
Education and 2.1 million enrollment records from the National Student Clearinghouse for all available
years. College students are classified based on their first college of enrollment. Analysis was focused on
the first two years after high school graduation. Due to data issues, analysis for the class of 2005 was
incomplete and therefore excluded from the report. Unless otherwise indicated college enrollment data
refers to enrollment in both public and private colleges.
Due to a change in source data for the report, analysis did not include data on developmental education
credits taken by students during spring or summer terms or the subject of developmental education
courses taken such as in math or reading. We plan to include these elements in future reports.
Due to space limitations only selected years are shown in the graphs, please refer to the tables for
information on all graduating classes. Further details about the data and metrics provided as part of
Getting Prepared 2014 are included in each section.
Caution: Data changes
Getting Prepared 2014 includes data from a new source – SLEDS, so you will notice some difference in
reporting. Prior Getting Prepared reports relied on data from MnSCU and the University of Minnesota.
This data was limited to public high school graduates enrolling in Minnesota public colleges and
universities. In addition to previous reporting SLEDS data allows us to report on public high school
graduates enrolling in public and private colleges in Minnesota and out of state.
The addition of SLEDS data also affects the counts of students reported. Readers and data users should
be aware that the counts of students displayed in Getting Prepared 2014 will not exactly match the
counts of students displayed in prior Getting Prepared reports. In order to facilitate comparison across
years, enrollment and developmental education data by year (2006 to 2012) is included in all tables.
Why don’t student counts match? Getting Prepared 2014 connects data across the K-12 and college
systems for purposes of this report. This requires us to be very rigid as to when we can identify a student
in K-12 as the same student later enrolled in college. The differences in student counts represent a small
percentage of overall students. The counts differ for the following reasons:
10

1. Differences in Enrollment Data Reported: The student’s high school graduation data differed
between the data reported by the college and the data reported by the high school. For example,
one student was reported as graduated from a public high school by the college but MDE
reported the student had transferred to a non-public school and did not graduate from a public
high school. These mismatches accounted for 1.8% of graduates analyzed.
2. Differences in Personal Information Reported: The student’s personal information differed
between the data reported by the college and the data reported by the high school. This includes
differences in first name, last name, date of birth or MARSS number. If personal information
does not match, SLEDS will not link the K-12 data with college data. This affected 2.5% of
graduates analyzed.
3. No Data Found: The roster comparisons also identified a group of students whose information
could not be located in either the K-12 data (if college data reported) or the higher education data
(if K-12 data reported). One reason for the missing data is that developmental education data is
currently limited to fall term in SLEDS, as noted on page 10. As data collection is expanded, the
percent of students affected should decline. This affected approximately 1.5% of graduates
analyzed.
4. Graduates Enrolling Elsewhere: The report now includes data on enrollment in Minnesota
private colleges and universities and non-Minnesota colleges. One consequence of expanded data
and reporting is that graduates may be enrolled in more than one college. For example, a student
may enroll at Minneapolis Community and Technical College and at Augsburg College. The
prior Getting Prepared report would have classified that student as enrolled at a MnSCU public
two-year college. The new Getting Prepared report classified that same student as enrolled at a
Minnesota private college. The new report classifies students based on their first institution of
enrollment. This means that a group of students have shifted from the MnSCU count to other
institutions. This affected approximately 1% students per year.
How did we figure this out? In the initial draft of the report, staff noted that fewer students were
reported as enrolled in college and in developmental courses in the 2014 report as compared to the 2010
report. In response, OHE, MnSCU and MN.IT staff manually compared student-level rosters for a
sample of high schools to identify graduates that MnSCU had previously reported as enrolled, both in
college and in developmental education, who were not being reported with SLEDS data. That analysis
led to a change in the procedure used to link MDE and OHE data. While the final data still yields
different student counts as compared to prior reports, the overall data utilized for the report is more
complete and consistent.
11

Background on Developmental Education
The transition from high school to a college can be more difficult for some students than others. While
some students begin college-level coursework immediately upon enrollment at a college, others need
additional preparatory or developmental coursework and/or support services prior to beginning college
level courses. Enrollment in preparatory or developmental coursework can delay accruing credits for a
degree program. Student preparation, their previous education and the criteria of the college granting
admission affect whether a student begins immediately earning credits toward their degree program or
whether preparatory coursework must be completed first.
States continue to report high numbers of students requiring developmental education (Complete
College America, 2014); Minnesota is not exempt from this trend. Through an examination of recent
Minnesota public high school graduates enrolled in developmental and/or remedial education, this report
provides insight into the academic readiness of Minnesota public high school graduates.
Defining Developmental Education
In this report, “developmental education” is a term used to refer to programs offered by postsecondary
institutions to prepare students for success in college-level work. “Developmental education,” the term
used in Minnesota Statutes 13.32, can imply courses which repeat material taught earlier that the student
did not learn adequately the first time. For many educators, “developmental education” is a broader term
that encompasses pre-college-level education and other academic support services that the student may
benefit from for any reason.
Developmental coursework encompasses the subject areas of mathematics, reading, writing, English as a
Second Language and general study skills. College level math generally requires skills in intermediate
algebra. College level English requires the ability to make clear arguments. College level reading
involves the ability to read and interpret text, identify main points, tone, purpose and inferences to
discuss the author’s argument (Conley, 2007).
In addition to course work, other academic support services may be provided to help students and can
include summer bridge programs, peer tutoring programs, cohort-based learning communities, or more
personalized advising. Colleges typically assess the academic readiness of high school graduates for
college level coursework. However, many postsecondary technical programs may require less than
college level skills in reading, writing and/or math. Many students graduate with an occupational
certificate or diploma and obtain a living wage job without being assessed college ready.
The provision of developmental education allows a college to accept promising students who may lack
necessary preparatory coursework. Besides helping students to improve their skills in specific areas,
developmental education serves the broader function of helping to expand access to college.
Students enroll in developmental courses for a variety of reasons:
Their high school coursework did not include the necessary classes required for the academic
program they want to pursue in college.
They completed the required coursework in high school but were not able to demonstrate the
necessary skills on placement exams offered by the college or university.
12

Their first language is not English and they find it necessary to bolster their reading and writing
skills through developmental English courses, before being considered college-ready.
They have delayed college enrollment and may now need to take developmental courses to
refresh or update their skills.
College Mission and Developmental Education Programs
All public colleges and universities in Minnesota enroll students who need developmental instruction.
However, a college’s mission is closely intertwined with the delivery and options available for
developmental education. The type and availability of offerings of developmental education often reflect
student demographics and selectivity.
Nationally, 80 percent of public colleges offer developmental courses and 98 percent of community
colleges offer developmental courses (Bettinger & Long, 2006).
The types of developmental course offerings vary across college types.
Minnesota public two-year colleges have open admission policies and admit all students with a
high school diploma in order to serve a larger population. Open admission attracts students with
a broad range of preparedness, including students in need of developmental reading, writing and
mathematics courses. Minnesota public two-year colleges offer an extensive array of
developmental courses and academic support services to meet the needs of a broader base of
students.
Four-year colleges, both public and private not-for-profit, generally have higher admission
standards and expect prospective applicants to be prepared for college-level work. This
expectation results in fewer developmental course offerings than Minnesota public two-year
colleges.
While many four-year colleges offer only one level of developmental education, Minnesota
public two-year colleges may offer three levels for math, reading and English. Thus, students
may test into the lowest level in math and English, resulting in six additional courses needed
prior to arriving at a degree program (Bailey, Jeong, & Cho, 2010).
All Minnesota public colleges offer at least one developmental mathematic, reading or writing
course. Minnesota State Colleges and Universities offer developmental courses in all subjects:
math, reading, writing, English as a Second Language and study skills. The colleges offer three
levels of developmental math courses ranging from pre-algebra to intermediate algebra.
University of Minnesota campuses offer only one level of developmental education in a math
course. One campus offers a course on study skills.
Changing Course Structures – Bridge Programs
Colleges continue to restructure the way they deliver developmental education. Bridge programs help
address academic under-preparedness and transition to college and may be offered by colleges,
universities, state and local or privately sponsored groups. Bridge programs orient students to campus
and college culture, help address academic deficiencies, build academic skills and develop a sense of
academic self-efficacy among participants (Walpole et al., 2008). Many bridge programs offer a
combination of components that address the three dimensions of integration identified by Pascarella and
Terenzini (1980) including college integration (knowledge and use of university services), academic
13

integration (study skills and habits) and social integration (extent to which students interact with persons
associated with the university).
Bridge programs are typically offered in the summer before fall classes start, or are condensed and
offered during an academic year. For example, Rasmussen College began piloting a 2012 program
called Math Prep to help students improve their mathematic skills before the start of the term. This
program is offered free of charge to students whose placement exam scores were just below the
minimum score needed to be exempt from developmental courses.
Changes in how developmental education is structured do make it harder to track enrollment in
developmental education over time. Bridge programs are typically not credit bearing courses and would
not be counted in Minnesota’s current measures of developmental education.
Identifying Students Who Need Developmental Education
How to identify students needing developmental education has been a topic of review. Some researchers
have found that relying too heavily on a placement test score alone can be problematic and support a
shift to a holistic review of student tests and high school transcripts. Research from Belfield and Crosta
(2012) highlighted severe error rates for placement tests, resulting in almost a third of students
incorrectly assigned to developmental education. The report confirms a weak correlation between
placement test scores and college grade point average (GPA), but a high correlation between high school
GPA and college GPA (Belfield & Crosta, 2012).
Another study among a subset of MnSCU two-year colleges found that “sole reliance on
ACCUPLACER [a set of computerized tests from The College Board] scores for developmental course
placements may result in placing too many students below their ability level” (Asmussen, 2013). Hence,
MnSCU has developed a new practice of using multiple measures for placing students into
developmental education including analyzing high school transcript information, ACT subject area
scores and ACCUPLACER results described below.
Methods Used by Minnesota Colleges
Minnesota colleges review placement test scores, college readiness exams and high school transcripts to
determine whether a student needs developmental education.
University of Minnesota campuses require students to take placement exams in mathematics,
regardless of ACT, AP or IB test scores. Additionally, colleges within the University of
Minnesota may require placement exams in chemistry or second language proficiency before
initial registration. The placement score, transcript and other measures are used to advise
students on their initial mathematics course placement. Students are not required to take
developmental courses.
Minnesota public two-year colleges assess students for course placement with ACCUPLACER.
Since fall semester 2008, cut scores in math, English and reading on the ACCUPLACER have
been used to determine which students are ready for college level courses and which need
developmental education. Cut scores for levels of developmental education vary among colleges.
Students who have taken the ACT or SAT may submit those subject scores to determine
placement. Prior to 2006, some colleges used a paper-and-pencil version of the College Board
tests, known as the Descriptive Tests of Language Skills (DTLS) and Descriptive Tests of
Mathematics Skills (DTMS). Others used ACT Compass to determine placement.
14

Minnesota State Universities use ACT test scores and ACCUPLACER scores for course
placement.
Among Minnesota private colleges, developmental education policies vary by college. For
example, some colleges use standardized test scores, such as ACT, ACT Compass or SAT, and
an assessment of students’ prior course work to determine whether developmental mathematics
and writing courses are needed. Other colleges determine the need for placement exams based
solely on the ACT math score and the math course the student intends to take in preparation for a
specified major or program.
15

Student Perspectives of Developmental Education
Although many high school students are encouraged to participate in a college preparatory curriculum,
not all students realize the importance of doing so. Students may also not see the link between
developmental courses and their desired career path. Students in developmental education who lack a
career plan are at higher risk of not completing their college program (Bailey, Jeong, & Cho, 2008).
Providing information to students about career paths and the necessary academic requirements for
achieving their career and educational goals is necessary both before and during college (Bailey et al.,
2008; Completion by Design, 2012).
To bring some student context to concerns in developmental education the Office of Higher Education
conducted interviews with 15 students regarding their experience with developmental education. All
respondents attended MnSCU colleges between 2009 and 2013. This qualitative data is meant to
highlight students’ views about developmental education and are not intended to be statistically reliable.
Data are included from other research sources showing trends in student views on developmental
education. The research and subsequent interviews revealed four themes:
1. Lack of information about the importance of placement exams/assessments for developmental
education.
2. Lack of consistency in determining developmental needs.
3. Increased college costs for students.
4. Increased time to degree or program completion.
Importance of Placement Exams / Assessments
Student responses from interviews mirrored research findings about the importance of placement
exams:
I didn't get much if any advising about it and certainly not that pre-calc wouldn't be college level in high
school when I could have taken it but chose not to out of laziness.
I had no idea what the test was about other than it being an academic placement test.
I reviewed the available information about the ACCUPLACER and reviewed math for it the second time I
took it (the first time I took it to get a feel for the exam).
I also feel like most students get no advising that testing into remedial classes means another year or
more until they can get a degree because of the sequencing.
If I would have known my score would have saved me $1,000+ dollars I would have studied. Would have
been nice to know what to study.
The Office of Higher Education and Completion by Design (2012) found students wanted information
about the importance of college placement tests/assessments earlier, specifically during high school.
High school counselors may view the college placement exam, along with advising students on the
implications of the exam, as the responsibility of the college (J. Shady, personal communication, March
26, 2014).
Some students indicated they might have studied more or tried harder on the placement exam had they
known the financial and time consequences of having to be placed in developmental education once
enrolled in college (Completion by Design, 2012). Small numbers of students utilize a practice test for
16

the placement exam. Among students interviewed by the Office of Higher Education, only 13 percent of
respondents took a practice exam or studied for the ACCUPLACER.
After taking the placement exam, students indicated a desire for additional resources and staff assistance
to help them with their transition to college. Students wanted more information from colleges about the
need for additional courses, financial and time implications for their degree plans, and assistance with
the psychological impacts of realizing they are not considered college ready. Finding the appropriate
staff to help students; however, was identified as a problem (Completion by Design, 2012).
Lack of Consistency in Determining Developmental Education Needs
Student responses from interviews confirmed research finding a lack of consistency in determining
developmental education needs:
I was pretty frustrated that the score needed to take various classes wasn't the same at each institution (I
needed calculus and didn't place into it at one community college but at another, the same score was
enough), and that the remedial courses don't match across community colleges in particular. I attended
four different state colleges (three community colleges and [a state university]) in three years finishing
my prerequisites . . . It would be really helpful if the remedial courses matched so if you'd taken one
somewhere it would count and you wouldn't need another remedial course at another college.
I needed to take a summer course rather than during the semester because my ACCUPLACER scores
weren't high enough to qualify for calculus [at one college] but they were at [another].
The lack of consensus and coordination across colleges regarding the necessity of developmental
education is frustrating and confusing to students since placement exam scores and transcripts are
interpreted differently at different colleges. In Minnesota, each college sets its own policies for placing
students into developmental education. Students deemed college ready at one college may be placed into
developmental courses at another college. Students may; therefore, receive mixed messages across
colleges about their college readiness and how important developmental education is to their educational
plans.
Asmussen (2013) highlighted the lack of consistency across four colleges studied. Students receiving a
math score of 30 to 33 on the ACCUPLACER exam who took fewer than three years of high school
math may be placed in any one of these three math courses depending on the college testing the student:
adult basic education (the lowest level), pre-algebra or introductory algebra. Similar results occurred
with reading and English placement scores. In 2013, the MnSCU Board of Trustees revised system
policy in order to establish consistent guidelines for placement into developmental education across its
colleges (MnSCU, 2013).
Increased College Costs
Student responses from interviews mirrored literature on student perspective:
It isn't free to take those remedial courses and that adds to the high cost of education in
Minnesota.
I was advised to take it, though it affected me financially just as any other courses will do.
My work was paying for my classes and since I didn't get actual "credit" for these classes they
didn't pay for it.
. . . the debt from not having finished the class will bite me when I repay my loans eventually.
It doesn't count for college credit and it's expensive.
17

Developmental courses may add requirements and time to complete a degree or other academic
credential which could add to the cost of completing their program. While developmental courses
qualify for financial aid in Minnesota the courses count toward the student’s lifetime eligibility for
financial aid. A student; therefore, could max out state financial aid prior to completing a degree
program. Financial burdens of developmental education for students are prevalent in the research
literature (Bailey et al., 2008; Completion by Design, 2012).
While the students interviewed acknowledged the financial impact of developmental education, they did
not indicate the added costs changed their decision to enroll in college; a response confirmed by national
studies (Completion by Design; 2012). However, Asmussen (2013) determined that students enrolled in
developmental math, reading and writing courses were more likely to leave college with debt and no
credential.
Added Time to Degree or Program Completion
A sample of student responses from the Office of Higher Education interviews mirrored literature on
student perspective:
It is not a huge deal, I am still in the right path towards my graduation, just short credits.
Put my completion off by one semester.
Yes. It put my completion back further.
Taking developmental courses extends requirements and likely the time needed to complete a degree.
The added time to degree may not be seen as an immediate obstacle to degree completion by students
but has been shown to negatively impact the likelihood of persistence and degree completion (Bailey,
Jeong, & Cho, 2008; Completion by Design, 2012). Adding developmental education requirements to a
student’s degree program can result in some students being “non-starters.” Non-starters are individuals
who leave college with zero credits completed. Asmussen (2013) found 10 percent of students at the
colleges studied were “non-starters.”
Bailey, Jeong & Cho (2008) reported that the sequencing of developmental education is a problem
because it potentially creates an opportunity for students to disengage. New models of developmental
education include accelerated programs and re-assessment of students at various points in time to ensure
students move quickly through the developmental education pathway (Asmussen, 2013; Bailey, Jeong,
& Cho, 2008; Completion by Design, 2012). These newer models fit student requests for shorter
programs and an opportunity to retest during a course to show they had mastered the material and could
move forward (Completion by Design, 2012).
Conclusion
National research and Office of Higher Education interviews highlight structural barriers to student
success (e.g. lack of practice tests, absence of information for students and families and uncertain
advising). These barriers challenge common thinking that the need for developmental education is solely
the result of students and their families lacking academic and cultural resources to succeed (Smit, 2012).
18

25%
11%
9%
9%2%
20%
24%
76% of 2012 public high school graduates
enrolled in college within 1 year of
graduation
Enrolled at Minnesota Of 2012* public high school Public Two-Year Colleges
graduates, 56 percent enrolled within Enrolled at Minneota one year at a Minnesota college and State Universities 20 percent enrolled outside of
Minnesota – a combined enrollment Enrolled at the University
rate of 76 percent. of Minnesota
Minnesota public two-year Enrolled at Minnesota
colleges 25% Private Not-for-profit
Four-year public colleges 20% Institutions
Enrolled at Minnesota Private For-profit
(11% State Universities; 9%
University of Minnesota) Institutions
Private colleges 11% (9% Enrolled Out-of-State
private not-for-profit colleges; 2% private for-profit colleges)
Did Not Enroll Colleges outside Minnesota
20%
Of 2011 Minnesota public high school graduates 77 percent enrolled in college within two years of
graduating as follows:
Minnesota public two-year colleges 26% Enrolled at Minnesota
Public Two-Year Colleges Four-year public colleges 20%
(11% State Universities; 9% 26%
11%
9% 9%
3%
19%
23%
77% of 2011 public high school graduates
enrolled in college within two years of
graduation
Enrolled at Minneota State Universities University of Minnesota)
Private colleges 13% (10% Enrolled at the University of Minnesota private not-for-profit colleges;
3% private for-profit colleges) Enrolled at Minnesota
Colleges outside Minnesota Private Not-for-profit Institutions Enrolled at Minnesota
20%
Private For-profit *Enrollment within two years of graduation for 2006-2011 graduates and within one year of Institutions graduation for 2012 graduates; data for 2012 Enrolled Out-of-State graduates is considered preliminary and should not be used in trend analysis.
Did Not Enroll
State-Level Findings Data by individual public high school can be found in Appendix A (college enrollment) and
Appendix B (developmental course-taking).
College Enrollment of Public High School Graduates
19

COLLEGE ENROLLMENT WITHIN TWO YEARS OF HIGH SCHOOL GRADUATION HAS INCREASED OVER TIME FOR MINNESOTA PUBLIC HIGH SCHOOL GRADUATES
100%
80%
60%
40%
20%
0%
Year of High School Graduation
Enrolled in Minnesota Enrolled Out of State
Pe
rce
nt
of
Pu
lic H
igh
Sch
oo
l Gra
du
ate
s
73% 76% 77% 79% 78% 77% 75%
2006 2007 2008 2009 2010 2011 2012* (Preliminary
data)
The two-year enrollment rate has increased from 73 percent in 2006 to 77 percent in 2011.
As recently reported by the Bureau of Labor Statistics, enrollment in college nationally, has declined
slightly since 2009. This trend also appears in the Minnesota data above. It is important to note that the
data may reflect a change in when high school graduates enroll in college as opposed to if they enroll in
college at all. Longitudinal data for Minnesota public high school graduates which tracks college
enrollment for eight years after high school indicates an increasing percentage of graduates are choosing
to enroll after age 20.
Additional college enrollment data can be found in Table 3 (page 45).
*Enrollment within two years of graduation for 2006-2011 graduates and within one year of graduation for 2012 graduates; data for 2012 graduates is considered preliminary and should not be used in trend analysis.
20

Graduates Enrolled in Developmental Courses within Two Years of Public High School Graduation By Sector Offering Developmental Education Credits
(includes students first enrolling outside MN then transferring to a MN college)
Total Minnesota
Minnesota Public Two-Year Colleges
Minnesota State Universities
Other Minnesota Colleges and Universities
(University of Minnesota and Private)
Year of High School Graduation
Number of
Students
Number of
Students
Percent of
Total
Number of
Students
Percent of
Total
Number of
Students
Percent of
Total
2006 9,068 7,108 78% 1,373 15% 587 6%
2007 10,270 8,004 78% 1,579 15% 687 7%
2008 10,629 8,488 80% 1,412 13% 729 7%
2009 9,989 8,124 81% 1,278 13% 587 6%
2010 10,118 8,454 84% 1,179 12% 485 5%
2011 9,480 8,034 85% 1,056 11% 390 4%
2012 (Preliminary data)
7,256 6,150 85% 846 12% 260 4%
Table 1: Number of Students Enrolling in Developmental Education by College
*Enrollment within two years of graduation for 2006-2011 graduates and within one year of graduation for 2012 graduates; data for 2012 graduates is considered preliminary and should not be used in trend analysis
Developmental Education Course-Taking of Public H igh School Graduates
The percent enrolled in one or more developmental courses is 28 percent for the class of 2011. The
percent would likely decrease further if developmental education course data for recent public high
school graduates enrolling out-of-state were included.
28%
72%
Developmental Education within Two Years
No Developmental Education
28% of 2011 public high school graduates
enrolled in college also enrolled in
developmental education
Getting Prepared 2010 estimated that 40
percent of 2008 Minnesota public high school
graduates enrolled in developmental education
when graduates enrolled only in Minnesota
public postsecondary institutions were
analyzed. Using SLEDS data, Getting
Prepared 2014 found 37 percent of 2008
Minnesota public high school graduates
enrolled in developmental education courses.
This figure declined to 35 percent for 2011
Minnesota public high school graduates.
Enrollment in developmental education varies by college type
Among graduates enrolled in developmental education:
85 percent enrolled at a Minnesota public two-year college 12 percent enrolled at Minnesota State Universities 2 percent enrolled at private colleges in Minnesota 1 percent enrolled at the University of Minnesota 1 percent enrolled at not-for-profit colleges in Minnesota
As shown in Table 1 be low, the MnSCU system, reflecting its mission of providing open access, served
the vast majority of graduates requiring developmental education (97%). This includes providing
developmental education courses for graduates enrolled at other colleges.
21

MOST PUBLIC HIGH SCHOOL GRADUATES ENROLLING IN DEVELOPMENTAL EDUCATION TAKE 1-6 CREDITS
Pe
rce
nt
of
Enro
llee
sin
De
velo
pm
en
tal E
du
cati
on
100%
80%
60%
40%
20%
0%
30% 30% 33% 34% 20% 22% 17% 13%
1-3 Credits 4-6 Credits 7-9 Credits More than 10 Credits
Number of Credits Taken in First Two Years of College
2010 2011
Table 4 provides additional information on developmental course-taking among all graduates (page 49).
Table 5 (page 53) and Table 6 (page 55) provide additional information on developmental education
enrollments by college type and sector
PERCENT OF PUBLIC HIGH SCHOOL GRADUATES ENROLLED IN DEVELOPMENTAL COURSES APPEARS STABLE (28%-30%) FROM 2006-2011
Pe
rce
nt
of
Fall
Term
En
rolle
es 100%
80%
60%
40%
20%
0%
28% 30% 30% 29% 29% 28% 24%
2006 2007 2008 2009 2010 2011 2012* (preliminary
data) Year of High School Graduation
*Enrollment within two years of graduation for 2006-2011 graduates and within one year of graduation for 2012 graduates; data for 2012 graduates is considered preliminary and should not be used in trend analysis.
Overall, 30 percent of public high school graduates enrolled in 1 to 3 credits of developmental
education. Thirteen percent enrolled in 10 or more cr edits.
Trends in Developmental Education Over Time
In Minnesota, the percent of public high school graduates enrolled in one or more developmental
credits during fall term has remained relatively stable at 28 to 30 percent between 2006 and
2011.
22
Pe
rce
nt
of
Re
cen
t G
rad
uat
es
Enro
llin
g in
De
velo
pm
en
tal E
du
cati
on
100%
80%
60%
40%
20%
0%
53% 55% 53% 57% 55%
49% 47%
16% 21% 21% 21%
15% 14% 13%
2006 2007 2008 2009 2010 2011 2012*
Year of High School Graduation (preliminary
data)
Public Two-Year Colleges Private For-Profit
PERCENT OF RECENT GRADUATES ENROLLED IN DEVELOPMENTAL EDUCATION INCREASING AT MINNESOTA PUBLIC TWO-YEAR COLLEGES
Pe
rce
nt
of
Re
cen
t G
rad
uat
es
Enro
llin
gin
De
velo
pm
en
tal E
du
cati
on
100%
80%
60%
40%
20%
0%
25% 26% 24% 21% 20% 18% 14% 5%
2% 3% 3% 3% 2% 2% 2%
2006 2007 2008 2009 2010 2011 2012*
Year of High School Graduation (preliminary
data)
State Universities University of Minnesota Private Not-for-Profit
PERCENT OF RECENT GRADUATES ENROLLED IN DEVELOPMENTAL EDUCATION DECREASING AT FOUR-YEAR COLLEGES
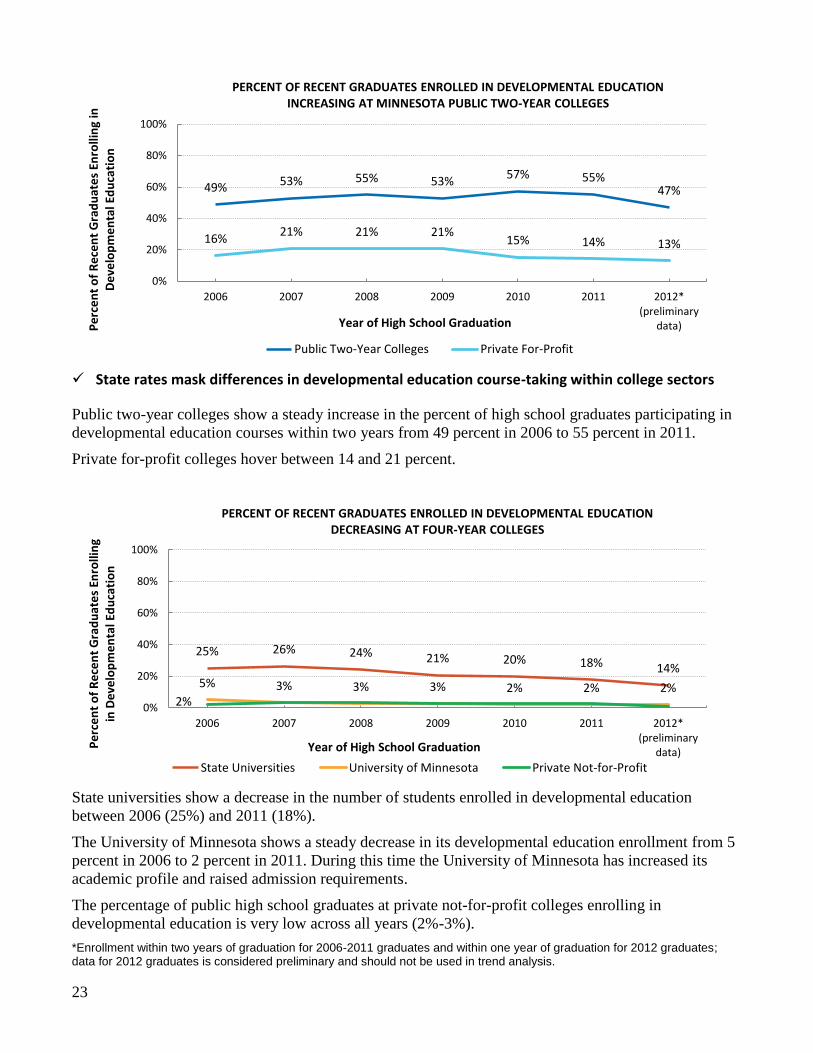
State rates mask differences in developmental education course-taking within college sectors
Public two-year colleges show a steady increase in the percent of high school graduates participating in
developmental education courses within two years from 49 percent in 2006 to 55 percent in 2011.
Private for-profit colleges hover between 14 and 21 percent.
State universities show a decrease in the number of students enrolled in developmental education
between 2006 (25%) and 2011 (18%).
The University of Minnesota shows a steady decrease in its developmental education enrollment from 5
percent in 2006 to 2 percent in 2011. During this time the University of Minnesota has increased its
academic profile and raised admission requirements.
The percentage of public high school graduates at private not-for-profit colleges enrolling in
developmental education is very low across all years (2%-3%).
*Enrollment within two years of graduation for 2006-2011 graduates and within one year of graduation for 2012 graduates; data for 2012 graduates is considered preliminary and should not be used in trend analysis.
23

College Outcomes
Across all classes of graduates, students in developmental education persisted in college
education at rates comparable to other students.
Enrollment in developmental education does not mean that a student cannot be successful in college.
This report examined persistence in college as one measure of student success.
For the class of 2011, developmental education enrollees persisted at rates two to four percentage points
higher than peers for every college sector except at private not-for-profit colleges.
Further work will be done tracking students beyond second year of college through to completion of a
degree or other college non-degree credential.
Table 22 provides additional information on developmental education enrollment and persistence (page
83).
DEVELOPMENTAL EDUCATION STUDENTS HAVE SIMILAR PERSISTENCE RATES COMPARED TO OTHER STUDENTS
24
89% 88%
96% 96% 95%91%
01,0002,0003,0004,0005,0006,0007,0008,0009,000
Colleges Sector of First Enrollment
n = number 2011 Graduates
Graduates not in Developmental Courses Graduates in Developmental Courses
64% 68% 57% 61%
n= n= n= n= n= n= n= n= n= n= 7,891 7,667 5,224 1,109 5,427 105 5,501 161 1,322 208 P
erc
en
t o
f G
rad
uat
es
Pe
rsis
tin
g to
Ye
ar T
wo
100%
80%
60%
40%
20%
0%
Minnesota Public Minnesota State University of Minnesota Private Minnesota Private Two-Year Colleges Universities Minnesota Not-For-Profit For-Profit Colleges

Female Male
Gender
Female public high school graduates enrolled in college at rates approximately nine percentage
points higher than males.
While equal numbers of males and females
graduate from public high school each year,
female graduates enrolled in college at rates
higher than male graduates – approximately
nine percentage points higher.
Additional college enrollment data by gender
can be found in Table 7 (page 56). 50% 50%
50% of public high school graduates analyzed for this report were
female
FEMALES ENROLL IN COLLEGE WITHIN TWO YEARS AT HIGHER RATES THAN MALES
Pe
rce
nt
of
Pu
blic
Hig
h S
cho
ol G
rad
uat
es 100%
80%
60%
40%
20%
0%
77% 81% 82% 82%
69% 74% 74% 73%
2006 2008 2010 2011 2006 2008 2010 2011
Female Male
Year of High School Graduation
Enrolled in Minnesota Enrolled Out-of-State
25

Pe
rce
nt
of
Fall
Term
En
rolle
es 100%
80%
60%
40%
20%
0%
2006 2008 2010 2011 2006 2008 2010 2011
29% 31% 29% 28% 26% 30% 29% 28%
Female Male Year of High School Graduation
AMONG ALL GRADUATES ENROLLING IN COLLEGE, FEMALES AND MALES ENROLL IN DEVELOPMENTAL EDUCATION AT SIMILAR RATES
Developmental Education Course-Taking by Gender
Across all colleges, female public high school graduates enrolled in developmental education at
rates comparable to males.
Among both male and female graduates, developmental education course-taking was relatively stable
between 2006 and 2011.
Gender differences in developmental education course-taking exist within college sectors
State averages mask differences by college sector.
Among 2011 graduates enrolled at Minnesota public two-year colleges, the percentage of female
graduates enrolled in developmental education within two years of graduation is higher (60%) than male
students (51%).
A similar trend is found among graduates enrolled at state universities (female graduates 20%, male
graduates 15%).
Among students enrolled at the University of Minnesota, private not-for-profit colleges and for-profit
colleges, the rate of enrollment in developmental education among 2011 public high school graduates is
similar as shown in the table below.
Minnesota trends do not reflect national trends. Nationally, male undergraduates attending public
colleges enrolled in developmental courses at rates higher (29%) than female students (22%) (NCES,
2013).
Additional data on developmental education by gender can be found in Table 8 (page 57).
26

Table 2 Developmental Education Course-taking by First College of Enrollment Class of 2011
Within Two Years of High School Graduation by First
College of Enrollment -- Fall term enrollees only
Graduates Enrolled in Developmental Courses in 1st or 2nd Fall Term
Students Total Students % of Fall Term
Enrollees
Male
Minnesota Public Two-Year Colleges
7,314 3,763 51%
Minnesota State Universities 2,765 422 15%
University of Minnesota 2,686 40 1%
Private Not-for-profit Colleges 2,172 54 2%
Private For-profit Colleges 466 73 16%
Total Minnesota 15,403 4,352 28%
Female
Minnesota Public Two-Year Colleges
6,534 3,904 60%
Minnesota State Universities 3,454 687 20%
University of Minnesota 2,824 65 2%
Private Not-for-profit Colleges 3,420 107 3%
Private For-profit Colleges 998 135 14%
Total Minnesota 17,230 4,898 28%
27

Race/Ethnicity
Students of color enrolled in college at lower rates than their White peers.
Approximately 17 percent of Minnesota public high school graduates are students of 2%
6% color. White and Asian public high school
graduates across all years enrolled in college
at rates higher than other racial/ethnic groups.
Approximately 20 percent of White public Asian high school graduates enrolled out of state; 10
percentage points higher than all other groups.
This trend is consistent across years. Hispanic/Latino
A significant gap in college enrollment
persists across racial/ethnic groups for
Minnesota public high school graduates,
especially for Hispanic or Latino and Black or African
American American Indian or Alaska Native graduates.
The enrollment gap is so large that the
difference between Asian and White graduates White
(79%) enrolling in college within the first two
years as compared to Hispanic or Latino and
American Indian graduates (58%) is 21
percentage points for the class of 2011. In comparison, 72 percent of Black or African American
graduates from the class of 2011 enrolled in college within two years.
Pe
rce
nt
of
Pu
blic
Hig
h S
cho
ol G
rad
uat
es
100%
80%
60%
40%
20%
0%
2006200820102011 2006200820102011 2006200820102011 2006200820102011 2006200820102011
American Indian or Asian Hispanic/Latino Black or African American White Alaska Native
72% 74% 78% 78% 70% 73% 72% 75%
79% 80% 79%
52% 57% 58% 55% 60% 58%
65%
50% 45%
Year of High School Graduation
Enrolled in Minnesota Enrolled Out-of-State
17% of high school
graduates analyzed for this report
were students of color
American Indian or
Alaska Native
3%
6%
83%
17% of public high school graduates analyzed
for this report were students of
color
COLLEGE ENROLLMENT HAS INCREASED OVER TIME BUT ENROLLMENT GAPS EXIST
Additional college enrollment data by race/ethnicity can be found in Table 9 (page 58).
28

Pe
rce
nt
of
Fall
Enro
llee
s
100%
80%
60%
40%
20%
0% 2006 2008 2010 2011 2006 2008 2010 2011 2006 2008 2010 2011 2006 2008 2010 2011 2006 2008 2010 2011
American Indian or Alaska Asian Hispanic/Latino Black or African American White Native
51% 53% 56% 55%
40% 41% 38%
49%
36% 39% 37% 39% 42% 47% 46% 45%
25% 28% 26% 24%
Year of High School Graduation
Year
1999-2000
Asian or Pacific Islander
34.9
Hispanic
37.8
Black, Not of Hispanic Origin
37.7
White, Not of Hispanic Origin
24.3
Other or two or more races
34.4
2003-2004 20.1 26.8 27.4 19.7 24.0
2007-2008 22.5 29.0 30.2 19.9 27.5
Developmental Education Course-Taking by Race/Ethnicity
Students of color enrolled at higher rates in developmental education than White students.
Black or African American 2011 graduates continue to have the highest percentage (55%) of fall
enrollees taking developmental education. Asian, American Indian or Alaskan Native and Hispanic or
Latino 2011 graduates enrolled in developmental courses at rates between 38 and 45 percent as
compared to 24 percent of White fall enrollees. This disparity in developmental education by
racial/ethnic minorities mirrors the national trends, especially for Black or African American public high
school graduates (NCES, 2013).
HIGH SCHOOL GRADUATES OF COLOR ENROLL IN DEVELOPMENTAL EDUCATION AT RATES HIGHER THAN WHITES
ACROSS THE U.S. UNDERGRADUATES OF COLOR AT PUBLIC COLLEGES REPORTED TAKING DEVELOPMENTAL COURSES AT HIGHER RATES THAN WHITE PEERS
Source: National Center for Education Statistics (2013)
The college a high school graduate attends determines the developmental courses available and the need
for placement into these courses. Among public high school graduates enrolled in fall term at Minnesota
public two-year colleges, over half of 2011 graduates from each race/ethnic group enrolled in
developmental education courses (56% Asian, 78% American Indian, 67% Hispanic, 81% Black and
50% White). At Minnesota state universities, the pattern of enrollment by race/ethnicity in
developmental education was similar though the rates were 30 to 50 percentage points lower compared
to Minnesota public two-year colleges. Additional data on developmental education by race/ethnicity
can be found in Table 10 (page 61).
29

Pe
rce
nt
of
Pu
blic
Hig
h S
cho
ol G
rad
uat
es 100%
80%
60%
40%
20%
0%
74% 78% 79% 78% 70% 72% 76% 76% 79% 77% 77% 77%
55% 55%
37% 47%
2006 2008 2010 2011 2006 2008 2010 2011 2006 2008 2010 2011 2006 2008 2010 2011
English Primarily Spoken at Hmong Primarily Spoken Spanish Primarily Spoken Somali Primarily Home at Home at Home Spoken at Home
Year of High School Graduation
Enrolled in Minnesota Enrolled Out-of-State
COLLEGE ENROLLMENT WITHIN TWO YEARS HAS INCREASED AMONG SPANISH SPEAKING GRADUATES BUT GAPS REMAIN
English Primarily Spoken at Home
Hmong Primarily Spoken at Home
Spanish Primarily Spoken at Home
Somali Primarily Spoken at Home
All Other Languages Primarily Spoken at Home
92%
2% 2% 1% 3%
8% of public high school graduates analyzed
for this report spoke a language other
than English at home
Language Spoken at Home
Across all graduating classes public high school students who spoke English at home or who were
English proficient had much higher rates of out-of-state college enrollment than other primary
language groups.
Approximately eight percent of Minnesota
public high school graduates spoke a
language other than English at home. The
languages most commonly spoken were
Hmong, Spanish and Somali.
Primary Language Spoken at Home
Minnesota public high school graduates who
spoke Somali at home enrolled (77%) in
college within two years at higher rates than
any other primary language group and at
rates comparable to English speakers.
Minnesota public high school graduates who
spoke Spanish at home enrolled (55%) in
college within two years at rates lower than
other primary language groups. Spanish
speaking graduates may encounter barriers to college enrollment based on residency issues. Passage of
the Minnesota Dream Act may result in an increase in college enrollment for these graduates. Analysis
of college enrollment rates over time shows Spanish speaking public high school graduates enrolled in
college within two years increased sharply from 2006 to 2011.
Additional data on college enrollments by home primary language can be found in Table 11 (page 63).
30

31
GRADUATES WHOSE PRIMARY HOME LANGUAGE IS NOT ENGLISH ENROLL IN DEVELOPMENTAL EDUCATION AT HIGHER RATES
100%
25% 26% 27% 26%28% 29% 28% 22%
69% 69% 69%65% 64% 62%
72%
55%
2005 2006 2007 2008 2009 2010 2011 2012* (preliminary
data)
English
80% Hmong
60%
Spanish
40%
Somali 20%
All Other 0%
Year of High School Graduation
Pe
rce
nt
of
Fall
Enro
llee
s Developmental Education Course-Taking by Language Spoken at Home
Graduates whose primary home language w as not English enrolled in developmental education
at rates higher than English speakers.
Reading and writing courses are primary components of developmental education and continue to be
utilized by students to improve their language skills; especially by students whose first language is not
English. It is not surprising to see a higher utilization of developmental education among students who
may have immigrated to this country.
Graduates who spoke Somali at home enrolled in college at higher rates than other non-native English
speakers; however, students who spoke Somali at home enrolled (69% for class of 2011) in
developmental education at percentages almost 20 percentage points higher than any other group.
Additional data on developmental education by home primary language can be found in Table 12 (p age
66).
*Enrollment within two years of graduation for 2006-2011 graduates and within one year of graduation for 2012 graduates; data for 2012 graduates is considered preliminary and should not be used in trend analysis.

Limited English Proficiency
The m ajority (78%) of 2011 graduates identified as limited English proficient enrolling in college
also enrolled in developmental education.
In addition to language spoken at home, another measure of language skills is limited English
proficiency status within K-12 education. Approximately three percent of Minnesota public hig h school
graduates were identified as limited English proficient.
Students considered limited English proficient lagged b ehind their peers in college enrollment. Students
considered limited English proficient enrolled almost exclusively in Minnesota colleges, few enrolled at
out-of-state colleges.
Additional data on college enrollment by limited English proficiency can be found in Table 13 (pa ge
68). Additional data on developmental education by limited English proficiency can be found in Table
14 (page 69)
0%
20%
40%
60%
80%
100%
LIMITED ENGLISH PROFICIENCY GRADUATES ENROLL IN COLLEGE WITHIN TWO YEARS AT LOWER RATES AND HAVE HIGHER DEVELOPMENTAL EDUCATION ENROLLMENTS
Pe
rce
nt
of
Pu
blic
Hig
h S
cho
ol G
rad
uat
es
100%100%
56% 54% 60% 61%
80%
60%
40%
20%
Pe
rce
nt
of
Fall
Enro
llee
s
80%
60%
40%
20%
74% 78%
64% 69%
0%
2006 2008 2010 2011 2006 2008 2010 2011
0%
Year of High School Graduation Year of High School Graduation
Enrolled in Developmental Education Enrolled in Minnesota Enrolled Out-of-State
Limited English Proficient
32
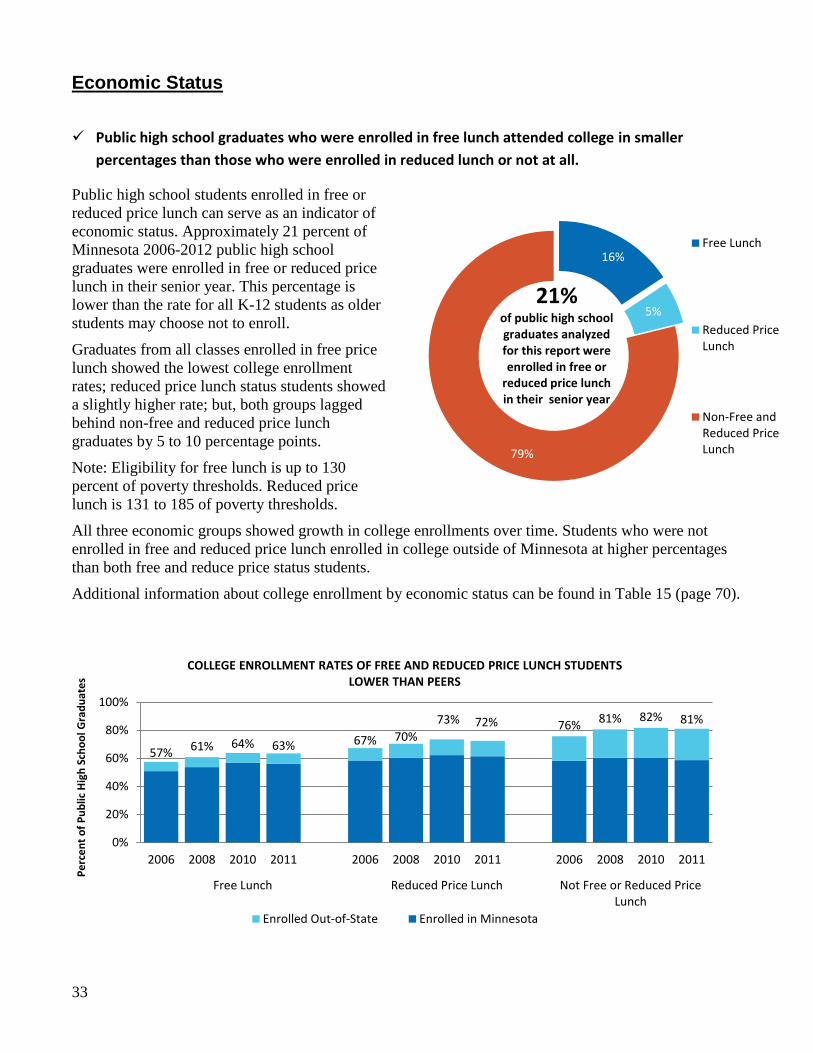
Year of High School Graduation
COLLEGE ENROLLMENT RATES OF FREE AND REDUCED PRICE LUNCH STUDENTS LOWER THAN PEERS
Pe
rce
nt
of
Pu
blic
Hig
h S
cho
ol G
rad
uat
es
100%
80%
60%
40%
20%
0%
2006 2008 2010 2011 2006 2008 2010 2011 2006 2008 2010 2011
Free Lunch Reduced Price Lunch Not Free or Reduced Price Lunch
Enrolled Out-of-State Enrolled in Minnesota
73% 81% 82% 81%72% 76%
57% 61% 63%64% 67% 70%
Economic Status
Public high school graduates who were enrolled in free l unch attended college in smaller
percentages than those who were enrolled in reduced lunch or not at all.
Public high school students enrolled in free or
reduced price lunch can serve as an indicator of
economic status. Approximately 21 percent of Free Lunch
Minnesota 2006-2012 public high school
graduates were enrolled in free or reduced price
lunch in their senior year. This percentage is
lower than the rate for all K-12 students as older of public high school students may choose not to enroll. Reduced Price
Lunch graduates analyzed
Graduates from all classes enrolled in free price
lunch show ed the lowest college enrollment
rates; reduced price lunch status students showed
a slightly higher rate; but, both groups lagged
79%
for this report were enrolled in free or
in their senior year reduced price lunch
Non-Free and behind non-free and reduced price lunch Reduced Price
graduates by 5 to 10 percentage points. Lunch
Note: Eligibility for free lunch is up to 130
percent of poverty thresholds. Reduced price
lunch is 131 to 185 of poverty thresholds.
All three economic groups showed growth in college enrollments over time. Students who were not
enrolled in free and reduced price lunch enrolled in college outside of Minnesota at higher percentages
than both free and reduce price status students.
Additional information about college enrollment by economic status can be found in Table 15 (page 70).
16%
21% 5%
33

Developmental Education Course-Taking by Economic Status
Public high school class of 2011 enrolled in free p rice lunch had the h ighest rates of
developmental education enrollment (47%).
The gap in developmental education enrollment between free lunch students and other students is
approximately 20 percentage points and appears to be increasing. Forty-seven percent of 2011 free lunch
graduates enrolled in fall term took developmental education courses as compared to 24 percent of other
graduates. Reduced price lunch enrolled graduates had higher developmental education enrollment rates
compared to other graduates but we re lower than free lunch graduates.
Pe
rce
nt
of
Fall
Enro
llee
s
100%
80%
60%
40%
20%
0%
41%
26%
46%
27%
47%
28%
46%
25%
48%
25%
47%
24%
40%
19%
2006 2007 2008 2009 2010 2011 2012* (preliminary
Year of High School Graduation data)
Free Lunch Enrolled Reduced Price Lunch Enrolled Not Free or Reduced Price Lunch
GRADUATES ENROLLED IN FREE OR REDUCED PRICE LUNCH ENROLL IN DEVELOPMENTAL EDUCATION AT HIGHER RATES
More research is needed to understand the link between income and college readiness in Minnesota. One
partial explanation for these trends is that students from higher socioeconomic backgrounds might take
more college preparatory classes and supplementary services that help them be more prepared for
college.
Additional information about developmental education enrollments by economic status can be found in
Table 16 (pa ge 72).
*Enrollment within two years of graduation for 2006-2011 graduates and within one year of graduation for 2012 graduates; data for 2012 graduates is considered preliminary and should not be used in trend analysis.
34

Pe
rce
nt
of
Fall
Enro
llee
s
100%
80%
60%
40%
20%
0%
2006 2008 2010 2011 2006 2008 2010 2011 2006 2008 2010 2011 2006 2008 2010 2011
Traditional High Schools Charter Schools Alternative Schools Distance Learning Programs
Year of High School Graduation
Enrolled Out-of-State Enrolled in Minnesota
77% 82% 83% 83%
57% 62% 59%
49%
33% 38% 37% 36%
45% 48% 51% 50%
GRADUATES FROM TRADITIONAL PUBLIC HIGH SCHOOLS ENROLL IN COLLEGE WITHIN TWO YEARS AT RATES HIGHER THAN PEERS
High School Type Attended
Non-traditional public high school graduates enrolled in college a t lower rates.
Class of 2011 graduates from
traditional public high schools showed
higher college enrollment rates (83%)
compared to charter school (59%),
alternative public high schools (36%)
and distance learning programs (50%).
One critical caveat to this finding is
that schools grouped together under
the headings of “traditional” or
“charter” serve a variety of educational
missions, offer different programs and
vary in size and geographic location.
One would expect there to be wide
variation in enrollment and
88%
2% 7%
2%
12% of public high school
graduates analyzed for this report attended
non-traditional schools
Traditional High School
Charter Schools
Alternative Schools
Distance Learning Programs
Other
developmental education course-taking
among individual high schools within these groups.
Additional data on college enrollment by public high school type can be found in Table 17 (page 73).
35

Pe
rce
nt
of
Fall
Enro
llee
s
100%
80%
60%
37% 43% 44% 46% 42% 45%
52% 50% 44%
35% 35% 41%
27% 27%30% 28% 40%
20%
0%
2006 2008 2010 2011 2006 2008 2010 2011 2006 2008 2010 2011 2006 2008 2010 2011
Traditional High Schools Charter Schools Alternative Schools Distance Learning Programs
Year of High School Graduation
GRADUATES FROM NON-TRADITIONAL PUBLIC HIGH SCHOOLS ENROLL IN DEVELOPMENTAL EDUCATION AT RATES HIGHER THAN PEERS
Graduates of non-traditional public high schools enrolled in developmental education at slightly
higher rates than traditional public high school graduates.
Developmental Education by High School Type Attended
Class of 2011 graduates of traditional schools showed lower developmental enrollment rates (27%) as
compared to charter school (46%), alternative high schools (50%) and distance learning programs
(35%).
Additional data on developmental education by public high school type can be found in Table 18 (p age
76).
36

Testing
By definition, college readiness means being able to succeed in credit-bearing college courses without
developmental education. Pre-high school graduation data can be used to identify students with a higher
likelihood of enrolling in college developmental education. Using available K-12 data, educators can
provide students with the extra supports needed to prepare them for college-level academic studies.
Historically public school students take a range of required and recommended assessments ranging
from: MCA, NWEA, EXPLORE, PLAN, ACT and SAT. State testing is limited to the MCA,
EXPLORE, PLAN and ACT. Meanwhile, Minnesota’s public colleges have typically relied on
ACCUPLACER, ACT or SAT tests to gauge a student’s readiness for college level curriculum. As a
result, the framework to align assessment is rooted in the belief that students meeting proficiency
guidelines for high school graduation are ready for college (MnSCU, 2014).
In May 2013, Minnesota adopted significant new legislative changes to strengthen the alignment
between high school and college and career readiness. Beginning in 2015, every Minnesota public
eighth grade and tenth grade student will be required to take a college readiness predictive exam aligned
to a nationally normed college entrance exam. Every public eleventh grade student will take a nationally
normed college entrance exam. Students in grade ten who do not reach the college readiness benchmarks
on the college readiness exam will be required to take the Minnesota public two-year colleges’ college
placement diagnostic exam. This will help identify foundational skill sets and additional support
students need to reach college readiness proficiency (MnSCU, 2014).
This better alignment of assessments measuring college and career readiness will enable earlier
identification of a student who is not on track for college level courses. If identified earlier, a student
who is not on track will receive instructional interventions and targeted support aligned to meet the
specific competencies of college developmental education while they are in a public high school, saving
time and money. Data for Minnesota public high school graduates from 2007 to 2012 allowed an initial
review of the current alignment of K-12 MCA math and reading tests, ACT tests and developmental
education course-taking as highlighted below.
37

0%
20%
40%
60%
80%
100%
YEARS AND LOWER DEVELOPMENTAL EDUCATION GRADUATES MEETING STANDARDS SHOW HIGHER RATES OF ENROLLMENT IN COLLEGE WITHIN TWO
Pe
rce
nt
of
Pu
blic
Hig
h S
cho
ol G
rad
uat
es
100% 90% 100%
80%
60%
40%
20%
0%
68%
82%
56%
Pe
rce
nt
of
Fall
Enro
llee
s
80%
60%
40%
20%
0%
62%
47%
21% 9%
Math Math Reading Reading Math Math Reading Reading
Proficient Not Proficient Not Proficient Not Proficient Not
Proficient Proficient Proficient Proficient
20112011 Enrolled in Minnesota Enrolled Out-of-State Enrolled in Developmental Education
High School Accountability Tests – Math & Reading
2011 public high school graduates who met the standards on statewide accountability tests had
higher college enrollment rates and lower developmental education rates compared to students
who did not meet standards.
Accountability tests given to Minnesota public high school students included the MCA-II, MOD-II,
MTAS and MTELL in both math and reading. There is a sizeable gap in both college enrollment and
developmental education needs among groups by reported proficiency.
Among graduates taking the state accountability test:
Math
90 percent of students meeting math standards enrolled in college and 9 percent enrolled in
developmental education within 2 years
68 percent of students not meeting math standards enrolled in college and 47 percent enrolled in
developmental education within 2 years
Reading
82 percent of students meeting reading standards enrolled in college and 21 percent enrolled in
developmental education within 2 years
56 percent of students not meeting reading standards enrolled in college and 62 percent enrolled
in developmental education within 2 years
Additional data on college enrollments and developmental education enrollments by achievement level
can be found in Table 19 (page 78) and Table 20 (page 80).
38

19.7 21.4 17.9
21.7 22.4 18.6 19.9
24.5
18.4 19.7 20.1 17.3
24.5
Minnesota Public Minnesota State University of Minnesota Private Minnesota Private Out-of-State wo-Year Colleges Universities Minnesota Not-For-Profit For-Profit Colleges Colleges
Colleges
DEVELOPMENTAL EDUCATION STUDENTS HAVE LOWER AVERAGE ACT COMPOSITE SCORES
AC
T C
om
po
site
Sco
re
40
30
20
10
0
25.5 25.6 24.6
T
Class of 2011 Enrolling in the First Year After Graduation
All Graduates Enrolled as Students Graduates Not in Developmental Courses Graduates in Developmental Courses
College Entrance Exams – ACT
For the class of 2011, the average ACT scores of students enrolled in developmental education
were lower than the scores of students not enrolled in developmental education.
ACT composite scores of students enrolled in developmental education ranged from 17.3 at private for-
profit colleges to 19.9 at the University of Minnesota. This compared to ACT scores for students not
enrolled in developmental courses ranging from 20.1 at private for-profit colleges to 25.6 at the
University of Minnesota.
Low ACT scores are one reason students can be placed into developmental education courses at the
University of Minnesota and Minnesota State Universities.
Additional data on ACT Composite scores can be found in Table 21 (page 82).
39

How does Minnesota Compare with Other States?
States measure developmental education in three ways.
1. Need: do students need developmental education to pursue the academic program or career they
desire?
2. Placement: are developmental education courses recommended based on test performance or
other skill assessment?
3. Enrollment: do students enroll in developmental education courses?
This section attempts to provide comparative developmental education data using state reports prepared
by the Education Commission of the States (2010) and additional state reports posted on state higher
education executive office web sites. Only states reporting data for graduating classes of 2009 or later
were included.
Alabama
Alabama Commission on Higher Education. (2013). High school report 2011-2012: Alabama public
high school graduates enrolled in Alabama public colleges and universities for fall 2012 and/or spring
2013. http://www.ache.alabama.gov/StudentDB/FA12_HSET_26Jul13.pdf
For the 2011-2012 academic year, there were 43,911 students who graduated from Alabama’s public
high schools, out of which 24,679 enrolled in public colleges and universities in Alabama in the
following fall and/or spring term. Over 9,000 college freshman at public colleges enrolled in
developmental courses. The subject area breakdown: 4,124 enrolled in developmental mathematics only;
1,488 in English only; and 3,421 in both mathematics and English courses.
Arkansas
Arkansas Department of Higher Education. (2011). Comprehensive Arkansas higher education annual
report: Remediation rates.
http://www.adhe.edu/SiteCollectionDocuments/Comprehensive%20Report/2011/1-RemediationRates-
ANNUAL.pdf
Arkansas identifies developmental education rates based on students required to enroll or assigned to
developmental education. Arkansas’s public colleges enrolled 22,479 first-time degree seeking students
in fall 2010 and 11,837 students (53 %) required enrollment in developmental courses. Forty-five
percent of students assigned to development courses were enrolled at four-year colleges. Thirty-five
percent of students required developmental education in one subject and 35 required developmental
education in three subjects.
California
California Community Colleges Chancellor’s Office – Data Mart Basic Skills Progress Checker
http://www.asd.calstate.edu/remediation/13/Rem_Sys_Final_Fall2013.htm
California reports developmental education rates based on students who test into developmental
education. For the fall 2013 cohort, California enrolled 60,592 students within the California State
system. Of those 17,636 students (29 percent) needed developmental education in math and 19,438
students (32 percent) required developmental education in English. Very few students enrolling in the
University of California system required developmental education. Over half of community college
students required developmental education and most were in more than one subject.
40

Colorado
Colorado Department of Higher Education. (2013). 2012 legislative report on remedial education.
http://highered.colorado.gov/Publications/Reports/Remedial/FY2012/2012_Remedial_relmay09.pdf
Colorado calculates a developmental education rate based on students who need developmental
education rather than the actual developmental education course-taking. Of Colorado’s Class of 2011,
24,659 students (47 percent) enrolled in the state’s public colleges or universities. Of those students,
7,853 (32 percent) were assessed as needing developmental education and another 2,009 students (8
percent) enrolled in developmental education courses but did not have an assessment score on file. This
resulted in a 40 percent developmental education rate for students enrolling in Colorado’s public
colleges.
Florida
Florida Department of Education. (2013). Performance on common placement tests among Florida
public high school graduates. http://www.fldoe.org/articulation/perfCPT/default.asp
Florida utilizes a developmental education rate based on the percent of students scoring at or above the
cutoff score in each subject. In 2012, 54,474 students enrolled in community colleges and 50 percent of
first-year students scored below the cut-off scores in all three subjects. Of 28,113 students enrolled in
state universities, three percent of first-year students tested below the cut-off score in all three subjects.
Maryland
Maryland Higher Education Commission. (2011). Student outcome and achievement report. College
performance of new Maryland high school graduates.
http://www.mhec.state.md.us/publications/research/AnnualReports/2010SOAR.pdf
Maryland’s developmental education data identifies students who followed a college preparatory
curriculum in high school and those who did not. The data analyzes developmental education based on
placement scores rather than on actual enrollment data. In the 2008-2009 academic year 29,105 students
enrolled in college. Of students who did not take a college preparatory curriculum 47 percent needed
developmental education in math compared to 35 percent who did take a college preparatory curriculum.
In addition, students who did not take a college preparatory curriculum had higher percentages needing
to take developmental education courses in reading and English. Like Minnesota, Maryland’s data show
there were fewer students enrolled in developmental education at four-year colleges than at community
colleges.
Montana
Montana University System. (2012). Montana university system high school follow-up report, 2012.
http://mus.edu/data/HS-Follow-up/MUS_HSFR_SUMMARY_report.pdf
There were 9,716 graduates from Montana public high school class of 2012 and 33 percent enrolled in
the Montana University System in the fall semester following graduation. Of these students, 29 percent
enrolled in at least one math or writing developmental course.
41

Nevada
Nevada System of Higher Education. (2012). Remedial & developmental report, summer and fall 2012
http://www.nevada.edu/ir/Documents/RemedialEnrollment/Remedial_Report_Fall_2012.pdf
Nevada reports data on high school graduates between September 2011 and August 2012 who enrolled
in developmental math or English courses in the summer or fall of 2012. The data show that 2,904
students (32 percent) enrolled in at least one developmental course. Among these development
education students, 21 percent needed an English course, 56 percent needed math and 22 percent needed
both English and math developmental courses.
New Mexico
Winograd, P., Florez, V., & Garcia, V. (2010). Ready for college 2010: An annual report on New
Mexico high school graduates who take remedial classes in New Mexico colleges and universities.
http://www.ped.state.nm.us/press/2010/Ready%20For%20College%202010.pdf
In the academic year 2008-2009, there were 9,713 public high school graduates who attended college in
New Mexico. Of these, 47 percent were enrolled in developmental education courses, with a higher
percentage of students needing numeracy and computation courses than literacy and communication
developmental courses.
North Carolina
The University of North Carolina General Administration. (2013). University of North Carolina
remedial/developmental activities report, 2011-2012.
http://www.northcarolina.edu/reports/index.php?page=download&id=1671&inline=1
This report contains information only on the University of North Carolina system. There was a 16
percent decrease in developmental education enrollment from 2010-2011 to 2011-2012. During the 10-
year period between 1992 and 2012, there was also a 54 percent decrease in institutional spending on
developmental education.
Ohio
Ohio Board of Regents. (2012). Fall 2011 public college enrollment and developmental course
enrollment rates.
https://www.ohiohighered.org/files/uploads/data/hs_transition/HS_remediation_rpt_fall2011.pdf
During fall 2011, there were 52,486 recent high school graduates who enrolled in Ohio public colleges
and universities; 74 percent enrolled in a state university and 26 percent enrolled in a community
college. Of these first-time college freshmen, 41 percent enrolled in at least one developmental course;
35 percent in math and 20 percent in English.
South Dakota
South Dakota Board of Regents. (2012). 2012 High school to college transition report.
http://www.sdbor.edu/theboard/agenda/2013/October/16.pdf
South Dakota tracks developmental education course-taking through student placement rates rather than
actual enrollment. In 2012, South Dakota’s high schools graduated 2,874 students and 32 percent
enrolled full-time at a public state university. Of those students, 27 percent required developmental
education courses in either English (13 percent) or math (23 percent).
42

Tennessee
Tennessee Higher Education Commission. (2010). Tennessee Higher Education Fact Book
http://www.state.tn.us/thec/Legislative/Reports/2011/2010-11%20Fact%20Book.PDF
Tennessee identifies developmental education based on enrollment within any development education
course. In fall 2010, 53 percent of first-time freshman enrolled in a public college needed at least one
developmental education course. At four-year public universities 20 percent of the 18,469 students
needed any developmental education courses. At community colleges 73 percent of the 18,756 students
enrolled in any developmental education course.
West Virginia
West Virginia Higher Education Policy Commission. 2013. Credit First-Time Full-Time Freshmen in
Developmental Courses
https://www.wvhepc.org/resources/Dashboard/Remedial/2013/cr_ftftfr_dev.html
In fall 2013, West Virginia’s public colleges enrolled 14,502 first-time, full-time students; and 31
percent took at least one developmental education course. At four-year public colleges 20 percent of the
11,000 students needed at least one developmental education course. At community colleges, 66 percent
needed a developmental course.
43

References
Asmussen, J. G. (2013). Longitudinal study of developmental education at four metropolitan area
MnSCU colleges. Mendota Heights, MN: Asmussen Research & Consulting LLC.
Bailey, T., Jeong, D. W., & Cho, S. (2008). Referral, enrollment, and completion in developmental
education sequences in community colleges. New York, NY: Community College Research Ctr.
Belfield, C. R. & Crosta, P.M. (2012). Predicting success in college: The importance of placement tests
and high school transcripts. New York, NY: Community College Research Center.
Bettinger, E. P. & Long, B. T. (2006). Addressing the needs of under-prepared students in higher
education: Does college remediation work? Retrieved from
http://www.postsecondaryresearch.org/i/a/document/4924_BettingerLong2006.pdf
Carnevale, A. (2013). Help wanted: Projections of jobs and education requirements through 2018.
Georgetown University Center on Education and the Workforce. Retrieved from
http://www.cew.georgetown.edu/jobs20280.
Complete College America. (2012). Remediation Higher Education’s Bridge to Nowhere. Washington,
DC: Complete College America.
Completion by Design. (2012). Student voices on the higher education pathway: Preliminary insights &
stakeholder engagement considerations. San Francisco, CA: WestEd.
Conley, D. T. (2007). Redefining college readiness. Eugene, OR: Educational Policy Improvement Ctr.
Fulton, M. (2010). Getting past go project. Denver, CO: Education Commission of the States.
Hughes, K., Rodrigues, O., Edward, L. & Blivefield (2012) Broadening the benefits of dual enrollment.
(Working Paper No. 47). New York, NY: Community College Research Center.
Jobs for the Future. (2011). A portrait in the numbers. Retrieved from:
http://www.jff.org/sites/default/files/a_portrait_in_numbers_newsletter_013111.pdf
Karp, M.M., Calcagno, J, Hughes, Jeong, D.W. & Bailey, T (2008). The postsecondary achievement of
participants of dual enrollment (CCRC Research Tools No. 1). New York, NY: Columbia
University, Teachers College, Community College Research Center.
Kim, J. (2006). The impact of dual and articulated credit on college readiness and total credit hours in
four selected community colleges. Ph.D. dissertation, University of Illinois Urbana-Champaign.
Maruyama, G., Davison, M., Kanada, M., Kellogg, J., Schoenecker, C. & Mercer, L.(2008). Predictors
of developmental mathematics course taking in Minnesota public post-secondary education.
Minneapolis, MN: Minnesota P-16 Education Partnership.
National Center for Education Statistics. (2013). “First-year undergraduate remedial course-taking:
1999-2000, 2003-04, 2007-08”. Statistics in Brief. January 2013. NCES 2013-013.
Smit, R. (2012). “Towards a clearer understanding of student disadvantage in higher education:
problematising deficit thinking”. Higher Education Research & Development, 31(3), 369-380.
Smith, D. (2007). Why expand dual credit? Community College Journal of Research and
Practice.31(5),371-387.
Speroni, C. (2011). Essays on economics of high school to college transition programs and teacher
effectiveness (Doctoral dissertation). Columbia University, New York, NY.
44

45
Additional Tables

45
Table 3: College Enrollment of 2006-2012 Public High School Graduates
Year of High School
Graduation
High School
College Activity
Total Graduates Enrolled in College First Term Enrollment Level
(Number of Credits)
Graduates At Any Time after High
School Graduation by First College of Enrollment
Within Two Years of High School Graduation by First
College of Enrollment
In a Fall Term within Two Years of High School
Graduation by First College of Enrollment
Number of Students
Total Graduates (column A)
Students (B)
Percent of High School Class (C = B ÷ A)
Students (D)
Percent of High School Class (E = D ÷ A)
Students (F)
Percent of High School Class (G = F ÷ A)
1-5 credits
(H)
6-8 credits
(I)
9-11 credits
(J)
12-14 credits
(K)
15+ credits
(L)
Enrolled at Any College (National)
2006 59,231 47,663 80% 43,188 73% 40,969 69%
not available
2007 59,851 49,465 83% 45,456 76% 43,113 72%
2008 60,824 50,312 83% 47,042 77% 44,573 73%
2009 59,618 49,177 82% 46,821 79% 44,308 74%
2010 59,639 48,154 81% 46,544 78% 44,081 74%
2011 59,365 46,444 78% 45,892 77% 43,555 73%
2012 (preliminary
data) 57,618 43,477 75% 43,477 75% 41,746 72%
Enrolled at Any Minnesota College (Public or Private)
2006 59,231 37,485 63% 33,857 57% 32,106 54% 2% 4% 4% 23% 67%
2007 59,851 38,772 65% 35,515 59% 33,644 56% 2% 3% 4% 23% 68%
2008 60,824 38,806 64% 36,133 59% 34,146 56% 2% 3% 4% 23% 68%
2009 59,618 37,914 64% 36,028 60% 33,943 57% 2% 3% 4% 23% 68%
2010 59,639 36,885 62% 35,581 60% 33,579 56% 1% 3% 4% 23% 69%
2011 59,365 35,046 59% 34,615 58% 32,633 55% 1% 3% 4% 23% 69%
2012 (preliminary
data) 57,618 32,082 56% 32,082 56% 30,660 53% 1% 2% 3% 23% 71%
*Enrollment within two years of graduation for 2006-2011 graduates and within one year of graduation for 2012 graduates; data for 2012 graduates is considered preliminary and should not be used in trend analysis.
Minnesota Office of Higher Education

46
Table 3: College Enrollment of 2006-2012 Public High School Graduates (continued)
Year of High School
Graduation
High School
College Activity
Total Graduates Enrolled in College First Term Enrollment Level
(Number of Credits)
Graduates At Any Time after High
School Graduation by First College of Enrollment
Within Two Years of High School Graduation by First
College of Enrollment
In a Fall Term within Two Years of High School
Graduation by First College of Enrollment
Number of Students
Total Graduates (column A)
Students (B)
Percent of High School Class (C = B ÷ A)
Students (D)
Percent of High School Class (E = D ÷ A)
Students (F)
Percent of High School Class (G = F ÷ A)
1-5 credits
(H)
6-8 credits
(I)
9-11 credits
(J)
12-14 credits
(K)
15+ credits
(L)
Enrolled at Minnesota Public Two-Year Colleges
2006 59,231 17,982 30% 15,363 26% 13,879 23% 3% 5% 5% 23% 65%
2007 59,851 18,331 31% 15,944 27% 14,342 24% 3% 4% 5% 22% 66%
2008 60,824 18,329 30% 16,346 27% 14,666 24% 3% 5% 6% 22% 64%
2009 59,618 17,902 30% 16,471 28% 14,680 25% 3% 5% 7% 24% 62%
2010 59,639 16,840 28% 15,869 27% 14,131 24% 2% 5% 7% 23% 63%
2011 59,365 15,920 27% 15,558 26% 13,848 23% 2% 5% 7% 24% 61%
2012* (preliminary
data) 57,618 14,234 25% 14,234 25% 13,024 23% 2% 4% 7% 25% 62%
Enrolled at Minnesota State Universities
2006 59,231 5,871 10% 5,718 10% 5,608 9% 2% 2% 3% 23% 69%
2007 59,851 6,520 11% 6,401 11% 6,294 11% 2% 2% 2% 25% 69%
2008 60,824 6,602 11% 6,485 11% 6,371 10% 1% 1% 2% 26% 69%
2009 59,618 6,487 11% 6,402 11% 6,304 11% 1% 1% 2% 28% 69%
2010 59,639 6,552 11% 6,486 11% 6,386 11% 1% 1% 1% 30% 67%
2011 59,365 6,361 11% 6,333 11% 6,219 10% 0% 0% 1% 30% 69%
2012* (preliminary
data) 57,618 6,118 11% 6,118 11% 6,027 10% 0% 0% 1% 32% 67%
*Enrollment within two years of graduation for 2006-2011 graduates and within one year of graduation for 2012 graduates; data for 2012 graduates is considered
preliminary and should not be used in trend analysis

47
Table 3: College Enrollment of 2006-2012 Public High School Graduates (continued)
Year of High School
Graduation
High School
College Activity
Total Graduates Enrolled in College First Term Enrollment Level
(Number of Credits)
Graduates At Any Time after High
School Graduation by First College of Enrollment
Within Two Years of High School Graduation by First
College of Enrollment
In a Fall Term within Two Years of High School
Graduation by First College of Enrollment
Number of Students
Total Graduates (column
A)
Students (B)
Percent of High School Class (C = B ÷ A)
Students (D)
Percent of High School Class (E = D ÷ A)
Students (F)
Percent of High School Class (G = F ÷ A)
1-5 credits
(H)
6-8 credits
(I)
9-11 credits
(J)
12-14 credits
(K)
15+ credits
(L)
Enrolled at the University of Minnesota
2006 59,231 5,366 9% 5,309 9% 5,252 9% 2% 2% 2% 31% 64%
2007 59,851 5,472 9% 5,413 9% 5,365 9% 1% 2% 1% 29% 66%
2008 60,824 5,427 9% 5,373 9% 5,330 9% 1% 1% 1% 27% 70%
2009 59,618 5,523 9% 5,493 9% 5,460 9% 1% 1% 1% 23% 75%
2010 59,639 5,815 10% 5,785 10% 5,750 10% 0% 0% 0% 23% 76%
2011 59,365 5,544 9% 5,532 9% 5,510 9% 0% 0% 0% 22% 77%
2012* (preliminary
data) 57,618 5,369 9% 5,369 9% 5,351 9% 0% 0% 0% 20% 80%
Enrolled at Private Not-for-profit College
2006 59,231 5,704 10% 5,585 9% 5,527 9% 2% 3% 2% 14% 80%
2007 59,851 5,947 10% 5,827 10% 5,764 10% 2% 2% 2% 14% 80%
2008 60,824 5,874 10% 5,795 10% 5,735 9% 1% 1% 1% 17% 81%
2009 59,618 5,781 10% 5,708 10% 5,626 9% 1% 0% 1% 15% 83%
2010 59,639 5,692 10% 5,637 9% 5,577 9% 0% 0% 1% 13% 86%
2011 59,365 5,684 10% 5,662 10% 5,592 9% 0% 0% 0% 13% 86%
2012* (preliminary
data) 57,618 5,386 9% 5,386 9% 5,334 9% 0% 0% 0% 12% 88%
*Enrollment within two years of graduation for 2006-2011 graduates and within one year of graduation for 2012 graduates; data for 2012 graduates is considered preliminary and should not be used in trend analysis.
Minnesota Office of Higher Education

Table 3: College Enrollment of 2006-2012 Public High School Graduates (continued)
Year of High School
Graduation
High School
College Activity
Total Graduates Enrolled in College First Term Enrollment Level
(Number of Credits)
Graduates At Any Time after High
School Graduation by First College of Enrollment
Within Two Years of High School Graduation by First
College of Enrollment
In a Fall Term within Two Years of High School
Graduation by First College of Enrollment
Number of Students
Total Graduates (column A)
Students (B)
Percent of High School Class
(C = B ÷ A)
Students (D)
Percent of High School Class
(E = D ÷ A)
Students (F)
Percent of High School Class
(G = F ÷ A)
1-5 credits
(H)
6-8 credits
(I)
9-11 credits
(J)
12-14 credits
(K)
15+ credits
(L)
Enrolled at Private For-profit Colleges
2006 59,231 2,562 4% 1,882 3% 1,840 3% 3% 14% 13% 33% 37%
2007 59,851 2,502 4% 1,930 3% 1,879 3% 5% 17% 11% 31% 36%
2008 60,824 2,574 4% 2,134 4% 2,044 3% 4% 15% 15% 33% 33%
2009 59,618 2,221 4% 1,954 3% 1,873 3% 5% 21% 13% 31% 29%
2010 59,639 1,986 3% 1,804 3% 1,735 3% 6% 19% 12% 26% 37%
2011 59,365 1,537 3% 1,530 3% 1,464 2% 7% 18% 14% 25% 36%
2012* (preliminary
data) 57,618 975 2% 975 2% 924 2% 5% 10% 13% 35% 37%
*Enrollment within two years of graduation for 2006-2011 graduates and within one year of graduation for 2012 graduates; data for 2012 graduates is considered
preliminary and should not be used in trend analysis 48

49
Table 4: Developmental Education Course-taking of 2006-2012 Public High School Graduates
Year of High School
Graduation
High School
College Activity Developmental Education Course-taking
College Enrollment by First College of Enrollment Graduates Enrolled in Developmental Courses
in 1st or 2nd Fall Term
Graduates Enrolled within Two Years of
High School Graduation
Enrolled within Two Years of High School Graduation -- Fall term
Enrollees by First College of Enrollment
Total Graduates (column A)
Number of Students (B)
Number of Students (C)
Total Students (D)
Percent of High School Class
(E = D ÷ A)
Percent of Fall Term Enrollees
(F = D ÷ C)
Enrolled at Any Minnesota College (Public or Private)
2006 59,231 33,857 32,106 8,873 15% 28%
2007 59,851 35,515 33,644 10,009 17% 30%
2008 60,824 36,133 34,146 10,373 17% 30%
2009 59,618 36,028 33,943 9,757 16% 29%
2010 59,639 35,581 33,579 9,889 17% 29%
2011 59,365 34,615 32,633 9,250 16% 28%
2012* (preliminary
data) 57,618 32,082 30,660 7,248 13% 24%
Enrolled at Minnesota Public Colleges
2006 59,231 26,390 24,739 8,459 14% 34%
2007 59,851 27,758 26,001 9,431 16% 36%
2008 60,824 28,204 26,367 9,742 16% 37%
2009 59,618 28,366 26,444 9,212 15% 35%
2010 59,639 28,140 26,267 9,477 16% 36%
2011 59,365 27,423 25,577 8,881 15% 35%
2012* (preliminary
data) 57,618 25,721 24,402 7,089 12% 29%
*Enrollment within two years of graduation for 2006-2011 graduates and within one year of graduation for 2012 graduates; data for 2012 graduates is considered preliminary and should not be used in trend analysis.
Minnesota Office of Higher Education

Table 4: Developmental Education Course-taking of 2006-2012 Public High School Graduates (continued)
Year of High School
Graduation
High School
College Activity Developmental Education Course-taking
College Enrollment by First College of Enrollment Graduates Enrolled in Developmental Courses
in 1st or 2nd Fall Term
Graduates Enrolled within Two Years of
High School Graduation
Enrolled within Two Years of High School Graduation -- Fall term
Enrollees by First College of Enrollment
Total Graduates (column A)
Number of Students (B)
Number of Students (C)
Total Students (D)
Percent of High School Class
(E = D ÷ A)
Percent of Fall Term Enrollees
(F = D ÷ C)
Enrolled at Minnesota Public Two-Year Colleges
2006 59,231 15,363 13,879 6,789 11% 49%
2007 59,851 15,944 14,342 7,603 13% 53%
2008 60,824 16,346 14,666 8,057 13% 55%
2009 59,618 16,471 14,680 7,766 13% 53%
2010 59,639 15,869 14,131 8,099 14% 57%
2011 59,365 15,558 13,848 7,667 13% 55%
2012* (preliminary
data) 57,618 14,234 13,024 6,121 11% 47%
Enrolled at Minnesota State Universities
2006 59,231 5,718 5,608 1,409 2% 25%
2007 59,851 6,401 6,294 1,657 3% 26%
2008 60,824 6,485 6,371 1,545 3% 24%
2009 59,618 6,402 6,304 1,304 2% 21%
2010 59,639 6,486 6,386 1,267 2% 20%
2011 59,365 6,333 6,219 1,109 2% 18%
2012* (preliminary
data) 57,618 6,118 6,027 864 1% 14%
*Enrollment within two years of graduation for 2006-2011 graduates and within one year of graduation for 2012 graduates; data for 2012 graduates is considered
preliminary and should not be used in trend analysis 50

51
Table 4: Developmental Education Course-taking of 2006-2012 Public High School Graduates (continued)
Year of High School
Graduation
High School
College Activity Developmental Education Course-taking
College Enrollment by First College of Enrollment Graduates Enrolled in Developmental Courses
in 1st or 2nd Fall Term
Graduates Enrolled within Two Years of
High School Graduation
Enrolled within Two Years of High School Graduation -- Fall term
Enrollees by First College of Enrollment
Total Graduates (column A)
Number of Students (B)
Number of Students (C)
Total Students (D)
Percent of High School Class
(E = D ÷ A)
Percent of Fall Term Enrollees
(F = D ÷ C)
Enrolled at the University of Minnesota
2006 59,231 5,309 5,252 261 0.4% 5%
2007 59,851 5,413 5,365 171 0.3% 3%
2008 60,824 5,373 5,330 140 0.2% 3%
2009 59,618 5,493 5,460 142 0.2% 3%
2010 59,639 5,785 5,750 111 0.2% 2%
2011 59,365 5,532 5,510 105 0.2% 2%
2012* (preliminary
data) 57,618 5,369 5,351 104 0.2% 2%
Enrolled at Private Not-for-Profit Colleges
2006 59,231 5,585 5,527 114 0.2% 2%
2007 59,851 5,827 5,764 186 0.3% 3%
2008 60,824 5,795 5,735 207 0.3% 4%
2009 59,618 5,708 5,626 158 0.3% 3%
2010 59,639 5,637 5,577 145 0.2% 3%
2011 59,365 5,662 5,592 161 0.3% 3%
2012* (preliminary
data) 57,618 5,386 5,334 39 0.1% 1%
*Enrollment within two years of graduation for 2006-2011 graduates and within one year of graduation for 2012 graduates; data for 2012 graduates is considered preliminary and should not be used in trend analysis.
Minnesota Office of Higher Education

Table 4: Developmental Education Course-taking of 2006-2012 Public High School Graduates (continued)
Year of High School
Graduation
High School
College Activity Developmental Education Course-taking
College Enrollment by First College of Enrollment Graduates Enrolled in Developmental Courses
in 1st or 2nd Fall Term
Graduates Enrolled within Two Years of
High School Graduation
Enrolled within Two Years of High School Graduation -- Fall term
Enrollees by First College of Enrollment
Total Graduates (column A)
Number of Students (B)
Number of Students (C)
Total Students (D)
Percent of High School Class
(E = D ÷ A)
Percent of Fall Term Enrollees
(F = D ÷ C)
Enrolled at Private For-Profit Colleges
2006 59,231 1,882 1,840 300 0.5% 16%
2007 59,851 1,930 1,879 392 0.7% 21%
2008 60,824 2,134 2,044 424 0.7% 21%
2009 59,618 1,954 1,873 387 0.6% 21%
2010 59,639 1,804 1,735 267 0.4% 15%
2011 59,365 1,530 1,464 208 0.4% 14%
2012* (preliminary
data) 57,618 975 924 120 0.2% 13%
*Enrollment within two years of graduation for 2006-2011 graduates and within one year of graduation for 2012 graduates; data for 2012 graduates is considered
preliminary and should not be used in trend analysis 52

Table 5: Developmental Education Credits
Year of High
School Graduation
Number of Developmental Credits Taken
Graduates Enrolled in Developmental Courses in 1st or 2nd Fall Term after High School Graduation
1-3 Credits 4-6 Credits 7-9 Credits More than 10
Credits Total
Percent of Students (column
A)
Total Credits
(B)
Percent of
Students (C)
Total Credits
(D)
Percent of
Students (E)
Total Credits
(F)
Percent of
Students (G)
Total Credits
(H)
Percent of
Students (I)
Total Credits
(J)
Enrolled at Any Minnesota College (Public or Private)
2006 34% 5,161 37% 10,956 17% 10,696 12% 13,298 100% 40,111
2007 33% 7,985 35% 14,700 18% 12,689 13% 15,320 100% 50,694
2008 34% 8,978 33% 15,575 18% 14,546 15% 19,166 100% 58,265
2009 33% 9,339 31% 15,024 19% 15,602 17% 22,145 100% 62,110
2010 32% 8,569 34% 15,378 19% 14,642 16% 19,780 100% 58,369
2011 30% 8,009 33% 15,457 20% 16,093 17% 21,105 100% 60,664
2012* (preliminary
data) 30% 7,466 34% 14,882 20% 15,192 16% 18,826 100% 56,366
Enrolled at Minnesota Public Two-Year Colleges
2006 25% 4,779 35% 11,471 22% 11,903 17% 15,028 100% 43,181
2007 26% 5,437 32% 11,739 22% 13,609 19% 18,805 100% 49,590
2008 24% 5,390 32% 12,094 23% 14,623 21% 21,771 100% 53,878
2009 24% 5,316 34% 12,641 22% 13,759 20% 19,396 100% 51,111
2010 24% 5,212 33% 12,662 23% 15,222 20% 20,597 100% 53,693
2011 25% 5,168 33% 12,319 23% 14,161 19% 18,334 100% 49,982
2012* (preliminary
data) 25% 4,244 34% 9,787 26% 12,556 15% 10,323 100% 36,910
Enrolled at Minnesota State Universities
2006 70% 2,590 27% 1,633 3% 342 0% 55 100% 4,620
2007 61% 2,644 34% 2,468 4% 518 0% 94 100% 5,724
2008 68% 2,901 27% 1,820 4% 420 1% 154 100% 5,295
2009 65% 2,301 31% 1,786 3% 274 1% 128 100% 4,489
2010 58% 2,127 35% 1,919 6% 634 1% 199 100% 4,879
2011 52% 1,711 39% 1,793 9% 777 1% 133 100% 4,414
2012* (preliminary
data) 54% 1,398 41% 1,426 5% 349 0% - 100% 3,173
*Enrollment within two years of graduation for 2006-2011 graduates and within one year of graduation for 2012 graduates; data for 2012 graduates is considered preliminary and should not be used in trend analysis.
Minnesota Office of Higher Education 53

Table 5: Developmental Education Credits (continued)
Year of High
School Graduation
Number of Developmental Credits Taken
Graduates Enrolled in Developmental Courses in 1st or 2nd Fall Term after High School Graduation
1-3 Credits 4-6 Credits 7-9 Credits More than 10
Credits Total
Percent of
Students (column
A)
Total Credits
(B)
Percent of
Students (C)
Total Credits
(D)
Percent of
Students (E)
Total Credits
(F)
Percent of
Students (G)
Total Credits
(H)
Percent of
Students (I)
Total Credits
(J)
Enrolled at University of Minnesota
2006 20% 149 73% 792 6% 126 2% 46 100% 1,113
2007 27% 136 63% 459 8% 105 2% 30 100% 730
2008 34% 137 61% 348 5% 57 1% 10 100% 552
2009 39% 163 50% 294 8% 90 2% 37 100% 584
2010 38% 119 60% 273 1% 8 1% 10 100% 410
2011 30% 92 63% 272 6% 47 1% 10 100% 421
2012* (preliminary
data) 56% 174 44% 184 0% - 0% - 100% 358
Enrolled at the Private Not-for-Profit Colleges
2006 44% 112 38% 205 11% 99 8% 117 100% 533
2007 70% 289 23% 207 4% 57 3% 62 100% 615
2008 64% 298 26% 249 5% 96 5% 128 100% 771
2009 65% 253 23% 173 8% 98 5% 91 100% 615
2010 57% 211 27% 191 9% 106 8% 129 100% 637
2011 61% 245 29% 217 7% 95 2% 63 100% 620
2012* (preliminary
data) 87% 93 8% 16 3% 7 3% 80 100% 196
Enrolled at Private For-Profit Colleges
2006 51% 355 38% 598 9% 219 2% 74 100% 1,247
2007 52% 472 36% 702 8% 257 4% 175 100% 1,606
2008 61% 614 27% 513 11% 407 2% 81 100% 1,614
2009 58% 537 28% 484 12% 422 3% 128 100% 1,570
2010 55% 340 33% 411 6% 123 6% 170 100% 1,044
2011 54% 251 28% 281 7% 112 11% 286 100% 929
2012* (preliminary
data) 72% 187 27% 150 1% 8 1% 12 100% 357
*Enrollment within two years of graduation for 2006-2011 graduates and within one year of graduation for 2012 graduates; data for 2012 graduates is considered preliminary and should not be used in trend analysis
54

Table 6: Where do Students Take Their Developmental Courses? Number of Students Enrolling in Developmental Education by College Offering Courses
Year of High School Graduation
Graduates Enrolled in Developmental Courses in 1st or 2nd Fall Term after High School Graduation
By College Offering Developmental Education Credits (includes students first enrolling outside Minnesota then transferring to a Minnesota college)
College Offering Courses
Total Minnesota Colleges and Universities
Minnesota Public Colleges and Universities
Minnesota Public Two-Year Colleges
Minnesota State Universities
Number of Students
(column A)
Percent of Total Students Enrolled in Developmental
Education (B)
Number of Students
(C)
Percent of Students Enrolled in Developmental
Education
(D = C ÷ A)
Number of Students
(E)
Percent of Students Enrolled in
Developmental Education
(F = E ÷ A)
Number of Students
(G)
Percent of Students Enrolled in
Developmental Education
(H = G ÷ A)
2006 9,068 100% 8,694 96% 7,108 78% 1,373 15%
2007 10,270 100% 9,707 95% 8,004 78% 1,579 15%
2008 10,629 100% 10,009 94% 8,488 80% 1,412 13%
2009 9,989 100% 9,493 95% 8,124 81% 1,278 13%
2010 10,118 100% 9,734 96% 8,454 84% 1,179 12%
2011 9,480 100% 9,166 97% 8,034 85% 1,056 11%
2012* (preliminary data)
7,256 100% 7,101 98% 6,150 85% 846 12%
College Offering Courses
University of Minnesota Private Not-for-Profit Colleges Private For-Profit Colleges
Year of High School Graduation
Number of Students
(I)
Percent of Students Enrolled in Developmental
Education
(J = I ÷ A)
Number of Students
(K)
Percent of Students Enrolled in Developmental
Education
(L = K ÷ A)
Number of Students
(M)
Percent of Students Enrolled in
Developmental
Education (N = M ÷ A)
2006 213 2% 42 0% 332 4%
2007 124 1% 144 1% 419 4%
2008 109 1% 147 1% 473 4%
2009 91 1% 107 1% 389 4%
2010 101 1% 107 1% 277 3%
2011 76 1% 96 1% 218 2%
2012* (preliminary data)
105 1% 31 0% 124 2%
*Enrollment within two years of graduation for 2006-2011 graduates and within one year of graduation for 2012 graduates; data for 2012 graduates is considered preliminary and should not be used in trend analysis.
Minnesota Office of Higher Education 55
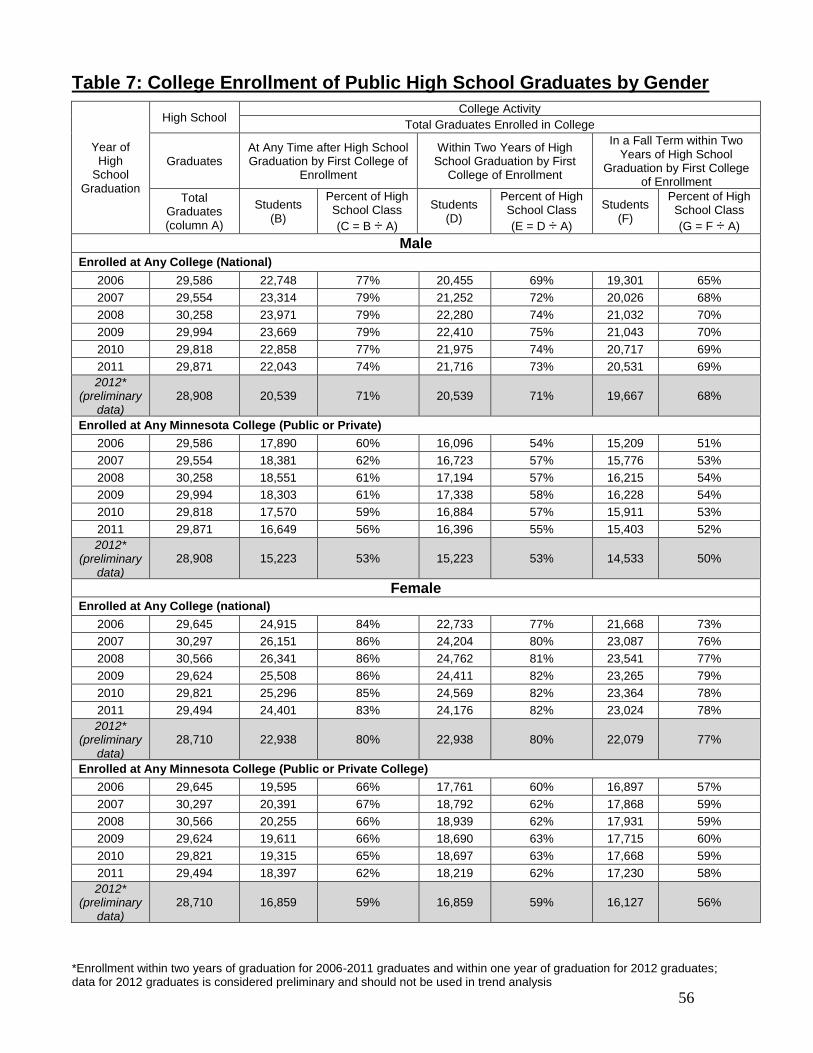
Table 7: College Enrollment of Public High School Graduates by Gender
Year of High
School Graduation
High School College Activity
Total Graduates Enrolled in College
Graduates At Any Time after High School Graduation by First College of
Enrollment
Within Two Years of High School Graduation by First
College of Enrollment
In a Fall Term within Two Years of High School
Graduation by First College of Enrollment
Total Graduates (column A)
Students (B)
Percent of High School Class
(C = B ÷ A)
Students (D)
Percent of High School Class
(E = D ÷ A)
Students (F)
Percent of High School Class
(G = F ÷ A)
Male
Enrolled at Any College (National)
2006 29,586 22,748 77% 20,455 69% 19,301 65%
2007 29,554 23,314 79% 21,252 72% 20,026 68%
2008 30,258 23,971 79% 22,280 74% 21,032 70%
2009 29,994 23,669 79% 22,410 75% 21,043 70%
2010 29,818 22,858 77% 21,975 74% 20,717 69%
2011 29,871 22,043 74% 21,716 73% 20,531 69%
2012* (preliminary
data) 28,908 20,539 71% 20,539 71% 19,667 68%
Enrolled at Any Minnesota College (Public or Private)
2006 29,586 17,890 60% 16,096 54% 15,209 51%
2007 29,554 18,381 62% 16,723 57% 15,776 53%
2008 30,258 18,551 61% 17,194 57% 16,215 54%
2009 29,994 18,303 61% 17,338 58% 16,228 54%
2010 29,818 17,570 59% 16,884 57% 15,911 53%
2011 29,871 16,649 56% 16,396 55% 15,403 52%
2012* (preliminary
data)
28,908 15,223 53% 15,223 53% 14,533 50%
Female Enrolled at Any College (national)
2006 29,645 24,915 84% 22,733 77% 21,668 73%
2007 30,297 26,151 86% 24,204 80% 23,087 76%
2008 30,566 26,341 86% 24,762 81% 23,541 77%
2009 29,624 25,508 86% 24,411 82% 23,265 79%
2010 29,821 25,296 85% 24,569 82% 23,364 78%
2011 29,494 24,401 83% 24,176 82% 23,024 78%
2012* (preliminary
data)
28,710 22,938 80% 22,938 80% 22,079 77%
Enrolled at Any Minnesota College (Public or Private College)
2006 29,645 19,595 66% 17,761 60% 16,897 57%
2007 30,297 20,391 67% 18,792 62% 17,868 59%
2008 30,566 20,255 66% 18,939 62% 17,931 59%
2009 29,624 19,611 66% 18,690 63% 17,715 60%
2010 29,821 19,315 65% 18,697 63% 17,668 59%
2011 29,494 18,397 62% 18,219 62% 17,230 58%
2012* (preliminary
data) 28,710 16,859 59% 16,859 59% 16,127 56%
*Enrollment within two years of graduation for 2006-2011 graduates and within one year of graduation for 2012 graduates; data for 2012 graduates is considered preliminary and should not be used in trend analysis
56

Table 8: Developmental Education Course-taking of Public High School Graduates by Gender
Year of High
School Graduation
High School
College Enrollment
Developmental Education Course-taking
Graduates Enrolled in Developmental Courses in 1st or 2nd Fall Term
Graduates
Within Two Years of High School Graduation by First College of
Enrollment
Within Two Years of High School
Graduation by First College of
Enrollment -- Fall Term Enrollees Only
by First College of Enrollment
Total Graduates (column A)
Number of Students
(B)
Number of Students (C)
Total Students
(D)
Percent of High School Class
(E = D ÷ A)
Percent of Fall Term Enrollees
(F = D ÷ C)
Male
Enrolled at Any Minnesota College (Public or Private)
2006 29,586 16,096 15,209 4,015 14% 26%
2007 29,554 16,723 15,776 4,672 16% 30%
2008 30,258 17,194 16,215 4,804 16% 30%
2009 29,994 17,338 16,228 4,532 15% 28%
2010 29,818 16,884 15,911 4,684 16% 29%
2011 29,871 16,396 15,403 4,352 15% 28%
2012* (preliminary
data) 28,908 15,223 14,533 3,362 12% 23%
Female
Enrolled at Any Minnesota College (Public or Private)
2006 29,645 17,761 16,897 4,858 16% 29%
2007 30,297 18,792 17,868 5,337 18% 30%
2008 30,566 18,939 17,931 5,569 18% 31%
2009 29,624 18,690 17,715 5,225 18% 29%
2010 29,821 18,697 17,668 5,205 17% 29%
2011 29,494 18,219 17,230 4,898 17% 28%
2012* (preliminary
data) 28,710 16,859 16,127 3,886 14% 24%
*Enrollment within two years of graduation for 2006-2011 graduates and within one year of graduation for 2012 graduates; data for 2012 graduates is considered preliminary and should not be used in trend analysis.
Minnesota Office of Higher Education 57

Table 9: College Enrollment of Public High School Graduates by Race/Ethnicity
Year of High
School Graduation
High School College Activity
Total Graduates Enrolled in College
Graduates At Any Time after High School Graduation by First College of
Enrollment
Within Two Years of High School Graduation by First
College of Enrollment
In a Fall Term within Two Years of High School
Graduation by First College of Enrollment
Total Graduates (column A)
Students (B)
Percent of High School Class
(C = B ÷ A)
Students (D)
Percent of High School Class
(E = D ÷ A)
Students (F)
Percent of High School Class
(G = F ÷ A)
American Indian or Alaska Native Enrolled at Any College (National)
2006 820 560 68% 430 52% 393 48%
2007 922 622 67% 494 54% 435 47%
2008 887 542 61% 447 50% 414 47%
2009 913 565 62% 498 55% 444 49%
2010 938 577 62% 531 57% 491 52%
2011 840 494 59% 484 58% 444 53%
2012* (preliminary
data)
827 483 58% 483 58% 436 53%
Enrolled at Any Minnesota College (Public or Private)
2006 820 495 60% 377 46% 344 42%
2007 922 557 60% 439 48% 388 42%
2008 887 474 53% 390 44% 359 40%
2009 913 496 54% 436 48% 384 42%
2010 938 508 54% 466 50% 429 46%
2011 840 439 52% 429 51% 397 47%
2012* (preliminary
data)
827 423 51% 423 51% 379 46%
Asian Enrolled at Any College (National)
2006 3,104 2,474 80% 2,222 72% 2,049 66%
2007 3,071 2,480 81% 2,259 74% 2,071 67%
2008 3,368 2,697 80% 2,505 74% 2,318 69%
2009 3,383 2,780 82% 2,629 78% 2,416 71%
2010 3,336 2,696 81% 2,604 78% 2,416 72%
2011 3,583 2,828 79% 2,787 78% 2,600 73%
2012* (preliminary
data)
3,639 2,753 76% 2,753 76% 2,610 72%
Enrolled at Any Minnesota College (Public or Private)
2006 3,104 2,140 69% 1,932 62% 1,786 58%
2007 3,071 2,159 70% 1,979 64% 1,813 59%
2008 3,368 2,326 69% 2,163 64% 1,998 59%
2009 3,383 2,423 72% 2,304 68% 2,118 63%
2010 3,336 2,308 69% 2,231 67% 2,064 62%
2011 3,583 2,424 68% 2,388 67% 2,224 62%
2012* (preliminary
data) 3,639 2,347 64% 2,347 64% 2,216 61%
*Enrollment within two years of graduation for 2006-2011 graduates and within one year of graduation for 2012 graduates; data for 2012 graduates is considered preliminary and should not be used in trend analysis
58

Table 9: College Enrollment of Public High School Graduates by Race/Ethnicity (continued)
Year of High
School Graduation
High School College Activity
Total Graduates Enrolled in College
Graduates At Any Time after High School Graduation by First College of
Enrollment
Within Two Years of High School Graduation by First
College of Enrollment
In a Fall Term within Two Years of High School
Graduation by First College of Enrollment
Total Graduates (column A)
Students (B)
Percent of High School Class
(C = B ÷ A)
Students (D)
Percent of High School Class
(E = D ÷ A)
Students (F)
Percent of High School Class
(G = F ÷ A)
Hispanic/Latino Enrolled at Any College (National)
2006 1,517 844 56% 683 45% 603 40%
2007 1,698 1,014 60% 837 49% 774 46%
2008 1,814 1,129 62% 998 55% 902 50%
2009 1,975 1,297 66% 1,154 58% 1,027 52%
2010 2,174 1,390 64% 1,296 60% 1,175 54%
2011 2,350 1,400 60% 1,370 58% 1,231 52%
2012* (preliminary
data) 2,416 1,371 57% 1,371 57% 1,274 53%
Enrolled at Any Minnesota College (Public or Private)
2006 1,517 715 47% 581 38% 512 34%
2007 1,698 867 51% 715 42% 664 39%
2008 1,814 966 53% 849 47% 778 43%
2009 1,975 1,107 56% 983 50% 873 44%
2010 2,174 1,197 55% 1,118 51% 1,003 46%
2011 2,350 1,216 52% 1,189 51% 1,064 45%
2012* (preliminary
data)
2,416 1,161 48% 1,161 48% 1,082 45%
Black or African American Enrolled at Any College (National)
2006 2,991 2,362 79% 1,956 65% 1,727 58%
2007 3,394 2,685 79% 2,246 66% 1,966 58%
2008 3,720 2,936 79% 2,614 70% 2,309 62%
2009 3,886 3,085 79% 2,836 73% 2,513 65%
2010 4,150 3,187 77% 3,023 73% 2,659 64%
2011 4,270 3,127 73% 3,076 72% 2,757 65%
2012* (preliminary
data) 4,057 2,819 69% 2,819 69% 2,577 64%
Enrolled at Any Minnesota College (Public or Private)
2006 2,652 1,693 64% 1,196 45% 1,196 45%
2007 2,991 2,019 68% 1,664 56% 1,473 49%
2008 3,394 2,322 68% 1,955 58% 1,716 51%
2009 3,720 2,493 67% 2,207 59% 1,949 52%
2010 3,886 2,656 68% 2,449 63% 2,171 56%
2011 4,150 2,706 65% 2,568 62% 2,249 54%
2012* (preliminary
data)
4,270 2,618 61% 2,580 60% 2,295 54%
*Enrollment within two years of graduation for 2006-2011 graduates and within one year of graduation for 2012 graduates; data for 2012 graduates is considered preliminary and should not be used in trend analysis.
Minnesota Office of Higher Education 59

Table 9: College Enrollment of Public High School Graduates by Race/Ethnicity (continued)
Year of High
School Graduation
High School College Activity
Total Graduates Enrolled in College
Graduates At Any Time after High School Graduation by First College of
Enrollment
Within Two Years of High School Graduation by First
College of Enrollment
In a Fall Term within Two Years of High School
Graduation by First College of Enrollment
Total Graduates (column A)
Students (B)
Percent of High School Class
(C = B ÷ A)
Students (D)
Percent of High School Class
(E = D ÷ A)
Students (F)
Percent of High School Class
(G = F ÷ A)
White Enrolled at Any College (National)
2006 50,799 41,423 82% 37,897 75% 36,197 71%
2007 50,766 42,664 84% 39,620 78% 37,867 75%
2008 51,035 43,008 84% 40,478 79% 38,630 76%
2009 49,461 41,450 84% 39,704 80% 37,908 77%
2010 49,041 40,304 82% 39,090 80% 37,340 76%
2011 48,322 38,595 80% 38,175 79% 36,523 76%
2012* (preliminary
data) 46,679 36,051 77% 36,051 77% 34,849 75%
Enrolled at Any Minnesota College (Public or Private)
2006 50,799 32,116 63% 29,303 58% 27,991 55%
2007 50,766 32,867 65% 30,427 60% 29,063 57%
2008 51,035 32,547 64% 30,524 60% 29,062 57%
2009 49,461 31,232 63% 29,856 60% 28,397 57%
2010 49,041 30,166 62% 29,198 60% 27,834 57%
2011 48,322 28,349 59% 28,029 58% 26,653 55%
2012* (preliminary
data)
46,679 25,849 55% 25,849 55% 24,892 53%
*Enrollment within two years of graduation for 2006-2011 graduates and within one year of graduation for 2012 graduates; data for 2012 graduates is considered preliminary and should not be used in trend analysis
60

Table 10: Developmental Education Course-taking of Public High School Graduates by Race/Ethnicity
Year of High
School Graduation
High School
College Enrollment
Developmental Education Course-taking
Graduates Enrolled in Developmental Courses in 1st or 2nd Fall Term
Graduates
Within Two Years of High School Graduation by First College of
Enrollment
Within Two Years of High School
Graduation by First College of
Enrollment -- Fall Term Enrollees Only
by First College of Enrollment
Total Graduates (column A)
Number of Students
(B)
Number of Students (C)
Total Students
(D)
Percent of High School Class
(E = D ÷ A)
Percent of Fall Term Enrollees
(F = D ÷ C)
American Indian or Alaska Native
Enrolled at Any Minnesota College (Public or Private)
2006 820 377 344 137 17% 40%
2007 922 439 388 152 16% 39%
2008 887 390 359 177 20% 49%
2009 913 436 384 197 22% 51%
2010 938 466 429 174 19% 41%
2011 840 429 397 150 18% 38%
2012* (preliminary
data) 827 423 379 119 14% 31%
Asian
Enrolled at Any Minnesota College (Public or Private)
2006 3,104 1,932 1,786 637 21% 36%
2007 3,071 1,979 1,813 690 22% 38%
2008 3,368 2,163 1,998 773 23% 39%
2009 3,383 2,304 2,118 790 23% 37%
2010 3,336 2,231 2,064 765 23% 37%
2011 3,583 2,388 2,224 867 24% 39%
2012* (preliminary
data) 3,639 2,347 2,216 724 20% 33%
Hispanic/Latino
Enrolled at Any Minnesota College (Public or Private)
2006 1,517 581 512 216 14% 42%
2007 1,698 715 664 270 16% 41%
2008 1,814 849 778 365 20% 47%
2009 1,975 983 873 365 18% 42%
2010 2,174 1,118 1,003 460 21% 46%
2011 2,350 1,189 1,064 482 21% 45%
2012* (preliminary
data) 2,416 1,161 1,082 412 17% 38%
*Enrollment within two years of graduation for 2006-2011 graduates and within one year of graduation for 2012 graduates; data for 2012 graduates is considered preliminary and should not be used in trend analysis.
Minnesota Office of Higher Education 61

Table 10: Developmental Education Course-taking of Public High School Graduates by Race/Ethnicity (continued)
Year of High
School Graduation
High School
College Enrollment
Developmental Education Course-taking
Graduates Enrolled in Developmental Courses in 1st or 2nd Fall Term
Graduates
Within Two Years of High School Graduation by First College of
Enrollment
Within Two Years of High School
Graduation by First College of
Enrollment -- Fall Term Enrollees Only
by First College of Enrollment
Total Graduates (column A)
Number of Students
(B)
Number of Students (C)
Total Students
(D)
Percent of High School Class
(E = D ÷ A)
Percent of Fall Term Enrollees
(F = D ÷ C)
Black or African American
Enrolled at Any Minnesota College (Public or Private)
2006 2,991 1,664 1,473 753 25% 51%
2007 3,394 1,955 1,716 934 28% 54%
2008 3,720 2,207 1,949 1,040 28% 53%
2009 3,886 2,449 2,171 1,190 31% 55%
2010 4,150 2,568 2,249 1,251 30% 56%
2011 4,270 2,580 2,295 1,266 30% 55%
2012* (preliminary
data) 4,057 2,302 2,091 1,019 25% 49%
White
Enrolled at Any Minnesota College (Public or Private)
2006 50,799 29,303 27,991 7,135 14% 25%
2007 50,766 30,427 29,063 7,963 16% 27%
2008 51,035 30,524 29,062 8,021 16% 28%
2009 49,461 29,856 28,397 7,214 15% 25%
2010 49,041 29,198 27,834 7,235 15% 26%
2011 48,322 28,029 26,653 6,480 13% 24%
2012* (preliminary
data) 46,679 25,849 24,892 4,972 11% 20%
*Enrollment within two years of graduation for 2006-2011 graduates and within one year of graduation for 2012 graduates; data for 2012 graduates is considered preliminary and should not be used in trend analysis
62
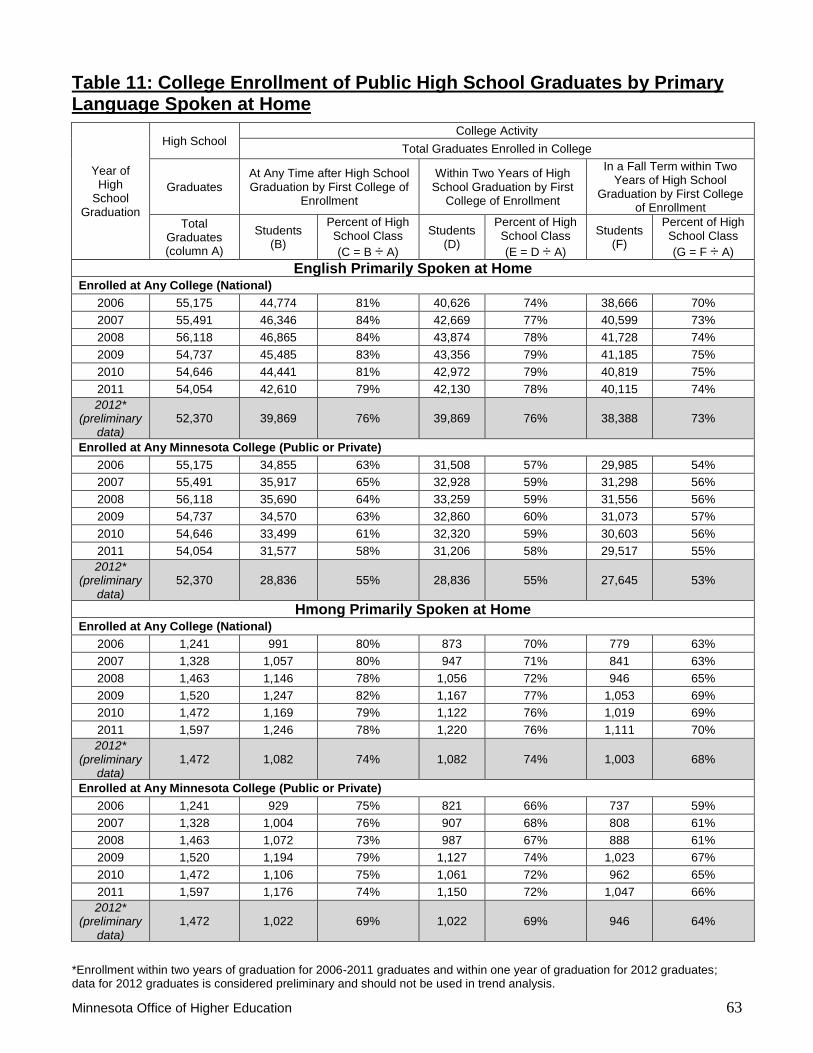
Table 11: College Enrollment of Public High School Graduates by Primary Language Spoken at Home
Year of High
School Graduation
High School College Activity
Total Graduates Enrolled in College
Graduates At Any Time after High School Graduation by First College of
Enrollment
Within Two Years of High School Graduation by First
College of Enrollment
In a Fall Term within Two Years of High School
Graduation by First College of Enrollment
Total Graduates (column A)
Students (B)
Percent of High School Class
(C = B ÷ A)
Students (D)
Percent of High School Class
(E = D ÷ A)
Students (F)
Percent of High School Class
(G = F ÷ A)
English Primarily Spoken at Home Enrolled at Any College (National)
2006 55,175 44,774 81% 40,626 74% 38,666 70%
2007 55,491 46,346 84% 42,669 77% 40,599 73%
2008 56,118 46,865 84% 43,874 78% 41,728 74%
2009 54,737 45,485 83% 43,356 79% 41,185 75%
2010 54,646 44,441 81% 42,972 79% 40,819 75%
2011 54,054 42,610 79% 42,130 78% 40,115 74%
2012* (preliminary
data) 52,370 39,869 76% 39,869 76% 38,388 73%
Enrolled at Any Minnesota College (Public or Private)
2006 55,175 34,855 63% 31,508 57% 29,985 54%
2007 55,491 35,917 65% 32,928 59% 31,298 56%
2008 56,118 35,690 64% 33,259 59% 31,556 56%
2009 54,737 34,570 63% 32,860 60% 31,073 57%
2010 54,646 33,499 61% 32,320 59% 30,603 56%
2011 54,054 31,577 58% 31,206 58% 29,517 55%
2012* (preliminary
data)
52,370 28,836 55% 28,836 55% 27,645 53%
Hmong Primarily Spoken at Home Enrolled at Any College (National)
2006 1,241 991 80% 873 70% 779 63%
2007 1,328 1,057 80% 947 71% 841 63%
2008 1,463 1,146 78% 1,056 72% 946 65%
2009 1,520 1,247 82% 1,167 77% 1,053 69%
2010 1,472 1,169 79% 1,122 76% 1,019 69%
2011 1,597 1,246 78% 1,220 76% 1,111 70%
2012* (preliminary
data) 1,472 1,082 74% 1,082 74% 1,003 68%
Enrolled at Any Minnesota College (Public or Private)
2006 1,241 929 75% 821 66% 737 59%
2007 1,328 1,004 76% 907 68% 808 61%
2008 1,463 1,072 73% 987 67% 888 61%
2009 1,520 1,194 79% 1,127 74% 1,023 67%
2010 1,472 1,106 75% 1,061 72% 962 65%
2011 1,597 1,176 74% 1,150 72% 1,047 66%
2012* (preliminary
data)
1,472 1,022 69% 1,022 69% 946 64%
*Enrollment within two years of graduation for 2006-2011 graduates and within one year of graduation for 2012 graduates; data for 2012 graduates is considered preliminary and should not be used in trend analysis.
Minnesota Office of Higher Education 63

Table 11: College Enrollment of Public High School Graduates by Primary Language Spoken at Home (continued)
Year of High
School Graduation
High School College Activity
Total Graduates Enrolled in College
Graduates At Any Time after High School Graduation by First College of
Enrollment
Within Two Years of High School Graduation by First
College of Enrollment
In a Fall Term within Two Years of High School
Graduation by First College of Enrollment
Total Graduates (column A)
Students (B)
Percent of High School Class
(C = B ÷ A)
Students (D)
Percent of High School Class
(E = D ÷ A)
Students (F)
Percent of High School Class
(G = F ÷ A)
Spanish Primarily Spoken at Home Enrolled at Any College (National)
2006 799 368 46% 293 37% 261 33%
2007 869 426 49% 341 39% 317 36%
2008 915 497 54% 427 47% 379 41%
2009 1,066 625 59% 553 52% 479 45%
2010 1,182 693 59% 645 55% 576 49%
2011 1,333 753 56% 738 55% 651 49%
2012* (preliminary
data) 1,368 701 51% 701 51% 650 48%
Enrolled at Any Minnesota College (Public or Private)
2006 799 318 40% 255 32% 228 29%
2007 869 392 45% 322 37% 301 35%
2008 915 461 50% 398 43% 358 39%
2009 1,066 547 51% 487 46% 424 40%
2010 1,182 635 54% 591 50% 526 45%
2011 1,333 688 52% 674 51% 595 45%
2012* (preliminary
data) 1,368 633 46% 633 46% 587 43%
Somali Primarily Spoken at Home Enrolled at Any College (National)
2006 318 271 85% 252 79% 218 69%
2007 489 404 83% 365 75% 303 62%
2008 529 433 82% 408 77% 345 65%
2009 515 434 84% 420 82% 375 73%
2010 553 436 79% 426 77% 367 66%
2011 511 402 79% 396 77% 357 70%
2012* (preliminary
data) 447 347 78% 347 78% 313 70%
Enrolled at Any Minnesota College (Public or Private)
2006 318 238 75% 223 70% 213 67%
2007 489 347 71% 319 65% 290 59%
2008 529 365 69% 343 65% 320 60%
2009 515 379 74% 369 72% 364 71%
2010 553 364 66% 357 65% 348 63%
2011 511 348 68% 344 67% 343 67%
2012* (preliminary
data)
447 295 66% 295 66% 297 66%
*Enrollment within two years of graduation for 2006-2011 graduates and within one year of graduation for 2012 graduates; data for 2012 graduates is considered preliminary and should not be used in trend analysis
64

Table 11: College Enrollment of Public High School Graduates by Primary Language Spoken at Home (continued)
Year of High
School Graduation
High School College Activity
Total Graduates Enrolled in College
Graduates At Any Time after High School Graduation by First College of
Enrollment
Within Two Years of High School Graduation by First
College of Enrollment
In a Fall Term within Two Years of High School
Graduation by First College of Enrollment
Total Graduates (column A)
Students (B)
Percent of High School Class
(C = B ÷ A)
Students (D)
Percent of High School Class
(E = D ÷ A)
Students (F)
Percent of High School Class
(G = F ÷ A)
All Other Languages Primarily Spoken at Home Enrolled at Any College (National)
2006 1,698 1,259 74% 1,144 67% 1,045 62%
2007 1,674 1,232 74% 1,134 68% 1,053 63%
2008 1,799 1,371 76% 1,277 71% 1,175 65%
2009 1,780 1,386 78% 1,325 74% 1,216 68%
2010 1,786 1,415 79% 1,379 77% 1,300 73%
2011 1,870 1,433 77% 1,408 75% 1,321 71%
2012* (preliminary
data) 1,961 1,478 75% 1,478 75% 1,392 71%
Enrolled at Any Minnesota College (Public or Private)
2006 1,698 1,125 66% 1,030 61% 943 56%
2007 1,674 1,085 65% 1,016 61% 947 57%
2008 1,799 1,186 66% 1,114 62% 1,024 57%
2009 1,780 1,188 67% 1,150 65% 1,059 59%
2010 1,786 1,234 69% 1,206 68% 1,140 64%
2011 1,870 1,221 65% 1,205 64% 1,131 60%
2012* (preliminary
data) 1,961 1,260 64% 1,260 64% 1,185 60%
*Enrollment within two years of graduation for 2006-2011 graduates and within one year of graduation for 2012 graduates; data for 2012 graduates is considered preliminary and should not be used in trend analysis.
Minnesota Office of Higher Education 65

Table 12: Developmental Education Course-taking of Public High School Graduates by Home Primary Language
Year of High
School Graduation
High School
College Enrollment
Developmental Education Course-taking
Graduates Enrolled in Developmental Courses in 1st or 2nd Fall Term
Graduates
Within Two Years of High School Graduation by First College of
Enrollment
Within Two Years of High School
Graduation by First College of
Enrollment -- Fall Term Enrollees Only
by First College of Enrollment
Total Graduates (column A)
Number of Students
(B)
Number of Students (C)
Total Students
(D)
Percent of High School Class
(E = D ÷ A)
Percent of Fall Term Enrollees
(F = D ÷ C)
English Primarily Spoken at Home
Enrolled at Any Minnesota College (Public or Private)
2006 55,175 31,508 29,985 7,929 14% 26%
2007 55,491 32,928 31,298 8,902 16% 28%
2008 56,118 33,259 31,556 9,154 16% 29%
2009 54,737 32,860 31,073 8,430 15% 27%
2010 54,646 32,320 30,603 8,484 16% 28%
2011 54,054 31,206 29,517 7,734 14% 26%
2012* (preliminary
data) 52,370 28,836 27,645 6,020 11% 22%
Hmong Primarily Spoken at Home
Enrolled at Any Minnesota College (Public or Private)
2006 1,241 929 737 305 25% 41%
2007 1,328 1,004 808 372 28% 46%
2008 1,463 1,072 888 396 27% 45%
2009 1,520 1,194 1,023 451 30% 44%
2010 1,472 1,106 962 423 29% 44%
2011 1,597 1,176 1,047 521 33% 50%
2012* (preliminary
data) 1,472 1,022 946 379 26% 40%
Spanish Primarily Spoken at Home
Enrolled at Any Minnesota College (Public or Private)
2006 799 255 228 106 13% 46%
2007 869 322 301 154 18% 51%
2008 915 398 358 193 21% 54%
2009 1,066 487 424 185 17% 44%
2010 1,182 591 526 268 23% 51%
2011 1,333 674 595 295 22% 50%
2012* (preliminary
data) 1,368 633 587 263 19% 45%
*Enrollment within two years of graduation for 2006-2011 graduates and within one year of graduation for 2012 graduates; data for 2012 graduates is considered preliminary and should not be used in trend analysis
66
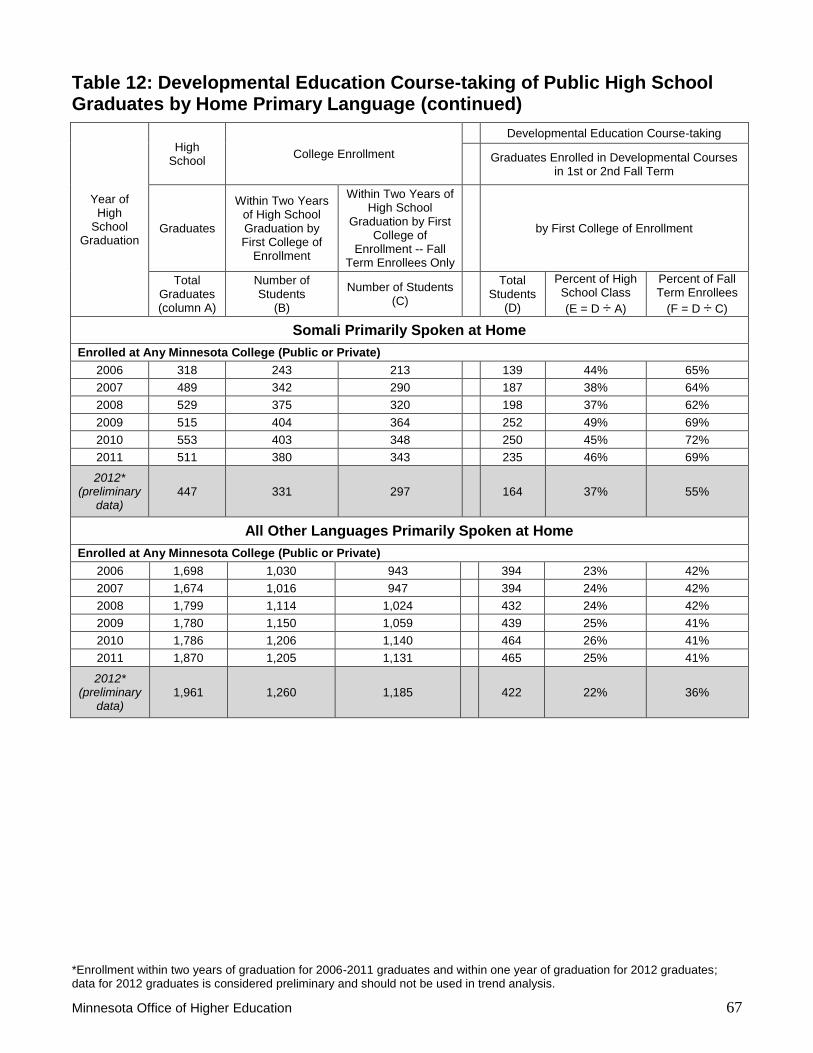
Table 12: Developmental Education Course-taking of Public High School Graduates by Home Primary Language (continued)
Year of High
School Graduation
High School
College Enrollment
Developmental Education Course-taking
Graduates Enrolled in Developmental Courses in 1st or 2nd Fall Term
Graduates
Within Two Years of High School Graduation by First College of
Enrollment
Within Two Years of High School
Graduation by First College of
Enrollment -- Fall Term Enrollees Only
by First College of Enrollment
Total Graduates (column A)
Number of Students
(B)
Number of Students (C)
Total Students
(D)
Percent of High School Class
(E = D ÷ A)
Percent of Fall Term Enrollees
(F = D ÷ C)
Somali Primarily Spoken at Home
Enrolled at Any Minnesota College (Public or Private)
2006 318 243 213 139 44% 65%
2007 489 342 290 187 38% 64%
2008 529 375 320 198 37% 62%
2009 515 404 364 252 49% 69%
2010 553 403 348 250 45% 72%
2011 511 380 343 235 46% 69%
2012* (preliminary
data) 447 331 297 164 37% 55%
All Other Languages Primarily Spoken at Home
Enrolled at Any Minnesota College (Public or Private)
2006 1,698 1,030 943 394 23% 42%
2007 1,674 1,016 947 394 24% 42%
2008 1,799 1,114 1,024 432 24% 42%
2009 1,780 1,150 1,059 439 25% 41%
2010 1,786 1,206 1,140 464 26% 41%
2011 1,870 1,205 1,131 465 25% 41%
2012* (preliminary
data) 1,961 1,260 1,185 422 22% 36%
*Enrollment within two years of graduation for 2006-2011 graduates and within one year of graduation for 2012 graduates; data for 2012 graduates is considered preliminary and should not be used in trend analysis.
Minnesota Office of Higher Education 67
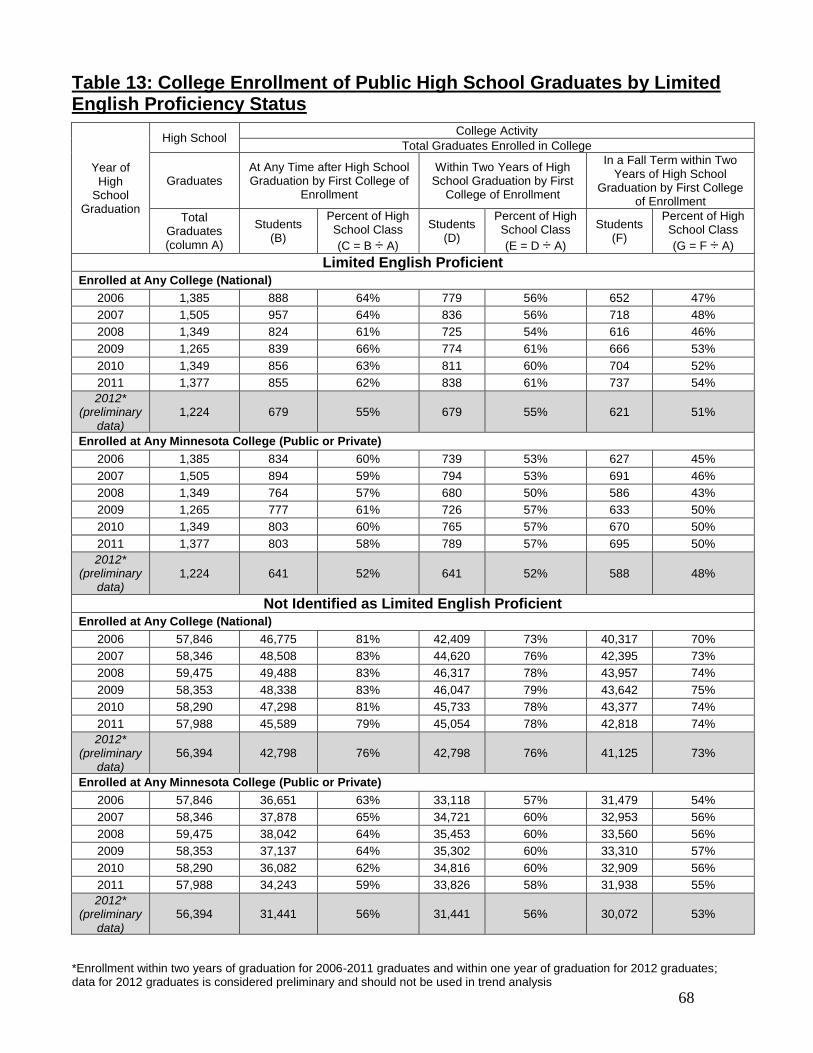
Table 13: College Enrollment of Public High School Graduates by Limited English Proficiency Status
Year of High
School Graduation
High School College Activity
Total Graduates Enrolled in College
Graduates At Any Time after High School Graduation by First College of
Enrollment
Within Two Years of High School Graduation by First
College of Enrollment
In a Fall Term within Two Years of High School
Graduation by First College of Enrollment
Total Graduates (column A)
Students (B)
Percent of High School Class
(C = B ÷ A)
Students (D)
Percent of High School Class
(E = D ÷ A)
Students (F)
Percent of High School Class
(G = F ÷ A)
Limited English Proficient Enrolled at Any College (National)
2006 1,385 888 64% 779 56% 652 47%
2007 1,505 957 64% 836 56% 718 48%
2008 1,349 824 61% 725 54% 616 46%
2009 1,265 839 66% 774 61% 666 53%
2010 1,349 856 63% 811 60% 704 52%
2011 1,377 855 62% 838 61% 737 54%
2012* (preliminary
data) 1,224 679 55% 679 55% 621 51%
Enrolled at Any Minnesota College (Public or Private)
2006 1,385 834 60% 739 53% 627 45%
2007 1,505 894 59% 794 53% 691 46%
2008 1,349 764 57% 680 50% 586 43%
2009 1,265 777 61% 726 57% 633 50%
2010 1,349 803 60% 765 57% 670 50%
2011 1,377 803 58% 789 57% 695 50%
2012* (preliminary
data) 1,224 641 52% 641 52% 588 48%
Not Identified as Limited English Proficient Enrolled at Any College (National)
2006 57,846 46,775 81% 42,409 73% 40,317 70%
2007 58,346 48,508 83% 44,620 76% 42,395 73%
2008 59,475 49,488 83% 46,317 78% 43,957 74%
2009 58,353 48,338 83% 46,047 79% 43,642 75%
2010 58,290 47,298 81% 45,733 78% 43,377 74%
2011 57,988 45,589 79% 45,054 78% 42,818 74%
2012* (preliminary
data) 56,394 42,798 76% 42,798 76% 41,125 73%
Enrolled at Any Minnesota College (Public or Private)
2006 57,846 36,651 63% 33,118 57% 31,479 54%
2007 58,346 37,878 65% 34,721 60% 32,953 56%
2008 59,475 38,042 64% 35,453 60% 33,560 56%
2009 58,353 37,137 64% 35,302 60% 33,310 57%
2010 58,290 36,082 62% 34,816 60% 32,909 56%
2011 57,988 34,243 59% 33,826 58% 31,938 55%
2012* (preliminary
data)
56,394 31,441 56% 31,441 56% 30,072 53%
*Enrollment within two years of graduation for 2006-2011 graduates and within one year of graduation for 2012 graduates; data for 2012 graduates is considered preliminary and should not be used in trend analysis
68
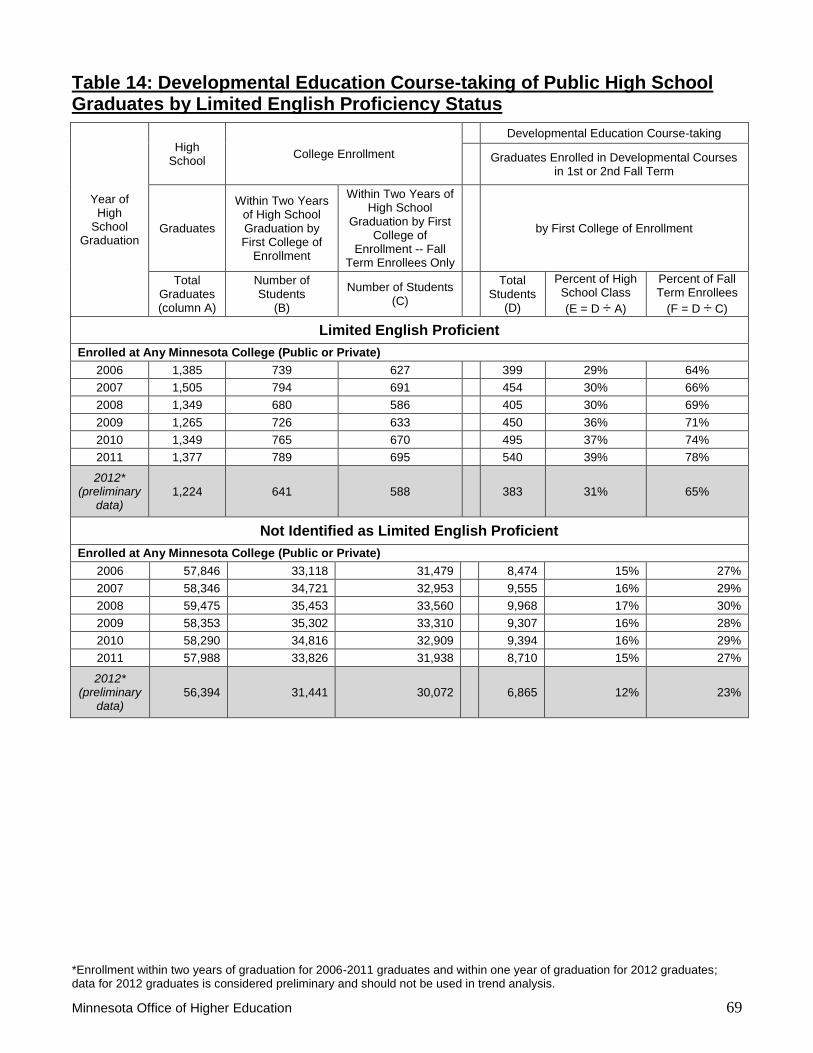
Table 14: Developmental Education Course-taking of Public High School Graduates by Limited English Proficiency Status
Year of High
School Graduation
High School
College Enrollment
Developmental Education Course-taking
Graduates Enrolled in Developmental Courses in 1st or 2nd Fall Term
Graduates
Within Two Years of High School Graduation by First College of
Enrollment
Within Two Years of High School
Graduation by First College of
Enrollment -- Fall Term Enrollees Only
by First College of Enrollment
Total Graduates (column A)
Number of Students
(B)
Number of Students (C)
Total Students
(D)
Percent of High School Class
(E = D ÷ A)
Percent of Fall Term Enrollees
(F = D ÷ C)
Limited English Proficient
Enrolled at Any Minnesota College (Public or Private)
2006 1,385 739 627 399 29% 64%
2007 1,505 794 691 454 30% 66%
2008 1,349 680 586 405 30% 69%
2009 1,265 726 633 450 36% 71%
2010 1,349 765 670 495 37% 74%
2011 1,377 789 695 540 39% 78%
2012* (preliminary
data) 1,224 641 588 383 31% 65%
Not Identified as Limited English Proficient
Enrolled at Any Minnesota College (Public or Private)
2006 57,846 33,118 31,479 8,474 15% 27%
2007 58,346 34,721 32,953 9,555 16% 29%
2008 59,475 35,453 33,560 9,968 17% 30%
2009 58,353 35,302 33,310 9,307 16% 28%
2010 58,290 34,816 32,909 9,394 16% 29%
2011 57,988 33,826 31,938 8,710 15% 27%
2012* (preliminary
data) 56,394 31,441 30,072 6,865 12% 23%
*Enrollment within two years of graduation for 2006-2011 graduates and within one year of graduation for 2012 graduates; data for 2012 graduates is considered preliminary and should not be used in trend analysis.
Minnesota Office of Higher Education 69

Table 15: College Enrollment of Public High School Graduates by Economic Status
Year of High
School Graduation
High School College Activity
Total Graduates Enrolled in College
Graduates At Any Time after High School Graduation by First College of
Enrollment
Within Two Years of High School Graduation by First
College of Enrollment
In a Fall Term within Two Years of High School
Graduation by First College of Enrollment
Total Graduates (column A)
Students (B)
Percent of High School Class
(C = B ÷ A)
Students (D)
Percent of High School Class
(E = D ÷ A)
Students (F)
Percent of High School Class
(G = F ÷ A)
Enrolled in Free Lunch Program Enrolled at Any College (National)
2006 7,638 5,362 70% 4,371 57% 3,917 51%
2007 7,926 5,542 70% 4,618 58% 4,106 52%
2008 8,403 5,836 69% 5,107 61% 4,561 54%
2009 8,973 6,306 70% 5,729 64% 5,111 57%
2010 10,448 7,063 68% 6,657 64% 5,981 57%
2011 10,990 7,120 65% 6,971 63% 6,282 57%
2012 (preliminary
data) 11,057 6,708 61% 6,708 61% 6,169 56%
Enrolled at Any Minnesota College (Public or Private)
2006 7,638 4,734 62% 3,881 51% 3,496 46%
2007 7,926 4,959 63% 4,173 53% 3,734 47%
2008 8,403 5,161 61% 4,512 54% 4,049 48%
2009 8,973 5,681 63% 5,179 58% 4,640 52%
2010 10,448 6,275 60% 5,925 57% 5,327 51%
2011 10,990 6,278 57% 6,155 56% 5,530 50%
2012 (preliminary
data) 11,057 5,900 53% 5,900 53% 5,423 49%
Enrolled in Reduced Price Lunch Program
Enrolled at Any College (National)
2006 2,919 2,261 77% 1,960 67% 1,836 63%
2007 3,096 2,405 78% 2,133 69% 1,978 64%
2008 3,067 2,370 77% 2,158 70% 1,996 65%
2009 3,267 2,545 78% 2,386 73% 2,201 67%
2010 3,476 2,669 77% 2,552 73% 2,384 69%
2011 3,509 2,575 73% 2,541 72% 2,373 68%
2012 (preliminary
data)
3,299 2,290 69% 2,290 69% 2,162 66%
Enrolled at Any Minnesota College (Public or Private)
2006 2,919 1,958 67% 1,704 58% 1,598 55%
2007 3,096 2,059 67% 1,838 59% 1,710 55%
2008 3,067 2,029 66% 1,854 60% 1,714 56%
2009 3,267 2,153 66% 2,035 62% 1,870 57%
2010 3,476 2,261 65% 2,163 62% 2,024 58%
2011 3,509 2,181 62% 2,152 61% 2,005 57%
2012 (preliminary
data) 3,299 1,882 57% 1,882 57% 1,772 54%
*Enrollment within two years of graduation for 2006-2011 graduates and within one year of graduation for 2012 graduates; data for 2012 graduates is considered preliminary and should not be used in trend analysis
70

Table 15: College Enrollment of Public High School Graduates by Economic Status (continued)
Year of High
School Graduation
High School College Activity
Total Graduates Enrolled in College
Graduates At Any Time after High School Graduation by First College of
Enrollment
Within Two Years of High School Graduation by First
College of Enrollment
In a Fall Term within Two Years of High School
Graduation by First College of Enrollment
Total Graduates (column A)
Students (B)
Percent of High School Class
(C = B ÷ A)
Students (D)
Percent of High School Class
(E = D ÷ A)
Students (F)
Percent of High School Class
(G = F ÷ A)
Not Enrolled in Free/Reduced Price Lunch Program Enrolled at Any College (National)
2006 48,674 40,040 82% 36,857 76% 35,216 72%
2007 48,829 41,518 85% 38,705 79% 37,029 76%
2008 49,354 42,106 85% 39,777 81% 38,016 77%
2009 47,378 40,326 85% 38,706 82% 36,996 78%
2010 45,715 38,422 84% 37,335 82% 35,716 78%
2011 44,866 36,749 82% 36,380 81% 34,900 78%
2012 (preliminary
data)
43,262 34,479 80% 34,479 80% 33,415 77%
Enrolled at Any Minnesota College (Public or Private)
2006 48,674 30,793 63% 28,272 58% 27,012 55%
2007 48,829 31,754 65% 29,504 60% 28,200 58%
2008 49,354 31,616 64% 29,767 60% 28,383 58%
2009 47,378 30,080 63% 28,814 61% 27,433 58%
2010 45,715 28,349 62% 27,493 60% 26,228 57%
2011 44,866 26,587 59% 26,308 59% 25,098 56%
2012 (preliminary
data) 43,262 24,300 56% 24,300 56% 23,465 54%
*Enrollment within two years of graduation for 2006-2011 graduates and within one year of graduation for 2012 graduates; data for 2012 graduates is considered preliminary and should not be used in trend analysis.
Minnesota Office of Higher Education 71
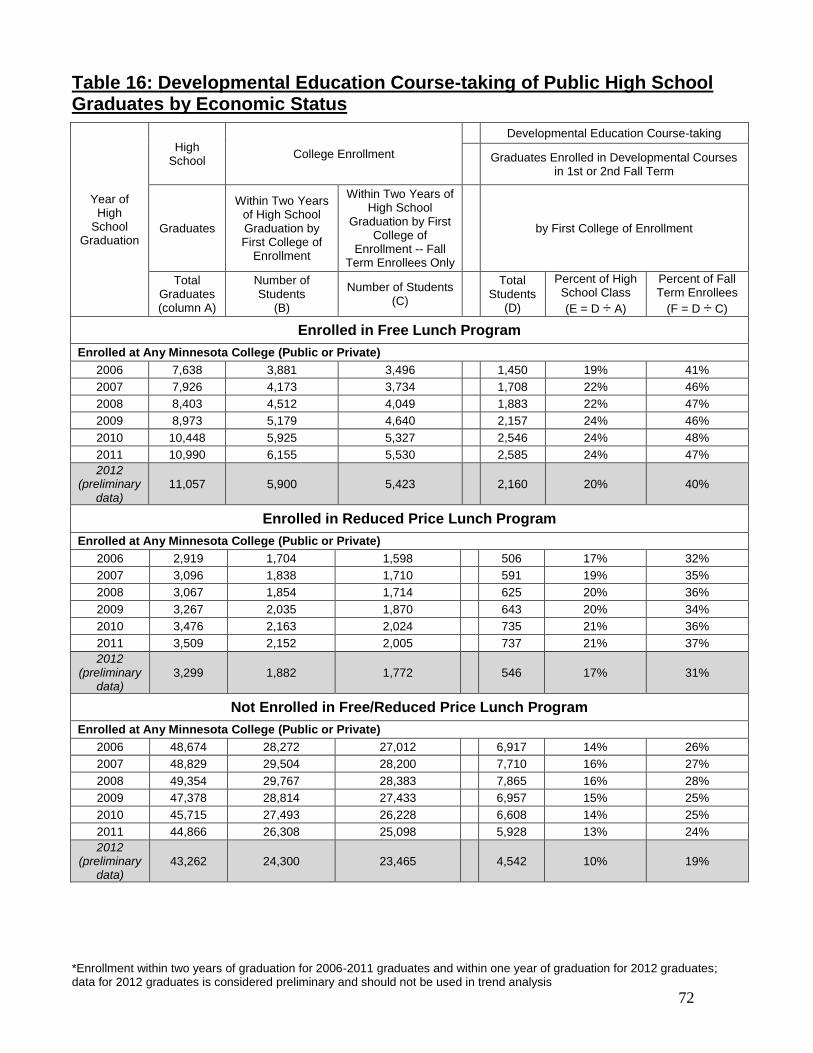
Table 16: Developmental Education Course-taking of Public High School Graduates by Economic Status
Year of High
School Graduation
High School
College Enrollment
Developmental Education Course-taking
Graduates Enrolled in Developmental Courses in 1st or 2nd Fall Term
Graduates
Within Two Years of High School Graduation by First College of
Enrollment
Within Two Years of High School
Graduation by First College of
Enrollment -- Fall Term Enrollees Only
by First College of Enrollment
Total Graduates (column A)
Number of Students
(B)
Number of Students (C)
Total Students
(D)
Percent of High School Class
(E = D ÷ A)
Percent of Fall Term Enrollees
(F = D ÷ C)
Enrolled in Free Lunch Program
Enrolled at Any Minnesota College (Public or Private)
2006 7,638 3,881 3,496 1,450 19% 41%
2007 7,926 4,173 3,734 1,708 22% 46%
2008 8,403 4,512 4,049 1,883 22% 47%
2009 8,973 5,179 4,640 2,157 24% 46%
2010 10,448 5,925 5,327 2,546 24% 48%
2011 10,990 6,155 5,530 2,585 24% 47%
2012 (preliminary
data) 11,057 5,900 5,423 2,160 20% 40%
Enrolled in Reduced Price Lunch Program
Enrolled at Any Minnesota College (Public or Private)
2006 2,919 1,704 1,598 506 17% 32%
2007 3,096 1,838 1,710 591 19% 35%
2008 3,067 1,854 1,714 625 20% 36%
2009 3,267 2,035 1,870 643 20% 34%
2010 3,476 2,163 2,024 735 21% 36%
2011 3,509 2,152 2,005 737 21% 37%
2012 (preliminary
data) 3,299 1,882 1,772 546 17% 31%
Not Enrolled in Free/Reduced Price Lunch Program
Enrolled at Any Minnesota College (Public or Private)
2006 48,674 28,272 27,012 6,917 14% 26%
2007 48,829 29,504 28,200 7,710 16% 27%
2008 49,354 29,767 28,383 7,865 16% 28%
2009 47,378 28,814 27,433 6,957 15% 25%
2010 45,715 27,493 26,228 6,608 14% 25%
2011 44,866 26,308 25,098 5,928 13% 24%
2012 (preliminary
data) 43,262 24,300 23,465 4,542 10% 19%
*Enrollment within two years of graduation for 2006-2011 graduates and within one year of graduation for 2012 graduates; data for 2012 graduates is considered preliminary and should not be used in trend analysis
72

Table 17: College Enrollment of Public High School Graduates by District Type and Schools Classification
Year of High
School Graduation
High School College Activity
Total Graduates Enrolled in College
Graduates At Any Time after High School Graduation by First College of
Enrollment
Within Two Years of High School Graduation by First
College of Enrollment
In a Fall Term within Two Years of High School
Graduation by First College of Enrollment
Total Graduates (column A)
Students (B)
Percent of High School Class
(C = B ÷ A)
Students (D)
Percent of High School Class
(E = D ÷ A)
Students (F)
Percent of High School Class
(G = F ÷ A)
Traditional High Schools Enrolled at Any College (National)
2006 52,950 44,278 84% 41,005 77% 39,014 74%
2007 53,230 45,948 86% 43,047 81% 40,988 77%
2008 53,686 46,511 87% 44,158 82% 42,066 78%
2009 52,164 45,261 87% 43,575 84% 41,488 80%
2010 51,969 44,563 86% 43,385 83% 41,327 80%
2011 51,686 43,216 84% 42,758 83% 40,826 79%
2012 (preliminary
data)
50,440 40,955 81% 40,955 81% 39,459 78%
Enrolled at Any Minnesota College (Public or Private)
2006 52,950 34,391 65% 31,876 60% 30,310 57%
2007 53,230 35,564 67% 33,325 63% 31,691 60%
2008 53,686 35,347 66% 33,536 62% 31,870 59%
2009 52,164 34,333 66% 33,068 63% 31,354 60%
2010 51,969 33,647 65% 32,742 63% 31,100 60%
2011 51,686 32,155 62% 31,806 62% 30,184 58%
2012 (preliminary
data) 50,440 29,871 59% 29,871 59% 28,662 57%
Charter Schools
Enrolled at Any College (National)
2006 954 638 67% 466 49% 404 42%
2007 1,205 842 70% 663 55% 575 48%
2008 1,462 991 68% 837 57% 737 50%
2009 1,496 1,055 71% 931 62% 807 54%
2010 1,608 1,078 67% 993 62% 858 53%
2011 1,674 1,030 62% 994 59% 863 52%
2012 (preliminary
data) 1,518 902 59% 902 59% 818 54%
Enrolled at Any Minnesota College (Public or Private)
2006 954 548 57% 400 42% 347 36%
2007 1,205 730 61% 577 48% 505 42%
2008 1,462 858 59% 717 49% 632 43%
2009 1,496 928 62% 815 54% 707 47%
2010 1,608 905 56% 831 52% 716 45%
2011 1,674 854 51% 822 49% 707 42%
2012 (preliminary
data) 1,518 742 49% 742 49% 665 44%
*Enrollment within two years of graduation for 2006-2011 graduates and within one year of graduation for 2012 graduates; data for 2012 graduates is considered preliminary and should not be used in trend analysis.
Minnesota Office of Higher Education 73
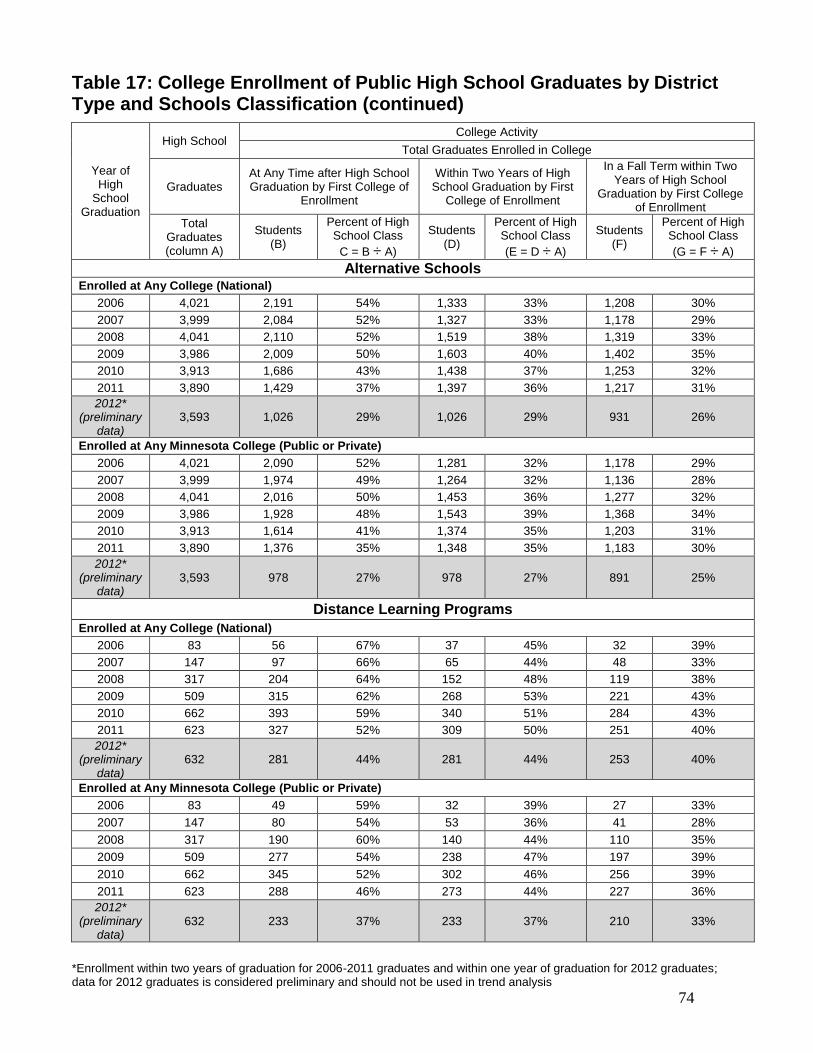
Table 17: College Enrollment of Public High School Graduates by District Type and Schools Classification (continued)
Year of High
School Graduation
High School College Activity
Total Graduates Enrolled in College
Graduates At Any Time after High School Graduation by First College of
Enrollment
Within Two Years of High School Graduation by First
College of Enrollment
In a Fall Term within Two Years of High School
Graduation by First College of Enrollment
Total Graduates (column A)
Students (B)
Percent of High School Class
C = B ÷ A)
Students (D)
Percent of High School Class
(E = D ÷ A)
Students (F)
Percent of High School Class
(G = F ÷ A)
Alternative Schools Enrolled at Any College (National)
2006 4,021 2,191 54% 1,333 33% 1,208 30%
2007 3,999 2,084 52% 1,327 33% 1,178 29%
2008 4,041 2,110 52% 1,519 38% 1,319 33%
2009 3,986 2,009 50% 1,603 40% 1,402 35%
2010 3,913 1,686 43% 1,438 37% 1,253 32%
2011 3,890 1,429 37% 1,397 36% 1,217 31%
2012* (preliminary
data) 3,593 1,026 29% 1,026 29% 931 26%
Enrolled at Any Minnesota College (Public or Private)
2006 4,021 2,090 52% 1,281 32% 1,178 29%
2007 3,999 1,974 49% 1,264 32% 1,136 28%
2008 4,041 2,016 50% 1,453 36% 1,277 32%
2009 3,986 1,928 48% 1,543 39% 1,368 34%
2010 3,913 1,614 41% 1,374 35% 1,203 31%
2011 3,890 1,376 35% 1,348 35% 1,183 30%
2012* (preliminary
data) 3,593 978 27% 978 27% 891 25%
Distance Learning Programs
Enrolled at Any College (National)
2006 83 56 67% 37 45% 32 39%
2007 147 97 66% 65 44% 48 33%
2008 317 204 64% 152 48% 119 38%
2009 509 315 62% 268 53% 221 43%
2010 662 393 59% 340 51% 284 43%
2011 623 327 52% 309 50% 251 40%
2012* (preliminary
data) 632 281 44% 281 44% 253 40%
Enrolled at Any Minnesota College (Public or Private)
2006 83 49 59% 32 39% 27 33%
2007 147 80 54% 53 36% 41 28%
2008 317 190 60% 140 44% 110 35%
2009 509 277 54% 238 47% 197 39%
2010 662 345 52% 302 46% 256 39%
2011 623 288 46% 273 44% 227 36%
2012* (preliminary
data) 632 233 37% 233 37% 210 33%
*Enrollment within two years of graduation for 2006-2011 graduates and within one year of graduation for 2012 graduates; data for 2012 graduates is considered preliminary and should not be used in trend analysis
74

Table 17: College Enrollment of Public High School Graduates by District Type and Schools Classification (continued)
Year of High
School Graduation
High School College Activity
Total Graduates Enrolled in College
Graduates At Any Time after High School Graduation by First College of
Enrollment
Within Two Years of High School Graduation by First
College of Enrollment
In a Fall Term within Two Years of High School
Graduation by First College of Enrollment
Total Graduates (column A)
Students (B)
Percent of High School Class
(C = B ÷ A)
Students (D)
Percent of High School Class
(E = D ÷ A)
Students (F)
Percent of High School Class
(G = F ÷ A)
Other Schools Enrolled at Any College (National)
2006 1,223 500 41% 347 28% 311 25%
2007 1,270 494 39% 354 28% 324 26%
2008 1,318 496 38% 376 29% 332 25%
2009 1,463 537 37% 444 30% 390 27%
2010 1,487 434 29% 388 26% 359 24%
2011 1,492 442 30% 434 29% 398 27%
2012* (preliminary
data) 1,435 313 22% 313 22% 285 20%
Enrolled at Any Minnesota College (Public or Private)
2006 1,223 407 33% 268 22% 244 20%
2007 1,270 424 33% 296 23% 271 21%
2008 1,318 395 30% 287 22% 257 19%
2009 1,463 448 31% 364 25% 317 22%
2010 1,487 374 25% 332 22% 304 20%
2011 1,492 373 25% 366 25% 332 22%
2012* (preliminary
data) 1,435 258 18% 258 18% 232 16%
*Enrollment within two years of graduation for 2006-2011 graduates and within one year of graduation for 2012 graduates; data for 2012 graduates is considered preliminary and should not be used in trend analysis.
Minnesota Office of Higher Education 75

Table 18: Developmental Education Course-taking of Public High School Graduates by District Type and Schools Classification
Year of High
School Graduation
High School
College Enrollment
Developmental Education Course-taking
Graduates Enrolled in Developmental Courses in 1st or 2nd Fall Term
Graduates
Within Two Years of High School Graduation by First College of
Enrollment
Within Two Years of High School
Graduation by First College of
Enrollment -- Fall Term Enrollees Only
by First College of Enrollment
Total Graduates (column A)
Number of Students
(B)
Number of Students (C)
Total Students
(D)
Percent of High School Class
(E = D ÷ A)
Percent of Fall Term Enrollees
(F = D ÷ C)
Traditional High Schools
Enrolled at Any Minnesota College (Public or Private)
2006 52,950 31,876 30,310 8,161 15% 27%
2007 53,230 33,325 31,691 9,145 17% 29%
2008 53,686 33,536 31,870 9,402 18% 30%
2009 52,164 33,068 31,354 8,583 16% 27%
2010 51,969 32,742 31,100 8,723 17% 28%
2011 51,686 31,806 30,184 8,132 16% 27%
2012* (preliminary
data) 50,440 29,871 28,662 6,461 13% 23%
Charter Schools
Enrolled at Any Minnesota College (Public or Private)
2006 954 400 347 128 13% 37%
2007 1,205 577 505 194 16% 38%
2008 1,462 717 632 272 19% 43%
2009 1,496 815 707 327 22% 46%
2010 1,608 831 716 315 20% 44%
2011 1,674 822 707 322 19% 46%
2012* (preliminary
data) 1,518 742 665 231 15% 35%
Alternative Schools
Enrolled at Any Minnesota College (Public or Private)
2006 4,021 1,281 1,178 496 12% 42%
2007 3,999 1,264 1,136 552 14% 49%
2008 4,041 1,453 1,277 576 14% 45%
2009 3,986 1,543 1,368 656 16% 48%
2010 3,913 1,374 1,203 625 16% 52%
2011 3,890 1,348 1,183 589 15% 50%
2012* (preliminary
data) 3,593 978 891 417 12% 47%
*Enrollment within two years of graduation for 2006-2011 graduates and within one year of graduation for 2012 graduates; data for 2012 graduates is considered preliminary and should not be used in trend analysis
76

Table 18: Developmental Education Course-taking of Public High School Graduates by District Type and Schools Classification (continued)
Year of High
School Graduation
High School
College Enrollment
Developmental Education Course-taking
Graduates Enrolled in Developmental Courses in 1st or 2nd Fall Term
Graduates
Within Two Years of High School Graduation by First College of
Enrollment
Within Two Years of High School
Graduation by First College of
Enrollment -- Fall Term Enrollees Only
by First College of Enrollment
Total Graduates (column A)
Number of Students
(B)
Number of Students (C)
Total Students
(D)
Percent of High School Class
(E = D ÷ A)
Percent of Fall Term Enrollees
(F = D ÷ C)
Distance Learning Programs
Enrolled at Any Minnesota College (Public or Private)
2006 83 32 27 12 14% 44%
2007 147 53 41 21 14% 51%
2008 317 140 110 38 12% 35%
2009 509 238 197 82 16% 42%
2010 662 302 256 106 16% 41%
2011 623 273 227 79 13% 35%
2012* (preliminary
data) 632 233 210 55 9% 26%
Other Schools
Enrolled at Any Minnesota College (Public or Private)
2006 1,223 268 244 76 6% 31%
2007 1,270 296 271 97 8% 36%
2008 1,318 287 257 85 6% 33%
2009 1,463 364 317 109 7% 34%
2010 1,487 332 304 120 8% 39%
2011 1,492 366 332 128 9% 39%
2012* (preliminary
data) 1,435 258 232 84 6% 36%
*Enrollment within two years of graduation for 2006-2011 graduates and within one year of graduation for 2012 graduates; data for 2012 graduates is considered preliminary and should not be used in trend analysis.
Minnesota Office of Higher Education 77

Table 19: College Enrollment of Public High School Graduates by Accountability Test Proficiency
Year of High
School Graduation
High School College Activity
Total Graduates Enrolled in College
Graduates At Any Time after High School Graduation by First College of
Enrollment
Within Two Years of High School Graduation by First
College of Enrollment
In a Fall Term within Two Years of High School
Graduation by First College of Enrollment
Total Graduates (column A)
Students (B)
Percent of High School Class
(C = B ÷ A)
Students (D)
Percent of High School Class
(E = D ÷ A)
Students (F)
Percent of High School Class
(G = F ÷ A)
Accountability Testing - Math Not Proficient Enrolled at Any College (National)
2006 Data not available
2007 34,692 28,752 83% 26,195 76% 24,580 71%
2008 36,277 29,132 80% 26,830 74% 25,034 69%
2009 34,947 27,571 79% 25,842 74% 24,039 69%
2010 31,696 23,462 74% 22,341 70% 20,681 65%
2011 30,929 21,504 70% 21,148 68% 19,584 63%
2012* (preliminary
data)
27,325 17,341 63% 17,341 63% 16,251 59%
Enrolled at Any Minnesota College (Public or Private)
2006 Data not available
2007 34,692 24,173 70% 22,016 63% 20,639 59%
2008 36,277 24,272 67% 22,307 61% 20,815 57%
2009 34,947 23,100 66% 21,647 62% 20,101 58%
2010 31,696 19,865 63% 18,911 60% 17,492 55%
2011 30,929 18,026 58% 17,730 57% 16,344 53%
2012* (preliminary
data) 27,325 14,427 53% 14,427 53% 13,490 49%
Accountability Testing - Math Proficient Enrolled at Any College (National)
2006 Data Not Available
2007 18,050 17,138 95% 16,639 92% 16,210 90%
2008 19,627 18,704 95% 18,205 93% 17,770 91%
2009 20,798 19,667 95% 19,275 93% 18,786 90%
2010 25,751 23,884 93% 23,493 91% 22,808 89%
2011 26,971 24,418 91% 24,239 90% 23,550 87%
2012* (preliminary
data) 29,223 25,769 88% 25,769 88% 25,164 86%
Enrolled at Any Minnesota College (Public or Private)
2006 Data Not Available
2007 18,050 11,539 64% 11,249 62% 10,990 61%
2008 19,627 12,454 63% 12,153 62% 11,833 60%
2009 20,798 13,204 63% 12,962 62% 12,598 61%
2010 25,751 16,366 64% 16,089 62% 15,599 61%
2011 26,971 16,615 62% 16,494 61% 15,955 59%
2012* (preliminary
data) 29,223 17,390 60% 17,390 60% 16,926 58%
*Enrollment within two years of graduation for 2006-2011 graduates and within one year of graduation for 2012 graduates; data for 2012 graduates is considered preliminary and should not be used in trend analysis
78
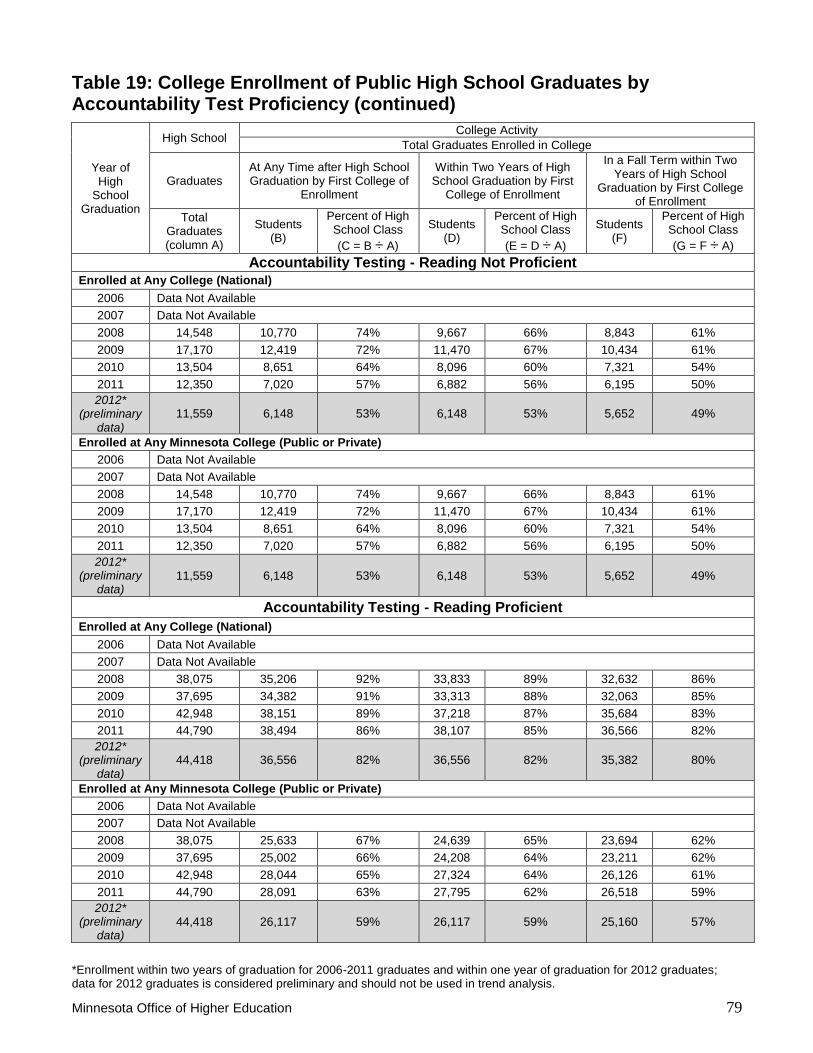
Table 19: College Enrollment of Public High School Graduates by Accountability Test Proficiency (continued)
Year of High
School Graduation
High School College Activity
Total Graduates Enrolled in College
Graduates At Any Time after High School Graduation by First College of
Enrollment
Within Two Years of High School Graduation by First
College of Enrollment
In a Fall Term within Two Years of High School
Graduation by First College of Enrollment
Total Graduates (column A)
Students (B)
Percent of High School Class
(C = B ÷ A)
Students (D)
Percent of High School Class
(E = D ÷ A)
Students (F)
Percent of High School Class
(G = F ÷ A)
Accountability Testing - Reading Not Proficient Enrolled at Any College (National)
2006 Data Not Available
2007 Data Not Available
2008 14,548 10,770 74% 9,667 66% 8,843 61%
2009 17,170 12,419 72% 11,470 67% 10,434 61%
2010 13,504 8,651 64% 8,096 60% 7,321 54%
2011 12,350 7,020 57% 6,882 56% 6,195 50%
2012* (preliminary
data)
11,559 6,148 53% 6,148 53% 5,652 49%
Enrolled at Any Minnesota College (Public or Private)
2006 Data Not Available
2007 Data Not Available
2008 14,548 10,770 74% 9,667 66% 8,843 61%
2009 17,170 12,419 72% 11,470 67% 10,434 61%
2010 13,504 8,651 64% 8,096 60% 7,321 54%
2011 12,350 7,020 57% 6,882 56% 6,195 50%
2012* (preliminary
data) 11,559 6,148 53% 6,148 53% 5,652 49%
Accountability Testing - Reading Proficient
Enrolled at Any College (National)
2006 Data Not Available
2007 Data Not Available
2008 38,075 35,206 92% 33,833 89% 32,632 86%
2009 37,695 34,382 91% 33,313 88% 32,063 85%
2010 42,948 38,151 89% 37,218 87% 35,684 83%
2011 44,790 38,494 86% 38,107 85% 36,566 82%
2012* (preliminary
data) 44,418 36,556 82% 36,556 82% 35,382 80%
Enrolled at Any Minnesota College (Public or Private)
2006 Data Not Available
2007 Data Not Available
2008 38,075 25,633 67% 24,639 65% 23,694 62%
2009 37,695 25,002 66% 24,208 64% 23,211 62%
2010 42,948 28,044 65% 27,324 64% 26,126 61%
2011 44,790 28,091 63% 27,795 62% 26,518 59%
2012* (preliminary
data) 44,418 26,117 59% 26,117 59% 25,160 57%
*Enrollment within two years of graduation for 2006-2011 graduates and within one year of graduation for 2012 graduates; data for 2012 graduates is considered preliminary and should not be used in trend analysis.
Minnesota Office of Higher Education 79

Table 20: Developmental Education Course-taking of Public High School Graduates by Accountability Test Proficiency
Year of High
School Graduation
High School
College Enrollment
Developmental Education Course-taking
Graduates Enrolled in Developmental Courses in 1st or 2nd Fall Term
Graduates
Within Two Years of High School Graduation by First College of
Enrollment
Within Two Years of High School
Graduation by First College of
Enrollment -- Fall Term Enrollees Only
by First College of Enrollment
Total Graduates (column A)
Number of Students
(B)
Number of Students (C)
Total Students
(D)
Percent of High School Class
(E = D ÷ A)
Percent of Fall Term Enrollees
(F = D ÷ C)
Accountability Testing - Math Not Proficient
Enrolled at Any Minnesota College (Public or Private)
2006 Data Not Available
2007 34,692 22,016 20,639 8,387 24% 41%
2008 36,277 22,307 20,815 8,803 24% 42%
2009 34,947 21,647 20,101 8,367 24% 42%
2010 31,696 18,911 17,492 8,237 26% 47%
2011 30,929 17,730 16,344 7,695 25% 47%
2012* (preliminary
data) 27,325 14,427 13,490 5,705 21% 42%
Accountability Testing - Math Proficient
Enrolled at Any Minnesota College (Public or Private)
2006 Data Not Available
2007 18,050 11,249 10,990 848 5% 8%
2008 19,627 12,153 11,833 1,012 5% 9%
2009 20,798 12,962 12,598 924 4% 7%
2010 25,751 16,089 15,599 1,425 6% 9%
2011 26,971 16,494 15,955 1,403 5% 9%
2012* (preliminary
data) 29,223 17,390 16,926 1,479 5% 9%
*Enrollment within two years of graduation for 2006-2011 graduates and within one year of graduation for 2012 graduates; data for 2012 graduates is considered preliminary and should not be used in trend analysis
80

Table 20: Developmental Education Course-taking of Public High School Graduates by Accountability Test Proficiency (continued)
Year of High
School Graduation
High School
College Enrollment
Developmental Education Course-taking
Graduates Enrolled in Developmental Courses in 1st or 2nd Fall Term
Graduates
Within Two Years of High School Graduation by First College of
Enrollment
Within Two Years of High School
Graduation by First College of
Enrollment -- Fall Term Enrollees Only
by First College of Enrollment
Total Graduates (column A)
Number of Students
(B)
Number of Students (C)
Total Students
(D)
Percent of High School Class
(E = D ÷ A)
Percent of Fall Term Enrollees
(F = D ÷ C)
Accountability Testing - Reading Not Proficient
Enrolled at Any Minnesota College (Public or Private)
2006 Data Not Available
2007 Data Not Available
2008 14,548 8,413 7,732 4,081 28% 53%
2009 17,170 10,129 9,222 4,749 28% 51%
2010 13,504 7,265 6,581 4,058 30% 62%
2011 12,350 6,137 5,511 3,406 28% 62%
2012* (preliminary
data) 11,559 5,402 4,978 2,753 24% 55%
Accountability Testing - Reading Proficient
Enrolled at Any Minnesota College (Public or Private)
2006 Data Not Available
2007 Data Not Available
2008 38,075 24,639 23,694 5,065 13% 21%
2009 37,695 24,208 23,211 4,334 11% 19%
2010 42,948 27,324 26,126 5,456 13% 21%
2011 44,790 27,795 26,518 5,579 12% 21%
2012* (preliminary
data) 44,418 26,117 25,160 4,308 10% 17%
*Enrollment within two years of graduation for 2006-2011 graduates and within one year of graduation for 2012 graduates; data for 2012 graduates is considered preliminary and should not be used in trend analysis.
Minnesota Office of Higher Education 81

Table 21: ACT Composite Scores
2007-2012 Minnesota Public High School Graduates Enrolled in Higher Education within 2 Years after Graduation
Year of High School Graduation
Minnesota Public Two-Year Colleges
Minnesota State Universities
University of Minnesota
Minnesota Private Not-For-Profit
Colleges
Minnesota Private For-Profit Colleges
Out-of-State Colleges
Number of Valid Scores (column
A)
Mean Scores
(B)
Number of Valid Scores
(C)
Mean Scores
(D)
Number of Valid Scores
(E)
Mean Scores
(F)
Number of Valid Scores
(G)
Mean Scores
(H)
Number of Valid Scores
(I)
Mean Scores
(J)
Number of Valid Scores
(K)
Mean Scores
(L)
2007
All Graduates Enrolled as Students 7,501 19.6 6,009 21.6 5,129 24.8 5,361 24.1 643 19.3 8,931 24.3
Graduates Not in Developmental Courses 3,719 20.9 4,462 22.3 4,969 24.9 5,205 24.3 523 19.8 N/A N/A
Graduates in Developmental Courses 3,782 18.3 1,547 19.7 160 19.7 156 18.4 120 17.3 N/A N/A
2008
All Graduates Enrolled as Students 7,708 19.7 6,017 21.7 5,081 25.0 5,262 24.3 790 19.6 9,731 24.4
Graduates Not in Developmental Courses 3,724 21.2 4,600 22.4 4,951 25.1 5,090 24.5 647 19.9 N/A N/A
Graduates in Developmental Courses 3,984 18.3 1,417 19.5 130 19.6 172 18.5 143 18.1 N/A N/A
2009
All Graduates Enrolled as Students 7,708 19.6 6,092 21.7 5,242 25.2 5,298 24.3 756 19.3 9,789 24.5
Graduates Not in Developmental Courses 3,871 21.0 4,883 22.3 5,109 25.4 5,171 24.5 634 19.7 N/A N/A
Graduates in Developmental Courses 3,837 18.2 1,209 19.0 133 20.2 127 18.5 122 17.7 N/A N/A
2010
All Graduates Enrolled as Students 7,331 19.7 6,084 21.7 5,483 25.3 5,151 24.4 749 19.7 9,634 24.4
Graduates Not in Developmental Courses 3,655 21.3 4,928 22.4 5,381 25.4 5,034 24.5 651 20.0 N/A N/A
Graduates in Developmental Courses 3,676 18.0 1,156 18.7 102 19.3 117 18.3 98 17.6 N/A N/A
2011
All Graduates Enrolled as Students 7,552 19.7 5,966 21.7 5,246 25.5 5,201 24.5 578 19.7 9,981 24.5
Graduates Not in Developmental Courses 3,943 21.4 4,933 22.4 5,149 25.6 5,073 24.6 503 20.1 N/A N/A
Graduates in Developmental Courses 3,609 17.9 1,033 18.6 97 19.9 128 18.4 75 17.3 N/A N/A
2012* (preliminary data)
All Graduates Enrolled as Students 7,422 19.6 5,749 21.7 5,096 25.8 4,945 24.5 400 20.3 10,130 24.3
Graduates Not in Developmental Courses 4,239 20.9 4,950 22.3 5,000 25.9 4,915 24.5 361 20.5 N/A N/A
Graduates in Developmental Courses 3,183 17.8 799 18.3 96 19.7 30 17.0 39 18.3 N/A N/A
*Enrollment within two years of graduation for 2006-2011 graduates and within one year of graduation for 2012 graduates; data for 2012 graduates is considered
preliminary and should not be used in trend analysis 82

Table 22: Persistence of High School Graduates by Developmental Education Status
2006-2011 Minnesota Public High School Graduates Enrolled in Higher Education in 1st or 2nd Fall Term after High School Graduation
Year of High School Graduation
First to Second Year Persistence
Minnesota Public Two-Year Colleges
Minnesota State Universities
University of Minnesota
Minnesota Private Not-For-Profit Colleges
Minnesota Private For-Profit Colleges
Number of Students
Enrolling in First Year (column A)
Percent of Students Enrolling
in Second Year (B)
Number of Students Enrolling in First Year (C)
Percent of
Students Enrolling
in Second Year (D)
Number of
Students Enrolling in First Year (E)
Percent of Students Enrolling in Second
Year (F)
Number of Students Enrolling in First Year (G)
Percent of
Students Enrolling
in Second Year (H)
Number of
Students Enrolling in First Year
(I)
Percent of Students
Enrolling in Second
Year (J)
2005
Graduates not in Developmental Courses 7,673 64% 4,343 87% 4,709 92% 5,354 92% 1,506 48%
Graduates in Developmental Courses 6,302 65% 1,541 88% 355 86% 83 93% 190 70%
2006
Graduates not in Developmental Courses 8,574 69% 4,309 92% 5,048 96% 5,471 95% 1,582 44%
Graduates in Developmental Courses 6,789 74% 1,409 92% 261 93% 114 96% 300 71%
2007
Graduates not in Developmental Courses 8,341 69% 4,744 92% 5,242 96% 5,641 95% 1,538 50%
Graduates in Developmental Courses 7,603 73% 1,657 93% 171 94% 186 85% 392 71%
2008
Graduates not in Developmental Courses 8,289 70% 4,940 92% 5,233 97% 5,588 96% 1,710 58%
Graduates in Developmental Courses 8,057 76% 1,545 94% 140 98% 207 89% 424 68%
2009
Graduates not in Developmental Courses 8,705 67% 5,098 92% 5,351 97% 5,550 96% 1,567 57%
Graduates in Developmental Courses 7,766 74% 1,304 93% 142 98% 158 92% 387 60%
2010
Graduates not in Developmental Courses 7,770 66% 5,219 91% 5,674 96% 5,492 95% 1,537 53%
Graduates in Developmental Courses 8,099 72% 1,267 91% 111 87% 145 91% 267 64%
2011
Graduates not in Developmental Courses 7,891 64% 5,224 89% 5,427 96% 5,501 95% 1,322 57%
Graduates in Developmental Courses 7,667 68% 1,109 91% 105 96% 161 88% 208 61%
Minnesota Office of Higher Education 83

![Report Title - Minnesota Department of Transportation ... · Web viewFINAL REPORT Prepared by: [Example: Author #1 Author #2Department of Civil EngineeringUniversity of Minnesota]](https://img.pdfslide.us/doc/110x75/5acdaeba7f8b9a63398e641e/report-title-minnesota-department-of-transportation-viewfinal-report-prepared.jpg)