Embed Size (px)
Citation preview

HOW HOSPITALS CAN IMPROVE THE QUALITY OF CARE AND SAVE MONEY
Getting it Right First Time (GIRFT)Lessons to be Learnt
The Kings Fund London June 22nd 2016 Professor Tim Briggs
Consultant Orthopaedic Surgeon RNOHT
National Director Clinical Quality and Efficiency NHS
Past President of the BOA
GETTING IT RIGHT FIRST TIMEImproving the Quality of Orthopaedic Care within the National Health Service in England
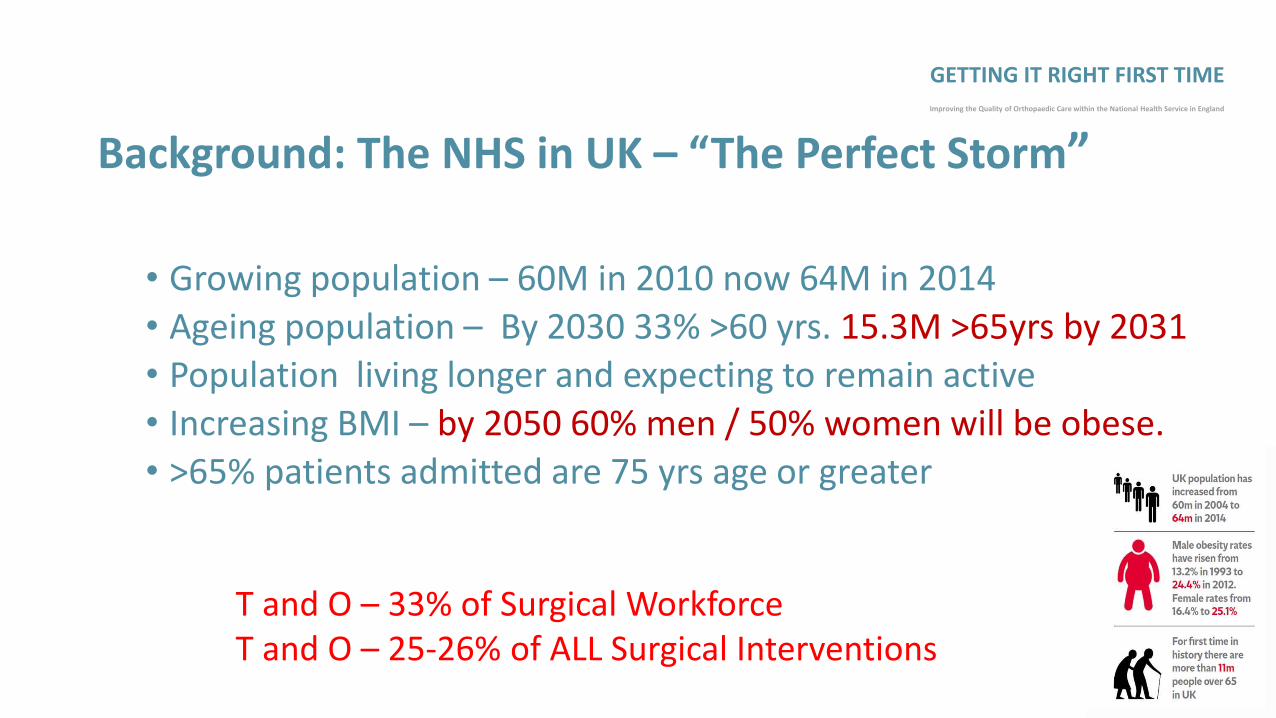
Background: The NHS in UK – “The Perfect Storm”
• Growing population – 60M in 2010 now 64M in 2014
• Ageing population – By 2030 33% >60 yrs. 15.3M >65yrs by 2031• Population living longer and expecting to remain active
• Increasing BMI – by 2050 60% men / 50% women will be obese.
• >65% patients admitted are 75 yrs age or greater
GETTING IT RIGHT FIRST TIMEImproving the Quality of Orthopaedic Care within the National Health Service in England
T and O – 33% of Surgical Workforce T and O – 25-26% of ALL Surgical Interventions

Want to Remain Active
By 2031 – 15.3M >65yrs
GETTING IT RIGHT FIRST TIMEImproving the Quality of Orthopaedic Care within the National Health Service in England

12th NJR Annual Report - 2015
• Hip Revisions:• 2009 2014 – 7,478 8,925
• 19.4% increase• 2004 2014 – 2,698 8,925
• 231% increase• Knee Revisions:• 2009 2014 – 4,780 5,873
• 22.9% increase• 2004 2014 – 1,221 5,873
• 381% increase
THR/TKR47,000 in 2004181,000 in 2013
>200,000 in 2014
Each increasing by over 7% annually
GETTING IT RIGHT FIRST TIMEImproving the Quality of Orthopaedic Care within the National Health Service in England

World Debt – 29th April 2016
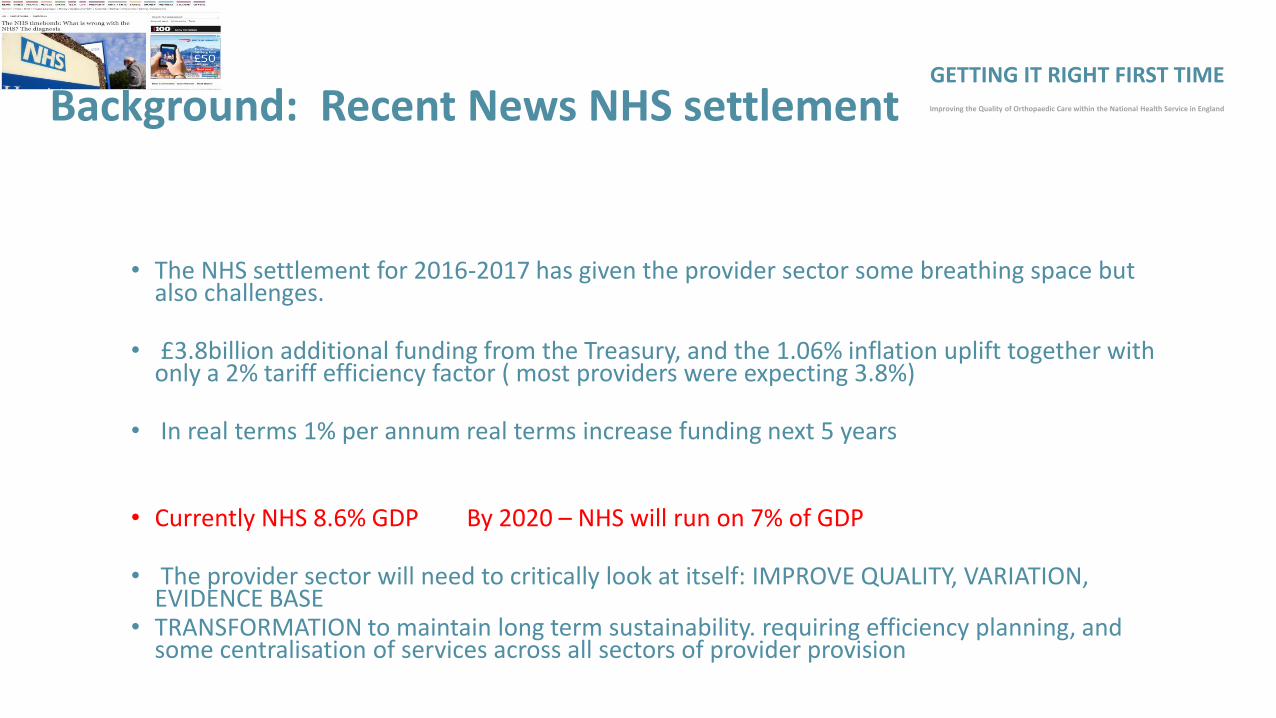
Background: Recent News NHS settlement
• The NHS settlement for 2016-2017 has given the provider sector some breathing space but also challenges.
• £3.8billion additional funding from the Treasury, and the 1.06% inflation uplift together with only a 2% tariff efficiency factor ( most providers were expecting 3.8%)
• In real terms 1% per annum real terms increase funding next 5 years
• Currently NHS 8.6% GDP By 2020 – NHS will run on 7% of GDP
• The provider sector will need to critically look at itself: IMPROVE QUALITY, VARIATION, EVIDENCE BASE
• TRANSFORMATION to maintain long term sustainability. requiring efficiency planning, and some centralisation of services across all sectors of provider provision
GETTING IT RIGHT FIRST TIMEImproving the Quality of Orthopaedic Care within the National Health Service in England

In reality…The NHS will be underfunded by Billions
Procedures of low clinical value
Dr. Foster Annual Report
The pressure is on GPs NOT to refer increasing numbers of patients for Orthopaedic careNew Devon CCG deficit of £14.5 Million last yearNew criteria “Urgent and Necessary measures”Aim: Balance the books
* Requiring patients with a BMI over 35 to lose 5% of their weight or to get under BMI 35 before planned surgery* Requiring patients to stop smoking for at least eight weeks
before planned surgery* Suspension of some types of shoulder surgery
This will dominate the health agendaCCGs don’t know what they are buying
We need to find another wayClinically led!!
CCGs under significant financial pressure
Demand Management – RationingDe-commission services
GETTING IT RIGHT FIRST TIMEImproving the Quality of Orthopaedic Care within the National Health Service in England

Professional responsibility – by clinicians in hospitals
GETTING IT RIGHT FIRST TIMEImproving the Quality of Orthopaedic Care within the National Health Service in England
Disproportionate DisadvantageEach £1M savings = 200 Joint Replacement

London• Annual Health Budget £16 Billion• £1 Billion into primary care• £2 Billion into Mental Health• £13 Billion spent in HOSPITALS (Providers)
• Provision of Care is 70- 80% of the cost
• We as Clinicians need to make the changes to our practice
GETTING IT RIGHT FIRST TIMEImproving the Quality of Orthopaedic Care within the National Health Service in England
Provision of Care is the Key

How do we justify this?
Grade 1V OA right HipAge at primary implantation- 65 years
Cost of Implant - £3500-£4,000Cost of bearing/cup - £1300+£5,000
Vertical cupASR bearing
GETTING IT RIGHT FIRST TIMEImproving the Quality of Orthopaedic Care within the National Health Service in England
Our Acetabular cup ofChoice is Tantalum for all !!!!

Knee Arthroplasty
• Unicondylar Knee
48 yrs age FWalking 15metres
Med uni 3 yrs agoX2 rev fixed bearing
Med uni 1yr ago
Revision Rates at 7 yrs
PFR - > 20%UNI >16%TKR 3.81%

GIRFT Objectives - Peer to Peer and Clinically led
• Supporting the following in elective orthopaedic care:• Improved patient experience - Quality• Re-empowering clinicians• Improved patient safety• Better outcomes in terms of joint longevity, infection – SSI and
acquired, complications, readmissions and mortality• Significant taxpayer savings from reduced complications; infections;
readmissions; length of stay and litigation; better directed care pathways; reduction in loan kit costs; and introduction of evidence based procurement and procedure selection.
• Grant £200,000 from SoS and MD NHS England
GETTING IT RIGHT FIRST TIMEImproving the Quality of Orthopaedic Care within the National Health Service in England
Published in 2012

Data sources – 12 sets of data collected for each trust• Data accumulation and collation is complete
• A comprehensive orthopaedic dashboard has been created for each provider. Data sources include: • NJR (disappointingly not all data is available by provider – e.g. Longevity/revision rate by different
prosthesis/weight bearing surface etc)• HES• HSCIC• NHS Comparators• NHS Indicators• Productivity Metrics• PROMS• National data sources – waiting times etc• National Hip Fracture Database• NHS Litigation Authority• NHS Atlas of Variation • Arthritis Research UK Musculoskeletal Calculator
UNIQUE Data Set For Each Trust
Visits started in SeptemberPeer to Peer reviewTrust receives data 14 -21 days before visitWe want to understand the data
GETTING IT RIGHT FIRST TIMEImproving the Quality of Orthopaedic Care within the National Health Service in England

• Project began in May ‘13 Report published March 2015
• Over 98% of all trusts visited, voluntary - one refusal only
• >130 GIRFT visits 211 hospitals completed
• Team have travelled 18,000+ miles, met 1708 surgeons, met 435 managers,
GETTING IT RIGHT FIRST TIMEImproving the Quality of Orthopaedic Care within the National Health Service in England
Progress to Date - England
Wales, NI and Scotland Also Reviewed

Emerging Themes -Surgical site infections – 10 Trusts in same City
GETTING IT RIGHT FIRST TIMEImproving the Quality of Orthopaedic Care within the National Health Service in England
Nos of Orthopaedic processes reported
% with infections –initial patient spell
% with infections – initial patient spell+ readmission
Trust 1 349 1.43% 1.43%
Trust 2 116 1.72% 1.72%
Trust 3 809 1.11% 2.47%
Trust 4 685 0.58% 0.73%
Trust 5 156 3.85% 4.49%
Trust 6 2657 0.68% 1.05%
Trust 7 454 0.00% 0.22%
Trust 8 544 1.47% 2.21%
Trust 9 -- -- --
Trust 10 521 0.00% 0.19%
0.19% - 4.49%
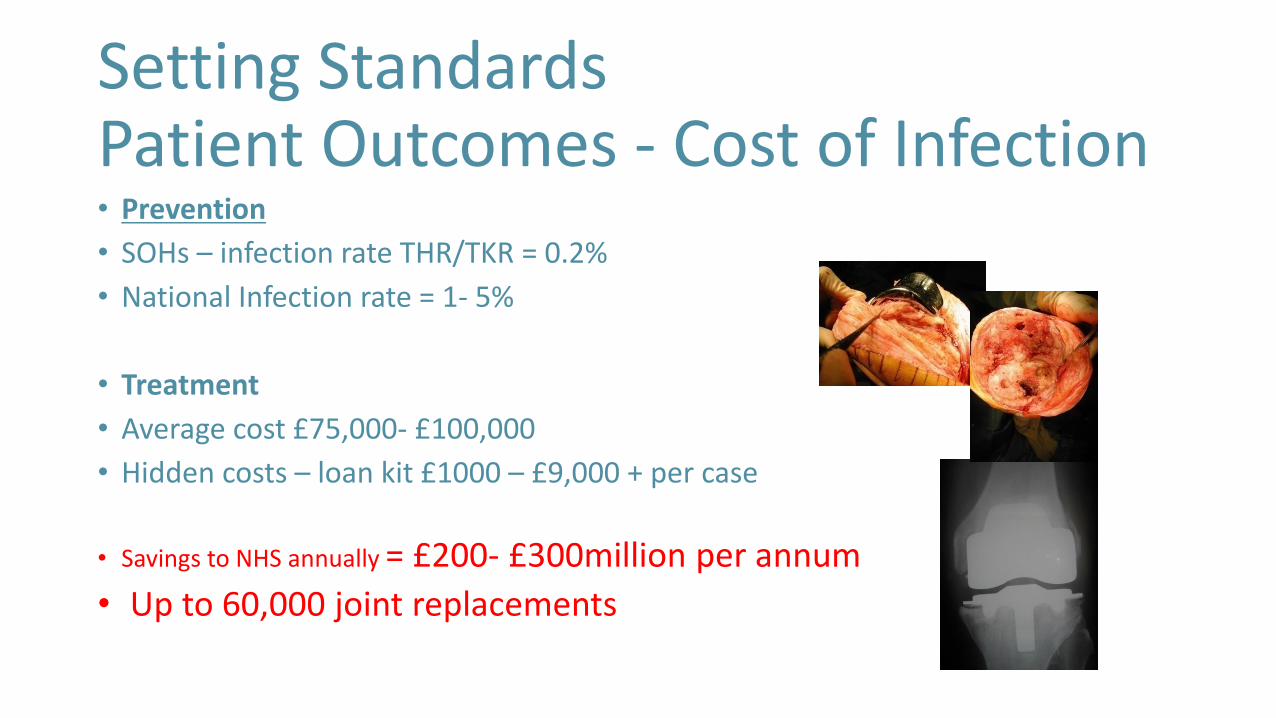
Setting Standards Patient Outcomes - Cost of Infection• Prevention
• SOHs – infection rate THR/TKR = 0.2%
• National Infection rate = 1- 5%
• Treatment
• Average cost £75,000- £100,000
• Hidden costs – loan kit £1000 – £9,000 + per case
• Savings to NHS annually = £200- £300million per annum
• Up to 60,000 joint replacements
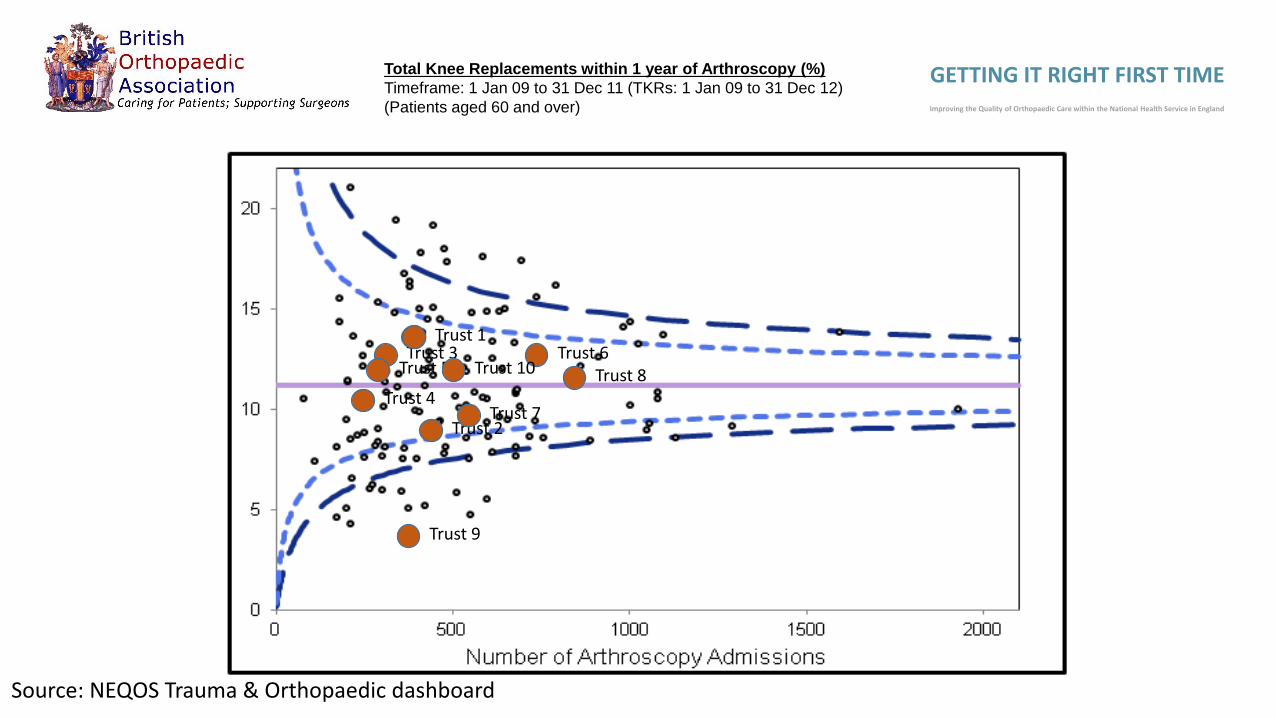
Source: NEQOS Trauma & Orthopaedic dashboard
Total Knee Replacements within 1 year of Arthroscopy (%)
Timeframe: 1 Jan 09 to 31 Dec 11 (TKRs: 1 Jan 09 to 31 Dec 12)
(Patients aged 60 and over)
Trust 2
Trust 3
Trust 4
Trust 5Trust 6
Trust 7
Trust 8
Trust 9
Trust 10
Trust 1
GETTING IT RIGHT FIRST TIMEImproving the Quality of Orthopaedic Care within the National Health Service in England

GETTING IT RIGHT FIRST TIMEImproving the Quality of Orthopaedic Care within the National Health Service in EnglandWhy The Difference ?

Low Volumes -Hip – 12 month surgeon profile(205 hospitals)
GETTING IT RIGHT FIRST TIMEImproving the Quality of Orthopaedic Care within the National Health Service in England
CategoryTotal
Operations*Total
Surgeons Average*National Average
Nos of surgeons
conducting <6 (%)
Nos of surgeons
conducting <11 (%)
Hip Primary 69,057 1,336 52 51 220 (16%) 327 (24%)
Hip Revision 10,107 735 14 12 340 (46%) 450 (61%)
Source: NHS Choices website, 2012 data.
Note: Not all consultants have consented to releasing this data. If this is the case for the Trust, then the values above may under-represent the true values for the
Trust. A full listing of the consultants who have not consented, and their reasons for doing so can be found at the NHS Choices website.
* To create totals those with a note of <5 are counted as 5, this may impact on the average number per surgeon, the notes section will be used to identify when this
has occurred.
Low Volumes – Loan kit costs, high cost implants
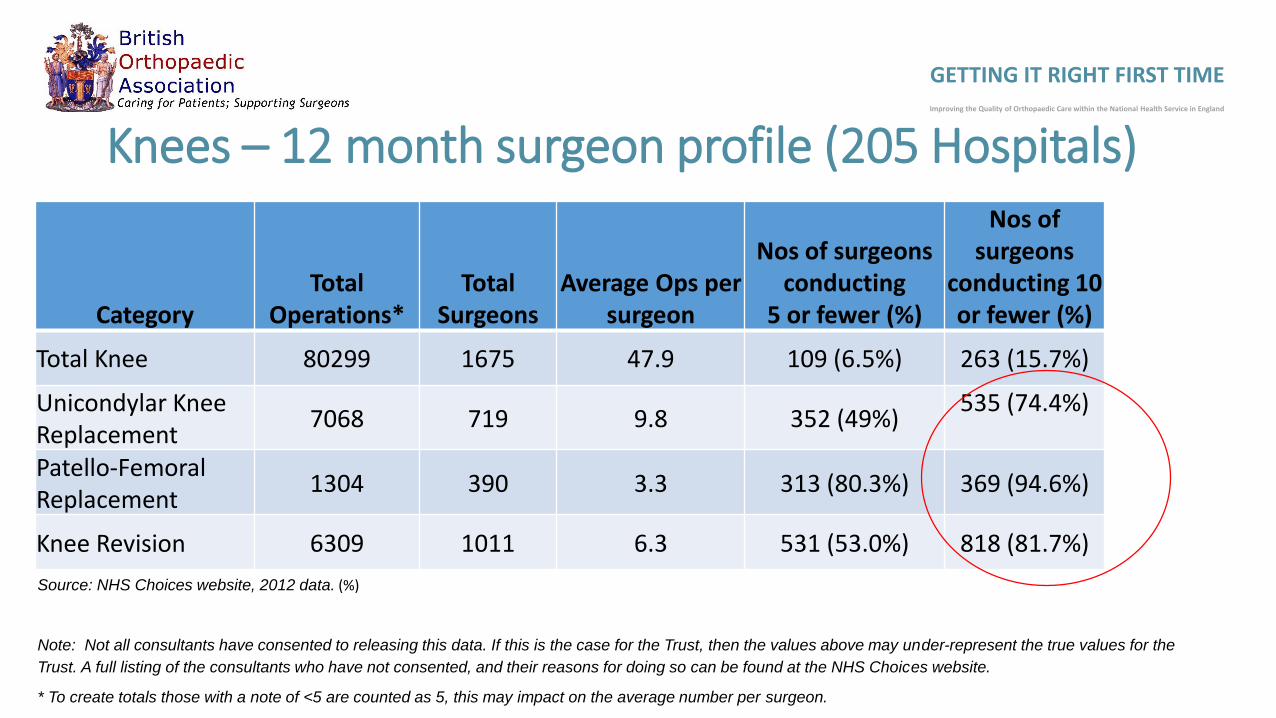
Knees – 12 month surgeon profile (205 Hospitals)
GETTING IT RIGHT FIRST TIMEImproving the Quality of Orthopaedic Care within the National Health Service in England
CategoryTotal
Operations*Total
Surgeons Average Ops per
surgeon
Nos of surgeons conducting
5 or fewer (%)
Nos of surgeons
conducting 10 or fewer (%)
Total Knee 80299 1675 47.9 109 (6.5%) 263 (15.7%)
Unicondylar Knee Replacement
7068 719 9.8 352 (49%)535 (74.4%)
Patello-Femoral Replacement
1304 390 3.3 313 (80.3%) 369 (94.6%)
Knee Revision 6309 1011 6.3 531 (53.0%) 818 (81.7%)
Source: NHS Choices website, 2012 data. (%)
Note: Not all consultants have consented to releasing this data. If this is the case for the Trust, then the values above may under-represent the true values for the
Trust. A full listing of the consultants who have not consented, and their reasons for doing so can be found at the NHS Choices website.
* To create totals those with a note of <5 are counted as 5, this may impact on the average number per surgeon.

Low volumes of specialist activity• Average 21 shoulder replacements per
trust (increased by 8 higher volume specialist centres) Usually 6 at most centres
• Average 4 elbow replacements (increased by 11 higher volume centres)
• Average 4 ankle replacements (increased by 11 higher volume specialist centres –generally less than 2 at most trusts)
• Average 59 spinal fusions (increased by 15 higher volume specialist centres).
GETTING IT RIGHT FIRST TIMEImproving the Quality of Orthopaedic Care within the National Health Service in England
6
1
2
31
1
32
Example - Elbow replacements and revision across trusts in Manchester
Trust 1
Trust 2
Trust 3
Trust 4
Trust 5
Trust 6
Trust 7
Trust 8
Trust 9
Trust 10
46 elbow replacements
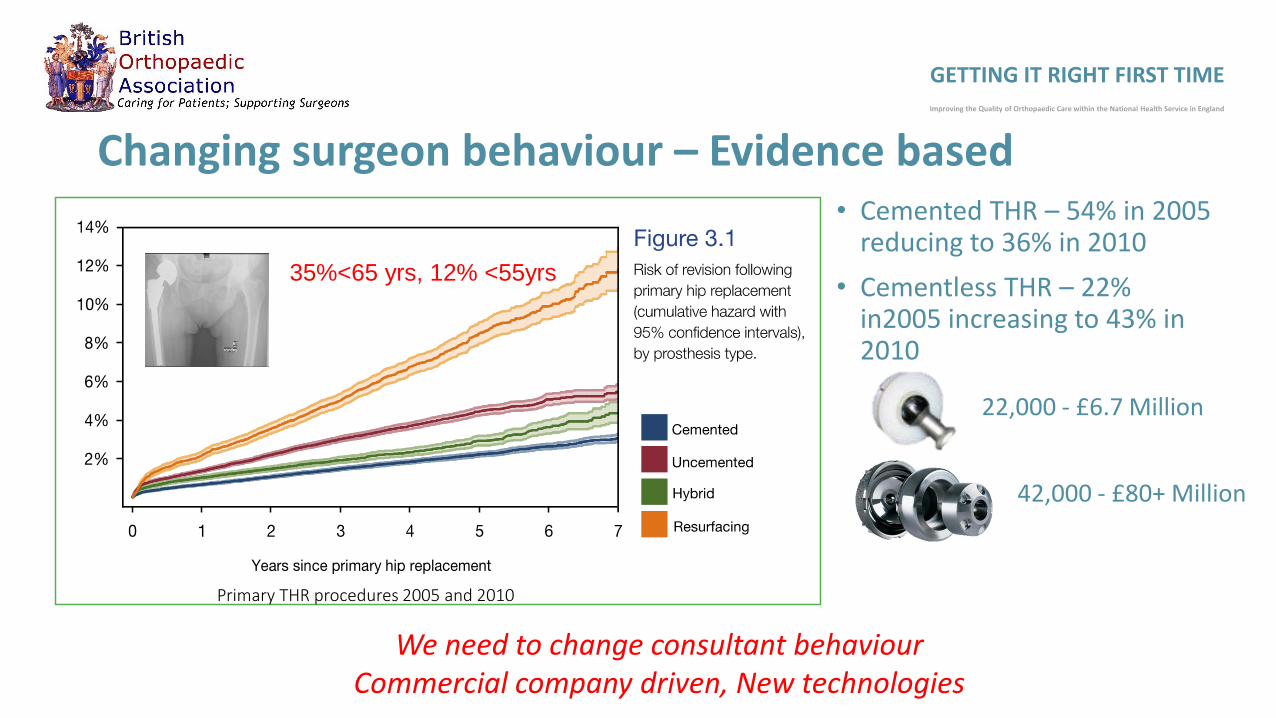
Changing surgeon behaviour – Evidence based• Cemented THR – 54% in 2005
reducing to 36% in 2010
• Cementless THR – 22% in2005 increasing to 43% in 2010
GETTING IT RIGHT FIRST TIMEImproving the Quality of Orthopaedic Care within the National Health Service in England
35%<65 yrs, 12% <55yrs
Primary THR procedures 2005 and 2010
22,000 - £6.7 Million
42,000 - £80+ Million
We need to change consultant behaviourCommercial company driven, New technologies

Is there a need for more robust national guidance on cement?
GETTING IT RIGHT FIRST TIMEImproving the Quality of Orthopaedic Care within the National Health Service in England
0%
10%
20%
30%
40%
50%
60%
70%
80%
90%
100%
Harrogate and District NHSFoundation Trust
England
0%
10%
20%
30%
40%
50%
60%
70%
80%
90%
100%
Epsom and St HelierUniversity Hospitals NHS
Trust
England
0%
10%
20%
30%
40%
50%
60%
70%
80%
90%
100%
Cemented vs Uncemented across Manchester
Cemented Uncemented0%
10%
20%
30%
40%
50%
60%
70%
80%
90%
100%
The Hillingdon HospitalsNHS Foundation Trust
England
0%
10%
20%
30%
40%
50%
60%
70%
80%
90%
100%
Lancashire TeachingHospitals NHS Foundation
Trust
England
NB – not part of confidential NJR dataset

Measuring Outcomes - NJR• Scrutiny of practice
Funnel plot for hips>45 trusts above 95%
Funnel plot for knees>48 trusts above 95%
Must have level playing field
RNOHT REVISION RATE AT FIVE YEARSTHR - 0.64% (2.14%)TKR – 0.55% ( 2.37%)
GETTING IT RIGHT FIRST TIMEImproving the Quality of Orthopaedic Care within the National Health Service in England

Country Borough of Teeside(red line indicates boundary)
North Tees Hospital Catchment Population 226,798
South Tees Hospital Catchment Population 523,256
GETTING IT RIGHT FIRST TIMEImproving the Quality of Orthopaedic Care within the National Health Service in England
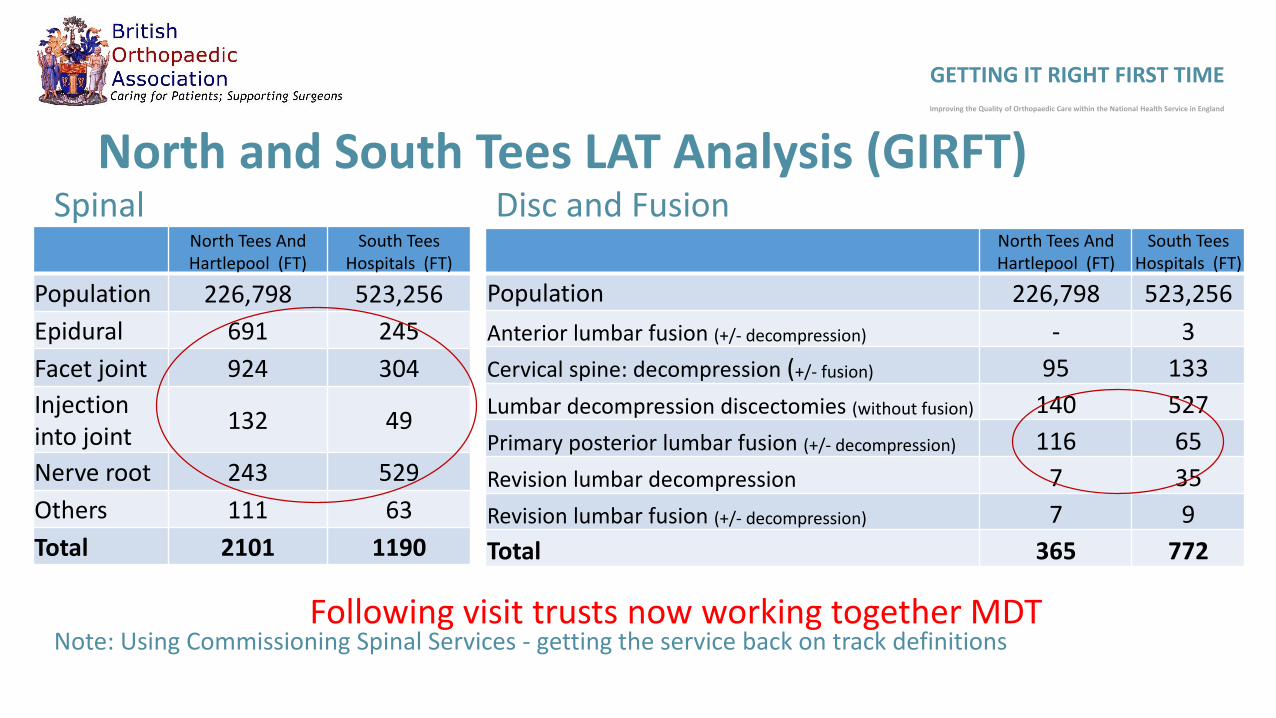
North and South Tees LAT Analysis (GIRFT)
North Tees And Hartlepool (FT)
South Tees Hospitals (FT)
Population 226,798 523,256
Epidural 691 245
Facet joint 924 304
Injection into joint
132 49
Nerve root 243 529
Others 111 63
Total 2101 1190
SpinalNorth Tees And Hartlepool (FT)
South Tees Hospitals (FT)
Population 226,798 523,256
Anterior lumbar fusion (+/- decompression) - 3
Cervical spine: decompression (+/- fusion) 95 133
Lumbar decompression discectomies (without fusion) 140 527
Primary posterior lumbar fusion (+/- decompression) 116 65
Revision lumbar decompression 7 35
Revision lumbar fusion (+/- decompression) 7 9
Total 365 772
Disc and Fusion
Note: Using Commissioning Spinal Services - getting the service back on track definitionsFollowing visit trusts now working together MDT
GETTING IT RIGHT FIRST TIMEImproving the Quality of Orthopaedic Care within the National Health Service in England
0
500
1,000
1,500
2,000
2,500
3,000
3,500
4,000
4,500
Vo
lum
e
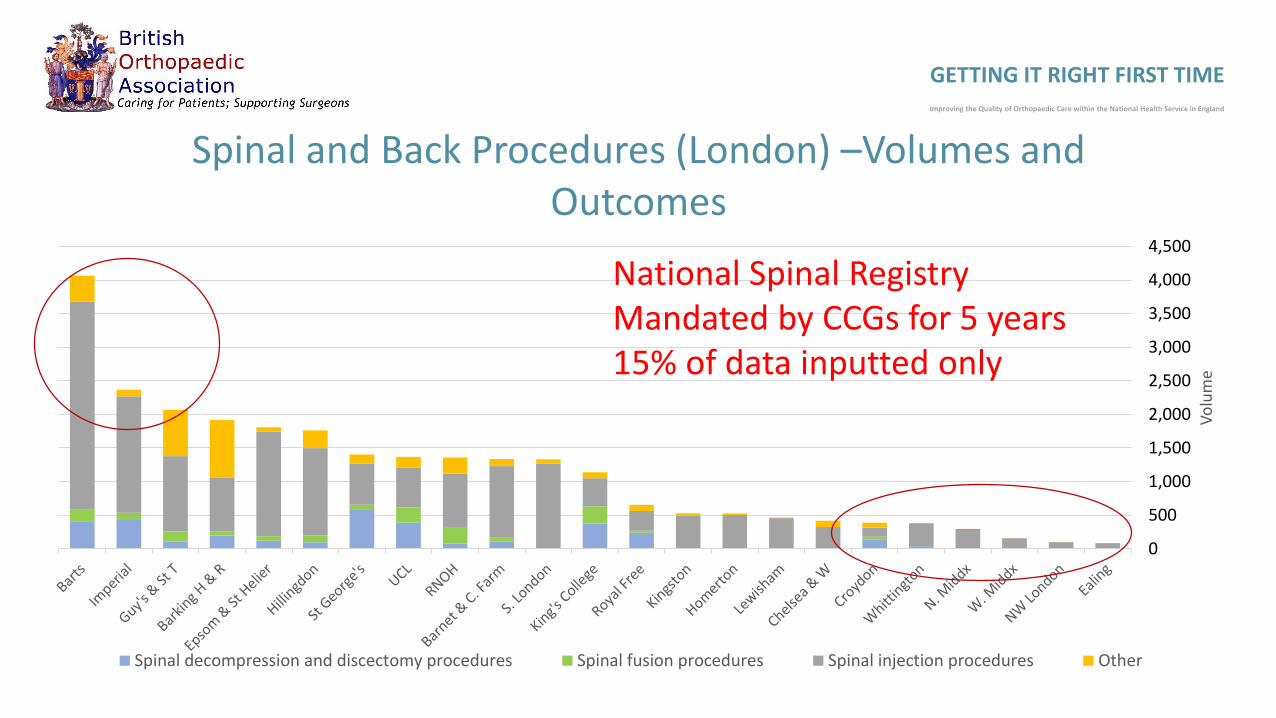
Spinal and Back Procedures (London) –Volumes and Outcomes
Spinal decompression and discectomy procedures Spinal fusion procedures Spinal injection procedures Other
National Spinal RegistryMandated by CCGs for 5 years15% of data inputted only
Sum of Total ClaimIncluding estimates from open cases
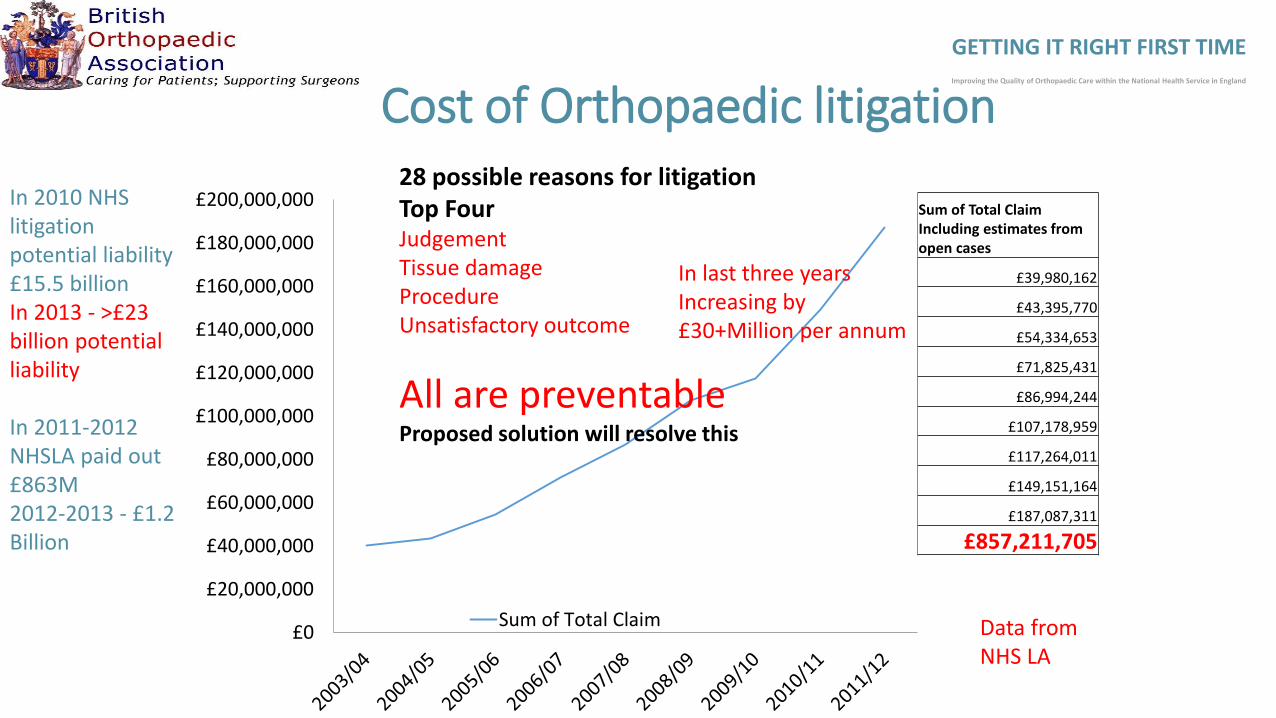
£39,980,162
£43,395,770
£54,334,653
£71,825,431
£86,994,244
£107,178,959
£117,264,011
£149,151,164
£187,087,311
£857,211,705
£0
£20,000,000
£40,000,000
£60,000,000
£80,000,000
£100,000,000
£120,000,000
£140,000,000
£160,000,000
£180,000,000
£200,000,000
Sum of Total Claim
Cost of Orthopaedic litigation28 possible reasons for litigationTop FourJudgementTissue damageProcedureUnsatisfactory outcome
All are preventableProposed solution will resolve this
Data fromNHS LA
In last three yearsIncreasing by£30+Million per annum
GETTING IT RIGHT FIRST TIMEImproving the Quality of Orthopaedic Care within the National Health Service in England
In 2010 NHS litigation potential liability £15.5 billionIn 2013 - >£23 billion potential liability
In 2011-2012 NHSLA paid out £863M 2012-2013 - £1.2 Billion

Litigation data – 10 Trusts same City (trust number not shown)
GETTING IT RIGHT FIRST TIMEImproving the Quality of Orthopaedic Care within the National Health Service in England
Claims in 2011/12
Estimated Cost of claims during 2011/12
Estimated Cost per Orthopaedic Spell
* * *
12 £1,214,315 £99.28
5 £661,890 £41.55
3 £472,500 £50.56
6 £945,000 £43.04
10 £1,418,375 £36.47
7 £1,102,500 £60.27
29 £3,987,113 £134.90
8 £644,655 £31.13
16 £2,090,698 £50.39
National average cost per orthopaedic spell is £54.42
* Permission from trust not given to access this data.
JudgementTissue damageProcedureUnsatisfactory Outcome
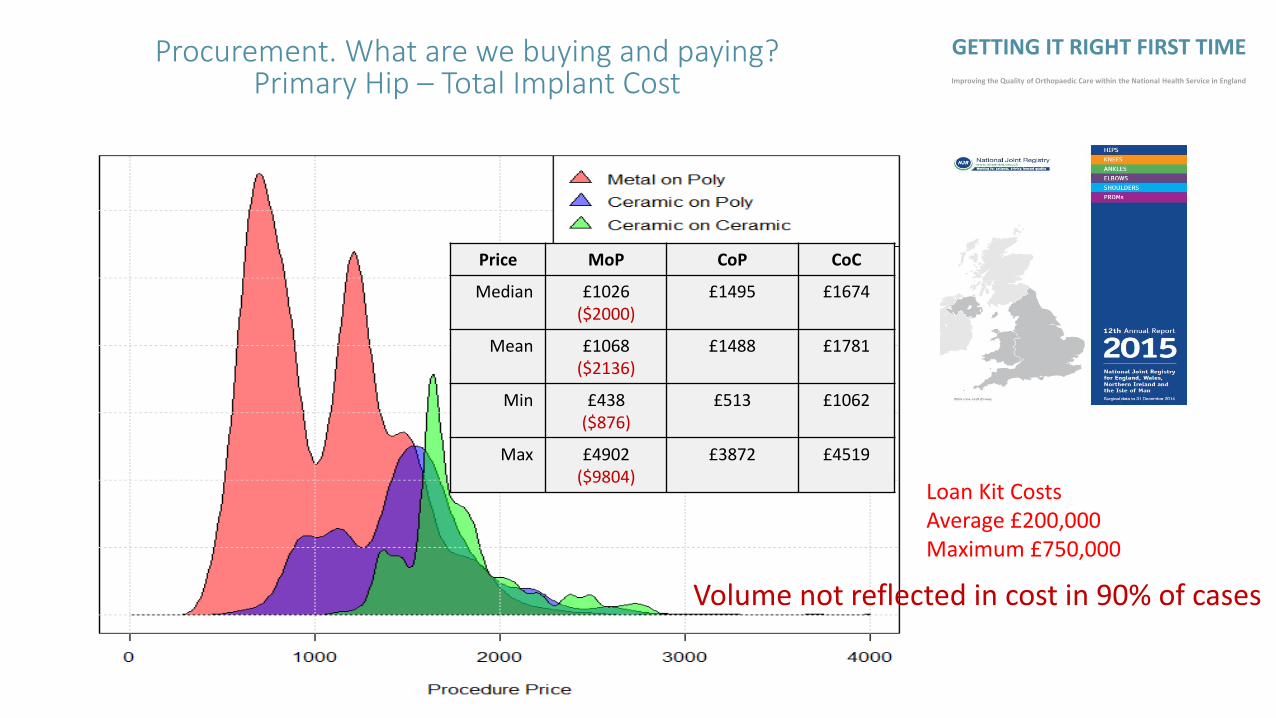
Procurement. What are we buying and paying?Primary Hip – Total Implant Cost
Price MoP CoP CoC
Median £1026 ($2000)
£1495 £1674
Mean £1068($2136)
£1488 £1781
Min £438($876)
£513 £1062
Max £4902($9804)
£3872 £4519
GETTING IT RIGHT FIRST TIMEImproving the Quality of Orthopaedic Care within the National Health Service in England
Loan Kit CostsAverage £200,000Maximum £750,000
Volume not reflected in cost in 90% of cases

Anonymised Trust
Orthopaedic activity – Primary and revision THR and TKRMetric Period Value
Primary Hip replacement 2013/14 513
Revision Hip Replacement 2013/14 84
Primary Knee Replacement 2013/14 636
Revision knee replacement 2013/14 56
GETTING IT RIGHT FIRST TIMEImproving the Quality of Orthopaedic Care within the National Health Service in England
15 surgeons33% <5 per annum

Band 1most expensiveBand 12Cheaper
Low volume is high cost

GETTING IT RIGHT FIRST TIMEImproving the Quality of Orthopaedic Care within the National Health Service in England
COST OF IMPLANTS
Hugh Variation in Cost of Spinal Implants>10,000 products available within spinal catalogues for hospitals
Screws - £32 -£600 – mono/poly nut included?
Rods (static and dynamic) - £72 - £1,066
Cages and Spacers - £26 -£3,200 diverse and different sizes.
Plates £22-£1,583
1cc of artificial bone graft to fill the c-spine cages with ranges from £170-300 full price inc VAT.
Comparisons across suppliers difficult as systems not being of standard design
Peek
£100Million
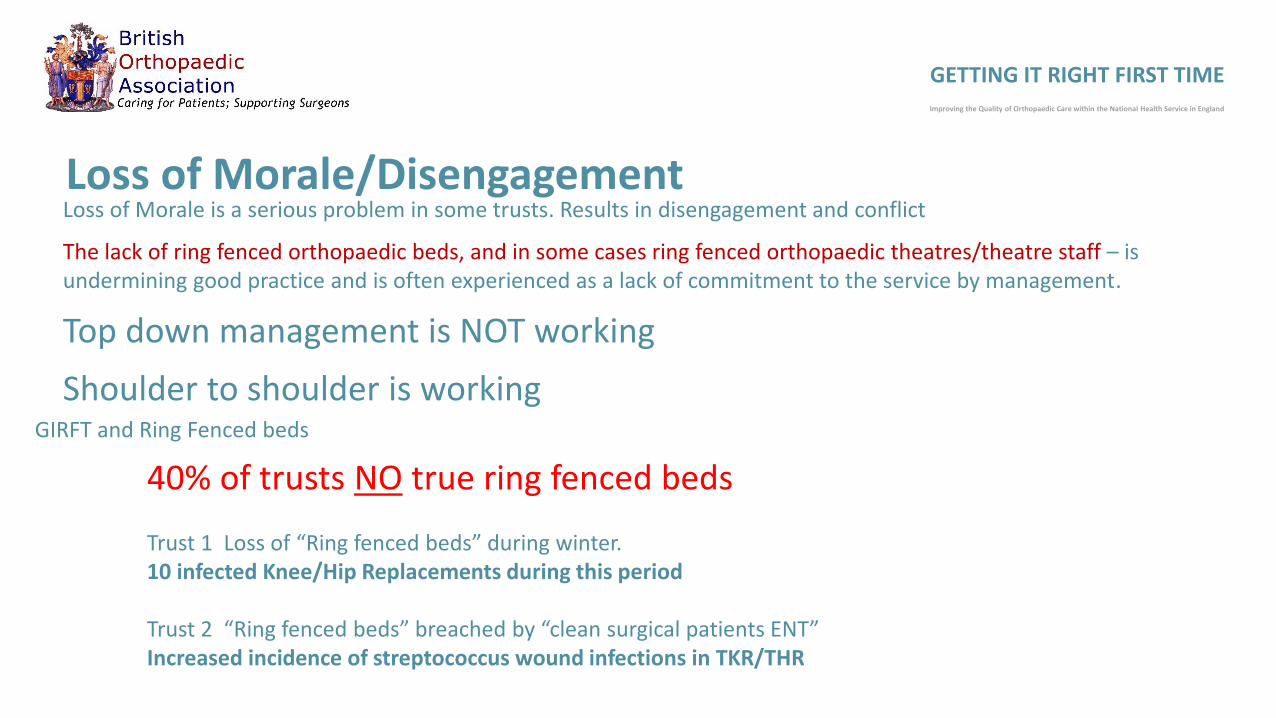
Loss of Morale/DisengagementLoss of Morale is a serious problem in some trusts. Results in disengagement and conflict
The lack of ring fenced orthopaedic beds, and in some cases ring fenced orthopaedic theatres/theatre staff – is undermining good practice and is often experienced as a lack of commitment to the service by management.
Top down management is NOT working
Shoulder to shoulder is working
GETTING IT RIGHT FIRST TIMEImproving the Quality of Orthopaedic Care within the National Health Service in England
40% of trusts NO true ring fenced beds
Trust 1 Loss of “Ring fenced beds” during winter.10 infected Knee/Hip Replacements during this period
Trust 2 “Ring fenced beds” breached by “clean surgical patients ENT”Increased incidence of streptococcus wound infections in TKR/THR
GIRFT and Ring Fenced beds
GETTING IT RIGHT FIRST TIMEImproving the Quality of Orthopaedic Care within the National Health Service in England
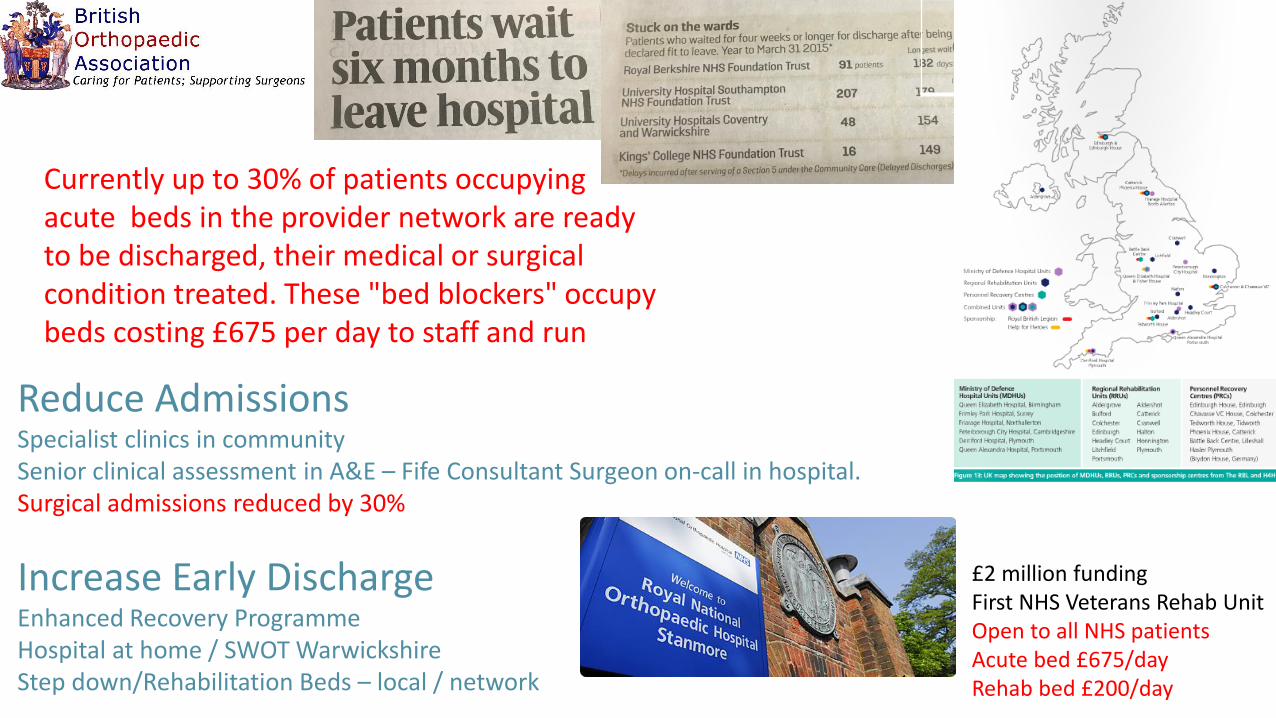
Reduce AdmissionsSpecialist clinics in communitySenior clinical assessment in A&E – Fife Consultant Surgeon on-call in hospital.Surgical admissions reduced by 30%
Increase Early DischargeEnhanced Recovery ProgrammeHospital at home / SWOT WarwickshireStep down/Rehabilitation Beds – local / network
Currently up to 30% of patients occupying acute beds in the provider network are ready to be discharged, their medical or surgical condition treated. These "bed blockers" occupy beds costing £675 per day to staff and run
£2 million fundingFirst NHS Veterans Rehab UnitOpen to all NHS patientsAcute bed £675/dayRehab bed £200/day

What did the GIRFT Pilot in Orthopaedics tell us?• Huge variations in practice and outcomes in terms of device and procedure
selection, clinical costs, infection rates, readmission rates, and litigation rates.
• Scope to tackle many of these variations and drive short, medium and longer- term improvements in quality of delivery (through adopting best practice), reducing supplier costs (for example of implants) and generating savings, for example from reduced readmission and re-operation rates.
• Many of the answers are already out there
• There is no consensus as to what constitutes best practice in areas of activity where there is no NICE or formal guidance from the BOA or other professional sub-specialty association. This provides a significant opportunity to drive efficiency.
GETTING IT RIGHT FIRST TIMEImproving the Quality of Orthopaedic Care within the National Health Service in England

Knee Length of Stay Trend
GETTING IT RIGHT FIRST TIMEImproving the Quality of Orthopaedic Care within the National Health Service in England
Increase in numbers of patients discharged Within 4 days
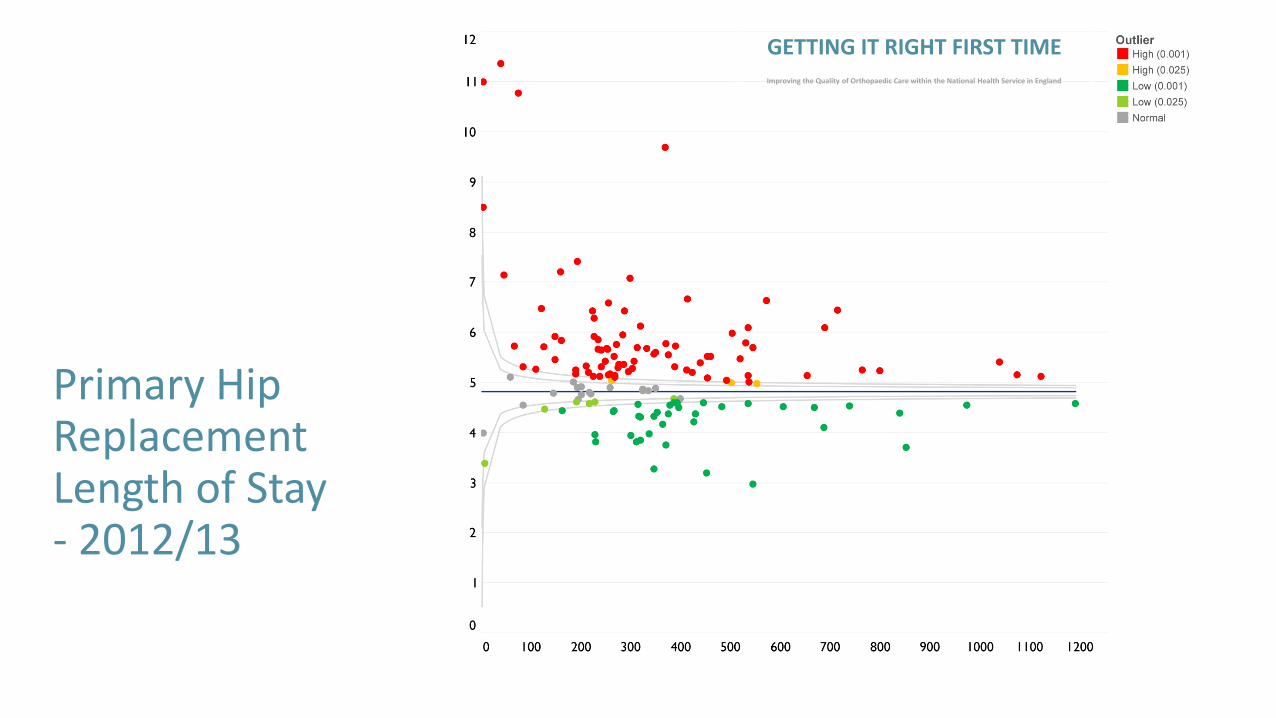
Primary Hip Replacement Length of Stay- 2012/13
GETTING IT RIGHT FIRST TIMEImproving the Quality of Orthopaedic Care within the National Health Service in England

Primary Hip Replacement Length of Stay- 2014/15
GETTING IT RIGHT FIRST TIMEImproving the Quality of Orthopaedic Care within the National Health Service in England
Re visit – Top 25% TrustsRe visit- Bottom 25%
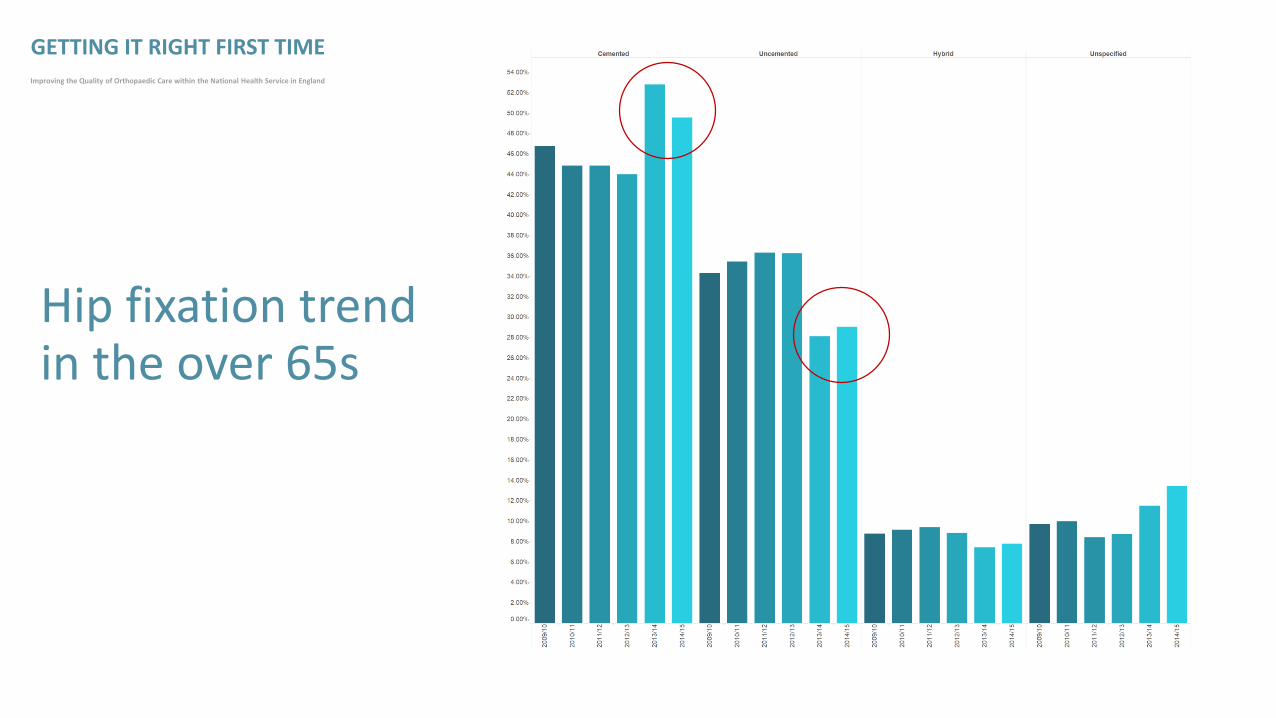
Hip fixation trend in the over 65s
GETTING IT RIGHT FIRST TIMEImproving the Quality of Orthopaedic Care within the National Health Service in England
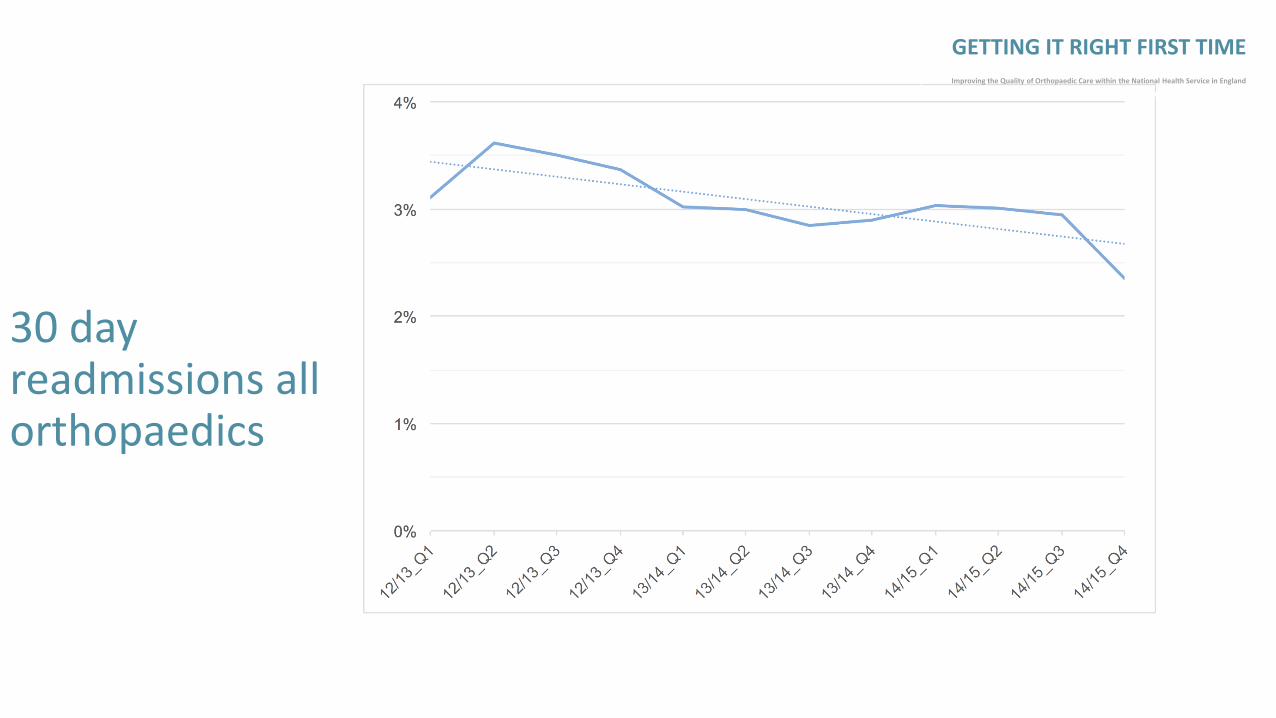
30 day readmissions all orthopaedics
GETTING IT RIGHT FIRST TIMEImproving the Quality of Orthopaedic Care within the National Health Service in England

Results of the GIRFT Pilot in Orthopaedics
• Cost - £250,000 Grant from NHS England and DH
• Length of stay
• Use of Cemented implants – patients70+
• Ring Fenced beds
• Reduction loan kit costs
• Reduction in costs of THR and TKR
• Reduction in arthroscopy rates
• Low volume surgeons changing practice
• Savings to date - £60-£90 Million
GETTING IT RIGHT FIRST TIMEImproving the Quality of Orthopaedic Care within the National Health Service in England
Improved Quality of CareReduction of complications

Implementation Support from the ProfessionGIRFT implementation steps:• We will be sending to all Trusts in England the latest version of
the GIRFT dashboard, with updated data
• The British Orthopaedic Association (BOA) has issued detailed implementation guidance.
• The BOA strongly encourages individual surgeons to share their personal National Joint Registry activity and outcome data with colleagues, as well as their appraiser and CD.
• In addition to the implementation guidance, the BOA has also produced a position statement on data transparency.
• It places a focus on clinical leadership responsibility on the CD
• Revisits top 25% and bottom 25%
• BOA Hospital visits coordinated with GIRFT Team
•
• Support from : Prof. Howie Immediate Past President
Mr. Tim Wilton President of BOA
GETTING IT RIGHT FIRST TIMEImproving the Quality of Orthopaedic Care within the National Health Service in England

Networks /Hub & Spoke Model
“Getting it right first time”-Pilot orthopaedics in England
• Critical Mass of Specialists - One site Specialist Units
• Networks• “Ring fenced elective
beds”• Dedicated theatres• MDT working• Range of models/networks
Clinical Reference Group for Specialised Orthopaedics
• Defines specialist units and centres
• Minimum numbers• Gold standard • Infection rate <1%• Audit• Robust Review of outcomes
Improving quality Improving training
Elderly population not disadvantagedPatients will feel safe
Significant savings
GETTING IT RIGHT FIRST TIMEImproving the Quality of Orthopaedic Care within the National Health Service in England
ExamplesLeicesterGuysNorthern
30-40 UnitsLondon 5-6
Fewer CentresCollect the dataChange the TariffEg. MTCs
STANDARDS

Leicester 2012
GENERAL
(Elective)
7 Theatres
33 Consultants
3 Wards
GLENFIELD
(Elective)
OPD & Diagnostics Only
ROYAL INFIRMARY (Trauma, Paeds & Sarcoma)
3 Theatres 25 Consultants 3 Wards
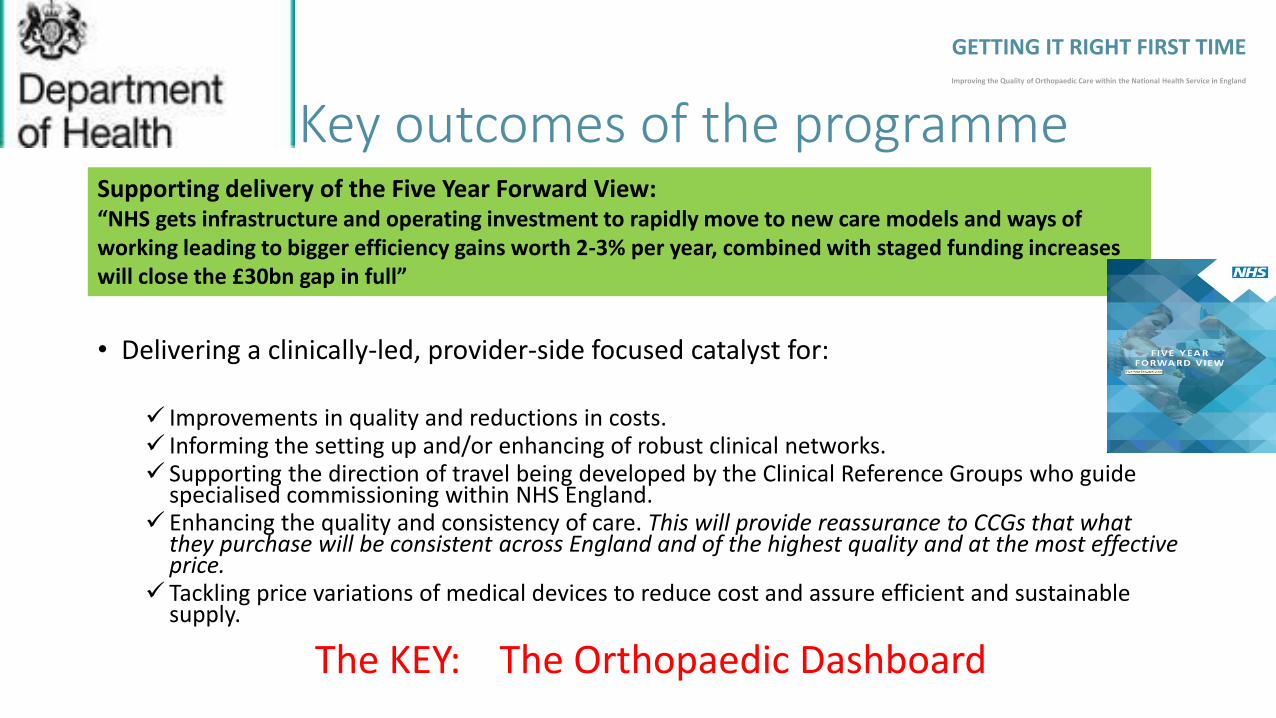
Key outcomes of the programme
• Delivering a clinically-led, provider-side focused catalyst for:
Improvements in quality and reductions in costs. Informing the setting up and/or enhancing of robust clinical networks. Supporting the direction of travel being developed by the Clinical Reference Groups who guide
specialised commissioning within NHS England. Enhancing the quality and consistency of care. This will provide reassurance to CCGs that what
they purchase will be consistent across England and of the highest quality and at the most effective price.
Tackling price variations of medical devices to reduce cost and assure efficient and sustainable supply.
Supporting delivery of the Five Year Forward View:“NHS gets infrastructure and operating investment to rapidly move to new care models and ways of working leading to bigger efficiency gains worth 2-3% per year, combined with staged funding increases will close the £30bn gap in full”
GETTING IT RIGHT FIRST TIMEImproving the Quality of Orthopaedic Care within the National Health Service in England
The KEY: The Orthopaedic Dashboard
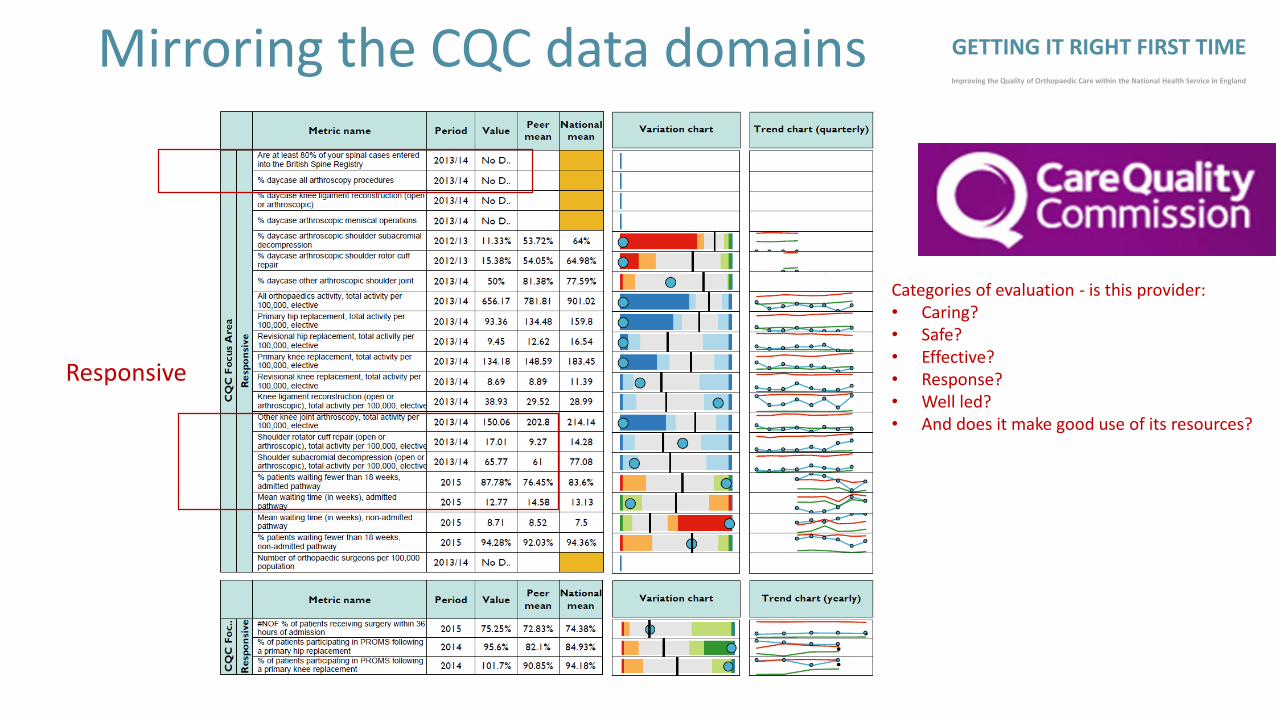
Mirroring the CQC data domains
Responsive
GETTING IT RIGHT FIRST TIMEImproving the Quality of Orthopaedic Care within the National Health Service in England
Categories of evaluation - is this provider:• Caring?• Safe?• Effective?• Response?• Well led?• And does it make good use of its resources?
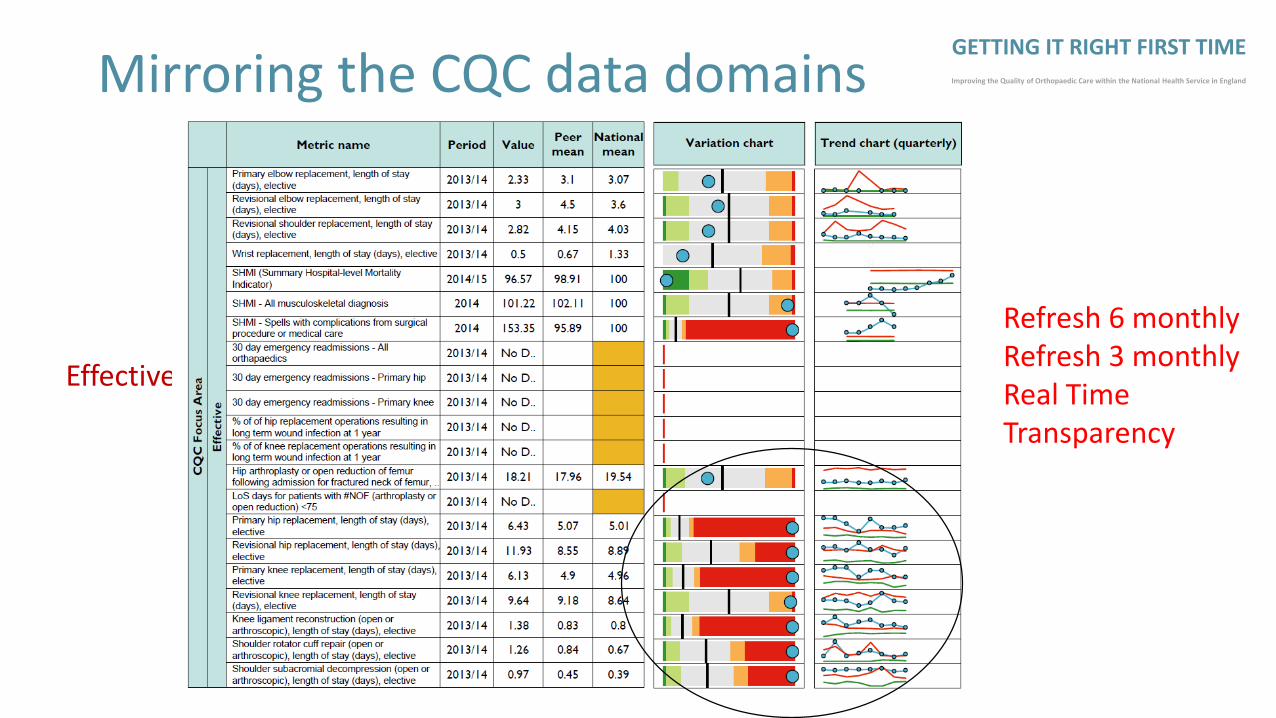
Mirroring the CQC data domains
Effective
GETTING IT RIGHT FIRST TIMEImproving the Quality of Orthopaedic Care within the National Health Service in England
Refresh 6 monthlyRefresh 3 monthlyReal TimeTransparency

Where Next :Clinically-led Quality and Efficiencyprogramme GIRFT 2
• Elective Orthopaedics – implementation solutions
• Emergency General Surgery• Spinal Surgery• Vascular surgery• Urology• Ophthalmology• Cardiothoracic• Oral and Maxillofacial• Neurosurgery• Gynaecology & Obstetrics• Paediatric Surgery• Ear Nose and Throat (ENT)• Plastics• Breast Surgery• Dentistry
• General Medicine(Acute)
• Respiratory
• Cardiology
• Intensive care medicine
• Gastroenterology
• Diabetes and Endocrinology
• Emergency medicine
• Radiology/Imaging
• Outpatients
Prof. Tim EvansProf. Tim Briggs
Medical/Surgical ProductivityEfficiency
3 year programme£2.55MNow fastracked
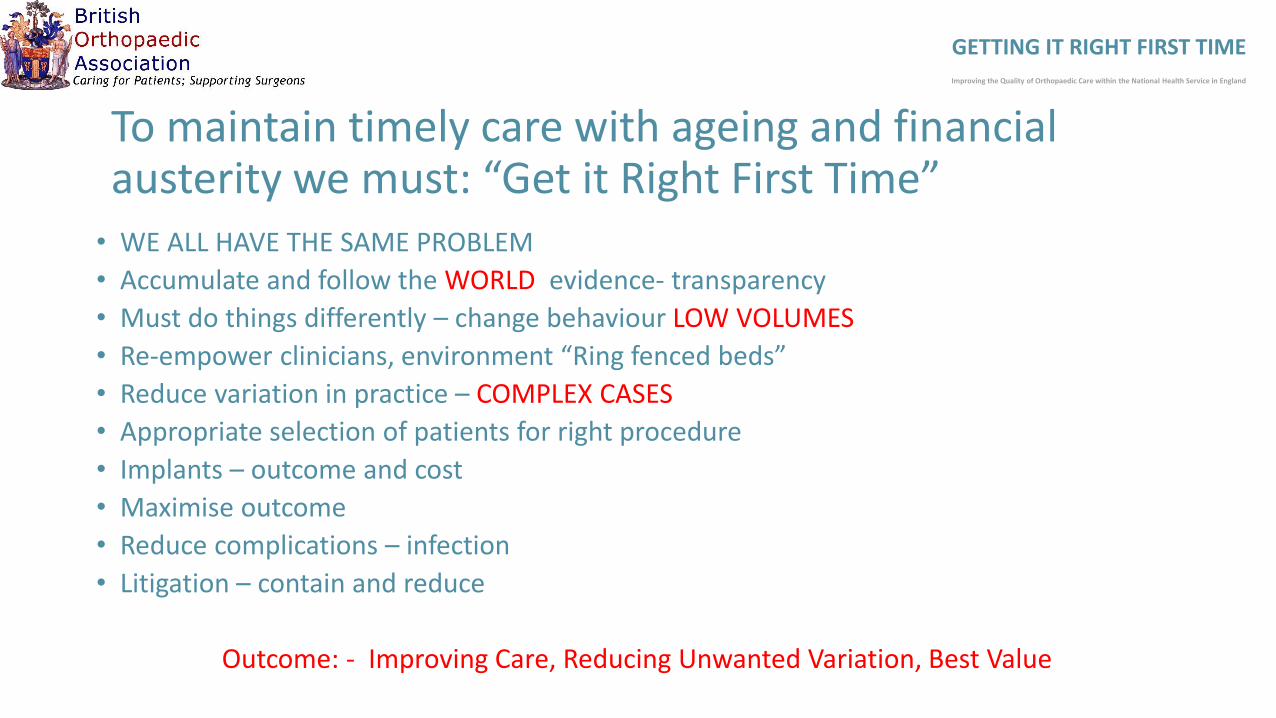
To maintain timely care with ageing and financial austerity we must: “Get it Right First Time”• WE ALL HAVE THE SAME PROBLEM
• Accumulate and follow the WORLD evidence- transparency
• Must do things differently – change behaviour LOW VOLUMES
• Re-empower clinicians, environment “Ring fenced beds”
• Reduce variation in practice – COMPLEX CASES
• Appropriate selection of patients for right procedure
• Implants – outcome and cost
• Maximise outcome
• Reduce complications – infection
• Litigation – contain and reduce
Outcome: - Improving Care, Reducing Unwanted Variation, Best Value
GETTING IT RIGHT FIRST TIMEImproving the Quality of Orthopaedic Care within the National Health Service in England


![1 BRIGGS LAW CORPORATION [FILE: 1593.60] Cory J. Briggs](https://img.pdfslide.us/doc/110x75/62143d16500e7a03e6034c04/1-briggs-law-corporation-file-159360-cory-j-briggs-.jpg)