Embed Size (px)
Citation preview
Getting Income Shares Right
Douglas Gollin Williams College
DRAFT
January 2001
JEL Classifications: E25 (aggregate factor income distribution); O47 (measurement of economic growth; aggregate productivity); E13 (neoclassical aggregative models) Comments are welcome. Author’s address: Department of Economics, Fernald House, Williams College, Williamstown, MA 01267. E-mail address: [email protected]. This research was supported in part by National Science Foundation Grant NSF/SBR 9515256. Portions of the paper were written while I was on leave at Yale University, and I gratefully acknowledge the support of the Economic Growth Center at Yale and the Gaylord Donnelley Fellowship administered by the Yale Institute for Biospheric Studies. I owe a particular debt to Alwyn Young for his insightful comments. The original impetus for this research came from discussions with Tim Kehoe, Ed Prescott and members of the Applied Theory working group at the University of Minnesota. Cheryl Doss read and commented on several drafts. Raphael Bergoeing and François Ortalo-Magné provided early requests for a manuscript and helped me conceptualize the topic, and Jim Schmitz and Stephen Parente provided encouragement at key stages.
Getting Income Shares Right
ABSTRACT
Many widely used economic models implicitly assume that income shares should be
identical across time and space. Although time series data from industrial countries appear
consistent with this notion, cross-section data generally appear to contradict the assumption of
constant income shares. A commonly used calculation suggests that labor shares of national
income vary from about 0.05 to about 0.80 in international cross-section data. This paper
suggests, however, that this widely used approach underestimates the labor income of the self-
employed and other proprietors. Several adjustments for calculating labor shares are identified
and compared. All of them yield data that appear broadly consistent with the hypothesis that
labor shares for most countries fall in the range of 0.65 to 0.80.
1.
International data on income shares pose a puzzle for economists.1 Within most countries,
the shares of national income accruing to capital and labor appear to be fairly constant over long
periods of time. This is true for many poor countries as well as the United States, United
Kingdom, and most rich countries for which data are available. In fact, the long-term stability of
factor shares has become enshrined as one of the “stylized facts” of growth (e.g., Kaldor
1958). Across countries, however, there appear to be large differences in income shares. Why
should there be such discrepancies between cross-section observations and time series
observations? And what do these differences imply for the widespread use of model
specifications that imply constant factor shares across countries and over time?
Taken at face value, the discrepancy between the time series data and the cross-section
data points to several possible conclusions, none of which is particularly appealing. One
explanation would be that countries do not operate the same aggregate technology. A second
possibility is that countries share a common aggregate technology, but due to institutional
arrangements or fixed factors, income shares simply differ across countries. A third alternative is
that some countries might face imperfect factor markets, so that wages are not equated to
marginal value products. These possibilities are briefly explored below.
This paper argues, however, for a fourth alternative. Specifically, I suggest that more
careful treatment of the data leads to calculated income shares that are approximately constant
across countries. I focus on differences in self-employment rates across countries. For a
1 I will use the terms “income shares” and “factor shares” interchangeably here; both terms refer to the fraction of national income accruing to different factors of production. These shares are reported in a portion of the national income and product accounts often referred to as the “functional distribution of income.”
2.
number of reasons, the labor income of the self employed is often treated incorrectly as capital
income. When income shares are corrected to reflect this fact, the large differences in income
shares between rich and poor countries become much smaller. The variation that remains is not
obviously related to levels of economic development.
In spirit and substance, this paper resurrects some of the work of Kravis (1962)
concerning the functional distribution of income. Kravis pointed out that entrepreneurial income
as a share of GDP was shrinking over time as a result of long-term shifts in the structure of
employment away from agriculture and self employment and into industrial wage labor. In
this paper, I argue that the same structural changes account for many of the apparent cross-
country differences in the data.
Section 1 of this paper reports data on income shares as they are commonly computed.
Section 2 suggests some possible explanations for the patterns observed in the data. Section 3
explores several alternative adjustments. Finally, Section 4 briefly sketches out some of the
implications of these findings for current research.
1. Employee compensation shares: patterns and complications
Macroeconomists typically calculate factor shares not from firm-level data but from
aggregates in the national income and product accounts. A widely used strategy is to estimate
the labor share of national income from the share of employee compensation in GDP. The
3.
returns to capital are then taken to be the residual. Such data are readily available for many
countries.2
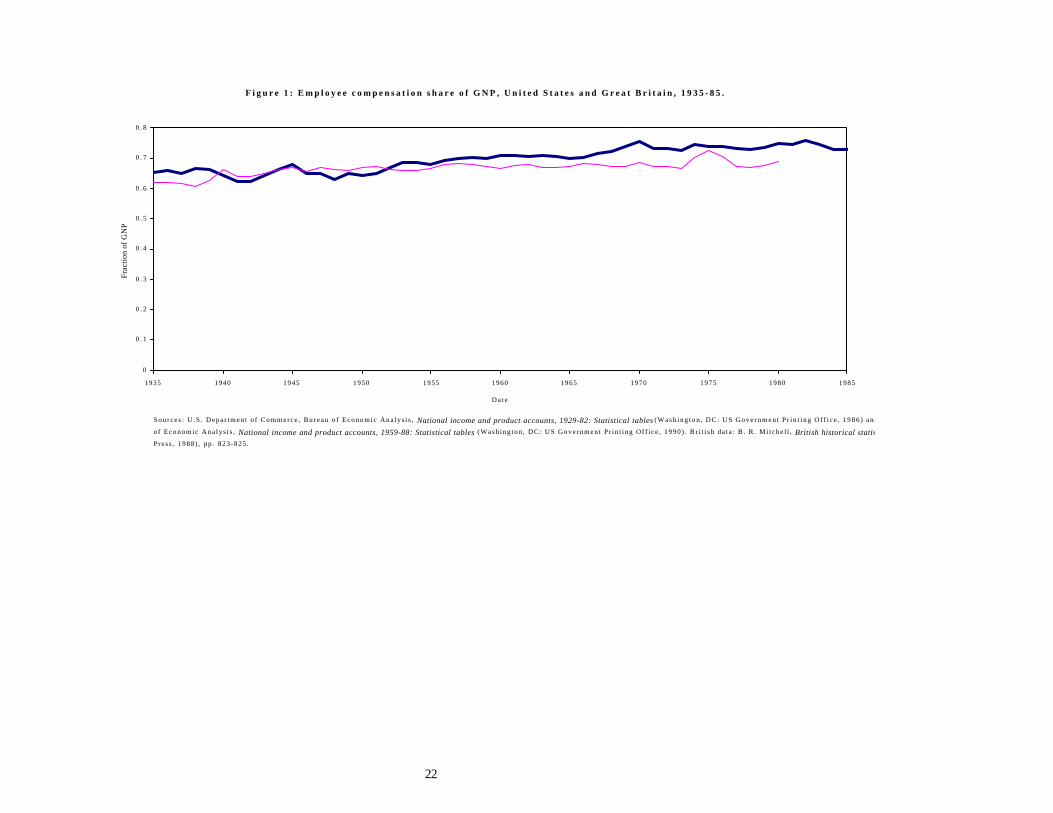
Time series data indicate that employee compensation shares of national income have
been relatively constant in the United States over long periods of time. Since 1935, the
employee compensation share of GDP has remained in the range of 65-75 percent of GDP.
Figure 1 shows the time series for the United States and the United Kingdom, dating back to
1935 ((U.S. Department of Commerce 1986, 1990; Mitchell 1988). Similar patterns emerge
for other countries for which relatively long time periods are available. The data suggest that the
employee compensation share moves very little over time and is quite constant across rich
countries.
The stability of the time series data on factor shares have long encouraged economists to
look favorably on models that attribute the same aggregate technology to all countries. In
particular, these data have frequently been invoked to justify the use of Cobb-Douglas
functional forms.3 Indeed, the eponymous Cobb and Douglas (1928) were among the earliest
authors to point out that for the United States, the labor share of income appeared to be roughly
constant over time, regardless of changes in factor prices.
2 One source of data is the United Nations yearbook of national accounts statistics . Appendix 1 shows the definitions used in allocating GDP among its various cost components in the United Nations System of National Accounts. 3 As is well known to economists, the Cobb-Douglas functional form implies constant factor shares of income; that is to say, if all factors of production are paid their marginal revenue products, then the share of income received by a particular factor is determined entirely by the technological parameters. Factor shares are independent of changes in the prices of inputs and outputs; for all factors, there is a unit elasticity of demand, and there is also a unit elasticity of substitution between factors. There are, of course, many other production functions that would give constant or near-constant labor shares.
4.
In recent years, however, economists have begun to pay closer attention to international
cross-section data that include observations on developing countries. The international data
appear to show wide disparities in labor shares across countries. For example, employee
compensation shares of GDP for 94 countries were available in the 1992 edition of the United
Nations National Accounts Statistics.4 These data show enormous variance. The lowest
share of employee compensation in GDP was reported in Ghana, with 0.051 of GDP; the
highest reported was for Ukraine, with 0.770. Fully 18 of the countries reported employee
compensation shares lower than 0.30 of GDP; eight countries reported employee compensation
shares of 0.60 or higher.
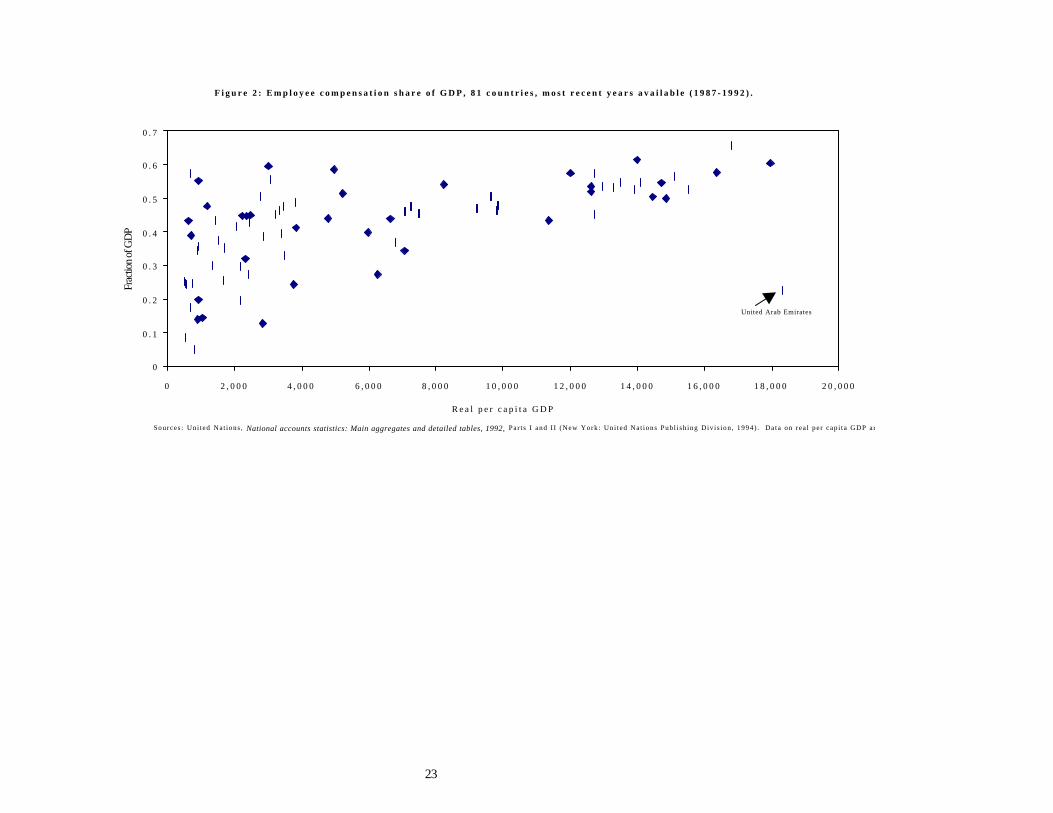
Moreover, the data appear to show some consistent patterns. Poor countries are more
likely than rich countries to have low shares of employee compensation in GDP. Figure 2 shows
employee compensation shares plotted against levels of real per capita GDP; the scatter plot
shows a clear positive relationship. This suggests that the labor share increases with economic
growth. But this pattern runs precisely counter to Kaldor’s “stylized facts,” and it thus appears
to undermine models that generate constant factor shares across time and space.
4 The countries are: Algeria, Angola, Australia, Austria, Bahamas, Bahrain, Belarus, Belgium, Benin, Bolivia, Botswana, Bulgaria, Burkina Faso, Burundi, Cameroon, Canada, Chile, Colombia, Congo, Costa Rica, Cote d’Ivoire, Denmark, Ecuador, Estonia, Fiji, Finland, France, French Guiana, French Polynesia, Germany, Ghana, Greece, Guadeloupe, Honduras, Hong Kong, Hungary, Iceland, Iraq, Ireland, Israel, Italy, Jamaica, Japan, Kenya, Korea, Latvia, Libya, Lithuania, Luxembourg, Mali, Malta, Martinique, Mauritius, Mexico, Myanmar, Namibia, Nepal, Netherlands, New Zealand, Niger, Nigeria, Norway, Panama, Papua New Guinea, Paraguay, Peru, Philippines, Portugal, Reunion, Romania, Rwanda, Saudi Arabia, Sierra Leone, Slovenia, South Africa, Spain, Sri Lanka, Sudan, Suriname, Swaziland, Sweden, Tanzania, Thailand, Trinidad & Tobago, Turkey, Ukraine, United Arab Emirates, United Kingdom, United States, Uruguay, Venezuela, Viet Nam, Zambia, and Zimbabwe.
5.
2. Possible explanations
There are several possible explanations for why factor shares might differ across
countries. One possibility is that factor shares differ across countries because each country in
fact faces a different aggregate technology. Differences in technology are perhaps the least
appealing explanation, because it is not clear why the relationship between inputs and outputs
should suddenly shift at a national frontier.5 Moreover, it is not clear why production
technologies should vary with per capita GDP rather than with geography. Why, for example,
would the production technology differ so greatly between the U.S. and neighboring Mexico,
while it differs so little between the U.S. and Germany or Japan?6
A second possibility is that the aggregate technology displays a non-unitary elasticity of
substitution between capital and labor. If this is the case, though, then the time series data pose
a puzzle: Why have employee compensation shares remained so stable over time, even as
accumulation has changed relative factor prices?
A third possibility is that factor markets are non-competitive in some countries and that
factors are not paid their marginal products. In principle, this could certainly account for the
data that we observe. Suppose, for example, that capital owners had market power in poor
countries. This would tend to increase the share of national income accruing to the owners of
5 Despite economists’ reluctance to see national boundaries as important, much recent work has focused on cross-border differences in country experiences as indications of the importance of policies and institutions (e.g., Olson 1996). Nonetheless, in this case the question is about underlying production technologies. Why should an aggregate technology change across countries? 6 For instance, Olson (1996) argues that economic performance may differ markedly across borders precisely because of differences in institutions.
6.
capital. But it is hard to place much credence in a story like this in a world of increasingly
mobile capital.
A fourth possibility is that measurement is poor – or more precisely that employee
compensation shares are a poor measure of labor shares. This is the explanation that I will
pursue in the remainder of the paper. Following Kravis (1962), we can conceive of two
potential sources of variation in the functional distribution of income across countries. First, the
disparities in employee compensation shares may reflect changes in the sectoral composition of
output. Second, these disparities may reflect changes in the structure of employment −
especially in the importance of self employment. Either of these long-term trends could lead us
to mismeasure or misinterpret the labor share of GDP.
3. Recalculating labor shares
First, consider how changes in the sectoral composition of output could lead us to
misinterpret the data. Suppose all countries have the same technology, but within each country,
different sectors face different technologies. Then changes in the composition of output – such
as the secular decline in agriculture’s importance as economies grow – might lead to differences
in factor shares.
Next, consider the possibility that changes in the importance of self employment are
responsible for the observed patterns in employee compensation shares. As noted above, it is
common practice to use employee compensation as a measure of labor income. From a
conceptual perspective, however, employee compensation differs from labor income.
7.
Employee compensation excludes some important forms of non-wage compensation and may
include rents accruing to particular skills, including returns to entrepreneurial ability. More
important for the purposes of this paper, employee compensation omits the labor income of
people who are not employees. In some countries, the self employed account for huge fractions
of the workforce. As a result, in these countries, labor income is badly understated by the
employee compensation measure.
The two phenomena described above are related but distinct. For example, agriculture
generally has very low employee compensation shares – partly because it is dominated almost
everywhere by the self employed and by small family businesses. The declining importance of
agriculture as economies grow has a double effect on observed factor shares: output moves into
sectors that are more labor-intensive, and a larger share of income is earned by workers, as
opposed to entrepreneurs. For analytic clarity, however, it is useful to consider the effects of
the two phenomena separately.
3.1 Accounting for differences in sectoral composition of output
For 42 countries, the 1992 United Nations National Account Statistics include
comparable data on the functional distribution of income the cost components of GDP by
sector. First, we note that across sectors, factor shares vary widely. In the United States, the
employee compensation shares of value added in agriculture and mining are, respectively, only
0.212 and 0.361, while the employee compensation share in manufacturing is 0.732 and the
share in “community, social, and personal services” is 0.751. Similar patterns are observed for
other countries. In general, agriculture and primary commodity production have low employee
8.
compensation shares, while manufacturing and services have relatively high employee
compensation shares.
Unsurprisingly, the data also reveal substantial differences in the sectoral composition of
output. For example, agriculture, hunting, forestry and fishing together account for 0.023 of
U.S. GDP, while in Burkina Faso the same sectors account for 0.526 of GDP. Finance,
insurance, real estate and business services accounted for 0.27 of U.S. GDP in 1986, while the
same sectors accounted for 0.041 of Rwandan GDP. Could changes in the sectoral
composition of output account for cross-country differences in employee compensation shares?
For example, does the declining importance of agriculture – a sector with generally low
employee compensation shares – account for the higher aggregate employee compensation
shares found in rich countries? The answer is surprising: Almost certainly, the changing sectoral
composition of GDP does not account for observed differences in income shares. The
evidence comes from the following exercise.
Suppose that all countries had the same sectoral composition of output, differing only in
within-sector factor shares. Then we could compute overall income shares that would reflect
only the within-sector differences in factor shares. Table 1 shows the results of this experiment.
For the 42 countries for which data were available, employee compensation shares were
computed in two ways: first, based on the current sectoral composition of output in each
country; and second, re-weighted according to the sectoral composition of output currently
prevailing in the United States. The data in Table 1 show that when sectoral composition of
output is re-weighted using the sectoral composition of the United States, overall employee
9.
compensation shares change very little. For a handful of poor countries such as Botswana,
Libya, and Rwanda there are significant increases in employee compensation, but these are
nowhere near large enough to account for the overall differences among countries.7
Clearly, even within sectors, there are important differences across countries in
employee compensation shares. For example, employee compensation shares in the
manufacturing sector range from 0.749 in Finland to 0.132 in Ecuador. Most likely, this reflects
structural changes in the nature of firms and the size and scale of production. Thus, changes in
the sectoral composition of output may not be the most important source of disparities in
observed income shares.
3.2 Adjusting for self-employment income
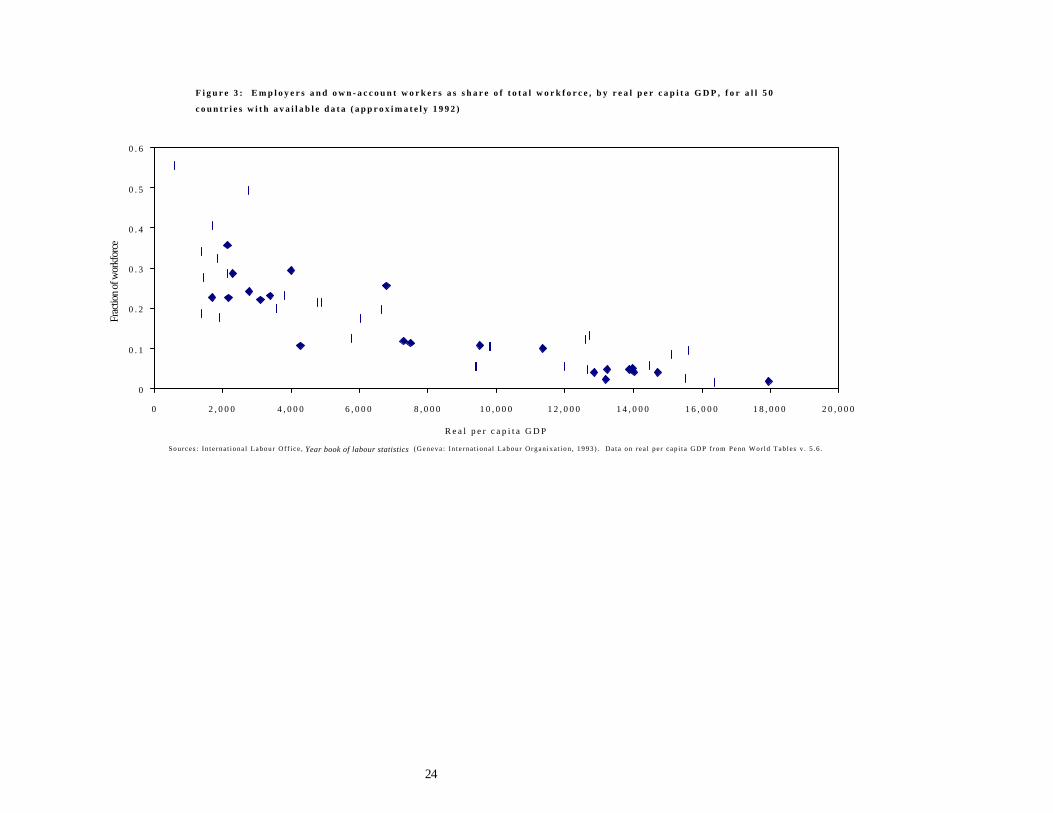
Rates of self employment vary widely across countries. Even within sectors, there are
large differences across countries, as shown by Gollin (1996). In Ghana, Bangladesh, and
Nigeria, for example, 75-80 percent of manufacturing workers were self-employed, compared
with fewer than 2 percent in the United States (ILO 1993).8 Figure 3 shows that rates of self
employment differ widely across countries, and that these rates are closely related to real per
capita GDP.
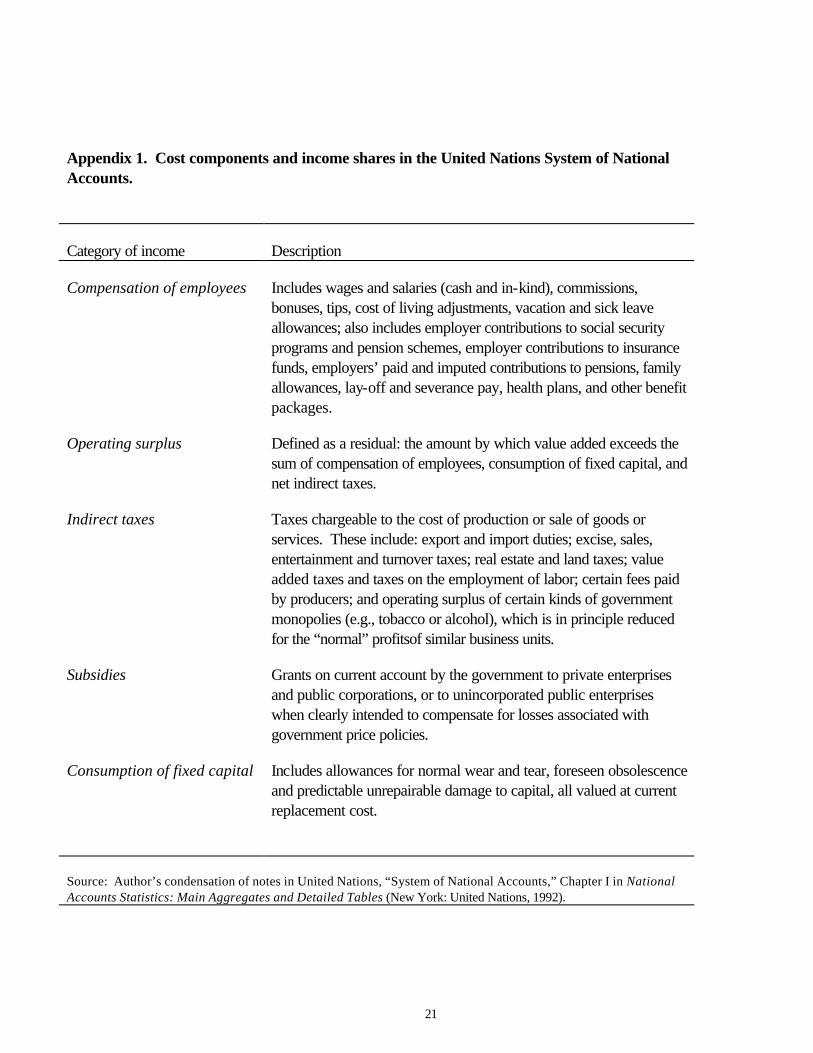
According to the United Nations System of National Accounts, adopted in 1953, the
income of the self employed is specifically not to be counted as employee compensation.
7 Similar results are obtained when we apply the sectoral weights of poor countries to the cross section; the qualitative result is not particularly sensitive to the choice of sectoral weights 8 The differences in self employment across countries are systematic; the examples given here are fully representative of the data. If we consider the share of entrepreneurs (employers and own-account workers) in the total manufacturing workforce to be an index of self employment, we find that the 20 poorest countries for which data were available had entrepreneur-workforce ratios averaging 0.434; the 20 richest countries had entrepreneur-workforce ratios averaging 0.138.
10.
Instead, this income – typically a mix of capital and labor income, along with rents to certain
types of skills – is to be treated as a form of business income. Employee compensation is
precisely the total compensation of people who work as employees. (See Appendix 1 for a
more formal definition.)
The usual approach of using employee compensation as a measure of labor income is
thus explicitly omitting the labor income of the self employed. If this income is mistakenly
counted as capital income – as in the usual approach of treating employee compensation as a
measure of labor income – then this will tend systematically to underestimate the labor shares of
poor countries relative to rich countries. 9 Unfortunately, it is not obvious how to remedy this
problem. For most countries, we do not have data on the total income of the self employed
much less on how to allocate this income between labor and capital.10
Perhaps the best approach is that of Young (1994), who imputed wages to the self
employed in Hong Kong, Singapore, and South Korea on the basis of their sector, sex, age,
and education. Based on this set of estimates, Young computed labor shares for both countries.
There are problems with this procedure, of course: it is difficult to control for unobservable
differences in entrepreneurial ability, and it is difficult to know how to treat returns to
9 Young (2000) notes, however, that in some countries, national income accountants appear to be imputing labor income to “unpaid workers” in small firms based on the reported output of these firms (though not necessarily to the self employed themselves). This is not strictly consistent with the system of national accounts, but he suggests that it is a natural response in economies where small firms account for a large fraction of GDP. It is unclear how widespread the practice is; clearly it is not occurring in countries like Ghana and Tanzania that report employee compensation shares below 0.10. 10 An exception is the United States, which in its system of national accounts includes items for proprietors’ income and for mixed income of the self-employed.
11.
entrepreneurial ability. Nonetheless, Young’s approach gives a plausible way of estimating
labor shares in economies with large numbers of self-employed people.11
An alternative approach is to make adjustments to the national income and product
accounts based on the reported operating surplus of unincorporated enterprises (OSPUE).
Most of the income of the self employed will fall into this category. Unless the self employed
receive wages from their own enterprises, or unless individuals incorporate their own
enterprises, the UN System of National Accounts would in principle treat all the proceeds from
an unincorporated enterprise as operating surplus. Particularly in developing countries, almost
no self-employed people will be legally incorporated. Thus, essentially all the income from their
enterprises – capital income and labor income, as well as any rents or returns to other factors –
will be reported as OSPUE.12 I consider three possible adjustments to national income and
product accounts that involve reallocating OSPUE between labor and capital.
The first adjustment would be to treat all the operating surplus of private unincorporated
enterprises (OSPUE) as labor income.13 This has the virtue of being a straightforward
adjustment, and in many poor countries it could be argued that the self employed are providing
almost pure labor services. The disadvantage of this approach is that even in poor countries
the self employed tend to have substantial amounts of capital in their businesses. Thus, this
adjustment overstates the labor share of national income
11 Young arrives at estimated labor shares of 0.404 for Singapore in 1970-90, 0.680 for South Korea in 1966-90, and 0.628 for Hong Kong in 1966-91. 12 Again, Young (2000) cautions that some countries may already be making adjustments to their employee compensation figures to account for unpaid workers, contrary to the UN System of National Accounts. 13 Specifically, the labor share computed using this adjustment is [(Employee Compensation + Operating Surplus of Private Unincorporated Enterprises) ÷ (GDP - Indirect Taxes)]
12.
The second adjustment would be to treat OSPUE as comprising the same mix of labor
and capital income as the rest of the economy. Thus, we assume that labor and capital shares
are the same in private unincorporated enterprises as they are in large corporations and the
government sector.14 The advantage to this approach is that it is simple and transparent, and it
makes sense to assume that OSPUE includes some capital income as well as some labor
income. The disadvantage of this approach is that it implicitly assumes that income shares are
the same for establishments that differ significantly in size and structure. This might not be a
good assumption for several reasons. First, private unincorporated enterprises (PUEs) might be
more common in some sectors than in others, and as noted above, income shares differ widely
by sector. Second, within a particular sector, PUEs might tend to be more labor-intensive (or
perhaps more capital-intensive) than corporations.
A third adjustment focuses on imputing employee compensation for those workers who
are self employed. For countries with available data on the composition of the workforce, it is
possible to compute average employee compensation by dividing NIPA employee
compensation by the number of employees. We can then scale this up for the entire workforce
by multiplying average employee compensation by the number of people in the workforce. The
result could be thought of as total labor income.15 The advantage of this approach is that it
attempts to take into account the fraction of self-employed people in different countries. Instead
14 Specifically, the labor share I computed using this adjustment is [Employee Compensation ÷ (GDP - Indirect Taxes - Operating Surplus of Private Unincorporated Enterprises)]. To the extent that unincorporated enterprises pay any formal compensation to employees, this measure actually attributes a higher labor share to unincorporated firms than to other firms. An alternative way to make this adjustment would be simply to use income shares reported by large formal sector firms, but this raises a number of other problems.
13.
of guessing at how to divide up OSPUE between labor and capital, this adjustment uses
additional information to estimate the total labor share in the economy. This adjustment will be
good to the extent that the self employed command essentially the same wages as people who
work as employees. It will be a poor assumption if there are systematic differences in earning
ability between employees and the self employed.16
All three adjustments will tend to overstate the labor share of national income in countries
where officials have already sought to adjust the data for the labor income of the self employed.
Young (2000) suggests that such adjustments are made in China and some other countries (e.g.,
Taiwan and Korea), contrary to the United Nations System of National Accounts. For many of
the countries in the data, however, this does not appear to be a problem. And to the extent that
output and income from self employment are under-reported in the national income accounts,
there may be undercounting of labor income as well.
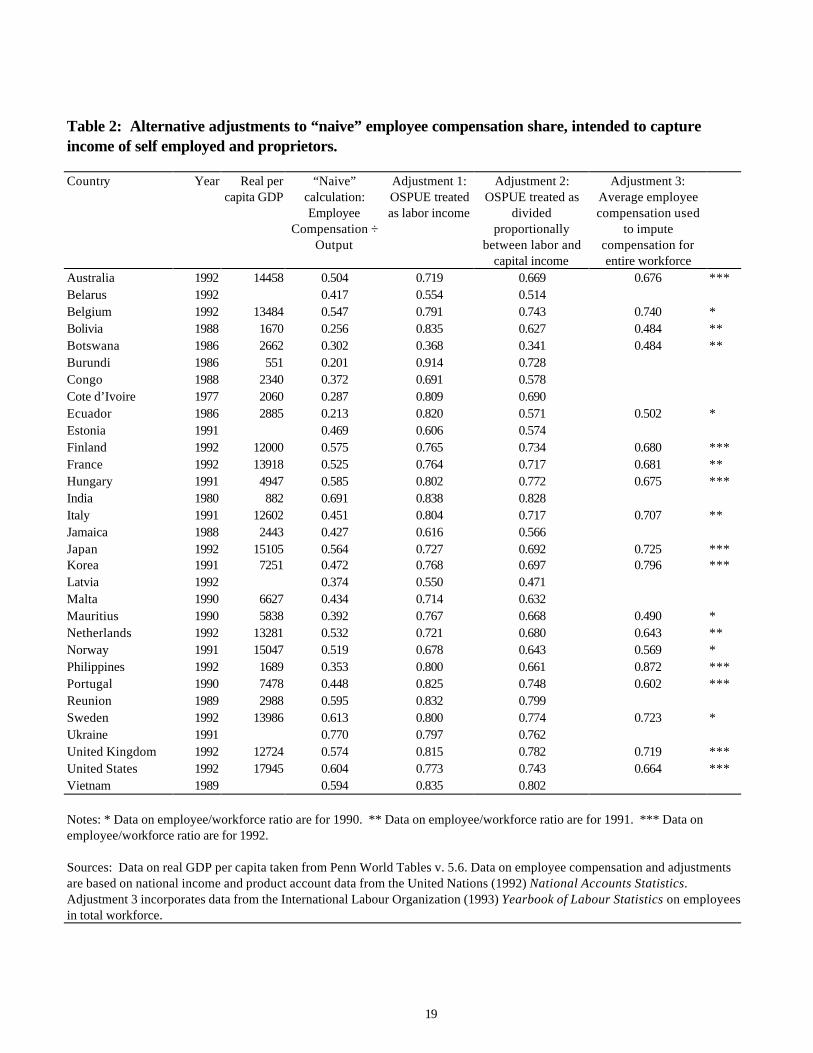
Table 2 shows the results of the three adjustments for all 31 countries for which data were
available on the operating surplus of private unincorporated enterprises. The third adjustment
can be computed only for a subset of 19 countries with contemporaneous data on the number
of employees in the workforce. Thus, the data do not permit a full comparison with all the
countries for which the employee compensation share can be calculated. Nonetheless, the
results are suggestive. For the 31 countries, the “naive” calculation, which simply gives the
employee compensation share of GDP, yields widely varied results, ranging from 0.201 for
15 Specifically, the labor share computed using this adjustment is [(Employee Compensation ÷ Number of Employees) × Total Workforce] ÷ GDP. 16 A potential difficulty with this approach is that it can in principle lead to labor shares greater than 1.0. This problem does not arise, however, with the data used in this paper.
14.
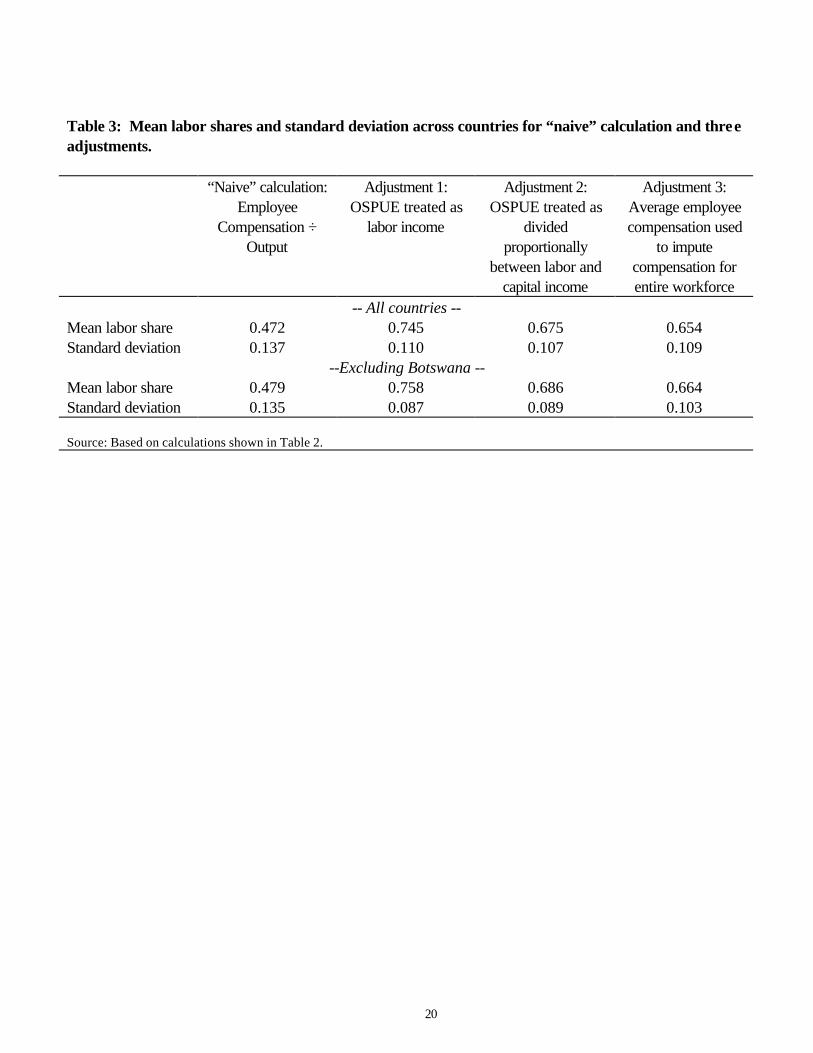
Burundi to 0.770 for Ukraine. The mean is 0.472, with a standard deviation of 0.137. All
three of the adjustments give higher mean values for labor shares, with much lower variance
across countries. Table 3 summarizes the means and standard deviations for the “naive”
calculation and the three proposed adjustments. Since Botswana appears to be an outlier,
Table 8 also shows how mean values and standard deviations change when Botswana is
omitted.
A quick glance at the data in Tables 2 and 3 reveals that Adjustments 1 and 2 appear to
resurrect the hypothesis that factor shares are constant across countries. Using either
adjustment, it appears that labor shares are quite stable across countries, regardless of the levels
of income per capita. Moreover, these shares cluster in a range from 0.60 to 0.85, depending
on which adjustment is used.17 This is precisely the range in which time series values for the
U.S. and U.K. tend to fall, lending some support to the idea that the cross section and time
series values are essentially consistent.
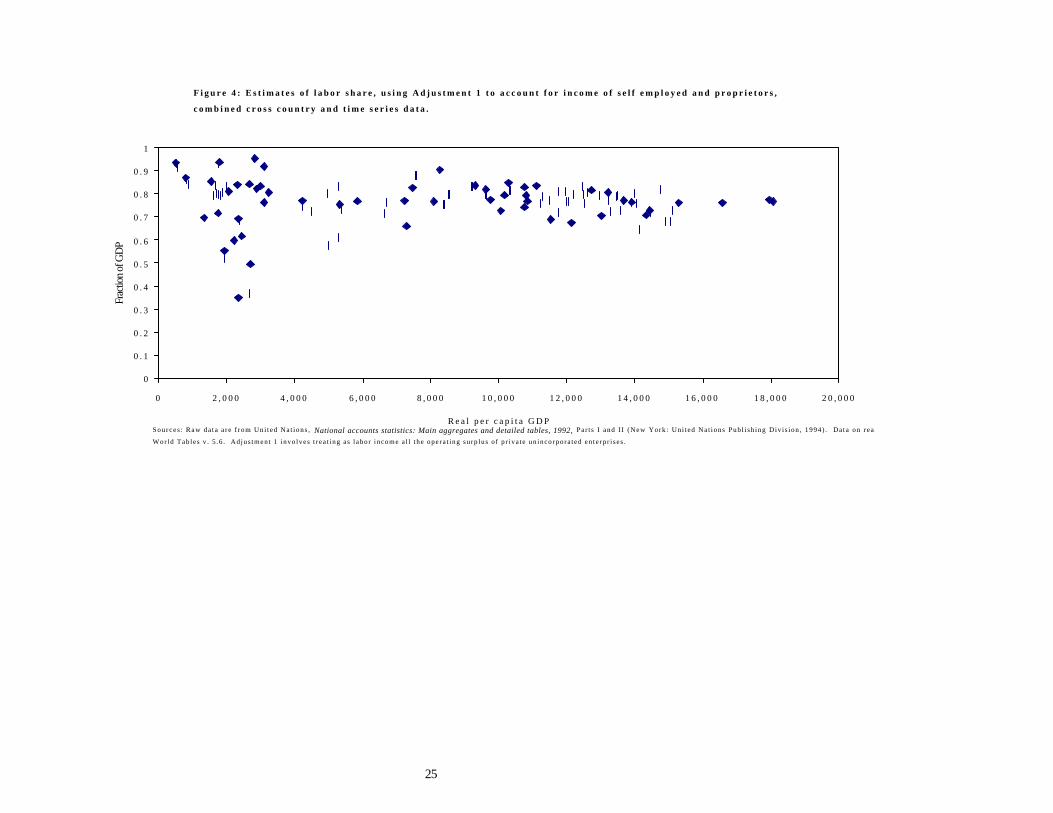
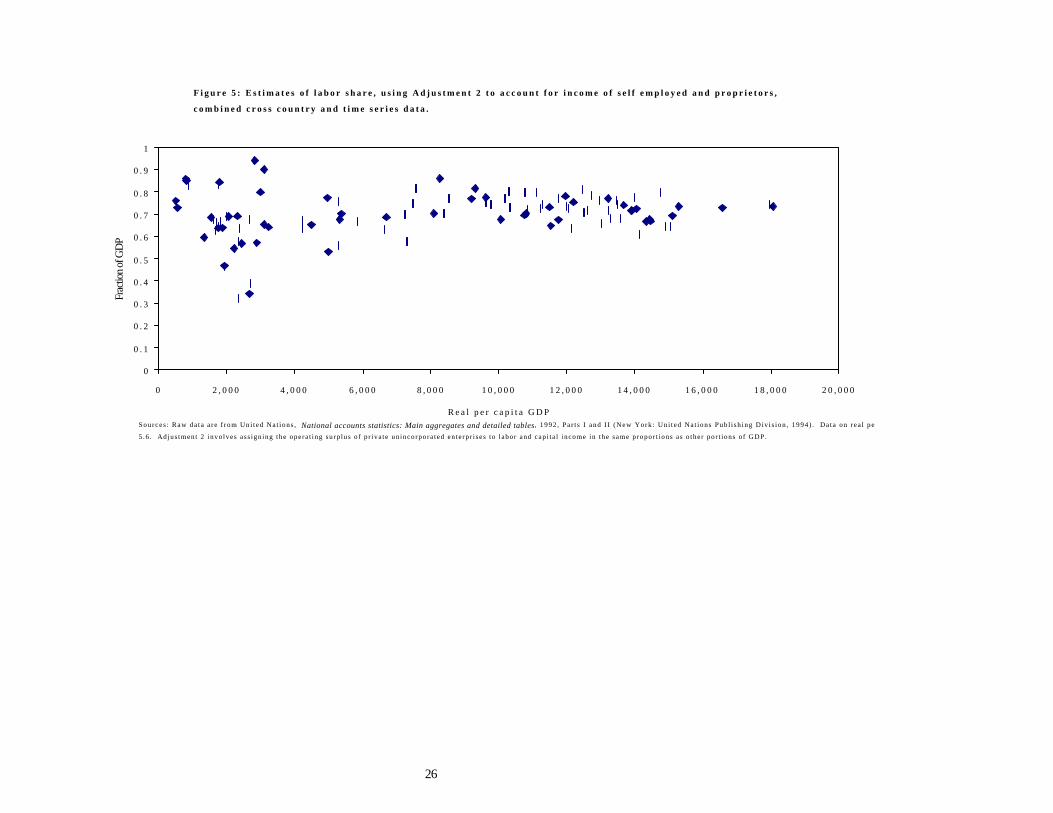
We can also examine the pooled cross-section and time series data to ask whether the
labor shares are consistent. For all countries and time periods available in the U.N. data,
Figures 4 and 5 plot labor shares against real per capita GDP using Adjustments 1 and 2. In
contrast to the data for the naive approach, which are shown in Figure 2, the scatter plots for
the adjusted data display surprisingly low variance and are relatively flat. The variance is in
general higher for poor countries than for rich countries, suggesting perhaps that data quality
17 Using Adjustment 1, we find only three countries with labor shares below 0.60 and one country with a labor share above 0.85; using Adjustment 2, we find three countries with labor shares below 0.55 and two above 0.80. In contrast, the “naive” calculations give four countries with labor shares below 0.30 and two above 0.65.
15.
may be a problem in the poor countries. Certainly, there is nothing in Figures 4 and 5 to suggest
that there are systematic differences between rich and poor countries in factor shares.
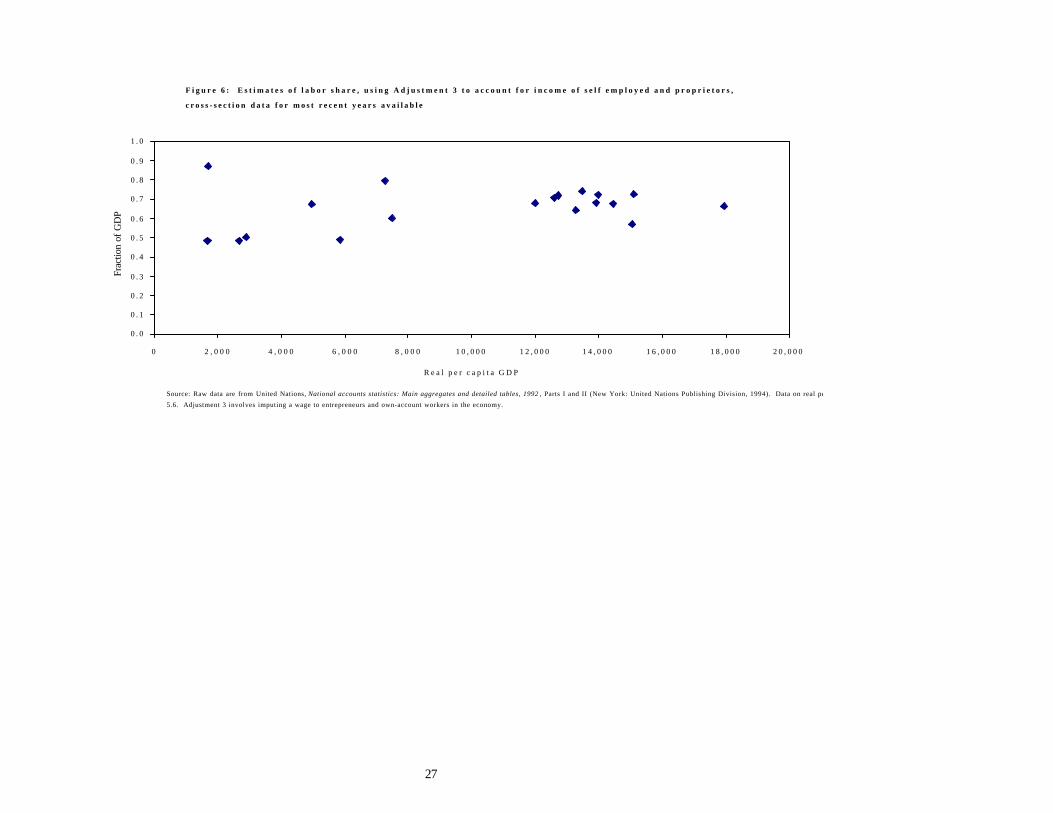
Adjustment 3, which computes labor shares based on average employee compensation,
also yields relatively flat results, although the data are available for a smaller number of
countries. (See Figure 6.) Here, too, the remaining variation in factor shares is not obviously
linked to income per capita.
4. Conclusions and implications
The main finding of this paper is that simple and straightforward adjustments to the usual
calculations of factor shares give estimates that are remarkably consistent with the claim that
factor shares are approximately constant across time and space. The usual “naive” calculation
of labor shares using employee compensation as a fraction of GDP makes an obvious
and important error in failing to account for labor income of the self employed and other
entrepreneurs. Labor force data suggest that this error may be particularly important in poor
countries, where small enterprises and self employment account for large fractions of the
workforce. Three possible corrections are considered. All three adjustments result in greater
uniformity of estimated labor shares across countries. In particular, the first two adjustments
give estimated labor shares that are essentially flat across countries and over time. This finding
has implications for research in trade and growth theory. It has become widely accepted, in
recent years, that labor shares are lower in poor countries than in rich countries. This has led to
numerous ad hoc adjustments in growth models and trade models. This paper suggests that, for
many analyses, it is reasonable to use models that give rise to constant factor shares. At a more
16.
applied level, country-specific studies such as applied general equilibrium models used to
analyze trade or policy reform should take care to compute factor shares in ways that take
into account the labor income of entrepreneurs and the earnings of the self employed. Estimates
of factor shares that do not account for self-employment income will be seriously flawed,
especially in poor countries.
17.
References
Cobb, Charles W. and Paul H. Douglas. 1928. A theory of production. American Economic Review (March) 18: 139-65.
Gollin, Douglas. 1996. Small enterprises, self employment, and economic development. Ph.D.
thesis, University of Minnesota, Department of Economics. International Labour Organization. 1993. Year book of labour statistics. Geneva: International
Labour Office. Kaldor, Nicholas. 1958. Capital accumulation and economic growth. Prepared for Corfu
meeting of the International Economic Association in August 1958; published in The theory of capital, ed. F. Lutz (London: Macmillan, 1961).
Kravis, Irving. 1962. The structure of income: some quantitative essays. Philadelphia:
University of Pennsylvania Press. Mitchell, B. R. 1988. British historical statistics. Cambridge: Cambridge University Press. Olson, Mancur. 1996. Big bills left on the sidewalk: Why some nations are rich, and others poor.
Distinguished lecture on economics in government. Journal of Economic Perspectives 10(2), 3-24.
United Nations. 1989. National accounts statistics: Main aggregates and detailed tables.
New York: United Nations. United Nations. 1992. National accounts statistics: Main aggregates and detailed tables.
New York: United Nations. United States Department of Commerce, Bureau of Economic Analysis. 1986. National income
and product accounts, 1929-82: Statistical tables. Washington, DC: U.S. Government Printing Office.
U.S. Department of Commerce, Bureau of Economic Analysis. 1990. National income and
product accounts, 1959-88: Statistical tables. Washington, DC: US Government Printing Office.
Young, Alwyn. 1994. The tyranny of numbers: confronting the statistical realities of the East Asian growth experiences. NBER Working Paper No. 4680. Cambridge, Mass.: NBER.
Young, Alwyn. 2000. Gold into base metals: Productivity growth in the People’s Republic of
China. Manuscript. University of Chicago Graduate School of Business.
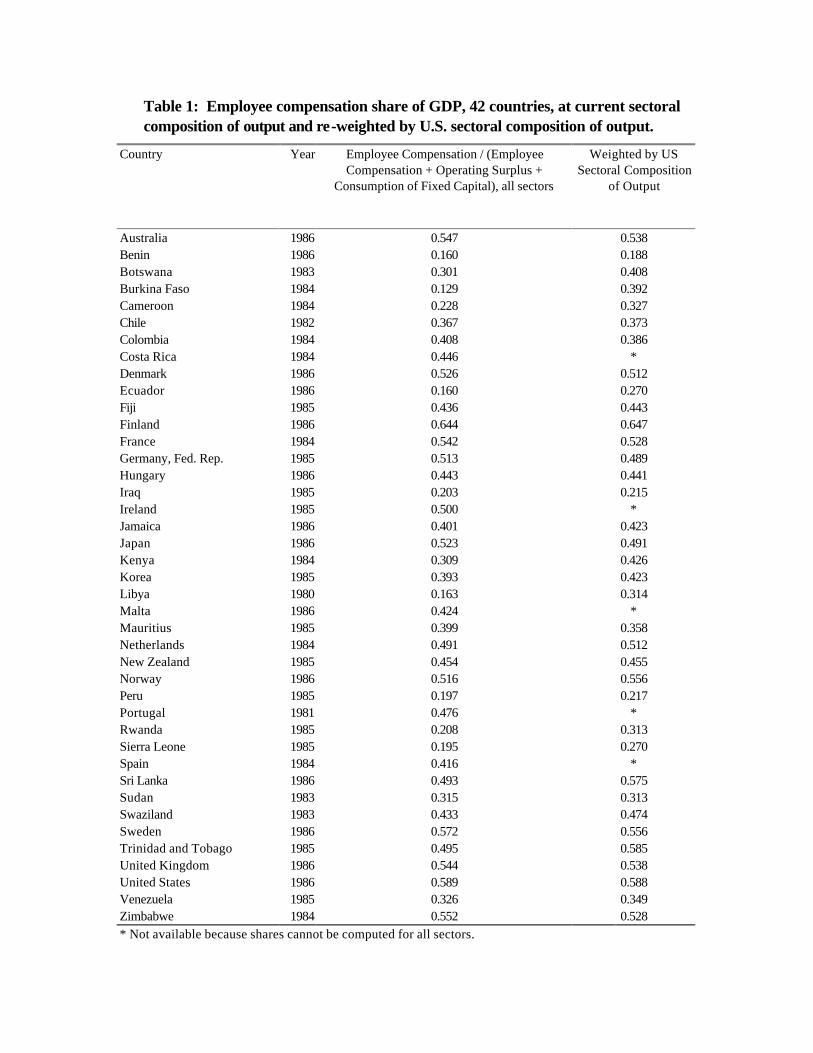
Table 1: Employee compensation share of GDP, 42 countries, at current sectoral composition of output and re-weighted by U.S. sectoral composition of output.
Country Year Employee Compensation / (Employee Compensation + Operating Surplus +
Consumption of Fixed Capital), all sectors
Weighted by US Sectoral Composition
of Output
Australia 1986 0.547 0.538 Benin 1986 0.160 0.188 Botswana 1983 0.301 0.408 Burkina Faso 1984 0.129 0.392 Cameroon 1984 0.228 0.327 Chile 1982 0.367 0.373 Colombia 1984 0.408 0.386 Costa Rica 1984 0.446 * Denmark 1986 0.526 0.512 Ecuador 1986 0.160 0.270 Fiji 1985 0.436 0.443 Finland 1986 0.644 0.647 France 1984 0.542 0.528 Germany, Fed. Rep. 1985 0.513 0.489 Hungary 1986 0.443 0.441 Iraq 1985 0.203 0.215 Ireland 1985 0.500 * Jamaica 1986 0.401 0.423 Japan 1986 0.523 0.491 Kenya 1984 0.309 0.426 Korea 1985 0.393 0.423 Libya 1980 0.163 0.314 Malta 1986 0.424 * Mauritius 1985 0.399 0.358 Netherlands 1984 0.491 0.512 New Zealand 1985 0.454 0.455 Norway 1986 0.516 0.556 Peru 1985 0.197 0.217 Portugal 1981 0.476 * Rwanda 1985 0.208 0.313 Sierra Leone 1985 0.195 0.270 Spain 1984 0.416 * Sri Lanka 1986 0.493 0.575 Sudan 1983 0.315 0.313 Swaziland 1983 0.433 0.474 Sweden 1986 0.572 0.556 Trinidad and Tobago 1985 0.495 0.585 United Kingdom 1986 0.544 0.538 United States 1986 0.589 0.588 Venezuela 1985 0.326 0.349 Zimbabwe 1984 0.552 0.528 * Not available because shares cannot be computed for all sectors.
19
Table 2: Alternative adjustments to “naive” employee compensation share, intended to capture income of self employed and proprietors. Country Year Real per
capita GDP “Naive”
calculation: Employee
Compensation ÷ Output
Adjustment 1: OSPUE treated as labor income
Adjustment 2: OSPUE treated as
divided proportionally
between labor and capital income
Adjustment 3: Average employee compensation used
to impute compensation for entire workforce
Australia 1992 14458 0.504 0.719 0.669 0.676 *** Belarus 1992 0.417 0.554 0.514 Belgium 1992 13484 0.547 0.791 0.743 0.740 * Bolivia 1988 1670 0.256 0.835 0.627 0.484 ** Botswana 1986 2662 0.302 0.368 0.341 0.484 ** Burundi 1986 551 0.201 0.914 0.728 Congo 1988 2340 0.372 0.691 0.578 Cote d’Ivoire 1977 2060 0.287 0.809 0.690 Ecuador 1986 2885 0.213 0.820 0.571 0.502 * Estonia 1991 0.469 0.606 0.574 Finland 1992 12000 0.575 0.765 0.734 0.680 *** France 1992 13918 0.525 0.764 0.717 0.681 ** Hungary 1991 4947 0.585 0.802 0.772 0.675 *** India 1980 882 0.691 0.838 0.828 Italy 1991 12602 0.451 0.804 0.717 0.707 ** Jamaica 1988 2443 0.427 0.616 0.566 Japan 1992 15105 0.564 0.727 0.692 0.725 *** Korea 1991 7251 0.472 0.768 0.697 0.796 *** Latvia 1992 0.374 0.550 0.471 Malta 1990 6627 0.434 0.714 0.632 Mauritius 1990 5838 0.392 0.767 0.668 0.490 * Netherlands 1992 13281 0.532 0.721 0.680 0.643 ** Norway 1991 15047 0.519 0.678 0.643 0.569 * Philippines 1992 1689 0.353 0.800 0.661 0.872 *** Portugal 1990 7478 0.448 0.825 0.748 0.602 *** Reunion 1989 2988 0.595 0.832 0.799 Sweden 1992 13986 0.613 0.800 0.774 0.723 * Ukraine 1991 0.770 0.797 0.762 United Kingdom 1992 12724 0.574 0.815 0.782 0.719 *** United States 1992 17945 0.604 0.773 0.743 0.664 *** Vietnam 1989 0.594 0.835 0.802 Notes: * Data on employee/workforce ratio are for 1990. ** Data on employee/workforce ratio are for 1991. *** Data on employee/workforce ratio are for 1992. Sources: Data on real GDP per capita taken from Penn World Tables v. 5.6. Data on employee compensation and adjustments are based on national income and product account data from the United Nations (1992) National Accounts Statistics. Adjustment 3 incorporates data from the International Labour Organization (1993) Yearbook of Labour Statistics on employees in total workforce.
20
Table 3: Mean labor shares and standard deviation across countries for “naive” calculation and three adjustments. “Naive” calculation:
Employee Compensation ÷
Output
Adjustment 1: OSPUE treated as
labor income
Adjustment 2: OSPUE treated as
divided proportionally
between labor and capital income
Adjustment 3: Average employee compensation used
to impute compensation for entire workforce
-- All countries -- Mean labor share 0.472 0.745 0.675 0.654 Standard deviation 0.137 0.110 0.107 0.109
--Excluding Botswana -- Mean labor share 0.479 0.758 0.686 0.664 Standard deviation 0.135 0.087 0.089 0.103 Source: Based on calculations shown in Table 2.
21
Appendix 1. Cost components and income shares in the United Nations System of National Accounts.
Category of income Description
Compensation of employees Includes wages and salaries (cash and in-kind), commissions, bonuses, tips, cost of living adjustments, vacation and sick leave allowances; also includes employer contributions to social security programs and pension schemes, employer contributions to insurance funds, employers’ paid and imputed contributions to pensions, family allowances, lay-off and severance pay, health plans, and other benefit packages.
Operating surplus Defined as a residual: the amount by which value added exceeds the sum of compensation of employees, consumption of fixed capital, and net indirect taxes.
Indirect taxes Taxes chargeable to the cost of production or sale of goods or services. These include: export and import duties; excise, sales, entertainment and turnover taxes; real estate and land taxes; value added taxes and taxes on the employment of labor; certain fees paid by producers; and operating surplus of certain kinds of government monopolies (e.g., tobacco or alcohol), which is in principle reduced for the “normal” profitsof similar business units.
Subsidies Grants on current account by the government to private enterprises and public corporations, or to unincorporated public enterprises when clearly intended to compensate for losses associated with government price policies.
Consumption of fixed capital Includes allowances for normal wear and tear, foreseen obsolescence and predictable unrepairable damage to capital, all valued at current replacement cost.
Source: Author’s condensation of notes in United Nations, “System of National Accounts,” Chapter I in National Accounts Statistics: Main Aggregates and Detailed Tables (New York: United Nations, 1992).
22
F i g u r e 1 : E m p l o y e e c o m p e n s a t i o n s h a r e o f G N P , U n i t e d S t a t e s a n d G r e a t B r i t a i n , 1 9 3 5 - 8 5 .
0
0 . 1
0 . 2
0 . 3
0 . 4
0 . 5
0 . 6
0 . 7
0 . 8
1935 1940 1945 1950 1955 1960 1965 1970 1975 1980 1985
D a t e
Fra
ctio
n of
GN
P
S o u r c e s : U . S . D e p a r t m e n t o f C o m m e r c e , B u r e a u o f E c o n o m i c A n a l y s i s , National income and product accounts, 1929-82: Statistical tables ( W a s h i n g t o n , D C : U S G o v e r n m e n t P r i n t i n g O f f i c e , 1 9 8 6 ) a n d U . S . D e p a r t m e n t o f C o m m e r c e , B u r e a u
o f Economic Ana ly s i s , National income and product accounts, 1959-88: Statistical tables (Wash ing ton , DC: US Gove rnmen t P r in t i ng Of f i ce , 1990 ) . B r i t i sh da t a : B . R . Mi t che l l , British historical statisticsPress , 1988) , pp . 823-825 .
23
F i g u r e 2 : E m p l o y e e c o m p e n s a t i o n s h a r e o f G D P , 8 1 c o u n t r i e s , m o s t r e c e n t y e a r s a v a i l a b l e ( 1 9 8 7 - 1 9 9 2 ) .
0
0 . 1
0 . 2
0 . 3
0 . 4
0 . 5
0 . 6
0 . 7
0 2 , 0 0 0 4 , 0 0 0 6 , 0 0 0 8 , 0 0 0 1 0 , 0 0 0 1 2 , 0 0 0 1 4 , 0 0 0 1 6 , 0 0 0 1 8 , 0 0 0 2 0 , 0 0 0
R e a l p e r c a p i t a G D P
Frac
tion
of G
DP
Sources : Uni ted Nat ions , National accounts statistics: Main aggregates and detailed tables, 1992, Par t s I and I I (New York : Uni ted Na t ions Pub l i sh ing Div i s ion , 1994) . Da ta on rea l pe r cap i t a GDP a re f rom Penn Wor ld Tab les v . 5 .6 .
United Arab Emirates
24
F i g u r e 3 : E m p l o y e r s a n d o w n - a c c o u n t w o r k e r s a s s h a r e o f t o t a l w o r k f o r c e , b y r e a l p e r c a p i t a G D P , f o r a l l 5 0
c o u n t r i e s w i t h a v a i l a b l e d a t a ( a p p r o x i m a t e l y 1 9 9 2 )
0
0 . 1
0 . 2
0 . 3
0 . 4
0 . 5
0 . 6
0 2 , 0 0 0 4 , 0 0 0 6 , 0 0 0 8 , 0 0 0 1 0 , 0 0 0 1 2 , 0 0 0 1 4 , 0 0 0 1 6 , 0 0 0 1 8 , 0 0 0 2 0 , 0 0 0
R e a l p e r c a p i t a G D P
Frac
tion
of w
orkf
orce
Sources : In te rna t iona l Labour Of f ice , Year book of labour statistics (Geneva : In te rna t iona l Labour Organ ixa t ion , 1993) . Da ta on rea l pe r cap i t a GDP f rom Penn Wor ld Tab les v . 5 .6 .
25
F i g u r e 4 : E s t i m a t e s o f l a b o r s h a r e , u s i n g A d j u s t m e n t 1 t o a c c o u n t f o r i n c o m e o f s e l f e m p l o y e d a n d p r o p r i e t o r s ,
c o m b i n e d c r o s s c o u n t r y a n d t i m e s e r i e s d a t a .
0
0 . 1
0 . 2
0 . 3
0 . 4
0 . 5
0 . 6
0 . 7
0 . 8
0 . 9
1
0 2 , 0 0 0 4 , 0 0 0 6 , 0 0 0 8 , 0 0 0 1 0 , 0 0 0 1 2 , 0 0 0 1 4 , 0 0 0 1 6 , 0 0 0 1 8 , 0 0 0 2 0 , 0 0 0
R e a l p e r c a p i t a G D P
Frac
tion
of G
DP
Sources : Raw da t a a r e f rom Uni t ed Na t ions , National accounts statistics: Main aggregates and detailed tables, 1992, Par t s I and I I (New York : Uni ted Na t ions Pub l i sh ing Div i s ion , 1994) . Da ta on rea l pe r cap i t a GDP a re f rom Penn
Wor ld Tab les v . 5 .6 . Adjus tment 1 invo lves t r ea t ing as l abor income a l l the opera t ing su rp lus o f p r iva te un incorpora ted en te rp r i ses .
26
F i g u r e 5 : E s t i m a t e s o f l a b o r s h a r e , u s i n g A d j u s t m e n t 2 t o a c c o u n t f o r i n c o m e o f s e l f e m p l o y e d a n d p r o p r i e t o r s ,
c o m b i n e d c r o s s c o u n t r y a n d t i m e s e r i e s d a t a .
0
0 . 1
0 . 2
0 . 3
0 . 4
0 . 5
0 . 6
0 . 7
0 . 8
0 . 9
1
0 2 , 0 0 0 4 , 0 0 0 6 , 0 0 0 8 , 0 0 0 1 0 , 0 0 0 1 2 , 0 0 0 1 4 , 0 0 0 1 6 , 0 0 0 1 8 , 0 0 0 2 0 , 0 0 0
R e a l p e r c a p i t a G D P
Frac
tion
of G
DP
Sources : Raw da t a a r e f rom Uni t ed Na t ions , National accounts statistics: Main aggregates and detailed tables, 1992 , Pa r t s I and I I (New York : Un i t ed Na t ions Pub l i sh ing Div i s ion , 1994) . Da ta on r ea l pe r cap i t a GDP a re f rom Penn Wor ld Tab le s v .
5 .6 . Adjus tment 2 invo lves ass ign ing the opera t ing surp lus o f p r iva te un incorpora ted en te rpr i ses to l abor and cap i ta l income in the same propor t ions as o ther por t ions o f GDP.
27
F i g u r e 6 : E s t i m a t e s o f l a b o r s h a r e , u s i n g A d j u s t m e n t 3 t o a c c o u n t f o r i n c o m e o f s e l f e m p l o y e d a n d p r o p r i e t o r s ,
c r o s s - s e c t i o n d a t a f o r m o s t r e c e n t y e a r s a v a i l a b l e
0 . 0
0 . 1
0 . 2
0 . 3
0 . 4
0 . 5
0 . 6
0 . 7
0 . 8
0 . 9
1 . 0
0 2 , 0 0 0 4 , 0 0 0 6 , 0 0 0 8 , 0 0 0 1 0 , 0 0 0 1 2 , 0 0 0 1 4 , 0 0 0 1 6 , 0 0 0 1 8 , 0 0 0 2 0 , 0 0 0
R e a l p e r c a p i t a G D P
Frac
tion
of G
DP
Source: Raw data are from United Nations, National accounts statistics: Main aggregates and detailed tables, 1992 , Parts I and II (New York: United Nations Publishing Division, 1994). Data on real per capita GDP are from Penn World Tables v.
5.6. Adjustment 3 involves imputing a wage to entrepreneurs and own-account workers in the economy.