Embed Size (px)
Citation preview
Forschungsinstitut zur Zukunft der ArbeitInstitute for the Study of Labor
DI
SC
US
SI
ON
P
AP
ER
S
ER
IE
S
Getting Grey Hairs in the Labour Market:An Alternative Experiment on Age Discrimination
IZA DP No. 9289
August 2015
Stijn BaertJennifer NorgaYannick ThuyMarieke Van Hecke
Getting Grey Hairs in the Labour Market: An Alternative Experiment on
Age Discrimination
Stijn Baert Ghent University, University of Antwerp,
Université catholique de Louvain and IZA
Jennifer Norga
Ghent University
Yannick Thuy
Ghent University
Marieke Van Hecke
Ghent University
Discussion Paper No. 9289 August 2015
IZA
P.O. Box 7240 53072 Bonn
Germany
Phone: +49-228-3894-0 Fax: +49-228-3894-180
E-mail: [email protected]
Any opinions expressed here are those of the author(s) and not those of IZA. Research published in this series may include views on policy, but the institute itself takes no institutional policy positions. The IZA research network is committed to the IZA Guiding Principles of Research Integrity. The Institute for the Study of Labor (IZA) in Bonn is a local and virtual international research center and a place of communication between science, politics and business. IZA is an independent nonprofit organization supported by Deutsche Post Foundation. The center is associated with the University of Bonn and offers a stimulating research environment through its international network, workshops and conferences, data service, project support, research visits and doctoral program. IZA engages in (i) original and internationally competitive research in all fields of labor economics, (ii) development of policy concepts, and (iii) dissemination of research results and concepts to the interested public. IZA Discussion Papers often represent preliminary work and are circulated to encourage discussion. Citation of such a paper should account for its provisional character. A revised version may be available directly from the author.
IZA Discussion Paper No. 9289 August 2015
ABSTRACT
Getting Grey Hairs in the Labour Market: An Alternative Experiment on Age Discrimination
This study presents a new field experimental approach for measuring age discrimination in hiring. In addition to the classical approach in which candidates’ ages are randomly assigned within pairs of fictitious resumes that are sent to real vacancies, we randomly assign activities undertaken by the older candidates during their additional life years between these pairs. When applying this design to the Belgium case, we find that age discrimination is fundamentally heterogeneous by older candidates’ career pattern. Older age affects call-back only (negatively) in case older candidates were inactive or employed in an out-of-field job during their additional post-educational years.
NON-TECHNICAL SUMMARY We measured age discrimination in the Belgian labour market. To this end, we sent out fictitious job applications, only differing in age, to real vacancies. We distinguished between older candidates who were (i) employed in an in-field job, (ii) employed in an out-of-field job or (iii) inactive during their additional post-educational years (in comparison to the younger fictitious candidates). We found that revealing an older age decreased the probability of getting invited to a job interview with 65.0% when revealing out-of-field employment and with 41.2% when revealing inactivity. On the other hand, older candidates with more in-field employment had the same hiring chances as their younger counterparts. JEL Classification: C90, C93, J14, J71 Keywords: age discrimination, design of experiments, field experiments,
difference in post-educational years problem, ageing, hiring discrimination Corresponding author: Stijn Baert Ghent University Sint-Pietersplein 6 9000 Gent Belgium E-mail: [email protected]
1
1 Introduction
Population ageing is one of the most pressing challenges facing the western world.
In 2050, for every person over the age of 65, there will be only 2.7 individuals of
working age in the United States and 1.9 in Western Europe compared to 5.4 and
4.2, respectively, in 2000.1 This ageing places substantial pressure on public
finances (pensions and medical care). It is a widespread belief that the only viable
solution to cut this ageing cost without compromising living standards is to
encourage older workers to remain in the labour force (Lahey, 2008; OECD, 2006;
Riach and Rich, 2010). During the past decade many countries have carried out
reforms in this direction. Sonnet et al. (2014) review that these reforms have
improved the labour market situation of older workers. Still, activity rates among
the older age groups are relatively low, especially in Europe. In the EU-15, the
employment rate for the 50 to 64 age group was 61.2% compared to 77.0% for the
25 to 49 age group in 2013. In Belgium, the country of analysis in this study, these
numbers are even more divergent: 54.0% versus 79.9% respectively.2 It is
important to determine the nature of these remaining gaps to design further
effective policy actions. Theoretically, there are three explanations for these gaps:
(i) differences in supply side productivity, (ii) differences in supply side preferences
and behaviour and (iii) differences in demand side preferences and behaviour.
While traditionally policy discussions have focussed only on supply-side factors,
policy attention has recently shifted more and more to the latter channel, better
known as discrimination (Sonnet et al., 2014). In this study we focus on the
estimation of age discrimination at the moment at which it is the least risky for
employers and therefore the most likely to occur, i.e. at first hiring decisions
(Bendick et al., 1999; Cédiey et al., 2008; Lahey, 2008).
Hiring discrimination against older candidates can be expected based on the
theories of taste-based discrimination (Becker, 1957) and statistical discrimination
(Arrow, 1973). Following the former theoretical model, employers, customers and
1 Source: United Nations, World Population Prospects: The 2015 Revision (“Old-age dependency ratio
65+/(15–64) by major area, region and country”; Estimates 1950–2015; Medium fertility variant prospections
2015–2100). Western Europe comprises Austria, Belgium, France, Germany, Luxembourg, the Netherlands and
Switzerland.
2 Source: Eurostat, Labour Force Survey (“Employment rate by age groups”).
2
co-workers may experience a disutility by dealing with older workers. Following the
latter model, employers may judge individual older workers on group
characteristics rather than on their individual merits. Adverse group characteristics
of the elderly, at least in the perception of employers, might be: (i) showing less
energy, motivation, creativity, flexibility and/or adaptability; (ii) being more difficult
to supervise; (iii) having poorer health; (iv) facing obsolescence of their human
capital; and (v) having higher salary aspirations (Albert et al., 2011; Bendick et al.,
1996; Lahey, 2008; Riach and Rich, 2010).
Over the last two decades, scholars have attempted to measure age
discrimination in the labour market. To this end, 10 studies applied the golden
standard to identify unequal treatment in the labour market, i.e. correspondence
experiments. Within these experiments, pairs of fictitious job applications are sent
to real job openings. These applications differ only by the ground of discrimination
that is tested. By monitoring the subsequent call back, unequal treatment based on
this characteristic is identified and can be given a causal interpretation. Based on
the application of this experimental setting, high levels of age discrimination are
found in Australia, England, France, Spain, Sweden and the United States (Ahmed
et al., 2012; Albert et al., 2011; Bendick et al., 1996; Bendick et al., 1999; Gringart
and Helmes, 2001; Lahey, 2008; Riach and Rich, 2006a; Riach and Rich, 2007; Riach
and Rich, 2010; Tinsley, 2012). However, the (classical) application of the
correspondence experimentation framework by the cited former contributions is
problematic due to a complication which we label in the present study as the
Difference in Post-Educational Years Problem. An older person inevitably has, in
comparison with a younger person with the same educational background, a
higher number of post-educational years at the moment of her/his application. The
mentioned correspondence studies “filled” these additional years in the resume of
the older candidates with a particular activity (additional in-field employment, out-
of-field employment or inactivity) or let employers fill them in themselves (by
limiting the mentioned professional experience to the most recent career years).
This mentioned or perceived particular activity undertaken by the older candidates
may, however, yield a positive or negative signal towards employers per se and
might, thereby, bias discrimination measures downwards or upwards, respectively.
In other words, based on the experimental design applied by the former
contributions, it is difficult to determine whether unequal treatment is attributable
3
to age discrimination or discrimination based on differences in human capital or
career gaps.
In the present study, we deal with the Difference in Post-Educational Years
Problem by proposing an extended correspondence experiment. In this extended
design, we combine the classical within-pair-randomisation of the age of fictitious
job candidates with a between-pair-randomisation of the activity the older
candidates undertook during their additional post-educational years. We report on
the application of this framework to measure age discrimination in the Belgian
labour market. During six months, we sent out pairs of (female or male) fictitious
job applicants to a balanced number of vacancies for the (middle-)low-skilled
occupations of production worker, administrative clerk and waiter and for the
(middle-)high-skilled occupations of laboratory worker, management assistant and
sales representative. For each vacancy, in one of both applications the younger age
of 38 or 44 was disclosed and in the other one the older age of 44 or 50.
Furthermore, we randomly assigned one out of three activities performed during
her/his 6 or 12 post-educational years to the older pair member: in-field
employment, out-of-field employment or inactivity. Thereby, we are able to
measure unequal treatment based on age in three realistic situations.
Readers may take an interest in the present study for a number of additional
reasons. Firstly, while former contributions have focussed on estimating age
discrimination in one or two, mostly (middle-)low skilled, occupations,3 we test
vacancies in six occupations at two different qualification levels and in three
different areas. This design is not only preferable in terms of generalisability of the
research results but it also allows us to investigate whether age discrimination is
heterogeneous by qualification level and/or by occupation characteristics.
Secondly, we use both pairs of female and pairs of male applicants, which also
allows us to inspect gender heterogeneity in age discrimination. Thirdly, the
difference in age within a pair is within our setting 6 or 12 years. On the one hand,
these age differences are substantially smaller than the age differences adopted in
the literature (on average 20 years),4 yielding in our opinion a more realistic
3 Albert et al. (2011) is to some extent an exception as they have some (slight) variation in the area and the
qualification level of the clerk positions they include in their experiment (sales representative, marketing
technician, accountant’s assistant, accountant, administrative assistants and executive secretary).
4 Own calculation based on columns (5) and (6) of Table 1.
4
experimental setting; unequal treatment of relatively close age groups is a stronger
signal for age discrimination per se. On the other hand, this variation in age
difference allows us to look into whether unequal treatment varies linearly with
this difference. Fourthly, several of the mentioned features of our experimental
design allow us to discuss the validity of the taste-based and statistical
discrimination models in their application to age discrimination.
The present study is structured as follows. In the next section we provide the
reader with a systematic literature review of the former correspondence studies
on age discrimination, with a focus on how these former contributions dealt with
the Difference in Post-Educational Years Problem. In Section 3 we explain how we
take this problem into account by means of our experimental design. Section 4
reports our measures of age discrimination based on an econometric analysis of
the experimentally gathered data. A final section concludes.
2 The Literature and its Main Lacuna
2.1 Correspondence Experimental Evidence on Age
Discrimination
Over the past decades, economists have conducted various correspondence
experiments to measure discrimination in the labour market. Within this type of
experiments, pairs of fictitious job applications are sent to real job openings. These
applications differ only in the characteristic that is to be tested. This characteristic
is randomly assigned within the pair of applicants. By monitoring subsequent call-
back unequal treatment in first hiring decisions based on this characteristic can be
identified.5 In the beginning, correspondence experiments were exclusively applied
5 Correspondence experiments focus on a very specific interaction between employers and employees.
Because by means of a correspondence test one simply measures call-back rates for first interviews, the research
results based on such a test do not allow making any statements about discrimination in the later stages of the
selection process, let alone in promotion opportunities and wages. However, Bertrand and Mullainathan (2004)
argue that a lower number of interview rates are expected to be reflected in reduced job offers and in lower
earnings. Moreover, since job interviews are costly, firms invite candidates to an interview only if these candidates
have a reasonably high chance of getting the job. In addition, Lahey (2008) argues that employers who wish to
5
to investigate racial and sex discrimination (Bertrand and Mullainathan, 2004;
Pager, 2007; Riach and Rich, 2002). More recently, correspondence tests have
been used to study discrimination based on other grounds, such as beauty,
criminal background and sexual orientation (Baert and Verhofstadt, 2015; Drydakis,
2009; Drydakis, 2011; Rooth, 2009). In addition, scholars have started to employ
correspondence experiments to study phenomena other than labour market
discrimination in strict sense, such as unemployment duration dependence and the
labour market penalty of motherhood (Baert, 2014; Eriksson and Rooth, 2014;
Kroft et al., 2013).
Correspondence testing is the golden standard for identifying unequal
treatment in the labour market as it allows, in theory, to disentangle discrimination
from supply-side determinants of labour market outcomes. This is the case when,
in practice, the experiment is designed in such a way that it controls strictly for all
productivity related characteristics of the fictitious applicants used so that the only
distinguishing feature of the two pair members is the characteristic which is to be
tested. In its application to race and sex discrimination, unequal treatment is easily
isolated by just randomly assigning the pair members’ names. In the case of age
discrimination, strictly equating candidates except for their age is trickier, as will
become clear in the following subsection.
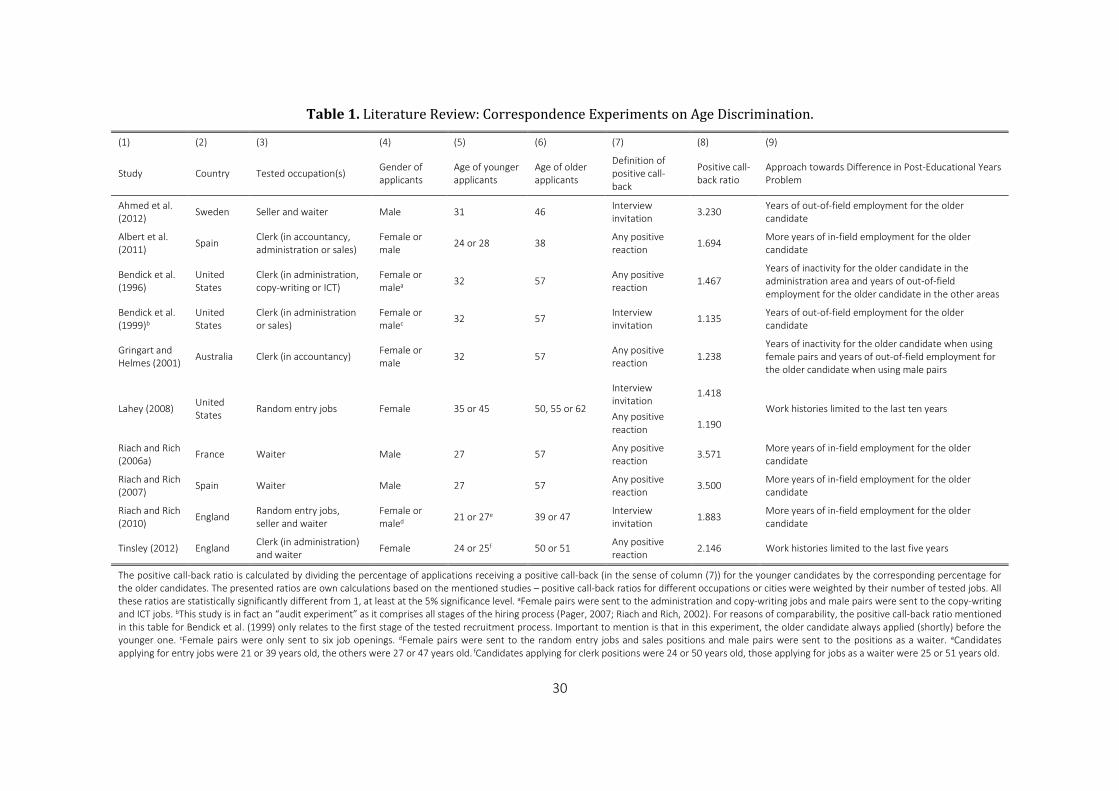
In Table 1 we systematically review the former correspondence studies on age
discrimination we are aware off. As indicated in column (2) and column (3), these
studies were conducted between 1996 and 2012 in Australia, England, France,
Spain, Sweden and the United States. In columns (3) up to (6) important modalities
of these experiments are summarised: the tested occupation(s), the gender of the
applicants and the age combinations used. Columns (7) and (8) focus on the level
of unequal treatment estimated. In the latter column, the overall measure of
discrimination is presented for each study. This measure is the positive call-back
discriminate against certain groups of workers without being sued would prefer to do this in the first step of the
hiring stage since it is more difficult for individuals to determine why they fail to receive a job interview than it is
to determine why they do not get the job after an interview or why they do not get promoted or get fired after
being hired. This reasoning is consistent with the international evidence of (i) a relatively low number of job-losses
among older workers compared to other age categories on the one hand and (ii) a relatively low probability to
leave unemployment for work within a given period of time among them (Tinsley, 2012). Moreover, Bendick et al.
(1999) and Cédiey et al. (2008) reported (based on their field experiments comprising all stages of the hiring
process) that, at the moment of their study, about 75% of age discrimination in the United States and about 85%
of ethnic discrimination in France, respectively, occurred in the first stage of the recruitment process.
6
ratio. It is calculated by dividing the percentage of applications receiving a positive
call-back for the younger candidates (whose ages are in column (5)) by the
corresponding percentage for the older candidates (whose ages are in column (6)).
The definition of positive call-back used in the studies is mentioned in column (7).
For instance, the positive call-back ratio of about 3.2 found by Ahmed et al. (2012)
indicates that the 31-years-old candidates in their experiment got on average 3.2
times more job interview invitations than their 46-years-old counterparts when
applying for positions as a seller or a waiter in Sweden.
We identify three important patterns through the examination of Table 1.
Firstly, in all tested countries, age discrimination is present and relatively high in
magnitude. All presented positive call-back ratios are statistically significantly
different from 1, at least at the 5% significance level. Moreover, the levels of age
discrimination are higher than the levels of discrimination based on ethnicity,
gender or sexual orientation as estimated by other field experiments in the same
country in the same period (Ahmed et al., 2013; Bendick, 1996; Berson, 2012,
Bertrand and Mullainathan, 2004; Booth and Leigh, 2010; Booth et al., 2012;
Carlsson and Rooth, 2007; Petit, 2007; Riach and Rich, 2006b; Wood et al., 2009).
Secondly, age discrimination is already present at relatively early ages. For
instance, Albert et al. (2011) showed that Spanish firms show a substantial fall in
interest for 38-years-old candidates compared to candidates aged 24 or 28.
Thirdly, the outlined studies differ substantially in the modalities of their
experiments. The age of the younger candidates ranges from 24 to 45 and the age
of their older counterparts from 38 to 62. As mentioned in Section 1, the former
contributions have focussed on estimating age discrimination in specific, mostly
(middle-)low skilled occupations. Administrative (clerk) jobs and vending jobs
(seller and waiter) dominate the tested positions. Remarkably, the positive call-
back ratios are more to the detriment of older candidates in experiments testing
the latter occupations compared to experiments testing the former ones. We come
back to this finding later when we present our own research findings. On the other
hand, no clear patterns emerge in the discrimination ratio by the region (country
and continent) of the experiment, the gender of the applicants and the particular
age combinations used.
7
2.2 Difference in Post-Educational Years Problem
As mentioned above, in order to get clean estimates of discrimination by means of
a correspondence experiment, one has to strictly equate the applications of the
fictitious pairs that are sent to employers except for the ground of discrimination.
However, in the case of age as a ground of discrimination, equating equally
educated candidates of a different age with respect to their past career is
essentially impossible. We label this problem as the “Difference in Post-Educational
Years Problem”.
This problem is related to the fact that the older candidate within each pair will
have a higher number of post-educational years at the moment of her/his
application. As a result, it is only feasible to equate a part of the career of both pair
members, i.e. a period of the length of the younger pair member. The remaining
part may result in more active years for the older candidate and therefore more
(potentially in-field) experience. This additional amount of experience might yield a
positive signal towards employers and, therefore, higher hiring chances ceteris
paribus. On the other hand, more experience may translate into higher salary
aspirations so that the effect on hiring chances may just as well go in the opposite
direction. Alternatively, the older candidate’s additional years may result in more
inactive years for the older candidate. This might yield a negative signal towards
employers and, therefore, lower hiring chances ceteris paribus.
As a result, it is not possible to disentangle unequal treatment caused by this
additional trajectory from discrimination based on age by means of a classical
correspondence test in which the post-educational years of the older candidate are
filled in a particular way, as the contributions listed in Table 1 did. As mentioned in
the previous section, the younger and older candidates within the pairs sent to
employers within these studies differed, on average, 20 years in age. It is very
unlikely that the activity job candidates undertake during such a long period does
not affect employers’ hiring decisions. This problem was mentioned in many of the
studies and authors often provide the reader with an argumentation for their
particular choice for (not) filling in the surplus years, but it was never tackled
fundamentally, neither by adapting the correspondence experimentation
framework nor by another way-out. Their approaches towards the Difference in
Post-Educational Years Problem are summarised in column (9) of Table 1.
8
A first approach, adopted by Ahmed et al. (2012), Bendick et al. (1996), Bendick
et al. (1999) and Gringart and Helmes (2001), has been to fill the additional post-
educational years in the resume of the older candidates with inactivity or out-of-
field employment, i.e. employment unrelated to the vacancies for which these
candidates applied. For instance, the additional years were ascribed to military
employment in Ahmed et al. (2012) and to military employment or teaching in
Bendick et al. (1999). When authors chose to fill in the additional years with
inactivity, older candidates mentioned they had been out of the labour force while
raising children. Strictly speaking, these solutions yielded younger and older
candidates with the same educational attainment as well as the same relevant (i.e.
in-field) work experience. However, as mentioned above, both the choice for
employment in another field and the choice for being out of the work force might
be perceived by employers as a negative signal (for instance, a signal of less
interest in the occupation for which one applied or a signal of weak labour market
commitment). Therefore, the measure of discrimination against older workers
found by this approach might be biased upwards.
A second approach used in the literature is to fill in the extra post-educational
years of older candidates with in-field employment. This was done by Albert et al.
(2011), Riach and Rich (2006a), Riach and Rich (2007) and Riach and Rich (2010).
They argue that one should accept that in reality the experience component of (the
human capital of) a candidate does vary between age groups and, therefore, allow
this dimension to vary within the experiment. On the other hand, Riach and Rich
(2010) acknowledge that age discrimination in this setting should be seen as an
upper bound (“a very significant level of prejudice”) of age discrimination in reality.
They, in other words, accept that their measures of unequal treatment are in fact a
combination of age discrimination (expected to be to the detriment of older
candidates) and a profit-maximising response to differential human capital (in
favour of older candidates).
A last alternative approach used by earlier correspondence studies was the one
outlined by Lahey (2008) and Tinsley (2012). In their experiments, both the
younger and older candidates only mentioned the last part of their career
trajectory in their written resumes. Thereby, the authors did not have to inform
the employer about what the older candidate did during her/his extra post-
educational years. In our opinion, this approach is cleaner than the former two
9
ones. In addition, Lahey (2008) argues that her design is realistic. In a footnote of
her study, she mentions that recruiters in the United States even indicated that
ten-year career histories are – or at least were at the moment of her research –
the golden standards for resumes. While this setting might, indeed, be realistic (for
low-skilled positions) in the United States, this may not be the case (for other
positions) in other countries. For instance, in Belgium, a sample of ten human
resource managers declared that resumes most commonly comprise an exhaustive
enumeration of one’s former jobs.6 In addition, by not mentioning the complete
career of the job candidates, one in fact let employers fill in the gaps themselves.
As a result, it is unclear in which setting age discrimination is measured. Moreover,
the effect on hiring chances of limiting one’s work history to the last five or ten
years might be heterogeneous by the candidate’s age, which might bias
discrimination measures.
By just picking out one of the potential activities undertaken by older
candidates during their extra post-educational years (or by not mentioning these
activities), the former correspondence studies on age discrimination did present
unequal treatment in a very particular situation, without knowing how far their
measures were from the upper or lower bound of discrimination in reality. In
addition, the different approaches adopted by the former correspondence studies
on age discrimination make their results highly incomparable.
In the present study, we propose to extend the classical correspondence
testing framework with the randomised assignment of one out of the three
mentioned possibilities with which they may have filled their additional post-
educational years (in-field employment, out-of-field employment and inactivity) to
the older candidates’ resumes.7 Thereby, we are able to study unequal treatment
based on age in three realistic situations. Moreover, the discrimination measures in
each of these situations provide us with an indication of the importance of the
6 This is realistic to ask given that the average job tenure in Belgium for the aged 25 to 54 was 10.3 years in
2013 (source: Belgian Federal Public Service Employment, Labour and Social Dialogue).
7 As mentioned in Table 1, also Bendick et al. (1996) and Gringart and Helmes (2001) combined two different
approaches to fill in the additional post-educational years of older candidates (out-of-field employment and
inactivity). However, they did not randomly assign these alternatives, but followed a different approach depending
on the tested occupation or the gender of the candidate. Thereby, they were not able to disentangle the
heterogeneity in age discrimination by occupation or gender from the heterogeneity by the career pattern of the
older candidate.
10
Difference in Post-Educational Years Problem.
3 The Experiment
We conducted our experiment between December 2014 and May 2015 in the
labour market of Flanders, the Northern part of Belgium. Two applications of job
candidates were sent to each vacancy we selected from the database of the Public
Employment Agency of Flanders, the region’s major job search channel. For each
tested occupation, we constructed two comparable job application templates, only
differing in details and lay-out. For each vacancy, we randomly assigned the
younger and older age to one of these template types and sent the resulting
combinations in a randomised order to the employer. In addition, three particular
age combinations, three different activities undertaken by the older candidates
during their extra post-educational years and the female or male gender (equal for
both pair members) were randomly assigned between the pairs of templates.
Thereafter, reactions from the employer side were analysed to investigate unequal
treatment in hiring based on age, in general and by specific candidate and vacancy
characteristics.
3.1 Selection of Vacancies
We aimed to send pairs of fictitious job applications to vacancies for six
occupations, in three areas (industry, administration and vending) and two
classification levels (higher secondary (ISCED 3)8 and lower tertiary education
(ISCED 5 – Bachelor) as a functional level). These occupations were: operator,
administrative clerk, waiter, laboratory analyst, management assistant and sales
representative.
Testing occupations in multiple areas and at multiple qualification levels
enabled us to avoid the danger inherent to many earlier correspondence
8 We employ the International Standard Classification of Education (ISCED) levels of education.
11
experiments in which researchers simply selected one occupation with, potentially,
an unrepresentatively high (or low) effect of the tested characteristic. In addition,
due to the particular occupations chosen, we were able to measure heterogeneity
in unequal treatment based on age by the educational attainment required by the
vacancy and the area of the occupation. In general, theoretical and empirical
studies show that candidates’ higher education levels can act as a prejudices
reducing device (Baert et al., 2015; Carlsson and Rooth, 2007; Taubman and Wales,
1974; Wood et al., 2009). So, we might expect age discrimination to decrease with
the educational attainment of candidates. However, some of the aforementioned
characteristics of older workers in the perception of employers (such as showing
less creativity) might play a more important role in the assessment of the higher
educated, so that the interaction between age discrimination and education level
might just as well go in the opposite direction. Concerning the area of the
occupation, based on the mentioned model of taste-based discrimination, one
could expect higher levels of unequal treatment in occupations where personal
contact with the employer, customers or co-workers is higher (Lahey, 2008; Riach
and Rich, 2010). We come back to this in Section 4.1.
3.2 Construction of Job Application Template Pairs
For each occupation, we constructed two types of templates (type ‘A’ and type ‘B’)
comprising a resume and a motivation letter matching the general requirements of
this kind of jobs. Type A and B templates differed concerning inessential
peculiarities and lay-out to avoid detection. To ensure that our applications were
realistic and representative, example resumes and motivation letters from the
Public Employment Agency of Flanders were calibrated for our purposes.
All fictitious applicants were born and living in Antwerp or Ghent, the largest
cities of Flanders, with approximately 503,000 and 251,000 inhabitants,
respectively. They mentioned in their resume that they were married and that they
had two children. All applicants had graduated from the same type of school, with
a comparable reputation. The candidates applying for a job as an operator,
administrative clerk and waiter graduated from secondary education with a degree
in mechanics or commerce. Those applying for a job as a lab analyst, management
12
assistant and sales representative held a Bachelor’s degree in chemistry,
management assistance and commercial sciences, respectively. To avoid
employers’ detection of the experiment, a variety of common wordings were used
for these degrees. The candidates with a secondary education degree graduated at
the age of 18, those with a Bachelor’s degree at the age of 21.
Importantly, all candidates had been working in one job within the same
occupation as the one mentioned in the vacancy since 2006. In addition, they had
worked in a similar job immediately after graduation. We come back to their
activities during the years in between, which were randomly assigned, in Section
3.4.
In addition, we added to all applications the following features: a typically
Flemish sounding first name and surname; a Belgian nationality; a day and month
of birth; an address with an existing street name but a non-existing house number
in a middle-class neighbourhood; a telephone number and an email address from
major providers; adequate Dutch, English and French language skills; comparable
computer skills; one sports activity; and a driver’s license. The resume and
motivation letter templates are available upon request.
It is important to note that the minimal differences between the type A and
type B job application templates could not bias discrimination measures as the
younger and older age identities were randomly assigned to these types. The same
is true with respect to (heterogeneity in discrimination by) the variables that were
randomly assigned between the pairs of applicants. Moreover, our regression
analysis presented in Section 4.2 will show that the small differences between the
application templates did not yield different call-back outcomes for the type A and
type B versions.
3.3 Randomised Assignment of Older Age Within Pairs
The younger and older identity were alternately assigned to the type A and type B
application templates. This was done by just adding a year of birth to these
templates. As mentioned in the previous subsection, the day and month of birth
were fixed at the application template type level. In addition, the age of the
13
candidates was also signalled by the summary of their past career, on which we
elaborate in the next subsection.
3.4 Randomised Assignment of Particular Age Combinations,
Career Trajectory and Gender Between Pairs
In order to measure age discrimination at multiple (older) ages on the one hand
and for multiple differences in age between the younger and older candidates on
the other hand, we alternately assigned three age combinations to the pairs of
applicants. More concretely, we tested all (pairwise) combinations of candidates
aged 38, 44 and 50 years. This yielded a variation in age difference between the
pairs of fictitious candidates (6 versus 12 years). Our a priori expectation was that a
double dose of older age would result in a more adverse effect on employment
opportunities.
We chose 38 as the youngest age as from this age on the probability of
pregnancy becomes reasonably low. Statistics from the Flemish Agency for Care
and Health show that in Flanders the age-specific fertility rate peaks at the age of
29. Only one out of twenty mothers is 38 or older at childbirth. Before this age, for
female candidates it would be difficult to distinguish between unequal treatment
based on age and unequal treatment based on potential maternity leave in the
future.9
In addition, we chose 50 as the oldest age as employed individuals at this age
are not yet eligible for any old age labour market programs.10 This is important
because in case employers would get wage subsidies when hiring one of our
experimental identities, it would be impossible to disentangle age discrimination
from profit-maximising unequal treatment based on older candidates’ eligibility for
these subsidies. In addition, at the age of 50, job candidates are still not too close
to their retirement age. In Belgium, the official retirement age is 65 – it will
9 Baert (2014) and Petit (2007) present field experimental evidence on the labour market penalty for
motherhood.
10 The reader will recall that in Section 3.2 we mentioned that our candidates were applying for a job while
they were in employment. If they would have been unemployed at the age of 50, various programs would have
been in effect, but in our setting this problem is thus not playing.
14
become 66 in 2025 and 67 in 2030. However, due to the widespread use of early
retirement, the effective age of labour market exit was 59.6 for men and 58.7 for
women in 2013 (OECD, 2013). Candidates who are substantially older than 50 may,
therefore, be treated unfavourable by employers just because of the profit-
maximising reflection that their return on hiring investments will be lower. At the
age of 50, however, candidates should still be worth to invest in. Lastly, at the age
of 50, obsolescence of human capital should not be a rational worry yet.
Descriptive evidence of Vandenberghe et al. (2013) indeed suggests that, at least in
Belgium, the average pay-productivity gap becomes positive only from age 56. If
these arguments would not hold, one could expect that unequal treatment based
on age would be more to the detriment of the applicants aged 50 (when compared
to those aged 44) than of the applicants aged 44 (when compared to those aged
38) ceteris paribus. However, our regression analysis presented in Section 4.2 will
show that this is not the case.
Next, to deal with the Difference in Post-Educational Years Problem, we
alternated between the three relevant activities that could have been undertaken
by the older candidate during their extra years over the pairs sent to employers.
These activities were the ones used individually by the former contributions
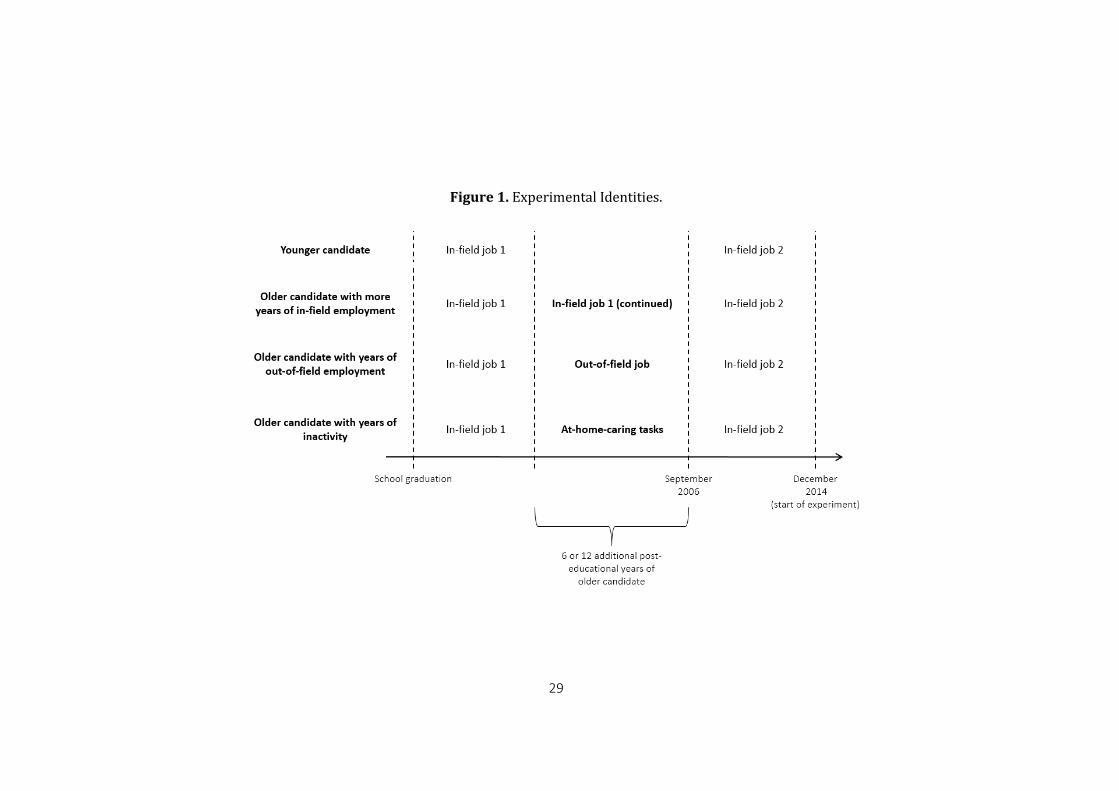
mentioned in Table 1. Figure 1 schematises the resulting career trajectories of our
experimental identities. As mentioned in Section 3.2, all candidates had worked in
a job within the same occupation as the one mentioned in the vacancy
immediately after graduation (“in-field job 1”) and were employed in another
similar job at the start of the experiment (“in-field job 2”). For the younger
candidate within the pairs, the former job was immediately followed by the latter
job. For the older candidate, three different activities could have been undertaken
during her/his additional 6 or 12 year in between her/his comparable periods in in-
field job 1 and in-field job 2. In one third of the cases, the older candidate had been
employed 6 or 12 years longer in in-field job 1. In a second third of the cases,
she/he had been employed in an out-of-field job during this period. For the
(middle-)low educated profiles this had been a position as a maintenance staff
member and for the (middle-)high educated profiles this had been a position as a
teacher at an organisation offering apprenticeship and entrepreneurship training.
In a last third of the cases, the older candidate mentioned in her/his resume that
she/he had been out of the labour force for child-rearing tasks during this period.
15
Lastly, we alternated between female and male pairs of fictitious candidates.
Our a priori belief was that heterogeneity in age discrimination by this dimension
would be, if present, to the detriment of older women. This belief was formed
because various studies have argued that females age sooner than males in terms
of (perceived) employability. This is related to their more age-dependent perceived
attractiveness and to their observed earlier retirement and (thereby) lower
employment rates at older ages (Gringart and Helmes, 2001; Rife, 1992;
Rodehaever, 1992).11 Empirically, Gringart and Helmes (2001) found that older
females were, compared to their younger counterparts, indeed relatively more
disadvantaged than older males, albeit in an insignificant way.
3.5 Classification of Call-Back
We sent the 36 resulting combinations of the two job application templates, three
particular age combinations, three career patterns for the older candidates and
two genders in an alternating order to the selected job postings, with a one-day
delay in between. Based on the relative supply of vacancies within the occupations
mentioned in Section 3.1, we decided to send out 72 pairs of applicants to the
occupations of administrative clerk, waiter, laboratory analyst and sales
representative and 144 pairs to the occupations of operator and management
assistant, resulting in 1152 job applications for 576 vacancies.
Reactions from the employer side were received via telephone voicemail and
email. To minimise inconvenience to the employers, we immediately terminated
the recruitment procedure after getting a positive reaction. All call-backs received
later than 30 days after the date of application submission were discarded.
As mentioned in Table 1, a small majority of the former correspondence
studies on age discrimination defined positive call-back as getting any positive
reaction. This might be an invitation to a job interview, the receipt of an alternative
job proposal, a request to provide more information or a request to contact the
recruiter. The other studies defined positive call-back, in a stricter sense, as getting
11 In the EU-15 (Belgium), the employment rate in 2013 among the 50 to 64 age group was 54.9% (47.5%) for
females and 67.8% (60.5%) for males compared to 71.3% (75.3%) for females and 82.6% (84.4%) for males among
the 25 to 49 age group (source: Eurostat, Labour Force Survey).
16
invited for an interview concerning the job for which one applied. In the present
study, we will present measures of unequal treatment based on age separately for
both definitions.
4 The Results
In this section we present the empirical insights based on a statistical examination
of the experimentally gathered data. Firstly, we report positive call-back rates for
the younger and older fictitious candidates, in general, classified by the activity the
older worker undertook during her/his extra post-educational years and classified
by some other vacancy and candidate characteristics. Secondly, we discuss a
regression analysis allowing us to control for vacancy fixed effects and to look into
the independent effect of various variables interacted with the older age of the
candidate.
4.1 Discrimination Ratios
Table 2 and Table 3 present positive call-back rates for the younger and older
candidates within the pairs of fictitious job applications we sent out. In Table 2
(Table 3) we follow the strict sense (broad sense) definition of positive call-back.
Statistics with respect to all tested vacancies together are presented in Panel A of
these tables. In total, the younger candidates got an invitation for a job interview
(any positive reaction) in 8.0% (16.5%) of their applications while their older
counterparts got an invitation (a positive reaction) in only 4.9% (11.8%) of the
cases. Column (3) of Table 2 and Table 3 shows that the positive call-back rate in
strict sense is about 1.6 while the positive call-back rate in broad sense is 1.4.
These numbers indicate that the younger candidate within the pairs had a 64.3%
higher chance of getting invited for a job interview and a 39.7% higher chance of
getting any positive reaction. Both statistics are significantly different from 1 at the
1% significance level.
<Table 2 about here.>
17
<Table 3 about here.>
This overall finding of hiring discrimination against older candidates is in line
with the results of the correspondence experiments reviewed in Section 2. Our
interview invitation ratio of 1.6 lies in between the comparable ratios found by
Bendick et al. (1999) and Lahey (2008) for the United States on the one hand and
those presented by Ahmed et al. (2012) and Riach and Rich (2010) for Sweden and
England. Our positive reaction ratio is higher than the one presented by Gringart
and Helmes (2001) and Lahey (2008) but lower than the one found by the other
studies. Moreover, our results corroborate with the evidence from other countries
in the sense that the levels of age discrimination found are higher than the levels of
discrimination based on ethnicity, gender or sexual orientation estimated in
Belgium (Baert, 2014; Baert et al., 2015; Baert et al., Forthcoming).
Next, we breakdown the positive call-back ratios12 by the activity in which the
older candidate within the pair was involved during her/his additional post-
educational years. Panel B of Table 2 and Table 3 indicates that, on the one hand,
equal treatment can be rejected for the subsamples in which the older candidates
had years of out-of-field employment or inactivity. Clearly, a period of out-of-field
employment is perceived as the worst signal by employers.13 The probability of
getting invited to a job interview decreases by 65.0%14 and the probability of any
positive reaction decreases by 44.8% for the older fictitious candidates revealing
out-of-field employment during their additional years. The punishment for older
age in combination with inactivity is somewhat lower: 41.2% with respect to
interview invitation and 25.8% with respect to any positive reaction. On the other
hand, we cannot reject equal treatment with respect to the pairs in which the
older candidate had more (in-field) experience. With respect to the probability of
job interview invitation, the positive call-back ratio is even (insignificantly) smaller
than 1. Apparently, the older candidates in our experiment had to compensate
12 The reader might note that comparing the call-back rates in column (2) between the rows of Panel B of
Table 2 and Table 3 is not appropriate as these rates might not only be determined by the difference in career
pattern of the older candidates but also, given the finite size of the subsamples by career pattern, by differences in
match quality between the tested vacancies and our pair of candidates between these subsamples. In our
regression analysis, we take this issue into account by controlling for vacancy fixed effects.
13 We come back to the significance of the difference in treatment between older candidates with out-of-
field employment on the one hand and inactivity on the other hand when we present our regression results.
14 65.0% = 1 – (1/2.857).
18
their older age by additional in-field experience. Otherwise, if they had strictly the
same level of in-field experience, younger candidates were preferred.
Two reflections are worth noting at this point. Firstly, our results underline that
the Difference in Post-Educational Years Problem, which we aim to take into
account in this study, is an important problem. Discrimination measures
fundamentally vary by the way older candidates’ extra years are filled in within
experiments on age discrimination. By means of our extended correspondence
experiment, we get an indication of the lower (zero) and upper bound (the ratios in
case the older candidates had out-of-field experience) of age discrimination in the
tested occupations in Flanders. If we would have picked just one out of these three
potential situations, as the former correspondence studies on age discrimination
did, the experiment had only allowed us to present one arbitrary value out of this
band, without knowing how far from the upper or lower bound we were. Secondly,
this variation of age discrimination by the career pattern of older candidates points
in the direction of statistical discrimination. If age discrimination could be fully
explained by employers, customers and co-workers having just a distaste for
dealing with older workers, the past career of older candidates should not affect
these candidates’ hiring outcomes. In addition, given the particular ordering over
the older candidates by their career pattern we observe, this statistical
discrimination seems not to be driven by the perception of higher salary
aspirations among older candidates, as this perception should be the highest with
respect to older candidates with more in-field experience. We come back to the
interpretation of our results within the taste-based and statistical discrimination in
the next paragraph.
In Panels C, D and E of Table 2 and Table 3, we breakdown the experimentally
gathered data by the tested occupation, the particular age of the candidates within
the pair and their gender, respectively. Firstly, the discrimination measures with
respect to the classification by occupation are the highest (and statistically
significant from 1) within the occupations of management assistant, waiter and
sales representative. The latter finding might be explained by employer and
customer discrimination in the sense of the taste-based discrimination model of
Becker (1957). On the one hand, personal cooperation with the employer is
probably the highest within the occupation of management assistant. These
employers might have a taste for younger individuals in their direct
19
neighbourhood. On the other hand, the high discrimination ratios in the vending
occupations (waiters and sales representatives) might point in the direction of
customer discrimination partly underlying age discrimination as customer contact
is on average higher in these occupations than in the other ones. This observation
squares with the aforementioned pattern through Table 1 that the evidence of
discrimination found in the former contributions testing the occupations of seller
and waiter was, on average, higher than the measures in studies testing other
occupations.
Secondly, our overall finding of age discrimination in terms of job interview
invitations (any positive reactions) is driven by the comparison of the 38-year-old
to the 44-year-old (44-year-old to the 50-year-old). Somewhat surprisingly, the
discrimination ratios are the lowest for the comparison of the 38-year-old to the
50-year-old. Thirdly, based on the ratios presented in Panel E, our overall ratios are
driven rather by the male than by the female pairs. We come back to the
significance of these dimensions of heterogeneity in age discrimination when we
present our regression results in the next subsection.
4.2 Controlling for Vacancy Fixed Effects
As the younger and older age are assigned randomly within our pairs of
applications, regressing positive call-back (in strict or broad sense) on an indicator
of being the older candidate within the pair leads to exactly the same empirical
conclusion as the one based on Panel A of Table 2 and Table 3. In addition, as we
randomly assigned these variables between pairs, regressions including
interactions between older age and (i) the activity the older candidate undertook
during her/his additional post-educational years, (ii) the particular age combination
of the candidates and (iii) their gender, should lead to the same empirical pattern
as the one in Panel B, Panel D and Panel E of Table 2 and Table 3, at least for a
sample size approaching infinity. However, our sample size is finite. Thus, some of
these variables randomly assigned between pairs may happen to correlate with
observable and unobservable vacancy characteristics. As these characteristics may
affect the hiring chances of our fictitious candidates, not controlling for them might
yield biased measures of the heterogeneity of age discrimination by the older
20
candidates’ past career, the particular age combinations and the gender of the
candidates used. Therefore, we further explore the experimentally gathered data
by means of a regression analysis controlling for vacancy fixed effects.
Table 4 and Table 5 present our regression results. We regress the outcome of
positive call-back in a strict sense (Table 4) and in a broad sense (Table 5) on
various sets of key and control variables by means of a linear probability model
with vacancy fixed effects. For reasons of comparability of the results for our
different regression models, except for the variable indicating individuals that were
the older candidate within a pair, all independent variables are normalised by
subtracting their mean among the subpopulation of older candidates. Variables
that are included in interaction with the indicator of older age, are not included
without this interaction as they are all constant at the vacancy level and therefore
controlled by our fixed effects estimations. In what follows, we first focus on the
results outlined in Table 4. Afterwards, we compare these results with the ones in
Table 5.
<Table 4 about here.>
<Table 5 about here.>
In regression model (1), we only include an indicator of older age as an
explanatory variable. By doing that, we find that this older age decreases the
probability of a job interview invitation by 3.1 percentage points. Obviously, this
outcome equals the difference between the overall positive call-back rates in a
strict sense among the younger and older candidates mentioned in Section 4.1.
Next, in model (2), we interact the older age with (normalised) indicators for
the two least beneficial activities undertaken by the older pair member during
her/his additional years (with additional in-field employment as a reference
category). We get, in line with the findings reported in Table 2, a significantly
negative effect of these interactions on the probability of getting an invitation for a
job interview. In addition, an F-test performed to assess the statistical difference
between these interaction variables does not allow us to reject that they are equal.
Therefore, we conclude that older age is only punished if the older and younger
candidates have the same amount of in-field experience and that this punishment
is irrespective of whether the older candidate filled her/his additional post-
21
educational years with out-of-field employment or inactivity.
In regression model (3), we extend the set of independent variables with
variables indicating type B applications and applications that were the first one of
the pair sent to the vacancy. Next, in regression model (4), we add additional
interactions between the indicator of older age and indicators for (i) (middle-)high
educated candidates; (ii) vacancies for administrative occupations and vacancies
for vending occupations (keeping vacancies in the industrial area as a reference
category); (iii) candidates being 50 years old; (iv) candidates being 12 years older
than their pair member and (v) candidates being of female gender. As the extra
variables included in models (3) and (4) are, by construction of the experiment, not
correlated with the older age and career pattern dummies, their adoption does not
change the coefficients for the main variables of interest.
In addition, the estimation results for model (3) learn, as announced in Section
3.2, that the probability of job interview invitation does not vary across template
types. In addition, it is invariant with respect to whether an application was sent as
the first pair member or not. Concerning the interactions added in model (4), we
find a (weakly) significant interaction effect with respect to the vending
occupations (waiter and sales representative). Potentially driven by the
aforementioned customer taste-based discrimination, revealing an older age
lowers the probability of getting a job interview in these occupations with an
additional 5.2 percentage points compared to the reference category of industrial
occupations. The other interactions are not significant: we cannot reject that age
discrimination in Belgium is invariant with respect to whether candidates differ 6 or
12 years in age and to whether they are female or male.
The latter finding might be explained by the fact that positive and negative
interaction effects with respect to these dimensions for the various career paths of
the older candidates cancel each other out. For instance, it is possible that 12 years
of extra post-educational years yields, when compared to 6 years, a positive
surplus when it is filled with in-field employment while it leads to a more severe
punishment for older candidates when it is filled with other activities. In addition,
due to gender stereotypes, years of inactivity might be punished less for females.
To test this, in model (5), we add triple interactions (i) between older age, the
activity of the older candidate during her/his extra post-educational years and an
22
indicator of whether the candidates differed 12 years in age and (ii) between older
age, the activity of the older candidate during her/his extra post-educational years
and an indicator of female gender. These triple interactions are normalised by
subtracting their mean among the relevant subpopulation of older candidates
(those with years of out-of-field employment or inactivity). However, none of the
added interactions yield significant effects.
Lastly, in model (6) we add indicators for vacancies offering part-time contracts
and vacancies offered by an interim office in interaction with an indicator for being
the older candidate within the pair. None of these interactions has a significant
effect on the probability of job interview invitation. However, by including these
variables, the interaction with respect to vacancies for vending occupations
becomes significant at the 5% significance level.
Table 5 presents the corresponding results using positive call-back in broad
sense as an outcome variable. The most important difference when comparing
column (6) of this table to the same column in Table 4, is that the (weak)
significance of the interaction between the indicators of the older candidate and
inactivity as a way to fill her/his additional post-educational years disappears. So,
for positive call-back in broad sense, we cannot reject anymore that the treatment
of older candidates is equal for those who were inactive during their additional
years and those who gained additional in-field experience. However, we can also
not reject that the treatment of older candidates is equal for those who were
inactive and those who were employed in an out-of-field job. Moreover, an
alternative econometric specification of model (6) in which we do not normalise
the interaction variables learns that, also after controlling for vacancy fixed effects,
older age is punished for those older candidates who were inactive during their
additional years.15 A second difference between column (6) of Table 4 and the
comparable column of Table 5 is that the interaction between older age and the
indicator of vending occupations loses its significance. Lastly, the broad sense
outcome is significantly more in favour of the first candidate sent. For this
candidate, the chance on any positive reaction is 3.3 percentage points higher
ceteris paribus.
15 The F-statistic testing whether the sum of the constant term and the interaction with respect to having
been inactive during one’s additional post-educational years is significant at the 10% significance level (with a p-
value of 0.087).
23
We also tested the robustness of our results using a heteroskedastic probit
model. We did this given Heckman and Siegelman’s (1993) critique on previous
studies reporting on correspondence experiments. Their critique boils down to the
fact that not controlling for group differences in the variance of unobservable
determinants of positive call-back can lead to substantial bias. The solution to this
problem is, as recently proposed by Neumark (2012), to adopt a heteroskedastic
probit model, in which the variance of the error term is allowed to vary with – in
our application – the age of the fictitious applicants. However, this analysis, which
is available upon request, leads to the same empirical pattern as the one reported
above.
5 Conclusion
This study contributed to the empirical literature on age discrimination. We argued
that former contributions to this literature employing classical correspondence
experiments, the golden standard to identify unequal treatment in hiring, were not
able to disentangle age discrimination from unequal treatment based on the
activities older workers undertake during their additional post-educational years
(which may lead to additional human capital or career gaps).
In our approach to this “Difference in Post-Educational Years Problem” we
proposed an extension of the correspondence testing framework. More
concretely, we presented a setting in which the random assignment of a younger
and an older age within pairs of fictitious job applications that are sent to real job
openings is combined with the random assignment of various realistic activities
undertaken by the older worker during her/his extra life years between these pairs.
We applied this extended field experimental framework to the Belgian case.
We sent out pairs of fictitious job candidates to real vacancies in Flanders, the
Northern part of Belgium, between December 2014 and May 2015. Alternately, to
one of both applications the younger age of 38 or 44 was disclosed, and in the
other one the older age of 44 or 50 – the resulting variation in age difference (6 or
12 years) allowed us to look into whether age discrimination varied linearly with
this difference. To the older candidate within the pair we randomly assigned one
24
out of the three most realistic activities she/he could have undertaken during
her/his 6 or 12 years of additional labour market time: in-field employment, out-of-
field employment or inactivity. We further contributed to the literature by
measuring the heterogeneity in age discrimination by the skill level and the area of
the occupation and by the gender of the candidate. To this end, we sent our pairs
of applications to a balanced number of vacancies in six different occupations and
we randomly assigned the gender of the candidates between these pairs.
We found that, in line with the literature, the younger candidate within a pair
of applicants had, on average, a 64.3% higher chance of getting invited for a job
interview than the older candidate and a 39.7% higher chance of getting any
positive reaction. However, when we classified this invitation probability by the
activity in which the older candidate was involved during her/his additional post-
educational years, we found that older age was only punished if the older and
younger candidates had the same amount of in-field experience and that this
punishment was irrespective of whether the older candidate filled her/his
additional post-educational years with out-of-field employment or inactivity. Stated
otherwise, the older candidates in our experiment had to compensate their older
age by additional in-field experience in order not to be discriminated against. So,
also empirically, the Difference in Post-Educational Years Problem came out to be
important. In addition, we interpreted this finding of age discrimination varying
with the past career of the older candidates as an indication of statistical
discrimination. However, as we also found that unequal treatment was most
detrimental to those older candidates who applied for vending occupations, we
saw also a role for taste-based customer preferences underlying age
discrimination.
Our application of the proposed experimental approach to measure age
discrimination is limited in terms of scope. We measured unequal treatment based
on age only for particular age combinations in jobs posted in the database of the
Public Employment Agency of Flanders. This limitation is less acute in our design in
comparison to former contributions as we made the conscious choice to test
industry- as well as administration- as well as vending-oriented and (middle-)low as
well as (middle-)high skilled occupations. Moreover, because this limitation is
expected to cause a similar shift in the punishment of all older candidates
irrespective of their past career, it should not bias the conclusions with respect to
25
the relative surplus of the various activities the older candidates undertook during
their extra post-educational years. Nevertheless, due to differing labour market
institutions, our results might not be simply generalised to other Western
European countries let alone to other continental regions. In addition, other
dimensions of heterogeneity in age discrimination (for instance the interaction
between age and ethnicity) seem to be interesting to explore. Therefore, we are in
favour of large-scale, cross-country implementations of our experimental setting to
measure age discrimination. It is in the own interest of governments to sponsor
this kind of experiments as their insightful results might not only facilitate more
accurate policies and interventions but may also make employers more aware of
the responsibility they carry with respect to the labour market situation of older
workers and, thereby, with respect to handling the problem of population ageing.
References
Ahmed, A. M., Andersson, L., Hammarstedt, M. (2012): Does age matter for
employability? A field experiment on ageism in the Swedish labour market. Applied
Economics Letters, 19, 403–406.
Ahmed, A. M., Andersson, L., Hammarstedt, M. (2013): Are Gay Man and
Lesbians Discriminated against in the Hiring Process? Southern Economic Journal,
79, 565–858.
Albert, A., Escot, L., Fernández-Cornejo, J. A. (2011): A field experiment to
study sex and age discrimination in the Madrid labour market. International Journal
of Human Resource Management, 22, 351–375.
Arrow, K. J. (1973): The Theory of Discrimination. In Ashenfelter, O., Rees, A.
(eds.): Discrimination in Labor Markets. Princeton: Princeton University Press.
Baert, S. (2014): Career Lesbians. Getting Hired for Not Having Kids? Industrial
Relations, 45, 543–561.
Baert, S., Cockx, B., Gheyle, N., Vandamme, C. (2015): Is There Less
Discrimination in Occupations Where Recruitment Is Difficult? ILR Review, 68, 467–
500.
26
Baert, S., De Pauw, A.-S., Deschacht, N. (Forthcoming): Do Employer
Preferences Contribute to Sticky Floors? ILR Review.
Baert, S., Verhofstadt, E. (2015): Labour market discrimination against former
juvenile delinquents: evidence from a field experiment. Applied Economics, 47,
1061–1072.
Becker, G. (1957): The Economics of Discrimination. Chicago: University of
Chicago Press.
Bendick, M. (1996): Discrimination against racial/ethnic minorities in access to
employment in the United States: Empirical findings from situation testing. Geneva:
International Labour Office.
Bendick, M., Brown, L. E., Wall, K. (1996): Experimental Discrimination Against
Older Workers: An Experimental Study of Hiring Practices. Journal of Aging & Social
Policy, 8, 25–46.
Bendick, M., Brown, L. E., Wall, K. (1999): No Foot in the Door: An Experimental
Study of Employment Discrimination Against Older Workers. Journal of Aging &
Social Policy, 10, 5–23.
Berson, C. (2012): Does Competition Induce Hiring Equity? Documents de
travail du Centre d’Economie de la Sorbonne, 12019.
Bertrand, M., Mullainathan, S. (2004): Are Emily and Greg more employable
than Lakisha and Jamal? A field experiment on labor market discrimination.
American Economic Review, 94, 991–1013.
Booth, A. L., Leigh, A. (2010): Do employers discriminate by gender? A field
experiment in female-dominated occupations. Economics Letters, 107, 236–238.
Booth, A. L., Leigh, A., Varganova, E. (2012): Does Racial and Ethnic
Discrimination Vary Across Minority Groups? Evidence From a Field Experiment.
Oxford Bulletin of Economics and Statistics, 74, 547–573.
Carlsson, M., Rooth, D.-A. (2007): Evidence of ethnic discrimination in the
Swedish labor market using experimental data. Labour Economics, 14, 716–729.
Cédiey, E., Foroni, F., Garner, H. (2008): Discrimination à l’embauche fondée
sur l’origine à l’encontre des jeunes français(e)s peu qualifié(e)s. Dares Premières
Infos Premières Synthèses, 06.3.
27
Drydakis, N. (2009): Sexual orientation discrimination in the labour market.
Labour Economics, 16, 364–372.
Drydakis, N. (2011): Women’s Sexual Orientation and Labor Market Outcomes
in Greece. Feminist Economics, 17, 89–117.
Eriksson, S., Rooth, D.-O. (2014): Do Employers Use Unemployment as a Sorting
Criterion When Hiring? Evidence from a Field Experiment. American Economic
Review, 104, 1014–1039.
Gringart, E., Helmes, A. (2001): Age Discrimination in Hiring Practices Against
Older Adults in Western Australia: the Case of Accounting Assistants. Australian
Journal on Ageing, 20, 23–28.
Heckman, J. J., Siegelman, C. (1993): The Urban Institute Audit Studies: Their
Methods and Findings. Washington DC: Urban Institute.
Kroft, K., Lange, F., Notowidigdo, M. J. (2013): Duration Dependence and Labor
Market Conditions: Evidence from a Field Experiment. Quarterly Journal of
Economics, 128, 1123–1167.
Lahey, J. N. (2008): Age, women, and hiring: an experimental study. Journal of
Human Resources, 43, 30–56.
Neumark, D. (2012): Detecting Discrimination in Audit and Correspondence
Studies. Journal of Human Resources, 47, 4, 1128–1157.
OECD (2006): Live Longer, Work Longer. Paris: OECD.
OECD (2013): Pensions at a Glance 2013: OECD and G20 Indicators. Paris:
OECD.
Pager, D. (2007): The use of field experiments for studies of employment
discrimination: contributions, critiques, and directions for the future. Annals of the
American Academy of Political and Social Science, 609, 104–133.
Petit, P. (2007): The effects of age and family constraints on gender hiring
discrimination: A field experiment in the French financial sector. Labour Economics,
14, 371–391.
Riach, P. A., Rich, J. (2002): Field Experiments of Discrimination in the Market
Place. Economic Journal, 112, 480–518.
Riach, P. A., Rich, J. (2006a): An Experimental Investigation of Age
28
Discrimination in the French Labour Market. IZA Discussion Paper Series, 2522.
Riach, P. A., Rich, J. (2006b): An Experimental Investigation of Sexual
Discrimination in Hiring in the English Labor Market. B.E. Journal of Economic
Analysis & Policy, 5, 1–22.
Riach, P. A., Rich, J. (2007): An Experimental Investigation of Age Discrimination
in the Spanish Labour Market. IZA Discussion Paper Series, 2654.
Riach, P. A., Rich, J. (2010): An Experimental Investigation of Age Discrimination
in the English Labor Market. Annals of Economics and Statistics, 99/100, 169–185.
Rife, J. C. (1992): A group practice strategy for helping unemployed older
women find employment. Journal of Women and Aging, 4, 25–38.
Rodehaever, D. (1992): Labor market progeria: on the life expectancy of
presentability among working women. In Glasse, L., Hendricks, J. (eds.): Gender and
aging. New York: Baywood Publishing Company.
Rooth, D.-O. (2009): Obesity, Attractiveness, and Differential Treatment in
Hiring: A Field Experiment. Journal of Human Resources, 44, 710–735.
Sonnet, A., Olsen, H., Manfredi, T. (2014): Towards More Inclusive Ageing and
Employment Policies: The Lessons from France, The Netherlands, Norway and
Switzerland. De Economist, 162, 315–339.
Taubman, P. J., Wales, T. (1974): Higher Education and Earnings: College as an
Investment and Screening Device. Massachusetts: NBER Books.
Tinsley, M. (2012): Too much to lose: Understanding and supporting Britain’s
older workers. London: Policy Exchange.
Vandenberghe, V., Waltenberg, F., Rigo, M. (2013): Ageing and Employability.
Evidence from Belgian Firm Level Data. Journal of Productivity Analysis, 40, 111–
136.
Wood, M., Hales, J., Purdon, S., Sejersen, T., Hayllar, O. (2009): A test for racial
discrimination in recruitment practice in British cities. DWP Research Reports, 607.
29
Figure 1. Experimental Identities.
30
Table 1. Literature Review: Correspondence Experiments on Age Discrimination.
(1) (2) (3) (4) (5) (6) (7) (8) (9)
Study Country Tested occupation(s) Gender of applicants
Age of younger applicants
Age of older applicants
Definition of positive call-back
Positive call-back ratio
Approach towards Difference in Post-Educational Years Problem
Ahmed et al. (2012)
Sweden Seller and waiter Male 31 46 Interview invitation
3.230 Years of out-of-field employment for the older candidate
Albert et al. (2011)
Spain Clerk (in accountancy, administration or sales)
Female or male
24 or 28 38 Any positive reaction
1.694 More years of in-field employment for the older candidate
Bendick et al. (1996)
United States
Clerk (in administration, copy-writing or ICT)
Female or malea
32 57 Any positive reaction
1.467 Years of inactivity for the older candidate in the administration area and years of out-of-field employment for the older candidate in the other areas
Bendick et al. (1999)b
United States
Clerk (in administration or sales)
Female or malec
32 57 Interview invitation
1.135 Years of out-of-field employment for the older candidate
Gringart and Helmes (2001)
Australia Clerk (in accountancy) Female or male
32 57 Any positive reaction
1.238 Years of inactivity for the older candidate when using female pairs and years of out-of-field employment for the older candidate when using male pairs
Lahey (2008) United States
Random entry jobs Female 35 or 45 50, 55 or 62
Interview invitation
Any positive reaction
1.418
1.190
Work histories limited to the last ten years
Riach and Rich (2006a)
France Waiter Male 27 57 Any positive reaction
3.571 More years of in-field employment for the older candidate
Riach and Rich (2007)
Spain Waiter Male 27 57 Any positive reaction
3.500 More years of in-field employment for the older candidate
Riach and Rich (2010)
England Random entry jobs, seller and waiter
Female or maled
21 or 27e 39 or 47 Interview invitation
1.883 More years of in-field employment for the older candidate
Tinsley (2012) England Clerk (in administration) and waiter
Female 24 or 25f 50 or 51 Any positive reaction
2.146 Work histories limited to the last five years
The positive call-back ratio is calculated by dividing the percentage of applications receiving a positive call-back (in the sense of column (7)) for the younger candidates by the corresponding percentage for the older candidates. The presented ratios are own calculations based on the mentioned studies – positive call-back ratios for different occupations or cities were weighted by their number of tested jobs. All these ratios are statistically significantly different from 1, at least at the 5% significance level. aFemale pairs were sent to the administration and copy-writing jobs and male pairs were sent to the copy-writing and ICT jobs. bThis study is in fact an “audit experiment” as it comprises all stages of the hiring process (Pager, 2007; Riach and Rich, 2002). For reasons of comparability, the positive call-back ratio mentioned in this table for Bendick et al. (1999) only relates to the first stage of the tested recruitment process. Important to mention is that in this experiment, the older candidate always applied (shortly) before the younger one. cFemale pairs were only sent to six job openings. dFemale pairs were sent to the random entry jobs and sales positions and male pairs were sent to the positions as a waiter. eCandidates applying for entry jobs were 21 or 39 years old, the others were 27 or 47 years old. fCandidates applying for clerk positions were 24 or 50 years old, those applying for jobs as a waiter were 25 or 51 years old.
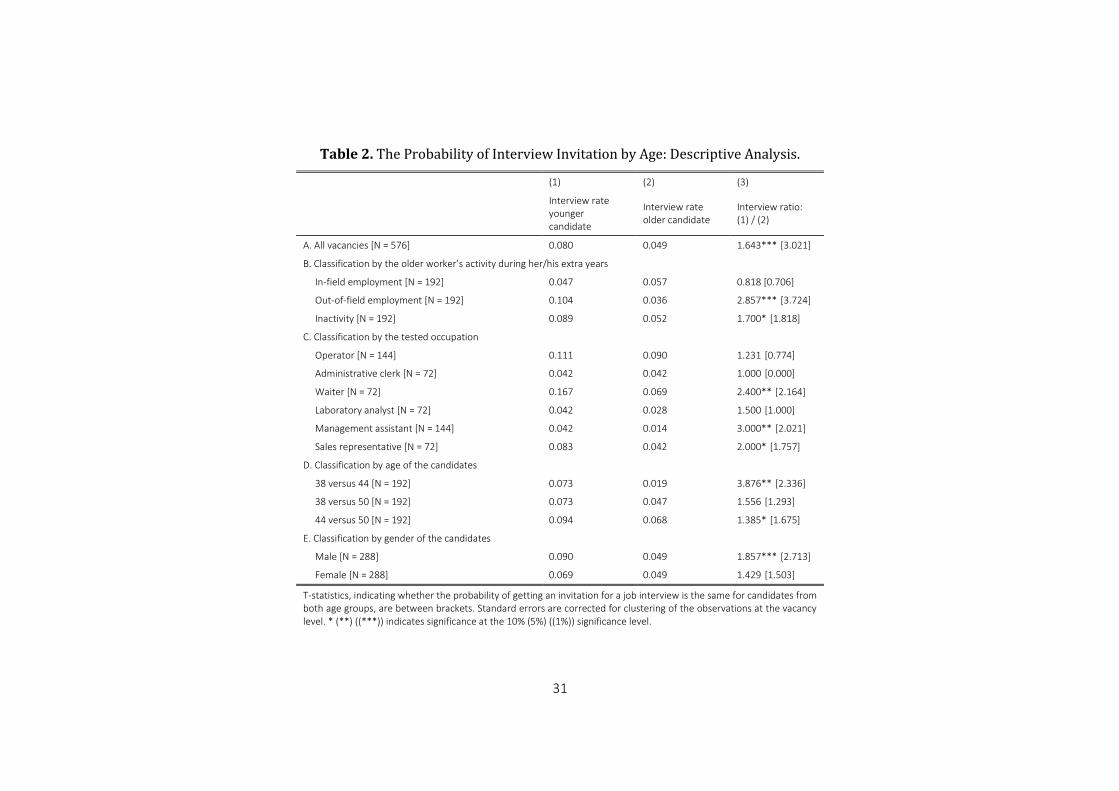
31
Table 2. The Probability of Interview Invitation by Age: Descriptive Analysis.
(1) (2) (3)
Interview rate younger candidate
Interview rate older candidate
Interview ratio: (1) / (2)
A. All vacancies [N = 576] 0.080 0.049 1.643*** [3.021]
B. Classification by the older worker’s activity during her/his extra years
In-field employment [N = 192] 0.047 0.057 0.818 [0.706] Out-of-field employment [N = 192] 0.104 0.036 2.857*** [3.724] Inactivity [N = 192] 0.089 0.052 1.700* [1.818] C. Classification by the tested occupation
Operator [N = 144] 0.111 0.090 1.231 [0.774] Administrative clerk [N = 72] 0.042 0.042 1.000 [0.000] Waiter [N = 72] 0.167 0.069 2.400** [2.164]
Laboratory analyst [N = 72] 0.042 0.028 1.500 [1.000] Management assistant [N = 144] 0.042 0.014 3.000** [2.021]
Sales representative [N = 72] 0.083 0.042 2.000* [1.757] D. Classification by age of the candidates
38 versus 44 [N = 192] 0.073 0.019 3.876** [2.336] 38 versus 50 [N = 192] 0.073 0.047 1.556 [1.293]
44 versus 50 [N = 192] 0.094 0.068 1.385* [1.675] E. Classification by gender of the candidates
Male [N = 288] 0.090 0.049 1.857*** [2.713] Female [N = 288] 0.069 0.049 1.429 [1.503]
T-statistics, indicating whether the probability of getting an invitation for a job interview is the same for candidates from both age groups, are between brackets. Standard errors are corrected for clustering of the observations at the vacancy level. * (**) ((***)) indicates significance at the 10% (5%) ((1%)) significance level.
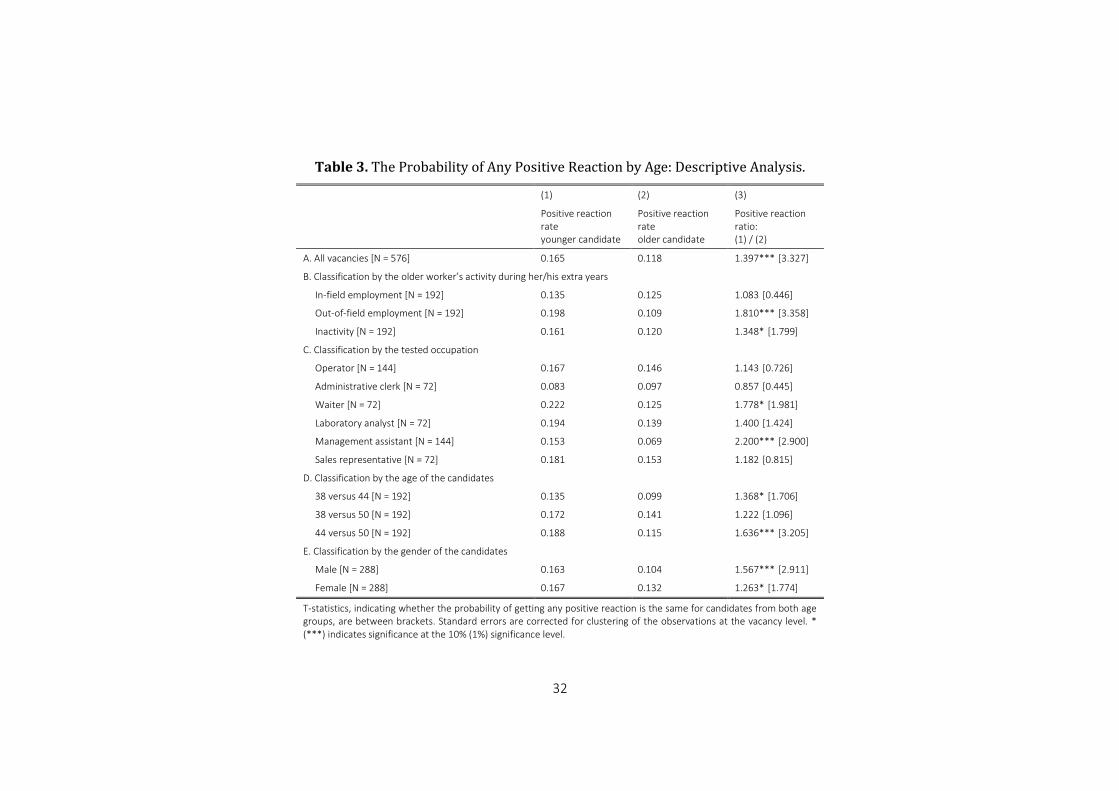
32
Table 3. The Probability of Any Positive Reaction by Age: Descriptive Analysis.
(1) (2) (3)
Positive reaction rate younger candidate
Positive reaction rate older candidate
Positive reaction ratio: (1) / (2)
A. All vacancies [N = 576] 0.165 0.118 1.397*** [3.327] B. Classification by the older worker’s activity during her/his extra years
In-field employment [N = 192] 0.135 0.125 1.083 [0.446] Out-of-field employment [N = 192] 0.198 0.109 1.810*** [3.358] Inactivity [N = 192] 0.161 0.120 1.348* [1.799] C. Classification by the tested occupation
Operator [N = 144] 0.167 0.146 1.143 [0.726] Administrative clerk [N = 72] 0.083 0.097 0.857 [0.445] Waiter [N = 72] 0.222 0.125 1.778* [1.981]
Laboratory analyst [N = 72] 0.194 0.139 1.400 [1.424] Management assistant [N = 144] 0.153 0.069 2.200*** [2.900]
Sales representative [N = 72] 0.181 0.153 1.182 [0.815] D. Classification by the age of the candidates
38 versus 44 [N = 192] 0.135 0.099 1.368* [1.706] 38 versus 50 [N = 192] 0.172 0.141 1.222 [1.096] 44 versus 50 [N = 192] 0.188 0.115 1.636*** [3.205] E. Classification by the gender of the candidates
Male [N = 288] 0.163 0.104 1.567*** [2.911]
Female [N = 288] 0.167 0.132 1.263* [1.774]
T-statistics, indicating whether the probability of getting any positive reaction is the same for candidates from both age groups, are between brackets. Standard errors are corrected for clustering of the observations at the vacancy level. * (***) indicates significance at the 10% (1%) significance level.
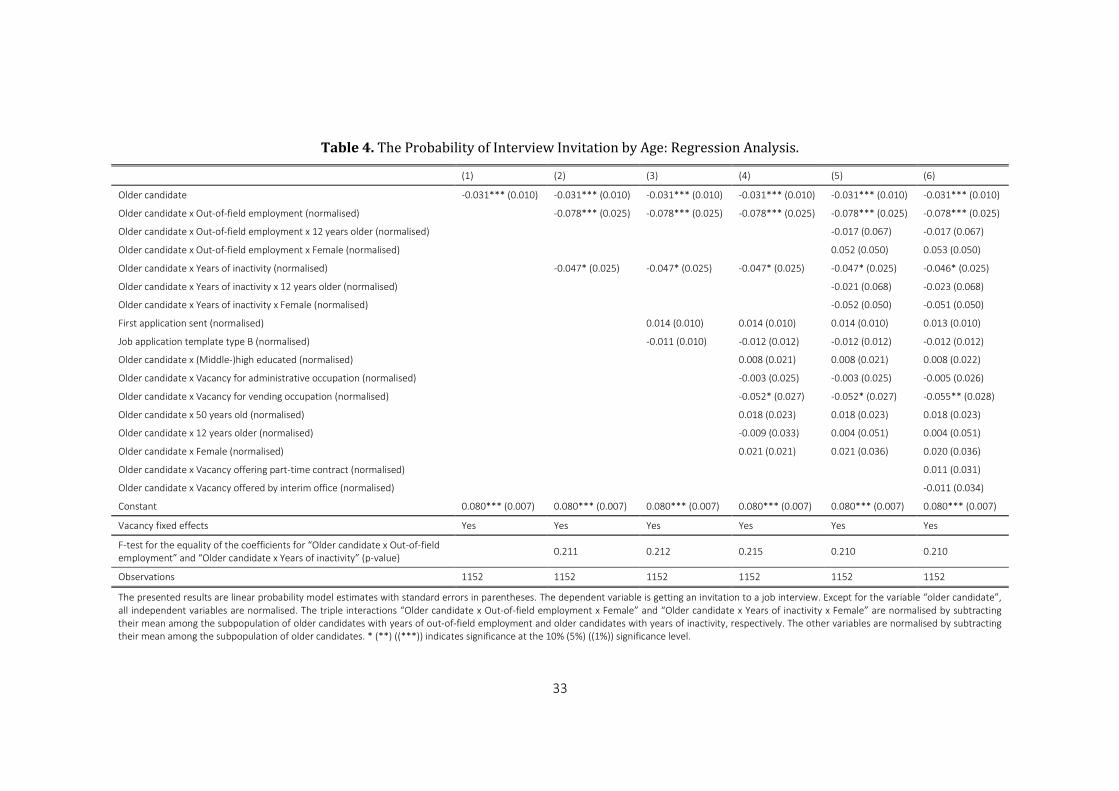
33
Table 4. The Probability of Interview Invitation by Age: Regression Analysis.
(1) (2) (3) (4) (5) (6)
Older candidate -0.031*** (0.010) -0.031*** (0.010) -0.031*** (0.010) -0.031*** (0.010) -0.031*** (0.010) -0.031*** (0.010)
Older candidate x Out-of-field employment (normalised) -0.078*** (0.025) -0.078*** (0.025) -0.078*** (0.025) -0.078*** (0.025) -0.078*** (0.025)
Older candidate x Out-of-field employment x 12 years older (normalised) -0.017 (0.067) -0.017 (0.067)
Older candidate x Out-of-field employment x Female (normalised) 0.052 (0.050) 0.053 (0.050)
Older candidate x Years of inactivity (normalised) -0.047* (0.025) -0.047* (0.025) -0.047* (0.025) -0.047* (0.025) -0.046* (0.025)
Older candidate x Years of inactivity x 12 years older (normalised) -0.021 (0.068) -0.023 (0.068)
Older candidate x Years of inactivity x Female (normalised) -0.052 (0.050) -0.051 (0.050)
First application sent (normalised) 0.014 (0.010) 0.014 (0.010) 0.014 (0.010) 0.013 (0.010)
Job application template type B (normalised) -0.011 (0.010) -0.012 (0.012) -0.012 (0.012) -0.012 (0.012)
Older candidate x (Middle-)high educated (normalised) 0.008 (0.021) 0.008 (0.021) 0.008 (0.022)
Older candidate x Vacancy for administrative occupation (normalised) -0.003 (0.025) -0.003 (0.025) -0.005 (0.026)
Older candidate x Vacancy for vending occupation (normalised) -0.052* (0.027) -0.052* (0.027) -0.055** (0.028)
Older candidate x 50 years old (normalised) 0.018 (0.023) 0.018 (0.023) 0.018 (0.023)
Older candidate x 12 years older (normalised) -0.009 (0.033) 0.004 (0.051) 0.004 (0.051)
Older candidate x Female (normalised) 0.021 (0.021) 0.021 (0.036) 0.020 (0.036)
Older candidate x Vacancy offering part-time contract (normalised) 0.011 (0.031)
Older candidate x Vacancy offered by interim office (normalised) -0.011 (0.034)
Constant 0.080*** (0.007) 0.080*** (0.007) 0.080*** (0.007) 0.080*** (0.007) 0.080*** (0.007) 0.080*** (0.007)
Vacancy fixed effects Yes Yes Yes Yes Yes Yes
F-test for the equality of the coefficients for “Older candidate x Out-of-field employment” and “Older candidate x Years of inactivity” (p-value)
0.211 0.212 0.215 0.210 0.210
Observations 1152 1152 1152 1152 1152 1152
The presented results are linear probability model estimates with standard errors in parentheses. The dependent variable is getting an invitation to a job interview. Except for the variable “older candidate”, all independent variables are normalised. The triple interactions “Older candidate x Out-of-field employment x Female” and “Older candidate x Years of inactivity x Female” are normalised by subtracting their mean among the subpopulation of older candidates with years of out-of-field employment and older candidates with years of inactivity, respectively. The other variables are normalised by subtracting their mean among the subpopulation of older candidates. * (**) ((***)) indicates significance at the 10% (5%) ((1%)) significance level.
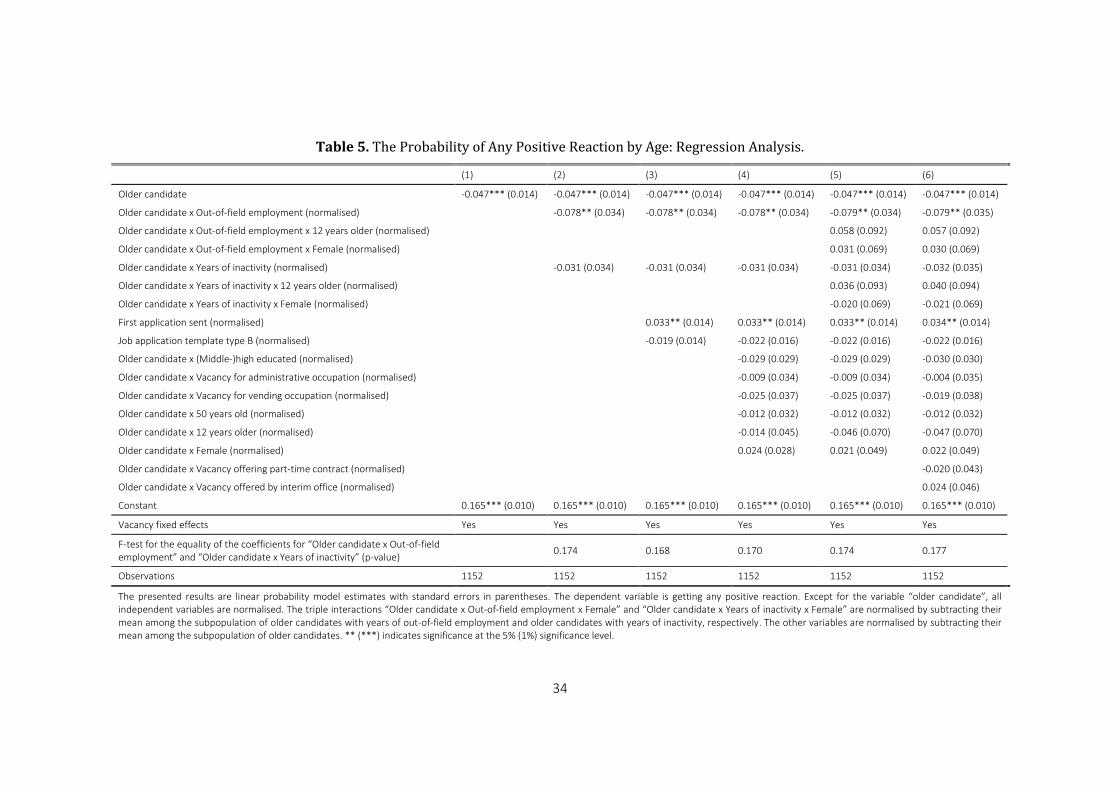
34
Table 5. The Probability of Any Positive Reaction by Age: Regression Analysis.
(1) (2) (3) (4) (5) (6)
Older candidate -0.047*** (0.014) -0.047*** (0.014) -0.047*** (0.014) -0.047*** (0.014) -0.047*** (0.014) -0.047*** (0.014)
Older candidate x Out-of-field employment (normalised) -0.078** (0.034) -0.078** (0.034) -0.078** (0.034) -0.079** (0.034) -0.079** (0.035)
Older candidate x Out-of-field employment x 12 years older (normalised) 0.058 (0.092) 0.057 (0.092)
Older candidate x Out-of-field employment x Female (normalised) 0.031 (0.069) 0.030 (0.069)
Older candidate x Years of inactivity (normalised) -0.031 (0.034) -0.031 (0.034) -0.031 (0.034) -0.031 (0.034) -0.032 (0.035)
Older candidate x Years of inactivity x 12 years older (normalised) 0.036 (0.093) 0.040 (0.094)
Older candidate x Years of inactivity x Female (normalised) -0.020 (0.069) -0.021 (0.069)
First application sent (normalised) 0.033** (0.014) 0.033** (0.014) 0.033** (0.014) 0.034** (0.014)
Job application template type B (normalised) -0.019 (0.014) -0.022 (0.016) -0.022 (0.016) -0.022 (0.016)
Older candidate x (Middle-)high educated (normalised) -0.029 (0.029) -0.029 (0.029) -0.030 (0.030)
Older candidate x Vacancy for administrative occupation (normalised) -0.009 (0.034) -0.009 (0.034) -0.004 (0.035)
Older candidate x Vacancy for vending occupation (normalised) -0.025 (0.037) -0.025 (0.037) -0.019 (0.038)
Older candidate x 50 years old (normalised) -0.012 (0.032) -0.012 (0.032) -0.012 (0.032)
Older candidate x 12 years older (normalised) -0.014 (0.045) -0.046 (0.070) -0.047 (0.070)
Older candidate x Female (normalised) 0.024 (0.028) 0.021 (0.049) 0.022 (0.049)
Older candidate x Vacancy offering part-time contract (normalised) -0.020 (0.043)
Older candidate x Vacancy offered by interim office (normalised) 0.024 (0.046)
Constant 0.165*** (0.010) 0.165*** (0.010) 0.165*** (0.010) 0.165*** (0.010) 0.165*** (0.010) 0.165*** (0.010)
Vacancy fixed effects Yes Yes Yes Yes Yes Yes
F-test for the equality of the coefficients for “Older candidate x Out-of-field employment” and “Older candidate x Years of inactivity” (p-value)
0.174 0.168 0.170 0.174 0.177
Observations 1152 1152 1152 1152 1152 1152
The presented results are linear probability model estimates with standard errors in parentheses. The dependent variable is getting any positive reaction. Except for the variable “older candidate”, all independent variables are normalised. The triple interactions “Older candidate x Out-of-field employment x Female” and “Older candidate x Years of inactivity x Female” are normalised by subtracting their mean among the subpopulation of older candidates with years of out-of-field employment and older candidates with years of inactivity, respectively. The other variables are normalised by subtracting their mean among the subpopulation of older candidates. ** (***) indicates significance at the 5% (1%) significance level.


![Hairs and FIbers Spring 2018 · Microsoft PowerPoint - Hairs and FIbers Spring 2018 [Compatibility Mode] Author: kellie.white Created Date](https://img.pdfslide.us/doc/110x75/60485492ba71c23f3455f45d/hairs-and-fibers-spring-2018-microsoft-powerpoint-hairs-and-fibers-spring-2018.jpg)