Embed Size (px)
Citation preview

11
Getting a job used to be an exit from poverty, but not anymore
Using this Economic Analysis Toolkit (EAT)You CAN figure out why jobs no longer get
people out of poverty
National Learning Community on Poverty TrendsSalon A 9:15-10:45 am
August 30, 2017
Jim Masters: CCAP, NCRT. [email protected] Stansbury, Senior Associate. [email protected]
Center for Community Futures

22
Connecting National Trends with Local Data
Poverty Trends LCG

33
Purpose: To analyze Community Action strategies and identify effective, promising and innovative approaches that eliminate the causes of poverty.
BUILD OUR CAPACITY!

44
Subject Matter Experts
Jim Masters Allen Stansbury
Likelihood of Experiencing Poverty in the US(1)
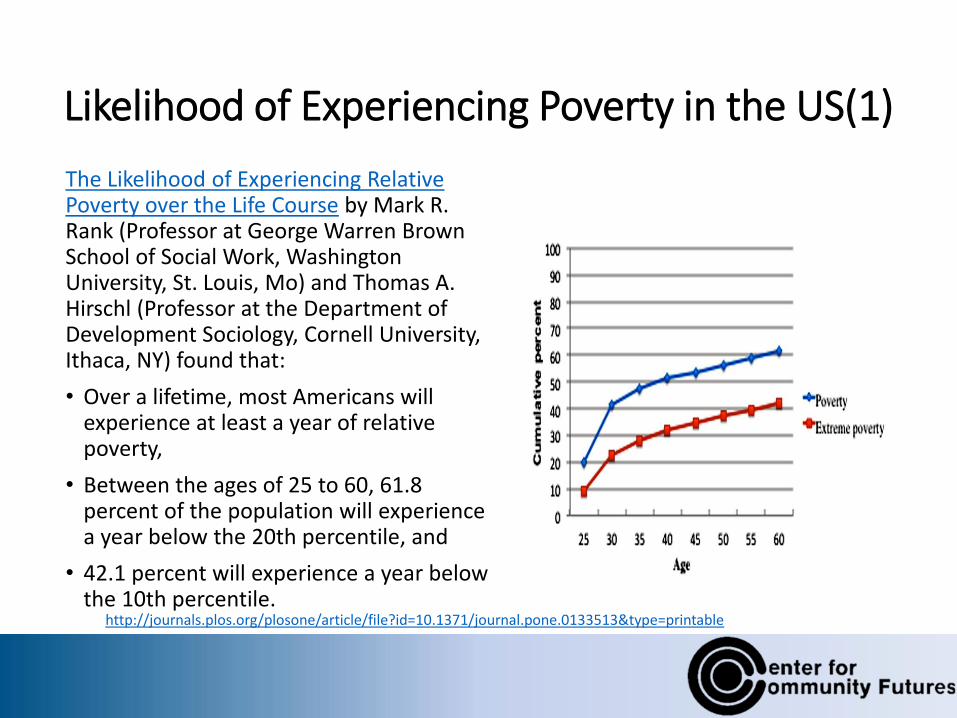
The Likelihood of Experiencing Relative Poverty over the Life Course by Mark R. Rank (Professor at George Warren Brown School of Social Work, Washington University, St. Louis, Mo) and Thomas A. Hirschl (Professor at the Department of Development Sociology, Cornell University, Ithaca, NY) found that:
• Over a lifetime, most Americans will experience at least a year of relative poverty,
• Between the ages of 25 to 60, 61.8 percent of the population will experience a year below the 20th percentile, and
• 42.1 percent will experience a year below the 10th percentile.
http://journals.plos.org/plosone/article/file?id=10.1371/journal.pone.0133513&type=printable
Likelihood of Experiencing Poverty in the US (2)
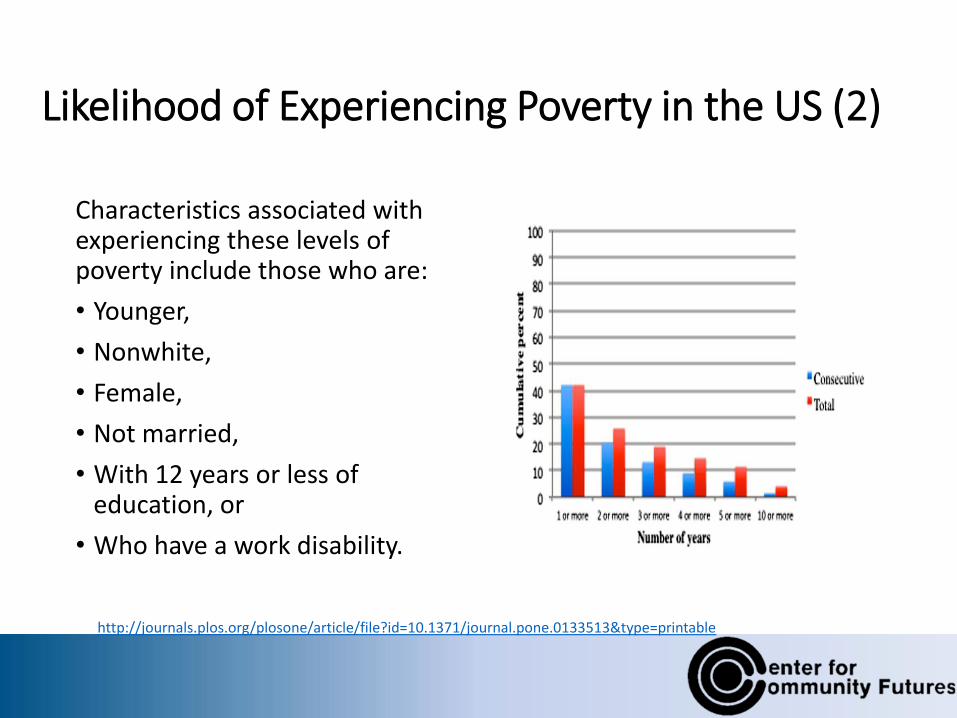
Characteristics associated with experiencing these levels of poverty include those who are:
• Younger,
• Nonwhite,
• Female,
• Not married,
• With 12 years or less of education, or
• Who have a work disability.
http://journals.plos.org/plosone/article/file?id=10.1371/journal.pone.0133513&type=printable
The problem: as the middle class is shrinking the American Dream is slipping away
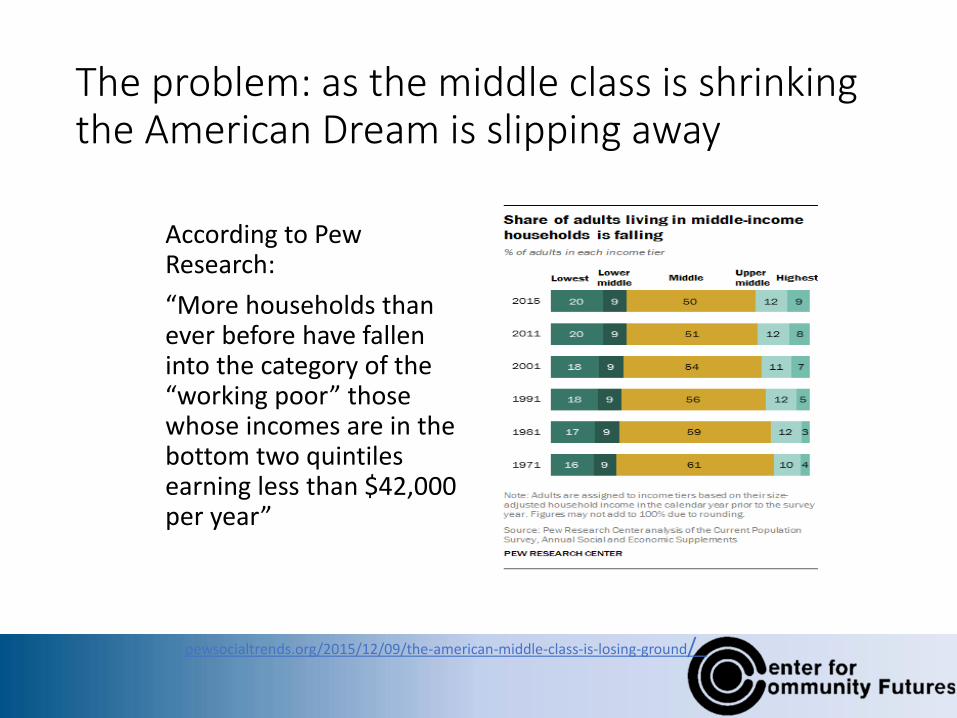
According to Pew Research:
“More households than ever before have fallen into the category of the “working poor” those whose incomes are in the bottom two quintiles earning less than $42,000 per year”
pewsocialtrends.org/2015/12/09/the-american-middle-class-is-losing-ground/

According to Pew's analysis of government data: “From 2000 to 2014, the share of adults living in middle income households fell in 203 of 229 U.S. metropolitan areas.”
America’s Shrinking Middle Class: A Close Look at Changes Within Metropolitan Areas, Pew Research Center

The Big Economic Causes of The Shrinking Middle Class since 1972 – and into the Future
Job Loss and Wage Stagnation happen because of:
1. Business culture and policies
r>g Thomas Piketty, Emmanuel Saez, Raz Chetty
Businesses give short term profits to managers and investors and not to worker pay and benefits.
2. Business practices in the name of “progress” reduce the number of jobs
Automation
Offshoring of jobs to lower labor costs, improve product quality
Cash held to avoid taxes, for M&A
3. Government failure to deal with the above.

What is The Number and Percent of People Living in Middle Income
Households in Your Area?

EAT Question1. What is the number and percent of people living in middle income households in your area?
a. How many households in your state/area earn less than $42,000 a year (the bottom two quintiles of the population)
http://www.pewresearch.org/fact-tank/2016/05/11/are-you-in-the-american-middle-class/
http://www.nccp.org/tools/converter/
b. What is the 40 year trend?
c. What other definitions and/or measures do you use to define what constitutes middle class in your area? https://project.wnyc.org/median-income-nation/#4/38.63/-95.89

Good Paying Jobs Are Declining
The Center for Economic and Policy Research:
• Good paying jobs (at least $18.50 an hour) declined overall between 1979 and 2010.
• While males held the majority of the jobs lost, female employment steadily increased.
• 40% of those good jobs requiring a degree held steady at about 42-45%
• Jobs with only a high school degree fell from 17% to about 5%
http://www.cepr.net/documents/publications/good-jobs-2012-07.pdf
EAT Question 2. What is the percentage of good-paying jobs in your area?
a. What percent of the jobs in your area are “good paying,” i.e. earning more than $18.50 an hour?
• http://cepr.net/documents/publications/good-jobs-2012-07.pdf
• https://www.bls.gov/oes/2016/may/oes_nat.htm
b. What is the 20, 30 or 40 year trend?
• An oldie but goodie https://www.census.gov/prod/2003pubs/02statab/labor.pdf

1414
Improving community assessments:
• HOW-TO MATERIALS for community assessment from the Partnership, NASCSP and ANCRT describe CONDITIONS such as the poverty rate, unemployment rate, etc.
• Do not ask for DETAILS about how people actually earn money, (part-time, temp, wage rates, number who have dropped out of the labor force, etc.)
• Do not describe problems in the economy and in the opportunity structure that are the CAUSES of why people are unable to earn a living.
• Therefore do not lead to STRATEGIES that reduce the causes. (Most services just ameliorate conditions.)

1515
The Solution: Use the Economic Analysis Toolkit
This Toolkit helps CAA’s go deeper into the structural causes of poverty today, to analyze:
• Automation – progress is a two-edged sword.
• Globalization – goods are cheaper but jobs are lost.
• Corporate culture and business practices squeeze employees, give the profits to the investors and managers. (All perfectly legal -- well, mostly legal except for wage theft and union busting.)
• The failure of government to deal with the above trends for the past 40 years.

1616
Economic Analysis Toolkit (EAT)• The Economic Analysis Toolkit helps CAA’s find out
how the national economic and workforce trends appear in their state, counties and cities. This information should be a section of the community assessment.,
• The EAT will help CAA’s select strategies to change the rules under which the economy operates. Many scholars, think tanks and practitioners have good ideas. We need more education and advocacy to get
them adopted.

17
ECONOMIC ANALYSIS OVERVIEW
THE TOOLS START AT THE HIGHEST LEVELS OF ECONOMIC ANALYSIS GDP), AND WORK DEDUCTIVELY DOWN TO THE CHARACTERISTICS OF J-O-B-S IN YOUR AREA.

1818
Toolkit format on each topic• Identify or define the problem/issue
• Indicators of the problem/issue.
– National
– Local
• EAT Questions for you to answer about your area
• And/or EAT survey questions for a group or individuals
• A map or mapping tool (if possible)
• Mitigation measures are listed in the White Paper

1919
Toolkit Topic AreasA. Economic Growth Rate >3% healthy, < 2% sick
B. Economic Regions operate between you and the global economy
C. How are profits divided? >50% to wage earners is healthy,
D. Formal/informal economy, self employment
E. Workforce Composition: characteristics of the people working
F. Characteristics of the jobs themselves
G. Compensation
H. Income volatility
I. Household wealth
J. What is to be done?
K. Bonus Section: Family Formation
• .
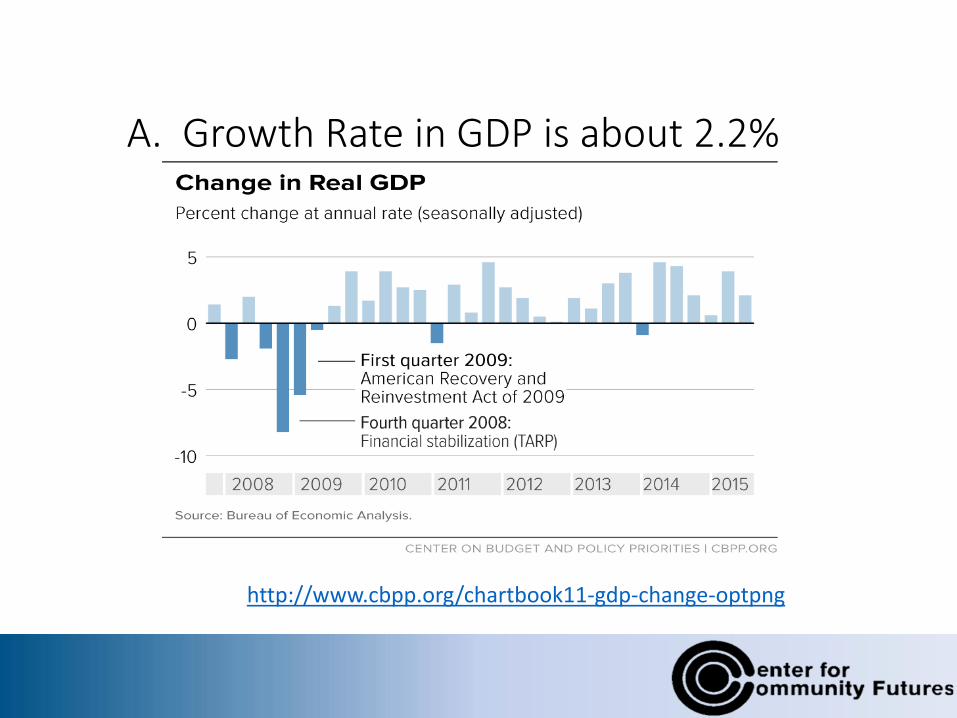
A. Growth Rate in GDP is about 2.2%
http://www.cbpp.org/chartbook11-gdp-change-optpng

A. What is the economic growth rate in your area? Is it above 3%? Below 3%?
•The growth rate is key. If above 3%, the rising tide hopefully lifts all boats.
•If between 2% and 3%, your economy is just floating along.
•If growth is below 2%, in most areas you are adding to unemployment, wages are stagnant or declining

A. EAT Question 3. Economic Growth Rate
What is the growth rate in your state? Region? Area?
DATA SOURCES:
• University Extension division
• Economic Development Agencies
• Local Workforce Innovation and Opportunity boards or commissions
• County Economic Development Departments
• State Department of Commerce
B. Economic Regions
• Wages in the same industry vary dramatically across the U.S. because of the characteristics of the ECONOMIC REGIONS in which they are located. How does your geographic area fit into the economic regions described by the USDA and the Department of Commerce Economic Development Administration?
• More importantly, the REGIONS are the links connecting your local economy to the global economy, and REGIONS are the conduits for the dynamics of the global economy back into your area. For example, all oil supply goes into one gigantic “world tank” and flows out of that “tank.” The price for oil flowing in our out varies according to worldwide aggregate supply/demand factors for a particular grade of oil, not because of what any one country or supplier tries to do. The world pricing systems come into your community.

B. Economic Regions
• When the marketplace for goods (including commodities, manufactured goods) or services (including labor costs) in an industry become globalized, values (prices) move toward the world average for that sector. Over time, wages in a given industry in low-wage countries go up, wages in that industry in a high-wage countries stagnate or go down.
• Harvard Professor Michael Porter explains the realities of regional economies and why there are such wide variations between them. Start here. If you make this through this paper you get an honorary MBA. http://clustermapping.us/sites/default/files/files/resource/The_Economic_Performance_of_Regions.pdf
• However you can bypass this paper and go straight to the sources (next slide).
B. EAT Question 4. Economic Regions – describe your regions and their characteristics
• Locate your region(s) and learn about economic trends affecting economic opportunity
• https://en.wikipedia.org/wiki/List_of_regions_of_the_United_States
• USDA https://www.ers.usda.gov/topics/rural-economy-population/rural-classifications
• EDA and Harvard University Business School http://www.clustermapping.us/cluster
• https://united-states.reaproject.org/
• https://www.ers.usda.gov/topics/rural-economy-population/rural-classifications

C. How productivity growth and profits are allocated.
• What happens to the benefits of growth in productivity – to the profits?
• What is the percent of corporate income going to workers
• Here is a surprise for you: since the 1970’s the profits produced by the rise in productivity have gone to the owners and managers, not to the wage earners.
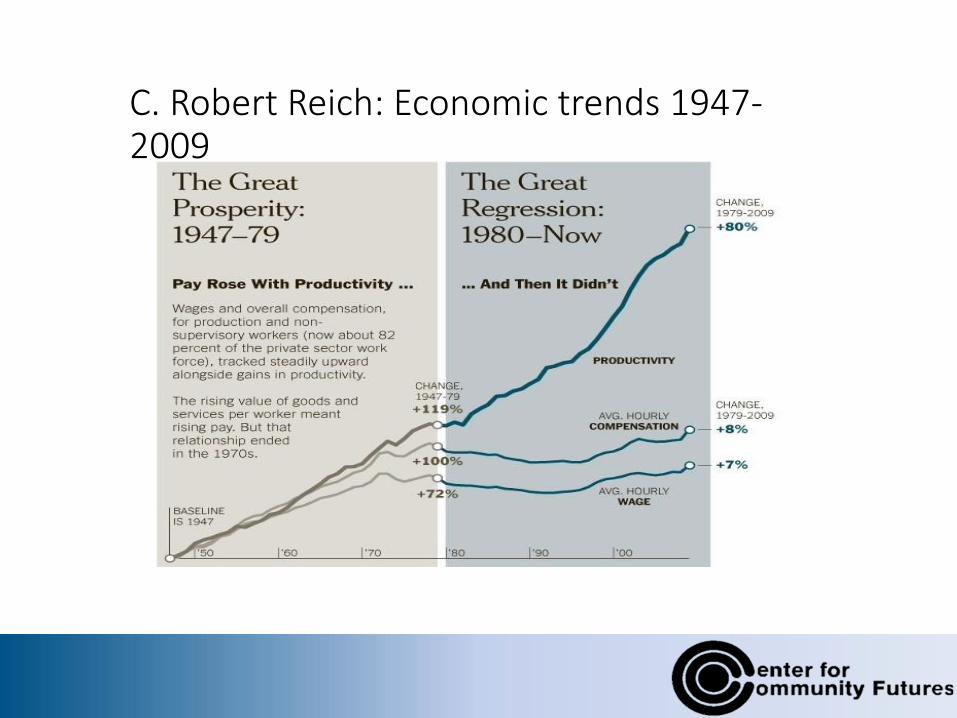
C. Robert Reich: Economic trends 1947-2009

C. Growing Productivity Gap 1973-2015
http://www.epi.org/productivity-pay-gap/

C. Decline in labor’s share of corporate income (2000-2017)
• The decline in labor’s share of corporate income since 2000 means $535 billion less for workers
• Between 2000 and the second quarter of 2015, the share of income generated by corporations that went to workers’ wages (versus going to managers and investors) declined from 82.3 percent to 75.5 percent.
• This 6.8 percentage-point decline in labor’s share of corporate income means that if this amount was spread over the entire labor force (not just corporate sector employees) this would translate into a $3,770 raise for each worker.
https://fred.stlouisfed.org/series/PRS85006173#http://www.epi.org/publication/understanding-the-historic-divergence-between-productivity-and-a-typical-workers-pay-why-it-matters-and-why-its-real
http://www.epi.org/publication/the-decline-in-labors-share-of-corporate-income-since-2000-means-535-billion-less-for-workers/
29

C. EAT Question 5. What is labor’s share of income in your area?
• Can you find his for a state or city?
• Data and information sources:Department of Labor (BLS)
State employment statistics
Local workforce council
University extension service
University department of economics
Chamber of Commerce
Local workforce innovation and opportunity Boarddevelopment board/council
36

Cash held by U.S. corporations
• $2.1 Trillion Bank and Non-bank deposits stashed in off-shore banks
• 20% of profits held off-shore
• Instead of investing, corporations have been paying more money out to Wall Street by issuing dividends and repurchasing shares.
• “A significant part” of the shortfall in corporate investment is due to the fact that fewer and fewer corporations control more and more of the American market.
http://www.sfchronicle.com/business/article/Tech-companies-are-hoarding-cash-so-where-is-6432105.php see also https://www.washingtonpost.com/news/wonk/wp/2017/07/18/researchers-have-a-new-theory-for-why-companies-are-sitting-on-ungodly-piles-of-cash/?utm_term=.4f2ba7cca1b8&wpisrc=nl_wonk&wpmm=1

D. The formal and informal economy
• The formal economy operates on paper. (OK it may be digital, too.) Paychecks, contracts, credit card charges and bank statements. There is a written record. Most activity in the formal economy is taxed.
• The informal economy is cash or barter. There is no written record. Almost none of it is taxed.
• The informal economy is as much as 50% in some Latin countries
• It is estimated to be about 10% in the U.S. i.e. 1.8 trillion in value. Only about 60 billion is illegal (drugs, prostitution, theft). Most activity would be legal if declared, i.e. barter where you fix my car and I’ll fix your roof. I’ll paint your house for $2,000.
• Most micro-businesses start in the informal sector. A person has something to sell and they start making money.
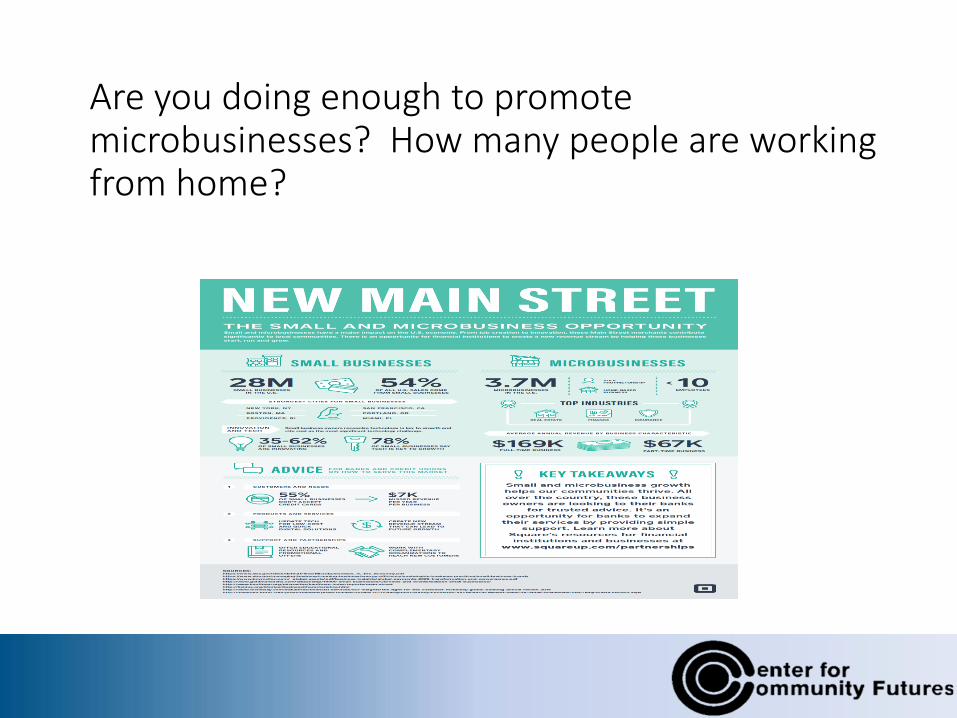
Are you doing enough to promote microbusinesses? How many people are working from home?
D. EAT Survey questions 6. The informal economy
• How easy is it to earn money “off the books.”
• Is your area permissive or hostile to activity in the informal economy?
• In which sectors do you see informal economic activity?
• Are food trucks and street vendors allowed to exist? Yard sales?
• Can you let a flea market operate on your parking lot on weekends?
• How much household income comes from the informal economy?

E. Workforce in relationship to the population.
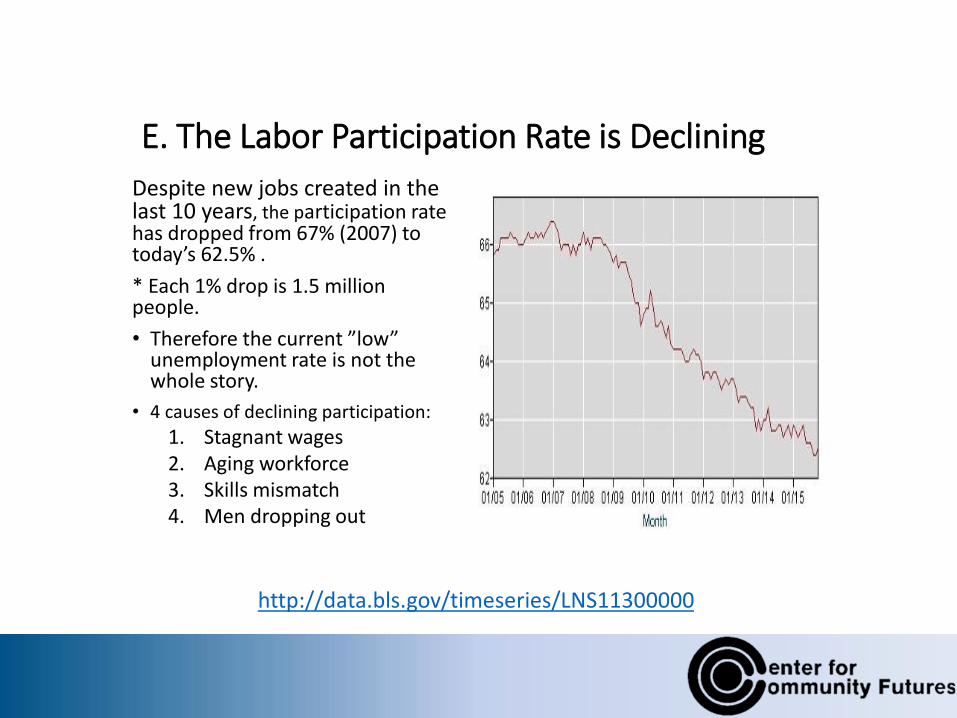
E. The Labor Participation Rate is Declining
Despite new jobs created in the last 10 years, the participation rate has dropped from 67% (2007) to today’s 62.5% .
* Each 1% drop is 1.5 million people.
• Therefore the current ”low” unemployment rate is not the whole story.
• 4 causes of declining participation:
1. Stagnant wages2. Aging workforce 3. Skills mismatch4. Men dropping out
http://data.bls.gov/timeseries/LNS11300000

E. Labor Force participation.The percentage of adults working
• Look at the variation state-by state, from a low of 52.8% in West Virginia to a high of 71.6% in North Dakota.
• https://www.expresspros.com/Newsroom/America-Employed/Express-Releases-State-by-State-Analysis-of-Labor-Force-Participation-Rates.aspx
• Here’s an overview of the employment situation from the DOL/BLS. Note the tables at the bottom of the narrative.
• Bureau of Labor Statistics Employment Situation Summary
• Understanding DOL’s approach to labor statistics requires some – understanding.
• http://jobenomicsblog.com/wp-content/uploads/2016/05/Jobenomics-U.S.-Unemployment-Analysis-Q1-2016.pdf
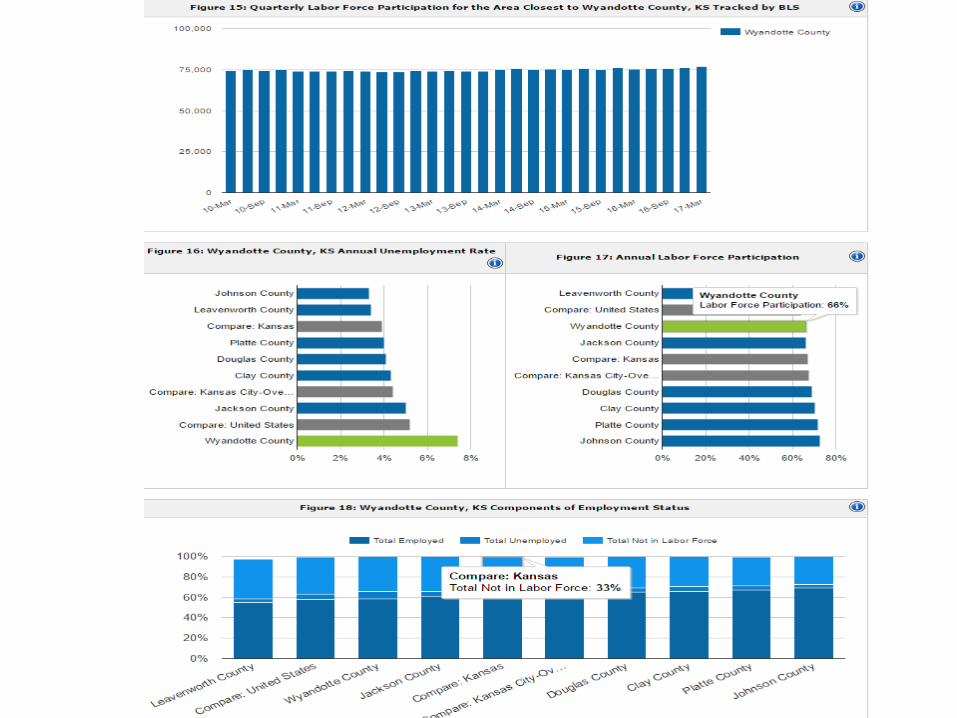
E. EAT Example. Labor force participation by industry
• EXAMPLE:
• Workforce participation rate Wyandotte County, KansasSource: Towncharts.com
http://www.towncharts.com/Kansas/Economy/Wyandotte-County-KS-Economy-data.html
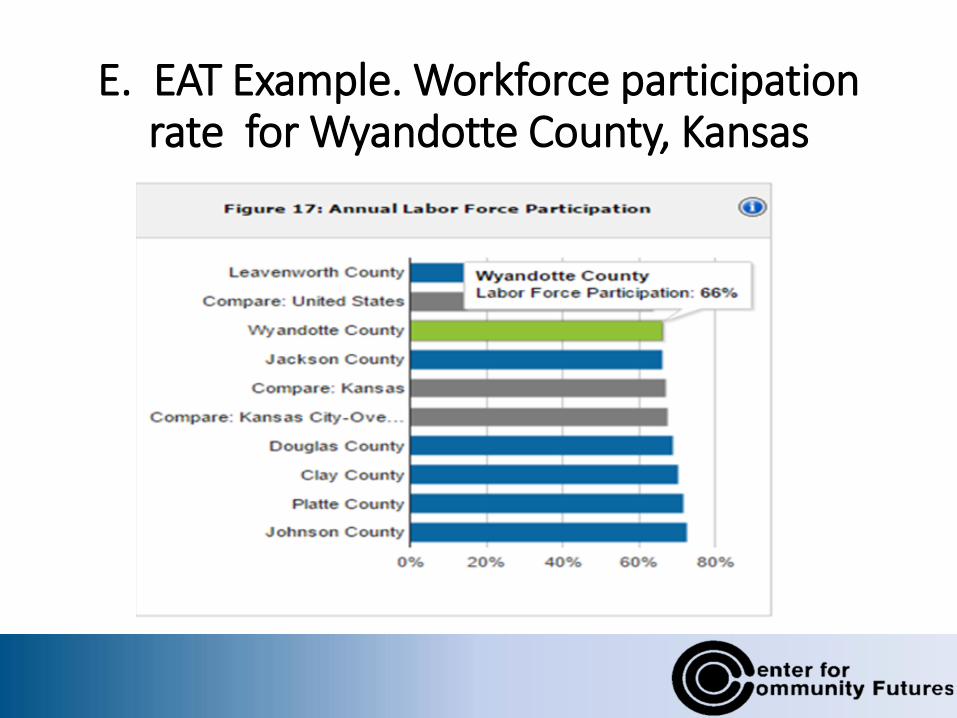
E. EAT Example. Workforce participation rate for Wyandotte County, Kansas

E. EAT Question 7. What percent of adults are working your state and counties?
• As we have seen, this can be further refined to look at industry area, gender, income levels, etc.
• But the percent of adults the 25 to 55 year-old age group is an important barometer of the economic health of your population.
• What is the 20 year trend?
• Go to your state Department of Labor
• DOL/BLS
• Local workforce innovation and opportunity board
4242
E. Understanding the Real Economy
• Many national trends are significant whether or not we have yet figured out a way to measures them locally.
• These include offshoring.
• These include robotics and automation Where most American job losses are occurring

4343
E. Automation kills jobs examples
• What are the number of people over the past 40 years employed in:
• Steelmaking. In 1970, 521,000 were employed, now 180,000 produce the same amount of steel.
• Coal mining. In 1920, 784,000 were employed, now 76,000 produce more coal.
• Manufacturing. Then 22% of the workforce, now 12% producing the same $ value of stuff
• Truck driving. 3 million now. What will self-driving trucks do to them?
4444
E. EAT examples for automation
• Nationally, store clerks are about 16 million people, predicted to drop by 5 million in the next few years. Gas station attendants. Bank tellers. Remember those?
• https://www.ecbforum.eu/uploads/originals/2017/speakers/papers/D_Autor_A_Salomons_Does_productivity_growth_threaten_employment_Final_Draft_20170619.pdf

4545
E. More Resources on Automation
• http://www.mckinsey.com/global-themes/digital-disruption/harnessing-automation-for-a-future-that-works
• http://www.pewinternet.org/2017/05/03/the-future-of-jobs-and-jobs-training/

4646
E. EAT Question 8. Automation
• For the jobs most likely to be automated out of existence, how many people in your area work in the top five? See those areas at:
• https://obamawhitehouse.archives.gov/sites/whitehouse.gov/files/documents/Artificial-Intelligence-Automation-Economy.PDF
• See the charts on pages 14, 16 and 24
• https://obamawhitehouse.archives.gov/sites/default/files/whitehouse_files/microsites/ostp/NSTC/preparing_for_the_future_of_ai.pdf

4747
E. EAT Questions 9. Automation
a. Number of jobs lost to automation
b. Number of jobs created by automation
c. Identify the numbers employed then and now in the largest occupational categories in your area.

4848
E. EAT Questions 10. for jobs moving in and out
a. Number of jobs moved out of your state or county area -- elsewhere in the U.S. (State sources?
b. Number of jobs moved overseas• https://seii.mit.edu/wp-content/uploads/2013/11/Autor-Dorn-Hanson-
The-China-Syndrome-Local-Labor-Market-Effects-of-Import-Competition-in-the-United-States-American-Economic-Revi.pdf
• https://www.citizen.org/our-work/globalization-and-trade/trade-related-job-loss-state
4949
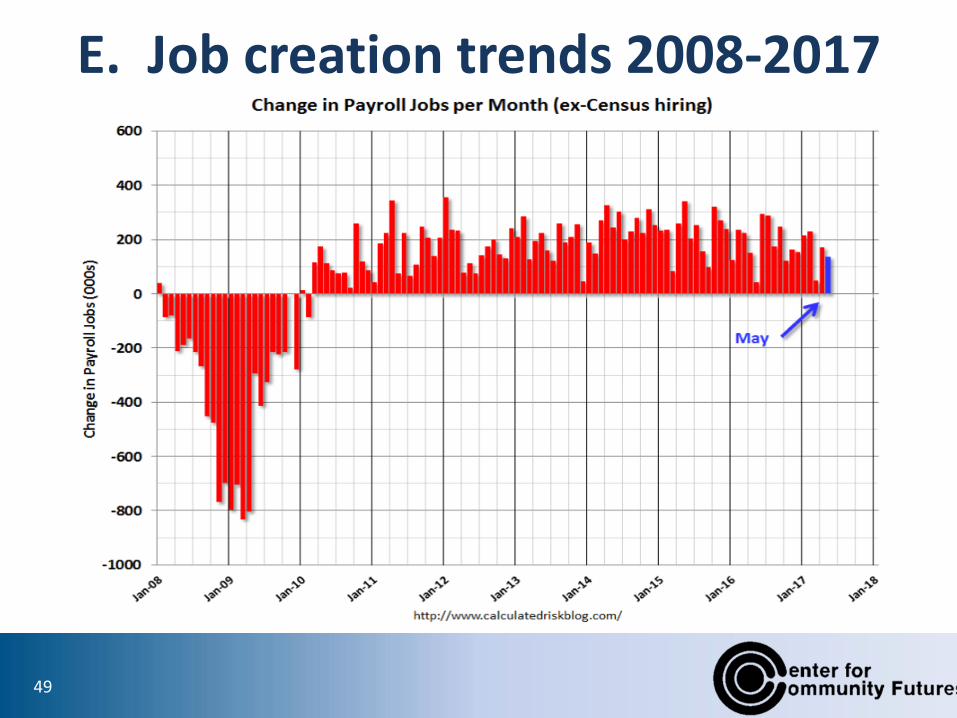
E. Job creation trends 2008-2017

5050
E. Labor force turnover and job growth
• About 5 million people leave their jobs EACH MONTH.
• About 5 million people get jobs EACH MONTH.
5151
E. Calculate the change in the number of people working • This number is the difference between
separations and new hires on the previous slide
• On an nationwide basis, it takes about 145,000 NEW jobs to be created EACH MONTH to keep up with normal population growth.
5252
• Nationally, if FEWER than 145,000 net new jobs are created, then the total number of people who are seeking work but unable to find it is increasing. Unemployment is going up. (Assuming the 5 million remains steady)
• If MORE than 145,000 net new jobs are created, then the total number of unemployed people is decreasing.
E. Calculate the change in the number of new jobs

5353
E. EAT. Example on job growth
Size of workforce in our area (people between 25 and 55 seeking work)in thousands2014 2015 2016 201722 23 24 25
Net new jobs in our area (in hundreds)12 9 6 3
Your workforce is expanding 1,000 per year but the increase in employment opportunities is not keeping up

5454
E. EAT Questions 12. Labor Force Turnover
• What are these numbers in your area?
• Is the population increasing or decreasing
• Is the number of new jobs increasing or decreasing?
• Is job growth keeping up with population growth?
• What is the multi-year trend?

5555
E. EAT Questions 11. Change in the net number of people working
a. Is the difference between separations and new hires in your area: Increasing? Decreasing? Staying the same?
If there are more new hires and the growth in working-age population, that unemployment is going down. If there are fewer new jobs than the growth in the population, then unemployment is increasing. If the number of new hires and population growth are the same, then unemployment rate remains constant.
F. Number of people working by industry area

F. Jobs by industry areaNote: Most of the growth Is in health care, principally Driven by aging baby boomers.

F. Example. Kansas City Kansas Area Year to Year Employment Changes
http://www.bls.gov/regions/mountain-plains/summary/blssummary_kansascity.pdf

F. EAT Question 13. Determine the number of jobs by types of occupation
• In the previous section you estimated job growth relative to the increase in population.
• In this section we are looking at job grown or shrinkage by job type or occupational category. What is happening?

6060
F. Labor Trends and Economic Data SourcesBureau of Labor Statistics Employment Situation Summary
• Income and earnings: https://factfinder.census.gov/faces/nav/jsf/pages/searchresults.xhtml?refresh=t#acsST
• Pay & Benefits: https://www.bls.gov/data/#wages
• Board of Directors, Federal Reserve System Report on the Economic Well-Being of U.S. Households in 2015, May 2016,
• Involuntary Part-time: https://www.bls.gov/opub/btn/archive/involuntary-part-time-work-on-the-rise.pdf
• Employed persons by class of worker and part-time status: https://www.bls.gov/news.release/empsit.t08.htm
Other data sources:
• http://www.governing.com/gov-data/economy-finance/metro-area-employment-job-growth.html
• Workforce Innovation and Opportunity Act Local Area Plan (http://workforcepartnership.com/_uploads/library/file_137.pdf)
• https://lmi.workforcegps.org/resources/2015/06/18/11/23/Employment_Projections_Portal_for_Planning_for_the_Future

6161
F. Example. A close look at one industry: Coal Mining

6262
F. Numbers employed

6363
F. More Workers in Solar Than Fossil Fuel Power Generation
https://techcrunch.com/2017/06/02/why-pulling-out-of-paris-accords-damages-americas-economic-future/

6464
F. Examples of # of employees in large companies
• Whole Foods (72,650)
• Arby's (close to 80,000)
• Dollar General (105,000)
• J.C. Penney (114,000)
• Walmart (2.2 million)
• Coal, (50,300) employees as of February 2017.
• https://fred.stlouisfed.org/series/CES1021210001

6565
F. The above from the Washington Post
• https://www.washingtonpost.com/news/wonk/wp/2017/03/31/8-surprisingly-small-industries-that-employ-more-people-than-coal/?utm_term=.5bba5d80e3d1&wpisrc=nl_wonk&wpmm=1
6666
F. Number of coal miners by state
• https://www.eia.gov/coal/annual/pdf/table18.pdf
• Notice that Kentucky employs almost 12,000 people in coal mining.
• Has the trade-off become the entire U.S. role in climate change vs. 12,000 coal-mining jobs in Kentucky?

F. What is the 30-year trend for women and men being in the workforce?

F. Pew Research found that nationally, the trend in labor participation for both has been declining (1)
Findings from their January 2017 Research Report:
• The drop has been widespread.
• The steady growth in women’s labor force representation slowed in the 1990s as women’s participation peaked.
• Labor force participation declined for both men and women between 2000 and 2015, so the growth rates of the male and female labor force are now quite similar on average: 0.8% per year for women between 2000 and 2010, compared with 0.7% for men.
• The participation rate of women ages 25 to 54 has fallen since 2000.
http://www.pewresearch.org/fact-tank/2017/01/31/women-may-never-make-up-half-of-the-u-s-workforce/
F. Pew Research found that nationally, the trend in labor participation for both has been declining (2)
• Mothers with children younger than 18 are less likely to participate in the labor force now than they were in 2000, particularly less-educated mothers.
• Some researchers have suggested this may be due in part to changing gender role attitudes.
• Women without children under 18 and single women are also less likely to participate than they were in the 1990s.
• The withdrawal of single women from the labor force in part reflects that more of them are going to school.
E. Labor Force Participation Rate by Gender
• Males
• https://jobmarketmonitor.com/2016/06/26/the-decline-in-prime-age-male-labor-force-participation-in-us-a-white-house-report/
• The full paper of long term decline of male labor force participation.
https://obamawhitehouse.archives.gov/sites/default/files/page/files/20160620_cea_primeage_male_lfp.pdf
• Males and Females
• http://mjperry.blogspot.com/2012/05/decline-in-labor-force-participation.html The moral of the story that the man should be the primary breadwinner is: old myths die hard.

EAT Question 13. Jobs by gender
• Create a chart showing trends by gender.

E. Persons Not in the Labor Force
http://www.economicpopulist.org/content/april-unemployment-rate-lowest-may-2007-6106
7373
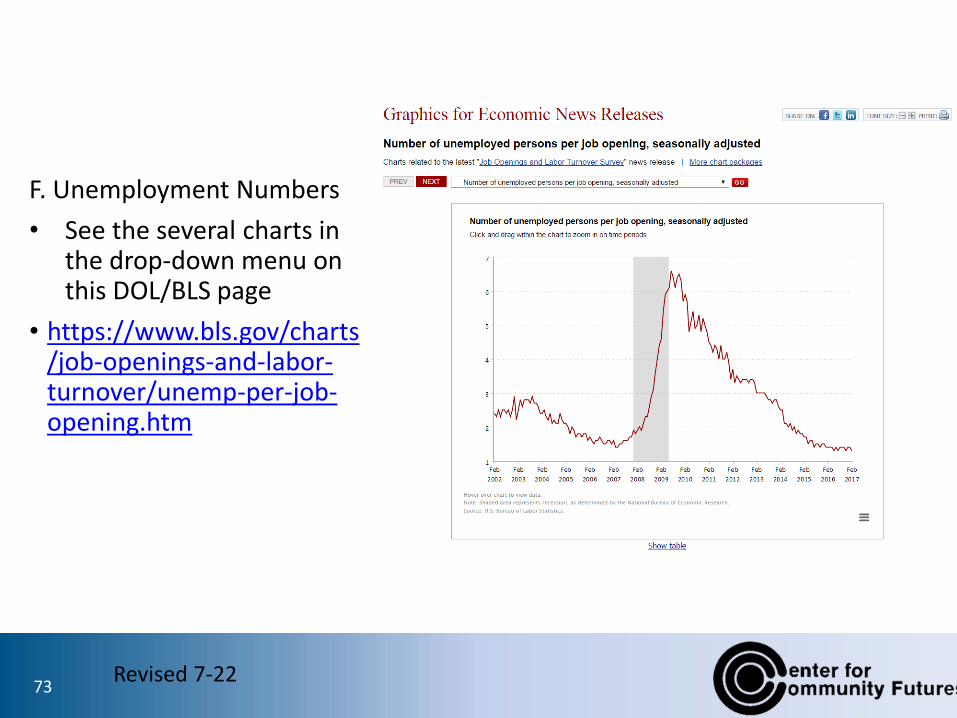
F. Unemployment Numbers
• See the several charts in the drop-down menu on this DOL/BLS page
• https://www.bls.gov/charts/job-openings-and-labor-turnover/unemp-per-job-opening.htm
Revised 7-22

E. Not in the labor force.
4808 4121 4398 5180
59396212 6135
6532
5932 6212 5326
41154187
4618
80299098
89358174
7926 7766
6790
6050
0
2000
4000
6000
8000
10000
12000
14000
16000
2005 2006 2007 2008 2009 2010 2011 2012 2013 2014 2015
DISCOURAGED WORKERS: WANT JOB NOW, NOT IN LABOR FORCE
AND PART-TIME EMPLOYED, ‘000
Not in Labor Force Part-time Employed
Source: http://www.bls.gov/cps/lfcharacteristics.htm

EAT Question 14.
• Identify the number/% of “discouraged workers” in your state/area.
E. Unemployment numbers
• Nationwide there is “full employment” yet millions of people are not in workforce and not making a living. And the more you drill down into smaller communities the higher the numbers go.
• “The challenges for workers in minority communities are even greater. The average unemployment rate across all census tracts where minorities made up a majority of the population averaged 14.3 percent from 2011 through 2015. Also, a much smaller share of the prime working-age population in these areas is employed -- 67.7 percent during this period, which is nearly 9 percentage points lower than in communities with smaller minority populations.” Janet Yellen, April, 2017
• https://www.federalreserve.gov/newsevents/speech/files/yellen20170328a.pdf

E. Gap between unemployed and drop-outs of the workforce
https://www.americanprogress.org/issues/economy/news/2017/06/01/433394/state-u-s-labor-market-pre-june-2017-jobs-release/
E. EAT Questions 15. “Unemployed”
a. Number unemployed -- looked for work in the past 12 months (trend)
b. Number unemployed more than 26 weeks (trend)
c. Number unemployed more than 52 weeks (trend)
TIP 1. DO YOUR UNEMPLOYMENT NUMBERS by census tract or block or neighborhood to show the actual rates in areas where people with low incomes and minorities live. (Rates in these area tend to be about double the state or county-wide totals.).
Tip 2. Get the BLS charts U-3 through U-6. https://www.bls.gov/news.release/empsit.t15.htm
Revised 7-22
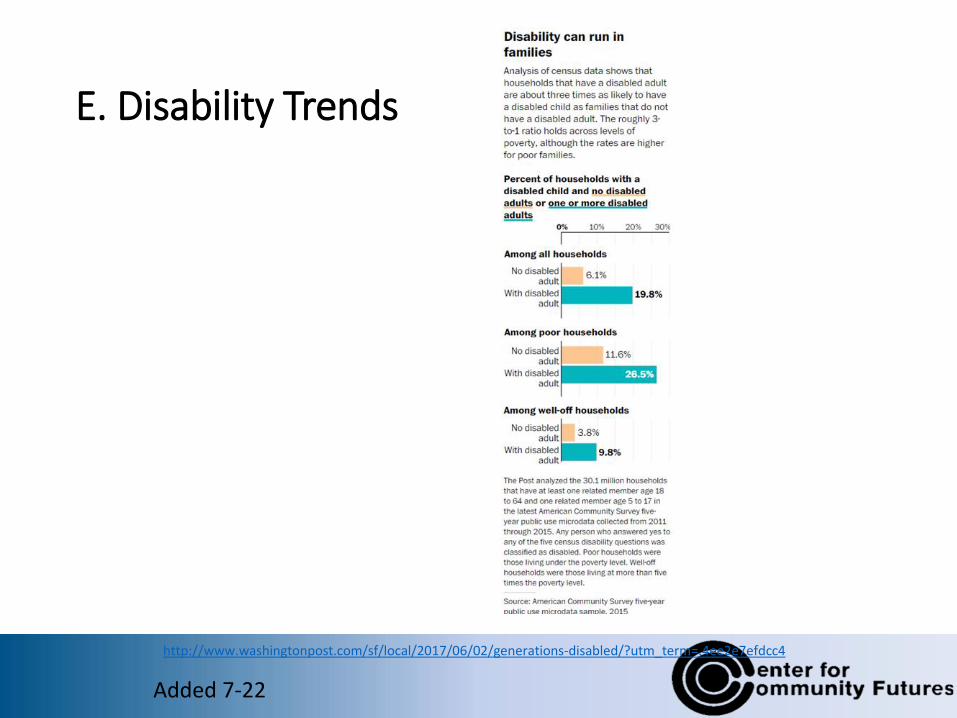
E. Disability Trends
Added 7-22
http://www.washingtonpost.com/sf/local/2017/06/02/generations-disabled/?utm_term=.4ee2e7efdcc4
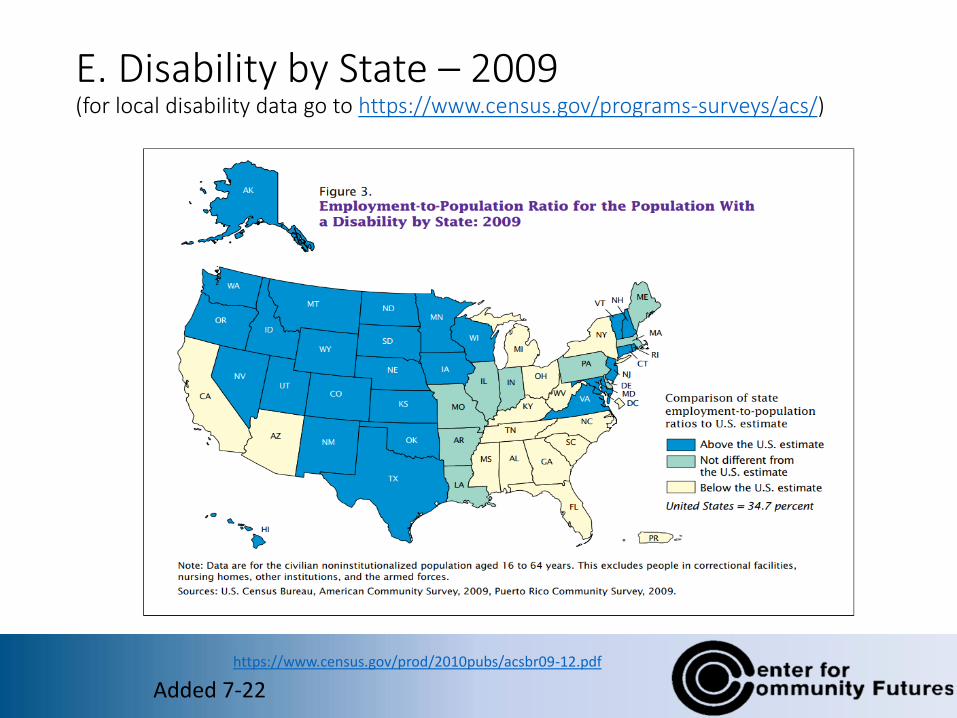
E. Disability by State – 2009(for local disability data go to https://www.census.gov/programs-surveys/acs/)
https://www.census.gov/prod/2010pubs/acsbr09-12.pdf
Added 7-22
E. EAT Questions 16. Disability
a. Number/% on SSI (trend)
• https://www.ssa.gov/policy/docs/statcomps/ssi_sc/
b. Number/% on SSDI
• https://www.ssa.gov/policy/data_title.html
c. How many people in your areas who are on disability are also working in the formal or informal economy?
Revised and move from F to E 7-22

F. Part Time. The number of people working only part time remains very high
https://www.americanprogress.org/issues/economy/news/2017/06/01/433394/state-u-s-labor-market-pre-june-2017-jobs-release/
F. Part-time work becoming new normal
According to research conducted by the Economic Policy Institute:
•Over six years into an economic recovery, the share of people working part time because they can only get part-time hours remains at recessionary levels.
• The number working part time involuntarily remains 44.6 percent higher than it was in 2007. This growth is being driven mainly by a few industries.
• About 9 million workers want full-time jobs but are working only part-time hours. https://www.bls.gov/news.release/empsit.t08.htm
• Involuntary part-time workers are not only earning less income than they would prefer, but suffer because part-time jobs offer relatively lower wage rates and fewer benefits, and have more variable and unpredictable work schedules.
• https://www.bls.gov/opub/btn/archive/involuntary-part-time-work-on-the-rise.pdf
http://www.epi.org/publication/still-falling-short-on-hours-and-pay-part-time-work-becoming-new-normal/?mc_cid=b9f35f7283&mc_eid=d9e9dfe0de
83

F. EAT Questions 17. How many people are working part time?
a. Voluntarily?
b. Wish they were working full time?
c. What percent of the workforce is this?
• You can try to calculate this deductively, working off national and state totals and prorating for your area as your population is a percent of the state, or inductively – asking people who come through your door.
• Any state sources on this?

F. On-demand Jobs

F. EAT Question 18. What is the number and percent of the workforce working in “on demand” jobs?
Fastest growing jobs in your service area sources:
• BLS Occupational Outlook handbook (https://www.bls.gov/ooh/)
• Workforce Innovation and Opportunity Act Local Area Plan (http://workforcepartnership.com/_uploads/library/file_137.pdf)
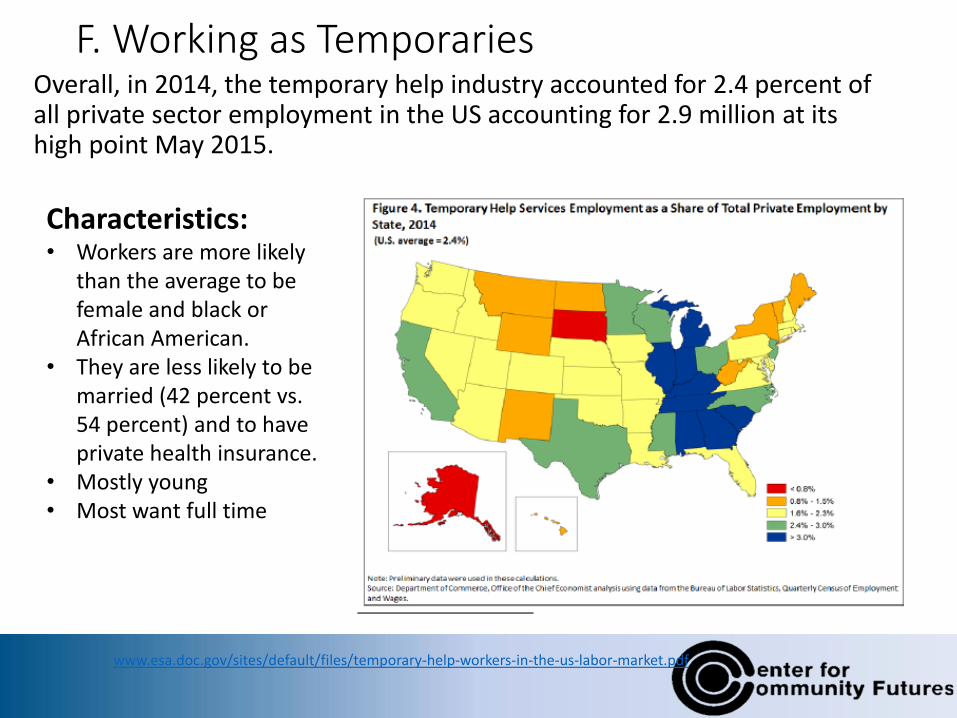
F. Working as TemporariesOverall, in 2014, the temporary help industry accounted for 2.4 percent of all private sector employment in the US accounting for 2.9 million at its high point May 2015.
www.esa.doc.gov/sites/default/files/temporary-help-workers-in-the-us-labor-market.pdf
Characteristics: • Workers are more likely
than the average to be female and black or African American.
• They are less likely to be married (42 percent vs. 54 percent) and to have private health insurance.
• Mostly young • Most want full time
F. Eat Questions 19. Temporaries
a. How many are there in your area?
b. How many want to work full time?
c. Again, use BLS and state source, and ask people.

F. Labor force participation by education level: Most jobs are offered to college grads.

F. Most jobs since the recession have gone to college grads

F. Example. Kansas City - Education and # Workers

F. EAT Survey Questions 20. Employment by Education levels
a. What are the trends in your area?
b. If 90% of new jobs are going to college graduates, what are the people who do not have a college degree doing to earn a living?
Revised 7-22
F. Are people getting jobs getting jobs that have a W-2, or a 1099?
• The trend is hard to measure, since subcontracting can take many forms. But it is big. A study last year by Lawrence F. Katz of Harvard and Alan B. Krueger of Princeton, a former chief economic adviser to President Barack Obama, concluded that independent contractors, on-call workers and workers provided by contracting companies or temp agencies accounted altogether for 94 percent of employment growth over the last 10 years.
• https://www.nytimes.com/2017/02/28/business/economy/economy-labor-wages-subcontracting.html?_r=0
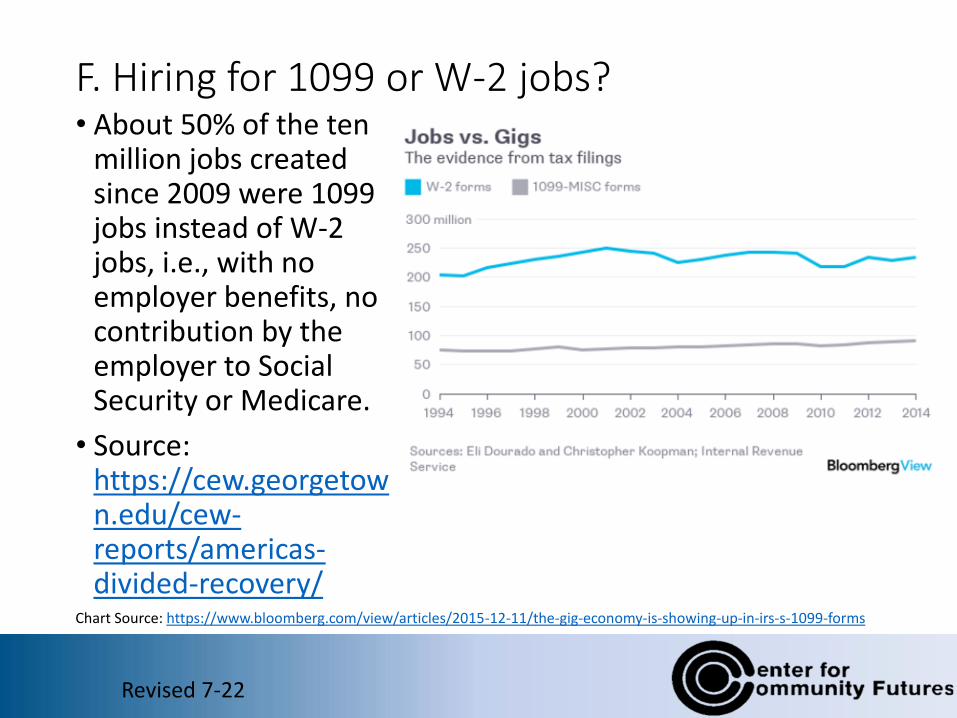
F. Hiring for 1099 or W-2 jobs?• About 50% of the ten
million jobs created since 2009 were 1099 jobs instead of W-2 jobs, i.e., with no employer benefits, no contribution by the employer to Social Security or Medicare.
• Source: https://cew.georgetown.edu/cew-reports/americas-divided-recovery/
Chart Source: https://www.bloomberg.com/view/articles/2015-12-11/the-gig-economy-is-showing-up-in-irs-s-1099-forms
Revised 7-22

F. More sources on 1099 vs. W-2
• http://www.nber.org/papers/w22667
• What percent of jobs in your area are “…independent contractors, on-call workers and workers provided by contracting companies or temp agencies.
• What percent of total employment growth is this?
• http://scholar.harvard.edu/lkatz/publications/rise-and-nature-alternative-work-arrangements-united-states-1995-2015

F. EAT Survey Questions 21. 1099 or W-2.
a. Are your or any member of your family working as an independent contractor, on-call worker or worker provided by a contracting company or temp agency?
b. Which one?
Or
c. Do you get a 1099 job or a W-2 from your employer?

F. Additional workforce composition datahttps://www.bls.gov/news.release/empsit.t15.htm
U-1 Persons unemployed 15 weeks or longer, as a percent of the civilian labor force
U-2 Job losers and persons who completed temporary jobs, as a percent of the civilian labor force
U-3 Total unemployed, as a percent of the civilian labor force (official unemployment rate)
U-4 Total unemployed plus discouraged workers, as a percent of the civilian labor force plus discouraged workers
U-5 Total unemployed, plus discouraged workers, plus all other persons marginally attached to the labor force, as a percent of the civilian labor force plus all persons marginally attached to the labor force
U-6 Total unemployed, plus all persons marginally attached to the labor force, plus total employed part time for economic reasons, as a percent of the civilian labor force plus all persons marginally attached to the labor force
HOUSEHOLD DATATable A-15. Alternative measures of labor underutilization [Percent]

F. EAT Survey Questions 22. More characteristics of jobs
1. Numbers working split shifts
2. Number working multiple jobs
3. It is not all sweetness and light even for college graduates: student debt is delaying marriage and slowing home buying. What is the amount of student debt in your state and area?
4. What is the number of people under 35 years old living in parent’s house (trend)
5. Number/% of workforce who are union members (trend)
Revised 7-22

9999
F. EAT Survey questions 23, and data collection suggestions
What are the primary reasons why people have trouble making a living in this community? Lack of child care
Not enough jobs
Wages are too low
Lack of encouragement to work
Lack of education
Not enough on-the-job training
Lack of transportation
Not enough resources (EDD or other agencies)to help find a good paying jobs
Other _________________________

G. Compensation and Incomes 1999 vs 2014
http://www.pewsocialtrends.org/2016/05/11/americas-shrinking-middle-class-a-close-look-at-changes-within-metropolitan-areas/st_2016-05-12_middle-class-geo-04/
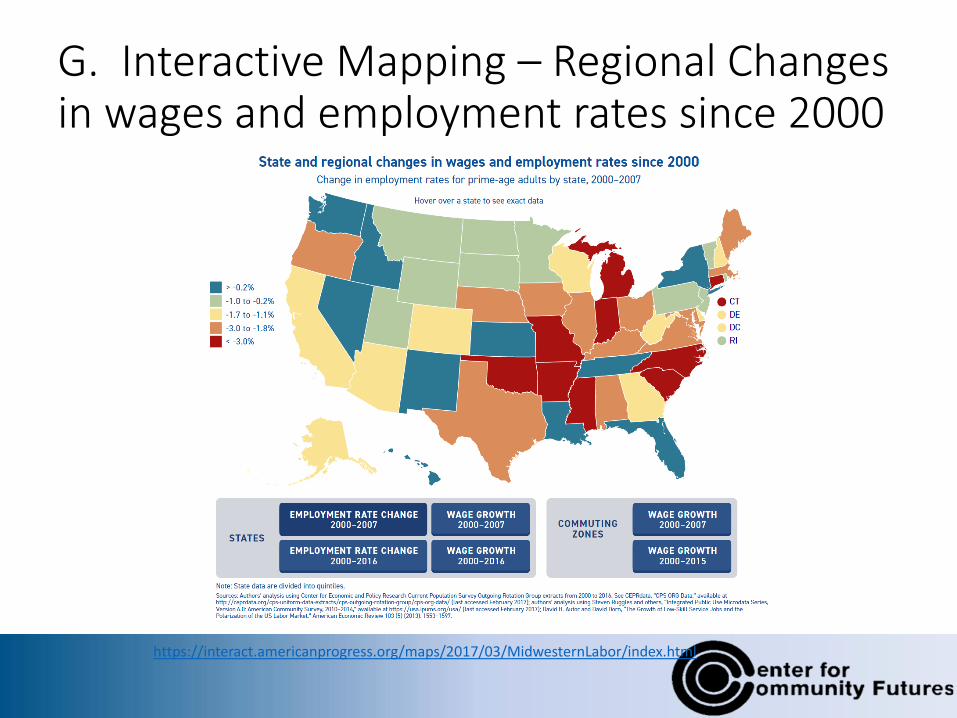
G. Interactive Mapping – Regional Changes in wages and employment rates since 2000
https://interact.americanprogress.org/maps/2017/03/MidwesternLabor/index.html

102102
G. What do our jobs pay? Here’s a database on 72 careers in 107 cities
http://www.bizjournals.com/sacramento/news/2017/06/02/money-in-america-what-do-our-jobs-pay-heres-our.html?ana=e_ph_prem&u=iH2DybuFSoP%2Bm50nMknBvYGpEoe&t=1496420166&j=78303011.


G. Year to Year Change Hours Worked and Hourly Earnings May 2016-May 17
https://klic.dol.ks.gov/admin/gsipub/htmlarea/uploads/LR%20May2017%20Economist%20Overview%20Report.pdf
7

G. EAT Question 24 on wages.
• Chart the average wages by job type for your area.
Sources in addition to those listed previously:
• BLS: https://www.bls.gov/bls/blswage.htm
• Local resources: http://www.payscale.com/research/US/Country=United_States/Salary
https://www.indeed.com/salaries
https://www.careerinfonet.org/select_state.asp?next=wages1&level=&optstatus=&id=&nodeid=208&soccode=&jobfam=&menuMode=&SOC=
Revised 7-22
G. Employed but paid non-living wages• The official poverty measure is based largely on whether a household’s cash
income can support basic needs, so there is a strong connection between the health of our labor markets and the poverty rate.
• While U.S. unemployment declined 1.6 percentage points from 2014 to 2015, earnings and wages remained flat, especially for those near the bottom.
• Among the bottom fifth of U.S. workers, most of whom earn less than $10 per hour, even working full-time all year will not allow an individual worker to reach the $24,036 annual income required to keep a family of four out of poverty.
• According to the Census Bureau, 104 million people — a third of the population — have annual incomes below twice the poverty line, less than $38,000 for a family of three. Goal: 75% of median $51,939 is $38,954
106

G. Who are the “Working Poor”
• In 2013 the “Working Poor” were:• 7% of the total work force
• 13% of Blacks; 13% of Hispanics; 6% of Whites; 5% of Asians
• 8% of women; 6% of men
• 19% of the labor force with less than a high school diploma; 9% of high school graduates with no college education; 5% for those with an associate’s degree and 2% for those with a bachelor’s degree or higher
• Most likely young: rates were highest for 16 to 19 year olds (11%) and 20 to 24 year olds (13%) and lowest for those over 65 (2%)
• 16% of part-time workers; 4% for those employed full-time
http://poverty.ucdavis.edu/faq/who-are-working-poor

G. EAT question 25. What is the number and percent of people who work full time but are still poor?• BLS
• Census Am Cmty Survey
• State Employment Department?

G. EAT Survey Questions 26. Work supports
Work supports are essential for most families. What are the:
• Number of people/families receiving Medicaid
• Number of people/families receiving SNAP
• Number of people/families receiving EITC
• Number of people/families receiving LIHEAP
• Number of people/families receiving other public benefits
Increasingly, public benefits will go only to people who work. Is your agency prepared to be a worksite for a large number of people?
Revised 7-22
G. Wage Theft in the US$8 billion annually in lost wages

G. Defining the problem: What is wage theft?
Wage theft is the failure to pay workers the full wages to which they are legally entitled. Wage theft can take many forms, including but not limited to:• Minimum wage violations: Paying workers less than the legal minimum
wage
• Overtime violations: Failing to pay nonexempt employees time-and-a-half for hours worked in excess of 40 hours per week
• Off-the-clock violations: Asking employees to work off-the-clock before or after their shifts
• Meal break violations: Denying workers their legal meal breaks Pay stub and illegal deductions: Taking illegal deductions from wages or not distributing pay stubs
• Tipped minimum wage violations: Confiscating tips from workers or failing to pay tipped workers the difference between their tips and the legal minimum wage
• Employee misclassification violations: Misclassifying employees as independent contractors to pay a wage lower than the legal minimum
http://www.epi.org/files/pdf/125116.pdf
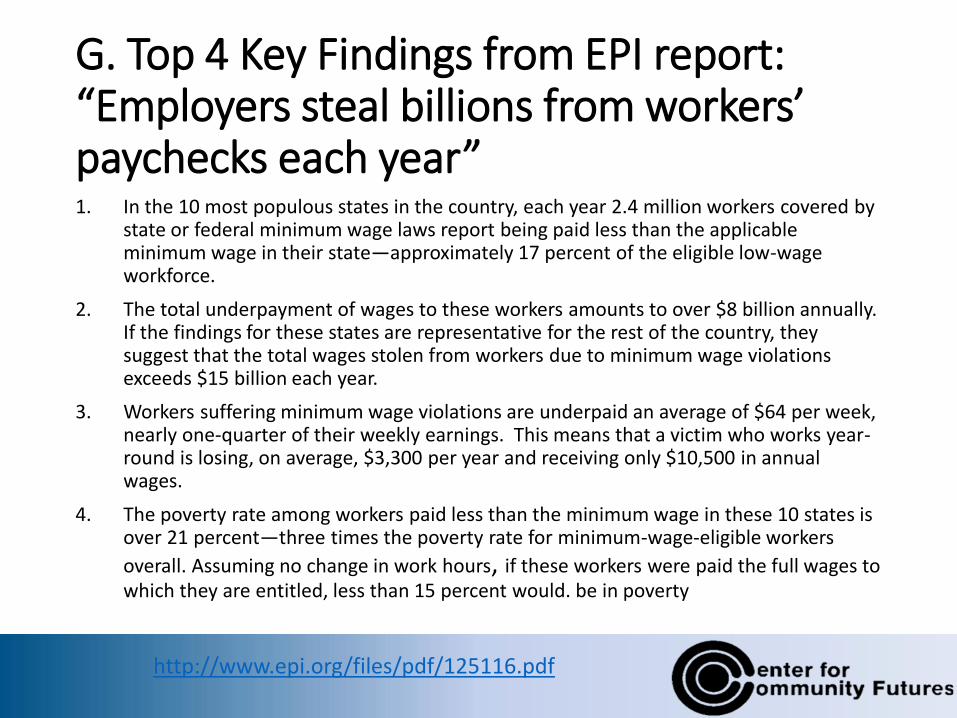
G. Top 4 Key Findings from EPI report: “Employers steal billions from workers’ paychecks each year”1. In the 10 most populous states in the country, each year 2.4 million workers covered by
state or federal minimum wage laws report being paid less than the applicable minimum wage in their state—approximately 17 percent of the eligible low-wage workforce.
2. The total underpayment of wages to these workers amounts to over $8 billion annually. If the findings for these states are representative for the rest of the country, they suggest that the total wages stolen from workers due to minimum wage violations exceeds $15 billion each year.
3. Workers suffering minimum wage violations are underpaid an average of $64 per week, nearly one-quarter of their weekly earnings. This means that a victim who works year-round is losing, on average, $3,300 per year and receiving only $10,500 in annual wages.
4. The poverty rate among workers paid less than the minimum wage in these 10 states is over 21 percent—three times the poverty rate for minimum-wage-eligible workers
overall. Assuming no change in work hours, if these workers were paid the full wages to which they are entitled, less than 15 percent would. be in poverty
http://www.epi.org/files/pdf/125116.pdf

G. Share of low-wage minimum-wage-eligible workers experiencing minimum wage violations
http://www.epi.org/files/pdf/125116.pdf

G. Results of wage theft: increasing poverty rates
http://www.epi.org/files/pdf/125116.pdf

G. Wage Theft and Public Assistance
http://www.epi.org/files/pdf/125116.pdf

G. Most workers that experience minimum wage violations are from families of modest means
http://www.epi.org/files/pdf/125116.pdf

G. Mitigating Wage Theft
• Are local newspapers putting a spotlight on wage-theft?
• What is the State’s or local District Attorney doing about Wage Theft in your service area?
• Have wage-theft at your employer been reported to local law enforcement agencies?
• Have these been reported to appropriate state or county agencies?
• Have you worked with locally elected officials to combat wage-theft?
• Have you contacted other advocacy groups about this issue?
• Have you helped people file a claim with a law firm to win back stolen wages?

G. Resources on Wage - Theft
• Stop Wage Theft California http://www.stopwagetheftca.org/index.php/about-us/
• Lawsuit claims Chipotle owes overtime pay to thousands of workers By Jonnelle Marte Washington Post, June 7, 2017

G. EAT Survey Questions 27. Wage Theft• Have you been…
Not paid minimum wage, but less?
Paid less than you were promised?
Paycheck report fewer hours than you actually worked?
Paid in cash, asked to endorse your paycheck to someone else, or forced to give a payment to your project foreman or supervisor?
Are you unsure of who your employer is, or the wage you are entitled to?
Forced to start early or stay late without getting paid overtime?
Asked to work off the clock (without punching in)?
Denied meal or rest breaks on the job?
Injured on the job and been denied proper care or worker’s compensation?
Employer threatened to fire you if you do not report for work after being injured?
Threatened or fired for questioning your boss about your pay?
If you answered yes to any of these questions, you may have been a victim of wage theft, and would be entitled to compensation under the law.
120120
H. Income Volatility
Unsteady pay and hours: A new problem contributing to poverty

H. Income Volatility: The Problem• 46,500,000 Americans living in poverty*
• 10,400,000 Families living in poverty supported by full-time workers *
• 1,800,000 Social service practitioners nationwide working every day to fight the effects of poverty**
• People are working hard to achieve financial mobility –more than 96% of people living in poverty do so for less than 3 consecutive years –and yet, 30% of these will eventually return below the poverty line.*
• According to the 2015 FDIC National Survey of Unbanked and Underbanked Households, the underserved population consists of 9 million unbanked and 24.5 million underbanked households — almost 35 millions Americans effectively rendered “invisible” from the financial system.
• Recent reports from Change Machine show customers’ monthly financial transaction fees racking up as high as $80 for maintenance fees, $40 on check cashing, and $50 on money orders.
* 2013 US Census Bureau Report**US Department of Labor Bureau of Labor’s Occupational Outlook Handbook
https://thefinancialclinic.org/

H. Income Volatility
Volatility explains where we are today:
• Why a below average jobless rate —4.3 % in May — is still producing an above average level of economic anxiety.
• Turbulence has replaced the traditional American narrative of steady financial progress over a lifetime.
https://www.nytimes.com/2017/05/31/business/economy/volatile-income-economy-jobs.html?em_pos=small&emc=edit_up_20170607&nl=upshot&nl_art=3&nlid=59465038&ref=headline&te=1
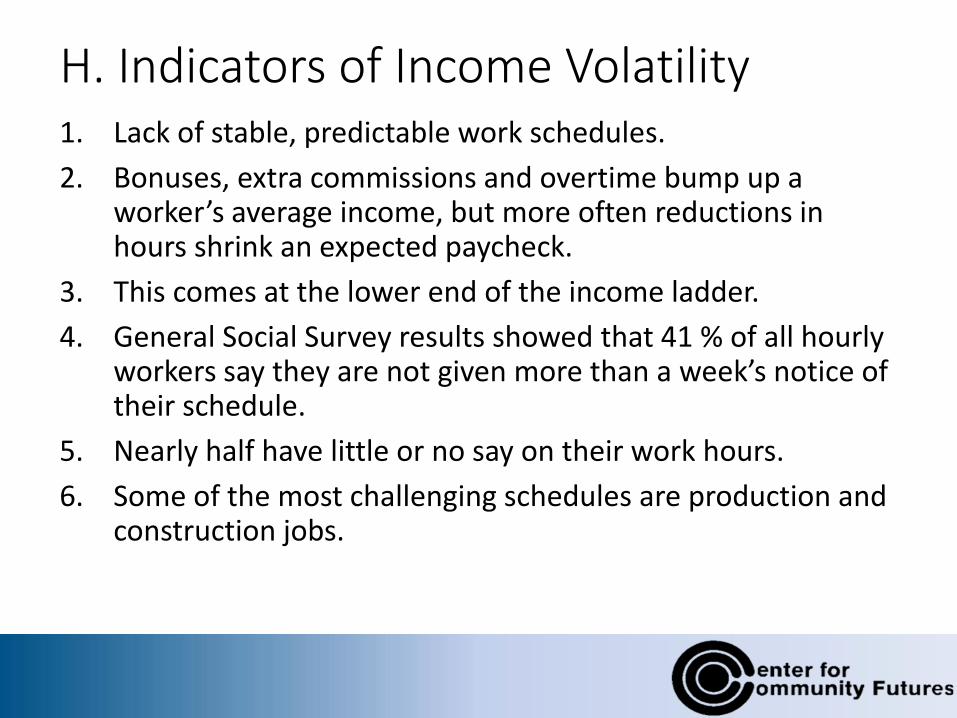
H. Indicators of Income Volatility1. Lack of stable, predictable work schedules.
2. Bonuses, extra commissions and overtime bump up a worker’s average income, but more often reductions in hours shrink an expected paycheck.
3. This comes at the lower end of the income ladder.
4. General Social Survey results showed that 41 % of all hourly workers say they are not given more than a week’s notice of their schedule.
5. Nearly half have little or no say on their work hours.
6. Some of the most challenging schedules are production and construction jobs.

H. Strategies to Reduce Income Volatility
1. Persuade employers to schedule in advance.
2. Enforce current labor laws, and propose new legislation in areas law does not cover, i.e.:
• Prohibiting scheduling hours by automation
• Persuade employers to fill vacancies with more full time instead of part time employees
3. Creating employer-provided benefits, and using wage-related financial technology.
4. Pay at a higher rate for late schedules.
5. Increase access to financial and legal services
http://www.lafollette.wisc.edu/images/publications/workshops/2015-income.pdf

H. Strategies to improve public benefit design and delivery
To better serve populations with volatile income include:
1. Changing enrollment and eligibility processes and
2. Improving annual tax credits to maximize smoothing potential.
3. Improve public benefit design and delivery to support people who work in low-paying jobs (i.e. State EITC)

H. Strategies to increase financial stability
Those services can help manage income volatility include:
1. Technological services that aid financial planning, and
2. New credit and savings mechanisms.
3. Advocate for neighborhood banks or credit unions in place of payday lenders
4. Advocate against payday loan lenders and loan sharks, and used car loans with high interest rates
5. See legislation regulating car loan interest rates
6. Regulate rent-to-own businesses
H. Income Volatility Resources
1. Robert M. La Follette School of Public Affairs Addressing: Income Volatility of Low Income Populations spring 2015
2. Pew Research Institute How Income Volatility Interacts With American Families’ Financial Security-An examination of gains, losses, and household economic experiences 03-09-17
3. Aspen Institute: INCOME VOLATILITY-A Primer, May 2016
4. Financial Clinic: Advancing Financial Security Inclusion Through FinTech 4-27-17

H. EAT Survey Questions 28. Income Volatility.
• Are you part time or full time?
• Are your working hours set times or decided at the by the employer?
• Do you have at least two weeks advance notice of your schedule?
• To make ends meet, do you take “temp” or part-time jobs?
• Do you have access to a local bank or credit union?
• Which?
• Are there payday loan shops in your neighborhood? Do yo use them? How often?

129129
I. Household Wealth Trends 2004-2010 by Income
Source: S&P August 4, 2014 Economic Report: How Increasing Income Inequality Is Dampening U.S. Economic Growth
130130
I. EAT question 29. Household wealth
• What is the distribution of household wealth in your state/area?
• https://www.federalreserve.gov/2015-report-economic-well-being-us-households-201605.pdf
• Economic Report: How Increasing Income Inequality Is Dampening U.S. Economic Growth
• https://www.census.gov/topics/income-poverty/wealth.html

131131
Median net worth by ethnicity
• Let’s look at another “big picture” trend
https://www.stlouisfed.org/~/media/Files/PDFs/HFS/essays/HFS-Essay-1-2015-Race-Ethnicity-and-Wealth.pdf
132132
I. EAT question 30. Net worth by ethnicity
• What is the net worth by ethnicity in your area?
• http://www.pewsocialtrends.org/2016/06/27/1-demographic-trends-and-economic-well-being/
• https://www.stlouisfed.org/~/media/Files/PDFs/HFS/essays/HFS-Essay-1-2015-Race-Ethnicity-and-Wealth.pd f

133133
J. What is to be done?
• WHAT CAN YOU DO ON EACH OF THESE ECONOMIC ISSUES TO CHANGE THE RULES UNDER WHICH THE ECONOMY OPERATES? WHAT CAN YOU DO AT EACH OF THESE LEVELS?
• National level
• State level
• Regional level
• County level
• City level
• Employer level. Yes, you and/or the employees have to talk to employers.

134134
J. What is to be done?
• This Toolkit shows dozens of ways that employers have restructured work to eliminate full-time jobs that pay a living wage and that have benefits.
• What are you going to do about it?
• Start by getting the data that shows what is happening in your area. Add it to your community assessment.
• Then select advocacy strategies to change public policies or community attitudes or employer practices.

135135
J. What is to be done?
• See the White Paper written by Allen and Jim that describes policies and strategies needed to change the rules. Most of these require advocacy.
• http://www.communityactionpartnership.com/storage/cap/documents/white
_paper_3rd_draft_-_exec_summary.pdf and
• http://www.communityactionpartnership.com/storage/cap/documents/1_-
_white_paper_3_0_content_draft_6_august_12_2016_jims_adds-final.pdf
• Also Please Visit our Blog at:
• http://declineofusmiddleclass.blogspot.com/

136136
Q & A

137137
Many Thanks for Your Interest and Participation
Jim Masters: CCAP, NCRT. [email protected]
Allen Stansbury, Senior Associate. [email protected]
Center for Community Futures
www.cencomfut.com
The White Paper can be found at: http://www.communityactionpartnership.com/storage/cap/documents/white_pap
er_3rd_draft_-_exec_summary.pdf and http://www.communityactionpartnership.com/storage/cap/documents/1_-_white_paper_3_0_content_draft_6_august_12_2016_jims_adds-final.pdf
Also Please Visit our Blog at:http://declineofusmiddleclass.blogspot.com/
138138
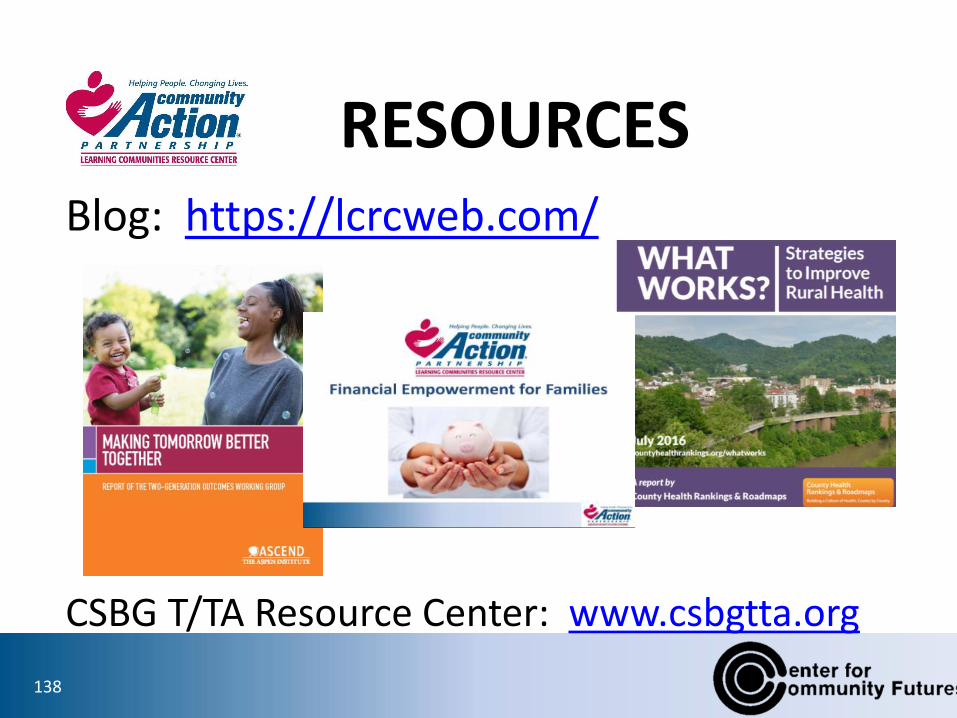
Blog: https://lcrcweb.com/
CSBG T/TA Resource Center: www.csbgtta.org
RESOURCES

139139
Please be sure to complete the evaluation for this session online, via the
CAPCON17 Event App.
Thanks in Advance for your Cooperation!
EVALUATIONS
The Partnership Wants Your Feedback!

K. BONUS SECTIONFamily Formation
Foundation for economic security
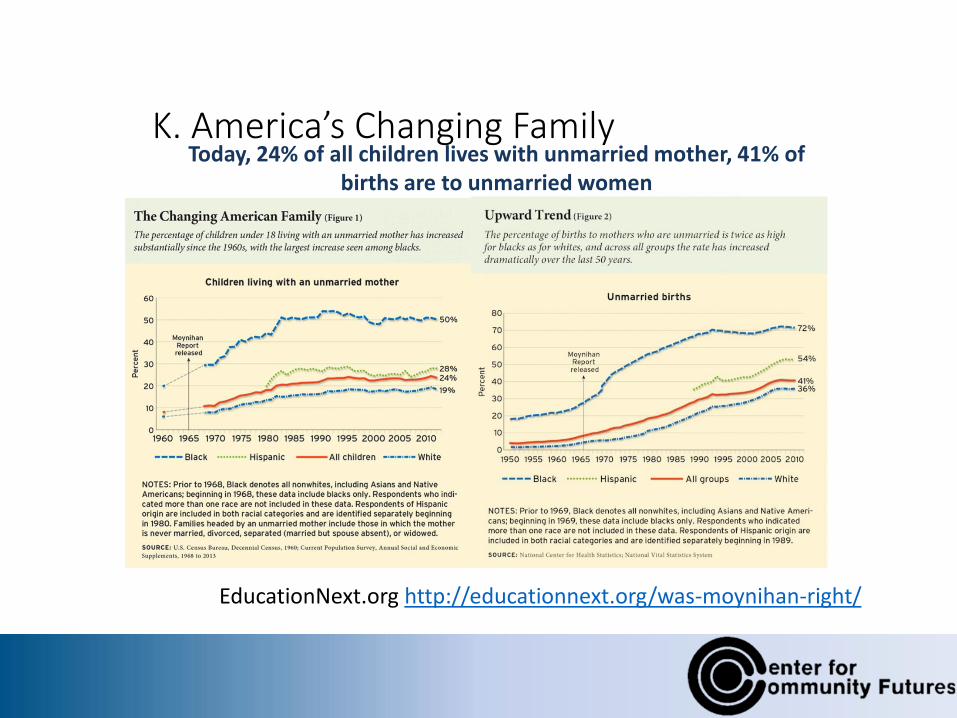
K. America’s Changing FamilyToday, 24% of all children lives with unmarried mother, 41% of
births are to unmarried women
EducationNext.org http://educationnext.org/was-moynihan-right/

K. America’s Evolving Family Makeup
Selected trends impacting America’s Family Makeup:
• Median age at first marriage was28.2 for men and 26.1 for women in 2010, an increase from 26.8 and 25.1 in 2000. An continued increase of a long-term trend since the mid-1950s.
• Overall percentage of adults who were married declined to 54.1 % in 2010 from 57.3 % in 2000.
• The average household size declined to 2.59 in 2010, from 2.62 people in 2000 partly because of the increase in one-person households, which rose from 25 % in 2000 to 27 % in 2010, more than double the 13 % in 1960.
• Households headed by a married couple who had children under 18 living with them declined 3 % in 2010, from 24 % in 2000.
• “Breadwinner moms,” mothers who are the only or main provider of income for their family rose from 11 percent to 40 percent from 1960 to 2011 (see chart to left).
• Americans living alone was a mere 9% in 1950 is now 28% today.
• Children living together with both their parents have been steadily declining since the 1970’s
• 2011 two parent families comprised on about 67% down from about 92% in 1960.

K. Direct correlation between married and unmarried head of households in poverty
The meaning of single mother-hood has changed since the 60s, now single mothers are far less likely than to have ever been married.
• In 1960, 95% of single mothers had been married at some point in the past.
• By 2013, only half of all single mothers had ever been married.
(Source: Education Next series on the state of the American family. )
EducationNext.org http://educationnext.org/was-moynihan-right/

144144
K. EAT Questions 31. Two incomes are better than one
• What number/percent of households with children have two or more incomes?
• What is the locally understood definition of a marriageable male? Prison record? Employed, but at – what?

145145
K. More on men and women
• Nationwide, The divorce rate among non-college-educated men and women are higher than college educated.
• What are these numbers and trends in your state? In your service area?

146146
K. Example. Marriage Rate in Kansas
• 2009 in Kansas, a Census analysis shows 22.1 men per 1,000 got married.
• Nationally, an average of 19.1 out of every 1,000 men got married
• Kansas, 20.8 women got married per 1,000.
• Meanwhile, women averaged 17.6 marriages per 1,000 nationally.
147147
K. Example. Divorce Rate in Kansas
• The Kansas rate is higher than nationwide at 9.2 out of every 1,000 men divorced.
• In Kansas, 10.6 per 1,000 divorced.
• An average of 9.7 out of every 1,000 women nationwide officially ended their marriages compared with 10.2 per 1,000 in Kansas.

148148
I. Higher education is a predictor of longer marriages
https://www.cdc.gov/nchs/data/nhsr/nhsr049.pdf

149149
K. Household Composition
• http://www.pewsocialtrends.org/2015/12/17/1-the-american-family-today/
• https://www.census.gov/topics/families.html
• http://www.prb.org/pdf12/us-household-change-2012.pdf
• http://www.nber.org/papers/w23371

150150
K. EAT Question 32. Household composition
The data in this section suggest that current attitudes about and cultural practices of household composition and marriage do not fit with economic realities.
a. What is next? Multiple generations of extended “families” under one roof? Hippie communes? Tent cities, like U.N. refugee camps?
b. How can people aggregate enough income to make a household function?