Embed Size (px)
Citation preview
Get started with DSO-X 2014A
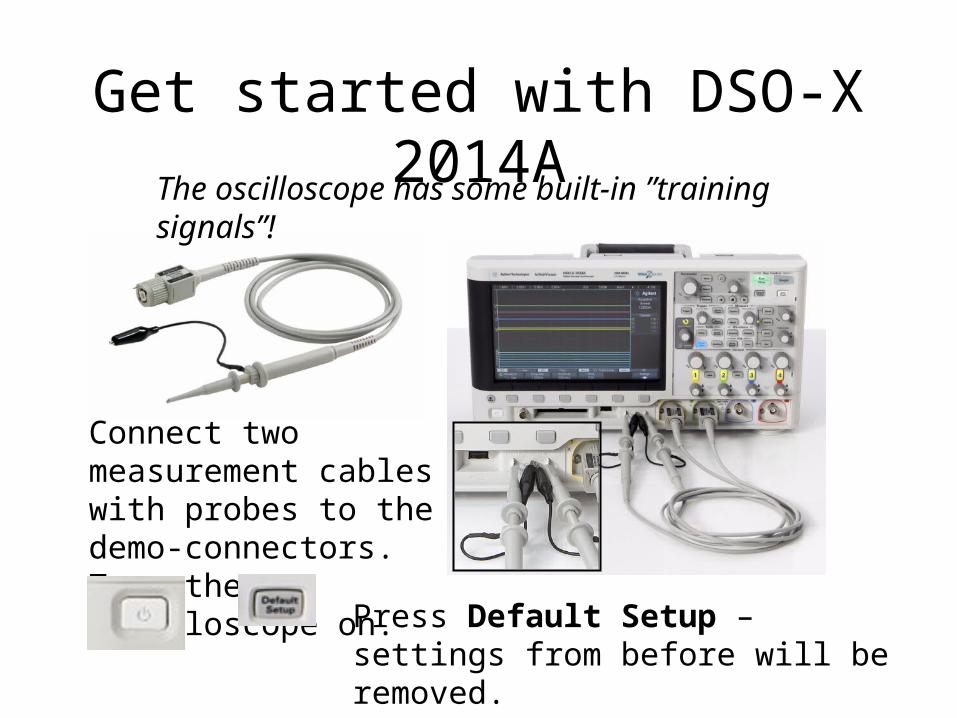
Connect two measurement cables with probes to the demo-connectors. Turn the oscilloscope on.
The oscilloscope has some built-in ”training signals”!
Press Default Setup – settings from before will be removed.
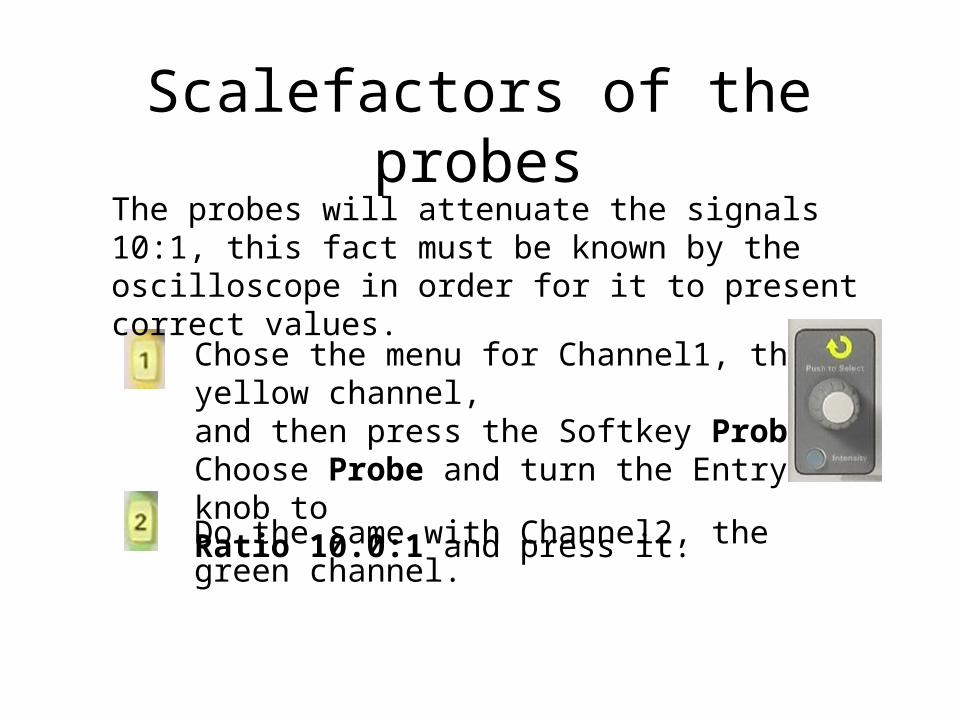
Scalefactors of the probesThe probes will attenuate the signals 10:1, this fact must be known by the oscilloscope in order for it to present correct values.
Chose the menu for Channel1, the yellow channel,and then press the Softkey Probe. Choose Probe and turn the Entry-knob toRatio 10.0:1 and press it.
Do the same with Channel2, the green channel.
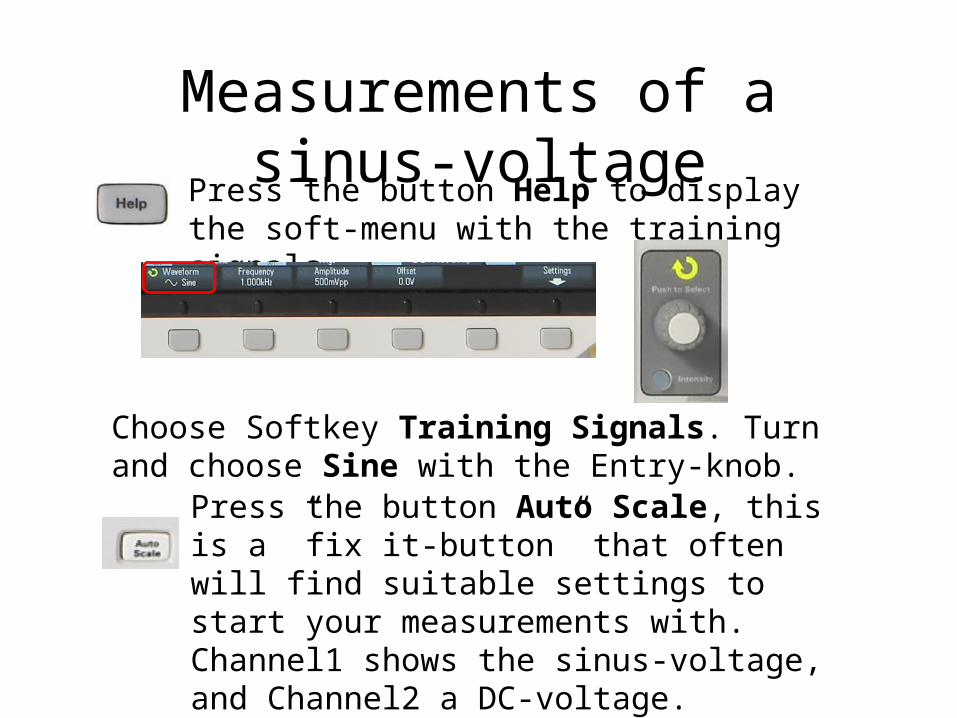
Measurements of a sinus-voltagePress the button Help to display the soft-menu with the training signals.
Press the button Auto Scale, this is a ”fix it-button” that often will find suitable settings to start your measurements with. Channel1 shows the sinus-voltage, and Channel2 a DC-voltage.
Choose Softkey Training Signals. Turn and choose Sine with the Entry-knob.
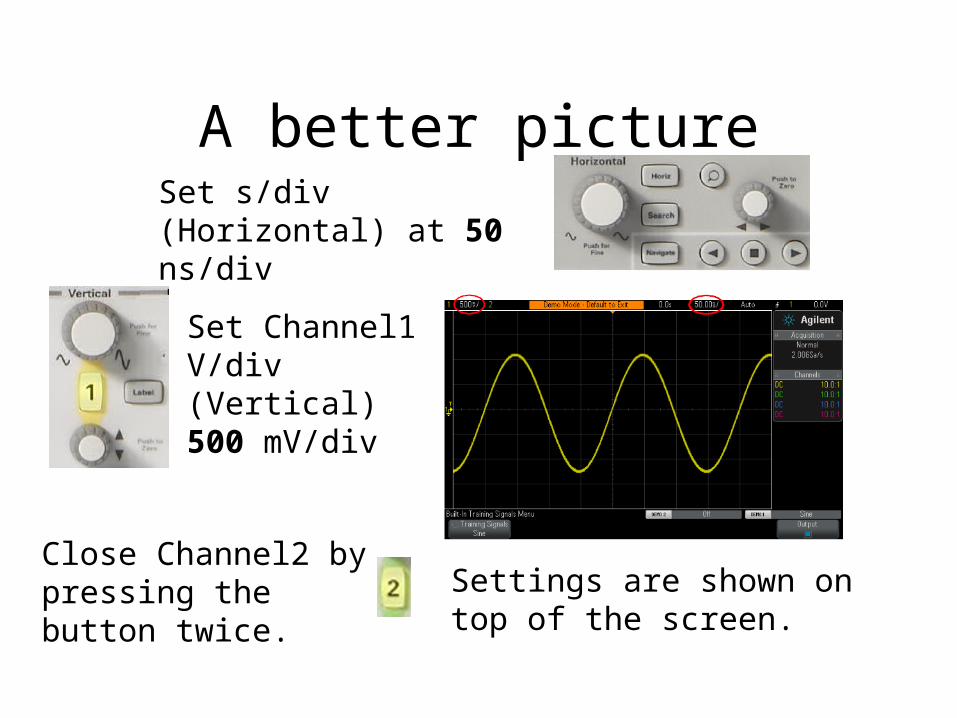
A better pictureSet s/div (Horizontal) at 50 ns/div
Set Channel1 V/div (Vertical) 500 mV/div
Close Channel2 by pressing the button twice. Settings are shown on top of the
screen.
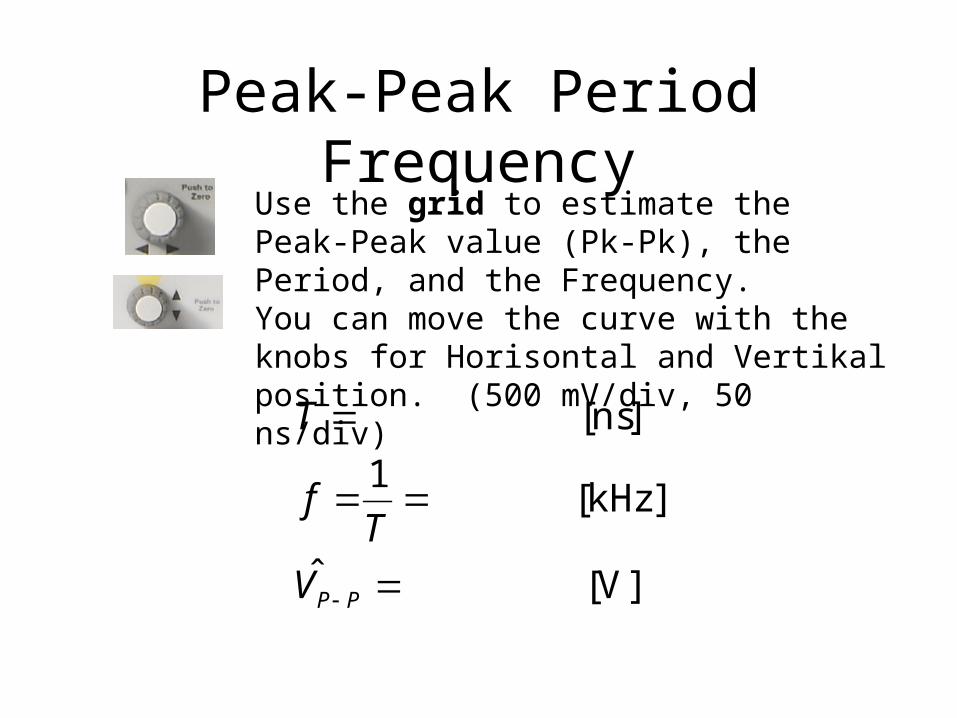
Peak-Peak Period FrequencyUse the grid to estimate the Peak-Peak value (Pk-Pk), the Period, and the Frequency. You can move the curve with the knobs for Horisontal and Vertikal position. (500 mV/div, 50 ns/div)
]V[ˆ
]kHz[1
]ns[
PPV
Tf
T
Automatical measurmets
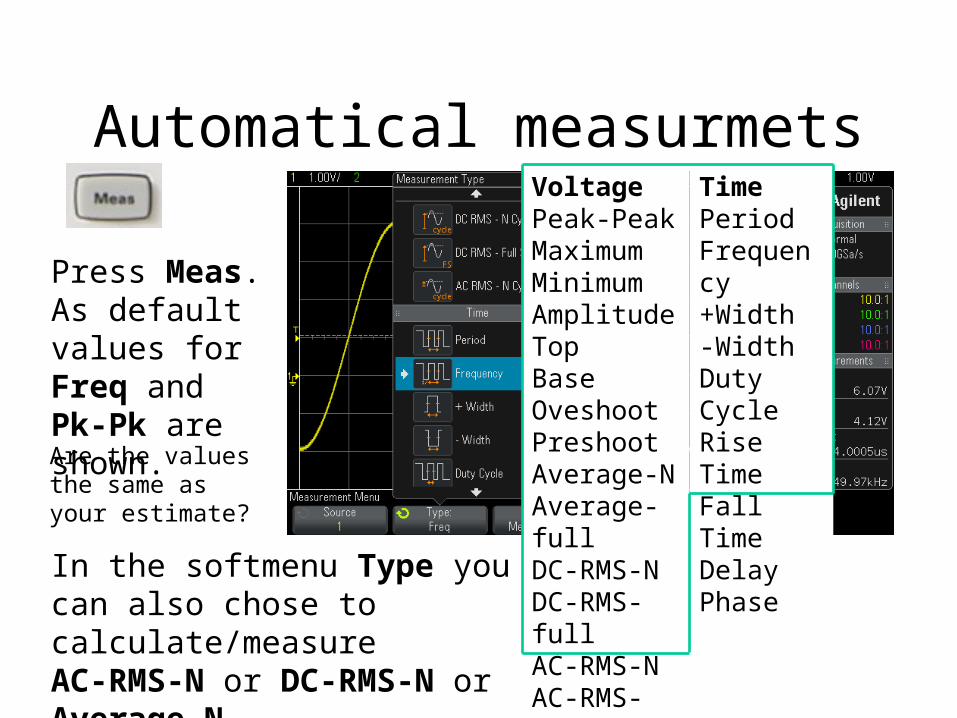
Press Meas. As default values for Freq and Pk-Pk are shown.
VoltagePeak-PeakMaximumMinimumAmplitudeTopBaseOveshootPreshootAverage-NAverage-fullDC-RMS-NDC-RMS-fullAC-RMS-NAC-RMS-full
TimePeriodFrequency+Width-WidthDuty CycleRise TimeFall TimeDelayPhase
In the softmenu Type you can also chose to calculate/measureAC-RMS-N or DC-RMS-N or Average-N
Are the values the same as your estimate?
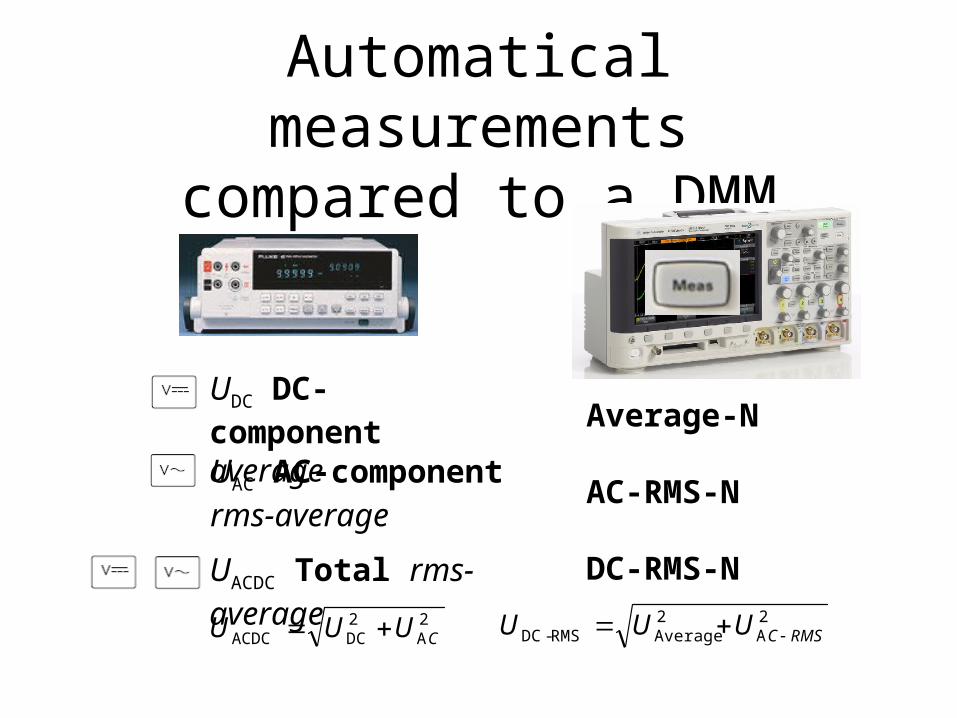
Automatical measurementscompared to a DMM
Average-N
AC-RMS-N
DC-RMS-N
2A
2DCACDC CUUU
UAC AC-componentrms-average
UDC DC-component average
UACDC Total rms-average2A
2AverageRMS-DC RMSCUUU

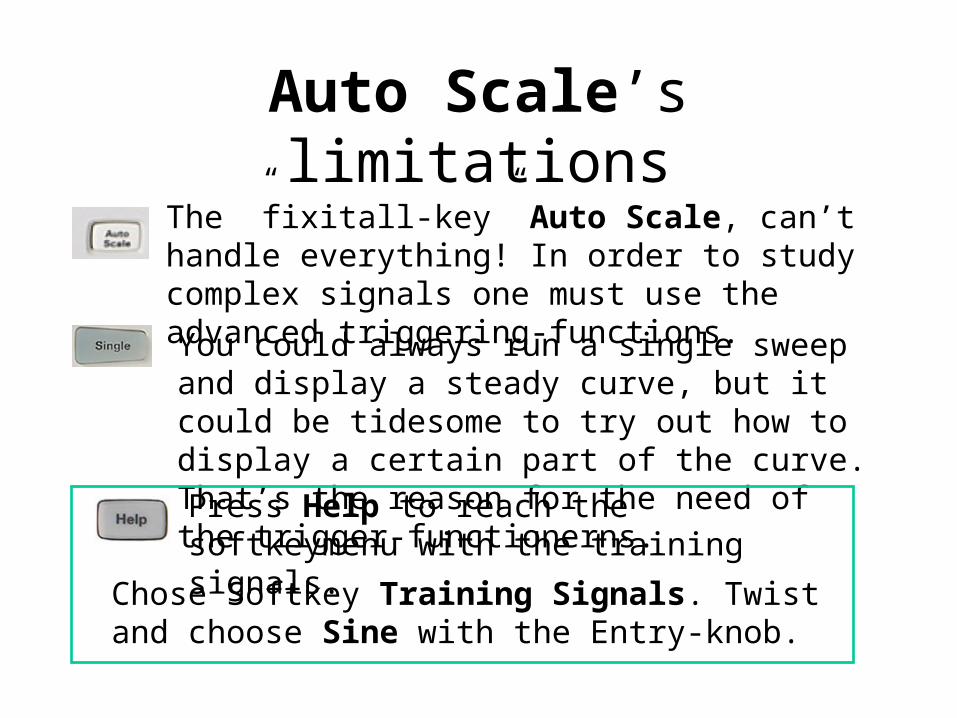
Auto Scale’s limitations
The ”fixitall-key” Auto Scale, can’t handle everything! In order to study complex signals one must use the advanced triggering-functions.
You could always run a single sweep and display a steady curve, but it could be tidesome to try out how to display a certain part of the curve. That’s the reason for the need of the trigger-functionerns.
Press Help to reach the softkeymenu with the training signals.
Chose Softkey Training Signals. Twist and choose Sine with the Entry-knob.
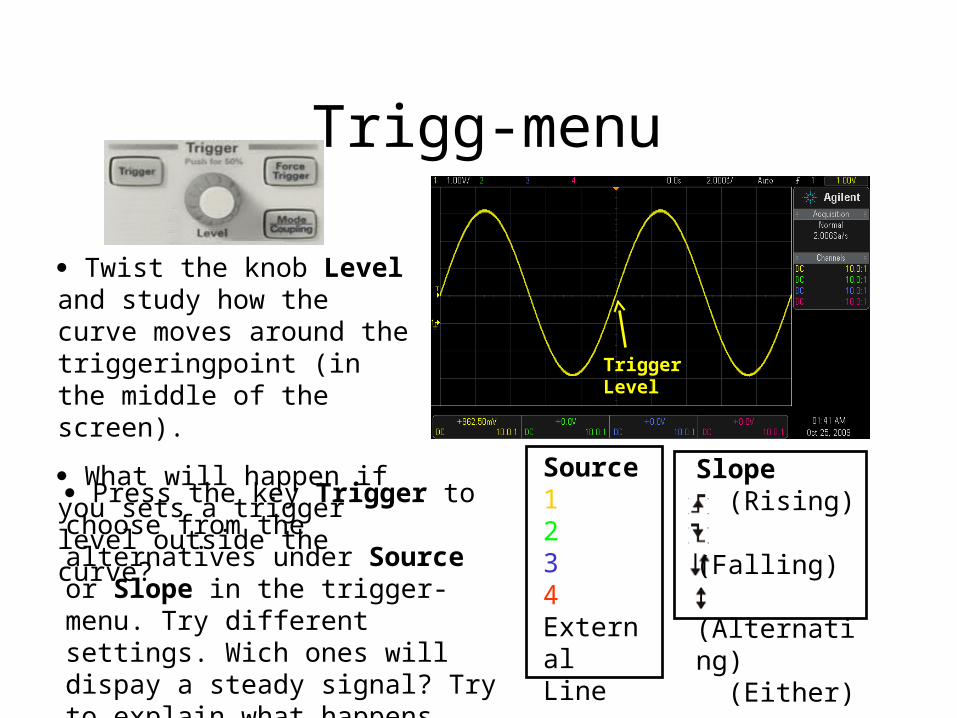
Trigg-menu
Slope (Rising) (Falling) (Alternating) (Either)
Source1234ExternalLine
Trigger Level
Twist the knob Level and study how the curve moves around the triggeringpoint (in the middle of the screen).
What will happen if you sets a trigger level outside the curve?
Press the key Trigger to choose from the alternatives under Source or Slope in the trigger-menu. Try different settings. Wich ones will dispay a steady signal? Try to explain what happens.
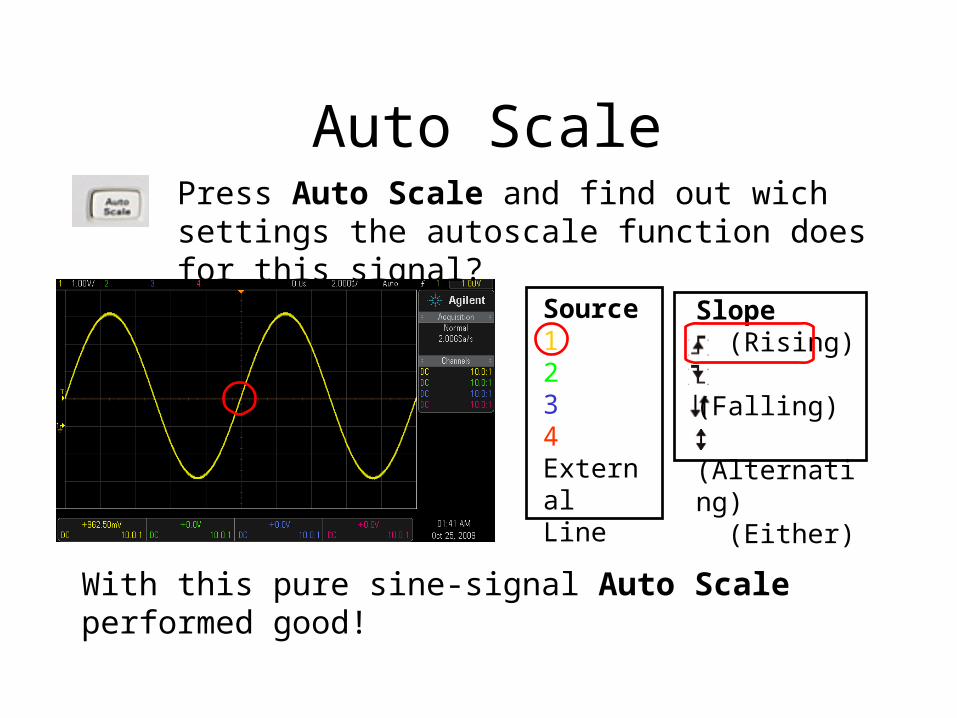
Auto Scale
Slope (Rising) (Falling) (Alternating) (Either)
Source1234ExternalLine
Press Auto Scale and find out wich settings the autoscale function does for this signal?
With this pure sine-signal Auto Scale performed good!
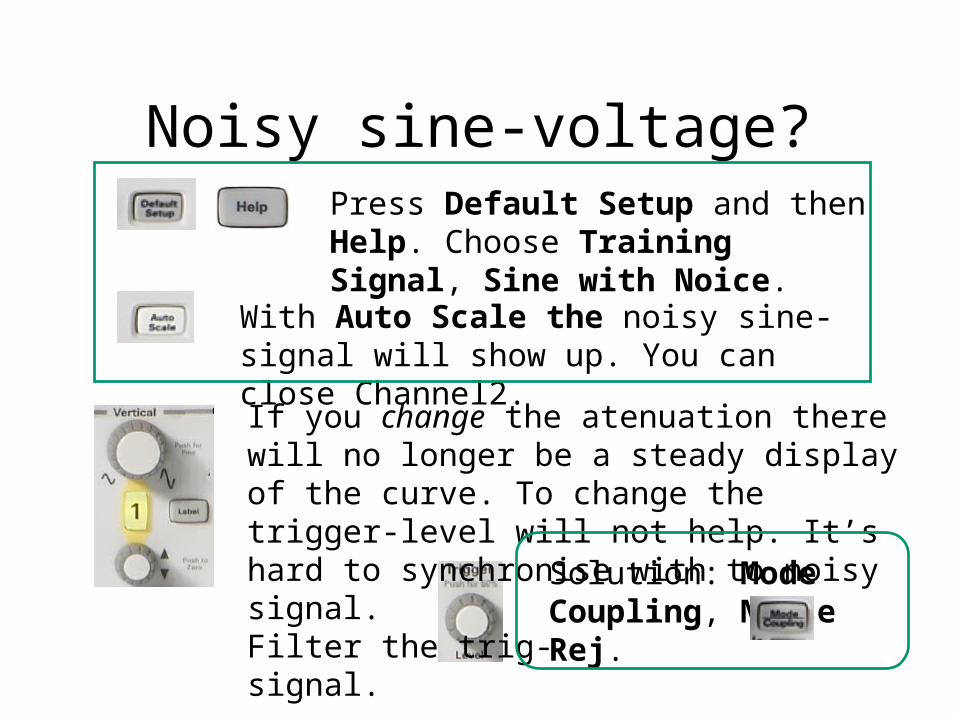
Noisy sine-voltage?Press Default Setup and then Help. Choose Training Signal, Sine with Noice.
With Auto Scale the noisy sine-signal will show up. You can close Channel2.
If you change the atenuation there will no longer be a steady display of the curve. To change the trigger-level will not help. It’s hard to synchronise with to noisy signal.Filter the trig-signal.
Solution: Mode Coupling, Noise Rej.
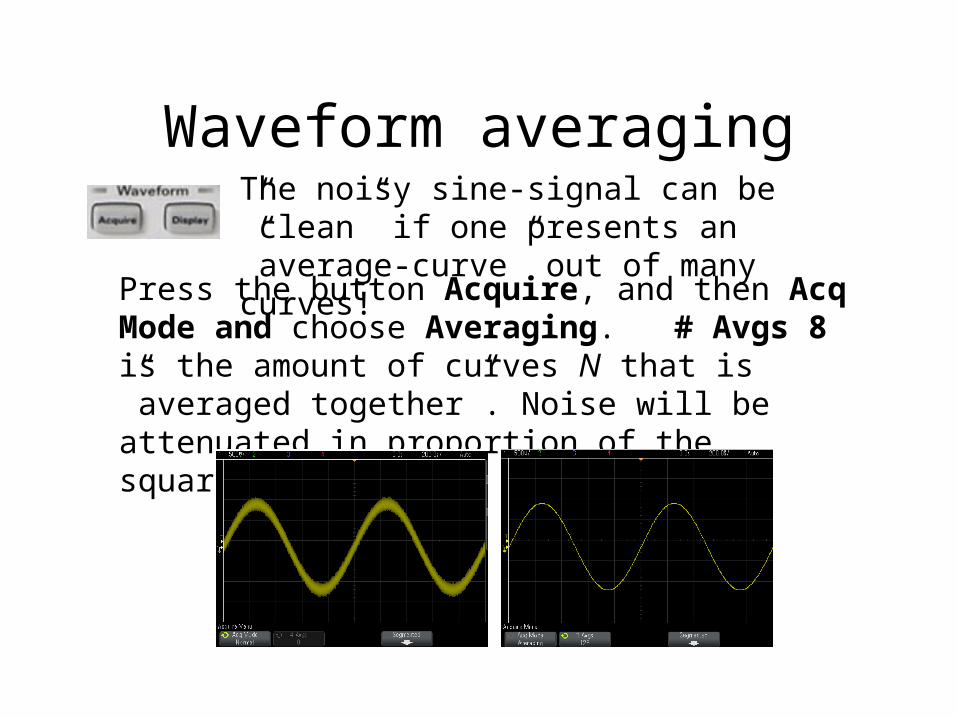
Waveform averagingThe noisy sine-signal can be ”clean” if one presents an ”average-curve” out of many curves!
Press the button Acquire, and then Acq Mode and choose Averaging. # Avgs 8 is the amount of curves N that is ”averaged together”. Noise will be attenuated in proportion of the squareroot of N.

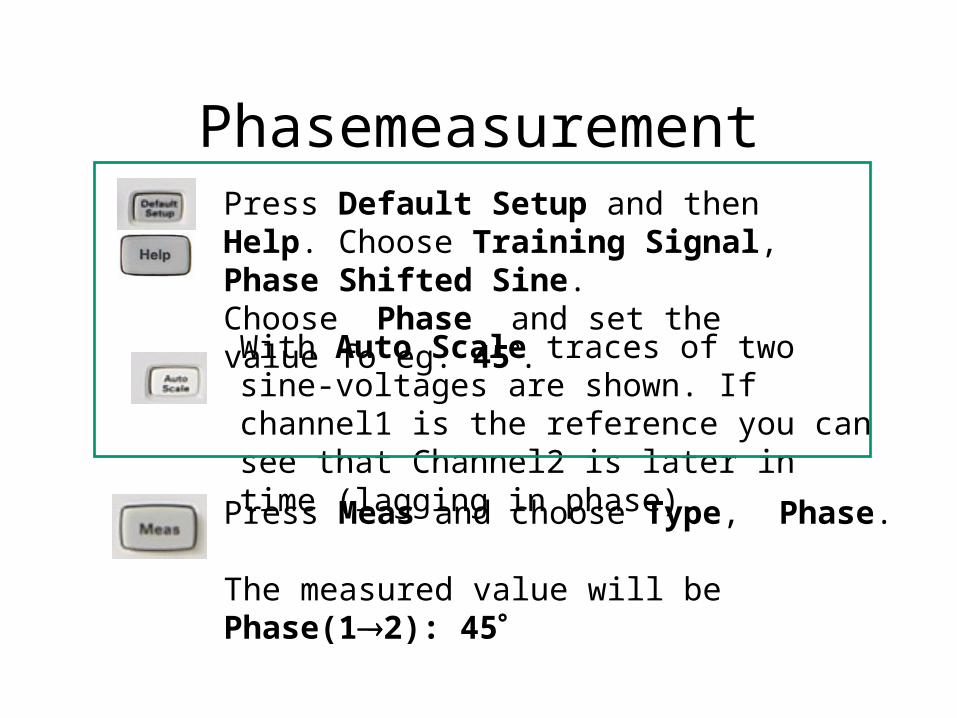
PhasemeasurementPress Default Setup and then Help. Choose Training Signal, Phase Shifted Sine.Choose Phase and set the value fo eg. 45.
With Auto Scale traces of two sine-voltages are shown. If channel1 is the reference you can see that Channel2 is later in time (lagging in phase).
Press Meas and choose Type, Phase.
The measured value will be Phase(12): 45

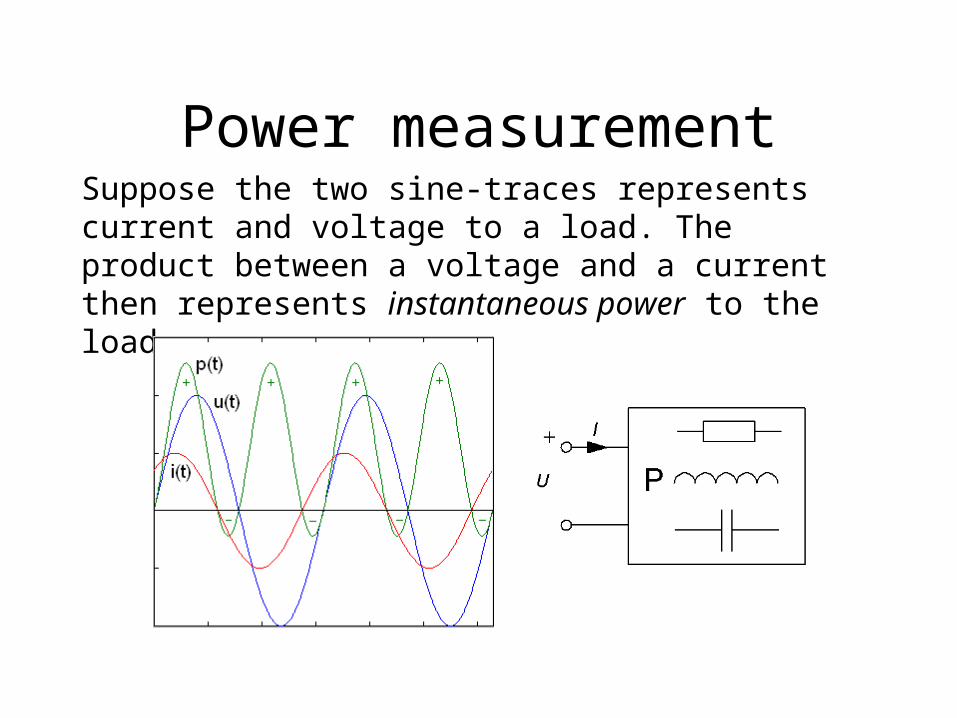
Power measurementSuppose the two sine-traces represents current and voltage to a load. The product between a voltage and a current then represents instantaneous power to the load.
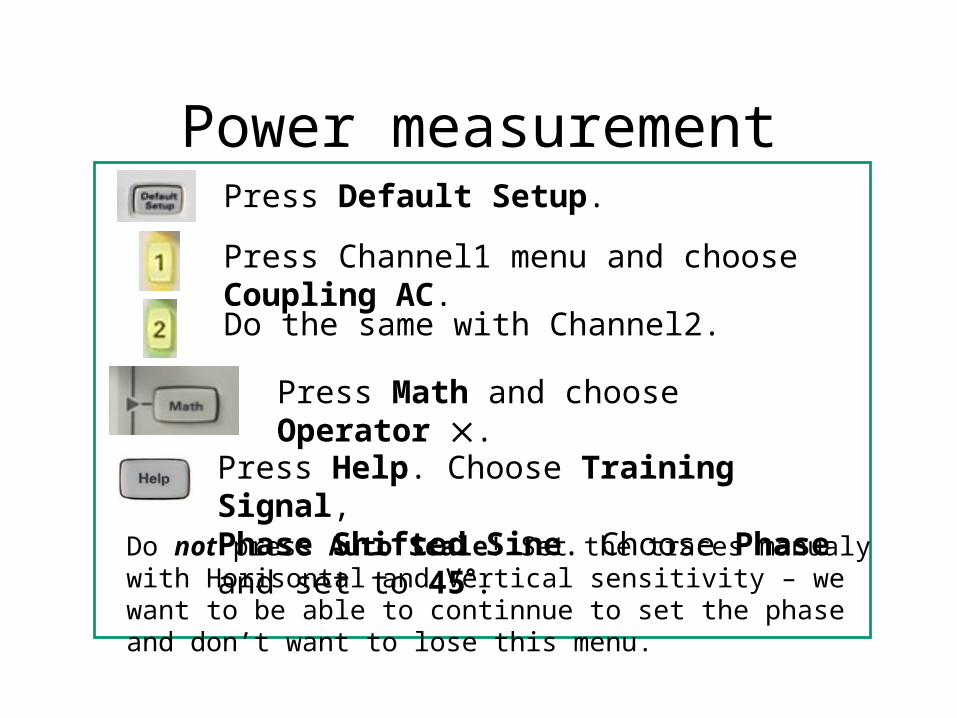
Power measurementPress Default Setup.
Press Channel1 menu and choose Coupling AC.
Do the same with Channel2.
Press Math and choose Operator .
Press Help. Choose Training Signal, Phase Shifted Sine. Choose Phase and set to 45.
Do not press Auto Scale! Set the traces manualy with Horisontal and Vertical sensitivity – we want to be able to continnue to set the phase and don’t want to lose this menu.
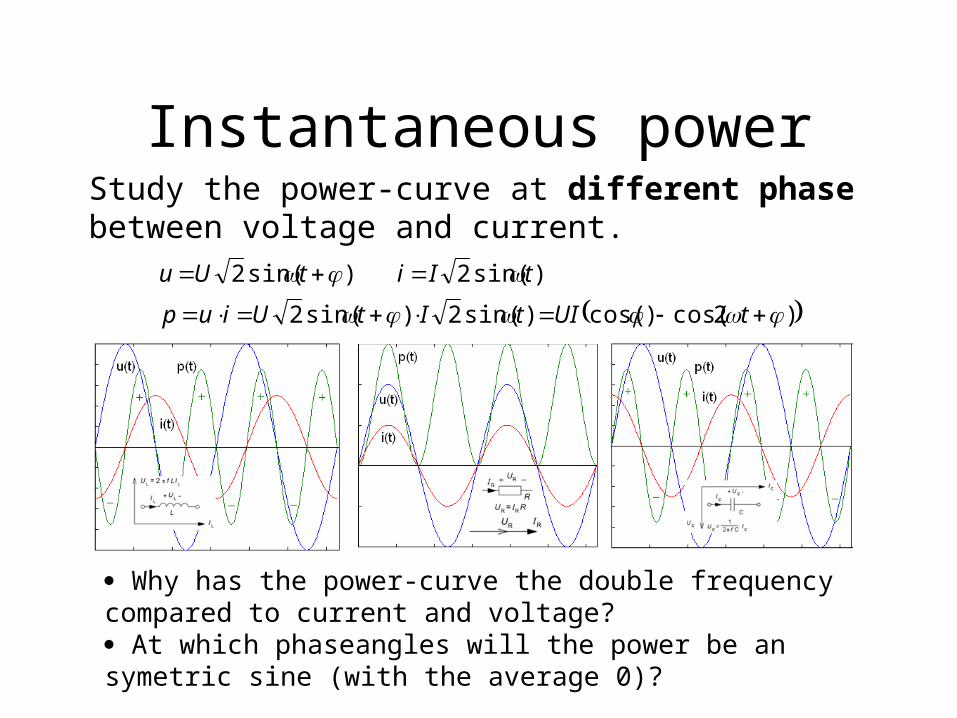
Instantaneous powerStudy the power-curve at different phase between voltage and current.
Why has the power-curve the double frequency compared to current and voltage? At which phaseangles will the power be an symetric sine (with the average 0)?
)2cos()cos()sin(2)sin(2
)sin(2)sin(2
tUItItUiup
tIitUu