Embed Size (px)
Citation preview


Get set for September 2017
Statistics
Paul Chillingworth
Nick Thorpe

Session description
In 2017 all students starting A level Mathematics will learn both
Statistics and Mechanics which will account for a third of the
qualification. In this session we will look at what the Statistics
content will look like, the change of emphasis from the current
S1 modules, and the connections which can be made while
teaching a linear course.
This session is one of a series of 4 which are designed to
inform teachers of upcoming changes to A level. It is therefore
suitable to any teachers of A level and may be of particular
interest to heads of department or KS5 coordinators. The
resources accompanying this conference session will be
suitable for using with departmental colleagues in order to help
teams prepare for the changes.
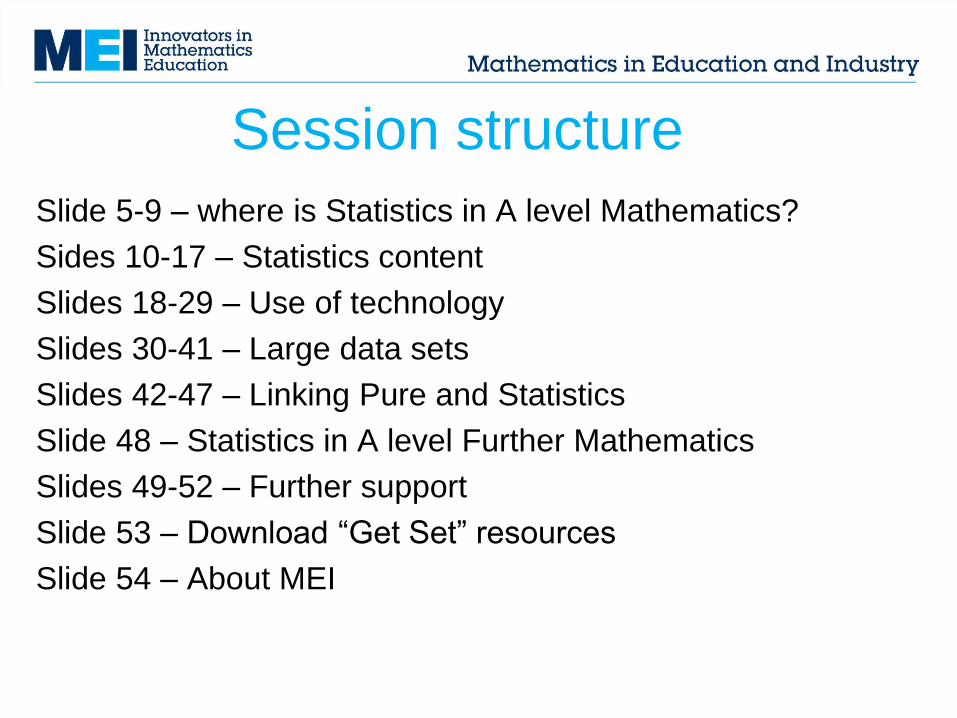
Session structure
Slide 5-9 – where is Statistics in A level Mathematics?
Sides 10-17 – Statistics content
Slides 18-29 – Use of technology
Slides 30-41 – Large data sets
Slides 42-47 – Linking Pure and Statistics
Slide 48 – Statistics in A level Further Mathematics
Slides 49-52 – Further support
Slide 53 – Download “Get Set” resources
Slide 54 – About MEI

The main change
• Every student will be expected to study Statistics
(and Mechanics) as part of AS/A level
Mathematics.
• The amount of Statistics is 1
6 of the content.
• How will that affect the teaching of AS/A level
Mathematics in your department?
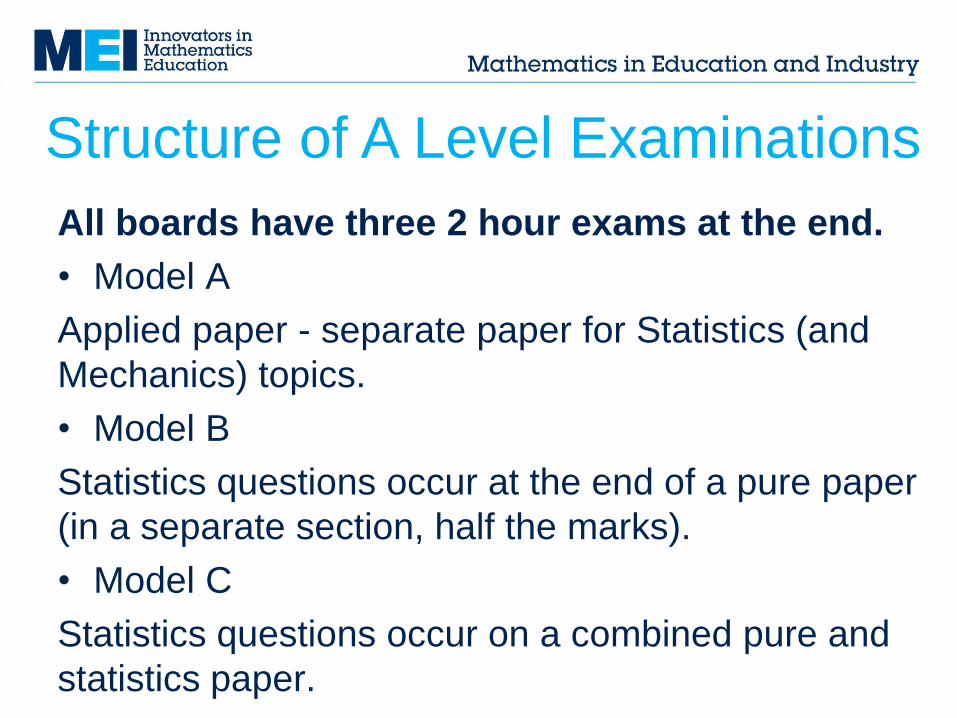
Structure of A Level Examinations
All boards have three 2 hour exams at the end.
• Model A
Applied paper - separate paper for Statistics (and
Mechanics) topics.
• Model B
Statistics questions occur at the end of a pure paper
(in a separate section, half the marks).
• Model C
Statistics questions occur on a combined pure and
statistics paper.

Structure of A Level Examinations
All boards have three 2 hour exams at the end.
• Model A – Edexcel
Applied paper - separate paper for Statistics (and
Mechanics) topics.
• Model B – AQA and OCR
Statistics questions occur at the end of a pure paper
(in a separate section, half the marks).
• Model C – MEI
Statistics questions occur on a combined pure and
statistics paper.

A level Mathematics
OCR Length Marks
Pure 120 100
Pure+Stats 120 100
Pure+Mech 120 100
TOTAL 360 300
MEI Length Marks
Pure+Mech 120 100
Pure+Stats 120 100
Pure+Comp 120 75
TOTAL 360 275
Edexcel Length Marks
Pure I 120 100
Pure II 120 100
Stats+Mech 120 100
TOTAL 360 300
AQA Length Marks
Pure 120 100
Pure+Mech 120 100
Pure+Stats 120 100
TOTAL 360 300
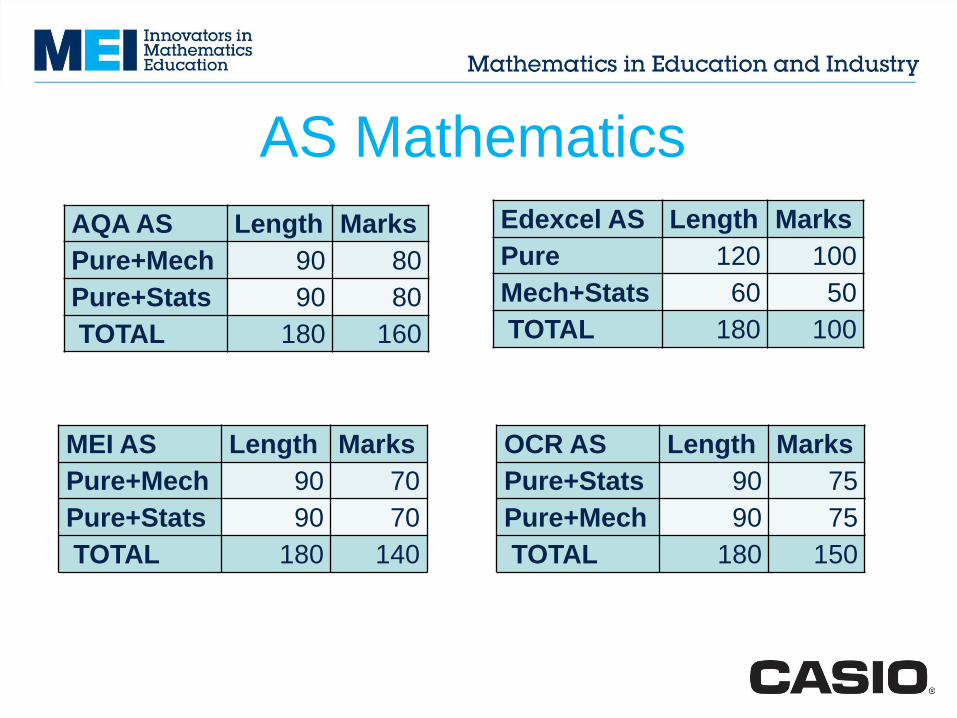
AS Mathematics
OCR AS Length Marks
Pure+Stats 90 75
Pure+Mech 90 75
TOTAL 180 150
MEI AS Length Marks
Pure+Mech 90 70
Pure+Stats 90 70
TOTAL 180 140
Edexcel AS Length Marks
Pure 120 100
Mech+Stats 60 50
TOTAL 180 100
AQA AS Length Marks
Pure+Mech 90 80
Pure+Stats 90 80
TOTAL 180 160

Content
• The content has been decided by the DfE
https://www.gov.uk/government/publications/gce-
as-and-a-level-mathematics
• There is still room for slight differences between
boards depending on interpretation of this
document, e.g. variance of binomial distribution,
rank correlation.

Content overview
Handling and representing Data
Correlation & Regression
Probability I (independent events)
Binomial distribution
Binomial hypothesis testing
Probability II (conditional probabilities)
Normal
Hypothesis Tests for Normal and Correlation

AQA S1 vs 2017
• Same:
Handling and representing Data
Probability
Binomial distribution
Normal distribution
Correlation & Regression
• New:
Hypothesis tests for Binomial, Normal, Correlation
• What’s going:
Estimation – Confidence Intervals and CLT

Edexcel S1 vs 2017
• Same:
Handling and representing Data
Probability
Normal distribution
Correlation & Regression
• New:
Binomial distribution
Hypothesis tests for Binomial, Normal, Correlation
• What’s going:
Discrete Random Variables
Uniform Distribution
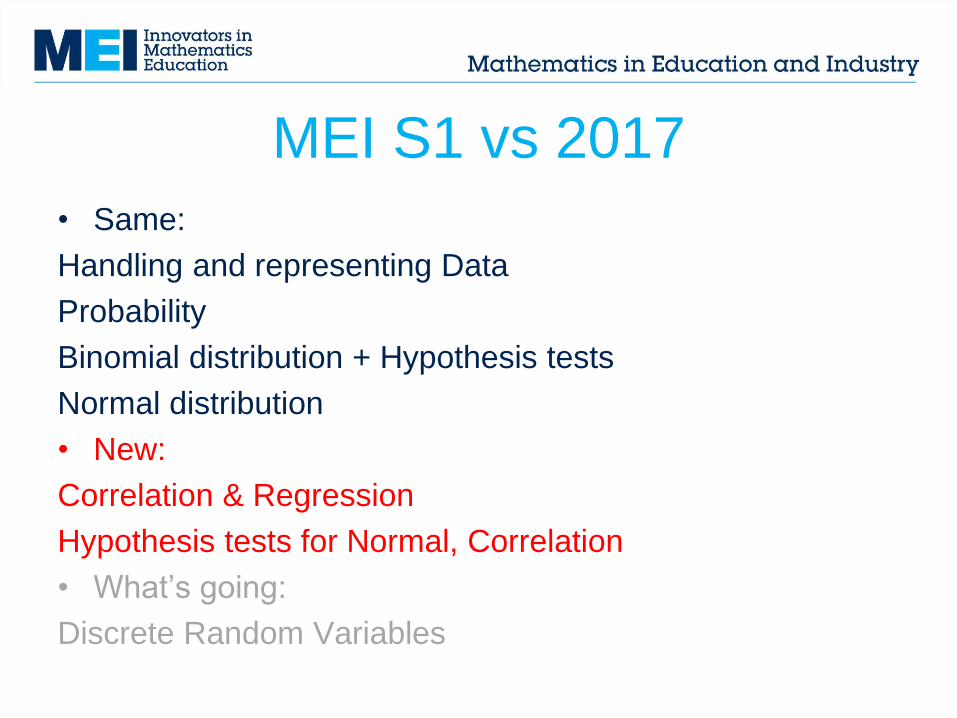
MEI S1 vs 2017
• Same:
Handling and representing Data
Probability
Binomial distribution + Hypothesis tests
Normal distribution
• New:
Correlation & Regression
Hypothesis tests for Normal, Correlation
• What’s going:
Discrete Random Variables

OCR S1 vs 2017
• Same:
Handling and representing Data
Probability
Binomial distribution
Correlation & Regression
• New:
Normal distribution
Hypothesis tests for Binomial, Normal, Correlation
• What’s going:
Permutations and Combinations
Discrete random variables & Geometric distribution

Standard Deviation in 2017
𝑛 − 1 or 𝑛?

Standard Deviation in 2017
𝑛 − 1 or 𝑛?
AQA(?) Edexcel*
MEI OCR
* 𝑛 − 1 will be condoned
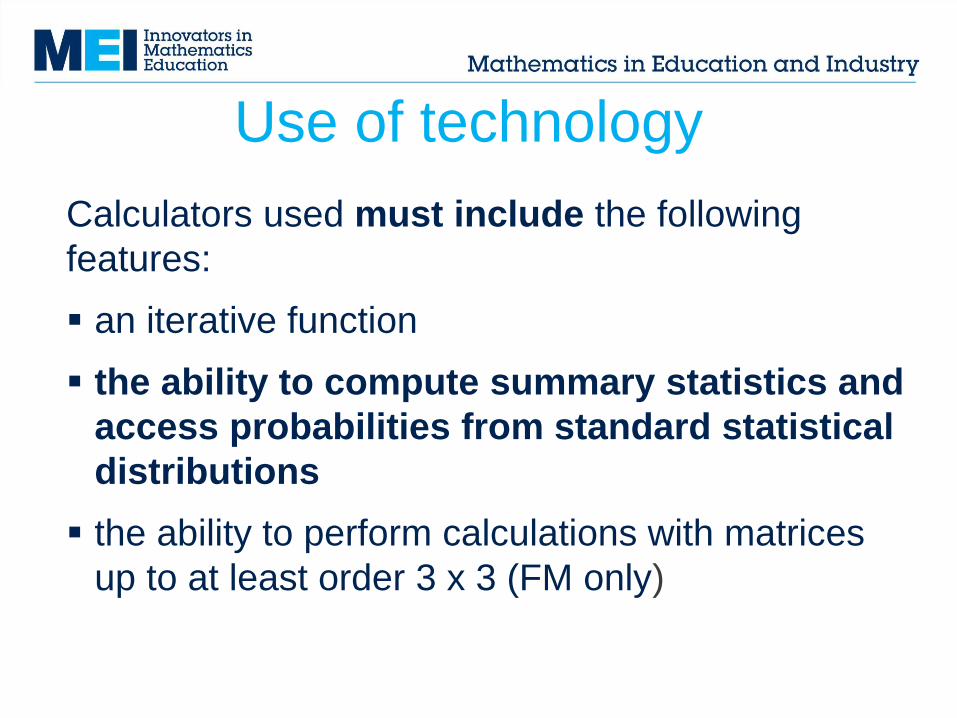
Calculators used must include the following
features:
an iterative function
the ability to compute summary statistics and
access probabilities from standard statistical
distributions
the ability to perform calculations with matrices
up to at least order 3 x 3 (FM only)
Use of technology

Calculators

The use of technology, in particular mathematical
and statistical graphing tools and spreadsheets,
must permeate the study of AS and A level
mathematics
Large data sets will require good practical use of
technology; students must have had the
opportunity to work on and become familiar with
one or more LDS before the assessment.
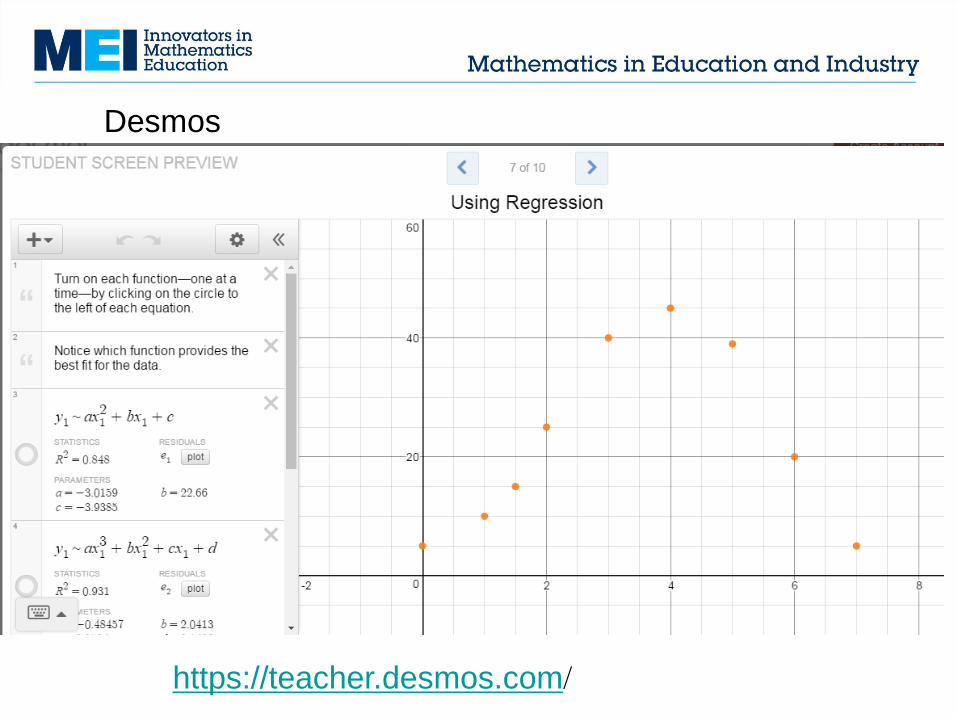
Use of technology

Which spreadsheet?
Graphing: Geogebra, Autograph, Desmos
Probability Distributions: Geogebra, Autograph,
GDC
Use of technology

Sorting, filtering,
cleansing, working
out summary
statistics and plotting
graphs.
Excel
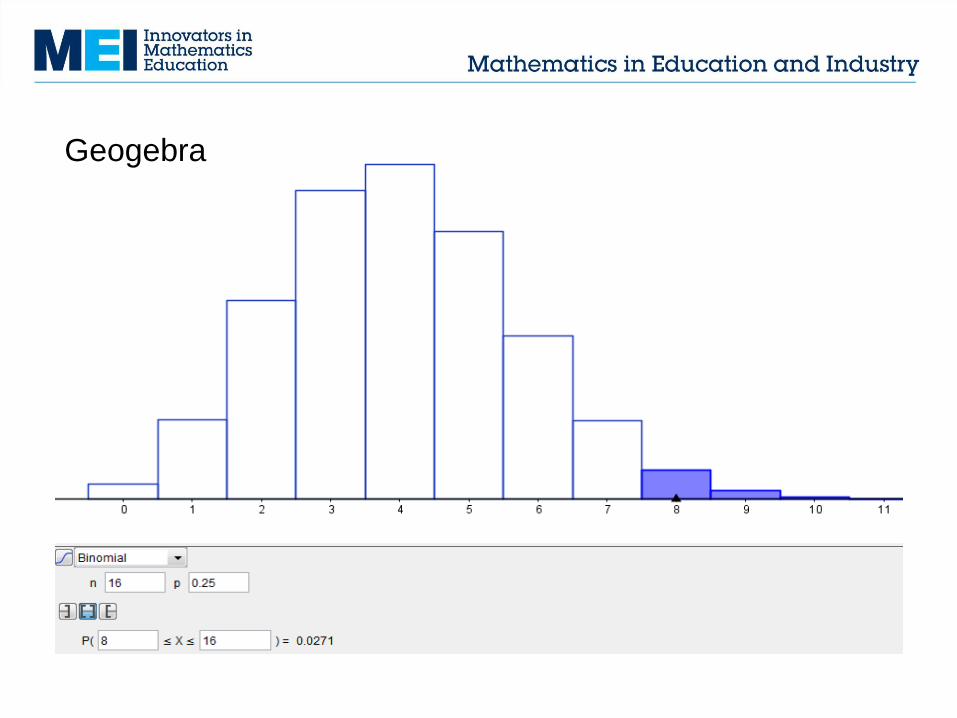
Geogebra

Average monthly petrol (blue) and
diesel (yellow) prices in 2015
http://www.autograph-maths.com/
Autograph
Sta
nd
ard
Ca
lcu
lato
r
Gra
ph
ical
Calc
ula
tor
Sp
read
sh
eet
Geo
geb
ra
Au
tog
rap
h
Desm
os
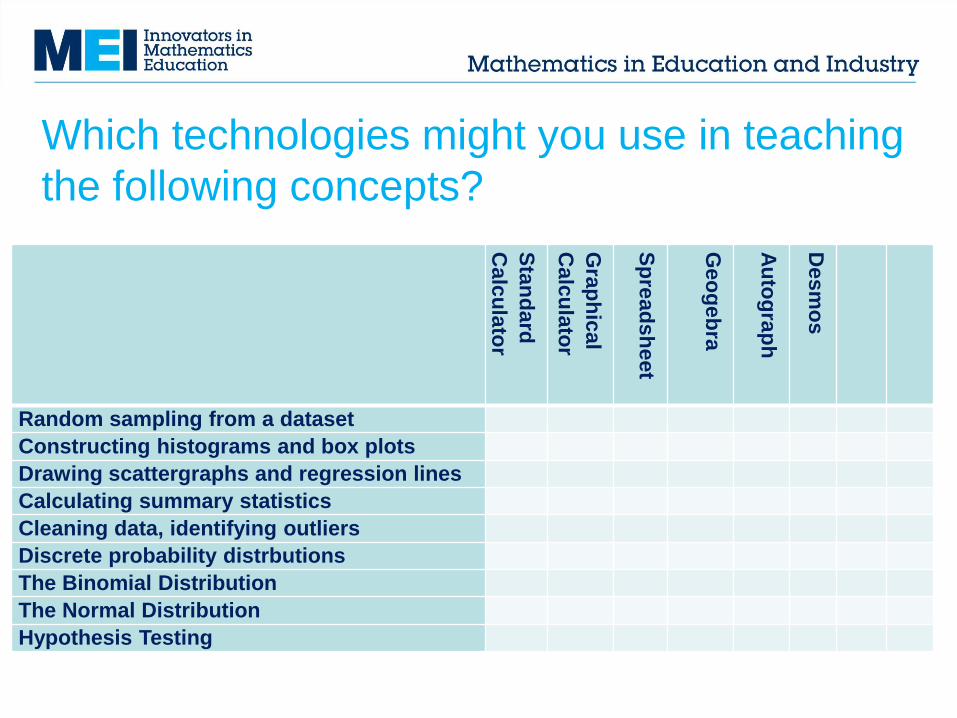
Random sampling from a dataset
Constructing histograms and box plots
Drawing scattergraphs and regression lines
Calculating summary statistics
Cleaning data, identifying outliers
Discrete probability distrbutions
The Binomial Distribution
The Normal Distribution
Hypothesis Testing
Which technologies might you use in teaching
the following concepts?

Sta
nd
ard
Ca
lcu
lato
r
Gra
ph
ical
Calc
ula
tor
Sp
read
sh
eet
Geo
geb
ra
Au
tog
rap
h
Desm
os
Random sampling from a dataset
Constructing histograms and box plots
Drawing scattergraphs and regression lines
Calculating summary statistics
Cleaning data, identifying outliers
Discrete probability distrbutions
The Binomial Distribution
The Normal Distribution
Hypothesis Testing
Which technologies might you use in teaching
the following concepts?
Formula book or formula sheet?
• Model A
Formula sheet given at the beginning of each
paper.
• Model B
Separate formula booklet including some statistical
tables.
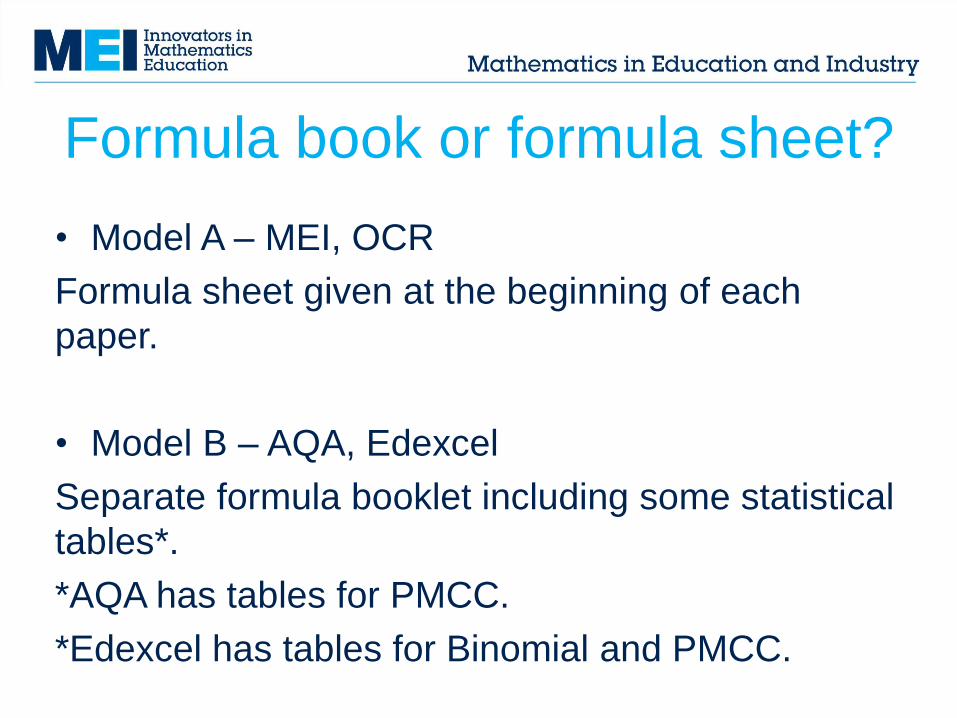
Formula book or formula sheet?
• Model A – MEI, OCR
Formula sheet given at the beginning of each
paper.
• Model B – AQA, Edexcel
Separate formula booklet including some statistical
tables*.
*AQA has tables for PMCC.
*Edexcel has tables for Binomial and PMCC.

Large Data Sets
• Model A
New data set for each cohort.
• Model B
Same data set for all cohorts.

Large Data Sets
• Model A – MEI
New data set for each cohort.
• Model B – AQA, Edexcel, OCR
Same data set for all cohorts.
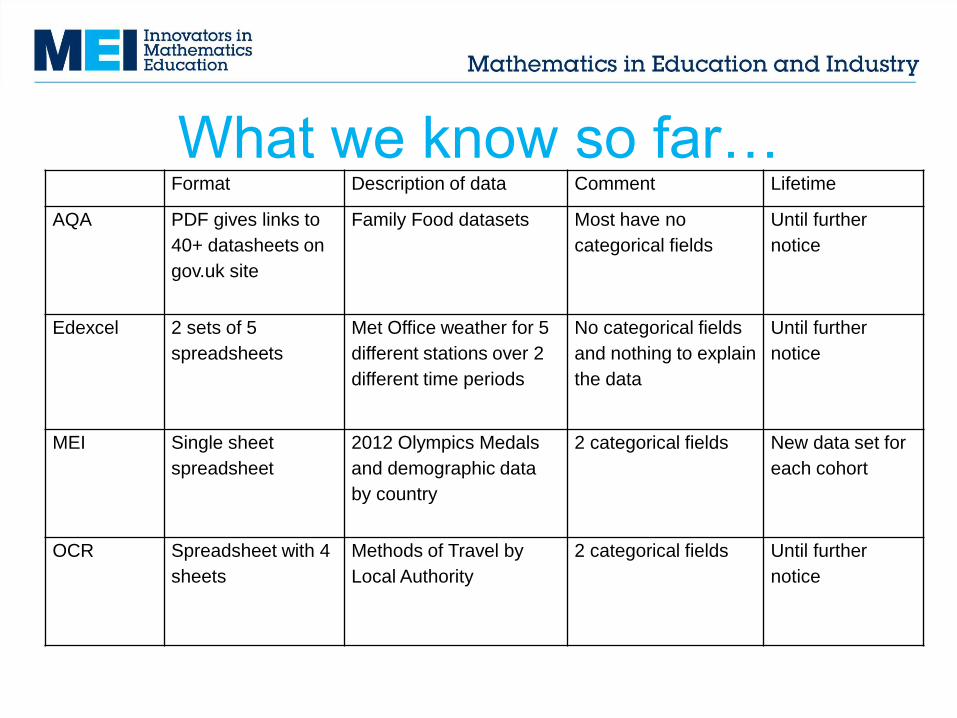
What we know so far…
Format Description of data Comment Lifetime
AQA PDF gives links to
40+ datasheets on
gov.uk site
Family Food datasets Most have no
categorical fields
Until further
notice
Edexcel 2 sets of 5
spreadsheets
Met Office weather for 5
different stations over 2
different time periods
No categorical fields
and nothing to explain
the data
Until further
notice
MEI Single sheet
spreadsheet
2012 Olympics Medals
and demographic data
by country
2 categorical fields New data set for
each cohort
OCR Spreadsheet with 4
sheets
Methods of Travel by
Local Authority
2 categorical fields Until further
notice
Put it in context!
A large data set gives students the opportunity to
apply statistical theory in a real world setting.
How could a large data set be used within each
topic area?

Data collection
• Learners could carry out sampling techniques,
and investigate sampling in real world data sets
including the LDS.
• Learners can discuss methods of data collection
and reliability of the data.
• Learners could explore the LDS with both
quantitative and visual techniques to develop
insight into underlying patterns and structures,
suggest hypotheses to test and to provide a
motivation for further data collection.

Data processing
• Learners should use a spreadsheet or statistical
software to create diagrams from data.
• Learners should use appropriate technology to
perform statistical calculations.

Probability
• Learners could use the LDS to provide estimates
of probabilities for modelling and to explore
possible relationships between variables.
• Learners could see that variables can be
modelled through binomial and normal
distrubutions and experimental and theoretical
outcomes can be compared.
Correlation
• Learners could use appropriate technology to
explore correlation between variables in the
LDS, and the effect different samples might have
in drawing conclusions.

Hypothesis testing
• Learners could use the LDS as the population
against which to test hypotheses based on their
own sampling.
• Learners could use the LDS as a model for the
population to perform repeated sampling
experiments to investigate variability and the
effect of sample size. They should compare the
results from different samples with each other
and with the results from the whole LDS.
Integral resources
• Many topic sections of the Integral resources on
Statistics will include ideas and prompts for how
to explore a LDS using the techniques of that
section.

Links between Pure and Statistics
• Binomial Expansion and Distribution
• Use of Venn Diagrams for classifying objects
e.g. functions
• Use of different functions for modelling data
• Series and probability distributions (geometric)
• Use of algebraic techniques to find unknowns

Examples
1. A discrete random variable X has a probability
distribution given by
𝑃 𝑋 = 𝑥 = 0.2𝑝𝑥 𝑤ℎ𝑒𝑟𝑒 0 < 𝑝 < 1 𝑎𝑛𝑑 𝑥= 0, 1, 2, 3 … …
Find the value of 𝑝
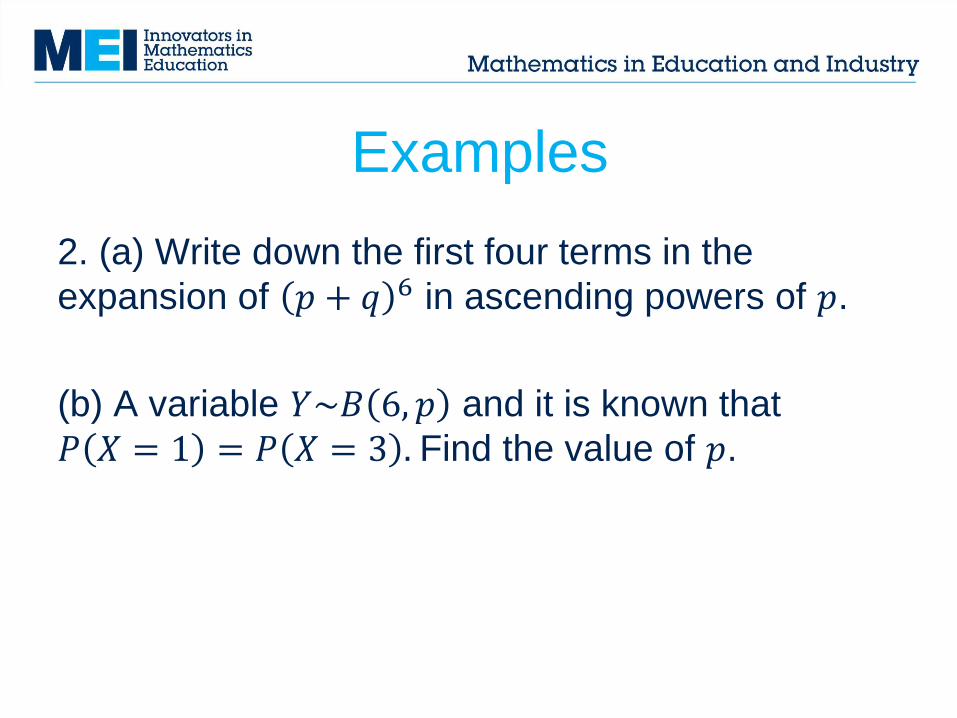
Examples
2. (a) Write down the first four terms in the
expansion of 𝑝 + 𝑞 6 in ascending powers of 𝑝.
(b) A variable 𝑌~𝐵 6, 𝑝 and it is known that
𝑃 𝑋 = 1 = 𝑃 𝑋 = 3 . Find the value of 𝑝.

Examples
3. The random variable G has the distribution
𝑁(µ, 𝜎2)
It is given that P(G < 106) = 0.3446
and P(G > 111) = 0.1977
Find the values of µ and 𝜎.

Examples
4. A Set 𝜀 contains some straight line graphs: 𝑥 + 2𝑦 = 1; 4𝑦 = 3 − 2𝑥 ; 3𝑦 − 6𝑥 = 10;
𝑦 = 1 − 𝑥; 𝑥 = 3 − 2𝑦
The Set A contains those lines in 𝜀 which pass
through (0,1)
The Set B contains those lines in 𝜀 which are
perpendicular to 𝑦 = 2𝑥 + 3
Work out 𝑃(𝐴|𝐵)

Examples
5. The graph below shows Life Expectancy at Birth
against GDP per capita (US$) for the countries in
the large data set.
Suggest a function that could be used to model the
approximate relationship between these two
variables.

Statistics in Further Maths
Awarding
organisation
Location and size of Statistics
unit(s) in AS Further Maths
Location and size of Statistics unit(s) in A level
Further Maths
AQA Paper 2 Statistics option,
1
4 of AS
FM qualification Paper 3 Statistics option
1
6 of A level FM qualification
Edexcel Paper 2 Further Statistics 1
Option, 1
2 of AS FM qualification
Paper 3 or 4 Further Statistics 1 option, 1
4 of A level FM
qualification
Paper 4 Further Statistics 2 option, 1
4 of A level FM
qualification
MEI Statistics a, Statistics b, each
1
3 of
AS FM qualification
Statistics Major, 1
3 of A level FM qualification, or Statistics
Minor, 1
6 of A level FM qualification
OCR Statistics option, Unit Y532,
1
3 of
AS FM qualification Statistics option, Unit 542,
1
4 of A level FM qualification
Further support
• Dedicated MEI website for the 2017 developments
mei.org.uk/2017
• MEI provides expert advice on the latest developments,
and supports you and your department as the changes
approach
• Support for all specifications is given

Further support - PD
‘Get Set for 2017’ courses:
mei.org.uk/2017-pd
A series of 4 one-day courses in an area near you coming
during the 2016-17
- Principles of the new mathematics A levels
- Statistics
- Mechanics
- Effective use of technology

Further support - PD Extended PD courses for teachers looking to develop subject
knowledge & pedagogy for AS/A level Maths or Further Maths.
Teaching Advanced Maths (TAM) course mei.org.uk/tam
Teaching Further Mathematics (TFM) course mei.org.uk/tfm
TAM and TFM cover the pure mathematics content of A level
Maths and Further Maths respectively. For Mechanics and
Statistics PD we run the following:
Teaching Mechanics (TM) furthermaths.org.uk/teaching-mechanics
Teaching Statistics (TS) furthermaths.org.uk/teaching-statistics

Further support - FMSP
• Dedicated FMSP website for the 2017 developments
furthermaths.org.uk/2017
• A wealth of advice, guidance and support form the FMSP
team on the latest developments as the changes approach
• Support for all specifications is given
• Download all the Get Set 2017 resources to use
with your department:
http://bit.ly/GetReady2017Maths

About MEI
• Registered charity committed to improving
mathematics education
• Independent UK curriculum development body
• We offer continuing professional development
courses, provide specialist tuition for students
and work with industry to enhance mathematical
skills in the workplace
• We also pioneer the development of innovative
teaching and learning resources