Embed Size (px)
Citation preview

Waste as a Fuel for CHPOpportunities and Technologies
May 5, 2011
Gershman, Brickner & Bratton, Inc. 1
Waste as a Fuel for CHPOpportunities and Technologies
Presented at thePresented at theU. S. Clean Heat & Power Association
Washington, DC
May 5, 2011
ByBy
Harvey W. Gershman, President
Gershman, Brickner & Bratton, Inc.
Fairfax, VA
With Research Support from
Neil Daniel and Thomas Reardon
GBB Overview
• Headquartered in Fairfax, VA
• Established in 1980 as an objective adviser to governments, institutions, and businesses
• 30 years implementing innovative solutions for waste and recycling industry
2
• Dedicated exclusively to solid waste management; more focused than broad-based firms
• “Change Agents” to produce better services and facilities
CelebratingCelebrating our our 3030th th
AnniversaryAnniversary
Waste as a Fuel for CHPOpportunities and Technologies
May 5, 2011
Gershman, Brickner & Bratton, Inc. 2
Waste Management Overview
3
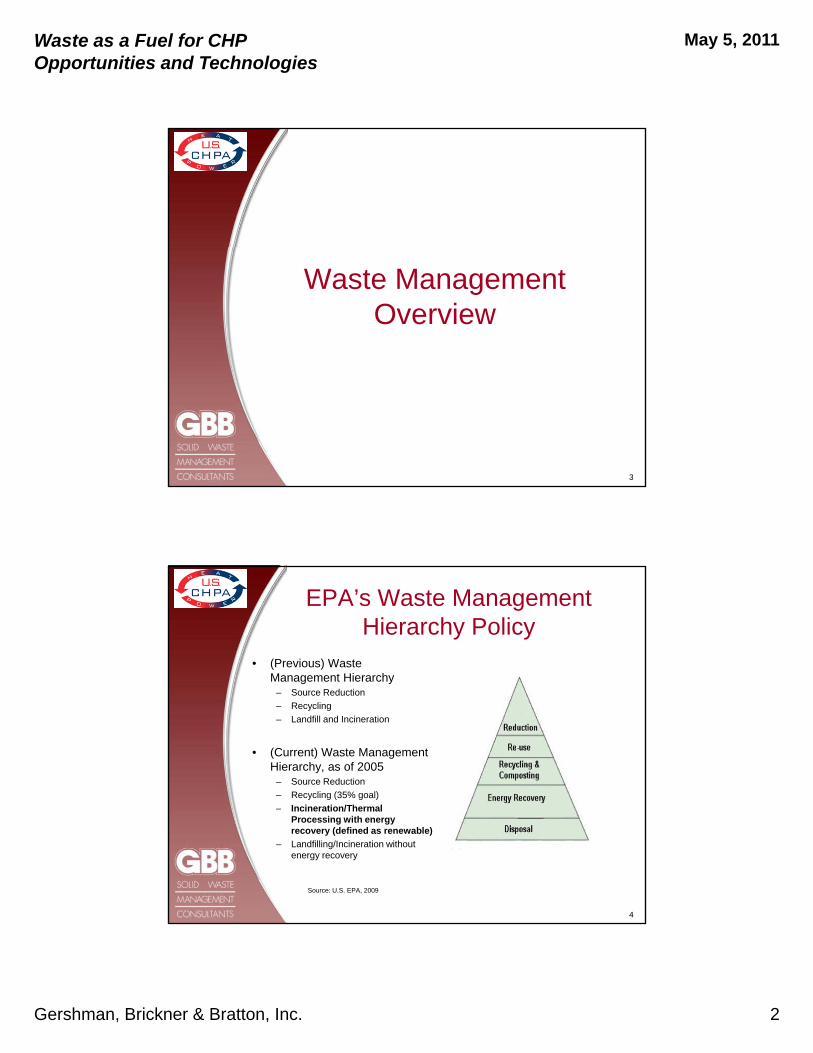
EPA’s Waste Management Hierarchy Policy
• (Previous) Waste Management Hierarchy
– Source Reduction
– Recycling
– Landfill and Incineration
• (Current) Waste Management Hierarchy, as of 2005
– Source Reduction
– Recycling (35% goal)
I i i /Th l– Incineration/Thermal Processing with energy recovery (defined as renewable)
– Landfilling/Incineration without energy recovery
4
Source: U.S. EPA, 2009

Waste as a Fuel for CHPOpportunities and Technologies
May 5, 2011
Gershman, Brickner & Bratton, Inc. 3
Waste Facts
• Each person in U.S. today generates 4.34 lbs. per day
• What is in our waste?– Recyclables
• Feasible now to recycle up to 50-60%
– Energy content of remainder: 5,500 BTUs per pound• Coal at 9,000 BTUs per pound
Source: US EPA, 2009 data5
1 Ton of MSW
• Has 11 million BTUs with 30% moisture30% moisture
• Equivalent to:– 1 barrel of oil
– ½ ton of coal
– 11 DT natural gas
• Can make:• Can make:– 5,500 lbs. of steam
– 400 to 600 KWHrs of electricity
– 48 gallons of ethanol
6

Waste as a Fuel for CHPOpportunities and Technologies
May 5, 2011
Gershman, Brickner & Bratton, Inc. 4
MSW Disposal in America
Discarded
54.20%33.20%
12.60%Discarded
Recovery
Combustion with energy
Source: USEPA 2008
recovery
7
86 U.S. WTE Plants - $14 Billion is Assets Generating approx. 2,700 MWs
Technology OperatingDaily Design
Capacity Annual Capacity (1)gy
Plants (TPD) (Million Tons)
Mass Burn 64 71,354 22.1
Modular 7 1,342 0.4
RDF - Processing & Combustion 13 16,928 5.3
RDF – Coal Combustion 2 4,592 1.4
Total U.S. Plants 86 94,216 29.2
8
(1) Annual Capacity equals daily tons per day (TPD) of design capacity multiplied by 365 (days/year) multiplied by 85 percent. Eighty-five percent of the design capacity is a typical system guarantee of annual facility throughput.
Source: Energy Recovery Council, 2010 Directory

Waste as a Fuel for CHPOpportunities and Technologies
May 5, 2011
Gershman, Brickner & Bratton, Inc. 5
Now - 2011• Several WTE expansions/new projects being
undertaken (some 5-7)
• Over 400 different companies offering alternative conversion technologiesconversion technologies
• Some local governments pursuing proven and/or alternative conversion technologies (some 10-15)
• USDOE and USDA loan/grants supporting several alternative conversion technologies (some 4-6)
• U.S. wants to reduce dependence on foreign oil and reduce greenhouse gases and carbon emissions
• U S needs more clean and renewable energy
9
U.S. needs more clean and renewable energy
• Additional Federal legislative incentives ‘firmly up in the air’
• Some incentives supporting brownfield development for CHP and renewable energy, including from biomass and MSW
Trend for Future
• New technologies will need 4-6 years to learn if they work and their economics
• Added economic benefit of placing value on carbonAdded economic benefit of placing value on carbon credits and power from waste as ‘renewable energy’• Possible impetus for more proven technologies that are now
deemed too expensive
• Renewable fuel standards from EPA
• Low risk assumption by public sector until new technologies proven
• Continued demand for recyclables; industry wants
10
Continued demand for recyclables; industry wants more paper, aluminum, and plastics
• ‘Environmentalists’ and ‘Zero Waste’ proponents will continue to fight WTE and alternative technologies calling them all “incineration”
Waste as a Fuel for CHPOpportunities and Technologies
May 5, 2011
Gershman, Brickner & Bratton, Inc. 6
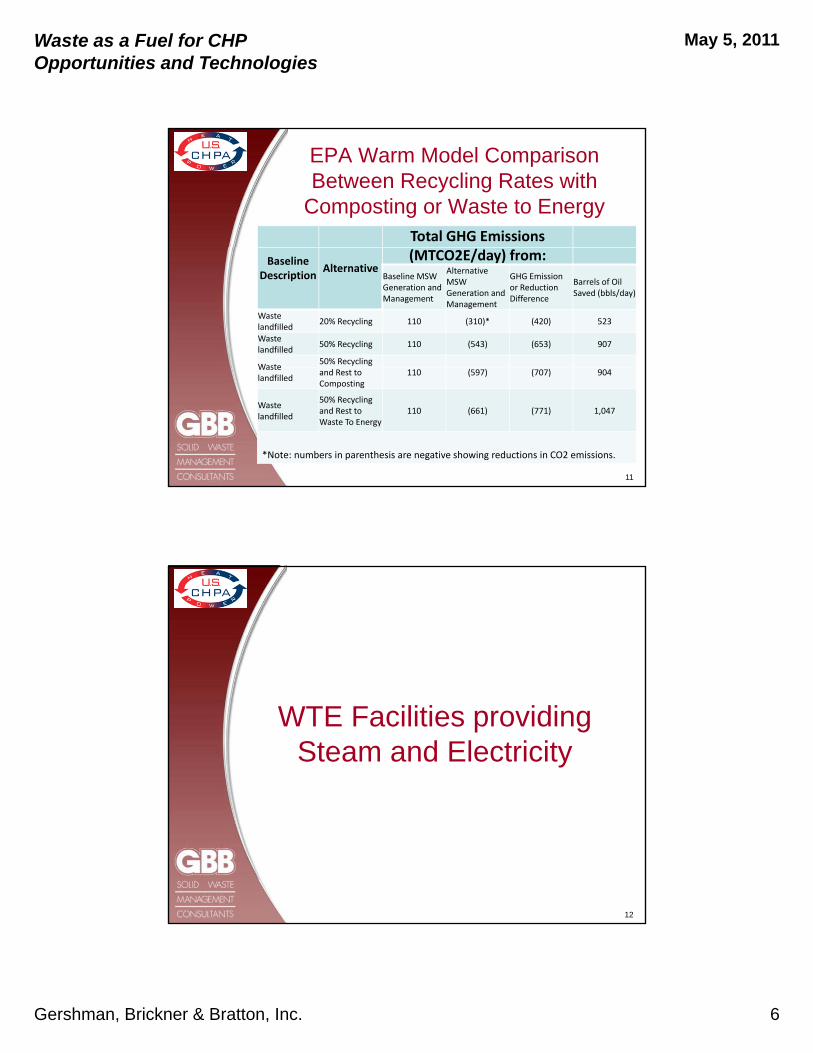
EPA Warm Model Comparison Between Recycling Rates with
Composting or Waste to EnergyTotal GHG Emissions
Baseline Description
Alternative(MTCO2E/day) from:
Baseline MSW Generation and Management
Alternative MSW Generation and Management
GHG Emission or Reduction Difference
Barrels of Oil Saved (bbls/day)
Waste landfilled
20% Recycling 110 (310)* (420) 523
Waste landfilled
50% Recycling 110 (543) (653) 907
Waste50% Recycling
Waste landfilled
and Rest to Composting
110 (597) (707) 904
Waste landfilled
50% Recycling and Rest to Waste To Energy
110 (661) (771) 1,047
*Note: numbers in parenthesis are negative showing reductions in CO2 emissions.
11
WTE Facilities providing Steam and Electricity
12

Waste as a Fuel for CHPOpportunities and Technologies
May 5, 2011
Gershman, Brickner & Bratton, Inc. 7
Nashville, TN District Energy
1974 - 2003
• Thermal provided DH&C services to almost 40 buildings for 30-years …from 1974 2003
2003 - present
1974-2003
• Since its inauguration in December 2003, Metro Nashville DES has received several awards:
• 2006 IDEA Public Sector Leadership Award
• 2006 IDEA System-of-the-Year Award
13
Award
• 2005 Public-Private Partnership Award
• 2005 Grand Award for Engineering Excellence
• 2003 IDEA Gold Award
• 2003 IDEA Silver Award
Nashville District Energy System 2002 Customers and Demand
Building Ownership/Name/Services Building Sq. Ft. Steam (lbs./hr.) Contract Demand Chilled Water (tons)State of TennesseeAndrew Jackson Building (S) (C/W) 545,000 83,000 1,784James J. Polk Building (S) (C/W) 758,000 12,000 1,500Central Service Building (S) (C/W) 90,000 Included in Andrew Jackson Bldg. (AJB) 400Cordell Hull Building (S) (C/W) 358,000 Included in AJB 1,000Library & Archive Building (S) (C/W) 80,000 Included in AJB 150State Capitol Building (S) (C/W) 66,000 Included in AJB 200Supreme Court Building (S) (C/W) 40,000 Included in AJB 125War Memorial Building (S) (C/W) 316,242 Included in AJB 550Tennessee State University Building (S) (C/W) Included in AJB Included in AJBLegislative Plaza Building (S) (C/W) Included in AJB Included in AJBJohn Sevier Building (S) (C/W) Included in AJB Included in AJBRachel Jackson Building (S) (C/W) Included in AJB Included in AJBCiti Pl B ildi (S) (C/W) 295 115 4 600 700Citizens Plaza Building (S) (C/W) 295,115 4,600 700Tennessee Tower (S) (C/W) (I) 850,000 25,200 1,500
Total State Customers 3,398,357 124,800 7,909
Metro BuildingsCourt House (S) (C/W) 239,616 8,000 500*Stahlman Building (S) (C/W) 157,000 4,425 500Criminal Justice Building (CJB) (S) (C/W) 386,000 14,710 645Safety Building (S) (C/W) Included in CJB Included in CJBMunicipal Auditorium (S) (C/W) 142,000 14,000 1,100Convention Center (S) (C/W) 650,000 18,750 1,400Nashville Arena (S) (C/W) 529,341 24,150 2,835The Coliseum N/a 0 2,000Total Metro Customers 2,103,957 84,035 8,980
Private Buildings*Washington Square (S) (C/W) 288,000 4,300 500Parkway Towers (S) (C/W) 215,000 8,000 550Union Planters Bank (S) (C/W) 75,000 3,000 250Sheraton Hotel (S) (C/W) 476,000 15,000 860South Trust Bank (S) (C/W) 82 000 2 000 190
14
South Trust Bank (S) (C/W) 82,000 2,000 190**Public Square Parking (S) (C/W) 36,700 1,500 110Hermitage Suites Hotel (S) (C/W) 80,000 4,000 300501 Building (S) (C/W) (I) 86,000 2,500 250**Sun Trust Bank (S) (C/W) 301,200 18,200 765Sun Trust Center (S) (C/W) 490,000 0 900Renaissance Hotel (S) (C/W) 650,000 21,250 1,000The Tower (C/W) 100,000 0 600(included in Convention Center)City Centre (C/W) 420,000 0 1,600St. Mary’s Church (S) (C/W) 13,200 490 40Ryman Auditorium (S) (C/W) 35,860 2,587 294Wild Horse Saloon (S) (C/W) 52,091 2,800 270Total Private Customers 3,401.05 85,627 8,479
Consolidation:Total State Customers 3,398,357 124,800 7,909Total Metro Customers 2,103,957 84,035 8,980Total Private Customers 3,401,051 85,627 8,479Total 8,903,365 294,462 23,368

Waste as a Fuel for CHPOpportunities and Technologies
May 5, 2011
Gershman, Brickner & Bratton, Inc. 8
Wheelabrator Baltimore, L.P.Baltimore, Maryland
• Commercial Operation: 1985
• Energy-from-Waste System: Three 750-ton-per-day mass burn units with waterwall furnaces and Von Roll reciprocating grates.
• Steam flow to turbine: 510,000 pounds per hour @ 850 psig/825°F
• Air Pollution Control Equipment: Dry scrubbers, electrostatic percipitators, SNCR (NOx controls), carbon injection
15
• Rated Refuse Capacity: 2,250 tons per day
• Energy Generation @ Rated Capacity: 60 megawatts from one condensing steam turbine generator
• Electricity sold to: Baltimore Gas & Electric Company
• Steam sold to: Trigen Baltimore Corporation for the downtown heating and cooling loop that provides services Baltimore retail and commercial buildings; has the capacity to supply Trigen with up to 220,000 pounds of steam per hour (more than 40 percent of Trigen’s steam requirements)
COVANTA Hennepin Energy Resource Co., L.P.Minneapolis, Minnesota
• Site: 15 acres in downtown Minneapolis
• Commercial Operation: October 1989 (Covanta Energy acquired the facility in 1991 from the Blount Energy Resource Corp.)
• Energy-from-Waste System: Two 606-ton-per-day mass burn units with waterwall furnaces and W + E Umwelttechnik A.G. stokers and ash handling systems
• Boiler Design: 630 psig/752°F superheater outlet conditions
• Air Pollution Control Equipment: Semi-dry flue gas scrubbers injecting lime, fabric filter baghouses, nitrogen oxide control system, mercury control system, and continuous emissions monitoring (CEM) system
• Rated Refuse Capacity: 1,212 tons per day
• Energy Generation @ Rated Capacity: Up to 39.6 megawatts from one condensing steam turbine generator
• Steam Sold to Xcel Energy Co.: 10,000 to 50,000 lbs of steam per hour sent to Excel’s Hennepin Energy Center (downtown)
16

Waste as a Fuel for CHPOpportunities and Technologies
May 5, 2011
Gershman, Brickner & Bratton, Inc. 9
COVANTA Indianapolis, Inc.Indianapolis, Indiana
• Site: 21 acres in Indianapolis, IN
• Commercial Operation Date: December 1988
• Energy-from-Waste System: Three 725 ton-per-day waterwall furnaces with Martin® reverse-reciprocating grates and ash handling system
• Boiler Design: 510 psig/710°F superheater outlet condition g g
• Air Pollution Control Equipment: Semi-dry flue gas scrubbers injecting lime, fabric filter baghouses, nitrogen oxide control system, mercury control system, and continuous emissions monitoring (CEM) system
• Rated Refuse Capacity: 2,175 tons per day/MSW
• Steam Export Capacity to Citizens Thermal Energy: no less than 4,500 lbs./steam per ton (587,400 lbs of steam per hour)
17
COVANTA Kent, Inc.Grand Rapids, Michigan
• Site: 9.86 acres
• Commercial Operation: January 1990
• Energy-from-Waste System: Two 312.5-ton-per-day waterwall furnaces with Martin® reverse-reciprocating grates and ash handling system
• Boiler Design: 865 psig/830°F superheater outlet conditions
• Air Pollution Control Equipment: Semi-dry flue gas scrubbers injecting lime, fabric filter baghouses, nitrogen oxide control system, mercury control system, and continuous emissions monitoring (CEM) system
• Rated Refuse Capacity: 625 tons per day
• Energy Generation @ Rated Capacity: up to 18 megawatts from one condensing steam turbine generator with a controlled extraction and/or up to 116,000 lbs/hr of exported steam
• Electricity sold to Consumers Power Company
• Steam sold to Kent County District Heating and Cooling Operation
18

Waste as a Fuel for CHPOpportunities and Technologies
May 5, 2011
Gershman, Brickner & Bratton, Inc. 10
• Operates the largest, most successful, biomass-fueled hot water district heating system in North Americasystem in North America
• Numerous local, national and international awards and honors
• Uses wood chips (biomass), natural gas, oil or clean-burning coal to fuel its district heating and cooling systems
• Steam service: – Signed customer buildings: 187
– Mount Airy homes: 298
– FY 2009 energy sales: 343 871 MWh– FY 2009 energy sales: 343,871 MWh
– Total Building Area Served: 31.7 million sq. ft.
– Heat capacity: 289 MW
• Cooling Service– Signed downtown customers: 98
– FY 2009 Energy Sales: 34,605,266 ton-hours
– Building Area Served: 19.3 million sq. ft.
– Chiller capacity: 32,937 tons
19
Combined Heat and Power
20

Waste as a Fuel for CHPOpportunities and Technologies
May 5, 2011
Gershman, Brickner & Bratton, Inc. 11
Locations of District Energy Systems 2,500 in the U.S.
21
22

Waste as a Fuel for CHPOpportunities and Technologies
May 5, 2011
Gershman, Brickner & Bratton, Inc. 12
Waste-to-energy CHP Vestforbraending nearCopenhagen, Denmark
• Location: Glostrup, west of Copenhagen, Denmark
• Largest WTE plant in Denmark
• Owner: 20 municipalities around Copenhagen
• Operator: I/S Vestforbrænding*
• Configuration: 1 X 17 MW, 1 X 20 MW
• Operation: 1998-2005
• Fuel: refuse; 500,000 tonnes per year
• Annual capacity: 700,000 tonnes of waste
• Boiler supplier: Volund
• T/G supplier: Allen
• Electricity to grid
• Heat for district energy interconnected withHeat for district energy interconnected with the regional district heating system in Copenhagen
• EPC: Elsam
*Denmark’s largest public owned waste management company in Denmark.
23
BrownfieldsBrownfields
“Brownfields are abandoned or underutilized property whose redevelopment is hindered by
either real or perceived environmental
contamination”
24

Waste as a Fuel for CHPOpportunities and Technologies
May 5, 2011
Gershman, Brickner & Bratton, Inc. 13
Brownfield Opportunities for WTE+CHP Advantages
• Reduces up front capital costs for developers by use of federal grants for clean-up and assessment
• Makes efficient use of local renewable energy sources and surplus heat• Makes efficient use of local renewable energy sources and surplus heat
• Fuel flexibility improves energy security, local economy
• Energy dollars re-circulate in local economy
• Urban infrastructure – hidden community asset
• Connects thermal energy sources with users
• Many sites located inside Enterprise Zones, which are eligible for significant tax benefits
• Because these sites exist in the heart of urban areas, there is an accessible skilled labor pool easily availableaccessible skilled labor pool easily available.
• Sites generally already have access to infrastructure: power, water, roads, rail, and bus routes
25
Selected Brownfields Programs• US EPA grants for:
– Assessments
– Revolving Loan Fund (RLF)
– Cleanup Grants
– Job Training Grants g
– Targeted Brownfield Assessment (TBA) – ask the EPA region.
– State/Tribal Response Programs
• US EPA Technical Assistance Sources –
– New Jersey Institute of Technology (NJIT) serves communities in Regions 1, 2, and 3
– Enterprise Corporation of the Delta, Inc (ECD) serves communities in Regions 4 and 6
– Kansas State University serves communities in Regions 5 and 7
– Center for Creative Land Recycling (CCLR) serves communities in Regions 8, 9, and 10
Source: ttp://www.safsf.org/documents/Brownfields%20Gardens%20Learning%20Network%20Call%20Presentation.pdf; and http://www.epa.gov/brownfields/overview/action_plan_2009.pdf
26

Waste as a Fuel for CHPOpportunities and Technologies
May 5, 2011
Gershman, Brickner & Bratton, Inc. 14
Selected Brownfields Programs (cont’d)
• US DOE– Grants and tax incentives for combined heatingGrants and tax incentives for combined heating
and cooling, and renewable energy
– Facilitates transition of brownfields clean sites to beneficial reuses, including for renewable energy technologies
– Feasibility studies for renewable energy projects
– Technical outreach through:• Office of Energy Efficiency and Renewable Energy• Office of Energy Efficiency and Renewable Energy
(EERE)
• National Renewable Energy Laboratory (NREL)
Source: Brownfields Federal Programs Guide, USEPA, 2011 Edition.
27
Facts About District Energy and Greenhouse Gases
District Heating & Cooling - A vision towards 2020 - 2030 - 2050", DHC+ Technology Platform, 2009 says:
• District energy responsible for avoiding at least 113 million tons of CO2 emissions per year; corresponds to 2.6% of total European CO2 emissions.
• District cooling can reduce CO2 emissions by as much as 75% as compared to conventional electrical chillersCities around the world can obtain major efficiency gains by coordinating their production of electricity and heating and cooling while reducing CO2 emission levels
• By implementing existing technologies it is possible to reduce CO2 emissions by as much as 40 per cent with district heating and district cooling systems
World Bank Comparative Study of different CO2 reducing investments revealed:
• District Energy: Every DKK 1,000 (~ EUR 135) invested yields a CO2 reduction of 1 ton of CO2 per year
Wi d P DKK 1 000 i t d l d t d ti f 0 5 t 0 7 t f CO2• Wind Power: DKK 1,000 invested leads to a reduction of 0.5 to 0.7 tons of CO2 per year
• Hydropower: DKK 1,000 invested gives a CO2 reduction of 0.6 - 1.3 tons CO2 per year.
• Only biomass exploited as fuel to avoid evaporation of methane from landfills do better than district heating - both gives 2.5 tons of CO2 reduction per year for every DKK 1,000 invested. However, it should be mentioned that both biomass and waste are fully applicable in a district energy system.
Source: http://www.districtenergypartnership.com/da-DK/DISTRICT-ENERGY/REDUCING-CO2-EMISSION.aspx
28

Waste as a Fuel for CHPOpportunities and Technologies
May 5, 2011
Gershman, Brickner & Bratton, Inc. 15
Examples Selected Cities with Development Opportunities
• Cleveland, OH– St. Vincent Charity Hospital
Cleveland State University
• Portland, OR– Portland State University
Portland Community College– Cleveland State University
– KeyCorp Building
– Metro Health Medical Center
– Case Western Reserve University
– Cleveland Browns Stadium
• Denver, CO– Denver Health and Hospital
– Saint Joseph Hospital
University of Colorado
– Portland Community College
– Portland Marriott City Center
– Oregon Health & Science University
– Providence Portland Medical Center
– Oregon Convention Center
• Washington, DC
– Central Heating Plant, Washington, DC
– University of Colorado Hospital
– Colorado Convention Center
– Auraria Higher Education Center
– University of Denver
g
– Capitol Power Plant
– George Washington University
– University of the District of Columbia
– Gallaudet University
29
Project Building Blocks
Limited and High Alternative Disposal Costs Waste Supply Energy and Materials Market(s) Site for Facility
Good logistics for waste receipt, energy market(s), and residue disposal
Can be permitted Accepted by neighbors
Landfill for ash and by-pass Contractor with resources and proven technology
illi t t k t h l i k
30
or willingness to take technology risk Capital Financeability Compatibility with High Level of Recycling Political Will
Waste as a Fuel for CHPOpportunities and Technologies
May 5, 2011
Gershman, Brickner & Bratton, Inc. 16
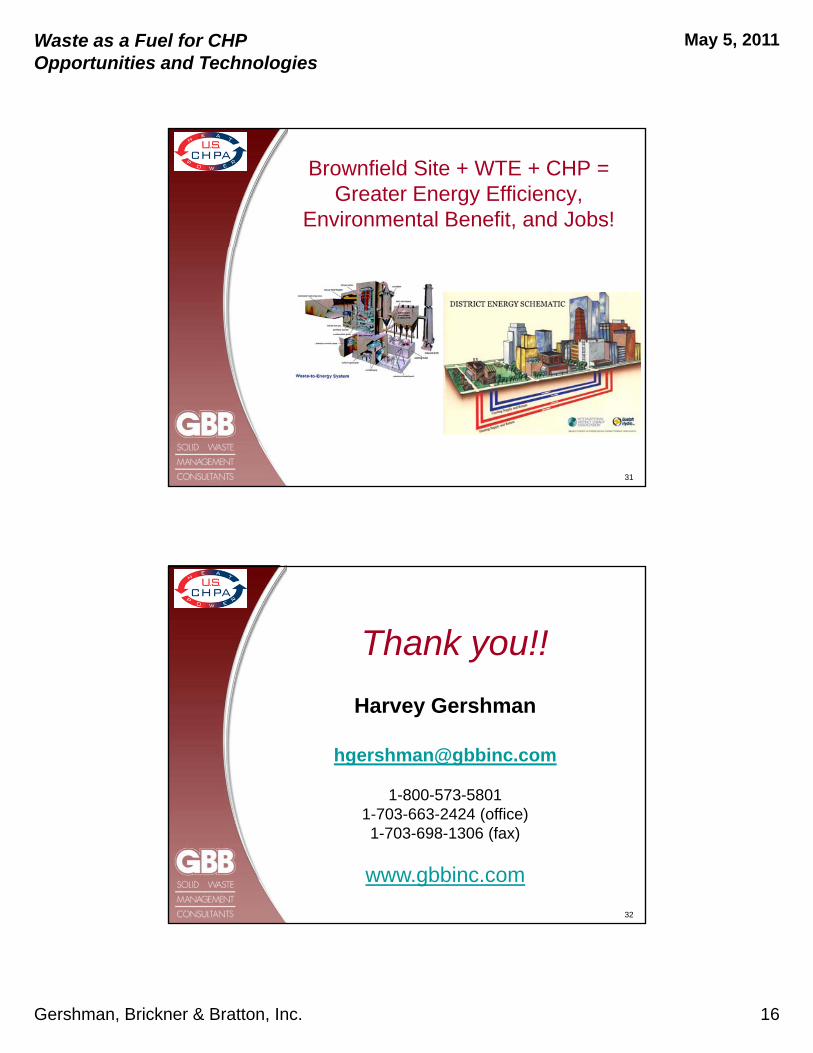
Brownfield Site + WTE + CHP = Greater Energy Efficiency,
Environmental Benefit, and Jobs!
31
Thank you!!
Harvey Gershman
1-800-573-58011-703-663-2424 (office)1-703-698-1306 (fax)
www.gbbinc.com
32