Embed Size (px)
Citation preview
GERMANY
Key findings
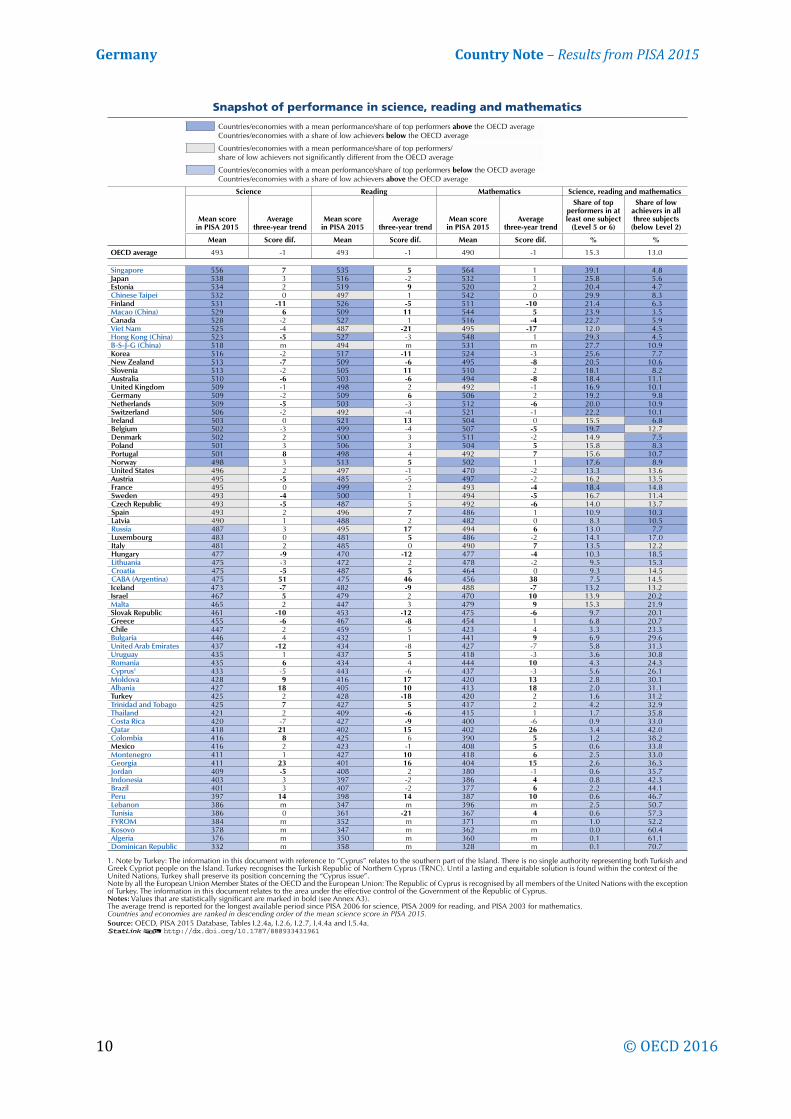
• Students in Germany perform above the OECD average in all three domains assessed in PISA, namely science, reading and mathematics (Figures I.2.13, I.4.1 and I.5.1).
• Germany’s mean score in science has remained stable since 2006, when science was the main domain assessed. But the country’s mean score in science fell by 15 points since 2012 when science was a minor domain. The country’s mean score in reading has steadily improved since PISA 2000, while its mean mathematics performance has not changed significantly since 2003 (Tables I.2.4a, I.4.4a and I.5.4a).
• Some 11% of students in Germany are top performers in science – 3 percentage points higher than the OECD average (Table I.2.2a).
• As in the majority of OECD countries, a more socio-economically advantaged student in Germany scores more than 30 points higher in science (the equivalent of one year of schooling), on average, than a disadvantaged student (42 points in Germany). In Germany, 16% of the variation in student performance is associated with socio-economic status, which is above the OECD average (13%). However, this relationship has weakened by four percentage points in Germany since 2006 (Table I.6.17, and Figure I.6.17).
• In Germany, not only are there fewer girls than boys performing at or above Level 5 in science, but girls – even top-performing girls – are also less likely than boys to expect to work in a science-related occupation (Tables I.2.6a and I.3.10c).
Student performance in science
• Students in Germany score 509 points in science, on average. This score is above the OECD average and is comparable with that of Australia, Ireland, Korea, the Netherlands, New Zealand, Switzerland and the United Kingdom, among others (Figures I.2.13 and I.2.14, and Table I.2.3).
• Germany’s mean performance in science has remained unchanged since 2006 when science was the major domain, with an average decline of 1.7 points every three years, not a significant change. But since 2012 when science was one of the minor domains, the country’s mean score in science dropped a significant 15 points (Table I.2.4a).
• Canada, Chinese Taipei and Viet Nam scored at a comparable level with Germany in 2012, but these countries overtook Germany in science performance in 2015. However, these changes
Germany Country Note – Results from PISA 2015
2 © OECD 2016
should be interpreted with caution, given the short time period of the comparison and since science was a minor domain in 2012 (Figure I.2.13).
• Moreover, since 2006, the OECD average has not shown a significant change either, while it has decreased by 8 score points since 2012; a pattern that mirrors that of Germany. The field trial of 2014 ensured that – for countries as a whole – paper- and computer-delivered assessments were entirely comparable. In fact, the data does not provide any hint that German students have experienced more difficulty in responding to the computer-based test than their peers in the other participating countries. Finally, as the world approaches the fourth industrial revolution, the time to assess students with a paper-and-pencil test is probably coming to an end.
• On average across OECD countries, just over 20% of students do not reach the baseline level of proficiency in science, Level 2. At this level, students can draw on their knowledge of basic science content and procedures to identify an appropriate explanation, interpret data, and identify the question being addressed in a simple experiment. The share of low-performing students in Germany is below the OECD average and has increased by only two percentage points between 2006 and 2015, not a significant change (Table I.2.2a).
• Some 8% of students across OECD countries are top performers in science, meaning that they are proficient at Level 5 or 6. At these levels, students can creatively and autonomously apply their scientific knowledge and skills to a wide variety of situations, including unfamiliar ones. The share of top-performing students in Germany is above the OECD average and has not changed significantly over previous PISA cycles (Table I.2.2a).
Gender differences in science performance
In Germany, boys outperform girls in science by an average of 10 points, above the OECD average. This gender gap widened by three percentage points between 2006 and 2015, which is not a significant change (Tables I.2.8a and I.2.8d).
• Even though gender differences in science performance tend to be small, on average, in 33 countries and economies, including Germany, the share of top performers in science is larger among boys than among girls (Tables I.2.6a).
Performance differences on the science subscales
Each of the science competencies assessed in PISA requires some content knowledge (knowledge of theories, explanatory ideas, information and facts), but also an understanding of how such knowledge has been derived (procedural knowledge) and of the nature of that knowledge (epistemic knowledge).
In Germany, students score six points higher, on average, on the “content knowledge” subscale than on the “procedural and epistemic knowledge” subscale. In neighbouring Austria, the Czech Republic and Hungary, a similar pattern is observed, while in France and the United States, students score higher on the “procedural and epistemic knowledge” subscale (Table I.2.14).
• On average across OECD countries, the difference between boys’ and girls’ scores in science is only 4 points; but boys score 12 points higher than girls, on average, on the “content knowledge” subscale. In Germany, the gender difference on that subscale widens to 20 score points. This may suggest that boys are relatively more interested than girls in the explanations of natural and technological phenomena that science provides (Tables I.2.7 and I.2.19d).
• Across OECD countries, girls score three points higher than boys on the “procedural and epistemic knowledge” subscale; in Germany, no gender difference is observed on this subscale (Table I.2.20d).
Germany Country Note – Results from PISA 2015
© OECD 2016 3
Student performance in reading
• Students in Germany score 509 points in reading, on average – significantly above the OECD average and comparable with the mean reading score in Australia, Japan, Korea, Macao (China), the Netherlands, Norway, Poland, Slovenia and Sweden (Table I.4.3 and Figure I.4.1).
• Germany’s mean reading performance improved from 484 points in 2000 to 497 points (about the OECD average) in 2009 and to 509 points (above the OECD average) in 2015, while no significant change was observed across OECD countries, on average, during the same period (Table I.4.4a).
• About 20% of students in OECD countries, on average, do not attain the baseline level of proficiency in reading (Level 2), considered to be the level at which students begin to demonstrate the reading skills that will enable them to participate effectively and productively in life. In Germany, 16% of students perform below Level 2 in reading, below the OECD average (Table I.4.2a).
• Across OECD countries, 8% of students are top performers in reading, meaning that they are proficient at Level 5 or 6. At these levels, students can find information in texts that are unfamiliar in form or content, demonstrate detailed understanding, and infer which information is relevant to the task. They are also able to critically evaluate such texts and build hypotheses about them, drawing on specialised knowledge and accommodating concepts that may be contrary to expectations. Some 12% of students in Germany are top performers in reading, a larger proportion than average across OECD countries (Table I.4.2a).
• The share of top performers in reading has grown by four percentage points since 2009 when reading was the main domain assessed (Table I.4.2a). As aforementioned, these changes should be interpreted with caution, given that reading was a minor domain in 2015.
Gender differences in reading performance
Girls tend to outperform boys in reading by an average of 21 score points (the OECD average is 27 score points). This gender gap in Germany narrowed by 19 score points between 2009 and 2015 (Tables I.4.8a and I.4.8d).
• A similar pattern is observed on average across OECD countries, although that gender gap narrowed by only 12 points (Tables I.4.8a and I.4.8d).
• In Germany, the share of girls attaining proficiency Level 5 or above in reading is nearly four percentage points larger than that of boys; in 2009, this gender gap was seven percentage points wide. During the same period, the OECD average difference in the shares of girls and boys attaining Level 5 or above shrank from five to three percentage points (Tables I.4.6a and I.4.6d).
Student performance in mathematics
Students in Germany score 506 points in mathematics, on average – above the OECD average and comparable with the mean score in Belgium, Denmark, Finland, Ireland, the Netherlands, Norway, Poland and Slovenia (Table I.5.3 and Figure I.5.1).
• Germany’s mean mathematics performance has not changed significantly since 2003 (Table I.5.4a).
• In Germany, 17% students are low achievers who do not reach the baseline level of proficiency in mathematics (Level 2), while across OECD countries, 23% of students are low achievers, on average. These low-performing students can solve problems involving clear directions and
Germany Country Note – Results from PISA 2015
4 © OECD 2016
requiring a single source of information but cannot engage in more complex reasoning to solve the kinds of problems that are routinely faced by adults in their daily lives. (Table I.5.2a).
• Between 2003 and 2015, Germany reduced its share of low achievers by around four percentage points, but the change is not significant (Tables I.5.2a).
• Around one in ten students in OECD countries is a top performer in mathematics, on average; but in Singapore, more than one in three students are top performers in the subject. In Germany, 13% of students are top performers, 3 percentage points above the OECD average (Tables I.5.2a). However, since 2012, when mathematics was the main domain assessed, the share of top performers shrank from 18% to 13%, while the OECD average share decreased by only 2% (Tables I.5.2a).
Gender differences in mathematics performance
Boys in Germany score 17 points higher in mathematics than girls, on average – a wider performance gap than observed across OECD countries. This gender gap has not changed significantly since 2003 (Tables I.5.8a, I.5.8b and I.5.8d).
• As has been observed since 2003, the percentage of boys attaining Level 5 or above in mathematics is significantly larger than the share of girls who score at those levels (Tables I.5.6a and I.5.6b).
Context for student achievement
In 2014, the per capita GDP of Germany was about 20% higher than the OECD average, similar to that of neighbouring Austria, Denmark and France, and almost 50% less than that of Singapore, one of the top-performing countries in PISA 2015. The percentage of 35-44 year-olds with tertiary education was approximately 8% lower in Germany than across OECD countries, on average (Table I.2.11).
The impact of socio-economic status on performance
• Canada, Estonia, Finland and Japan achieve high levels of performance and equity in education outcomes as assessed in PISA 2015, with 10% or less of the variation in student performance attributed to differences in students’ socio-economic status, compared with 13% of the variation across OECD countries. (Figure I.6.6 and Table I.6.3a)
• Germany’s education system is less equitable than the average across OECD countries as 16% of the variation in student performance in science is attributed to differences in students’ socio-economic status. However, equity has improved in Germany since 2006. Students’ socio-economic status became a less reliable predictor of achievement in Germany by four percentage points (Tables I.6.3a and I.6.17).
• Across OECD countries, a socio-economically advantaged student scores 38 points higher in science – the equivalent of more than one year of schooling – than a disadvantaged student. In Germany, the performance difference between these two groups of students – 42 points – is larger than the OECD average (Table I.6.3a).
• On average across OECD countries, students attending advantaged schools score 104 points higher than students in disadvantaged schools. This difference is even larger in Germany (144 score points), as well as in neighbouring Austria, Belgium, the Czech Republic, Hungary, Luxembourg and the Netherlands (Table I.6.11).
Germany Country Note – Results from PISA 2015
© OECD 2016 5
• In Germany, 34% of disadvantaged students – the equivalent of around 9% of the entire student population – are “resilient”, meaning that they beat the socio-economic odds against them and score among the top 25% of students around the world. In Hong Kong (China), Macao (China) and Viet Nam, more than one in two disadvantaged students are resilient (Figure I.6.10). The percentage of resilient students in Germany increased by a significant 9 percentage points since 2006, much larger than the OECD average increase of 2 percentage points during the same period (Table I.6.17).
Students with an immigrant background
• The share of immigrant students in OECD countries increased from 9% in 2006 to 12% in 2015 while the difference in science performance between immigrant and non-immigrant students shrank by 9 score points during the same period. While results for Germany should be interpreted with caution due to high missing rates in student responses to questions regarding immigrant background and language spoken at home since 2009 (Tables A1.3 and A5.10), the performance gap between these groups of students in Germany did not narrow significantly during the period (Figure I.7.13).
• In Germany, immigrant students score 72 points lower than non-immigrant students, on average, but this difference shrinks to 28 points after accounting for students’ socio-economic status and the language spoken at home (Table I.7.15a).
Education policies and practices
Opportunity to learn science at school
Inequalities in opportunities to learn are mainly reflected in the time education systems, schools and teachers allocate to learning. If time is a necessary condition for learning, students who do not attend science lessons are probably those who enjoy the fewest opportunities to acquire competencies in science.
On average across OECD countries, 94% of students reported that they attend at least one science course per week. But that means that at least one million 15-year-old students are not required to attend any science lesson. In Germany, 95% of students are required to attend science lessons (Table II.2.3).
Moreover, students who reported that they do not attend school science classes are more likely to be in disadvantaged schools. In Germany, students in disadvantaged school are 10 percentage points less likely than students in advantaged schools to be required to attend at least one science course. Across OECD countries, the former group of students is four percentage points less likely to be required to attend a science course (Figure II.2.5).
In Germany, students who are not required to attend science classes score almost 78 points lower in science; across OECD countries, these students score 44 points lower in science than students who are required to attend at least one science lesson per week. However, after accounting for the socio-economic profile of students and schools, the difference between Germany and the OECD average in the impact of attending a science course narrows to 3 score points (25 points in Germany and 28 points on average across OECD countries) (Figure II.2.4).
Teaching strategies
How teachers teach science is more strongly associated with science performance and students’ expectations of working in a science-related career than the material and human resources of science departments, including the qualifications of teachers or the kinds of extracurricular science activities offered to students. Almost everywhere, students who reported that their teachers explain scientific
Germany Country Note – Results from PISA 2015
6 © OECD 2016
ideas more frequently score higher in science, even after accounting for socio-economic status. In Germany, 50% of students reported that their teachers explain scientific ideas in many or all lessons, and these students score 40 points higher in science than students who reported that their teachers explain scientific ideas only in some lessons or never (Tables II.2.16 and II.2.18).
In almost all school systems, students who reported that their teachers adapt the lesson to the students’ needs and knowledge more frequently score higher in science, even after accounting for socio-economic status. In Germany, 43% of students reported that their teachers adapt many or every lesson to the class’s needs and knowledge, and these students score 46 points higher in science than students who reported that their teachers never or only sometimes adapt lessons to the class’s needs and knowledge (Tables II.2.22 and II.2.24).
Resource allocation
Equitable resource allocation means that the schools attended by socio-economically disadvantaged students are at least as well-equipped as the schools attended by advantaged students, to compensate for inequalities in the home environment. Based on school principals’ reports, in 26 countries and economies, advantaged schools are better equipped than disadvantaged schools (Tables II.6.3).
With the exception of Ciudad Autónoma de Buenos Aires (Argentina) and Macao (China), all school systems where schools principals in disadvantaged schools are considerably more concerned about the material resources at their school than principals in advantaged schools score below 450 score points in science. In Germany, principals in disadvantaged schools are as concerned about the material resources – and human resources – as principals in advantaged schools. However, students whose principals reported greater concern about staff shortages score 15 points lower in science, before accounting for socio-economic status (Tables II.6.2 and II.6.15, and Figure II.6.4).
Selecting and sorting students
On average across OECD countries, school systems begin selecting students for different programmes at the age of 14. Some OECD countries, including Germany, start selecting students at age 10. The later students are selected into different academic programmes/schools and the lower the percentage of students who had repeated a grade, the greater the equity in science performance, even after accounting for the school’s mean score in science and the variation in student performance (Figures II.5.13 and II.5.8, and Table II.5.27).
In countries that sort students early, performance can vary markedly between schools. Across OECD countries, 70% of the variation in performance is observed among students in the same school, indicating greater academic inclusion within the system as a whole. In Germany, 56% of the variation in performance is observed among students in the same school; however, variation in the performance of students attending different schools (43%) is greater than on average across OECD countries (30%), partly reflecting the extensive use of tracking in the German school system. . But there was greater academic inclusion in Germany in 2015 than in 2006, when only 46% of the variation in student performance was observed within schools (Table I.6.17).
In Germany, 78% of students attend schools that consider students’ academic records, including results of placement tests, for admission to school, and 87% attend schools that consider residence as a criterion for admission. The former group of students scores 38 points higher in science than students who do not attend such schools; the latter group scores 37 points lower in science. But, after accounting for students' and schools' socio-economic status, these performance gaps narrow and are not significant (Tables II.5.18 and II.5.21).
Germany Country Note – Results from PISA 2015
© OECD 2016 7
Grade repetition
Grade repetition is more prevalent in school systems where students score lower on the PISA science assessment and where students’ socio-economic status is most strongly associated with science performance. Students might have been kept back to repeat course content that they had not fully mastered; or they might have been invited to skip a grade when their teachers felt they were capable of taking on more challenging schoolwork. In 13 countries and economies, at least 30% of students had repeated a grade at least once in primary or secondary education; in Germany, 18% of students had repeated a grade in primary or secondary school (Tables II.5.9).
Many people would agree that performance, behaviour and motivation are legitimate reasons for deciding which students repeat a grade; and the data clearly show these associations. What is more troubling is that, even after accounting for students’ academic performance, behaviour and motivation, in many education systems, a student with certain characteristics is more likely to have repeated a grade than other students. For instance, across OECD countries, boys are more likely than girls, socio-economically disadvantaged students are more likely than advantaged students, and students with an immigrant background are more likely than students without an immigrant background to have repeated a grade. In Germany, boys are more likely than girls to have repeated a grade, but advantaged and disadvantaged students, and immigrant and non-immigrant students are equally likely to have repeated a grade (Tables II.5.13).
One promising finding is that, across OECD countries, the percentage of students who reported that they had repeated a grade at least once decreased by almost three percentage points between 2009 and 2015. In Germany, the percentage of students who reported that they had repeated a grade at least once, which is lower than the OECD average, did not change significantly during the period (Figure II.5.5).
School governance
Around 90% of students in Germany are enrolled in a public school, more than the OECD average (82%) and in line with neighbouring countries Austria, the Czech Republic and Poland. As in most other school systems that participate in PISA, disadvantaged students in Germany are more likely than advantaged students to attend public schools. Students in public schools score 46 points lower in science than students in private schools, although after accounting for socio-economic status, there is no significant performance difference between the two groups of students (Tables II.4.6 and II.4.10).
In education systems where school principals hold greater responsibility for school governance, students score higher in science; and this relationship is stronger among school systems where the percentage of students whose achievement data are tracked over time and posted publicly is higher than the OECD average. However, in Germany, only 14% of students attend schools that post achievement data publicly; the OECD average is 44% (Table II.4.27).
Schools in Germany are as autonomous in many areas as on average across OECD countries, except when it comes to resources and admissions policies. For instance, principals and teachers in Germany hold 62% of the responsibility for the curriculum, compared to 66% across OECD countries; and they hold 71% of the responsibility for assessments, compared to 68% across OECD countries. Responsibility for school resources is largely centralised at the local/regional level (73%); principals and teachers hold only 20% of the responsibility for resources (the OECD average is 42%). But 84% of the responsibility for school admissions lies in the hands of principals and teachers in Germany, compared to 67% across OECD countries. According to reports by school principals across OECD countries, since 2009 schools have gained greater autonomy over decisions regarding teachers’ salaries, the school budget, the school curriculum and assessment policies. In Germany, the opposite pattern is observed, as local and regional authorities centralise responsibilities (Tables II.4.2 and II.4.4, and Figure II.4.3).
Germany Country Note – Results from PISA 2015
8 © OECD 2016
Students’ engagement with science
Disposition towards the scientific method of enquiry
PISA 2015 asked students about their beliefs about the nature of science knowledge and the validity of scientific methods of enquiry (collectively known as epistemic beliefs). Students whose epistemic beliefs are in agreement with current views about the nature of science can be said to value scientific approaches to enquiry.
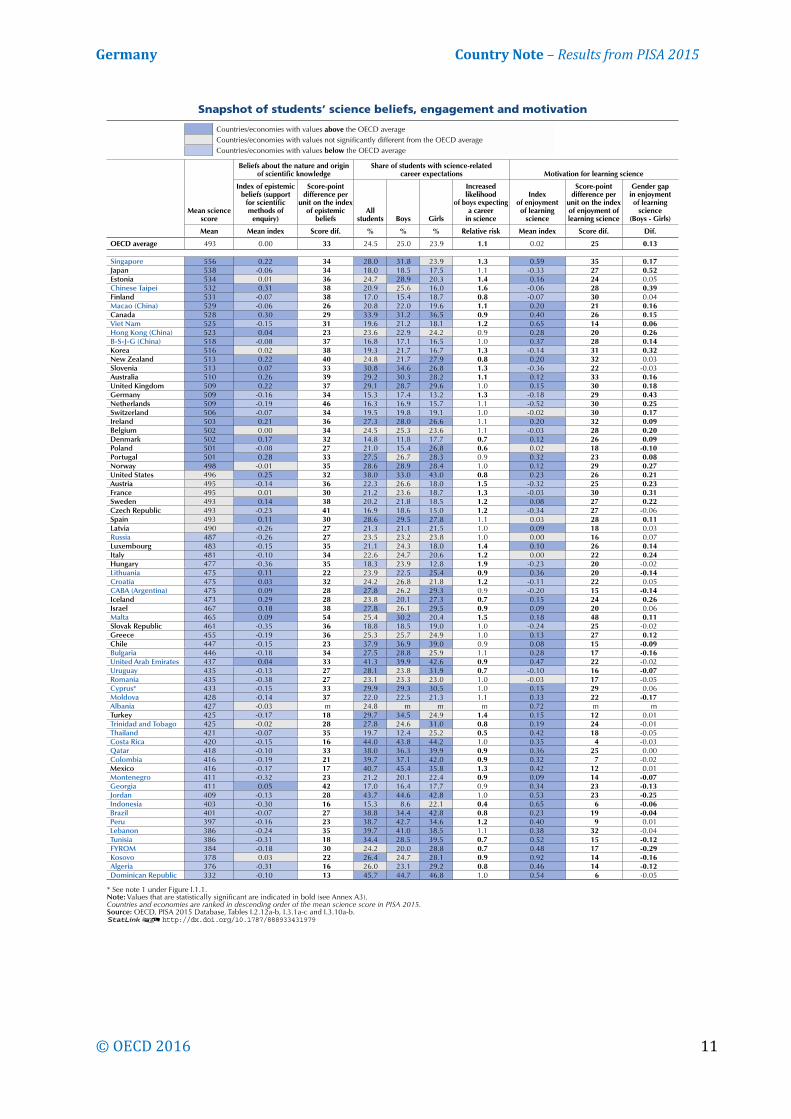
In Germany, the percentage of students with strong epistemic beliefs is lower than the OECD average. For instance, 77% of students in Germany agreed with the statement that it is good to try experiments more than once to make sure of the findings, while across OECD countries, 85% of students, on average, agreed with that statement. Some 65% of students in Germany agreed with the statement that sometimes scientists change their minds about what is true in science, while 80% of students across OECD countries agreed with that statement, on average (Table I.2.12a).
Students’ expectations of a career in science
PISA 2015 asked students what occupation they expect to be working in when they are 30 years old. Even though many 15-year-olds are undecided about their future, almost one in four students across OECD countries – and around one in seven students (15%) in Germany – reported that they expect to work in an occupation that requires further science training beyond compulsory education. On average across OECD countries, almost one in four students (24%) reported so (Table I.3.10a).
In almost all countries/economies, the expectation of pursuing a career in science is strongly related to proficiency in science. On average across OECD countries, only 13% of students who score below PISA proficiency Level 2 in science hold such expectations, but that percentage more than triples to 42% among top performers in science (those who score at or above Level 5). In Germany, only 6% of low-performing students and 32% of top performers expect to pursue a career in science (Figure I.3.3 and Table I.3.10b).
Even when equal shares of boys and girls expect to pursue a science-related career, boys and girls tend to think of working in different fields of science. In all countries, girls envisage themselves as health professionals more than boys do; and in almost all countries, boys see themselves as becoming ICT professionals, scientists or engineers more than girls do. Boys are more than twice as likely as girls to expect to work as engineers, scientists or architects (science and engineering professionals), on average across OECD countries; only 0.4% of girls, but 5% of boys, expect to work as ICT professionals. Girls are almost three times as likely as boys to expect to work as doctors, veterinarians or nurses (health professionals). In Germany, gender differences are more pronounced than across OECD countries: boys are 30% more likely than girls to report that they expect to pursue a career in science (Tables I.3.10b, I.3.11a and I.3.11c).
Gender-related differences in students’ engagement with science
When a student is confident in his or her ability to accomplish particular goals in the context of science, he or she is said to have a greater sense of self-efficacy in science. Better performance in science leads to a greater sense of self-efficacy, through positive feedback received from teachers, peers and parents, and the positive emotions associated with that feedback.
In 39 countries and economies, boys show significantly greater self-efficacy than girls. Gender differences in science self-efficacy are slightly larger than average in Germany. The difference in the shares of boys and girls who reported feeling confident when asked to “recognise the science question that underlies a newspaper report on a health issue” is five percentage points (the OECD average is four percentage points). When asked to “explain why earthquakes occur more frequently in some
Germany Country Note – Results from PISA 2015
© OECD 2016 9
areas than in others”, the gender gap in self-efficacy widens to ten percentage points (the OECD average is four percentage points) (Figure I.3.20 and Table I.3.4c).
Moreover, the gender gap in science self-efficacy is related to the gender gap in science performance, especially among high-achieving students. In Germany, top-performing boys who reported greater self-efficacy score 20 score points higher in science than girls who also perform at Level 5 or 6 (Figure I.3.23).
PISA distinguishes between two forms of motivation to learn science: students may learn science because they enjoy it (intrinsic motivation) and/or because they perceive learning science to be useful for their future plans (instrumental motivation).
A majority of students who participated in PISA 2015 reported that they enjoy and are interested in learning science, but boys tended to report so more than girls. In Germany, the gender gap is larger than across OECD countries, on average. The difference in the shares of boys and girls who reported that they agree with the statement “I enjoy acquiring new knowledge in science” is 17 percentage points (the OECD average difference is 4 percentage points). Moreover, in Germany, 50% of boys reported that what they “learn in their school science subject(s) will help [them] to get a job” while 38% of girls reported so (Tables I.3.1c and I.3.3c).
Student truancy
On average across OECD countries, two in five students reported that they had skipped a day of school or more in the two weeks prior to the PISA test; in Germany, one in five students so reported. Some 40% of students in Germany reported that they had arrived late for school over the same period, compared with 44% of students across OECD countries who so reported (Figure II.3.2 and Table II.3.1).
Students who arrive late or skip school miss learning opportunities. They also disrupt class, creating a disciplinary climate that is not conducive to learning for their fellow students. In PISA-participating countries and economies, skipping a whole day of school is more common in disadvantaged schools than in advantaged schools. This is observed in 44 countries and economies, compared to only 4 education systems where students in advantaged schools are more likely to have skipped a day of school (Figures II.3.3 and II.3.6).
On average across OECD countries, students who had skipped a whole day of school at least once in the two weeks prior to the PISA test score 45 points lower in the science assessment than students who had not skipped a day of school (and 33 points lower after accounting for the socio-economic profile of students and schools – the equivalent of almost one full year of schooling). In Germany, students who reported that they had skipped a day of school score 50 points lower in science than students who reported that they had not skipped school (Table II.3.4).
Across OECD countries, students score lower on the PISA science test when more of their peers had skipped a whole day of school at least once in the two weeks prior to the PISA test, even after taking into account whether the student himself/herself had skipped school and the socio-economic status of students and schools. In Germany, students score three points lower in science for every percentage-point increase in the share of peers who had skipped a day of school, and one point lower after accounting for the respondent’s truancy, and students’ and schools’ socio-economic profile (Figure II.3.5 and Table II.3.8).
Between 2012 and 2015, the percentage of students who had skipped a day of school increased by four percentage points, signalling a decline in students’ engagement with school (the OECD average is an increase of five percentage points) (Figure II.3.2, and Tables II.3.1, II.3.2 and II.3.3).
Germany Country Note – Results from PISA 2015
10 © OECD 2016
Germany Country Note – Results from PISA 2015
© OECD 2016 11
Germany Country Note – Results from PISA 2015
12 © OECD 2016
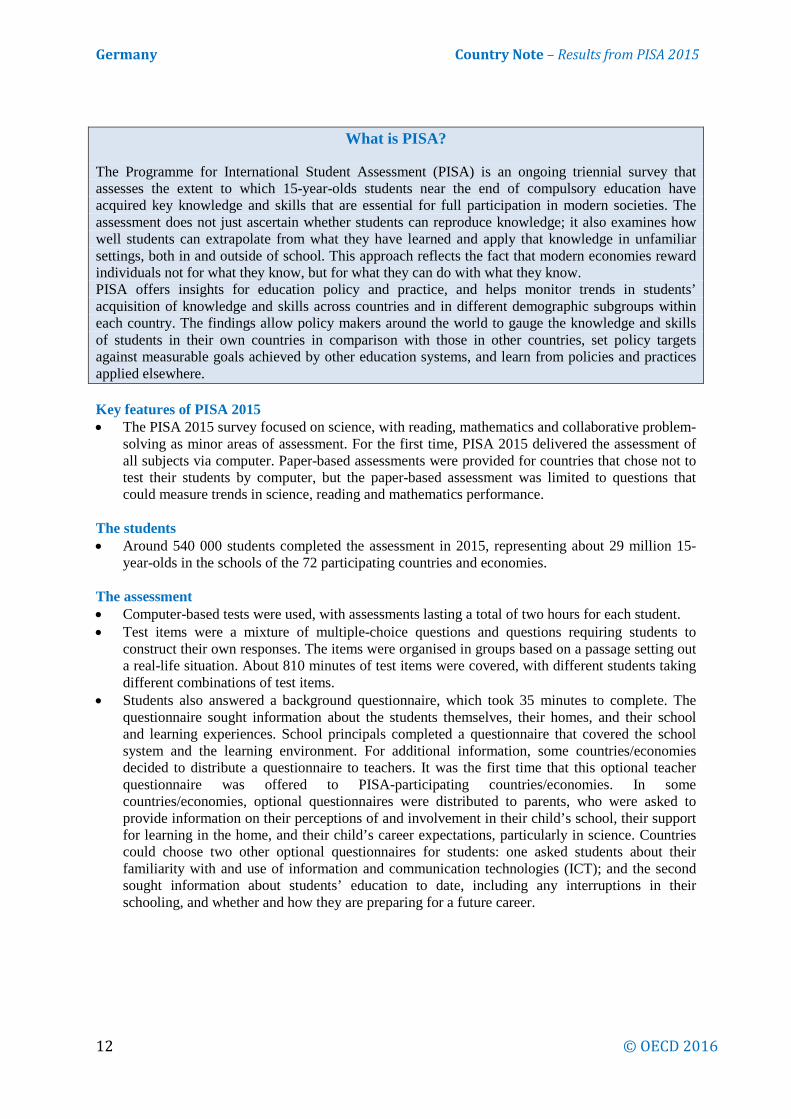
What is PISA?
The Programme for International Student Assessment (PISA) is an ongoing triennial survey that assesses the extent to which 15-year-olds students near the end of compulsory education have acquired key knowledge and skills that are essential for full participation in modern societies. The assessment does not just ascertain whether students can reproduce knowledge; it also examines how well students can extrapolate from what they have learned and apply that knowledge in unfamiliar settings, both in and outside of school. This approach reflects the fact that modern economies reward individuals not for what they know, but for what they can do with what they know. PISA offers insights for education policy and practice, and helps monitor trends in students’ acquisition of knowledge and skills across countries and in different demographic subgroups within each country. The findings allow policy makers around the world to gauge the knowledge and skills of students in their own countries in comparison with those in other countries, set policy targets against measurable goals achieved by other education systems, and learn from policies and practices applied elsewhere. Key features of PISA 2015 • The PISA 2015 survey focused on science, with reading, mathematics and collaborative problem-
solving as minor areas of assessment. For the first time, PISA 2015 delivered the assessment of all subjects via computer. Paper-based assessments were provided for countries that chose not to test their students by computer, but the paper-based assessment was limited to questions that could measure trends in science, reading and mathematics performance.
The students • Around 540 000 students completed the assessment in 2015, representing about 29 million 15-
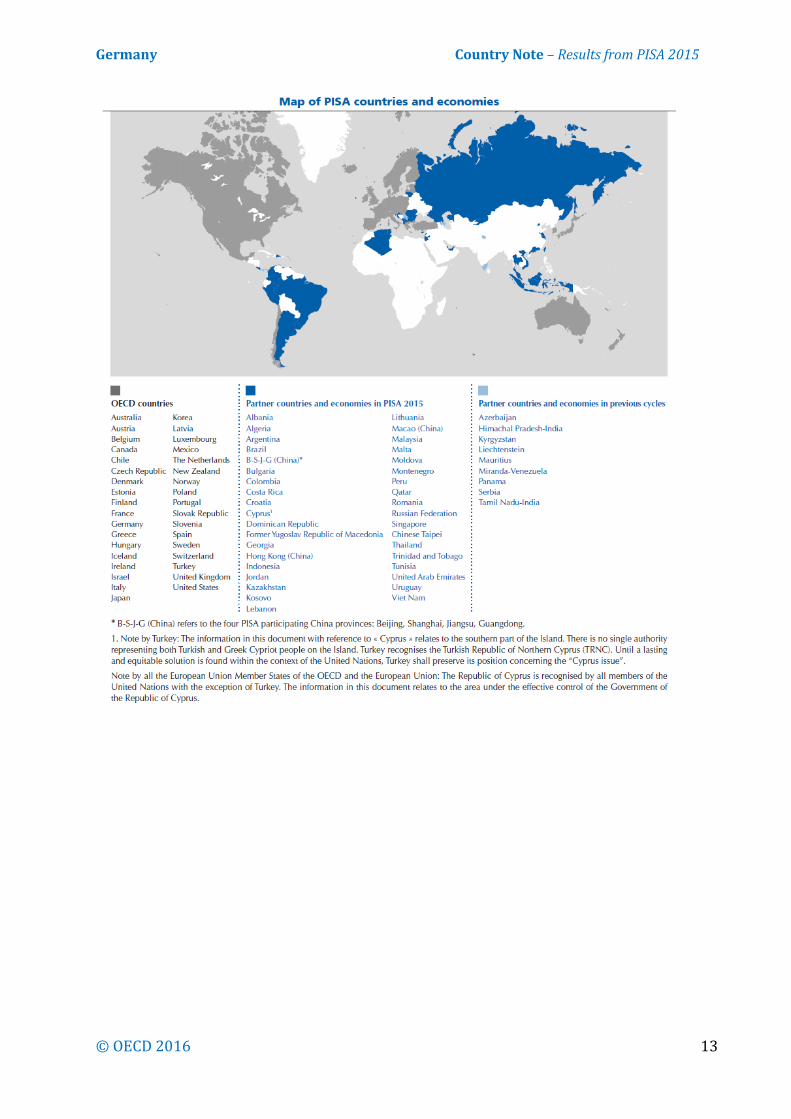
year-olds in the schools of the 72 participating countries and economies.
The assessment • Computer-based tests were used, with assessments lasting a total of two hours for each student. • Test items were a mixture of multiple-choice questions and questions requiring students to
construct their own responses. The items were organised in groups based on a passage setting out a real-life situation. About 810 minutes of test items were covered, with different students taking different combinations of test items.
• Students also answered a background questionnaire, which took 35 minutes to complete. The questionnaire sought information about the students themselves, their homes, and their school and learning experiences. School principals completed a questionnaire that covered the school system and the learning environment. For additional information, some countries/economies decided to distribute a questionnaire to teachers. It was the first time that this optional teacher questionnaire was offered to PISA-participating countries/economies. In some countries/economies, optional questionnaires were distributed to parents, who were asked to provide information on their perceptions of and involvement in their child’s school, their support for learning in the home, and their child’s career expectations, particularly in science. Countries could choose two other optional questionnaires for students: one asked students about their familiarity with and use of information and communication technologies (ICT); and the second sought information about students’ education to date, including any interruptions in their schooling, and whether and how they are preparing for a future career.
Germany Country Note – Results from PISA 2015
© OECD 2016 13
Germany Country Note – Results from PISA 2015
14 © OECD 2016
This work is published under the responsibility of the Secretary-General of the OECD. The opinions expressed and arguments employed herein do not necessarily reflect the official views of OECD member countries. This document and any map included herein are without prejudice to the status of or sovereignty over any territory, to the delimitation of international frontiers and boundaries and to the name of any territory, city or area. Note regarding data from Israel The statistical data for Israel are supplied by and are under the responsibility of the relevant Israeli authorities. The use of such data by the OECD is without prejudice to the status of the Golan Heights, East Jerusalem and Israeli settlements in the West Bank under the terms of international law.
This work is available under the Creative Commons Attribution-NonCommercial-ShareAlike 3.0 IGO (CC BY-NC-SA 3.0 IGO). For specific information regarding the scope and terms of the licence as well as possible commercial use of this work or the use of PISA data please consult Terms and Conditions on www.oecd.org.
Contacts: Andreas Schleicher Director for the Directorate for Education and Skills Email: [email protected] Telephone: +33 1 45 24 93 66 [email protected] [email protected] For more information on the Programme for International Student Assessment and to access the full set of PISA 2015 results, visit: www.oecd.org.edu/pisa