Embed Size (px)
Citation preview
1
German Validation of the Conners Adult ADHD Rating Scale–Self-Report: Confirmation of Factor Structure in
a Large Sample of Participants with ADHD
Christiansen, H1., Hirsch, O1., Philipsen, A2., Oades, R.D3., Matthies, S4., Hebebrand, J3.,
Ueckermann, J3., Abdel-Hamid, M3., Kraemer,M5., Wiltfang,J3., Graf, E4., Colla, M6., Sobanski,
E7., Alm, B7., Rösler, M8., Jacob, C9., Jans, T9., Huss, M10., Schimmelmann, B.G11. and Kis, B3.
1. Philipps University Marburg, Germany 2. Medical University Center, Freiburg, Germany 3. University of Duisburg-Essen, Germany 4. University Medical Center Freiburg, Freiburg, Germany 5. Alfried-Krupp Hospital, Essen, Germany 6. Charite-University Medicine Berlin, Germany 7. Central Institute of Mental Health, Mannheim, Germany 8. Saarland University, Homburg, Germany 9. University of Würzburg, Germany 10. University of Mainz, Germany 11. University of Bern, Switzerland
Corresponding Author: Hanna Christiansen, Philipps University Marburg, Gutenbergstr. 18, Marburg, 35037, Germany, Email: [email protected]
2012 Journal of Attention Disorders,
This is the reformatted manuscript submitted - prior to publication in its final form at DOI: 10.1177/1087054711435680 http://jad.sagepub.com
Abstract Objective: The Conners Adult ADHD Rating Scales (CAARS) assess symptoms specific to
adults that are frequently used and have been translated into German. The current study tests the factor structure of the CAARS in a large sample of German adults with ADHD and compares the means of the CAARS subscales with those of healthy German participants.
Method: CAARS were completed by 466 participants with ADHD and 851 healthy control participants. Confirmatory factor analysis was used to establish model fit with the American original. Comparisons between participants with ADHD and healthy controls and influences of gender, age, and degree of education were analyzed.
Results: Confirmatory factor analysis showed a very good fit with the model for the American original. Differences between ADHD participants and healthy controls on all Conners Adult ADHD Rating Scales–Self-Report (CAARS-S) subscales were substantial and significant.
Conclusion: The factor structure of the original American model was successfully replicated in this sample of adult German ADHD participants.
Keywords: ADHD, adult ADHD, adult ADHD assessment, diagnostic issues, Conners Adult ADHD Rating Scales (CAARS) Declaration of Conflicting Interests and funding: The author(s) declared no potential conflicts of interest with respect to the research, authorship, and/or publication of this article and received no financial support for the research, authorship, and/or publication of this article.
2
Introduction Diagnosis of adult ADHD is often
compromised by deficits in the current diagnostic systems of the Diagnostic and Statistical Manual of Mental Disorders (4th ed., DSM-IV; American Psychiatric Association, 1994) and International Classification of Diseases–10th Revision (ICD-10) in that these diagnostic systems do not include criteria appropriate for adult symptoms (Bell, 2011; Faraone et al., 2006). To assess persistent ADHD symptoms in adults, several instruments have been developed (for a review, see Rösler, Retz, & Stieglitz, 2010). Among these, the Conners Adult ADHD Rating Scales (CAARS) are frequently used (Davidson, 2008; Weiss & Murray, 2003). Due to the need in German speaking countries for an instrument that accurately assesses adult ADHD symptoms according to research criteria, the CAARS were translated into the German language. To obtain information on factor structure and cross-cultural comparability of the German version, a confirmatory factor analysis with the original 42 items of the Conners Adult ADHD Rating Scales–Self-Report (CAARS-S) was performed. In a large sample of healthy control participants, this analysis showed a very good fit with the established factors representing inattention/memory prob-lems, hyperactivity/restlessness, impuls-ivity/emotional lability, and problems with self-concept (Christiansen, Kis, Hirsch, Philipsen, et al., 2011). To confirm those results in a sample with ADHD participants, the CAARS-S ratings of adults diagnosed with ADHD were collected and are analyzed here. We address the following questions: Is the original American factor structure, as shown in the confirmatory analysis for healthy German controls, also replicable in a sample of ADHD participants? Is the original American model equivalent in German healthy controls and German participants
with ADHD? Is it possible to locate individuals on each of the established scales? Finally, do age, gender, and education influence CAARS-S ratings for ADHD participants? Method
Participants This is a cross-sectional study on
healthy German adults and German participants diagnosed with ADHD. We report data from 851 healthy control participants (for details on this sample, see Christiansen, Kis, Hirsch, Philipsen, et al., 2011; one additional control particip-ant is included in the current report) and 466 participants with ADHD. These consisted of 366 participants with ADHD contributing baseline data from sub-cohorts of two multi-center ADHD treat-ment studies. One of these was conducted in mothers with ADHD (for details, see Jans et al., 2009; Philipsen et al., 2010), and the other with 100 additional ADHD participants from the University of Duisburg-Essen. All participants were off medication prior to assessment — 6 months off ADHD specific medication and 2 weeks off any psychiatric medication, such as antidepressants. They were diag-nosed with a structured clinical interview, with the ADHD diagnostic checklist for adults (Roesler et al., 2004), and also with a self-rating questionnaire, namely, the German version of the Wender Utah Rating Scale that retrospectively assesses the continuity with childhood ADHD symptoms (Retz-Junginger et al., 2002, 2003; for details on this sample, see Christiansen, Kis, Hirsch, Matthies, et al., 2011).
Study protocols in accord with the
criteria of the Declaration of Helsinki were reviewed and approved by the local institutional review boards. Written informed consent was obtained from all participants, and their confidentiality was
3
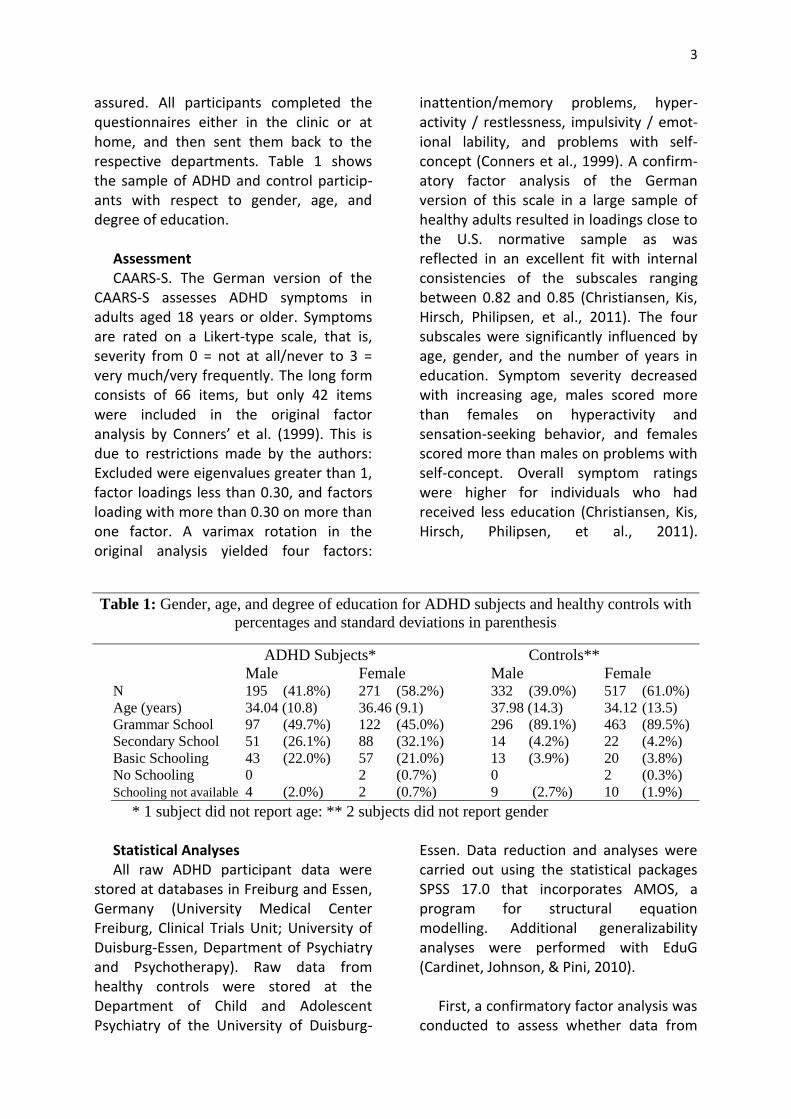
assured. All participants completed the questionnaires either in the clinic or at home, and then sent them back to the respective departments. Table 1 shows the sample of ADHD and control particip-ants with respect to gender, age, and degree of education.
Assessment CAARS-S. The German version of the
CAARS-S assesses ADHD symptoms in adults aged 18 years or older. Symptoms are rated on a Likert-type scale, that is, severity from 0 = not at all/never to 3 = very much/very frequently. The long form consists of 66 items, but only 42 items were included in the original factor analysis by Conners’ et al. (1999). This is due to restrictions made by the authors: Excluded were eigenvalues greater than 1, factor loadings less than 0.30, and factors loading with more than 0.30 on more than one factor. A varimax rotation in the original analysis yielded four factors:
inattention/memory problems, hyper-activity / restlessness, impulsivity / emot-ional lability, and problems with self-concept (Conners et al., 1999). A confirm-atory factor analysis of the German version of this scale in a large sample of healthy adults resulted in loadings close to the U.S. normative sample as was reflected in an excellent fit with internal consistencies of the subscales ranging between 0.82 and 0.85 (Christiansen, Kis, Hirsch, Philipsen, et al., 2011). The four subscales were significantly influenced by age, gender, and the number of years in education. Symptom severity decreased with increasing age, males scored more than females on hyperactivity and sensation-seeking behavior, and females scored more than males on problems with self-concept. Overall symptom ratings were higher for individuals who had received less education (Christiansen, Kis, Hirsch, Philipsen, et al., 2011).
Table 1: Gender, age, and degree of education for ADHD subjects and healthy controls with
percentages and standard deviations in parenthesis
ADHD Subjects* Controls**
Male Female Male Female N 195 (41.8%) 271 (58.2%) 332 (39.0%) 517 (61.0%)
Age (years) 34.04 (10.8) 36.46 (9.1) 37.98 (14.3) 34.12 (13.5)
Grammar School 97 (49.7%) 122 (45.0%) 296 (89.1%) 463 (89.5%)
Secondary School 51 (26.1%) 88 (32.1%) 14 (4.2%) 22 (4.2%)
Basic Schooling 43 (22.0%) 57 (21.0%) 13 (3.9%) 20 (3.8%)
No Schooling 0 2 (0.7%) 0 2 (0.3%)
Schooling not available 4 (2.0%) 2 (0.7%) 9 (2.7%) 10 (1.9%)
* 1 subject did not report age: ** 2 subjects did not report gender
Statistical Analyses All raw ADHD participant data were
stored at databases in Freiburg and Essen, Germany (University Medical Center Freiburg, Clinical Trials Unit; University of Duisburg-Essen, Department of Psychiatry and Psychotherapy). Raw data from healthy controls were stored at the Department of Child and Adolescent Psychiatry of the University of Duisburg-
Essen. Data reduction and analyses were carried out using the statistical packages SPSS 17.0 that incorporates AMOS, a program for structural equation modelling. Additional generalizability analyses were performed with EduG (Cardinet, Johnson, & Pini, 2010).
First, a confirmatory factor analysis was
conducted to assess whether data from
4
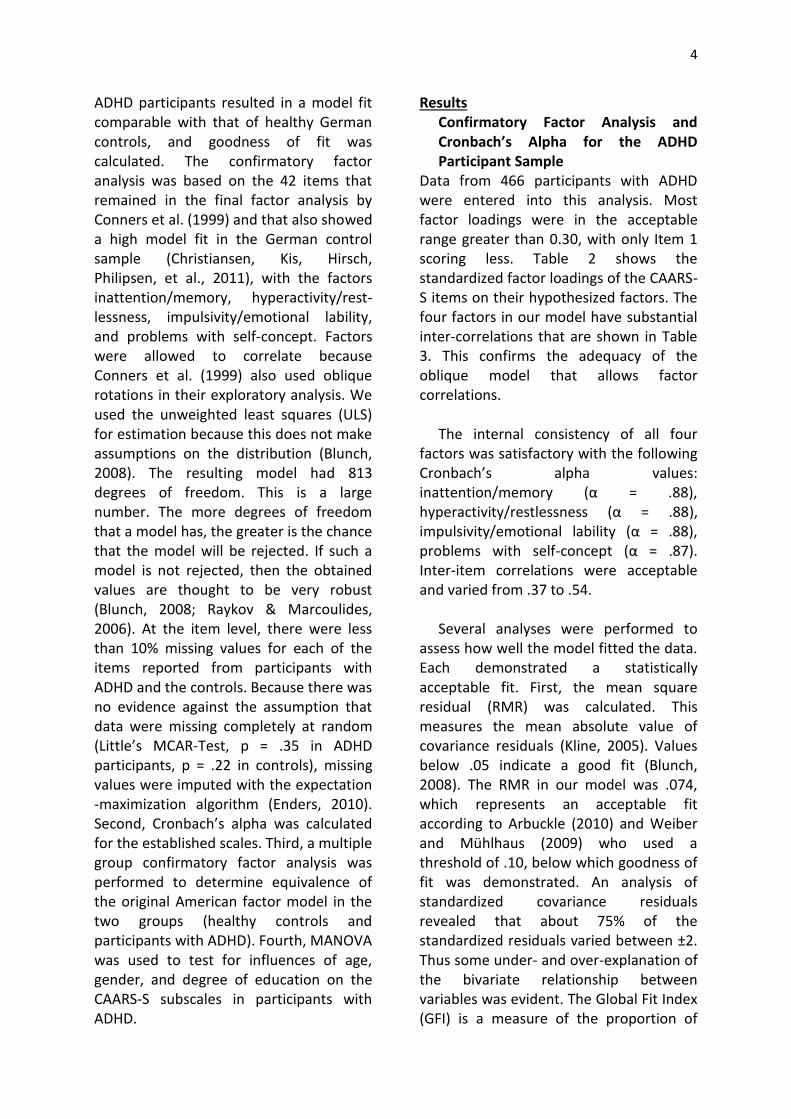
ADHD participants resulted in a model fit comparable with that of healthy German controls, and goodness of fit was calculated. The confirmatory factor analysis was based on the 42 items that remained in the final factor analysis by Conners et al. (1999) and that also showed a high model fit in the German control sample (Christiansen, Kis, Hirsch, Philipsen, et al., 2011), with the factors inattention/memory, hyperactivity/rest-lessness, impulsivity/emotional lability, and problems with self-concept. Factors were allowed to correlate because Conners et al. (1999) also used oblique rotations in their exploratory analysis. We used the unweighted least squares (ULS) for estimation because this does not make assumptions on the distribution (Blunch, 2008). The resulting model had 813 degrees of freedom. This is a large number. The more degrees of freedom that a model has, the greater is the chance that the model will be rejected. If such a model is not rejected, then the obtained values are thought to be very robust (Blunch, 2008; Raykov & Marcoulides, 2006). At the item level, there were less than 10% missing values for each of the items reported from participants with ADHD and the controls. Because there was no evidence against the assumption that data were missing completely at random (Little’s MCAR-Test, p = .35 in ADHD participants, p = .22 in controls), missing values were imputed with the expectation -maximization algorithm (Enders, 2010). Second, Cronbach’s alpha was calculated for the established scales. Third, a multiple group confirmatory factor analysis was performed to determine equivalence of the original American factor model in the two groups (healthy controls and participants with ADHD). Fourth, MANOVA was used to test for influences of age, gender, and degree of education on the CAARS-S subscales in participants with ADHD.
Results Confirmatory Factor Analysis and Cronbach’s Alpha for the ADHD Participant Sample
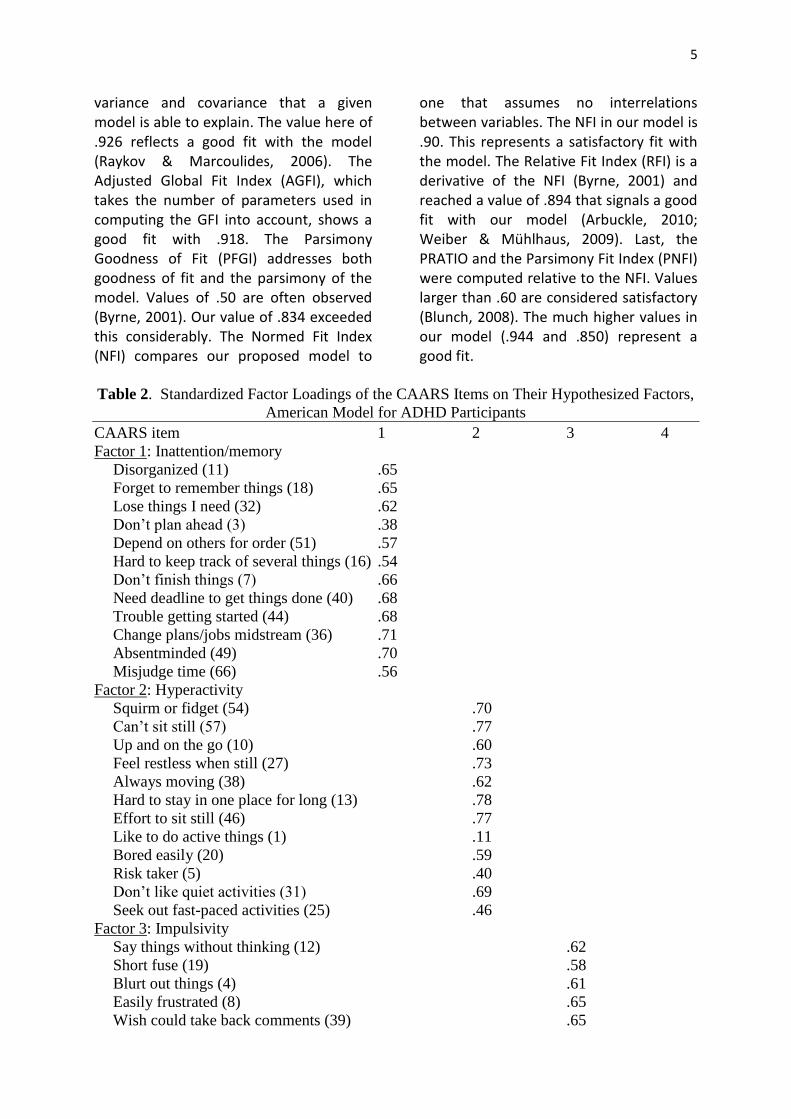
Data from 466 participants with ADHD were entered into this analysis. Most factor loadings were in the acceptable range greater than 0.30, with only Item 1 scoring less. Table 2 shows the standardized factor loadings of the CAARS-S items on their hypothesized factors. The four factors in our model have substantial inter-correlations that are shown in Table 3. This confirms the adequacy of the oblique model that allows factor correlations.
The internal consistency of all four factors was satisfactory with the following Cronbach’s alpha values: inattention/memory (α = .88), hyperactivity/restlessness (α = .88), impulsivity/emotional lability (α = .88), problems with self-concept (α = .87). Inter-item correlations were acceptable and varied from .37 to .54.
Several analyses were performed to
assess how well the model fitted the data. Each demonstrated a statistically acceptable fit. First, the mean square residual (RMR) was calculated. This measures the mean absolute value of covariance residuals (Kline, 2005). Values below .05 indicate a good fit (Blunch, 2008). The RMR in our model was .074, which represents an acceptable fit according to Arbuckle (2010) and Weiber and Mühlhaus (2009) who used a threshold of .10, below which goodness of fit was demonstrated. An analysis of standardized covariance residuals revealed that about 75% of the standardized residuals varied between ±2. Thus some under- and over-explanation of the bivariate relationship between variables was evident. The Global Fit Index (GFI) is a measure of the proportion of
5
variance and covariance that a given model is able to explain. The value here of .926 reflects a good fit with the model (Raykov & Marcoulides, 2006). The Adjusted Global Fit Index (AGFI), which takes the number of parameters used in computing the GFI into account, shows a good fit with .918. The Parsimony Goodness of Fit (PFGI) addresses both goodness of fit and the parsimony of the model. Values of .50 are often observed (Byrne, 2001). Our value of .834 exceeded this considerably. The Normed Fit Index (NFI) compares our proposed model to
one that assumes no interrelations between variables. The NFI in our model is .90. This represents a satisfactory fit with the model. The Relative Fit Index (RFI) is a derivative of the NFI (Byrne, 2001) and reached a value of .894 that signals a good fit with our model (Arbuckle, 2010; Weiber & Mühlhaus, 2009). Last, the PRATIO and the Parsimony Fit Index (PNFI) were computed relative to the NFI. Values larger than .60 are considered satisfactory (Blunch, 2008). The much higher values in our model (.944 and .850) represent a good fit.
Table 2. Standardized Factor Loadings of the CAARS Items on Their Hypothesized Factors,
American Model for ADHD Participants
CAARS item 1 2 3 4
Factor 1: Inattention/memory
Disorganized (11) .65
Forget to remember things (18) .65
Lose things I need (32) .62
Don’t plan ahead (3) .38
Depend on others for order (51) .57
Hard to keep track of several things (16) .54
Don’t finish things (7) .66
Need deadline to get things done (40) .68
Trouble getting started (44) .68
Change plans/jobs midstream (36) .71
Absentminded (49) .70
Misjudge time (66) .56
Factor 2: Hyperactivity
Squirm or fidget (54) .70
Can’t sit still (57) .77
Up and on the go (10) .60
Feel restless when still (27) .73
Always moving (38) .62
Hard to stay in one place for long (13) .78
Effort to sit still (46) .77
Like to do active things (1) .11
Bored easily (20) .59
Risk taker (5) .40
Don’t like quiet activities (31) .69
Seek out fast-paced activities (25) .46
Factor 3: Impulsivity
Say things without thinking (12) .62
Short fuse (19) .58
Blurt out things (4) .61
Easily frustrated (8) .65
Wish could take back comments (39) .65
6
Annoy other people (52) .63
Throw tantrums (23) .48
Step on peoples’ toes (43) .64
Moods unpredictable (47) .62
Interrupt others when talking (35) .63
Things set me off easily (30) .58
Irritable (61) .60
Factor 4: Self-concept
Not sure of self (15) .74
Wish had greater confidence (56) .83
Get down on self (6) .61
Act okay outside, but unsure of self (37) .82
Past failures/hard to believe in self (63) .76
Avoid new challenges (26) .66
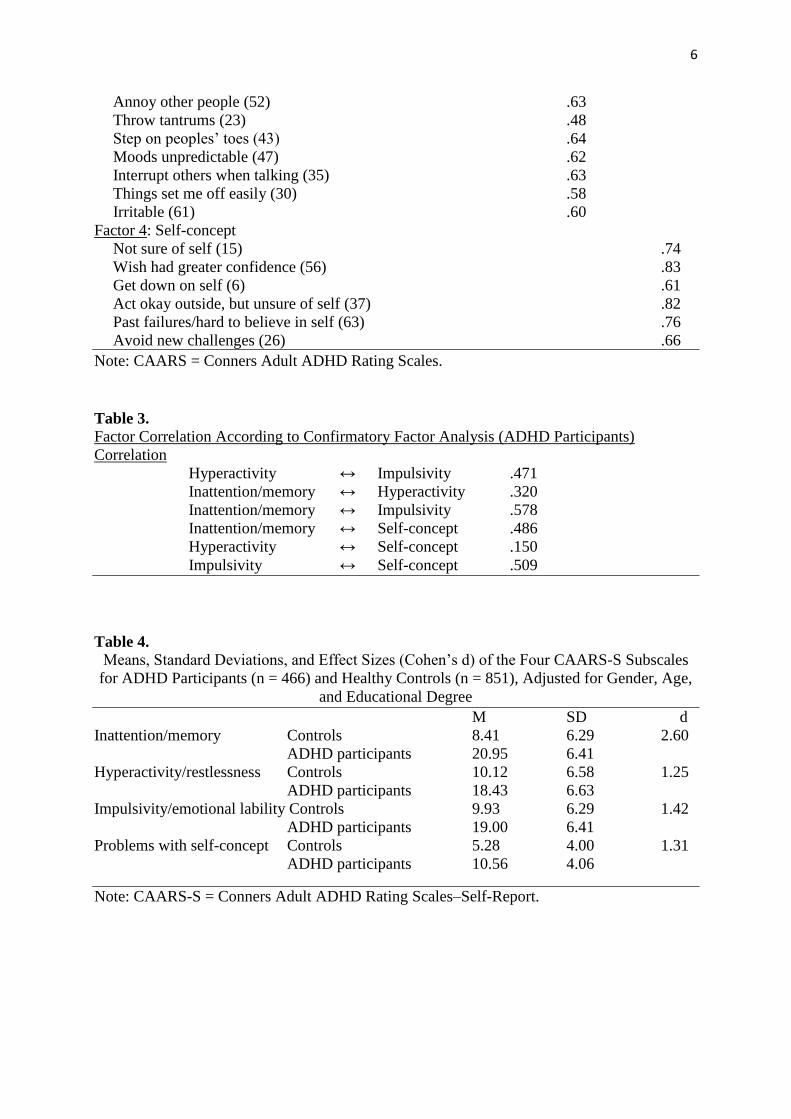
Note: CAARS = Conners Adult ADHD Rating Scales.
Table 3.
Factor Correlation According to Confirmatory Factor Analysis (ADHD Participants)
Correlation
Hyperactivity ↔ Impulsivity .471
Inattention/memory ↔ Hyperactivity .320
Inattention/memory ↔ Impulsivity .578
Inattention/memory ↔ Self-concept .486
Hyperactivity ↔ Self-concept .150
Impulsivity ↔ Self-concept .509
Table 4.
Means, Standard Deviations, and Effect Sizes (Cohen’s d) of the Four CAARS-S Subscales
for ADHD Participants (n = 466) and Healthy Controls (n = 851), Adjusted for Gender, Age,
and Educational Degree
M SD d
Inattention/memory Controls 8.41 6.29 2.60
ADHD participants 20.95 6.41
Hyperactivity/restlessness Controls 10.12 6.58 1.25
ADHD participants 18.43 6.63
Impulsivity/emotional lability Controls 9.93 6.29 1.42
ADHD participants 19.00 6.41
Problems with self-concept Controls 5.28 4.00 1.31
ADHD participants 10.56 4.06
Note: CAARS-S = Conners Adult ADHD Rating Scales–Self-Report.
7
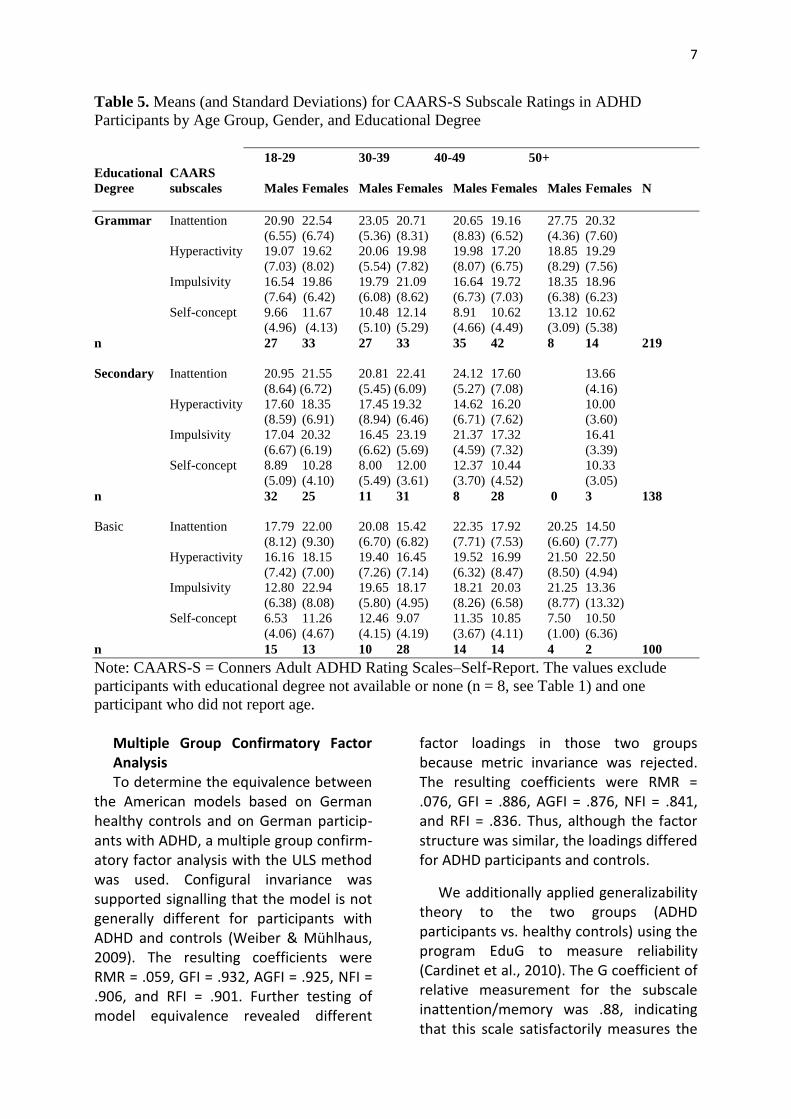
Table 5. Means (and Standard Deviations) for CAARS-S Subscale Ratings in ADHD
Participants by Age Group, Gender, and Educational Degree
18-29 30-39 40-49 50+
Educational CAARS
Degree subscales Males Females Males Females Males Females Males Females N
Grammar Inattention 20.90 22.54 23.05 20.71 20.65 19.16 27.75 20.32
(6.55) (6.74) (5.36) (8.31) (8.83) (6.52) (4.36) (7.60)
Hyperactivity 19.07 19.62 20.06 19.98 19.98 17.20 18.85 19.29
(7.03) (8.02) (5.54) (7.82) (8.07) (6.75) (8.29) (7.56)
Impulsivity 16.54 19.86 19.79 21.09 16.64 19.72 18.35 18.96
(7.64) (6.42) (6.08) (8.62) (6.73) (7.03) (6.38) (6.23)
Self-concept 9.66 11.67 10.48 12.14 8.91 10.62 13.12 10.62
(4.96) (4.13) (5.10) (5.29) (4.66) (4.49) (3.09) (5.38)
n 27 33 27 33 35 42 8 14 219
Secondary Inattention 20.95 21.55 20.81 22.41 24.12 17.60 13.66
(8.64) (6.72) (5.45) (6.09) (5.27) (7.08) (4.16)
Hyperactivity 17.60 18.35 17.45 19.32 14.62 16.20 10.00
(8.59) (6.91) (8.94) (6.46) (6.71) (7.62) (3.60)
Impulsivity 17.04 20.32 16.45 23.19 21.37 17.32 16.41
(6.67) (6.19) (6.62) (5.69) (4.59) (7.32) (3.39)
Self-concept 8.89 10.28 8.00 12.00 12.37 10.44 10.33
(5.09) (4.10) (5.49) (3.61) (3.70) (4.52) (3.05)
n 32 25 11 31 8 28 0 3 138
Basic Inattention 17.79 22.00 20.08 15.42 22.35 17.92 20.25 14.50
(8.12) (9.30) (6.70) (6.82) (7.71) (7.53) (6.60) (7.77)
Hyperactivity 16.16 18.15 19.40 16.45 19.52 16.99 21.50 22.50
(7.42) (7.00) (7.26) (7.14) (6.32) (8.47) (8.50) (4.94)
Impulsivity 12.80 22.94 19.65 18.17 18.21 20.03 21.25 13.36
(6.38) (8.08) (5.80) (4.95) (8.26) (6.58) (8.77) (13.32)
Self-concept 6.53 11.26 12.46 9.07 11.35 10.85 7.50 10.50
(4.06) (4.67) (4.15) (4.19) (3.67) (4.11) (1.00) (6.36)
n 15 13 10 28 14 14 4 2 100
Note: CAARS-S = Conners Adult ADHD Rating Scales–Self-Report. The values exclude
participants with educational degree not available or none (n = 8, see Table 1) and one
participant who did not report age.
Multiple Group Confirmatory Factor Analysis To determine the equivalence between
the American models based on German healthy controls and on German particip-ants with ADHD, a multiple group confirm-atory factor analysis with the ULS method was used. Configural invariance was supported signalling that the model is not generally different for participants with ADHD and controls (Weiber & Mühlhaus, 2009). The resulting coefficients were RMR = .059, GFI = .932, AGFI = .925, NFI = .906, and RFI = .901. Further testing of model equivalence revealed different
factor loadings in those two groups because metric invariance was rejected. The resulting coefficients were RMR = .076, GFI = .886, AGFI = .876, NFI = .841, and RFI = .836. Thus, although the factor structure was similar, the loadings differed for ADHD participants and controls.
We additionally applied generalizability theory to the two groups (ADHD participants vs. healthy controls) using the program EduG to measure reliability (Cardinet et al., 2010). The G coefficient of relative measurement for the subscale inattention/memory was .88, indicating that this scale satisfactorily measures the
8
degree of difficulties in attention and memory of the individual participant and that it is possible to compare one individual with another. The G coefficient of absolute measurement was .87 and signals that it is possible to establish the location of each individual on this scale. The G coefficients of relative and absolute measurement were very similar on the other scales: hyperactivity/restlessness (relative .88, absolute .87), impulsivity/ emotional lability (relative .87, absolute .86), problems with self-concept (relative .87, absolute .86).
A MANOVA controlling for gender, age, and degree of education resulted in a significant group effect, Wilks’s Lambda = .79, F(4, 1265) = 81.47, p < .001, η2 = .21. All univariate differences on the four CAARS-S subscales were significantly different between ADHD participants and controls (all p < .001). Table 4 lists adjusted means, standard deviations, and effect sizes for each subscale. All differences were large according to Cohen (1988), with the largest effect on the inattention subscale.
ADHD Participants Data A MANOVA for the four CAARS-S
subscales with ADHD participants only resulted in significant main effects for gender, Wilks’s Lambda = .04, F(5, 430) = 3.817, p = .002, η2 = .043; age group, Wilks’s Lambda = .103, F(15, 1187) = 100.88, p < .001, η2 = .531; and degree of education, Wilks’s Lambda = .92, F(10, 862) = 3.37, p < .001, η2 = .038 as well as for the three-way-interaction, Gender × Age Group × Degree of Education, Wilks’s Lambda = .89, F(25, 1598) = 1.87, p = .006, η2 = .021, indicating that interpretations of these subscales are dependent on these socio-demographic influences. The means and standard deviations for the CAARS-S subscales are presented separately for gender, age groups, and degree of education (see Table 5).
Discussion Applying the German version of the
CAARS-S in a large sample of participants diagnosed with ADHD, we were able to replicate the factor structure of the original American version. A confirmatory factor analysis with the original 42 items that already showed high model fit in a sample of healthy German controls loaded on the four factors, inattention/memory problems, hyperactivity/restlessness, im-pulsivity/emotional lability, and problems with self-concept, and showed a very good model fit in the German ADHD sample. Internal consistencies of all subscales were satisfactory. Multiple group factor analysis also confirmed equivalence and a high model fit of factor structure for ADHD participants and controls even with different factor loadings. Factor loadings here were slightly higher in ADHD participants than in the healthy control sample and closer to the original American factor solution. Some items showed a fairly low loading, most probably due to restrictions made by confirmatory procedures and the inclusion of items that were excluded in the German exploratory analysis due to low loadings (Christiansen, Kis, Hirsch, Philipsen, et al., 2011). Still, loadings and model fit were sufficient for the factor structure in this German sample of ADHD participants to prove comparable with the American original and to a large German control group. Cross-cultural comparability of scales is thus given.
Factor correlations were highest between impulsivity and all other subscales showing the strong correlation between pervasively impulsive symptoms and the other core adult ADHD symptoms (Barkley & Fischer, 2010). Correlations between self-concept and hyperactivity were low, but high for self-concept and inattention. This replicates findings of our first study that revealed the two second-order factors, impulsivity/hyperactivity and problems with self-concept/
9
inattention (Christiansen, Kis, Hirsch, Philipsen, et al., 2011).
Methods of generalizability theory demonstrated that all subscales satisfact-orily assess the degree of impairment for individual participants and allow compar-isons between individuals. Comparisons between ADHD participants and controls showed significantly higher ratings on all subscales for ADHD participants resulting in very large effects according to Cohen (1988). These psychometric properties are highly relevant for clinical assessment of adult ADHD.
In accord with key findings of the literature (Costello, Mustillo, Erkanli, Keeler, & Angold, 2003; Fleitlich-Bilyk & Goodman, 2004; Huss, Hölling, Kurth, & Schlack, 2008; Rowland, Lesesne, & Abramowitz, 2002; Weiss et al., 2010) and our study on healthy individuals and the CAARS-S (Christiansen, Kis, Hirsch, Philipsen, et al., 2011), age, degree of education, and gender significantly influenced CAARS-S subscale ratings that should thus be taken into consideration when rating and interpreting the CAARS-S.
Limitations In our sample of ADHD participants,
there were more females than males. This is due to the subgroup of mothers with ADHD in the described treatment study (Jans et al., 2009). But overall males were only exceeded by 76 females in the ADHD sample, and the ratio of males to females is similar to the control sample analyzed here.
Participants in both samples tended to have a higher level of education and those with more education might more readily participate in a study than participants with lower educational backgrounds. This may present a recruitment bias.
The study also lacks larger numbers of ADHD participants in the older age groups.
Younger participants are overrepresented. On the other hand, participants seeking help are overall younger, and because our ADHD data were from the corresponding clinical departments of university hospitals, this feature is likely reflected in this study.
Clinical Implications Sound diagnostic assessment of
individuals is highly important for clinical practice and for any study on adult ADHD. The results of our study make it possible to locate participants individually on all CAARS-S subscales and thus the requirements for estimation of the personal symptom load on the four subscales are met.
Symptoms of inattention appear to be strongly linked to reduced self-concept, as reflected in the correlation between inattention and self-concept. This might be an important target for therapeutic interventions. Treatment studies have shown promising results for all core ADHD symptoms, but especially so for inattention (Grevensleben et al., 2009; Grevensleben et al., 2010; Weiss et al., 2010). In a recent study, inattention proved to be a strong mediator for quality of life in adult ADHD participants (Weiss et al., 2010). A reduction in attention/ memory problems might thus improve self-concept in participants with ADHD while also enhancing quality of life.
Conclusion The results replicate findings of our first
study that already confirmed a high model fit for the German version of the CAARS-S with the original American scale in confirmatory factor analysis. Cross-valid-ation with ratings from close associates or significant family members are not reported in this article, but they meet psychometric standards, as do values for concurrent, criterion, and discriminant validity; test–retest reliability; sensitivity;
10
and specificity (Christiansen, Kis, Hirsch, Matthies, et al., 2011). The German CAARS-S thus proves to be a sound instrument for assessing adult ADHD symptoms.
References American Psychiatric Association. (1994).
Diagnostic and statistical manual of mental disorders (4th ed.). Washington, DC: Author.
Arbuckle, J. L. (2010). AmosTM17.0 User’s Guide. Chicago, IL: SPSS.
Barkley, R. A., & Fischer, M. (2010). The unique contribution of emotional impulsiveness to impairment in major life activities in hyperactive children as adults. Journal of the American Academy of Child & Adolescent Psychiatry, 49, 503-513.
Bell, A. (2011). A critical review of ADHD diagnostic criteria: What to address in the DSM-V. Journal of Attention Disorders, 15, 3-10.
Blunch, N. J. (2008). Introduction to structural equation modelling using SPSS and AMOS. London, England: SAGE.
Byrne, B. (2001). Structural equation modelling with AMOS: Basic concepts, applications, and programming. Mahwah, NJ: Erlbaum.
Cardinet, J., Johnson, S., & Pini, G. (2010). Applying generalizability theory using. EduG. New York, NY: Routledge.
Christiansen, H., Kis, B., Hirsch, O., Matthies, S., Hebebrand, J., Uekermann, J., . . . Philipsen, A. (2011). German validation of the Conners Adult ADHD Rating Scales (CAARS) II: Reliability, validity, diagnostic sensitivity and specificity. European Psychiatry,doi:10.1016/j.eurpsy.2010.12.010
Christiansen, H., Kis, B., Hirsch, O., Philipsen, A., Henneck, M., Panczuk, A., . . . Schimmelmann, B. G. (2011). German validation of the Conners Adult ADHD Rating Scales - Self-Report
(CAARS-S) I: Factor structure and normative data. European Psychiatry, 26, 100-107.
Cohen, J. (1988). Statistical power analysis for the behavioral sciences. Mahwah, NJ: Erlbaum.
Conners, C. K., Erhardt, D., Epstein, J. N., Parker, J. D. A., Sitarenios, G., & Sparrow, E. (1999). Self-ratings of ADHD symptoms in adults I: Factor structure and normative data. Journal of Attention Disorders, 3, 141-151.
Costello, E. J., Mustillo, S., Erkanli, A., Keeler, G., & Angold, A. (2003). Prevalence and development of psychiatric disorders in childhood and adolescence. Archives of General Psychiatry, 60, 837-844.
Davidson, M. A. (2008). ADHD in adults: A review of the literature. Journal of Attention Disorders, 11, 628-641.
Enders, C. K. (2010). Applied missing data analysis. New York, NY: Guilford.
Faraone, S. V., Biederman, J., Spencer, T., Mick, E., Murray, K., Petty, C., . . . Monuteaux, M. C. (2006). Diagnosing adult attention deficit hyperactivity disorder: Are late onset and subthreshold diagnoses valid? American Journal of Psychiatry, 163, 1720-1729.
Fleitlich-Bilyk, B., & Goodman, R. (2004). Prevalence of child and adolescent psychiatric disorders in southeast Brazil. Journal of the American Academy of Child & Adolescent Psychiatry, 43, 727-734.
Grevensleben, H., Holl, B., Albrecht, B., Schlamp, D., Kratz, O., Studer, P., . . . Heinrich, H. (2009). Distinct EEG effects related to neurofeedback training in children with ADHD: A randomized controlled trial. International Journal of Psychophysiology, 74, 149-157.
Grevensleben, H., Holl, B., Albrecht, B., Schlamp, D., Kratz, O., Studer, P., . . . Heinrich, H. (2010). Neurofeedback training in children with ADHD: 6-
11
month follow-up of a randomised controlled trial. European Child and Adolescent Psychiatry, 19, 715-724.
Huss, M., Hölling, H., Kurth, B. M., & Schlack, R. (2008). How often are German children and adolescents diagnosed with ADHS? Prevalence based on the judgment of health care professionals: Results of the German health and examination survey (KiGGS). European Child and Adolescent Psychiatry, 17, 52-58.
Jans, T., Philipsen, A., Graf, E., Ihorst, G., Gerlach, M., & Warnke, A. (2009). Does the treatment of maternal attention deficit and hyperactivity disorder (ADHD) enhance the efficacy of a behavioural parent training for the treatment of their children’s ADHD? Study protocol of a randomized controlled multicentre trial. ADHD Attention Deficit and Hyperactivity Disorders, 1, 33-45. Retrieved from http://dx.doi.org/10.1007/s12402-009-0004-4
Kline, R. B. (2005). Principles and practice of structural equation modelling. New York, NY: Guilford.
Philipsen, A., Graf, E., van Elst, L. T., Jans, T., Warnke, A., Hesslinger, B., . . . Berger, M. (2010). Evaluation of the efficacy and effectiveness of a structured disorder tailored psycho-therapy in ADHD in adults: Study protocol of a randomized controlled multicentre trial. Attention Deficit and Hyperactivity Disorders, 2, 203-212. Retrieved from http://dx.doi.org/ 10.1007/s12402-010- 0046-7
Raykov, T., & Marcoulides, G. A. (2006). A first course in structural equation modelling. Mahwah, NJ: Erlbaum.
Retz-Junginger, P., Retz, W., Blocher, D., Stieglitz, R. D., Georg, T., Supprian, T., . . . Rösler, M. (2003). Reliabilität und Validität der Wender-Utah-Rating-Scale Kurzform. Retrospektive Erfassung von Symptomen aus dem Spektrum der
Aufmerksamkeitsdefizit/Hyperaktivitätsstörung. Nervenarzt, 74, 987-993.
Retz-Junginger, P., Retz, W., Blocher, D., Weijers, H. G., Trott, G. E., Wender, P. H., & Rössler, M. (2002). Wender Utah Rating Scale (WURS-k). Nervenarzt, 73, 830-838.
Rösler, M., Retz, W., Retz-Junginger, P., Thome, J., Supprian, T., Nissen, T., . . . Trott, G. E. (2004). Instrumente zur Diagnostik der Aufmerksamkeitsdefizit-/Hyperaktivitätsstörung (ADHS) im Erwachsenenalter. Selbstbeurteilungs-skala (ADHS-SB) und Diagnosecheckliste (ADHS-DC). Nervenarzt, 75, 888-895.[AQ: 9]
Rösler, M., Retz, W., & Stieglitz, R. D. (2010). Psychopathological Rating Scales as efficacy parameters in adult ADHD treatment investigations—Benchmarking Instruments for International Multicenter Trials. Pharmacopsychiatry, 43, 92-98.
Rowland, A. S., Lesesne, C. A., & Abramowitz, A. J. (2002). The epidemiology of attention-deficit/ hyperactivity disorder (ADHD): A public health view. Mental Retardation and Developmental Disabilities Research Reviews, 8, 162-170.
Weiber, R., & Mühlhaus, D. (2009). Strukturgleichungsmodellierung [Structural Equation Modeling]. Berlin, Germany: Springer.
Weiss, M. D., Gibbins, C., Goodman, D. W., Hodgkins, P. S., Landgraf, J. M., & Faraone, S. V. (2010). Moderators and mediators of symptoms and quality of life outcomes in an open-label study of adults treated for attention-deficit/ hyperactivity disorder. Journal of Clinical Psychiatry, 71, 381-390.
Weiss, M. D., & Murray, C. (2003). Assessment and management of attention-deficit hyperactivity disorder in adults. Canadian Medical Association Journal, 168, 715-722.

12