Embed Size (px)
Citation preview

RMA Group 15-095-0JUNE 23, 2016
GEOTECHNICAL INVESTIGATION REPORT forPROPOSED NEW BRENTWOOD CENTER (L630)LOS MEDANOS COMMUNITY COLLEGEMIWOK AVENUE AND PIONEER SQUAREBRENTWOOD, CA
ATTN: BEN AZARNOUSHCONTRA COSTA COMMUNITY COLLEGE DISTRICT 500 COURT STREETMARTINEZ, CA 94553


GEOTECHNICAL CONSULTANTS
GEOTECHNICAL INVESTIGATION FOR
PROPOSED NEW BRENTWOOD CENTER (L-630) LOS MEDANOS COMMUNITY COLLEGE
MIWOK AVENUE AND PIONEER SQUARE BRENTWOOD, CA
for
Contra Costa Community College District 500 Court Street
Martinez, CA 94553
June 23, 2016
15-095-0

GEOTECHNICAL CONSULTANTS
Brentwood Campus June 23, 2016 Contra Costa Community College District RMA Job No.: 15-095-0 Page i
TABLE OF CONTENTS PAGE
1.00 INTRODUCTION 1
1.01 Purpose 1 1.02 Scope of the Investigation 1 1.03 Site Location and Description 1 1.04 Current and Past Land Usage 2 1.05 Planned Usage 2 1.06 Investigation Methods 2
2.00 FINDINGS 3
2.01 Geologic Setting 3 2.02 Prior Geotechnical Reports 3 2.03 Earth Materials 3 2.04 Expansive Soils 4 2.05 Surface and Groundwater Conditions 4 2.06 Faults 4 2.07 Historic Seismicity 4 2.08 Flooding Potential 4 2.09 Landslides 5 2.10 Other Geologic Hazard Considerations 6
3.00 CONCLUSIONS AND RECOMMENDATIONS 7
3.01 General Conclusion 7 3.02 General Earthwork and Grading 7 3.03 Earthwork Shrinkage and Subsidence 7 3.04 Removals and Overexcavation 7 3.05 Rippability and Rock Disposal 8 3.06 Subdrains 8 3.07 Fill and Cut Slopes 8 3.08 Faulting 8 3.09 Seismic Design Parameters 9 3.10 Liquefaction and Secondary Earthquake Hazards 9 3.11 Foundations 11 3.12 Foundation Setbacks from Slopes 12 3.13 Slabs on Grade 12 3.14 Miscellaneous Concrete Flatwork 13
GEOTECHNICAL CONSULTANTS
Brentwood Campus June 23, 2016 Contra Costa Community College District RMA Job No.: 15-095-0 Page ii
TABLE OF CONTENTS (Continued)
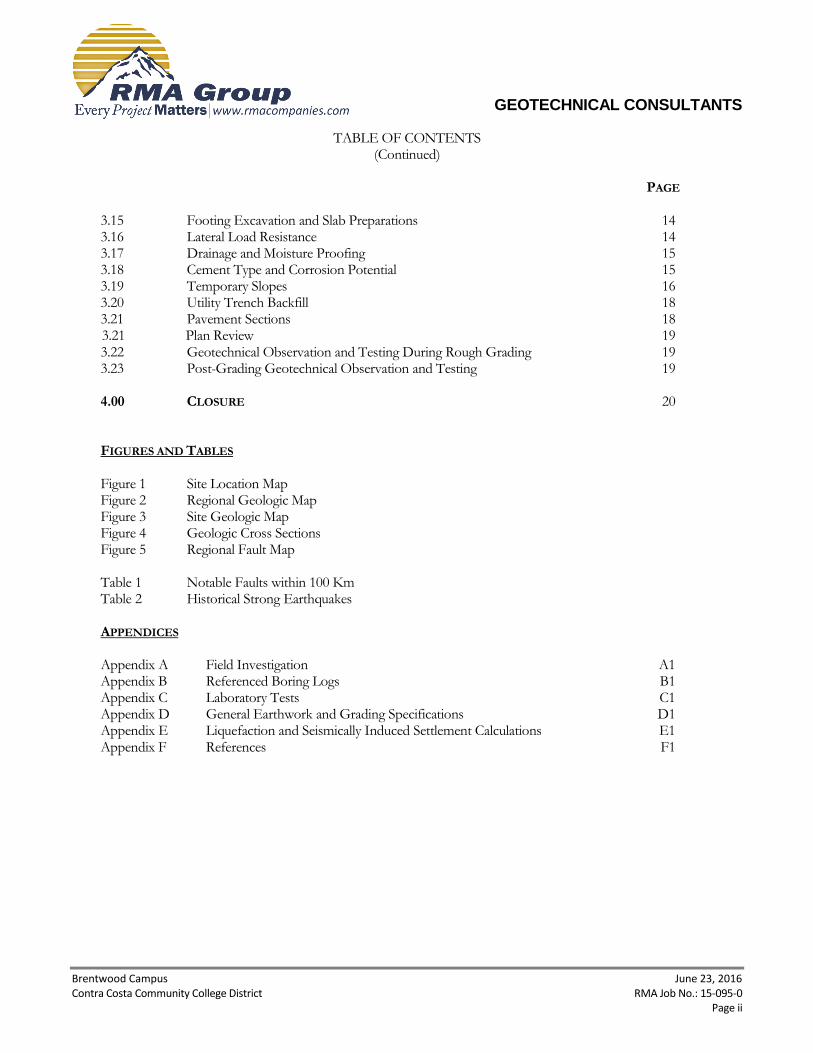
PAGE 3.15 Footing Excavation and Slab Preparations 14 3.16 Lateral Load Resistance 14 3.17 Drainage and Moisture Proofing 15 3.18 Cement Type and Corrosion Potential 15 3.19 Temporary Slopes 16 3.20 Utility Trench Backfill 18 3.21 Pavement Sections 18 3.21 Plan Review 19 3.22 Geotechnical Observation and Testing During Rough Grading 19 3.23 Post-Grading Geotechnical Observation and Testing 19 4.00 CLOSURE 20 FIGURES AND TABLES Figure 1 Site Location Map Figure 2 Regional Geologic Map Figure 3 Site Geologic Map Figure 4 Geologic Cross Sections Figure 5 Regional Fault Map Table 1 Notable Faults within 100 Km Table 2 Historical Strong Earthquakes APPENDICES Appendix A Field Investigation A1 Appendix B Referenced Boring Logs B1 Appendix C Laboratory Tests C1 Appendix D General Earthwork and Grading Specifications D1 Appendix E Liquefaction and Seismically Induced Settlement Calculations E1 Appendix F References F1

GEOTECHNICAL CONSULTANTS
New Brentwood Center (L-630) June 23, 2016 Contra Costa Community College District RMA Job No.: 15-095-0 Page 1
1.00 INTRODUCTION
1.01 Purpose
A geotechnical investigation has been completed for the proposed New Brentwood Center extension campus of Los Medanos Community College in Brentwood, California. The purpose of the investigation was to summarize geotechnical and geologic conditions at the site, to assess their potential impact on the proposed development, and to develop geotechnical and engineering geologic design parameters.
1.02 Scope of the Investigation
The general scope of this investigation included the following:
Review of published and unpublished geologic, seismic, groundwater and geotechnical literature.
Examination of aerial photographs.
Contacting of underground service alert to locate onsite utility lines.
Contacting the Contra Costa County Department of Environmental Health and obtaining well permits for the drilling of exploratory borings.
Logging, sampling and backfilling of 5 exploratory borings drilled with a CME-45c truck-mounted drill rig.
Laboratory testing of representative soil samples.
Geotechnical evaluation of the compiled data.
Preparation of this report presenting our findings, conclusions and recommendations.
Our scope of work did not include a preliminary site assessment for the potential of hazardous materials onsite.
1.03 Site Location and Description
The proposed construction will be located in the northeast corner of the northern-most intersection of Miwok Avenue and Pioneer Square within the City of Brentwood, Contra Costa County, California. The site is bounded by Miwok Avenue to west, a residential housing development to the north, Marsh Creek to the East, a drainage basin to the southeast, and Pioneer Square to the south (Figure 1). Its geographic position is at Latitude 37.89628° and Longitude -121.72112°. The overall gradient of the property is about 2% upwards towards the northwest corner of the site. Elevation at the site is approximately 142 feet above mean sea level. The drainage basin located southeast of the proposed structure is approximately 17 feet in depth. The roadways bounding the site to the south and west (Miwok Avenue and Pioneer Square) consist of asphalt concrete pavement with Portland cement concrete (PCC) curb and gutter. A PCC sidewalk currently lines the outside edge of Pioneer Square. Current development of the surrounding areas consist primarily of the construction of the single-family homes.

GEOTECHNICAL CONSULTANTS
New Brentwood Center (L-630) June 23, 2016 Contra Costa Community College District RMA Job No.: 15-095-0 Page 2
1.04 Current and Past Land Usage
The proposed building site is currently undeveloped and covered with seasonal grasses. Review of historical aerial photography provided by Google Earth indicates that prior to 2004, the site and surrounding areas were undeveloped. Mass grading activities associated with the construction of the adjacent residential development and construction of the drainage basin appears to begin between 2004 and 2006. Minor grading in the immediate vicinity of the proposed campus site are evident in a historical aerial photo from 2006. Residential development activities appear to be dormant from 2006 to 2014. Construction of Miwok Avenue and Pioneer Square appear to occur during 2014 and 2015.
1.05 Planned Usage
It is our understanding that the proposed construction will consist of the construction of single-story building structures to house classrooms, laboratories, student services facilities, and administrative offices. Currently, the school district is considering 3 separate building configurations for the proposed campus. Option 1 consists of a single structure with open courtyards within the interior portion of the facility. Option 2 consists of 3 independent structures separated by concrete walkways and courtyard areas. Option 3 consists of 2 adjacent structures joined by a roof. Exploratory boring locations were selected based on their compatibility with all 3 proposed building configuration options. Building footprint areas for the 3 proposed configurations is not expected to exceed 25,000 square feet. The proposed construction also included construction of parking lot within the northern portion of the site and extending from northern edge of the building structure areas to northern property line in the north/south direction and from Miwok Avenue to eastern property line in the east/west direction. Two lane access roadways connecting the parking lot to entrances on Pioneer Square are planned to be located to east and west of the proposed building structures. Our investigation was performed prior to the preparation of grading or foundation plans. To aid in preparation of this report, we utilized the following assumptions:
Maximum foundation loads of 2 to 3 kips per linear foot for continuous footings and 60 kips for isolated spread footings.
Cuts and fills will be less than 5 feet.
1.06 Investigation Methods
Our investigation consisted of office research, field exploration, laboratory testing, review of the compiled data, and preparation of this report. It has been performed in a manner consistent with generally accepted engineering and geologic principles and practices, and has incorporated requirements of California Geological Survey Note 48 and the California Buildings Code (CBC). Definitions of technical terms and symbols used in this report include those of the ASTM International, the California Building Code, and commonly used geologic nomenclature. Technical supporting data are presented in the attached appendices. Appendix A presents a description of the methods and equipment used in performing the field exploration and logs of our subsurface exploration. Appendix B presents a description of our laboratory testing and the test results. Standard grading specifications and references are presented in Appendices C and D respectively.

GEOTECHNICAL CONSULTANTS
New Brentwood Center (L-630) June 23, 2016 Contra Costa Community College District RMA Job No.: 15-095-0 Page 3
2.00 FINDINGS
2.01 Geologic Setting
The site is located on the western fringe of the Great Valley geomorphic province where it abuts the Coast Ranges geomorphic province. Great Valley, which is commonly known at the California Central Valley, is an alluvial plain situated between the Coast Ranges and Sierra Nevada Mountains that is 50 miles wide and 400 miles long. The Coast Ranges consist of northwest trending mountain ranges and valleys sedimentary, volcanic and metamorphic rocks that extend from southern California to Oregon. Within the site, approximately 25 to 35 feet of valley alluvium overly Coast Ranges sedimentary bedrock.
The regional geologic setting of the site is presented on Figure 2.
2.02 Prior Geotechnical Reports
A previous Preliminary Geologic Hazard Evaluation Report prepared by ENGEO, Inc. dated January 29, 2010 (project No. 3229.001.001) has been reviewed as part of this investigation. The previous report was prepared for the new Brentwood Center Campus, however, the conceptual design utilized for preparation of the report included the construction of two 22,000 square foot structures as opposed to the three 25,000 square foot structure layout options currently under consideration.
Data contained within Boring 1-B1 presented in the previous report, has been considered for the preparation of this report. Soils encountered in the previous investigation appear to be consistent with soils encountered in borings perform during this investigation. The approximate location of ENGEO Boring 1B-1 has been shown on the Site Geologic Map (Figure 3) and the referenced boring log has been included in Appendix B of this report
2.03 Earth Materials
Our subsurface investigation encountered artificial fill, valley alluvium and sedimentary bedrock.
Artificial fill (af) was encountered in Borings B-1, B-2, and B-3 within the upper 3 feet. The fill consists of stiff clays and dense silty sands visually classified by the Unified Soils Classification System (USCS) as CL and SM.
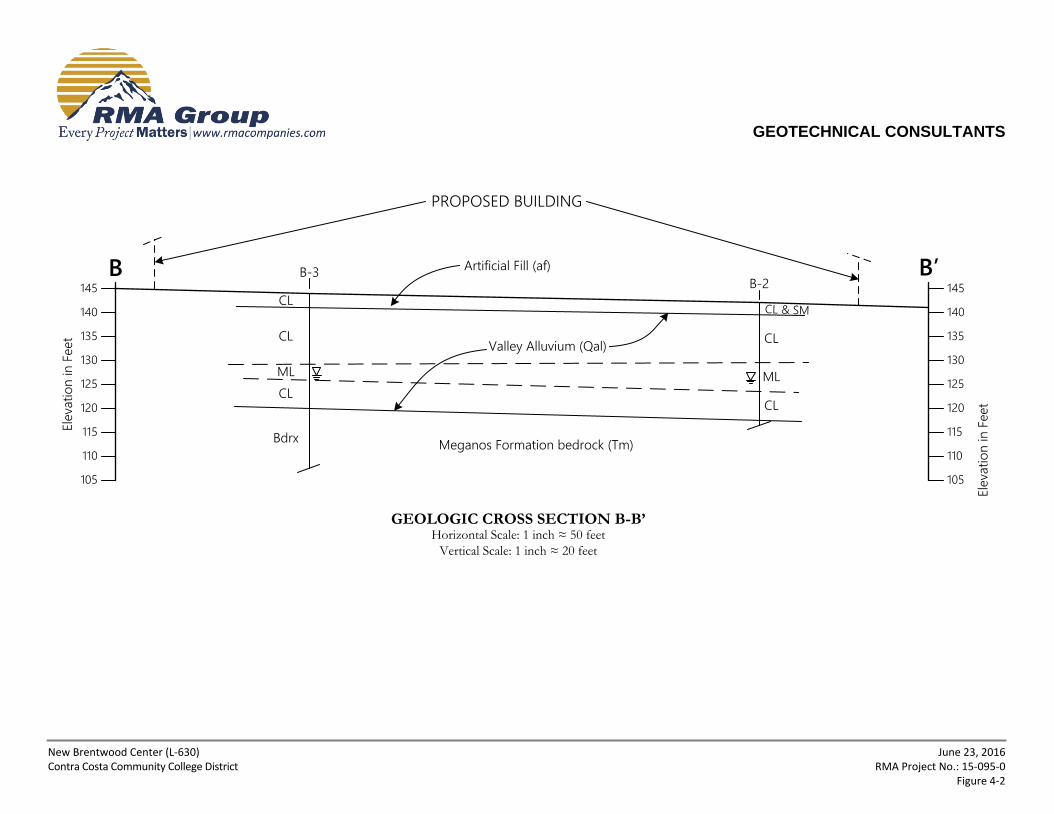
Valley alluvial deposits (Qal) encountered in our exploratory borings consisted of clays, silts, clayey sands, and silty sands visually classified by the USCS as CL, ML, SC, and SM, respectively. Occasional layers of poorly graded sands classified as SP were also encountered. The consistency of clays and silts ranged from medium stiff to hard. Compactness of sands and clayey sands ranged from medium dense to very dense.
Beneath the valley alluvium, a dark gray claystone of the Tertiary age Meganos formation (Tm) was encountered in Borings B-2, B-3 and B-5 at depths of 25, 24 and 35 feet, respectively. The bedrock was observed to be massive, dense with little weathering and moderately spaced tight fractures. The fractures dip approximately 10 to 20 degrees below horizontal suggesting the fractures could be bedding. Regional geologic mapping by Dibble (Figure 2) indicates that bedding nearby hills dip approximately 17 to 37 degrees to the northeast. A boring previously drilled approximately 100 feet to the southeast of Boring B-2 in a previous geotechnical investigation by Engeo Inc. encountered claystone bedrock at the depth of 28.5 feet, which is generally consistent with our borings. A copy of the Engeo log is presented in Appendix B.
A Site Geologic Map showing the locations of our borings and cross sections is presented as Figure 3. Geologic cross sections are presented as Figures 4-1 and 4-2.
The subsurface conditions encountered in the exploratory borings drilled at the site are described in greater detail on the logs contained in Appendix A.

GEOTECHNICAL CONSULTANTS
New Brentwood Center (L-630) June 23, 2016 Contra Costa Community College District RMA Job No.: 15-095-0 Page 4
2.04 Expansive Soils
Expansion index testing indicates that near surface soils are expansive. Expansion testing performed in accordance with ASTM D4829 indicates that earth materials underlying the site have an expansion classification of low. Results of expansion test and other soil index tests are presented in Appendix B. Our recommendations to mitigate the effects of expansive soils in foundation design are presented in Section 3.11.
2.05 Surface and Groundwater Conditions
No areas of ponding or standing water were present at the time of our study. Further, no springs or areas of natural seepage were found. Groundwater was encountered in each exploratory boring at depths ranging from 16 to 18 feet below existing ground elevation. According the Department of Water Resources, no monitoring wells are located within 5 miles of the site.
2.06 Faults
The site is not located within the boundaries of an Earthquake Fault Zone for fault-rupture hazard as defined by the Alquist-Priolo Earthquake Fault Zoning Act and no faults are known to pass through the property. The nearest earthquake fault zone is located about 6 miles to the southwest of the site along the Greenville-Marsh Creek fault. The nearest fault zones are the Sherman Island, Davis, and Midland faults located approximately 1/3 mile to the west, ¾ miles to the west, and 5 miles to the east, respectively. According to the Fault Activity Map of California, the Davis and Midland faults displace late Quaternary age deposits and the Sherman Island fault (unlabeled) is concealed and shows no evidence of displacement in Quaternary time but is not necessarily inactive. The accompanying Regional Fault Map (Figure 5) illustrates the location of the site with respect to major faults in the region. The distance to notable faults within 100 kilometers of the site is presented on Table 1.
2.07 Historic Seismicity
There have been 4 historic strong earthquakes have been epicentered within about 30 miles of the site. The magnitudes of the other earthquakes have been estimated to range from about 6.0 to 7.0 and were epicentered in San Jose, San Francisco Bay and San Joaquin Valley areas of California. These events occurred in the 1800s prior to the development of seismic monitoring networks, and thus their locations and magnitudes are only approximate. Strong earthquakes that have occurred in this region in historic time and their approximate epicentral distances are summarized in Table 2. Our research of regional geologic and seismic data did not reveal any known instances of ground failure within the site associated with regional seismic activity. Seismic design parameters relative to the requirements of the 2013 California Building Code are presented in Section 3.09 and Appendix C.
2.08 Flooding Potential
According to Federal Emergency Management Agency (2015), the site is located within Flood Zone X, which is defined as an “Area of Minimal Flood Hazard” (an area determined to be outside the 0.2% annual chance floodplain).
Control of surface runoff originating from within and outside of the site should, of course, be included in design of the project.

GEOTECHNICAL CONSULTANTS
New Brentwood Center (L-630) June 23, 2016 Contra Costa Community College District RMA Job No.: 15-095-0 Page 5
2.09 Landslides
Due to the low gradient of the site and surrounding area, landsliding is not a hazard at this property.

GEOTECHNICAL CONSULTANTS
New Brentwood Center (L-630) June 23, 2016 Contra Costa Community College District RMA Job No.: 15-095-0 Page 6
2.10 Other Geologic Hazard Considerations
California Geological Survey Note 48 (2011) identifies a number of exceptional geologic hazards that can occur at individual sites, but do not occur statewide. Evaluation of these exceptional conditions is referred to as a conditional geologic assessment by Note 48. Specific assessment items listed in Note 48 are addressed in the table below.
CONDITIONAL GEOLOGIC ASSESSMENT
Hazard Assessment Reference
Methane gas, hydrogen-sulfide gas, tar seeps
Not applicable, site is not located within an oil field.
California Division of Oil, Gas and Geothermal Resources Online Well Finder.
Volcanic eruption Not applicable, site is not in a known hazard area for volcanic eruptions.
Miller, 1989 (U.S.G.S. Bulletin 1847)
Flooding The proposed development area is not located within the boundaries of a 100-year flood zone.
See Section 2.07
Tsunami and seiches inundation
Not applicable. See Section 3.10
Radon-222 gas
Radon gas levels are generally low in Contra Costa County (only 3% at or above 4 pCi/L). Radon gass typically a concern within portions of the California Coast Ranges underlain by bedrock. Since the site is underlain by 25 feet or more of alluvium, the potential for significant radon gas at the site appears to be low, however there is no site specific testing available to confirm these observations.
See Section 2.01 and Online Contra Costa County Radon Information
Naturally occurring asbestos
Not applicable, site is not is an area more likely to contain naturally occurring asbestos and ultramafic rocks have not been mapped in the vicinity of the site.
Churchill and Hill, 2000 (DMG OFR 2000-19). Dibblee and Minch, 2006
Hydrocollapse due to anthropic use of water
Drilling data indicate that soils underlying the site consist primarily of stiff to hard clay and thus are not prone to hydrocollapse due to anthropic use of water.
See Sections 2.01, 2.02 and 3.10. Appendices A, B and D.
Regional land subsidence
Due to the shallow depth of bedrock, regional land subsidence is not expected to impact the site related to groundwater withdrawal is not expected to impact the site.
See Sections 2.01 and 2.02, and Appendix B
Clays and cyclic softening
Cyclic softening of clay is unlikely due to the in situ density of the clay. Expansive properties will be addressed by foundation design.
Appendices A and B

GEOTECHNICAL CONSULTANTS
New Brentwood Center (L-630) June 23, 2016 Contra Costa Community College District RMA Job No.: 15-095-0 Page 7
3.00 CONCLUSIONS AND RECOMMENDATIONS
3.01 General Conclusion
Based on specific data and information contained in this report, our understanding of the project and our general experience in engineering geology and geotechnical engineering, it is our professional judgment that the proposed development is geologically and geotechnically feasible. This is provided that the recommendations presented below are fully implemented during design, grading and construction.
3.02 General Earthwork and Grading
All grading should be performed in accordance with the General Earthwork and Grading Specifications outlined in Appendix C, unless specifically revised or amended below. Recommendations contained in Appendix C are general specifications for typical grading projects and may not be entirely applicable to this project. It is also recommended that all earthwork and grading be performed in accordance with Appendix J of the 2010 California Building Code (CBC) and all applicable governmental agency requirements. In the event of conflicts between this report and CBC Appendix J, this report shall govern.
3.03 Earthwork Shrinkage and Subsidence
Shrinkage is the decrease in volume of soil upon removal and recompaction expressed as a percentage of the original in-place volume. Subsidence occurs as natural ground is densified to receive fill. These factors account for changes in earth volumes that will occur during grading. Our estimates are as follows:
Shrinkage factor = 5%-10% for soil removed and replaced as compacted fill.
Subsidence factor = 0.1 - 0.2 foot.
The degree to which fill soils are compacted and variations in the insitu density of existing soils will influence earth volume changes. Consequently, some adjustments in grades near the completion of grading could be required to balance the earthwork.
3.04 Removals and Overexcavation
All vegetation, trash and debris should be cleared from the grading area and removed from the site. Prior to placement of compacted fills, all non-engineered fills and loose, porous, or compressible soils will need to be removed down to competent ground. Removal and requirements will also apply to cut areas, if the depth of cut is not sufficient to reach competent ground. Removed and/or overexcavated soils may be moisture-conditioned and recomputed as engineered fill, except for soils containing detrimental amounts of organic material. Estimated depths of removals are as follows:
It is expected that competent native soils will be encountered in cuts deeper than approximately 3 to 5 feet
below existing grade or the base of existing non-engineered fill. Provided competent soils are exposed, these
cut surfaces should be scarified to a minimum depth of 12 inches, moisture conditioned and compacted to at
least 90 percent of the maximum dry density, provided that footing overexcavation requirements are met.
Soils disturbed by demolition of existing structures will need to be over-excavated to competent native ground
and then scarified to a minimum depth of 12 inches, moisture conditioned and compacted to at least 90
percent of the maximum dry density.

GEOTECHNICAL CONSULTANTS
New Brentwood Center (L-630) June 23, 2016 Contra Costa Community College District RMA Job No.: 15-095-0 Page 8
In addition to the above requirements, overexcavation will also need to meet the following criteria for the building pads, concrete flatwork and pavement areas:
All footing areas, both continuous and spread, shall be undercut, moistened, and compacted as necessary to
produce soils compacted to a minimum of 90 percent relative compaction to a depth equal to the width of the
footing below the bottom of the footing or to a depth of 3 feet below the bottom of the footing, whichever is
less. Footing areas shall be defined as the area extending from the edge of the footing for a distance of 5 feet.
All concrete flatwork and paved areas shall be underlain by a minimum of 12 inches of non-expansive engineered
fill material compacted to a minimum of 90 percent relative compaction.
Areas containing slabs on grade shall be undercut, moistened, and compacted as necessary to produce soils
compacted to a minimum of 90 percent relative compaction to a depth of 3 feet below the bottom of the
proposed slabs on grade. The upper 24 inches of the engineered fill zone below slabs on grade shall be
composed of non-expansive material compacted to a minimum of 90 percent relative compaction
The exposed soils beneath all overexcavation should be scarified an additional 12 inches, moisture conditioned and compacted to a minimum of 90% relative compaction. The above recommendations are based on the assumption that soils encountered during field exploration are representative of soils throughout the site. However, there can be unforeseen and unanticipated variations in soils between points of subsurface exploration. Hence, overexcavation depths must be verified, and adjusted if necessary, at the time of grading. The overexcavated materials may be moisture-conditioned and re-compacted as engineered fill.
3.05 Rippability and Rock Disposal
Our exploratory trenches and borings were advanced without difficulty and no oversize materials were encountered in our subsurface investigation. Accordingly we expect that all earth materials will be rippable with conventional heavy duty grading equipment and oversized materials are not expected.
3.06 Subdrains
Since the depth to historic groundwater beneath the site is 51 feet or greater, installation of subdrains is not expected to be necessary.
3.07 Fill and Cut Slopes
Due to the low gradient of the property, it appears that construction of cut and fill slopes will not be required. If such slopes are proposed, they should be inclined no steeper than 2 to 1 (horizontal to vertical, H:V).
3.08 Faulting
Since the site is not located within the boundaries of an Earthquake Fault Zone and no faults are known to pass through the property, surface fault rupture within the site is considered unlikely.
GEOTECHNICAL CONSULTANTS
New Brentwood Center (L-630) June 23, 2016 Contra Costa Community College District RMA Job No.: 15-095-0 Page 9
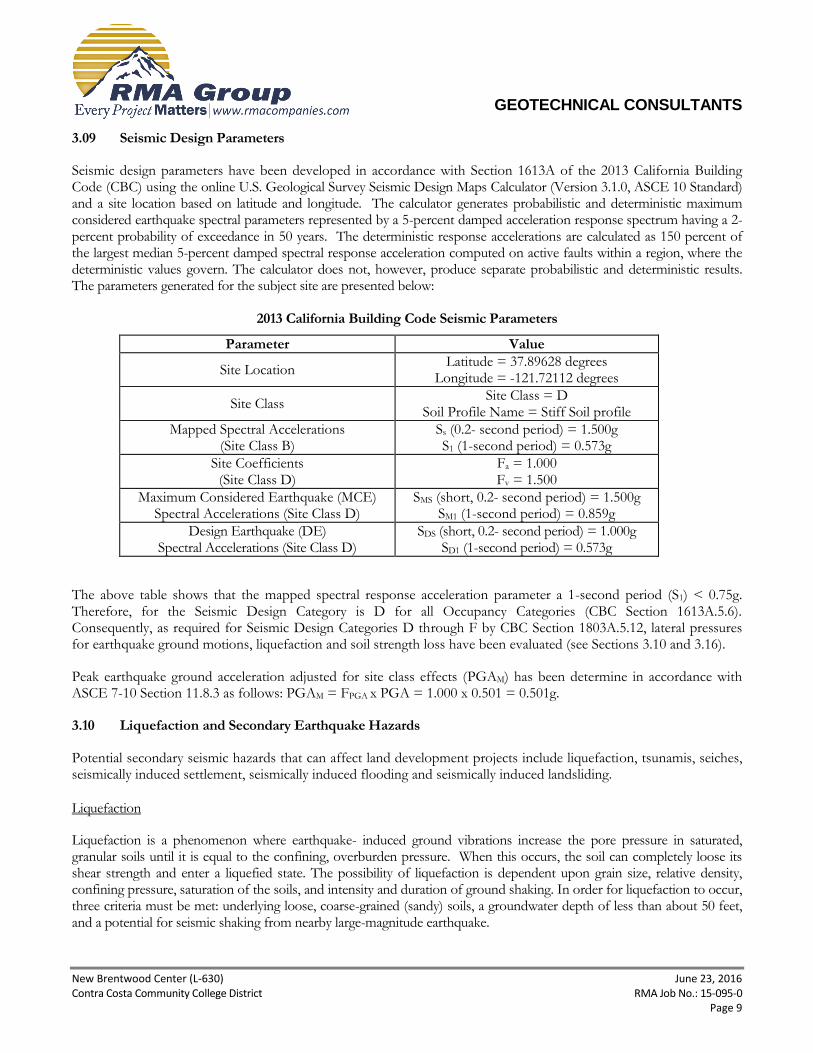
3.09 Seismic Design Parameters
Seismic design parameters have been developed in accordance with Section 1613A of the 2013 California Building Code (CBC) using the online U.S. Geological Survey Seismic Design Maps Calculator (Version 3.1.0, ASCE 10 Standard) and a site location based on latitude and longitude. The calculator generates probabilistic and deterministic maximum considered earthquake spectral parameters represented by a 5-percent damped acceleration response spectrum having a 2-percent probability of exceedance in 50 years. The deterministic response accelerations are calculated as 150 percent of the largest median 5-percent damped spectral response acceleration computed on active faults within a region, where the deterministic values govern. The calculator does not, however, produce separate probabilistic and deterministic results. The parameters generated for the subject site are presented below:
2013 California Building Code Seismic Parameters
Parameter Value
Site Location Latitude = 37.89628 degrees
Longitude = -121.72112 degrees
Site Class Site Class = D
Soil Profile Name = Stiff Soil profile
Mapped Spectral Accelerations (Site Class B)
Ss (0.2- second period) = 1.500g S1 (1-second period) = 0.573g
Site Coefficients (Site Class D)
Fa = 1.000 Fv = 1.500
Maximum Considered Earthquake (MCE) Spectral Accelerations (Site Class D)
SMS (short, 0.2- second period) = 1.500g SM1 (1-second period) = 0.859g
Design Earthquake (DE) Spectral Accelerations (Site Class D)
SDS (short, 0.2- second period) = 1.000g SD1 (1-second period) = 0.573g
The above table shows that the mapped spectral response acceleration parameter a 1-second period (S1) < 0.75g. Therefore, for the Seismic Design Category is D for all Occupancy Categories (CBC Section 1613A.5.6). Consequently, as required for Seismic Design Categories D through F by CBC Section 1803A.5.12, lateral pressures for earthquake ground motions, liquefaction and soil strength loss have been evaluated (see Sections 3.10 and 3.16).
Peak earthquake ground acceleration adjusted for site class effects (PGAM) has been determine in accordance with ASCE 7-10 Section 11.8.3 as follows: PGAM = FPGA x PGA = 1.000 x 0.501 = 0.501g.
3.10 Liquefaction and Secondary Earthquake Hazards
Potential secondary seismic hazards that can affect land development projects include liquefaction, tsunamis, seiches, seismically induced settlement, seismically induced flooding and seismically induced landsliding.
Liquefaction
Liquefaction is a phenomenon where earthquake- induced ground vibrations increase the pore pressure in saturated, granular soils until it is equal to the confining, overburden pressure. When this occurs, the soil can completely loose its shear strength and enter a liquefied state. The possibility of liquefaction is dependent upon grain size, relative density, confining pressure, saturation of the soils, and intensity and duration of ground shaking. In order for liquefaction to occur, three criteria must be met: underlying loose, coarse-grained (sandy) soils, a groundwater depth of less than about 50 feet, and a potential for seismic shaking from nearby large-magnitude earthquake.

GEOTECHNICAL CONSULTANTS
New Brentwood Center (L-630) June 23, 2016 Contra Costa Community College District RMA Job No.: 15-095-0 Page 10
Exploratory Boring B-4 encountered a 5-foot thick layer of poorly graded sand at a depth of 15 feet and a groundwater depth of 16 feet. Our analysis using data collected from this boring indicates that liquefaction is unlikely to occur.
It should be noted that the California Geological Survey has not yet prepared a Seismic Hazard Zone Map of potential liquefaction hazards for the quadrangle in which the site is located.
Tsunamis and Seiches
Tsunamis are sea waves that are generated in response to large-magnitude earthquakes. When these waves reach shorelines, they sometimes produce coastal flooding. Seiches are the oscillation of large bodies of standing water, such as lakes, that can occur in response to ground shaking. Tsunamis do not pose hazards due to the inland location of the site. There is a stormwater basin a few hundred feet west of the site. Its outlet point is approximately 15 feet below the elevation of the site. Consequently, the site is not expected to be impacted by potential seiches generated at the basin. Marsh Creek Reservoir is located approximately ½ mile to the south-southwest of the site. The overflow outlet for the reservoir is approximately 50 feet higher than the site elevation. The drainage path of Marsh Creek runs between the reservoir and the site and is located about 600 feet southeast of the site at its nearest point. At its nearest point, the elevation of Marsh Creek is about 10 feet lower than the elevation of the site. Consequently, it appears unlikely the seiches at the reservoir would impact the site. The potential for seismically induced flooding originating from Marsh Creek Reservoir is discussed below.
Seismically Induced Settlement
Seismically induced settlement occurs most frequently in areas underlain by loose, granular sediments. Damage as a result of seismically induced settlement is most dramatic when differential settlement occurs in areas with large variations in the thickness of underlying sediments. Settlement caused by ground shaking is often non-uniformly distributed, which can result in differential settlement. Seismically induced settlement calculations were performed using the software LiquefyPRO developed by CivilTech Software. SPT data, fines content test results, in-situ density, subsurface profile, groundwater level, and site-specific seismic information are utilized by the program to determine the magnitude of settlement resulting from un-saturated sand layers susceptible to dynamic settlement when subjected to Design Earthquake Event. We estimate 0.01-inches of total seismically induced ground settlement may occur at the site when subjected to a Design Earthquake event (see calculations in Appendix D). In our opinion, differential seismic settlement may be taken as one-half of the computed total seismic settlement. Calculations of seismically induced settlements are presented in Appendix D.
Seismically Induced Flooding
According to the Contra Costa County Flood Control and Water Conservation District online Dam Failure Inundation Areas Map, the potential inundation area of the Marsh Creek Reservoir abuts the eastern side of the site. The potential impact of this potential inundation area should be further evaluated by the design civil engineer.
Seismically Induced Landsliding
Due to the low gradient of the site, the potential for seismically induced landsliding is nil. This assumes that any slopes created during development of the school site will be properly designed and constructed. It should be noted that the

GEOTECHNICAL CONSULTANTS
New Brentwood Center (L-630) June 23, 2016 Contra Costa Community College District RMA Job No.: 15-095-0 Page 11
California Geological Survey has not yet prepared a Seismic Hazard Zone Map of potential earthquake-induced landslide hazards for the quadrangle in which the site is located. However, according to the City of Brentwood General Plan Existing Conditions Report, dated April 9, 2013, and hazard maps provided by the Association of Bay Area Governments indicate that the site is not located within a potential landslide area.
3.11 Foundations
Our preliminary laboratory tests indicate that the onsite soils are expansive. It is anticipated that the primary mechanisms for differential movement of building foundations at the subject site will be shrinkage and swelling of expansive soils. Therefore, we recommend the use of reinforced foundations and slabs with internal grade beams at the subject site to mitigate the effects of expansive soils. Due to the preliminary nature of the expansion tests performed for this study, we recommend additional testing be performed near the completion of rough grading to verify the test results and recommended foundation design criteria. It is recommended that the design provide for a stiff floor slab, which minimizes the amount of deflection imposed on the structure. The slab and foundation system should be designed in accordance with the recommendations contained in the WRI/CRSI Design of Slab-on-Ground Foundations (1981, updated in 1996) by a foundation design engineer experienced in the field of slab design. The slab designer should provide estimates of the anticipated deflection to the design architect and structural engineer for use in the design of the structure. If the anticipated design deflection exceeds that which the design architect and or structural engineer can accommodate then the slab should be re-designed by the slab designer to reduce the total deflection. If necessary, recommendations for alternative types of foundations may be developed by the geotechnical engineer. In accordance with CBC Section 1808A.6.2, design of stiffened reinforced concrete slab-on-grade on expansive soils should follow the WRI/CRSI Design of Slab-on-Ground Foundations. We recommend an effective Plasticity Index (PI) value of 20 for design. The slab should have a minimum thickness of 6 inches and be designed with concrete having a minimum compressive strength of 3,000 psi. Exterior foundations should extend a minimum of 24 inches below grade along the perimeter of the structure and should have a minimum width of 18 inches. Foundation embedment should be measured from the lowest adjacent grade within 5 feet of the structure. Reinforcement of the exterior foundations, grade beams, and slab-on-grade should provide the minimum area of steel required per the WRI/CRSI Design of Slab-on-Ground Foundations. The slab should be continuously reinforced with a minimum of #3 reinforcing bars placed in both directions at a maximum spacing of 18 inches on center. The foundations and grade beams should be continuously reinforced with a minimum of two #4 bars at the top and two #4 bars at the bottom. Provided the recommendations on grading given in this report are followed and footings are established in compacted fill materials, footings may be designed using the following allowable soil bearing values:
Continuous Footings:
Continuous footings having a minimum width of 12 inches and a minimum depth of embedment of 24 inches below the lowest adjacent grade may have allowable bearing capacity of 2,000 pounds per square foot (psf). This value may be increased by 20% for each additional foot of width or depth to a maximum value of 3,300 psf.
Isolated Spread Footings:
Isolated footings having a minimum width of 18 inches and a minimum depth of embedment of 24 inches below the lowest adjacent grade may have allowable bearing capacity of 2,000 psf. This value may be increased by 20%

GEOTECHNICAL CONSULTANTS
New Brentwood Center (L-630) June 23, 2016 Contra Costa Community College District RMA Job No.: 15-095-0 Page 12
for each additional foot of width or depth to a maximum value of 3,300 psf.
The above bearing capacities represent an allowable net increase in soil pressure over existing soil pressure and may be increased by one-third for short-term wind or seismic loads. The maximum expected settlement of footings designed with the recommended allowable bearing capacity is expected to not exceed 1 inch with differential settlement less than 0.5 inches.
3.12 Foundation Setbacks from Slopes
Setbacks for footings adjacent to slopes should conform to the requirements of the California Building Code (CBC). Specifically, footings should maintain a horizontal distance or setback between any adjacent slope face and the bottom outer edge of the footing. For slopes descending away from the foundation, the horizontal distance may be calculated by using h/3, where h is the height of the slope. The horizontal setback should not be less than 5 feet, nor need not be greater than 40 feet (per CBC). Where structures encroach within the zone of h/3 from the top of the slope the setback may be maintained by deepening the foundations. Flatwork and utilities within the zone of h/3 from the top of slope may be subject to lateral distortion caused by gradual downslope creep. Walls, fences and landscaping improvements constructed at the top of descending slopes should be designed with consideration of the potential for gradual downslope creep. For ascending slopes, the horizontal setback required may be calculated by using h/2 where h is the height of the slope. The horizontal setback need not be greater than 15 feet (per CBC).
3.13 Slabs on Grade Concrete floors with a minimum thickness of 6 inches are recommended for slabs on grade for the proposed structures, considering normal floor loading conditions. However, if heavy concentrated or moving loads are anticipated, slabs should be designed using a modulus of subgrade reaction (k) of 125 psi/in when soils are prepared in conformance with the grading recommendations contained within the report. Reinforcement of slabs with a minimum of #3 reinforcing steel bar spaced at 18 inches on center placed at mid-height within the slab is recommended. Special care should be taken on floors slabs to be covered with thin-set tile or other inflexible coverings. These areas may be reinforced by a minimum of #3 reinforcing bar placed at 18 inches in both directions at mid-height of the slab, to mitigate drying shrinkage cracks. Alternatively, inflexible flooring may be installed with unbonded fabric or liners to prevent reflection of slab cracks through the flooring. A moisture vapor retarder/barrier is recommended beneath all slabs-on-grade that will be covered by moisture-sensitive flooring materials such as vinyl, linoleum, wood, carpet, rubber, rubber-backed carpet, tile, impermeable floor coatings, adhesives, or where moisture-sensitive equipment, products, or environments will exist. We recommend that design and construction of the moisture vapor retarder/barrier conform to Section 1805A of the 2013 California Building Code and pertinent sections of American Concrete Institute (ACI) guidance documents 302.1R-04, 302.2R-06 and 360R-10. The moisture vapor retarder/barrier should consist of a minimum 10 mils thick polyethylene with a maximum perm rating of 0.3 in accordance with ASTM E 1745. Seams in the moisture vapor retarder/barrier should be overlapped no less than 6 inches or in accordance with the manufacturer’s recommendations. Joints and penetrations should be sealed with the manufacturer’s recommended adhesives, pressure-sensitive tape, or both. The contractor must avoid damaging or puncturing the moisture vapor retarder/barrier and repair any punctures with additional polyethylene properly lapped and sealed.

GEOTECHNICAL CONSULTANTS
New Brentwood Center (L-630) June 23, 2016 Contra Costa Community College District RMA Job No.: 15-095-0 Page 13
The moisture vapor retarder/barrier may be placed directly beneath the floor slab with no intermediate granular fill layer. This method of construction will provide improved curing of the slab bottom and will eliminate potential problems caused by water being trapped in a granular fill layer. However, concrete slabs poured directly on a moisture vapor retarder/barrier can experience shrinkage cracking and curling due to differential rates of curing through the thickness of the slab. Therefore, for concrete placed directly on the moisture vapor retarder/barrier, we recommend a maximum water cement ratio of 0.45 and the use of water-reducing admixtures to increase workability and decrease bleeding. Alternatively, the slabs may be constructed by placing a 4-inch layer of granular soil over the moisture vapor retarder/barrier in accordance with ACI 302.1R-04. Granular fill should consist of clean, fine-graded materials with 10% to 30% passing the No. 100 sieve and free from clay or silt. The granular layer should be uniformly compacted and trimmed to provide the full design thickness of the proposed slab. The granular fill layer should not be left exposed to rain or other sources of water such as wet-grinding, power washing, pipe leaks or other processes, and should be dry at the time of concrete placement. Granular fill layers that become saturated should be removed and replaced prior to concrete placement.
3.14 Miscellaneous Concrete Flatwork
Miscellaneous concrete flatwork and walkways may experience seasonal movement due to the expansive nature of soils at the site. Consequently, some cracking or vertical movement of conventional flatwork and walkways should be anticipated. Several construction methods may be utilized to mitigate such movements; however, some minor movements, cracking or distress may still occur.
Subgrade soils should be scarified and moisture conditioned to a minimum of 3% and a maximum of 6% over optimum moisture content for a depth of 12 inches prior to placing concrete. Moisture conditioning of dry soils should be accomplished by gradual wetting rather than flooding or excessive watering, which could result in a soft, unstable condition and possible construction delays while waiting for soils to dry out. Moisture conditioning of wet soils should be accomplished by air drying, lime treatment or other methods approved by the geotechnical engineer. Subgrade soils should be compacted for 87 to 92 percent relative compaction (ASTM D1557). The moisture content of subgrade soils should be verified by the geotechnical consultant a maximum of 24 hours prior to placing concrete and the geotechnical consultant should be verify compaction of the subgrade soils by field density testing.
Concrete flatwork and walkways that are not subject to vehicle loads should be at least 4 inches thick and underlain by at least 6 inches of non-expansive soil such as aggregate base, crushed rock or import soil with a Plastic Index of 15 or less. The non-expansive soil should be compacted to at least 90% relative compaction (ASTM D1557). Flatwork and walkways subject to vehicle loads should be design in accordance to the recommendations presented in Section 3.22.
Large slabs should be reinforced with a minimum of #3 reinforcing bar placed at 12 inches in both directions at mid-height of the slab. Slabs should also have control joints constructed as squares or rectangles with spacing of about 2 feet in each direction for each inch of concrete thickness up to a maximum of 10 feet. Control joints for walkways should have a maximum spacing of 5 feet. Exterior slabs and walkways should be isolated from adjacent foundations with a construction joint and a felt strip or approved equivalent that extends the full depth of the exterior slab. This will help reduce the potential for permanent vertical offset between the slabs due to friction between the concrete edges.
Consideration should also be given to using reinforcing steel, such as No. 3 rebar space at 24 inches on center each direction to reduce the potential for vertical offset or widening of concrete cracks.
GEOTECHNICAL CONSULTANTS
New Brentwood Center (L-630) June 23, 2016 Contra Costa Community College District RMA Job No.: 15-095-0 Page 14
3.15 Footing Excavation and Slab Preparations
All footing excavations should be observed by the geotechnical consultant to verify that they have been excavated into competent soils. The foundation excavations should be observed prior to the placement of forms, reinforcement steel, or concrete. These excavations should be evenly trimmed and level. Prior to concrete placement, any loose or soft soils should be removed. Excavated soils should not be placed on slab or footing areas unless properly compacted. Continuous and isolated spread footings as well as slabs-on-grade should be underlain by a minimum of 36 inches of engineered fill. Prior to the placement of the moisture barrier and sand, the subgrade soils underlying the slab should be observed by the geotechnical consultant to verify that all under-slab utility trenches have been properly backfilled and compacted, that no loose or soft soils are present, and that placement and compaction of non-expansive materials has been performed in substantial compliance to the above recommendations.
Footings may experience and overall loss in bearing capacity or an increased potential to settle where located in close proximity to existing or future utility trenches. Furthermore, stresses imposed by the footings on the utility lines may cause cracking, collapse and/or a loss of serviceability. To reduce this risk, footings should extend below a 1:1 plane projected upward from the closest bottom of the trench.
Slabs on grade and walkways should be brought to a minimum of 2% and a maximum of 6% above their optimum moisture content for a depth of 18 inches prior to the placement of concrete. The geotechnical consultant should perform in-situ moisture tests to verify that the appropriate moisture content has been achieved a maximum of 24 hours prior to the placement of concrete or moisture barriers.
3.16 Lateral Load Resistance
Lateral loads may be resisted by soil friction and the passive resistance of the soil. The following parameters are recommended.
Passive Earth Pressure = 346 pcf (equivalent fluid weight).
Coefficient of Friction (soil to footing) = 0.35
Retaining structures should be designed to resist the following lateral active earth pressures:
Surface Slope of Retained Materials
(Horizontal:Vertical)
Equivalent Fluid Weight
(pcf)
Level 42
5:1 44
4:1 46
3:1 50
2:1 70
These active earth pressures are only applicable if the retained earth is allowed to strain sufficiently to achieve the active state. The required minimum horizontal strain to achieve the active state is approximately 0.0025H. Retaining structures should be designed to resist an at-rest lateral earth pressure if this horizontal strain cannot be achieved.

GEOTECHNICAL CONSULTANTS
New Brentwood Center (L-630) June 23, 2016 Contra Costa Community College District RMA Job No.: 15-095-0 Page 15
At-rest Lateral Earth Pressure = 62 pcf (equivalent fluid weight)
The Mononobe-Okabe method is commonly utilized for determining seismically induced active and passive lateral earth pressures and is based on the limit equilibrium Coulomb theory for static stress conditions. This method entails three fundamental assumptions (e.g., Seed and Whitman, 1970): Wall movement is sufficient to ensure either active or passive conditions, the driving soil wedge inducing the lateral earth pressures is formed by a planar failure surface starting at the heel of the wall and extending to the free surface of the backfill, and the driving soil wedge and the retaining structure act as rigid bodies, and therefore, experiences uniform accelerations throughout the respective bodies (U.S. Army Corps of Engineers, 2003, Engineering and Design - Stability Analysis of Concrete Structures).
Seismic Lateral Earth Pressure = 19 pcf (equivalent fluid weight).
The seismic lateral earth pressure given above is an inverted triangle, and the resultant of this pressure is an increment of force which should be applied to the back of the wall in the upper 1/3 of the wall height and also applied as a reduction of force to the front of the wall in the upper 1/3 of the footing depth.
3.17 Drainage and Moisture Proofing
Surface drainage should be directed away from the proposed structure into suitable drainage devices. Neither excess irrigation nor rainwater should be allowed to collect or pond against building foundations or within low-lying or level areas of the lot. Surface waters should be diverted away from the tops of slopes and prevented from draining over the top of slopes and down the slope face. Walls and portions thereof that retain soil and enclose interior spaces and floors below grade should be waterproofed and dampproofed in accordance with CBC Section 1805A. Retaining structures should be drained to prevent the accumulation of subsurface water behind the walls. Backdrains should be installed behind all retaining walls exceeding 3 feet in height. A typical detail for retaining wall back drains is presented in Appendix C. All backdrains should be outlet to suitable drainage devices. Retaining wall less than 3 feet in height should be provided with backdrains or weep holes. Dampproofing and/or waterproofing should also be provided on all retaining walls exceeding 3 feet in height.
3.18 Cement Type and Corrosion Potential
Soluble sulfate tests indicate that concrete at the subject site will have a moderate exposure to water-soluble sulfate in the soil. Our recommendations for concrete exposed to sulfate-containing soils are presented in the table below.

GEOTECHNICAL CONSULTANTS
New Brentwood Center (L-630) June 23, 2016 Contra Costa Community College District RMA Job No.: 15-095-0 Page 16
Recommendations for Concrete exposed to Sulfate-containing Soils
Sulfate Exposure
Water Soluble Sulfate (SO4)
in Soil (% by Weight)
Sulfate (SO4)
in Water (ppm)
Cement Type
(ASTM C150)
Maximum Water-Cement
Ratio (by Weight)
Minimum Compressive
Strength (psi)
Negligible 0.00 - 0.10 0-150 -- -- 2,500
Moderate 0.10 - 0.20 150-1,500 II 0.50 4,000
Severe 0.20 - 2.00 1,500-10,000 V 0.45 4,500
Very Severe Over 2.00 Over 10,000 V plus pozzolan
or slag 0.45 4,500
Use of alternate combinations of cementitious materials may be permitted if the combinations meet design recommendations contained in American Concrete Institute guideline ACI 318-11. The soils were also tested for soil reactivity (pH) and electrical resistivity (ohm-cm) and chloride content. The test results indicate that the on-site soils have a soil reactivity of 8.17, an electrical resistivity of 540 ohm-cm, and chloride content of 58.3 ppm.. A neutral or non-corrosive soil has a value ranging from 5.5 to 8.4. Generally, soils that could be considered moderately corrosive to ferrous metals have resistivity values of about 3,000 ohm-cm to 10,000 ohm-cm. Soils with resistivity values less than 3,000 ohm-cm can be considered corrosive and soils with resistivity values less than 1,000 ohm-cm can be considered extremely corrosive. Soil with a chloride content of 500 ppm or greater are generally considered corrosive. Based on our analysis, it appears that the underlying onsite soils are corrosive to ferrous metals. Protection of buried pipes utilizing coatings on all underground pipes; clean backfills and a cathodic protection system can be effective in controlling corrosion. A qualified corrosion engineer should be consulted to further assess the corrosive properties of the soil.
3.19 Temporary Slopes
Excavation of utility trenches will require either temporary sloped excavations or shoring. Temporary excavations in existing alluvial soils may be safely made at an inclination of 1:1 or flatter. If vertical sidewalls are required in excavations greater than 5 feet in depth, the use of cantilevered or braced shoring is recommended. Excavations less than 5 feet in depth may be constructed with vertical sidewalls without shoring or shielding. Our recommendations for lateral earth pressures to be used in the design of cantilevered and/or braced shoring are presented below. These values incorporate a uniform lateral pressure of 72 psf to provide for the normal construction loads imposed by vehicles, equipment, materials, and workmen on the surface adjacent to the trench excavation. However, if vehicles, equipment, materials, etc., are kept a minimum distance equal to the height of the excavation away from the edge of the excavation, this surcharge load need not be applied.

GEOTECHNICAL CONSULTANTS
New Brentwood Center (L-630) June 23, 2016 Contra Costa Community College District RMA Job No.: 15-095-0 Page 17
Design of the shield struts should be based on a value of 0.65 times the indicated pressure, Pa, for the approximate trench depth. The wales and sheeting can be designed for a value of 2/3 the design strut value.
Placement of the shield may be made after the excavation is completed or driven down as the material is excavated from inside of the shield. If placed after the excavation, some overexcavation may be required to allow for the shield width and advancement of the shield. The shield may be placed at either the top or the bottom of the pipe zone. Due to the anticipated thinness of the shield walls, removal of the shield after construction should have negligible effects on the load factor of pipes. Shields may be successively placed with conventional trenching equipment. Vehicles, equipment, materials, etc. should be set back away from the edge of temporary excavations a minimum distance of 15 feet from the top edge of the excavation. Surface waters should be diverted away from temporary excavations and prevented from draining over the top of the excavation and down the slope face. During periods of heavy rain, the slope face should be protected with sandbags to prevent drainage over the edge of the slope, and a visqueen liner placed on the slope face to prevent erosion of the slope face.
SHORING DESIGN: LATERAL SHORING PRESSURES
BRACED SHEETING
H
CANTILEVERED SHEETING
72 psf
Pa Total = 72 psf + 30 H psf
Pa = 30 H psf
0.6H
0.2H
0.2H
Pa Total = 72 psf + 25 H psf
Pa = 25 H psf 72 psf
STRUTS(typ.)
SHIELD(typ.)
UNDISTURBED SOIL
BEDDING
1'min.
H1
Hsh
Dt
P = 30 Hsh
psfa
HEIGHT OF SHIELD, Hsh
= DEPTH OF TRENCH, Dt
, MINUS DEPTH OF SLOPE, H1
TYPICAL SHORING
DETAIL
1:1
(H:V
)1:1 (H
:V)
GEOTECHNICAL CONSULTANTS
New Brentwood Center (L-630) June 23, 2016 Contra Costa Community College District RMA Job No.: 15-095-0 Page 18
Periodic observations of the excavations should be made by the geotechnical consultant to verify that the soil conditions have not varied from those anticipated and to monitor the overall condition of the temporary excavations over time. If at any time during construction conditions are encountered which differ from those anticipated, the geotechnical consultant should be contacted and allowed to analyze the field conditions prior to commencing work within the excavation. Cal/OSHA construction safety orders should be observed during all underground work.
3.20 Utility Trench Backfill
The onsite fill soils will not be suitable for use as pipe bedding for buried utilities. All pipes should be bedded in a sand, gravel or crushed aggregate imported material complying with the requirements of the Standard Specifications for Public Works Construction Section 306-1.2.1. Crushed rock products that do not contain appreciable fines should not be utilized as pipe bedding and/or backfill. Bedding materials should be densified to at least 90% relative compaction (ASTM D1557) by mechanical methods. The geotechnical consultant should review and approve of proposed bedding materials prior to use. All utility trench backfill within street right of way, utility easements, under or adjacent to sidewalks, driveways, or building pads should be observed and tested by the geotechnical consultant to verify proper compaction. Trenches excavated adjacent to foundations should not extend within the footing influence zone defined as the area within a line projected at a 1:1 drawn from the bottom edge of the footing. Trenches crossing perpendicular to foundations should be excavated and backfilled prior to the construction of the foundations. The excavations should be backfilled in the presence of the geotechnical engineer and tested to verify adequate compaction beneath the proposed footing. Cal/OSHA construction safety orders should be observed during all underground work.
3.22 Pavement Sections R-value tests were performed on anticipated subgrade soils at the site in order to provide information on their soil properties for design of pavement structural sections. Structural sections were designed using the procedures outlined in Chapter 630 of the California Highway Design Manual (Caltrans, 2008). This procedure uses the principle that the pavement structural section must be of adequate thickness to distribute the load from the design traffic index (TI) to the subgrade soils in such a manner that the stresses from the applied loads do not exceed the strength of the soil (R-value). Development of the design traffic indexes on the basis of a traffic study is beyond the scope of this report. However, based on our experience, traffic indices for parking lots typically range from 5.0 to 7.0. We have provided alternate structural sections for each traffic index with this range. Selection of the final pavement structural section should be based on economic considerations which are beyond the scope of this investigation. Recommended structural sections are as follows:
Parking Lots (TI=5.0, R-Value=7): Parking Lots (TI=5.5, R-Value=7): 3.0 inches of asphaltic concrete over 3.0 inches of asphaltic concrete over 9.5 inches of crushed aggregate base 11.5 inches of crushed aggregate base
Parking Lots (TI=6.0, R-Value=7): Parking Lots (TI=6.5, R-Value=7): 3.5 inches of asphaltic concrete over 4.0 inches of asphaltic concrete over 12.5 inches of crushed aggregate base 13.0 inches of crushed aggregate base

GEOTECHNICAL CONSULTANTS
New Brentwood Center (L-630) June 23, 2016 Contra Costa Community College District RMA Job No.: 15-095-0 Page 19
Parking Lots (TI=7.0, R-Value=7): 4.0 inches of asphaltic concrete over 15.0 inches of crushed aggregate base
Portland cement concrete (PCC) pavements for areas which are not subject to traffic loads may be designed with a minimum thickness of 4.0inches of Portland cement concrete on compacted native soils. If traffic loads are anticipated, PCC pavements should be designed for a minimum thickness of <6.0> inches of Portland cement concrete on <4.0> inches of crushed aggregate base. Prior to paving, the subgrade soils should be scarified and the moisture adjusted to within 2% of the optimum moisture content. The subgrade soils should be compacted to a minimum of 90% relative compaction. All aggregate base courses should be compacted to a minimum of 95% relative compaction.
3.21 Plan Review
Once a formal grading and foundation plans are prepared for the subject property, this office should review the plans from a geotechnical viewpoint, comment on changes from the plan used during preparation of this report and revise the recommendations of this report where necessary.
3.22 Geotechnical Observation and Testing During Rough Grading
The geotechnical engineer should be contacted to provide observation and testing during the following stages of grading:
During the clearing and grubbing of the site.
During the demolition of any existing structures, buried utilities or other existing improvements.
During excavation and overexcavation of compressible soils.
During all phases of grading including ground preparation and filling operations.
When any unusual conditions are encountered during grading. A final geotechnical report summarizing conditions encountered during grading should be submitted upon completion of the rough grading operations.
3.23 Post-Grading Geotechnical Observation and Testing
After the completion of grading the geotechnical engineer should be contacted to provide additional observation and testing during the following construction activities:
During trenching and backfilling operations of buried improvements and utilities to verify proper backfill and compaction of the utility trenches.
After excavation and prior to placement of reinforcing steel or concrete within footing trenches to verify that footings are properly founded in competent materials.
During fine or precise grading involving the placement of any fills underlying driveways, sidewalks, walkways, or other miscellaneous concrete flatwork to verify proper placement, mixing and compaction of fills.
When any unusual conditions are encountered during construction.

GEOTECHNICAL CONSULTANTS
New Brentwood Center (L-630) June 23, 2016 Contra Costa Community College District RMA Job No.: 15-095-0 Page 20
4.00 CLOSURE
The findings, conclusions and recommendations in this report were prepared in accordance with generally accepted engineering and geologic principles and practices. No other warranty, either expressed or implied, is made. This report has been prepared for Contra Costa Community College District to be used solely for design purposes. Anyone using this report for any other purpose must draw their own conclusions regarding required construction procedures and subsurface conditions. The geotechnical and geologic consultant should be retained during the earthwork and foundation phases of construction to monitor compliance with the design concepts and recommendations and to provide additional recommendations as needed. Should subsurface conditions be encountered during construction that are different from those described in this report, this office should be notified immediately so that our recommendations may be re-evaluated.

GEOTECHNICAL CONSULTANTS
FIGURES AND TABLES

Brentwood Center (L-630)Contra Costa Community College District
June 23, 2016RMA Project No.: 15-095-0
Figure 1
GEOTECHNICAL CONSULTANTS
SITE LOCATION MAP
Scale: 1 inch = 2,000 feet
Basemap obtained from USGS and USTopo
SITE
4
MARSH CREEK RD

Brentwood Center (L-630)Contra Costa Community College District
June 23, 2016RMA Project No.: 15-095-0
Figure 2
GEOTECHNICAL CONSULTANTS
Source: Dibblee and Minch, 2006, Map of Antioch South and Brentwood Quadrangles, Dibblee Geologic Foundation Map DF-193.
SITE
REGIONAL GEOLOGIC MAP
Scale: 1 in = 2,500 ft
Partial LegendQl, Qc – Holocene Alluvial Deposits
Qoa – Pleistocene Older Alluvium
Tmge, Tmc, Tds, Tmgd – Tertiary Sedimentary Bedrock
Tkm – Tertiary and Cretaceous Sedimentary Bedrock
Kdv, Km – Cretaceous Sedimentary Bedrock

Basemap: Google Earth, Imagery date 10/30/2015
GEOTECHNICAL CONSULTANTS
B-1
B-2
B-3 B-4
B-5A
A’B
B’
Brentwood Center (L-630)Contra Costa Community College District
June 23, 2016RMA Project No.: 15-095-0
Figure 3
SITE GEOLOGIC MAPScale: 1 inch ≈ 150 feet
S-1
S-2
PROPOSED STRUCTURE FOOTPRINT
PROPOSED PARKING LOT
MIW
OK
AV
EN
UE
PIONEER SQUARE
af/Qal
1-B1
>> S 30°E >>
>> N 83° E >>
Geologic Legend
Geologic Cross SectionA A’
Approx. Boring Location (RMA, 2016)B-1
Approx. Bulk Sample Location (RMA, 2016)S-1
Approx. Boring Location (ENGEO, 2009)1-B1
Approx. Geologic Contact
Valley AlluviumQal
Artificial Fill over Valley Alluviumaf/Qal
Qal

Brentwood Center (L-630)Contra Costa Community College District
June 23, 2016RMA Project No.: 15-095-0
Figure 4-1
GEOTECHNICAL CONSULTANTS
B-3
Meganos Formation bedrock (Tm)
B-5
PROPOSED BUILDING
A A’
CL
ML
CL
CL
Bdrx
140
135
130
120
115
110
125
145
105
Ele
vatio
n in
Feet
140
135
130
120
115
110
125
145
105CH
SC
ML
SP
CL
Artificial Fill (af)
Valley Alluvium (Qal)
GEOLOGIC CROSS SECTION A-A’Horizontal Scale: 1 inch ≈ 50 feet
Vertical Scale: 1 inch ≈ 20 feet
New Brentwood Center (L-630)Contra Costa Community College District
June 23, 2016RMA Project No.: 15-095-0
Figure 4-2
GEOTECHNICAL CONSULTANTS
B-3
CL & SM
CL
ML
CL
B-2
PROPOSED BUILDING
B B’
Ele
vatio
n in
Feet
Bdrx
CL
ML
CL
CL
Valley Alluvium (Qal)
Artificial Fill (af)
Meganos Formation bedrock (Tm)
140
135
130
120
115
110
125
145
105
GEOLOGIC CROSS SECTION B-B’Horizontal Scale: 1 inch ≈ 50 feet
Vertical Scale: 1 inch ≈ 20 feet
140
135
130
120
115
110
125
145
105
Ele
vatio
n in
Feet

Brentwood Center (L-630)Contra Costa Community College District
June 23, 2016RMA Project No.: 15-095-0
Figure 5
GEOTECHNICAL CONSULTANTS
Basemap: California Geological Survey Fault Activity Map, 2010
SITE
REGIONAL FAULT MAP
Scale: 1 inch ≈ 10 miles
Partial Legend
Red – Historic Fault Displacement
Orange – Holocene Fault Displacment
Green – Late Quaternary Fault Displacement
Purple – Quaternary Fault
Black – Pre-Quaternary Fault

GEOTECHNICAL CONSULTANTS
New Brentwood Center (L-630) June 23, 2016 Contra Costa Community College District RMA Job No.: 15-095-0 Table 1
Maximum Slip
Distance Distance Moment Rate
Fault Zone & geometry (km) (mi.) Magnitude (mm/yr)
Calaveras - North (rl-ss) 26 16 6.8 6.0
Concord - Green Valley (rl-ss) 24 15 6.2 4.0
Foothills Fault System (n-rl-o) 84 52 6.5 0.1
Great Valley - Segment 3 (r) 90 56 6.9 1.5
Great Valley - Segment 4 (r) 47 29 6.6 1.5
Great Valley - Segment 5 (r) 21 13 6.5 1.5
Great Valley - Segment 7 (r) 25 16 6.7 1.5
Great Valley - Segment 8 (r) 71 44 6.6 1.5
Greenville - Marsh Creek (rl-ss) 9 6 6.6 2.0
Hayward (rl-ss) 40 25 6.4 9.0
Hunting Creek - Berryessa 75 47 7.1 6.0
Monte Vista - Shannon (r) 69 43 6.7 0.4
Mount Diablo (r) 19 12 6.6 2.0
Ortigalita (rl-ss) 80 50 7.1 1.0
Point Reyes (r) 98 61 7.0 0.3
San Andreas (rl-ss) 69 43 7.1 17.0
San Gregorio - North (rl-ss) 79 49 7.2 7.0
West Napa (rl-ss) 55 34 6.5 1.0
Zayante - Vergeles (rl-r) 93 58 7.0 0.1
Notes:
Fault geometry - (ss) strike slip, (r) reverse, (n) normal, (rl) right lateral, (ll) left lateral, (o) oblique
Fault and Seismic Data - California Geological Survey (Cao), 2003
NOTABLE FAULTS WITHIN 100 KILOMETERS AND SEISMIC DATA

GEOTECHNICAL CONSULTANTS
New Brentwood Center (L-630) June 23, 2016 Contra Costa Community College District RMA Job No.: 15-095-0 Table 2
Epicentral
Distance
Date Event Magnitude (miles)
June 10, 1836 Near San Juan Bautista 6.4 70
June, 1938 San Juan Bautista - San Francisco 7.4 49
November 26, 1858 San Jose Region 6.2 28
February 26, 1964 Southeast of San Jose 6.1 49
March 5, 1864 East of San Francisco Bay 6.0 25
October 8, 1865 Santa Cruz Mountains 6.5 50
July 15, 1866 Western San Joaquin Valley 6.0 19
October 21, 1868 Bay Area - Hayward fault 7.0 26
April 19, 1892 Vacaville 6.6 39
March 31, 1998 Mara Island 6.4 51
June 11, 1903 San Jose 6.1 49
August 3, 1903 San Jose 6.2 42
April 18, 1906 Great San Francisco Earthqauke 7.8 48
July 1, 1911 Morgan Hill area 6.4 45
April 24, 1984 Morgan Hill 6.2 41
Oct. 17, 1989 Loma Prieta 6.9 60
August 24, 2014 American Canyon 6.0 42
Notes:
Earthquake data: California Geological Survey online historic earthquake database, M ≥ 6.0
Magnitudes prior to 1932 are estimated from intensity.
Magnitudes after 1932 are moment, local or surface wave magnitudes.
Site Location:
Longitude: - 121.721
Latitude: 37.896
HISTORIC STRONG EARTHQUAKES SINCE 1836
SAN FRANCISCO BAY REGION

GEOTECHNICAL CONSULTANTS
APPENDIX A
FIELD INVESTIGATION

GEOTECHNICAL CONSULTANTS
New Brentwood Center (L-630) June 23, 2016 Contra Costa Community College District RMA Job No.: 15-095-0 Page A-1
APPENDIX A
FIELD INVESTIGATION
A-1.00 FIELD EXPLORATION A-1.01 Number of Borings Our subsurface investigation consisted of 5 borings drilled with a CME-45B drill rig. A-1.02 Location of Borings A Site Geologic Map showing the approximate locations of the borings is presented as Figure 3. A-1.03 Boring Logging Logs of borings were prepared by one of our staff and are attached in this appendix. The logs contain factual information and interpretation of subsurface conditions between samples. The strata indicated on these logs represent the approximate boundary between earth units and the transition may be gradual. The logs show subsurface conditions at the dates and locations indicated, and may not be representative of subsurface conditions at other locations and times. Identification of the soils encountered during the subsurface exploration was made using the field identification procedure of the Unified Soils Classification System (ASTM D2488). A legend indicating the symbols and definitions used in this classification system and a legend defining the terms used in describing the relative compaction, consistency or firmness of the soil are attached in this appendix. Bag samples of the major earth units were obtained for laboratory inspection and testing, and the in-place density of the various strata encountered in the exploration was determined
GEOTECHNICAL CONSULTANTS
New Brentwood Center (L-630) June 23, 2016 Contra Costa Community College District RMA Job No.: 15-095-0 Page A-2
Well graded gravel, gravel-sand mixtures.
Poorly graded gravel or gravel-sand mixtures,
Silty gravels, gravel-sand-silt mixtures.
Clayey gravels, gravel-sand-clay mixtures.
Well graded sands, gravelly sands, little or
Poorly graded sands or gravelly sands, little
Inorganic silts and very fine sands, rock flour
silty or clayey fine sands or clayey silts
Inorganic clays of low to medium plasticity,gravelly clays, sandy clays, silty clays, lean
Organic silts and organic silty clays of low
Inorganic silts, micaceous or diatamaceous
fine sandy or silty soils, elastic silts.
Inorganic clays of high plasticity, fat clays.
Organic clays of medium to high plasticity,
BOUNDARY CLASSIFICATIONS: Soils possessing characteristics of two groups are designated by combinations of group symbols.
Pt
OH
CH
MH
OL
CL
ML
SC
SM
SP
SW
GC
GM
GP
GW
MAJOR DIVISIONSGROUP
SYMBOLSTYPICAL NAMES
CLEAN
GRAVELS
GRAVELS
WITH FINES
GRAVELS
COARSE
GRAINED
SOILS
SANDS
CLEAN
SANDS
SANDS
WITH FINES
SILTS AND CLAYS
SILTS AND CLAYS
FINE
GRAINED
SOILS
HIGHLY ORGANIC SOILS
(More than 50% of
material is LARGER
than No. 200 sieve
size)
(More than 50% of
coarse fraction is
LARGER than the
No. 4 sieve size.
(More than 50% of
coarse fraction is
SMALLER than the
No. 4 sieve size)
(Appreciable
amount of fines)
(Little or no fines)
(Appreciable amt.
of fines)
(Little or no fines)
(More than 50% of
material is SMALLER
than No. 200 sieve
size)
(Liquid limit LESS than 50)
(Liquid limit GREATER than 50)
little or no fines.
little or no fines.
no fines.
or no fines.
Silty sands, sand-silt mixtures.
Clayey sands, sand-clay mixtures.
with slight plasticity
clays.
plasticity.
organic silts.
Peat and other highly organic soils.
P A
R T
I C
L E
S
I Z
E L
I M
I T
S
SIL
T O
R C
LA
Y
SA
ND
GR
AV
EL
CO
BB
LE
SB
OU
LD
ER
S
U. S
. S
T A
N D
A R
D S
I E
V E
S
I Z
E
FIN
EM
ED
IUM
CO
AR
SE
FIN
EC
OA
RS
E
No.
200
No.
40
No.
10
No.
43/4
in.
3 in.
12 in.
UNIFIED SOIL CLASSIFICATION SYSTEM

GEOTECHNICAL CONSULTANTS
New Brentwood Center (L-630) June 23, 2016 Contra Costa Community College District RMA Job No.: 15-095-0 Page A-3
I. SOIL STRENGTH/DENSITY
BASED ON STANDARD PENETRATION TESTS
Compactness of sand Consistency of clay
Penetration Resistance N (blows/Ft)
Compactness
Penetration Resistance N (blows/ft)
Consistency
0-4 4-10 10-30 30-50 >50
Very Loose Loose Medium Dense Dense Very Dense
<2 2-4 4-8
8-15 15-30 >30
Very Soft Soft Medium Stiff Stiff Very Stiff Hard
N = Number of blows of 140 lb. weight falling 30 in. to drive 2-in OD sampler 1 ft.
BASED ON RELATIVE COMPACTION
Compactness of sand Consistency of clay
% Compaction Compactness % Compaction Consistency
<75 75-83 83-90 >90
Loose Medium Dense Dense Very Dense
<80 80-85 85-90 >90
Soft Medium Stiff Stiff Very Stiff
II. SOIL MOISTURE
Moisture of sands Moisture of clays
% Moisture Description % Moisture Description
<5% 5-12% >12%
Dry Moist Very Moist
<12% 12-20% >20%
Dry Moist Very Moist, wet
SOIL DESCRIPTION LEGEND
Material DescriptionSamples
Dep
th
(ft)
Sam
ple
Ty
pe
Blo
ws
(blo
ws/
ft)
Bu
lkS
amp
le
Mo
istu
reC
on
ten
t(%
)
Dry
Den
sity
(pcf
)
US
CS This log contains factual information and interpretation of the subsurface conditions between the
samples. The stratum indicated on this log represent the approximate boundary between earth
units and the transition may be gradual. The log show subsurface conditions at the date and
location indicated, and may not be representative of subsurface conditions at other locations and
times.
Gra
ph
ic
Sy
mb
ol
5
10
15
25
30
35
20
Date Drilled:
Logged By:
Location:
Drilling Equipment:
Borehole Diameter:
Drive Weights:
Exploratory Boring Log
B. Wilson
140 lbs. See Site Geologic Map
Boring No.Sheet of
Drop Height: 30"
- Groundwater
- End of Boring
S
T
- SPT Sample
- Modified California Tube Sample
- Bulk Sample
Sample Types: Symbols:*Note
All blow counts associated with Modified California Sample
are uncorrected. The sampler dimensions are as follows:
ID = 2.5" OD = 3"R - Ring Sample
May 23, 2016 CME 45C, SF Auger, Auto Hammer
Surface Elev.:
New Brentwood Center (L-630)Contra Costa Community College District
June 23, 2016RMA Project No.: 15-095-0
Page A - 4
GEOTECHNICAL CONSULTANTS
4.5 inches
B-11 1
B-1
Boring terminated at 21.5 feet
Groundwater encountered at 18 feet
Hole backfilled with grout
144 ft (approx.)
T
T
T
S
S
39
22
17
44
28
Artificial Fill (af): Dark brown lean clay interbedded with layers of light
brown silt and silty sand, moist, low plasticity
8.9 107.0
12.0 115.5
17.0 109.1
Valley Alluvium (Qal): Dark brown lean clay with sand, little fine to medium
sand, low plasticity, moist, very stiff
Trace fine sand, increase in plasticity
Becomes yellowish brown, decrease in plasticity
CL
Dark yellowish brown clayey sand, trace fine gravel, mostly fine sand, low
plasticity, moist, medium dense
Olive brown lean clay, trace fine gravel, trace fine sand, low plasticity, moist,
hard
SC
CL
CL

Material DescriptionSamples
Dep
th
(ft)
Sam
ple
Ty
pe
Blo
ws
(blo
ws/
ft)
Bu
lkS
amp
le
Mo
istu
reC
on
ten
t(%
)
Dry
Den
sity
(pcf
)
US
CS This log contains factual information and interpretation of the subsurface conditions between the
samples. The stratum indicated on this log represent the approximate boundary between earth
units and the transition may be gradual. The log show subsurface conditions at the date and
location indicated, and may not be representative of subsurface conditions at other locations and
times.
Gra
ph
ic
Sy
mb
ol
5
10
15
25
30
35
20
Date Drilled:
Logged By:
Location:
Drilling Equipment:
Borehole Diameter:
Drive Weights:
Exploratory Boring Log
B. Wilson
140 lbs. See Site Geologic Map
Boring No.Sheet of
Drop Height: 30"
- Groundwater
- End of Boring
S
T
- SPT Sample
- Modified California Tube Sample
- Bulk Sample
Sample Types: Symbols:*Note
All blow counts associated with Modified California Sample
are uncorrected. The sampler dimensions are as follows:
ID = 2.5" OD = 3"R - Ring Sample
May 23, 2016 CME 45C, SF Auger, Auto Hammer
Surface Elev.:
New Brentwood Center (L-630)Contra Costa Community College District
June 23, 2016RMA Project No.: 15-095-0
Page A - 5
GEOTECHNICAL CONSULTANTS
4.5 inches
T
T
T
S
S
S
38
30
15
8
93/11"
50/1"
Boring terminated at 25.5 feet due to drilling refusal
Groundwater encountered at 17 feet
Hole backfilled with grout
Valley Alluvium (Qal): Dark brown lean clay with sand, little fine to medium
sand, medium plasticity, moist, very stiff
142 ft (approx.)
B-21 1
Artificial Fill (af): brown lean clay with sand, low plasticity, moist
Becomes dark reddish brown
SM
CL
Light yellowish brown silty sand, mostly fine sand, non-plastic10.0 119.7
12.4 108.5
23.9 100.1
CL
CL Olive brown lean clay, moist, hard, some reddish brown mottle
Meganos Formation bedrock (Tm): Dark gray claystone
Dark olive brown silt, trace fine sand, stiffML

Material DescriptionSamples
Dep
th
(ft)
Sam
ple
Ty
pe
Blo
ws
(blo
ws/
ft)
Bu
lkS
amp
le
Mo
istu
reC
on
ten
t(%
)
Dry
Den
sity
(pcf
)
US
CS This log contains factual information and interpretation of the subsurface conditions between the
samples. The stratum indicated on this log represent the approximate boundary between earth
units and the transition may be gradual. The log show subsurface conditions at the date and
location indicated, and may not be representative of subsurface conditions at other locations and
times.
Gra
ph
ic
Sy
mb
ol
5
10
15
25
30
35
20
Date Drilled:
Logged By:
Location:
Drilling Equipment:
Borehole Diameter:
Drive Weights:
Exploratory Boring Log
B. Wilson
140 lbs. See Site Geologic Map
Boring No.Sheet of
Drop Height: 30"
- Groundwater
- End of Boring
S
T
- SPT Sample
- Modified California Tube Sample
- Bulk Sample
Sample Types: Symbols:*Note
All blow counts associated with Modified California Sample
are uncorrected. The sampler dimensions are as follows:
ID = 2.5" OD = 3"R - Ring Sample
May 23, 2016 CME 45C, SF Auger, Auto Hammer
Surface Elev.:
New Brentwood Center (L-630)Contra Costa Community College District
June 23, 2016RMA Project No.: 15-095-0
Page A - 6
GEOTECHNICAL CONSULTANTS
4.5 inches
B-31 1
144 ft (approx.)
T
T
T
S
S
S
S
S 50/6"
50/5"
40
15
41
36
35
89/10"
Boring terminated at 36.5 feet
Groundwater encountered at 17 feet
Hole backfilled with grout
Valley Alluvium (Qal): Dark reddish brown lean clay, medium plasticity,
moist, very stiff
11.2 107.7
112.214.8
Becomes sandy
Olive brown lean clay, low plasticity, moist, hard
Meganos formation bedrock (Tm): Dark gray claystone
Reddish brown sandy silt, fine to medium sand, moist, stiff
Becomes gravelly
CL
12.7 119.4
CL
Artificial Fill (af): Dark brown lean clay interbedded with layers of light
brown silt and silty sand, moist, low plasticity
CL
ML

Material DescriptionSamples
Dep
th
(ft)
Sam
ple
Ty
pe
Blo
ws
(blo
ws/
ft)
Bu
lkS
amp
le
Mo
istu
reC
on
ten
t(%
)
Dry
Den
sity
(pcf
)
US
CS This log contains factual information and interpretation of the subsurface conditions between the
samples. The stratum indicated on this log represent the approximate boundary between earth
units and the transition may be gradual. The log show subsurface conditions at the date and
location indicated, and may not be representative of subsurface conditions at other locations and
times.
Gra
ph
ic
Sy
mb
ol
5
10
15
25
30
35
20
Date Drilled:
Logged By:
Location:
Drilling Equipment:
Borehole Diameter:
Drive Weights:
Exploratory Boring Log
B. Wilson
140 lbs. See Site Geologic Map
Boring No.Sheet of
Drop Height: 30"
- Groundwater
- End of Boring
S
T
- SPT Sample
- Modified California Tube Sample
- Bulk Sample
Sample Types: Symbols:*Note
All blow counts associated with Modified California Sample
are uncorrected. The sampler dimensions are as follows:
ID = 2.5" OD = 3"R - Ring Sample
May 23, 2016 CME 45C, SF Auger, Auto Hammer
Surface Elev.:
New Brentwood Center (L-630)Contra Costa Community College District
June 23, 2016RMA Project No.: 15-095-0
Page A - 7
GEOTECHNICAL CONSULTANTS
4.5 inches
B-41 1
143 ft (approx.)
T
T
T
S
S
22
77
35
23
18
Valley Alluvium (Qal): Dark brown lean clay, medium plasticity, moist, stiff
Becomes reddish brown lean clay with sand, medium to coarse sand, medium
plastic clayey fines, moist, stiff
Brown poorly graded sand, mostly medium to coarse, trace clayey fines, wet,
medium dense
Light grayish brown fat clay, trace fine sand, moist, high plasticity, hardCH
SP
CL
Boring terminated at 21.5 feet
Groundwater encountered at 16 feet
Hole backfilled with grout
11.1 120.4
17.7 107.3
11.3
Becomes yellowish brown

Material DescriptionSamples
Dep
th
(ft)
Sam
ple
Ty
pe
Blo
ws
(blo
ws/
ft)
Bu
lkS
amp
le
Mo
istu
reC
on
ten
t(%
)
Dry
Den
sity
(pcf
)
US
CS This log contains factual information and interpretation of the subsurface conditions between the
samples. The stratum indicated on this log represent the approximate boundary between earth
units and the transition may be gradual. The log show subsurface conditions at the date and
location indicated, and may not be representative of subsurface conditions at other locations and
times.
Gra
ph
ic
Sy
mb
ol
5
10
15
25
30
35
20
Date Drilled:
Logged By:
Location:
Drilling Equipment:
Borehole Diameter:
Drive Weights:
Exploratory Boring Log
B. Wilson
140 lbs. See Site Geologic Map
Boring No.Sheet of
Drop Height: 30"
- Groundwater
- End of Boring
S
T
- SPT Sample
- Modified California Tube Sample
- Bulk Sample
Sample Types: Symbols:*Note
All blow counts associated with Modified California Sample
are uncorrected. The sampler dimensions are as follows:
ID = 2.5" OD = 3"R - Ring Sample
May 23, 2016 CME 45C, SF Auger, Auto Hammer
Surface Elev.:
New Brentwood Center (L-630)Contra Costa Community College District
June 23, 2016RMA Project No.: 15-095-0
Page A - 8
GEOTECHNICAL CONSULTANTS
4.5 inches
T
T
T
S
S
B-51 1
141 ft (approx.)
Valley Alluvium (Qal): Dark reddish brown lean clay, trace fine sand,
medium plasticity, moist, very stiff
18
44
29
52
50/4"
S 50/5"
S 67
S 71/11"
SP Yellowish brown poorly graded sand, medium to coarse, trace clayey fines,
wet, very dense
Boring terminated at 36.5 feet due to drilling refusal
Groundwater encountered at 15.5 feet
Hole backfilled with grout
Dark reddish brown clayey sand with gravel, some subangular gravel (1" max
diameter), mostly fine to medium sand, little medium plastic clayey fines,
moist, medium dense
Becomes very dense
CL
SC
Yellowish brown sandy silt, fine to medium sand, low to medium plasticity,
moist, hard, horizontal seams of gray, red, and brown approximately 1 mm
thick
ML
Grayish brown fat clay, high plasticity, moist, hardCH
Meganos formation bedrock (Tm): Dark gray claystone
15.0 114.4
9.0 119.3

GEOTECHNICAL CONSULTANTS
APPENDIX B
REFERENCED BORING LOGS

3/4 "41040
MORE THAN HALFCOARSE FRACTION
IS LARGER THANNO. 4 SIEVE SIZE
200
OH - Highly plastic organic silts and clays
For fine-grained soil with >30% retained on the #200 sieve, the words "sandy" or "gravelly" (whichever is predominant) are added to the group name.
For fine-grained soils with 15 to 29% retained on the #200 sieve, the words "with sand" or "with gravel" (whichever is predominant) are added to the group name.
FIN
E-G
RA
INE
D S
OIL
S M
OR
ET
HA
N H
ALF
OF
MA
T'L
SM
ALL
ER
TH
AN
#20
0 S
IEV
E
CO
AR
SE
-GR
AIN
ED
SO
ILS
MO
RE
TH
AN
HA
LF O
F M
AT
'L L
AR
GE
R T
HA
N #
200
SIE
VE
SILTS AND CLAYS LIQUID LIMIT 50 % OR LESS
U.S. STANDARD SERIES SIEVE SIZE
SILTS AND CLAYS LIQUID LIMIT GREATER THAN 50 %
PT - Peat and other highly organic soils
KEY TO SOIL LOGS
CH - Fat clay with high plasticity
SC - Clayey sand, sand-clay mixtures
GP - Poorly graded gravels or gravel-sand mixtures
Grab Samples
Dusty, dry to touch
Solid - Layer Break
LINE TYPES
WET Visible freewater
MOIST Damp but no visible waterDRY
Groundwater level during drilling
MOISTURE CONDITION
* Unconfined compressive strength in tons/sq. ft., asterisk on log means determined by pocket penetrometer
(S.P.T.) Number of blows of 140 lb. hammer falling 30" to drive a 2-inch O.D. (1-3/8 inch I.D.) sampler
12"3"
No Recovery
Bag Samples
GRAIN SIZESCLEAR SQUARE SIEVE OPENINGS
MAJOR TYPES
NR
Continuous Core_ _ _ _ _ _
S.P.T. - Split spoon sampler
Dashed - Gradational or approximate layer break
Modified California (3" O.D.) sampler
GROUND-WATER SYMBOLS
California (2.5" O.D.) sampler
SAMPLER SYMBOLS
Stabilized groundwater level
Shelby Tube
SANDS WITH OVER 12 % FINES
GM - Silty gravels, gravel-sand and silt mixtures
HIGHLY ORGANIC SOILS
GRAVELS WITH OVER 12 % FINES
GRAVELS
DESCRIPTION
MH - Elastic silt with high plasticity
OL - Low plasticity organic silts and clays
GW - Well graded gravels or gravel-sand mixtures
CLEAN SANDS WITHLESS THAN 5% FINES
OVER 4
STRENGTH*
FINE
RELATIVE DENSITY CONSISTENCY
SANDSMORE THAN HALF
COARSE FRACTIONIS SMALLER THANNO. 4 SIEVE SIZE
CL - Inorganic clay with low to medium plasticity
ML - Inorganic silt with low to medium plasticity
SM - Silty sand, sand-silt mixtures
SP - Poorly graded sands or gravelly sand mixtures
SW - Well graded sands, or gravelly sand mixtures
GC - Clayey gravels, gravel-sand and clay mixtures
LOOSE
SILTSAND
CLAYS
VERY DENSE
0-4
BLOWS/FOOT SILTS AND CLAYS
SOFTVERY SOFT
STIFF
HARD2-41-2
1/4-1/20-1/4
CLEAN GRAVELS WITHLESS THAN 5% FINES
1/2-1
VERY STIFF
VERY LOOSE
DENSEMEDIUM DENSE
(S.P.T.)
GRAVELSAND
FINE COARSEBOULDERS
SANDS AND GRAVELS
4-10
OVER 5030-5010-30
MEDIUM STIFF
MEDIUM COARSECOBBLES

+4.5*+4.5*
+4.5*
4.5*
+4.5*
36
22
31
30
18
22
15
72
1349
CLAYEY SAND (SC/CL), olive brown, moist, medium plasticity,approximately 50% fines, fine-grained sand, [FILL]SANDY CLAY (CL), olive brown mottled with reddish brown,hard, moist, medium plasticity, approximately 30% fine-grainedsand, [FILL]SILT WITH SAND (ML), brown, hard, moist, approximately20% fine-grained sandSILTY CLAY (CL-CH), brown, hard, moist, high plasticity,approximately 20% fine-grained sand
LEAN CLAY (CL), brown, hard, moist, medium plasticity,approximately 5% fine-grained sand
SILT WITH SAND (ML), brown, hard, moist, low plasticity,approximately 25% fine-grained sand
SILTY SAND (SM), reddish brown, medium dense, moist, fine-to medium-grained sand, approximately 30% fines
At 20 feet, grading with approximately 5% fine subroundedgravelSANDY LEAN CLAY (CL), olive brown, stiff, moist, mediumplasticity, approximately 30% fine-grained sand, approximately5% fine subrounded gravel
SILTY CLAY (CL), olive brown, hard, moist, low plasticity, tracefine-grained sand
CLAYSTONE, dark gray, very weak (R1), laminated,moderately weathered (WM), damp, bedding appears to dipapproximately 40 degrees
Dep
th in
Met
ers
1
2
3
4
5
6
7
8
9
Dep
th in
Fee
t
5
10
15
20
25
30
Sam
ple
Typ
e
LOG OF BORING 1-B1LOGGED / REVIEWED BY:DRILLING CONTRACTOR:
DRILLING METHOD:HAMMER TYPE:
Unc
onfin
ed S
tren
gth
(tsf
) *f
ield
app
rox
Dry
Uni
t Wei
ght
(pcf
)
Moi
stur
e C
onte
nt(%
dry
wei
ght)
Pla
stic
ity In
dex
Blo
w C
ount
/Foo
t
Wat
er L
evel
Fin
es C
onte
nt(%
pas
sing
#20
0 si
eve)
Atterberg Limits
M. Turner / SHBritton ExplorationHollow Stem Auger140 lb. Auto Trip
Field ExplorationL630 New Brentwood Center
Brentwood, CA3229.001.001
Pla
stic
Lim
it
Liqu
id L
imitDESCRIPTION
12/29/2009Approx. 51 ft.8.0 in.Approx. 140 ft.
DATE DRILLED:HOLE DEPTH:
HOLE DIAMETER:SURF ELEV (msl):
Log
Sym
bol
LO
G -
GE
OT
EC
HN
ICA
L
32
29
.00
1.0
01
B-1
GE
OH
AZ
AR
D R
PT
.GP
J E
NG
EO
IN
C.G
DT
1
/29
/10

+4.5*
+4.5*
+4.5*
+4.5*
50/4"
86/11"
92/11"
50/6"
50/6"
CLAYSTONE, dark gray, very weak (R1), laminated,moderately weathered (WM), damp, bedding appears to dipapproximately 40 degrees
Boring terminated at approximately 51 feet. No Groundwaterencountered.
Dep
th in
Met
ers
10
11
12
13
14
15
Dep
th in
Fee
t
35
40
45
50
Sam
ple
Typ
e
LOG OF BORING 1-B1LOGGED / REVIEWED BY:DRILLING CONTRACTOR:
DRILLING METHOD:HAMMER TYPE:
Unc
onfin
ed S
tren
gth
(tsf
) *f
ield
app
rox
Dry
Uni
t Wei
ght
(pcf
)
Moi
stur
e C
onte
nt(%
dry
wei
ght)
Pla
stic
ity In
dex
Blo
w C
ount
/Foo
t
Wat
er L
evel
Fin
es C
onte
nt(%
pas
sing
#20
0 si
eve)
Atterberg Limits
M. Turner / SHBritton ExplorationHollow Stem Auger140 lb. Auto Trip
Field ExplorationL630 New Brentwood Center
Brentwood, CA3229.001.001
Pla
stic
Lim
it
Liqu
id L
imitDESCRIPTION
12/29/2009Approx. 51 ft.8.0 in.Approx. 140 ft.
DATE DRILLED:HOLE DEPTH:
HOLE DIAMETER:SURF ELEV (msl):
Log
Sym
bol
LO
G -
GE
OT
EC
HN
ICA
L
32
29
.00
1.0
01
B-1
GE
OH
AZ
AR
D R
PT
.GP
J E
NG
EO
IN
C.G
DT
1
/29
/10

GEOTECHNICAL CONSULTANTS
APPENDIX C
LABORATORY TESTS
GEOTECHNICAL CONSULTANTS
New Brentwood Center (L-630) June 23, 2016 Contra Costa Community College District RMA Job No.: 15-095-0 Page C-1
APPENDIX C
LABORATORY TESTS
C-1.00 LABORATORY TESTS C-1.01 Maximum Density Maximum density - optimum moisture relationships for the major soil types encountered during the field exploration were performed in the laboratory using the standard procedures of ASTM D1557. C-1.02 Atterberg Limits The liquid limit, plastic limit, and the plasticity index of the major soil types encountered in the test holes were determined using the standard test methods of ASTM D4318. C-1.03 Expansion Tests Expansion index tests were performed on representative samples of the major soil types encountered by the test methods outlined in ASTM D4829. C-1.04 Soluble Sulfates and Chlorides Tests were performed on representative samples encountered during the investigation in accordance with California Test Methods 417 and 422. These tests were performed by Sunland Analytical located in Rancho Cordova, California. C-1.05 Soil Reactivity (pH) and Electrical Conductivity (Ec) Representative soil samples were tested for soil reactivity (pH) and minimum electrical resistivity using California Test Method 643. The pH measurement determines the degree of acidity or alkalinity in the soils. The minimum electrical resistivity is used as an indicator of how corrosive the soil is relative to buried metallic items. These tests were performed by Sunland Analytical located in Rancho Cordova, California. C-1.06 Particle Size Analysis Particle size analysis was performed on representative samples of the major soils types in accordance to the standard test methods of the ASTM D422. The hydrometer portion of the standard procedure was not performed and the material retained on the #200 screen was washed. C-1.07 Direct Shear Direct shear tests were performed on representative samples of the major soil types encountered in the test holes using the standard test method of ASTM D3080 (consolidated and drained). Tests were performed on remolded samples. Remolded samples were tested at 90 percent relative compaction.
Shear tests were performed on a direct shear machine of the strain-controlled type. To simulate possible adverse field conditions, the samples were saturated prior to shearing. Several samples were sheared at varying normal loads and the results plotted to establish the angle of the internal friction and cohesion of the tested samples. C-1.08 Resistance Value (R-Value) Resistance Value tests were performed on representative samples of the major soil types encountered by the test methods outlined in ASTM D2844. C-1.09 Moisture Determination Moisture content of the soil samples was performed in accordance to standard method for determination of water content of soil by drying oven, ASTM D2216. The mass of material remaining after oven drying is used as the mass of the solid particles.

GEOTECHNICAL CONSULTANTS
New Brentwood Center (L-630) June 23, 2016 Contra Costa Community College District RMA Job No.: 15-095-0 Page C-2
C-1.10 Density of Split-Barrel Samples Soil samples were obtained by using a split-barrel sampler in accordance to standard method of ASTM D1586 C-1.11 Test Results Test results for all laboratory tests performed on the subject project are presented in this appendix.

GEOTECHNICAL CONSULTANTS
New Brentwood Center (L-630) June 23, 2016 Contra Costa Community College District RMA Job No.: 15-095-0 Page C-3
SAMPLE INFORMATION
Sample Number
Sample Description
Sample Location
Boring No. Depth (ft)
1 Dark brown lean clay with sand (CL) S-1 0-4
2 Dark brown lean clay with sand (CL) B-1 5
3 Dark yellowish brown clayey sand (SC) B-1 15
4 Brown lean clay (CL) B-3 10
5 Brown sandy lean clay (CL) B-3 5-10
6 Reddish brown lean clay (CL) B-4 10
7 Light grayish brown fat clay with sand (CH) B-4 20
8 Dark reddish brown lean clay (CL) B-5 1-10
MAXIMUM DENSITY - OPTIMUM MOISTURE (Test Method: ASTM D1557)
Sample Number
Optimum Moisture (Percent)
Maximum Density (lbs/ft3)
5 12.9 120.9
ATTERBERG LIMITS (Test Method: ASTM D4318)
Sample Location Liquid Limit Plastic Index
Soil Classification
2 34 20 CL
5 35 20 CL
6 32 16 CL
7 51 32 CH
GEOTECHNICAL CONSULTANTS
New Brentwood Center (L-630) June 23, 2016 Contra Costa Community College District RMA Job No.: 15-095-0 Page C-4
EXPANSION INDEX Test Method: ASTM D4829
Sample Number
Molding Moisture Content (Percent)
Final Moisture Content (Percent)
Initial Dry
Density (lbs/ft3)
Expansion Index
Expansion Classification
5 10.5 21.2 108.9 50 Low
8 10.0 19.7 110.6 50 Low
SOLUBLE SULFATES Test Method: CTM 417
Sample Number
Soluble Sulfate (ppm)
5 156.4
SOLUBLE CHLORIDE Test Method: CTM 422
Sample Number
Soluble Chloride (ppm)
5 58.3
SOIL REACTIVITY (pH) AND ELECTRICAL CONDUCTIVITY Test Method: CTM 643
Sample Number
pH
Resistivity (Ohm-cm)
5 8.17 540

GEOTECHNICAL CONSULTANTS
New Brentwood Center (L-630) June 23, 2016 Contra Costa Community College District RMA Job No.: 15-095-0 Page C-5
PERCENT PASSING #200 SIEVE (Test Method: ASTM D422)
Sample Location
Percent Passing #200 Sieve
3 41.5
5 76.5
4 56.7
7 74.0

GEOTECHNICAL CONSULTANTS
New Brentwood Center (L-630) June 23, 2016 Contra Costa Community College District RMA Job No.: 15-095-0 Page C-6

GEOTECHNICAL CONSULTANTS
New Brentwood Center (L-630) June 23, 2016 Contra Costa Community College District RMA Job No.: 15-095-0 Page C-7
ASTM D2844 - Determination of Resistance "R" Value of Treated and Untreated Bases, Subbases
and Basement Soils by Stabilometer
Sample No. 1
Specimen No A B C
Moisture Content (%) 13.7 16.2 18.7
Dry Density (pcf) 121.9 115.8 113.4
Exudation Pressure (psi) 644 358 243
Stabilometer R Value 15 9 5
Expansion Pressure Dial 0 0 0
Thickness by Expansion (ft)
Thickness by Stabilometer (ft) 0.84 0.90 0.94
Equilibrium Thick (ft) -
Equilibrium Pressure R Value n/a
Exudation Pressure R Value @ 300 psi 7 Use Exudation R Value
0.00
0.20
0.40
0.60
0.80
1.00
1.20
1.40
1.60
1.80
2.00
0.00 0.50 1.00 1.50 2.00
Co
ver T
hic
kne
ss b
y St
abilo
me
ter (
ft)
Cover Thickness by Expansion Pressure (ft)
Expansion Pressures
0
10
20
30
40
50
60
70
80
90
100
0 100 200 300 400 500 600 700 800
Stab
ilom
ete
r R V
alu
e
Exudation Pressure (psi)
Exudation Pressures

GEOTECHNICAL CONSULTANTS
APPENDIX D
GENERAL EARTHWORK AND GRADING SPECIFICATIONS

GEOTECHNICAL CONSULTANTS
New Brentwood Center (L-630) June 23, 2016 Contra Costa Community College District RMA Job No.: 15-095-0 Page D-1
APPENDIX C
GENERAL EARTHWORK AND GRADING SPECIFICATIONS
D-1.00 GENERAL DESCRIPTION
D-1.01 Introduction
These specifications present our general recommendations for earthwork and grading as shown on the approved grading
plans for the subject project. These specifications shall cover all clearing and grubbing, removal of existing structures,
preparation of land to be filled, filling of the land, spreading, compaction and control of the fill, and all subsidiary work
necessary to complete the grading of the filled areas to conform with the lines, grades and slopes as shown on the
approved plans.
The recommendations contained in the geotechnical report of which these general specifications are a part of shall
supersede the provisions contained hereinafter in case of conflict.
D-1.02 Laboratory Standard and Field Test Methods
The laboratory standard used to establish the maximum density and optimum moisture shall be ASTM D1557.
The insitu density of earth materials (field compaction tests) shall be determined by the sand cone method (ASTM
D1556), direct transmission nuclear method (ASTM D2922) or other test methods as considered appropriate by the
geotechnical consultant.
Relative compaction is defined, for purposes of these specifications, as the ratio of the in-place density to the maximum
density as determined in the previously mentioned laboratory standard.
D-2.00 CLEARING
D-2.01 Surface Clearing
All structures marked for removal, timber, logs, trees, brush and other rubbish shall be removed and disposed of off the
site. Any trees to be removed shall be pulled in such a manner so as to remove as much of the root system as possible.
D-2.02 Subsurface Removals
A thorough search should be made for possible underground storage tanks and/or septic tanks and cesspools. If found,
tanks should be removed and cesspools pumped dry.
Any concrete irrigation lines shall be crushed in place and all metal underground lines shall be removed from the site.
D-2.03 Backfill of Cavities
All cavities created or exposed during clearing and grubbing operations or by previous use of the site shall be cleared of
deleterious material and backfilled with native soils or other materials approved by the soil engineer. Said backfill shall be
compacted to a minimum of 90% relative compaction.

GEOTECHNICAL CONSULTANTS
New Brentwood Center (L-630) June 23, 2016 Contra Costa Community College District RMA Job No.: 15-095-0 Page D-2
D-3.00 ORIGINAL GROUND PREPARATION
D-3.01 Stripping of Vegetation
After the site has been properly cleared, all vegetation and topsoil containing the root systems of former vegetation shall
be stripped from areas to be graded. Materials removed in this stripping process may be used as fill in areas designated by
the soil engineer, provided the vegetation is mixed with a sufficient amount of soil to assure that no appreciable settlement
or other detriment will occur due to decaying of the organic matter. Soil materials containing more than 3% organics shall
not be used as structural fill.
D-3.02 Removals of Non-Engineered Fills
Any non-engineered fills encountered during grading shall be completely removed and the underlying ground shall be
prepared in accordance to the recommendations for original ground preparation contained in this section. After cleansing
of any organic matter the fill material may be used for engineered fill.
D-3.03 Overexcavation of Fill Areas
The existing ground in all areas determined to be satisfactory for the support of fills shall be scarified to a minimum depth
of 6 inches. Scarification shall continue until the soils are broken down and free from lumps or clods and until the
scarified zone is uniform. The moisture content of the scarified zone shall be adjusted to within 2% of optimum
moisture. The scarified zone shall then be uniformly compacted to 90% relative compaction. Where fill material is to be placed on ground with slopes steeper than 5:1 (H:V) the sloping ground shall be benched. The lowermost bench shall be a minimum of 15 feet wide, shall be a minimum of 2 feet deep, and shall expose firm material as determined by the geotechnical consultant. Other benches shall be excavated to firm material as determined by the geotechnical consultant and shall have a minimum width of 4 feet. Existing ground that is determined to be unsatisfactory for the support of fills shall be overexcavated in accordance to the recommendations contained in the geotechnical report of which these general specifications are a part.
D-4.00 FILL MATERIALS
D-4.01 General
Materials for the fill shall be free from vegetable matter and other deleterious substances, shall not contain rocks or lumps of a greater dimension than is recommended by the geotechnical consultant, and shall be approved by the geotechnical consultant. Soils of poor gradation, expansion, or strength properties shall be placed in areas designated by the geotechnical consultant or shall be mixed with other soils providing satisfactory fill material.
D-4.02 Oversize Material
Oversize material, rock or other irreducible material with a maximum dimension greater than 12 inches, shall not be placed in fills, unless the location, materials, and disposal methods are specifically approved by the geotechnical consultant. Oversize material shall be placed in such a manner that nesting of oversize material does not occur and in such a manner that the oversize material is completely surrounded by fill material compacted to a minimum of 90% relative compaction. Oversize material shall not be placed within 10 feet of finished grade without the approval of the geotechnical consultant.

GEOTECHNICAL CONSULTANTS
New Brentwood Center (L-630) June 23, 2016 Contra Costa Community College District RMA Job No.: 15-095-0 Page D-3
D-4.03 Import
Material imported to the site shall conform to the requirements of Section 4.01 of these specifications. Potential import material shall be approved by the geotechnical consultant prior to importation to the subject site.
D-5.00 PLACING AND SPREADING OF FILL
D-5.01 Fill Lifts
The selected fill material shall be placed in nearly horizontal layers which when compacted will not exceed approximately 6 inches in thickness. Thicker lifts may be placed if testing indicates the compaction procedures are such that the required compaction is being achieved and the geotechnical consultant approves their use. Each layer shall be spread evenly and shall be thoroughly blade mixed during the spreading to insure uniformity of material in each layer.
D-5.02 Fill Moisture
When the moisture content of the fill material is below that recommended by the soils engineer, water shall then be added until he moisture content is as specified to assure thorough bonding during the compacting process. When the moisture content of the fill material is above that recommended by the soils engineer, the fill material shall be aerated by blading or other satisfactory methods until the moisture content is as specified.
D-5.03 Fill Compaction
After each layer has been placed, mixed, and spread evenly, it shall be thoroughly compacted to not less than 90% relative compaction. Compaction shall be by sheepsfoot rollers, multiple-wheel pneumatic tired rollers, or other types approved by the soil engineer. Rolling shall be accomplished while the fill material is at the specified moisture content. Rolling of each layer shall be continuous over its entire area and the roller shall make sufficient trips to insure that the desired density has been obtained.
D-5.04 Fill Slopes
Fill slopes shall be compacted by means of sheepsfoot rollers or other suitable equipment. Compacting of the slopes may be done progressively in increments of 3 to 4 feet in fill height. At the completion of grading, the slope face shall be compacted to a minimum of 90% relative compaction. This may require track rolling or rolling with a grid roller attached to a tractor mounted side-boom. Slopes may be over filled and cut back in such a manner that the exposed slope faces are compacted to a minimum of 90% relative compaction. The fill operation shall be continued in six inch (6") compacted layers, or as specified above, until the fill has been brought to the finished slopes and grades as shown on the accepted plans.
D-5.05 Compaction Testing
Field density tests shall be made by the geotechnical consultant of the compaction of each layer of fill. Density tests shall be made at locations selected by the geotechnical consultant.

GEOTECHNICAL CONSULTANTS
New Brentwood Center (L-630) June 23, 2016 Contra Costa Community College District RMA Job No.: 15-095-0 Page D-4
Frequency of field density tests shall be not less than one test for each 2.0 feet of fill height and at least every one thousand cubic yards of fill. Where fill slopes exceed four feet in height their finished faces shall be tested at a frequency of one test for each 1000 square feet of slope face. Where sheepsfoot rollers are used, the soil may be disturbed to a depth of several inches. Density reading shall be taken in the compacted material below the disturbed surface. When these readings indicate that the density of any layer of fill or portion thereof is below the required density, the particular layer or portion shall be reworked until the required density has been obtained. D-6.00 SUBDRAINS
D-6.01 Subdrain Material
Subdrains shall be constructed of a minimum 4-inch diameter pipe encased in a suitable filter material. The subdrain pipe shall be Schedule 40 Acrylonitrile Butadiene Styrene (ABS) or Schedule 40 Polyvinyl Chloride Plastic (PVC) pipe or approved equivalent. Subdrain pipe shall be installed with perforations down. Filter material shall consist of 3/4" to 1 1/2" clean gravel wrapped in an envelope of filter fabric consisting of Mirafi 140N or approved equivalent.
D-6.02 Subdrain Installation
Subdrain systems, if required, shall be installed in approved ground to conform the approximate alignment and details shown on the plans or herein. The subdrain locations shall not be changed or modified without the approval of the geotechnical consultant. The geotechnical consultant may recommend and direct changes in the subdrain line, grade or material upon approval by the design civil engineer and the appropriate governmental agencies.
D-7.00 EXCAVATIONS
D-7.01 General
Excavations and cut slopes shall be examined by the geotechnical consultant. If determined necessary by the geotechnical consultant, further excavation or overexcavation and refilling of overexcavated areas shall be performed, and/or remedial grading of cut slopes shall be performed.
D-7.02 Fill-Over-Cut Slopes
Where fill-over-cut slopes are to be graded the cut portion of the slope shall be made and approved by the geotechnical consultant prior to placement of materials for construction of the fill portion of the slope.
D-8.00 TRENCH BACKFILL
D-8.01 General
Trench backfill within street right of ways shall be compacted to 90% relative compaction as determined by the ASTM D1557 test method. Backfill may be jetted as a means of initial compaction; however, mechanical compaction will be required to obtain the required percentage of relative compaction. If trenches are jetted, there must be a suitable delay for drainage of excess water before mechanical compaction is applied.

GEOTECHNICAL CONSULTANTS
New Brentwood Center (L-630) June 23, 2016 Contra Costa Community College District RMA Job No.: 15-095-0 Page D-5
D-9.00 SEASONAL LIMITS
D-9.01 General
No fill material shall be placed, spread or rolled while it is frozen or thawing or during unfavorable weather conditions. When the work is interrupted by heavy rain, fill operations shall not be resumed until field tests by the soils engineer indicate that the moisture content and density of the fill are as previously specified.
D-10.00 SUPERVISION
D-10.01 Prior to Grading
The site shall be observed by the geotechnical consultant upon completion of clearing and grubbing, prior to the preparation of any original ground for preparation of fill. The supervisor of the grading contractor and the field representative of the geotechnical consultant shall have a meeting and discuss the geotechnical aspects of the earthwork prior to commencement of grading.
D-10.02 During Grading
Site preparation of all areas to receive fill shall be tested and approved by the geotechnical consultant prior to the placement of any fill. The geotechnical consultant or his representative shall observe the fill and compaction operations so that he can provide an opinion regarding the conformance of the work to the recommendations contained in this report.

GEOTECHNICAL CONSULTANTS
New Brentwood Center (L-630) June 23, 2016 Contra Costa Community College District RMA Job No.: 15-095-0 Page D-6
RETAINING WALL DRAINAGE DETAIL
Soil backfill, compacted to
90% relative compaction*
Filter fabric envelope
(Mirafi 140N or approved
equivalent) **
Minimum of 1 cubic foot
3" diameter perforated
PVC pipe (schedule 40 or
equivalent) with perforations
oriented down as depicted
minimum 1% gradient to
suitable outlet.
3" min.
Wall footing
Compacted fill
Finished Grade
Retaining wall
Wall waterproofing
per architect's
specifications
* Based on ASTM D1557
** If class 2 permeable material (See
gradation to left) is used in place of
3/4" - 1 1/2" gravel. Filter fabric may
be deleted. Class 2 permeable material
compacted to 90% relative compaction. *
SPECIFICATIONS FOR CLASS 2
PERMEABLE MATERIAL
(CAL TRANS SPECIFICATIONS)
Sieve Size % Passing1"
3/4"
3/8"
No.4
No.8
No.30
No.50
No.200 0-3
0-7
5-15
18-33
25-40
40-100
90-100
100
per linear foot of 3/4"crushed rock
50 feet on center to a
joints or outlet drain atProvide open cell head
suitable drainage device
.
..
.
.
.
.
..
.
.
.
.

GEOTECHNICAL CONSULTANTS
APPENDIX E
SEISMICALLY INDUCED SETTTLMENT CALCULATIONS

GEOTECHNICAL CONSULTANTS
New Brentwood Center (L-630) June 23, 2016 Contra Costa Community College District RMA Job No.: 15-095-0 Page E-8
Liq
uefy
Pro
C
ivilT
ech S
oftw
are
U
SA
w
ww
.civ
ilte
ch.c
om
LIQUEFACTION ANALYSISNEW BRENTWOOD CENTER
Hole No.=B-4 Water Depth=16 ft Surface Elev.=143 Magnitude=6.57
Acceleration=0.602g
(ft)0
5
10
15
20
25
30
35
Lean Clay
Poorly graded Sand
Fat Clay
Shear Stress Ratio
CRR CSR fs1Shaded Zone has Liquefaction Potential
0 2Soil DescriptionFactor of Safety
0 51Settlement
SaturatedUnsaturat.
S = 0.01 in.
0 (in.) 1
fs1=1.00

GEOTECHNICAL CONSULTANTS
New Brentwood Center (L-630) June 23, 2016 Contra Costa Community College District RMA Job No.: 15-095-0 Page E-9
*******************************************************************************************************
LIQUEFACTION ANALYSIS SUMMARY
COPYRIGHT BY CIVILTECH SOFTWARE
WWW.CIVILTECH.COM
*******************************************************************************************************
FONT: COURIER NEW, REGULAR, SIZE 8 IS RECOMMENDED FOR THIS REPORT.
LICENSED TO , 6/22/2016 10:10:48 AM
INPUT FILE NAME: C:\USERS\JSUMMERS.RMA\BOX SYNC\RMA WORKING DOCUMENTS\_PROJECTS\BRENTWOOD
CAMPUS\GEOTECH REPORT\LIQUIFACTION AND SEISMIC INDUCED SETTLEMENT\B-4.LIQ
TITLE: NEW BRENTWOOD CENTER
SUBTITLE:
SURFACE ELEV.=143
HOLE NO.=B-4
DEPTH OF HOLE= 21.50 FT
WATER TABLE DURING EARTHQUAKE= 16.00 FT
WATER TABLE DURING IN-SITU TESTING= 16.00 FT
MAX. ACCELERATION= 0.6 G
EARTHQUAKE MAGNITUDE= 6.57
INPUT DATA:
SURFACE ELEV.=143
HOLE NO.=B-4
DEPTH OF HOLE=21.50 FT
WATER TABLE DURING EARTHQUAKE= 16.00 FT
WATER TABLE DURING IN-SITU TESTING= 16.00 FT
MAX. ACCELERATION=0.6 G
EARTHQUAKE MAGNITUDE=6.57
NO-LIQUEFIABLE SOILS: CL, OL ARE NON-LIQ. SOIL
1. SPT OR BPT CALCULATION.
2. SETTLEMENT ANALYSIS METHOD: TOKIMATSU, M-CORRECTION
3. FINES CORRECTION FOR LIQUEFACTION: IDRISS/SEED
4. FINE CORRECTION FOR SETTLEMENT: DURING LIQUEFACTION*
5. SETTLEMENT CALCULATION IN: ALL ZONES*
6. HAMMER ENERGY RATIO, CE = 1.25
7. BOREHOLE DIAMETER, CB= 1.15
8. SAMPLING METHOD, CS= 1
9. USER REQUEST FACTOR OF SAFETY (APPLY TO CSR) , USER= 1
PLOT ONE CSR CURVE (FS1=USER)
10. USE CURVE SMOOTHING: YES*
* RECOMMENDED OPTIONS
IN-SITU TEST DATA:
DEPTH SPT GAMMA FINES
FT PCF %
____________________________________
2.00 11.00 133.00 NOLIQ
5.00 14.00 133.00 NOLIQ
10.00 21.00 126.00 NOLIQ
15.00 22.00 125.00 0.00
20.00 77.00 120.00 0.00
____________________________________
OUTPUT RESULTS:
SETTLEMENT OF SATURATED SANDS=0.00 IN.
SETTLEMENT OF UNSATURATED SANDS=0.01 IN.
TOTAL SETTLEMENT OF SATURATED AND UNSATURATED SANDS=0.01 IN.
DIFFERENTIAL SETTLEMENT=0.003 TO 0.004 IN.
DEPTH CRRM CSRFS F.S. S_SAT. S_DRY S_ALL
FT IN. IN. IN.
_______________________________________________________
2.00 2.00 0.39 5.00 0.00 0.01 0.01
3.00 2.00 0.39 5.00 0.00 0.01 0.01
4.00 2.00 0.39 5.00 0.00 0.01 0.01
5.00 2.00 0.39 5.00 0.00 0.01 0.01

GEOTECHNICAL CONSULTANTS
New Brentwood Center (L-630) June 23, 2016 Contra Costa Community College District RMA Job No.: 15-095-0 Page E-10
6.00 2.00 0.39 5.00 0.00 0.01 0.01
7.00 2.00 0.38 5.00 0.00 0.01 0.01
8.00 2.00 0.38 5.00 0.00 0.01 0.01
9.00 2.00 0.38 5.00 0.00 0.01 0.01
10.00 2.00 0.38 5.00 0.00 0.01 0.01
11.00 2.00 0.38 5.00 0.00 0.01 0.01
12.00 2.00 0.38 5.00 0.00 0.01 0.01
13.00 2.00 0.38 5.00 0.00 0.01 0.01
14.00 2.00 0.38 5.00 0.00 0.01 0.01
15.00 0.70 0.38 5.00 0.00 0.01 0.01
16.00 0.70 0.38 1.86 0.00 0.00 0.00
17.00 0.70 0.39 1.81 0.00 0.00 0.00
18.00 0.70 0.40 1.77 0.00 0.00 0.00
19.00 0.70 0.41 1.73 0.00 0.00 0.00
20.00 0.70 0.41 1.70 0.00 0.00 0.00
21.00 0.70 0.42 1.66 0.00 0.00 0.00
_______________________________________________________
* F.S.<1, LIQUEFACTION POTENTIAL ZONE
(F.S. IS LIMITED TO 5, CRR IS LIMITED TO 2, CSR IS LIMITED TO 2)
UNITS: UNIT: QC, FS, STRESS OR PRESSURE = ATM (1.0581TSF); UNIT WEIGHT = PCF; DEPTH = FT;
SETTLEMENT = IN.
____________________________________________________________________________________
1 ATM (ATMOSPHERE) = 1 TSF (TON/FT2)
CRRM CYCLIC RESISTANCE RATIO FROM SOILS
CSRSF CYCLIC STRESS RATIO INDUCED BY A GIVEN EARTHQUAKE (WITH USER REQUEST FACTOR OF
SAFETY)
F.S. FACTOR OF SAFETY AGAINST LIQUEFACTION, F.S.=CRRM/CSRSF
S_SAT SETTLEMENT FROM SATURATED SANDS
S_DRY SETTLEMENT FROM UNSATURATED SANDS
S_ALL TOTAL SETTLEMENT FROM SATURATED AND UNSATURATED SANDS
NOLIQ NO-LIQUEFY SOILS

GEOTECHNICAL CONSULTANTS
APPENDIX F
REFERENCES

GEOTECHNICAL CONSULTANTS
New Brentwood Center (L-630) June 23, 2016 Contra Costa Community College District RMA Job No.: 15-095-0 Page F-1
APPENDIX F
REFERENCES
1. Blake, T.F., 2000, FRISKSP Computer Program, Version 4.00.
2. Bryant, W.A. and Hart, E.W., 2007, Fault-Rupture Hazard Zones in California: California Department of Conservation, Division of Mines and Geology Special Publication 42, Interim Revision 2007 and online updates.
3. California Building Standards Commission, 2013 California Building Code.
4. California Department of Conservation, Division of Mines and Geology, 2008, Guidelines for Evaluating and Mitigating Seismic Hazards in California, Special Publication 117.
5. California Department of Water Resources, 2015, Online Water Data Library, http://www.water.ca.gov/waterdatalibrary
6. California Division of Oil, Gas and Geothermal Resources, 2015, Online Well Finder (hhp://maps.conservation.ca.gov/dogger/#close).
7. California Geological Survey, 2013, Checklist for the Review of Engineering Geology and Seismology Reports for California Public Schools, Hospitals, and Essential Services Buildings, Note 48.
8. Cao, Y. and others, 2003, The Revised 2002 California Probabilistic Seismic Hazard Maps, June 2003.
9. Churchill, R.K. and Hill, R.L., 2000, A General Location Guide for Ultramafic Rocks in California – Areas More Likely to Contain Naturally Occurring Asbestos: Department of Conservation, Division of Mines and Geology Open-File Report 2000-19.
10. Contra Costa County Department of Conservation and Development, 2005, Contra Costa County General Plan 2005-2020, dated January 18, 2005.
11. Contra Costa County Flood Control and Water Conservation District, 2015, Online Dam Failure Inundation Areas Map, last modified February 5, 2015.
12. Contra Costa County Radon Information, http://county-radon.info/CA/Contra_Costa.html.
13. Dibblee, T.W. and Minch, J.A., 2006, Geologic Map of the Antioch South and Brentwood Quadrangles, Conta Costa County, California: Dibblee Geological Foundation Map DF-193.
14. Federal Emergency Management Agency, 2015, Flood Insurance Rate Map #06013C0138G, Version2.3.2.0, revised September 30, 2015.
15. Google Earth, Aerial Photographs, 2010, 2008, 2005, 2002, 1993 and 1938.
16. Historicaerials.com, Aerial Photographs, 2012, 2010, 2009, 2005, 2002, 1993, 1979, 1968, 1966, 1958, 1957, and 1949.
17. Jennings, C.W., and Bryant, W.A, 2010, Fault Activity Map of California, California Geological Survey: Geologic

GEOTECHNICAL CONSULTANTS
New Brentwood Center (L-630) June 23, 2016 Contra Costa Community College District RMA Job No.: 15-095-0 Page F-2
Data Map No. 6.
18. Jennings, C.W. and others, 2010, Geologic Map of California: Geologic Data Map No. 2.
19. Luhdorff and Scalmanni Consulting Engineers, 2014, Land Subsidence from Groundwater Use in California.
20. Martin, G.R. and Lew, M., 1999, Recommended Procedures for Implementation of DMG Special Publication 117,
Guidelines for Analyzing and Mitigating Liquefaction Hazards in California, Southern California Earthquake Center
publication.
21. Miller, Dan C., 1989, Potential Hazards from Future Volcanic Eruptions in California: U.S. Geological Survey
Bulletin 1847.
22. Pittsburg Planning Department, 2001, General Plan Pittsburg 2020, Adopted November 16, 2001.
23. Seed, H.B. and Whitman, R.V., 1970, Design of Earth Structures for Dynamic Loads in American Society of Civil
Engineers Specialty Conference State-of-the Art Paper, Lateral Stresses in the Ground and Design of Earth-
Retaining Structures.
24. Sims, J.D., Fox, K.F., Bartow, L.A. and Helley, E.J., 1973, Preliminary Geologic Map of Solano County and parts of
Napa, Contra Costa, Marin and Yolo Counties: U.S. Geological Survey MF-484.
25. Tokimatsu, K. and Seed, H.B., 1987, Evaluation of Settlements in Sands Due to Earthquake Shaking, Journal of Soil
Mechanics and Foundation Engineering, Vol. 113, No. 8.
26. U.S. Army Corps of Engineers, 2003, Engineering and Design - Stability Analysis of Concrete Structures,
Publication CECW-E, Circular No. 1110-2-6058, Appendix G, http://www.usace.army.mil/publications/eng-
circulars/ec1110-2-6058/.
27. U.S. Geological Survey, 2015, Seismic Design Maps Calculator, Version 3.1.0, ASCE 7-10 Standard,
htpp://earthquake.usgs.gov/designmaps/us/report.

AVIATION
CIVIC
HEALTHCARE
HIGHER EDUCATION
HOTELS AND CASINOS
K-12 SCHOOLS
LAND DEVELOPMENT
PORTS
POWER AND ENERGY
SPORTS AND RECREATION
TRANSIT AND RAIL
TRANSPORTATION
WATER INFRASTRUCTURE
CORPORATE12130 Santa Margarita Court | Rancho Cucamonga, CA 91730 909.989.1751 | 909.989.4287
CALIFORNIA LOCATIONS
1210 E. 223rd Street | Carson, CA 90745 310.684.4854 | 424.287.0622
3150 Fitzgerald Road | Rancho Cordova, CA 95742 916.631.7194 | 916.631.7256
6976 Convoy Court | San Diego, CA 92111858.609.7168 | 858.598.6102
130 Archer Street | San Jose, CA 95112 408.362.4920 | 408.362.4926
16525 Sherman Way, Unit C-4 | Van Nuys, CA 91406 818.392.8778 | 818.988.9873
824 E. Douglas Avenue | Visalia, CA 93292 559.732.3039 | 559.732.8141
GEOTECHNICAL ENGINEERING
PAVEMENT ENGINEERING
MATERIALS TESTING
SPECIAL INSPECTION
ENVIRONMENTAL ENGINEERING
STORM WATER MANAGEMENT
STRUCTURE AND UTILITY SCANNING