Embed Size (px)
Citation preview
March 2020 US Golden Eagle Farms, Ltd.
Geotechnical Investigation and Recommendations
Prepared for US Golden Eagle Farms, Ltd.

March 2020 US Golden Eagle Farms, Ltd.
Geotechnical Investigation and Recommendations
Prepared for US Golden Eagle Farms, Ltd. 33083 Cockerham Island Road Sedro-Woolley, Washington 98284
Prepared by Anchor QEA, LLC 1201 3rd Avenue Seattle, Washington 98101

Geotechnical Investigation and Recommendations i March 2020
TABLE OF CONTENTS 1 Introduction ................................................................................................................................ 1
2 Subsurface Conditions .............................................................................................................. 2 2.1 Subsurface Investigation .................................................................................................................................. 2 2.2 Laboratory Testing .............................................................................................................................................. 2 2.3 Subsurface Soil Profile ....................................................................................................................................... 3 2.4 Groundwater ......................................................................................................................................................... 4
3 Geotechnical Engineering Evaluations ................................................................................. 5 3.1 Calculation of Factors of Safety ..................................................................................................................... 6 3.2 Discussion of Stability Results ........................................................................................................................ 6
4 Construction Recommendations ........................................................................................... 8 4.1 Native Backfill Material Properties................................................................................................................ 8 4.2 Earthwork Specifications .................................................................................................................................. 8
Site Preparation ................................................................................................................................................... 8 Moisture Control ................................................................................................................................................. 8
4.3 Excavation Safety ................................................................................................................................................. 9 4.4 Water Management ........................................................................................................................................... 9
5 Limitations ................................................................................................................................. 10
6 References .................................................................................................................................. 11
TABLES Table 1 Soil Profile in Hand Auger Borings ...................................................................................................... 4 Table 2 Assumed Soil Properties .......................................................................................................................... 6 Table 3 Slope Stability Summary .......................................................................................................................... 7
FIGURES Figure 1 Site Vicinity Map Figure 2 Geotechnical Investigation Locations Figure 3 Slope Stability for Undrained Soil Condition Figure 4 Slope Stability for Drained Soil Condition Figure 5 Slope Stability for Rapid Drawdown Condition
Geotechnical Investigation and Recommendations ii March 2020
APPENDICES Appendix A Hand Auger Borings Appendix B Dynamic Cone Penetrometer Logs Appendix C Laboratory Report Appendix D Limitations Document

Geotechnical Investigation and Recommendations iii March 2020
ABBREVIATIONS DCP dynamic cone penetrometer FOS Factor of Safety H:V horizontal to vertical NAVD88 North American Vertical Datum of 1988 OSHA Occupational Safety and Health Administration pcf pounds per cubic foot psf pounds per square foot UNT Unnamed Tributary USGEF US Golden Eagle Farms, Ltd.
Geotechnical Investigation and Recommendations 1 March 2020
1 Introduction The purpose of this report is to describe subsurface conditions, present geotechnical analysis results, and provide recommendations for earthwork activities at the US Golden Eagle Farms, Ltd. (USGEF) Site. The Site is a blueberry farm located east of Larimer Road in the Marshland Flood Control District just south of Everett in Snohomish County, Washington (Figure 1). The Site comprises 50 acres over two tax lots: 28050800101700 and 28050900200900. The owners of the neighboring property to the south (i.e., Daniel and Shavonne Tonnes) entered a lawsuit against USGEF regarding earthwork activity that had impacted their property, citing violations of the Clean Water Act Sections 401 and 404 and City of Everett Municipal Code 19.37.250(B) and 19.37.260. A settlement agreement was reached mandating USGEF to perform required earthwork to correct any damages caused to the Tonnes property, including but not limited to the filling, relocating, and extending of existing flow ditches on the property. This report was prepared to meet the requirements of Study 3 as specified in the Tonnes v. Golden Eagle Farms Settlement Agreement.
This memorandum includes the following:
• Subsurface conditions observed from soil boring explorations• Discussion and interpretation of laboratory results• Geotechnical engineering recommendations for restoration earthwork• Recommendations for materials handling, safety, and water management during construction
Geotechnical Investigation and Recommendations 2 March 2020
2 Subsurface Conditions
2.1 Subsurface Investigation Subsurface geotechnical conditions at the Site were investigated by Anchor QEA on January 30 and 31, 2020. The exploration and testing program included the following:
• Advance six hand auger borings (designated HA-1 through HA-6) at selected locations,conduct visual classification of observed soils in each boring, and collect representative soilsamples for laboratory testing.
• Conduct four dynamic cone penetrometer (DCP) tests (designated DCP-1 through DCP-4) atselected locations.
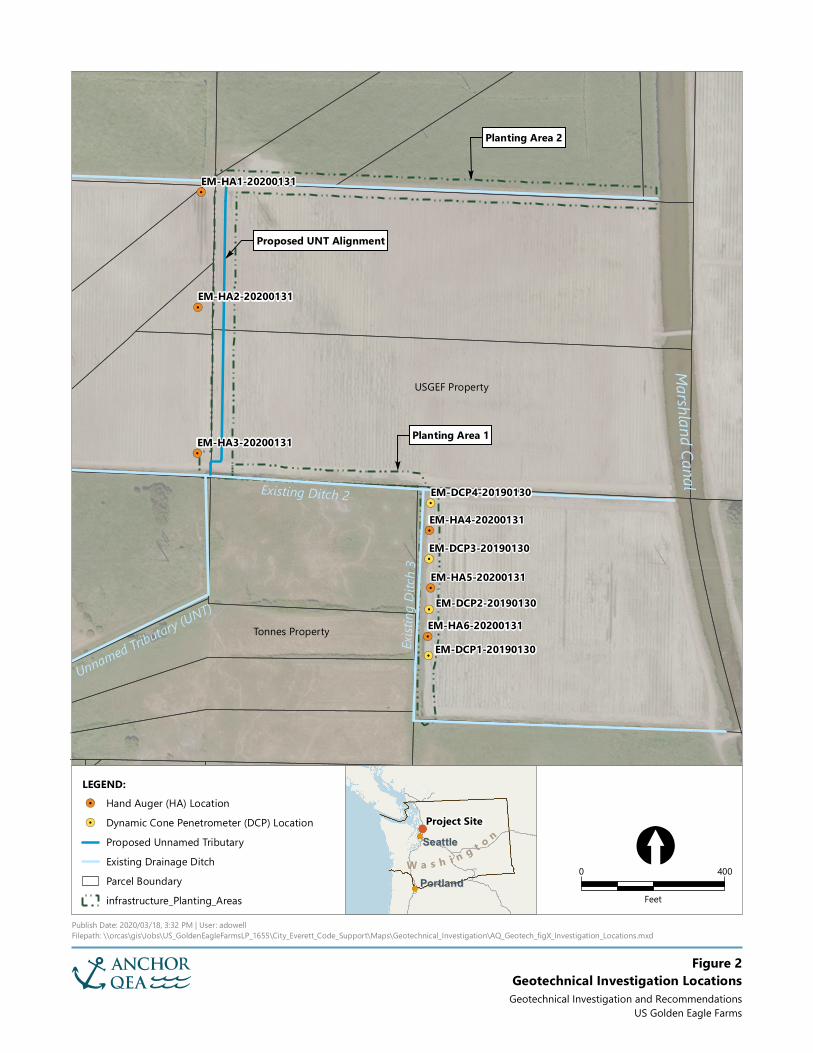
Three of the six hand augers and all four DCP tests were conducted by Anchor QEA along the top of the east slope of Ditch 3 where fill material is to be placed as part of the restoration earthwork. The other three hand augers were conducted along the proposed excavation to extend the Unnamed Tributary (UNT). The locations of the hand auger borings and DCP tests are displayed in Figure 2. The hand auger exploration logs are provided in Appendix A, and the DCP results are in Appendix B.
The borings were advanced by hand using a 3¼-inch-diameter auger. Boring depths ranged from 3 to 9.4 feet below ground surface. The termination depth for each boring was based on practical refusal of the auger. Samples were collected from each of the borings for laboratory testing. Exploratory borings were used to provide an understanding of subsurface conditions, as well as to provide samples for laboratory testing.
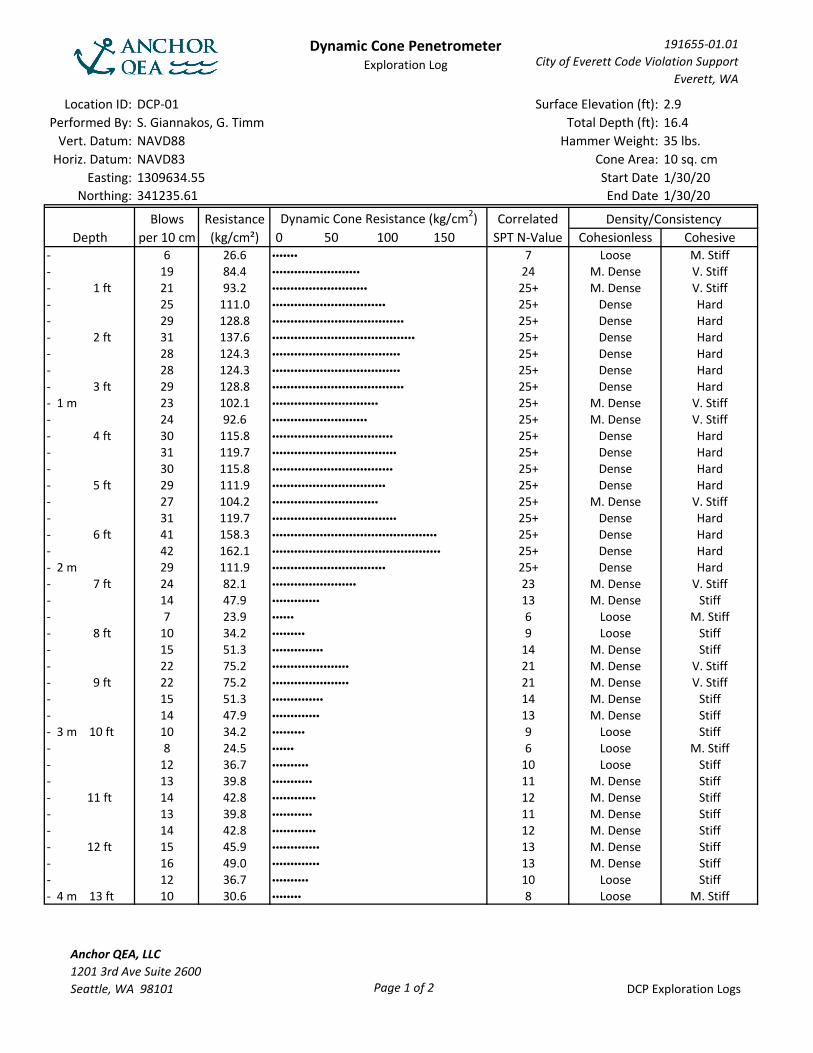
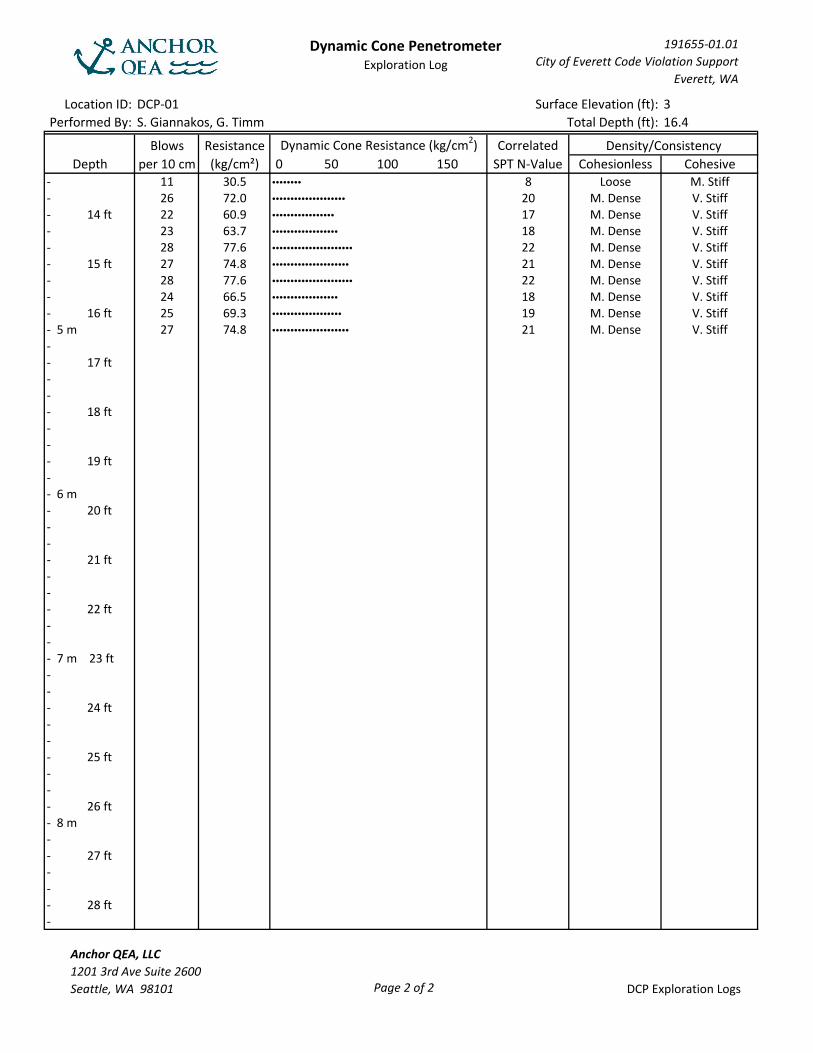
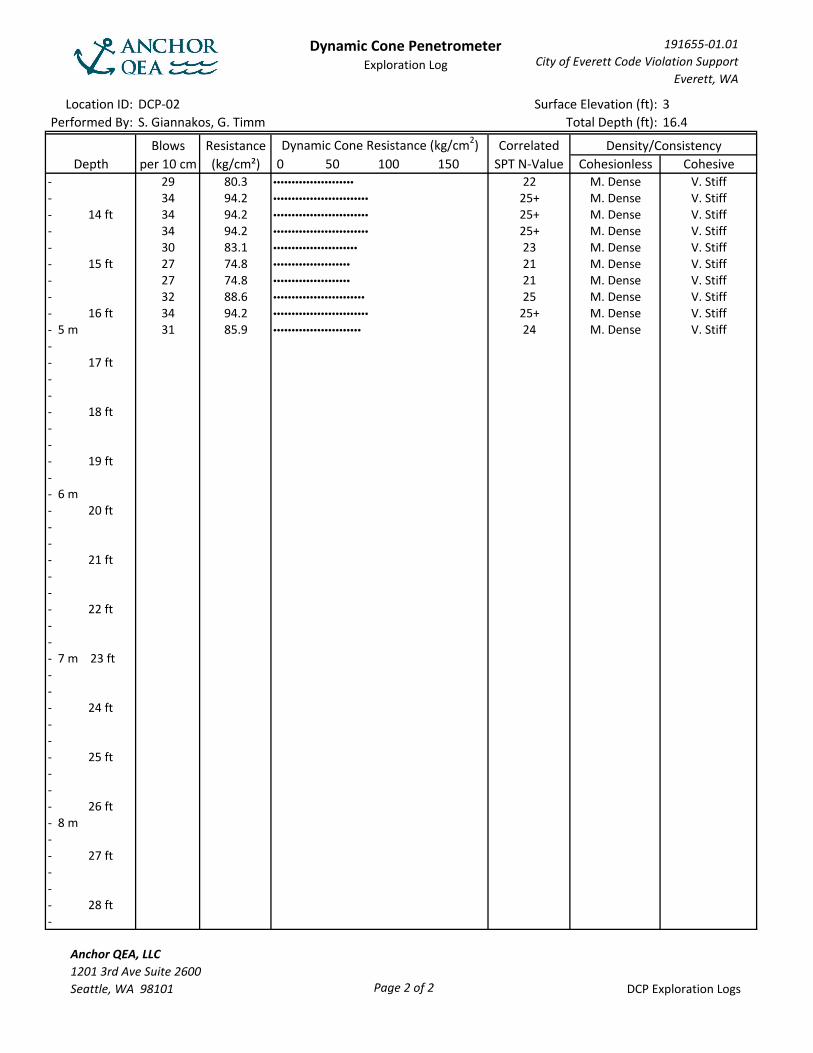
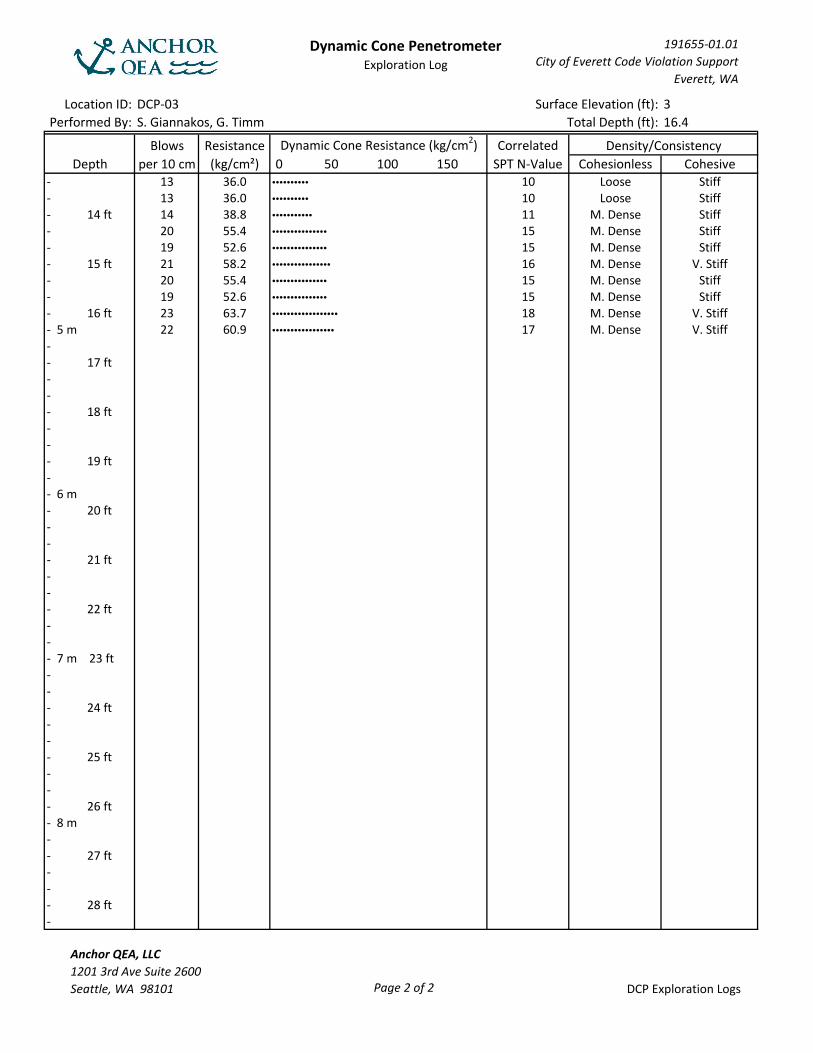
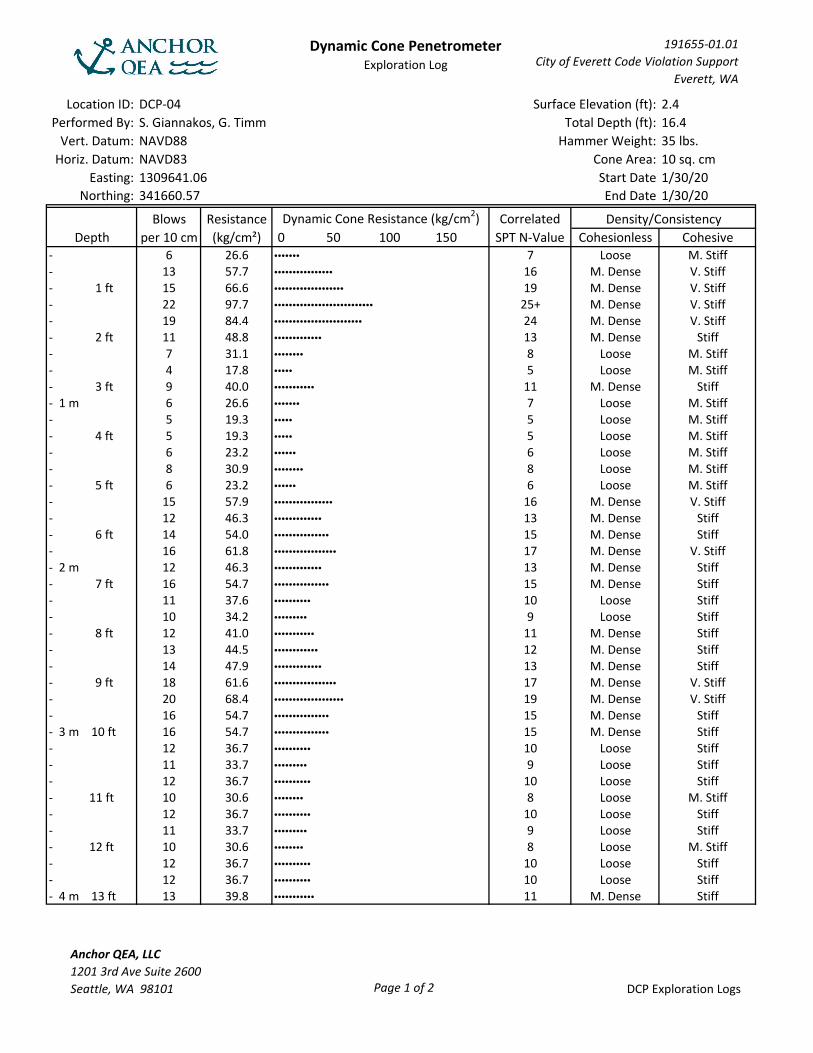
DCP tests were conducted using a hand-operated, multi-flight steel probe with a sacrificial steel conical tip, and a 35-pound hammer weight. The weight was manually raised to 15 inches and then dropped (allowed to free fall), transferring energy through the lower flights to the cone tip. Advancement of the probe was recorded in 10-centimeter increments until practical refusal was met or the maximum depth of the available steel flights was reached (5 meters). All four DCP tests were driven to a cone tip depth of 500 centimeters (5 meters, 16.4 feet).
2.2 Laboratory Testing Soil samples from five of the six borings (HA-1 and HA-3 to HA-6) were submitted for geotechnical analysis to an independent geotechnical laboratory, Materials Testing and Consulting, Inc. A total of 10 samples were collected and submitted to the testing laboratory.
Samples were analyzed for the following parameters:
• Moisture content (ASTM D2216)• Atterberg limits (ASTM D4318)• Particle size (ASTM D422)

Geotechnical Investigation and Recommendations 3 March 2020
• Specific gravity (ASTM D854)• Modified Proctor (ASTM D1557)
General testing procedures and testing results as generated by the laboratory are provided in Appendix C.
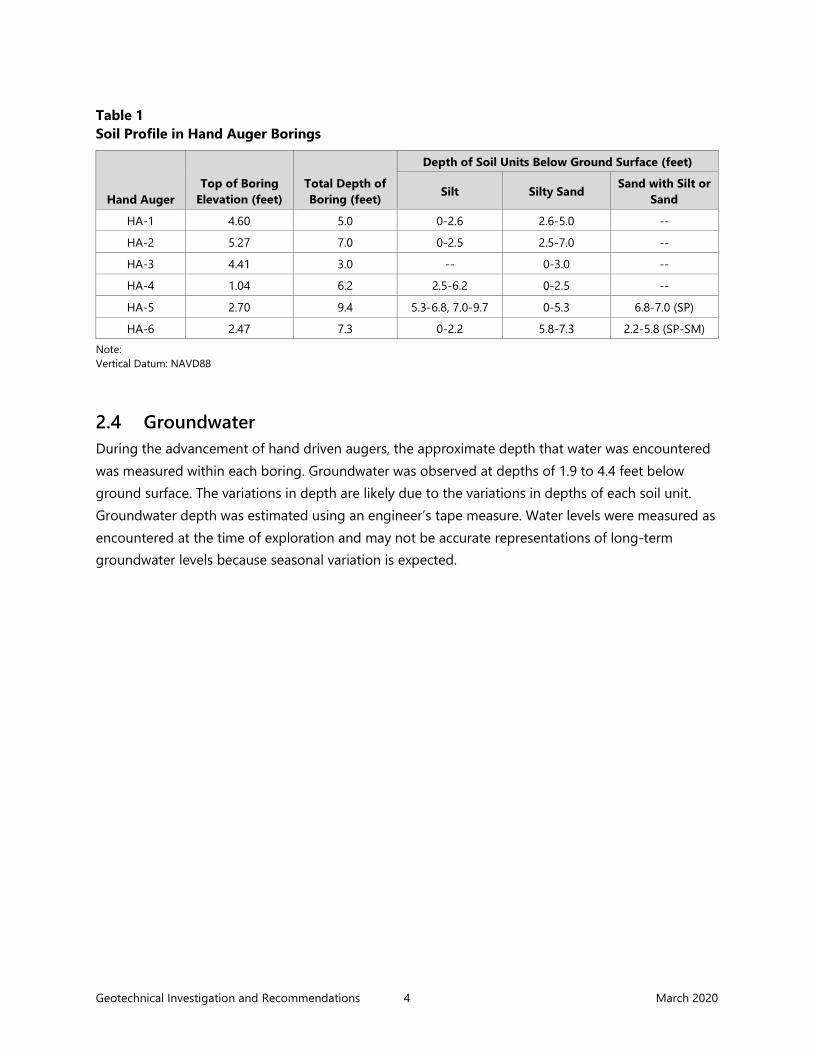
2.3 Subsurface Soil Profile The following is a description of the generalized subsurface soil profile that was observed, with a discussion of the key characteristics of the major soil units encountered during the investigation, listed in order from the ground surface downward. Table 1 provides a summary of the depths of each unit encountered in each hand driven auger.
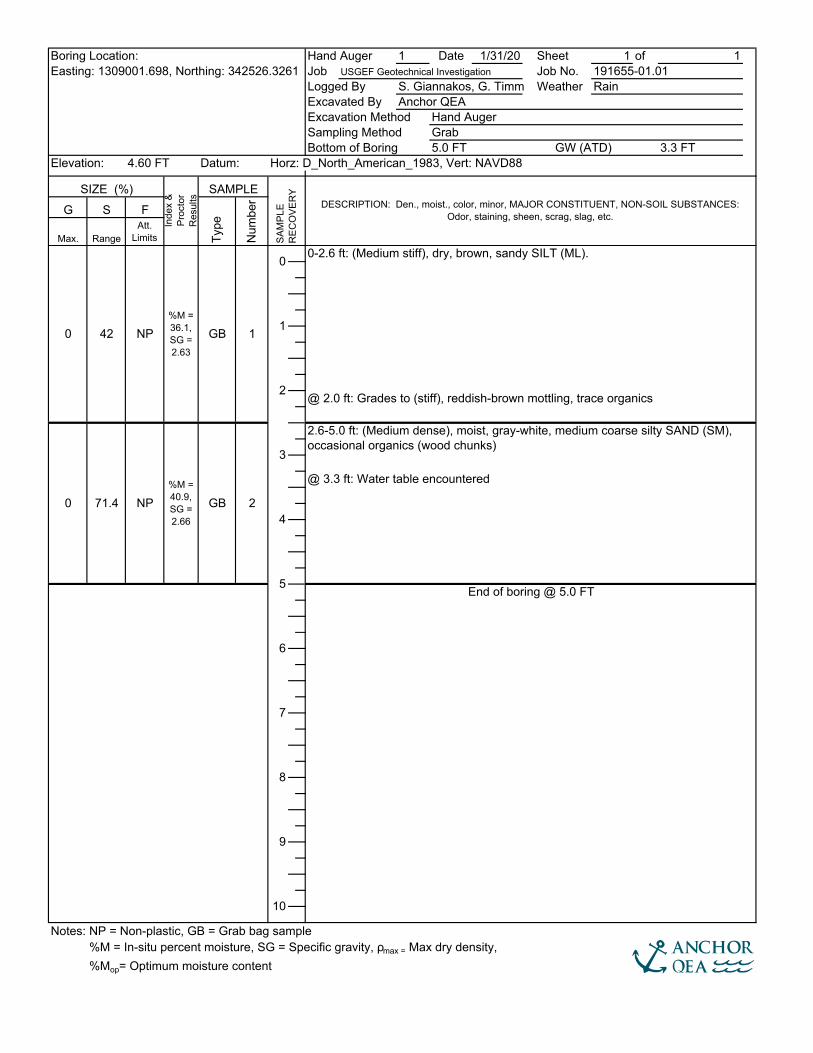
Sandy Silt (ML). The surficial layer of soil in borings HA-1 through HA-2 along the north end of the proposed UNT extension was brown to gray sandy silt ranging in thickness from 2.2 to 2.6 feet below ground surface. At the surface, the silt was typically medium stiff and dry to damp with occasional organic material, and graded to wet and stiff at the bottom of the layer. This unit was found to be non-plastic.
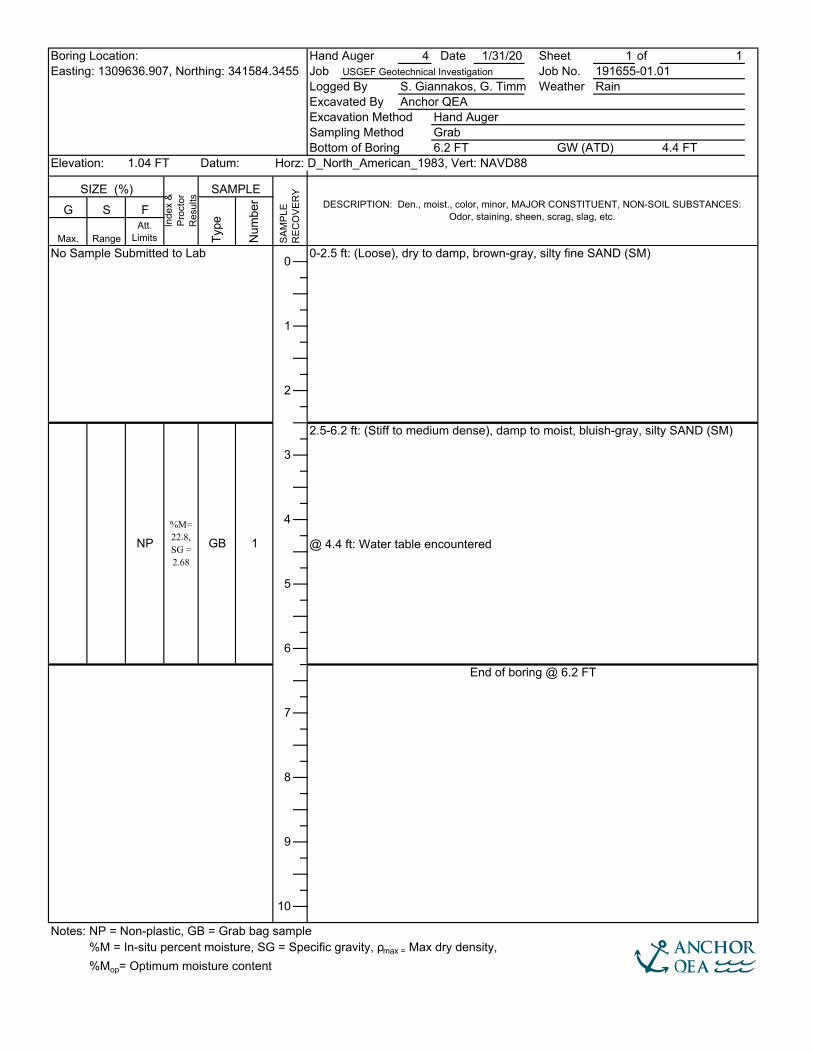
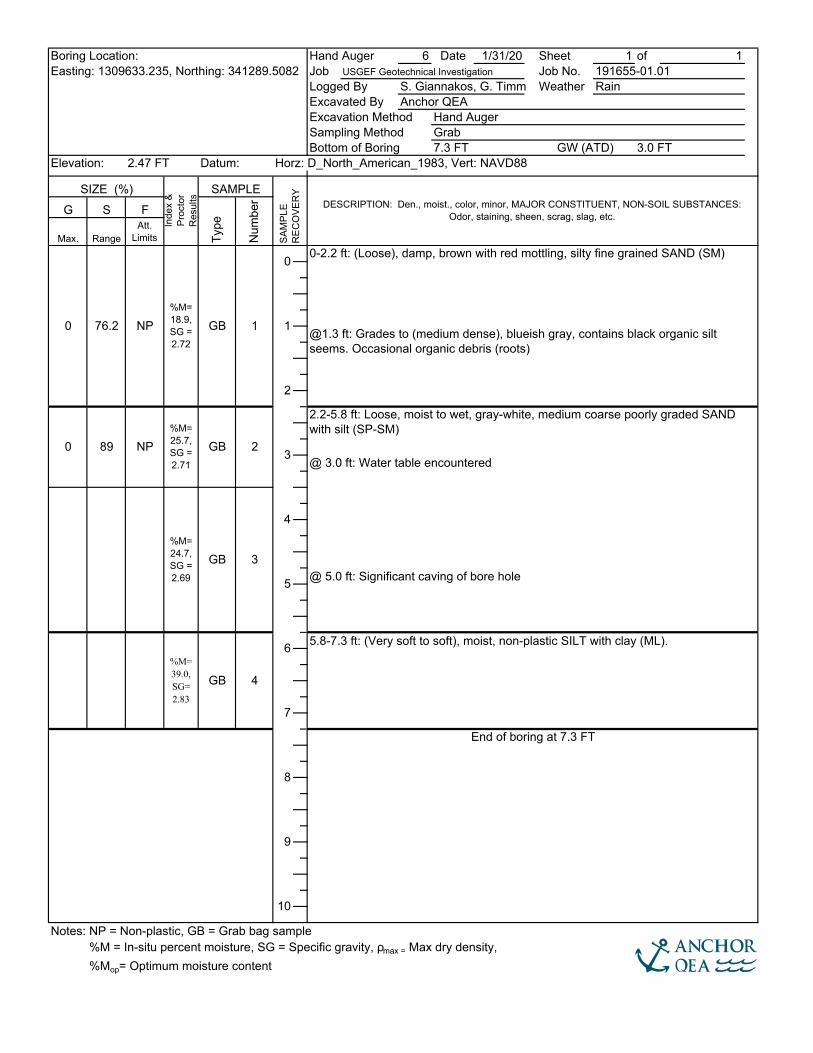
Silty Sand (SM). Silty sand was encountered in all borings. This layer was found at the surface of borings HA-3 through HA-6, ranging in thickness from 2.2 to 6.2 feet below ground surface, and underlaying silt in borings HA-1 and HA-2. At the surface, this layer of silty sand was typically loose, dry to damp, and brown with occasional red mottling. Beneath the silt layers found in HA-1 and HA-2, this material was typically loose and dry to damp, grading to wet and medium dense at the bottom of the layer. At boring HA-6, the silty sand graded to bluish gray at 1.3 feet below ground surface.
Poorly Graded Sand with Silt (SP-SM). A layer of poorly graded sand with silt was discovered underlaying the surficial silty sand in boring HA-6. This layer, 2.2 to 5.8 feet thick below ground surface, was moist to wet, gray-white, and loose in density.
Geotechnical Investigation and Recommendations 4 March 2020
Table 1 Soil Profile in Hand Auger Borings
Hand Auger Top of Boring
Elevation (feet) Total Depth of Boring (feet)
Depth of Soil Units Below Ground Surface (feet)
Silt Silty Sand Sand with Silt or Sand
HA-1 4.60 5.0 0-2.6 2.6-5.0 --
HA-2 5.27 7.0 0-2.5 2.5-7.0 --
HA-3 4.41 3.0 -- 0-3.0 --
HA-4 1.04 6.2 2.5-6.2 0-2.5 --
HA-5 2.70 9.4 5.3-6.8, 7.0-9.7 0-5.3 6.8-7.0 (SP)
HA-6 2.47 7.3 0-2.2 5.8-7.3 2.2-5.8 (SP-SM) Note: Vertical Datum: NAVD88
2.4 Groundwater During the advancement of hand driven augers, the approximate depth that water was encountered was measured within each boring. Groundwater was observed at depths of 1.9 to 4.4 feet below ground surface. The variations in depth are likely due to the variations in depths of each soil unit. Groundwater depth was estimated using an engineer’s tape measure. Water levels were measured as encountered at the time of exploration and may not be accurate representations of long-term groundwater levels because seasonal variation is expected.

Geotechnical Investigation and Recommendations 5 March 2020
3 Geotechnical Engineering Evaluations Geotechnical evaluations were conducted to assess the stability of earthen fill that will be placed for the restoration project. This section describes slope stability evaluations that were completed in support of the work.
Slope stability was modeled with Rocscience Slide 2018 software Version 8.031 (Rocscience 2018) using limit equilibrium methods of analysis. The soil model for limit equilibrium analysis is a rigid, perfectly plastic soil model. The assumptions inherent to this model are that the anticipated sliding mass remains rigid (i.e., non-deformable) and the soil strength along the slip plane is fully mobilized at failure. Although this analysis method does not directly represent the true behavior of the soil during a slope failure, it is intended to provide a reasonable indication of the overall stability of a slope and is the standard of practice for these types of engineering evaluations.
The stability of the future fill slope along cross section G to G’, in the southern portion of the Site, was evaluated (Figure 2). To perform the analysis, a geologic cross section was developed using the existing topographic survey data, available groundwater data, GPS data collected at the time of the exploration, and subsurface stratigraphy obtained as part of the investigations. The location of the geologic cross section was selected based on the areas with the highest slope and thickest proposed fill within an existing drainage ditch. Slope angles that are stable for section G-G’ are expected to be stable for other fill locations because those areas will have less fill and lower slope heights.
The model requires input of a geologic profile, assignment of strength parameters to the various soil layers, selection of the type of “slip surface” to be modeled (i.e., circular or non-circular), and methods for evaluating limit equilibrium forces and moments.
Table 2 summarizes the modeling index and strength parameters used for each soil material for the short-term (undrained) stability and long-term (drained) stability. Modeling parameters were established using geotechnical laboratory test results, as well as correlations to measured DCP values to standard penetration test blow counts. The index parameter correlations used are as presented in geotechnical engineering design guidance and based on experience with similar materials on other projects.

Geotechnical Investigation and Recommendations 6 March 2020
Table 2 Assumed Soil Properties
Material Total Unit
Weight (ɣ) (pcf)
Undrained Conditions Drained Conditions
Effective Cohesion (c’)
(psf) Friction Angle (φ’) (degrees)
Effective Cohesion (c’)
(psf) Friction Angle (φ’) (degrees)
Native Backfill Silty Sand (SM)* 120 0 35 0 35
Silty Sand (SM) 94 100 0 0 29
Sand with Silt (SP-SM) 94 150 0 0 29
Silt (ML) 110 250 0 0 27 Notes: *: Native Backfill Silty Sand (SM) was collected near HA-3. This material will be used as embankment backfill in the southern portion of the Site. pcf: pounds per cubic foot
3.1 Calculation of Factors of Safety For this model, both the Spencer (1967) and GLE Morgenstern and Price (1965) methods were used to compute the Factor of Safety (FOS). These methods satisfy both force and moment equilibrium for the slip surface being evaluated. The limit equilibrium method calculates the FOS by comparing the “driving” forces for an assumed failure wedge with the “resisting” forces provided by the shear strength of the soils along the assumed failure surface. The typical recommended target factor of safety for engineered slopes is 1.3 for short-term conditions, 1.5 for long‑term conditions, and 1.1 for “rapid drawdown”1 conditions based on U.S. Army Corps of Engineers guidance (USACE 2003).
The stability of the slope along the selected cross section was evaluated assuming a high-water table within the repositioned Ditch 3 at the toe of the backfill slope. Varying degrees of slope steepness were assessed to determine the FOS associated with each.
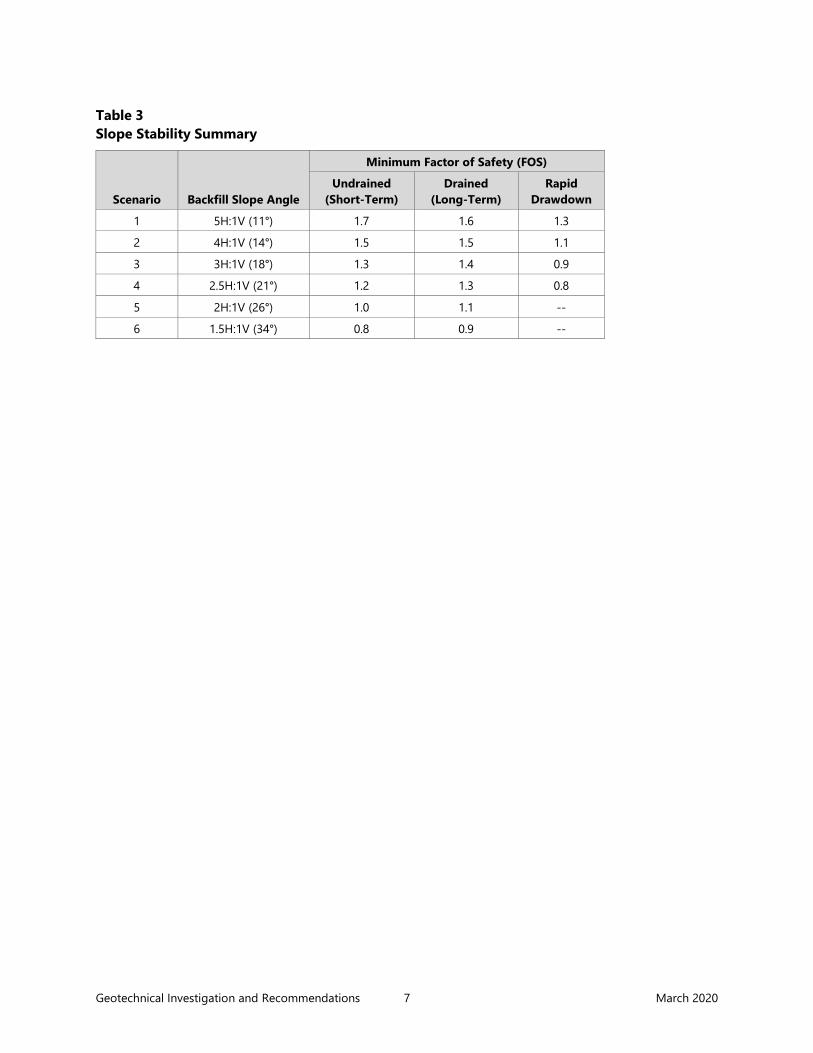
3.2 Discussion of Stability Results The results of the modeling indicate that the proposed backfill slope meets the recommended FOS for an engineered slope when constructed to a slope of 4 horizontal to 1 vertical (4H:1V) or flatter. Table 3 summarizes the results for each slope analyzed. Figures 3, 4, and 5 display the undrained (short-term), drained (long-term), and rapid drawdown conditions of the recommended backfill scenario of 4H:1V, respectively.
1 The term “rapid drawdown” typically refers to the operation of impoundments and dams, where reservoir levels can drop quickly, affecting slope stability. In the context of our evaluation for this project, the rapid drawdown evaluation simulates the behavior of the compacted fill material as the water level returns to normal following a future flood at the project site.
Geotechnical Investigation and Recommendations 7 March 2020
Table 3 Slope Stability Summary
Scenario Backfill Slope Angle
Minimum Factor of Safety (FOS)
Undrained (Short-Term)
Drained (Long-Term)
Rapid Drawdown
1 5H:1V (11°) 1.7 1.6 1.3
2 4H:1V (14°) 1.5 1.5 1.1
3 3H:1V (18°) 1.3 1.4 0.9
4 2.5H:1V (21°) 1.2 1.3 0.8
5 2H:1V (26°) 1.0 1.1 --
6 1.5H:1V (34°) 0.8 0.9 --
Geotechnical Investigation and Recommendations 8 March 2020
4 Construction Recommendations
4.1 Native Backfill Material Properties Based on the Proctor sample collected during the January 2020 geotechnical investigation by Anchor QEA at the location of HA-3, it is recommended that on-site materials should be compacted to at least 90% of the maximum dry density (as measured by the Modified Proctor test) when being used as fill. The maximum dry density of this material was found to be 116.4 pounds per cubic foot (pcf) and the optimum moisture content to be 10.0%. The Proctor results for the fill material described above are provided in Appendix C.
4.2 Earthwork Specifications The following section will describe specifications for site preparations as well as field and laboratory testing of relative density and percent moisture of material used as fill.
Site Preparation Following the stripping and grubbing of all surficial organics, as well as 2 to 3 inches of topsoil, the native backfill material shall be placed in no more than 12- to 18-inch-thick loose lifts and compacted using a vibratory rolling compactor. The contractor shall provide density and moisture content data to the engineer of record during construction to ensure adequate compaction of the fill material was achieved.
If the native sand material from the extension of the UNT ditch is not sufficient to fill Ditch 3, material will be imported to achieve volume requirements. Imported material should conform to Section 9.03-14(3) (Common Borrow) of the Washington State Department of Transportation Standard Specifications. Material shall be free of wood and organic waste or any other extraneous material. Imported material should be compacted to the same standard as on-site native material.
The number of field tests as recommended in DM-7.02 Foundations and Earth Pressures (NAVFAC 1986) for material placed as part of an embankment is one test for every 500 cubic yards. Additionally, supplemental testing should be conducted whenever there is a suspicion of a change in the material type, quality of moisture control, or effectiveness of compaction.
Moisture Control Because of the nature of the native material, the moisture content of the soil at the time of placement may be sensitive to oversaturation. If construction under relatively dry conditions is not possible, then moisture conditioning of the soil may be required to achieve adequate compaction. Moisture conditioning may involve the blending of materials from wet and dry sections of the
Geotechnical Investigation and Recommendations 9 March 2020
borrow area (near HA-3), and/or the use of alternative compaction equipment may be necessary, such as a sheep’s foot roller.
4.3 Excavation Safety All Occupational Safety and Health Administration (OSHA) guidelines (OSHA 2019), and Washington Department of Labor and Industries requirements (Chapter 296-155 Washington Administrative Code), should be followed during excavation operations. Typically, measures for safe excavation would include the following:
• Keep heavy equipment and surcharge loads from excavation edges and at top of slope.• Limit cut depths to 4 feet or less where possible.• For excavations deeper than 4 feet, use benching and/or stable excavation side slopes, or
where side slopes are not possible, temporary shoring.
Excavation safety should be the responsibility of the contractor because they are the party continuously present and in control of means and methods, and therefore they have the most control and influence on safe excavation practices.
4.4 Water Management Based on the presence of waterways in the work area, observed seeps along the base of the ridgeline, oversaturated zones at depth, and a varying water table depth, it is likely that water will be encountered during construction. We recommend that the contractor perform a site visit prior to commencing work and make their own determination about the volume of water that they may need to manage during construction, and methods they may need to apply.
Temporary water management should be designed and implemented by the contractor as needed. If needed, it should have at least the following two key elements:
• Temporary rerouting of existing drainage ditches• Pumping from the excavation during construction
Geotechnical Investigation and Recommendations 10 March 2020
5 Limitations This report has been prepared for the exclusive use of the client (US Golden Eagle Farms, Ltd.) for specific application to this project. This work has been performed in accordance with generally accepted geotechnical engineering practices in the same or similar localities, at the time the work was performed. The recommendations discussed in this report are appropriate for the locations shown and may vary at other locations at the project area due to unforeseen variable conditions. No warranty is made, expressed, or implied. Please refer to Appendix D titled “Important Information About Your Geotechnical/Environmental Report” for additional information pertaining to use of this report.
This report is intended to meet the requirements of Study 3 identified in the settlement agreement. This study does not include environmental site characterization or other associated environmental studies, which are outside the scope of this report.
Anchor QEA’s recommendations were developed with the assumption that a proper level of field observation and construction review will be provided during the construction of the proposed backfill berm.
Please do not hesitate to contact Anchor QEA should there be any questions or comments, or if any clarification of the information provided is required.

Geotechnical Investigation and Recommendations 11 March 2020
6 References Anchor QEA (Anchor QEA, LLC), 2019. Scope of Work for Golden Eagle Farms, Ltd. Prepared for
John D. Negrin. March 2019.
Morgenstern, N.R., and V.E. Price, 1965. “The Analysis of the Stability of General Slip Surfaces.” Geotechnique 15(1):79–93.
NAVFAC (Naval Facilities Engineering Command), 1986. Foundations & Earth Structures.
OSHA (Occupational Safety and Health Administration), 2019. “Trenching and Excavation Safety.” https://www.osha.gov/Publications/trench_excavation_fs.html
Rocscience, 2018. SLIDE 2018 software Version 8.031 – 2-D Limit Equilibrium Slope Stability for Soil and Rock Slopes, User's Guide. Rocscience Software, Inc., Toronto, Ontario, Canada.
Spencer, E., 1967. “A Method of Analysis of the Stability of Embankments Assuming Parallel Inter-Slice Forces.” Geotechnique 17(1):11–26.
USACE (U.S. Army Corps of Engineers), 2003. Slope Stability. EM 1110-2-1902. October 2003.

Figures

Figure 1 Site Vicinity Map
Geotechnical Investigation and Recommendations US Golden Eagle Farms
Filepath: \\fuji\anchor\Projects\Golden Eagle Farms\City of Everett Code Violation Support\Study 3\Geotech Memo\Figures
!.
!.
!.
!.
!.
!.
!.
!.
!.
!.
Marshland Canal
%
Planting Area 2
Unnamed Tributary (UNT)
%
Planting Area 1
Existi
ng D
itch 3
Tonnes Property
%
Proposed UNT Alignment
USGEF Property
Existing Ditch 2
EM-DCP1-20190130
EM-DCP3-20190130
EM-DCP2-20190130
EM-DCP4-20190130
EM-HA6-20200131
EM-HA5-20200131
EM-HA4-20200131
EM-HA1-20200131
EM-HA2-20200131
EM-HA3-20200131
[0 400
Feet
LEGEND:!. Hand Auger (HA) Location
!. Dynamic Cone Penetrometer (DCP) Location
Proposed Unnamed Tributary
Existing Drainage Ditch
Parcel Boundary
infrastructure_Planting_Areas
Publish Date: 2020/03/18, 3:32 PM | User: adowellFilepath: \\orcas\gis\Jobs\US_GoldenEagleFarmsLP_1655\City_Everett_Code_Support\Maps\Geotechnical_Investigation\AQ_Geotech_figX_Investigation_Locations.mxd
Figure 2Geotechnical Investigation Locations
Geotechnical Investigation and RecommendationsUS Golden Eagle Farms
W a s h i n g t o nProject SiteSeattleSeattle
PortlandPortland

Figure 3Slope Stability for Undrained Soil Condition
Geotechnical Investigation and RecommendationsUS Golden Eagle Farms
Filepath: \\fuji\anchor\Projects\Golden Eagle Farms\City of Everett Code Violation Support\Study 3\Geotech Memo\Figures

Figure 4Slope Stability for Drained Soil Condition
Geotechnical Investigation and RecommendationsUS Golden Eagle Farms
Filepath: \\fuji\anchor\Projects\Golden Eagle Farms\City of Everett Code Violation Support\Study 3\Geotech Memo\Figures
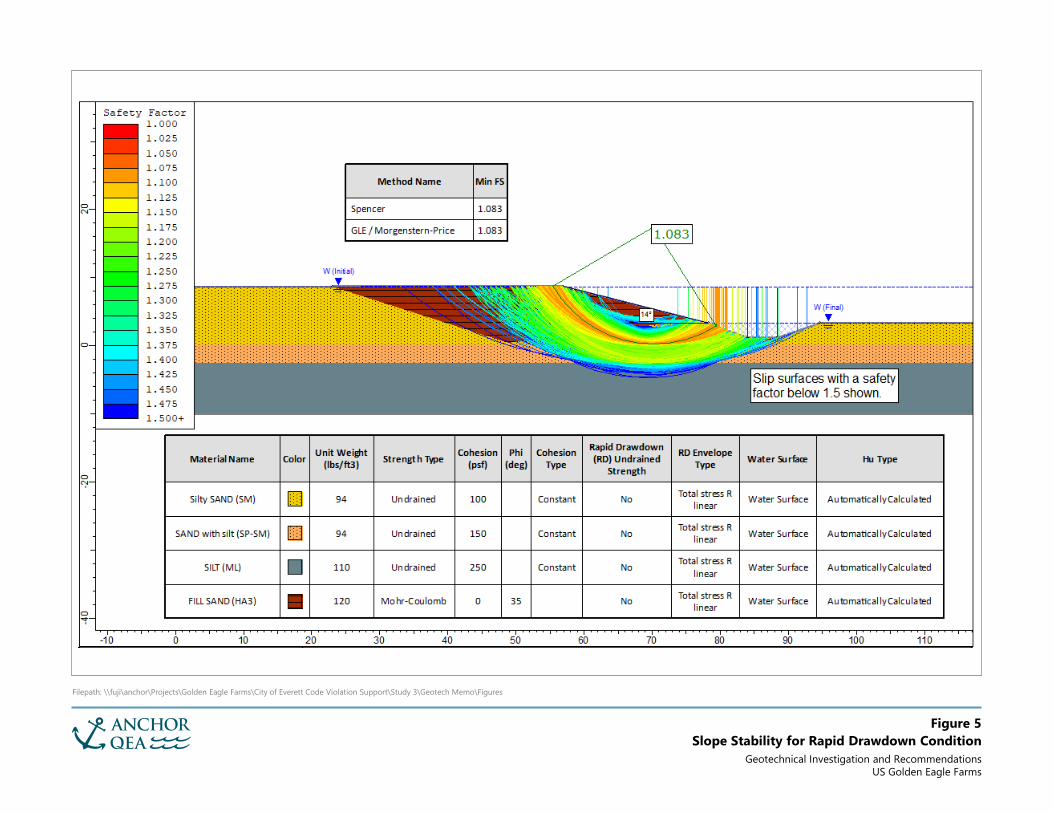
Figure 5Slope Stability for Rapid Drawdown Condition
Geotechnical Investigation and RecommendationsUS Golden Eagle Farms
Filepath: \\fuji\anchor\Projects\Golden Eagle Farms\City of Everett Code Violation Support\Study 3\Geotech Memo\Figures
Appendix A Hand Auger Borings
Boring Location: Hand Auger 1 Date 1/31/20 Sheet 1 of 1Job USGEF Geotechnical Investigation Job No. 191655-01.01Logged By S. Giannakos, G. Timm Weather RainExcavated By Anchor QEAExcavation Method Hand AugerSampling Method GrabBottom of Boring 5.0 FT GW (ATD) 3.3 FT
Elevation: 4.60 FT Datum: Horz: D_North_American_1983, Vert: NAVD88
G S F
Max. RangeAtt.
Limits
Notes:%M = In-situ percent moisture, SG = Specific gravity, ρmax = Max dry density,
%Mop= Optimum moisture content
%M = 40.9, SG = 2.66
1GB
GB 2
0
%M = 36.1, SG = 2.63
0-2.6 ft: (Medium stiff), dry, brown, sandy SILT (ML).
@ 3.3 ft: Water table encountered
@ 2.0 ft: Grades to (stiff), reddish-brown mottling, trace organics
2.6-5.0 ft: (Medium dense), moist, gray-white, medium coarse silty SAND (SM), occasional organics (wood chunks)
DESCRIPTION: Den., moist., color, minor, MAJOR CONSTITUENT, NON-SOIL SUBSTANCES: Odor, staining, sheen, scrag, slag, etc.
SIZE (%)
Ind
ex
&
Pro
cto
r R
esul
ts
Typ
e
Num
ber
SAMPLE
Easting: 1309001.698, Northing: 342526.3261
9
5
6
3
4
1
2
SA
MP
LE
R
EC
OV
ER
Y
NP = Non-plastic, GB = Grab bag sample
7
10
8
End of boring @ 5.0 FT
0 42 NP
0 71.4 NP

Boring Location: Hand Auger 2 Date 1/31/20 Sheet 1 of 1Job USGEF Geotechnical Investigation Job No. 191655-01.01Logged By S. Giannakos, G. Timm Weather RainExcavated By Anchor QEAExcavation Method Hand AugerSampling Method GrabBottom of Boring 7.0 FT GW (ATD) 1.9 FT
Elevation: 5.27 FT Datum: Horz: D_North_American_1983, Vert: NAVD88
G S F
Max. RangeAtt.
Limits
Notes:%M = In-situ percent moisture, SG = Specific gravity, ρmax = Max dry density,
%Mop= Optimum moisture content
DESCRIPTION: Den., moist., color, minor, MAJOR CONSTITUENT, NON-SOIL SUBSTANCES: Odor, staining, sheen, scrag, slag, etc.
0-2.5 ft: (Medium stiff), dry to damp, brown, fine grained sandy SILT (ML), occasional reddish mottling
@ 1.9 ft: Water table encountered
@ 6.8 ft: grades to wet
2.5-6.8 ft: (Medium dense), moist, gray, silty fine SAND (SM) @ 2.3 ft: 4-inch diameter wood debris encountered
3
4
5
Easting: 1308992.536, Northing: 342206.1736
SIZE (%)
Ind
ex
&
Pro
cto
r R
esul
tsSAMPLE
SA
MP
LE
R
EC
OV
ER
Y
Typ
e
Num
ber
9
10
NP = Non-plastic, GB = Grab bag sample
End of boring at 7.0 FT
8
6
7
No Samples Submitted to Lab0
1
2

Boring Location: Hand Auger 3 Date 1/31/20 Sheet 1 of 1Job USGEF Geotechnical Investigation Job No. 191655-01.01Logged By S. Giannakos, G. Timm Weather RainExcavated By Anchor QEAExcavation Method Hand AugerSampling Method GrabBottom of Boring 3.0 FT GW (ATD) 2.8 FT
Elevation: 4.41 FT Datum: Horz: D_North_American_1983, Vert: NAVD88
G S F
Max. RangeAtt.
Limits
Notes:%M = In-situ percent moisture, SG = Specific gravity, ρmax = Max dry density,
%Mop= Optimum moisture content
2.2-3.0 ft: Grades (stiff), moist, gray, silty SAND (SM)@2.7 ft: Substantial organic material (wood debris)@2.8 ft: Water table [email protected] ft: Significant wood debris encountered
DESCRIPTION: Den., moist., color, minor, MAJOR CONSTITUENT, NON-SOIL SUBSTANCES: Odor, staining, sheen, scrag, slag, etc.
Typ
e
Num
ber
0-2.2 ft: (Medium dense), dry to damp, brown, fine, silty SAND (SM)
2
%M= 22.6 ρmax=
116 @
MCopt=
10
Easting: 1308991.082, Northing: 341799.3464
SIZE (%)
Ind
ex
&
Pro
cto
r R
esul
tsSAMPLE
SA
MP
LE
R
EC
OV
ER
Y
0
1
3.9 64.8 NP GB 1
3
4
End of boring @ 3.0 FT
9
10
NP = Non-plastic, GB = Grab bag sample
8
5
6
7
Boring Location: Hand Auger 4 Date 1/31/20 Sheet 1 of 1Job USGEF Geotechnical Investigation Job No. 191655-01.01Logged By S. Giannakos, G. Timm Weather RainExcavated By Anchor QEAExcavation Method Hand AugerSampling Method GrabBottom of Boring 6.2 FT GW (ATD) 4.4 FT
Elevation: 1.04 FT Datum: Horz: D_North_American_1983, Vert: NAVD88
G S F
Max. RangeAtt.
Limits
Notes:%M = In-situ percent moisture, SG = Specific gravity, ρmax = Max dry density,
%Mop= Optimum moisture content
DESCRIPTION: Den., moist., color, minor, MAJOR CONSTITUENT, NON-SOIL SUBSTANCES: Odor, staining, sheen, scrag, slag, etc.
Typ
e
Num
ber
0-2.5 ft: (Loose), dry to damp, brown-gray, silty fine SAND (SM)No Sample Submitted to Lab
%M= 22.8, SG = 2.68
0
1
2
@ 4.4 ft: Water table encountered
2.5-6.2 ft: (Stiff to medium dense), damp to moist, bluish-gray, silty SAND (SM)
Easting: 1309636.907, Northing: 341584.3455
SIZE (%)
Ind
ex
&
Pro
cto
r R
esul
tsSAMPLE
SA
MP
LE
R
EC
OV
ER
Y
NP
4
3
5
6
1GB
9
10
NP = Non-plastic, GB = Grab bag sample
End of boring @ 6.2 FT
8
7

Boring Location: Hand Auger 5 Date 1/31/20 Sheet 1 of 1Job USGEF Geotechnical Investigation Job No. 191655-01.01Logged By S. Giannakos, G. Timm Weather RainExcavated By Anchor QEAExcavation Method Hand AugerSampling Method GrabBottom of Boring 9.4 FT GW (ATD) 3.8 FT
Elevation: 2.70 FT Datum: Horz: D_North_American_1983, Vert: NAVD88
G S F
Max. RangeAtt.
Limits
Notes:%M = In-situ percent moisture, SG = Specific gravity, ρmax = Max dry density,
%Mop= Optimum moisture content
GB
%M= 35.4, SG= 2.8
6.8-7.0 ft: Lense of (medium dense), wet, gray-white, medium coarse SAND (SP)
5.3-6.8 ft: (Very soft to soft), moist to wet, grayish-brown, non-plastic SILT (ML).
GB 1
%M= 34.7, ρmax = 93.9
pcf @ %Mop=
10.7
2
DESCRIPTION: Den., moist., color, minor, MAJOR CONSTITUENT, NON-SOIL SUBSTANCES: Odor, staining, sheen, scrag, slag, etc.
Typ
e
Num
ber
0-5.3 ft: (Loose), dry to damp, browish-gray, silty fine grained SAND (SM)0
9 57.4 NP
@ 3.8 ft: Grades to moderate organics (wood debris) Water table encountered
@ 1.3 ft: grades to blueish-gray
Easting: 1309640.865, Northing: 341424.0138
SIZE (%)
Ind
ex
&
Pro
cto
r R
esul
tsSAMPLE
SA
MP
LE
R
EC
OV
ER
Y
1
2
8
3
4
5
6
7
9
10
NP = Non-plastic, GB = Grab bag sample
End of boring at 9.4 FT
7.0-9.4 ft: Same as above @5.3-6.8 (ML)
Boring Location: Hand Auger 6 Date 1/31/20 Sheet 1 of 1Job USGEF Geotechnical Investigation Job No. 191655-01.01Logged By S. Giannakos, G. Timm Weather RainExcavated By Anchor QEAExcavation Method Hand AugerSampling Method GrabBottom of Boring 7.3 FT GW (ATD) 3.0 FT
Elevation: 2.47 FT Datum: Horz: D_North_American_1983, Vert: NAVD88
G S F
Max. RangeAtt.
Limits
Notes:%M = In-situ percent moisture, SG = Specific gravity, ρmax = Max dry density,
%Mop= Optimum moisture content
%M= 39.0, SG= 2.83
NP890
3GB
%M= 24.7, SG = 2.69 @ 5.0 ft: Significant caving of bore hole
@ 3.0 ft: Water table encountered
GB 1
2GB
2.2-5.8 ft: Loose, moist to wet, gray-white, medium coarse poorly graded SAND with silt (SP-SM)
2
5
DESCRIPTION: Den., moist., color, minor, MAJOR CONSTITUENT, NON-SOIL SUBSTANCES: Odor, staining, sheen, scrag, slag, etc.
Typ
e
Num
ber
0-2.2 ft: (Loose), damp, brown with red mottling, silty fine grained SAND (SM)
@1.3 ft: Grades to (medium dense), blueish gray, contains black organic silt seems. Occasional organic debris (roots)
0
1
Easting: 1309633.235, Northing: 341289.5082
SIZE (%)
Ind
ex
&
Pro
cto
r R
esul
tsSAMPLE
SA
MP
LE
R
EC
OV
ER
Y%M= 18.9, SG = 2.72
NP76.20
%M= 25.7, SG = 2.71
3
4
5.8-7.3 ft: (Very soft to soft), moist, non-plastic SILT with clay (ML).
9
10
NP = Non-plastic, GB = Grab bag sample
End of boring at 7.3 FT
8
6
7
GB 4
Appendix B Dynamic Cone Penetrometer Logs
Dynamic Cone PenetrometerExploration Log
191655-01.01City of Everett Code Violation Support
Everett, WA
Location ID: DCP-01 Surface Elevation (ft): 2.9Performed By: S. Giannakos, G. Timm Total Depth (ft): 16.4
Vert. Datum: NAVD88 Hammer Weight: 35 lbs.Horiz. Datum: NAVD83 Cone Area: 10 sq. cm
Easting: Start Date 1/30/20Northing: End Date 1/30/20
Blows Resistance Dynamic Cone Resistance (kg/cm2)Depth per 10 cm (kg/cm²) 0 50 100 150 Cohesionless Cohesive
- 6 26.6 ••••••• 7 Loose M. Stiff- 19 84.4 •••••••••••••••••••••••• 24 M. Dense V. Stiff- 1 ft 21 93.2 •••••••••••••••••••••••••• 25+ M. Dense V. Stiff- 25 111.0 ••••••••••••••••••••••••••••••• 25+ Dense Hard- 29 128.8 •••••••••••••••••••••••••••••••••••• 25+ Dense Hard- 2 ft 31 137.6 ••••••••••••••••••••••••••••••••••••••• 25+ Dense Hard- 28 124.3 ••••••••••••••••••••••••••••••••••• 25+ Dense Hard- 28 124.3 ••••••••••••••••••••••••••••••••••• 25+ Dense Hard- 3 ft 29 128.8 •••••••••••••••••••••••••••••••••••• 25+ Dense Hard- 1 m 23 102.1 ••••••••••••••••••••••••••••• 25+ M. Dense V. Stiff- 24 92.6 •••••••••••••••••••••••••• 25+ M. Dense V. Stiff- 4 ft 30 115.8 ••••••••••••••••••••••••••••••••• 25+ Dense Hard- 31 119.7 •••••••••••••••••••••••••••••••••• 25+ Dense Hard- 30 115.8 ••••••••••••••••••••••••••••••••• 25+ Dense Hard- 5 ft 29 111.9 ••••••••••••••••••••••••••••••• 25+ Dense Hard- 27 104.2 ••••••••••••••••••••••••••••• 25+ M. Dense V. Stiff- 31 119.7 •••••••••••••••••••••••••••••••••• 25+ Dense Hard- 6 ft 41 158.3 ••••••••••••••••••••••••••••••••••••••••••••• 25+ Dense Hard- 42 162.1 •••••••••••••••••••••••••••••••••••••••••••••• 25+ Dense Hard- 2 m 29 111.9 ••••••••••••••••••••••••••••••• 25+ Dense Hard- 7 ft 24 82.1 ••••••••••••••••••••••• 23 M. Dense V. Stiff- 14 47.9 ••••••••••••• 13 M. Dense Stiff- 7 23.9 •••••• 6 Loose M. Stiff- 8 ft 10 34.2 ••••••••• 9 Loose Stiff- 15 51.3 •••••••••••••• 14 M. Dense Stiff- 22 75.2 ••••••••••••••••••••• 21 M. Dense V. Stiff- 9 ft 22 75.2 ••••••••••••••••••••• 21 M. Dense V. Stiff- 15 51.3 •••••••••••••• 14 M. Dense Stiff- 14 47.9 ••••••••••••• 13 M. Dense Stiff- 3 m 10 ft 10 34.2 ••••••••• 9 Loose Stiff- 8 24.5 •••••• 6 Loose M. Stiff- 12 36.7 •••••••••• 10 Loose Stiff- 13 39.8 ••••••••••• 11 M. Dense Stiff- 11 ft 14 42.8 •••••••••••• 12 M. Dense Stiff- 13 39.8 ••••••••••• 11 M. Dense Stiff- 14 42.8 •••••••••••• 12 M. Dense Stiff- 12 ft 15 45.9 ••••••••••••• 13 M. Dense Stiff- 16 49.0 ••••••••••••• 13 M. Dense Stiff- 12 36.7 •••••••••• 10 Loose Stiff- 4 m 13 ft 10 30.6 •••••••• 8 Loose M. Stiff
1309634.55341235.61
Density/ConsistencyCorrelated SPT N-Value
Anchor QEA, LLC1201 3rd Ave Suite 2600Seattle, WA 98101 Page 1 of 2 DCP Exploration Logs
Dynamic Cone PenetrometerExploration Log
191655-01.01City of Everett Code Violation Support
Everett, WA
Location ID: DCP-01 Surface Elevation (ft): 3Performed By: S. Giannakos, G. Timm Total Depth (ft): 16.4
Blows Resistance Dynamic Cone Resistance (kg/cm2)Depth per 10 cm (kg/cm²) 0 50 100 150 Cohesionless Cohesive
- 11 30.5 •••••••• 8 Loose M. Stiff- 26 72.0 •••••••••••••••••••• 20 M. Dense V. Stiff- 14 ft 22 60.9 ••••••••••••••••• 17 M. Dense V. Stiff- 23 63.7 •••••••••••••••••• 18 M. Dense V. Stiff- 28 77.6 •••••••••••••••••••••• 22 M. Dense V. Stiff- 15 ft 27 74.8 ••••••••••••••••••••• 21 M. Dense V. Stiff- 28 77.6 •••••••••••••••••••••• 22 M. Dense V. Stiff- 24 66.5 •••••••••••••••••• 18 M. Dense V. Stiff- 16 ft 25 69.3 ••••••••••••••••••• 19 M. Dense V. Stiff- 5 m 27 74.8 ••••••••••••••••••••• 21 M. Dense V. Stiff-- 17 ft--- 18 ft--- 19 ft-- 6 m- 20 ft--- 21 ft--- 22 ft--- 7 m 23 ft--- 24 ft--- 25 ft--- 26 ft- 8 m-- 27 ft--- 28 ft-
Correlated SPT N-Value
Density/Consistency
Anchor QEA, LLC1201 3rd Ave Suite 2600Seattle, WA 98101 Page 2 of 2 DCP Exploration Logs

Dynamic Cone PenetrometerExploration Log
191655-01.01City of Everett Code Violation Support
Everett, WA
Location ID: DCP-02 Surface Elevation (ft): 2.8Performed By: S. Giannakos, G. Timm Total Depth (ft): 16.4
Vert. Datum: NAVD88 Hammer Weight: 35 lbs.Horiz. Datum: NAVD83 Cone Area: 10 sq. cm
Easting: Start Date 1/30/20Northing: End Date 1/30/20
Blows Resistance Dynamic Cone Resistance (kg/cm2)Depth per 10 cm (kg/cm²) 0 50 100 150 Cohesionless Cohesive
- 8 35.5 •••••••••• 10 Loose Stiff- 10 44.4 •••••••••••• 12 M. Dense Stiff- 1 ft 11 48.8 ••••••••••••• 13 M. Dense Stiff- 12 53.3 ••••••••••••••• 15 M. Dense Stiff- 14 62.2 ••••••••••••••••• 17 M. Dense V. Stiff- 2 ft 9 40.0 ••••••••••• 11 M. Dense Stiff- 11 48.8 ••••••••••••• 13 M. Dense Stiff- 11 48.8 ••••••••••••• 13 M. Dense Stiff- 3 ft 11 48.8 ••••••••••••• 13 M. Dense Stiff- 1 m 13 57.7 •••••••••••••••• 16 M. Dense V. Stiff- 15 57.9 •••••••••••••••• 16 M. Dense V. Stiff- 4 ft 9 34.7 ••••••••• 9 Loose Stiff- 4 15.4 •••• 4 V. Loose Soft- 4 15.4 •••• 4 V. Loose Soft- 5 ft 7 27.0 ••••••• 7 Loose M. Stiff- 8 30.9 •••••••• 8 Loose M. Stiff- 6 23.2 •••••• 6 Loose M. Stiff- 6 ft 7 27.0 ••••••• 7 Loose M. Stiff- 5 19.3 ••••• 5 Loose M. Stiff- 2 m 3 11.6 ••• 3 V. Loose Soft- 7 ft 3 10.3 •• 2 V. Loose Soft- 4 13.7 ••• 3 V. Loose Soft- 3 10.3 •• 2 V. Loose Soft- 8 ft 4 13.7 ••• 3 V. Loose Soft- 4 13.7 ••• 3 V. Loose Soft- 4 13.7 ••• 3 V. Loose Soft- 9 ft 6 20.5 ••••• 5 Loose M. Stiff- 7 23.9 •••••• 6 Loose M. Stiff- 11 37.6 •••••••••• 10 Loose Stiff- 3 m 10 ft 18 61.6 ••••••••••••••••• 17 M. Dense V. Stiff- 16 49.0 ••••••••••••• 13 M. Dense Stiff- 20 61.2 ••••••••••••••••• 17 M. Dense V. Stiff- 21 64.3 •••••••••••••••••• 18 M. Dense V. Stiff- 11 ft 25 76.5 ••••••••••••••••••••• 21 M. Dense V. Stiff- 28 85.7 •••••••••••••••••••••••• 24 M. Dense V. Stiff- 27 82.6 ••••••••••••••••••••••• 23 M. Dense V. Stiff- 12 ft 31 94.9 ••••••••••••••••••••••••••• 25+ M. Dense V. Stiff- 33 101.0 •••••••••••••••••••••••••••• 25+ M. Dense V. Stiff- 29 88.7 ••••••••••••••••••••••••• 25 M. Dense V. Stiff- 4 m 13 ft 31 94.9 ••••••••••••••••••••••••••• 25+ M. Dense V. Stiff
1309636.64341364.81
Density/ConsistencyCorrelated SPT N-Value
Anchor QEA, LLC1201 3rd Ave Suite 2600Seattle, WA 98101 Page 1 of 2 DCP Exploration Logs
Dynamic Cone PenetrometerExploration Log
191655-01.01City of Everett Code Violation Support
Everett, WA
Location ID: DCP-02 Surface Elevation (ft): 3Performed By: S. Giannakos, G. Timm Total Depth (ft): 16.4
Blows Resistance Dynamic Cone Resistance (kg/cm2)Depth per 10 cm (kg/cm²) 0 50 100 150 Cohesionless Cohesive
- 29 80.3 •••••••••••••••••••••• 22 M. Dense V. Stiff- 34 94.2 •••••••••••••••••••••••••• 25+ M. Dense V. Stiff- 14 ft 34 94.2 •••••••••••••••••••••••••• 25+ M. Dense V. Stiff- 34 94.2 •••••••••••••••••••••••••• 25+ M. Dense V. Stiff- 30 83.1 ••••••••••••••••••••••• 23 M. Dense V. Stiff- 15 ft 27 74.8 ••••••••••••••••••••• 21 M. Dense V. Stiff- 27 74.8 ••••••••••••••••••••• 21 M. Dense V. Stiff- 32 88.6 ••••••••••••••••••••••••• 25 M. Dense V. Stiff- 16 ft 34 94.2 •••••••••••••••••••••••••• 25+ M. Dense V. Stiff- 5 m 31 85.9 •••••••••••••••••••••••• 24 M. Dense V. Stiff-- 17 ft--- 18 ft--- 19 ft-- 6 m- 20 ft--- 21 ft--- 22 ft--- 7 m 23 ft--- 24 ft--- 25 ft--- 26 ft- 8 m-- 27 ft--- 28 ft-
Correlated SPT N-Value
Density/Consistency
Anchor QEA, LLC1201 3rd Ave Suite 2600Seattle, WA 98101 Page 2 of 2 DCP Exploration Logs

Dynamic Cone PenetrometerExploration Log
191655-01.01City of Everett Code Violation Support
Everett, WA
Location ID: DCP-03 Surface Elevation (ft): 2.7Performed By: S. Giannakos, G. Timm Total Depth (ft): 16.4
Vert. Datum: NAVD88 Hammer Weight: 35 lbs.Horiz. Datum: NAVD83 Cone Area: 10 sq. cm
Easting: Start Date 1/30/20Northing: End Date 1/30/20
Blows Resistance Dynamic Cone Resistance (kg/cm2)Depth per 10 cm (kg/cm²) 0 50 100 150 Cohesionless Cohesive
- 3 13.3 ••• 3 V. Loose Soft- 12 53.3 ••••••••••••••• 15 M. Dense Stiff- 1 ft 19 84.4 •••••••••••••••••••••••• 24 M. Dense V. Stiff- 18 79.9 •••••••••••••••••••••• 22 M. Dense V. Stiff- 16 71.0 •••••••••••••••••••• 20 M. Dense V. Stiff- 2 ft 18 79.9 •••••••••••••••••••••• 22 M. Dense V. Stiff- 22 97.7 ••••••••••••••••••••••••••• 25+ M. Dense V. Stiff- 28 124.3 ••••••••••••••••••••••••••••••••••• 25+ Dense Hard- 3 ft 28 124.3 ••••••••••••••••••••••••••••••••••• 25+ Dense Hard- 1 m 24 106.6 •••••••••••••••••••••••••••••• 25+ M. Dense V. Stiff- 28 108.1 •••••••••••••••••••••••••••••• 25+ M. Dense V. Stiff- 4 ft 25 96.5 ••••••••••••••••••••••••••• 25+ M. Dense V. Stiff- 10 38.6 ••••••••••• 11 M. Dense Stiff- 8 30.9 •••••••• 8 Loose M. Stiff- 5 ft 12 46.3 ••••••••••••• 13 M. Dense Stiff- 10 38.6 ••••••••••• 11 M. Dense Stiff- 11 42.5 •••••••••••• 12 M. Dense Stiff- 6 ft 9 34.7 ••••••••• 9 Loose Stiff- 10 38.6 ••••••••••• 11 M. Dense Stiff- 2 m 10 38.6 ••••••••••• 11 M. Dense Stiff- 7 ft 14 47.9 ••••••••••••• 13 M. Dense Stiff- 16 54.7 ••••••••••••••• 15 M. Dense Stiff- 14 47.9 ••••••••••••• 13 M. Dense Stiff- 8 ft 18 61.6 ••••••••••••••••• 17 M. Dense V. Stiff- 20 68.4 ••••••••••••••••••• 19 M. Dense V. Stiff- 26 88.9 ••••••••••••••••••••••••• 25 M. Dense V. Stiff- 9 ft 30 102.6 ••••••••••••••••••••••••••••• 25+ M. Dense V. Stiff- 24 82.1 ••••••••••••••••••••••• 23 M. Dense V. Stiff- 22 75.2 ••••••••••••••••••••• 21 M. Dense V. Stiff- 3 m 10 ft 28 95.8 ••••••••••••••••••••••••••• 25+ M. Dense V. Stiff- 22 67.3 ••••••••••••••••••• 19 M. Dense V. Stiff- 29 88.7 ••••••••••••••••••••••••• 25 M. Dense V. Stiff- 31 94.9 ••••••••••••••••••••••••••• 25+ M. Dense V. Stiff- 11 ft 27 82.6 ••••••••••••••••••••••• 23 M. Dense V. Stiff- 22 67.3 ••••••••••••••••••• 19 M. Dense V. Stiff- 31 94.9 ••••••••••••••••••••••••••• 25+ M. Dense V. Stiff- 12 ft 46 140.8 •••••••••••••••••••••••••••••••••••••••• 25+ Dense Hard- 28 85.7 •••••••••••••••••••••••• 24 M. Dense V. Stiff- 18 55.1 ••••••••••••••• 15 M. Dense Stiff- 4 m 13 ft 12 36.7 •••••••••• 10 Loose Stiff
1309636.57341505.31
Density/ConsistencyCorrelated SPT N-Value
Anchor QEA, LLC1201 3rd Ave Suite 2600Seattle, WA 98101 Page 1 of 2 DCP Exploration Logs
Dynamic Cone PenetrometerExploration Log
191655-01.01City of Everett Code Violation Support
Everett, WA
Location ID: DCP-03 Surface Elevation (ft): 3Performed By: S. Giannakos, G. Timm Total Depth (ft): 16.4
Blows Resistance Dynamic Cone Resistance (kg/cm2)Depth per 10 cm (kg/cm²) 0 50 100 150 Cohesionless Cohesive
- 13 36.0 •••••••••• 10 Loose Stiff- 13 36.0 •••••••••• 10 Loose Stiff- 14 ft 14 38.8 ••••••••••• 11 M. Dense Stiff- 20 55.4 ••••••••••••••• 15 M. Dense Stiff- 19 52.6 ••••••••••••••• 15 M. Dense Stiff- 15 ft 21 58.2 •••••••••••••••• 16 M. Dense V. Stiff- 20 55.4 ••••••••••••••• 15 M. Dense Stiff- 19 52.6 ••••••••••••••• 15 M. Dense Stiff- 16 ft 23 63.7 •••••••••••••••••• 18 M. Dense V. Stiff- 5 m 22 60.9 ••••••••••••••••• 17 M. Dense V. Stiff-- 17 ft--- 18 ft--- 19 ft-- 6 m- 20 ft--- 21 ft--- 22 ft--- 7 m 23 ft--- 24 ft--- 25 ft--- 26 ft- 8 m-- 27 ft--- 28 ft-
Correlated SPT N-Value
Density/Consistency
Anchor QEA, LLC1201 3rd Ave Suite 2600Seattle, WA 98101 Page 2 of 2 DCP Exploration Logs
Dynamic Cone PenetrometerExploration Log
191655-01.01City of Everett Code Violation Support
Everett, WA
Location ID: DCP-04 Surface Elevation (ft): 2.4Performed By: S. Giannakos, G. Timm Total Depth (ft): 16.4
Vert. Datum: NAVD88 Hammer Weight: 35 lbs.Horiz. Datum: NAVD83 Cone Area: 10 sq. cm
Easting: Start Date 1/30/20Northing: End Date 1/30/20
Blows Resistance Dynamic Cone Resistance (kg/cm2)Depth per 10 cm (kg/cm²) 0 50 100 150 Cohesionless Cohesive
- 6 26.6 ••••••• 7 Loose M. Stiff- 13 57.7 •••••••••••••••• 16 M. Dense V. Stiff- 1 ft 15 66.6 ••••••••••••••••••• 19 M. Dense V. Stiff- 22 97.7 ••••••••••••••••••••••••••• 25+ M. Dense V. Stiff- 19 84.4 •••••••••••••••••••••••• 24 M. Dense V. Stiff- 2 ft 11 48.8 ••••••••••••• 13 M. Dense Stiff- 7 31.1 •••••••• 8 Loose M. Stiff- 4 17.8 ••••• 5 Loose M. Stiff- 3 ft 9 40.0 ••••••••••• 11 M. Dense Stiff- 1 m 6 26.6 ••••••• 7 Loose M. Stiff- 5 19.3 ••••• 5 Loose M. Stiff- 4 ft 5 19.3 ••••• 5 Loose M. Stiff- 6 23.2 •••••• 6 Loose M. Stiff- 8 30.9 •••••••• 8 Loose M. Stiff- 5 ft 6 23.2 •••••• 6 Loose M. Stiff- 15 57.9 •••••••••••••••• 16 M. Dense V. Stiff- 12 46.3 ••••••••••••• 13 M. Dense Stiff- 6 ft 14 54.0 ••••••••••••••• 15 M. Dense Stiff- 16 61.8 ••••••••••••••••• 17 M. Dense V. Stiff- 2 m 12 46.3 ••••••••••••• 13 M. Dense Stiff- 7 ft 16 54.7 ••••••••••••••• 15 M. Dense Stiff- 11 37.6 •••••••••• 10 Loose Stiff- 10 34.2 ••••••••• 9 Loose Stiff- 8 ft 12 41.0 ••••••••••• 11 M. Dense Stiff- 13 44.5 •••••••••••• 12 M. Dense Stiff- 14 47.9 ••••••••••••• 13 M. Dense Stiff- 9 ft 18 61.6 ••••••••••••••••• 17 M. Dense V. Stiff- 20 68.4 ••••••••••••••••••• 19 M. Dense V. Stiff- 16 54.7 ••••••••••••••• 15 M. Dense Stiff- 3 m 10 ft 16 54.7 ••••••••••••••• 15 M. Dense Stiff- 12 36.7 •••••••••• 10 Loose Stiff- 11 33.7 ••••••••• 9 Loose Stiff- 12 36.7 •••••••••• 10 Loose Stiff- 11 ft 10 30.6 •••••••• 8 Loose M. Stiff- 12 36.7 •••••••••• 10 Loose Stiff- 11 33.7 ••••••••• 9 Loose Stiff- 12 ft 10 30.6 •••••••• 8 Loose M. Stiff- 12 36.7 •••••••••• 10 Loose Stiff- 12 36.7 •••••••••• 10 Loose Stiff- 4 m 13 ft 13 39.8 ••••••••••• 11 M. Dense Stiff
1309641.06341660.57
Density/ConsistencyCorrelated SPT N-Value
Anchor QEA, LLC1201 3rd Ave Suite 2600Seattle, WA 98101 Page 1 of 2 DCP Exploration Logs
Appendix C Laboratory Report

Date Revised: Date Sampled:
Test(s) Performed: Test(s) Performed:
X
X X
XX
Respectfully Submitted,
NW Region Laboratory Manager
Client:
Sample #:
Date:Project:
Anchor QEA720 Olive Way, Suite 1900
Attn:
Sulfate SoundnessSieve Analysis
January 31, 2020
Materials Testing & Consulting, Inc. Geotechnical Engineering • Special Inspection • Materials Testing • Environmental Consulting
Test Results
Seattle, WA 98101Casey Janisch
February 24, 2020
20S051B20-0116 - 0125
Project #:Q.C. - Everett Code Violation SettlementAddress:
As requested MTC, Inc. has performed the following test(s) on the sample referenced above. The testing was performed in accordance with current applicable AASHTO or ASTM standards as indicated below. The results obtained in our laboratory were as follows below or on the attached pages:
Test Results
See Attached Reports
See Attached ReportsSee Attached Reports
Corporate ~ 777 Chrysler Drive • Burlington, WA 98233 • Phone (360) 755-1990 • Fax (360) 755-1980Regional Offices: Olympia ~ 360.534.9777 Bellingham ~ 360.647.6111 Silverdale ~ 360.698.6787 Tukwila ~ 206.241.1974
Visit our website: www.mtc-inc.net
Meghan Blodgett-Carrillo
If you have any questions concerning the test results, the procedures used, or if we can be of any further assistance please call on us at the number below.
Rice Density
ProctorSand EquivalentFracture Count Specific Gravity, Soils
See Attached ReportsWSDOT DegradationBulk Density & Voids
Atterberg LimitsAsphalt Extraction/Gradation
Moisture Content See Attached ReportSpecific Gravity, CoarseSpecific Gravity, FineHydrometer Analysis

Project: Q.C. - Everett Code Violation Settlement Client:Project #: 20S051
Date Received: February 14, 2020 Sampled by:Date Tested: February 17, 2020 Tested by:
Sample # Location Tare Wet + Tare Dry + Tare Wgt. Of Moisture Wgt. Of Soil % MoistureB20-0116 EM-HA5 @ 5.3-6.8 - 20200131 763.6 2837.0 2294.8 542.2 1531.2 35.4%B20-0117 EM-HA6 @ 5.8-7.3 - 20200131 720.3 2024.9 1659.0 365.9 938.7 39.0%B20-0118 EM-HA1 @ 0-2.6 - 20200131 719.4 2297.4 1878.6 418.8 1159.2 36.1%B20-0119 EM-HA1 @ 2.6-5 - 20200131 722.0 1635.8 1370.4 265.4 648.4 40.9%B20-0120 EM-HA6 @ 2.2-3.5 - 20200131 644.9 2547.2 2158.4 388.8 1513.5 25.7%B20-0121 EM-HA6 @ 0-2.2 - 20200131 688.1 1962.5 1759.8 202.7 1071.7 18.9%B20-0122 EM-HA6 @ 3.5-5.8 - 20200131 764.5 4723.4 3940.4 783.0 3175.9 24.7%B20-0123 EM-HA3 @ 0-1 - 20200131 10.1 355.1 291.4 63.7 281.3 22.6%B20-0124 EM-HA5 @ 0-2 - 20200131 10.5 195.6 147.9 47.7 137.4 34.7%B20-0125 EM-HA4 @ 2.5-6.2 - 20200131 687.7 1500.2 1349.5 150.7 661.8 22.8%
0.0 0.0 #DIV/0!0.0 0.0 #DIV/0!0.0 0.0 #DIV/0!0.0 0.0 #DIV/0!0.0 0.0 #DIV/0!0.0 0.0 #DIV/0!0.0 0.0 #DIV/0!0.0 0.0 #DIV/0!0.0 0.0 #DIV/0!0.0 0.0 #DIV/0!0.0 0.0 #DIV/0!0.0 0.0 #DIV/0!0.0 0.0 #DIV/0!0.0 0.0 #DIV/0!0.0 0.0 #DIV/0!
Reviewed by:Meghan Blodgett-Carrillo
Regional Offices: Olympia ~ 360.534.9777 Bellingham ~ 360.647.6111 Silverdale ~ 360.698.6787 Tukwila ~ 206.241.1974Visit our website: www.mtc-inc.net
Corporate ~ 777 Chrysler Drive • Burlington, WA 98233 • Phone (360) 755-1990 • Fax (360) 755-1980
All results apply only to actual locations and materials tested. As a mutual protection to clients, the public and ourselves, all reports are submitted as the confidential property of clients, and authorization for publication of statements, conclusions or extracts from or regarding our reports is reserved pending our written approval.
Materials Testing & Consulting, Inc. Geotechnical Engineering • Special Inspection • Materials Testing • Environmental Consulting
Anchor QEA
ClientM. Carrillo
Moisture Content - ASTM C-566, ASTM D-2216 & AASHTO T-265

Materials Testing & Consulting, Inc. Geotechnical Engineering & Consulting ● Special Inspection ● Materials Testing ● Environmental Consulting
A l l r e s u l t s a p p l y o n l y t o a c t u a l l o c a t i o n s a n d m a t e r i a l s t e s t e d . A s a m u t u a l p r o t e c t i o n t o c l i e n t s , t h e p u b l i c a n d o u r s e l v e s , a l l r e p o r t s a r e s u b m i t t e d a s t h e c o n f i d e n t i a l p r o p e r t y o f c l i e n t s , a n d a u t h o r i z a t i o n f o r p u b l i c a t i o n o f s t a t e m e n t s , c o n c l u s i o n s o r e x t r a c t s f r o m o r r e g a r d i n g o u r r e p o r t s i s r e s e r v e d p e n d i n g o u r w r i t t e n a p p r o v a l . ©
2 0 0 8 - 2 0 1 5 M a t e r i a l s T e s t i n g & C o n s u l t i n g , I n c . A l l r i g h t s r e s e r v e d .
C or por a te 777 C hr ys le r D r ive • B ur l ing ton , WA 98233 • Phone 360 .755 .1990 • Fax 360 .755 .1980
R e g iona l Of f i ce s : O lympia B e l l i ngha m S i lve rda l e T ukw i l a 360 .534 .9777 360 .647 .6111 360 .698 .6787 206 .241 .1974
V i s i t ou r w e bs i t e : w w w .mtc - inc .ne t
SOILS SPECIFIC GRAVITY ASTM D-854
Project: Q.C. – Everett Code Violation Settlement Client: Anchor QEA
Project #: 20S051 Sampled by: Client Lab #: B20-0116 Date Sampled: 1-31-20
Location/Source: EM-HA5 @ 5.3-6.8 – 20200131 Tested by: A. Eifrig Description: Grayish-brown silt with clay Date Tested: 2-18-20
Equipment Used: SA-050 A3, CA-017, MI-007 Record the following weights to the nearest 0.01 grams. A Weight of Pan 737.70
B Oven Dry Weight of Soils & Pan 804.10
C Oven Dry Weight of Soils (B-A) 66.40
D Weight of Pycnometer filled with water 658.77
E Weight of Pycnometer filled with water & soils 701.58
F Temperature of water in Item “E” 86.0*F Technicians Record values to 3 decimal places & Clerical Report values to 2 decimal places G Specific Gravity C/(C+D-E) 2.81
H Temperature Correction Factor 0.9974
I Corrected Specific Gravity (H*G) 2.80
Temperature (*C) Temperature (*F) Relative Density of Water Correction Factor 18 64.4 0.9986244 1.0004 19 66.2 0.9984347 1.0002 20 68.0 0.9982343 1.0000 21 69.8 0.9980233 0.9998 22 71.6 0.9978019 0.9996 23 73.4 0.9975702 0.9993 24 75.2 0.9973286 0.9991 25 77.0 0.9970770 0.9988 26 78.8 0.9968156 0.9986 27 80.6 0.9965451 0.9983 28 82.4 0.9962652 0.9980 29 84.2 0.9959761 0.9977 30 86.0 0.9956780 0.9974
Reviewed by:
Meghan Blodgett-Carrillo
Project:Project #:
Client: Sample ColorSource:
Sample #:
#1 #2 #3 #4 #5 #6
Weight of Wet Soils + Pan: 39.38 38.71 31.32
Weight of Dry Soils + Pan: 35.48 34.70 27.68
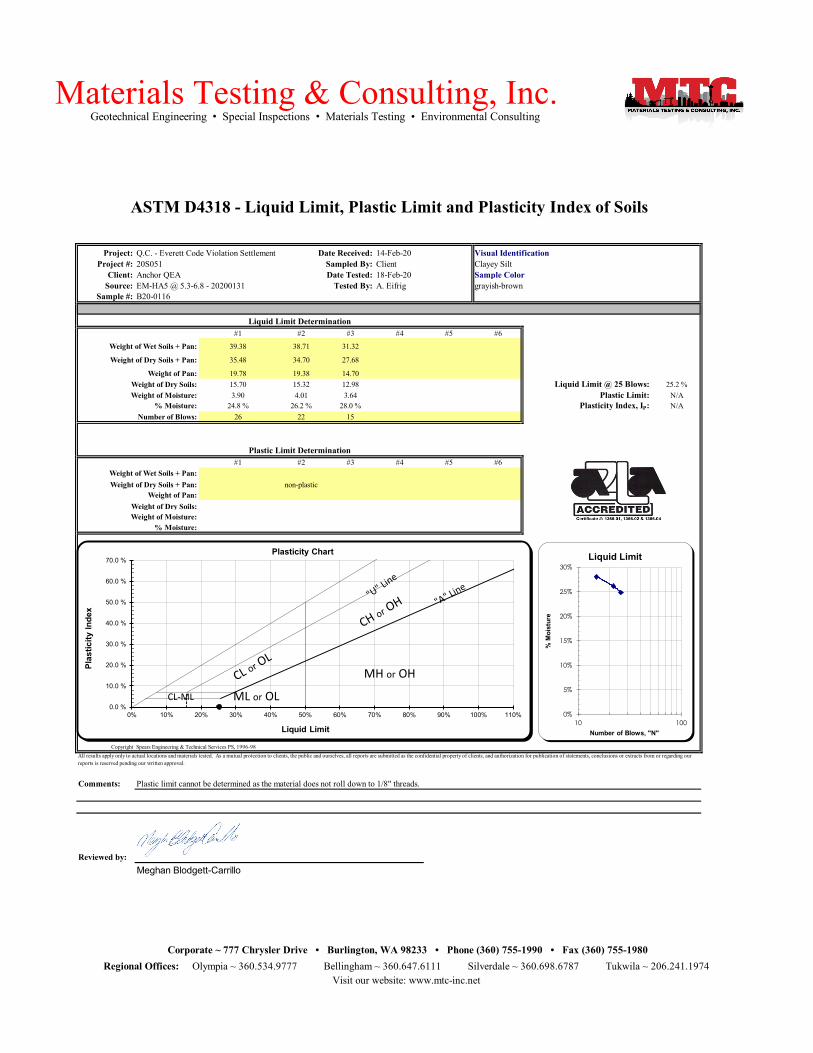
Weight of Pan: 19.78 19.38 14.70Weight of Dry Soils: 15.70 15.32 12.98 Liquid Limit @ 25 Blows: 25.2 %Weight of Moisture: 3.90 4.01 3.64 Plastic Limit: N/A
% Moisture: 24.8 % 26.2 % 28.0 % Plasticity Index, IP: N/ANumber of Blows: 26 22 15
#1 #2 #3 #4 #5 #6Weight of Wet Soils + Pan:Weight of Dry Soils + Pan: non-plastic
Weight of Pan:Weight of Dry Soils:Weight of Moisture:
% Moisture:
Copyright Spears Engineering & Technical Services PS, 1996-98
Comments:
Reviewed by:Meghan Blodgett-Carrillo
Sampled By:Date Tested:
Tested By:
Plastic Limit Determination
All results apply only to actual locations and materials tested. As a mutual protection to clients, the public and ourselves, all reports are submitted as the confidential property of clients, and authorization for publication of statements, conclusions or extracts from or regarding our reports is reserved pending our written approval.
20S051 Clayey Silt
grayish-brown
Visit our website: www.mtc-inc.net
Corporate ~ 777 Chrysler Drive • Burlington, WA 98233 • Phone (360) 755-1990 • Fax (360) 755-1980
Liquid Limit Determination
Plastic limit cannot be determined as the material does not roll down to 1/8" threads.
Geotechnical Engineering • Special Inspections • Materials Testing • Environmental ConsultingMaterials Testing & Consulting, Inc.
Regional Offices: Olympia ~ 360.534.9777 Bellingham ~ 360.647.6111 Silverdale ~ 360.698.6787 Tukwila ~ 206.241.1974
18-Feb-20EM-HA5 @ 5.3-6.8 - 20200131Anchor QEA
A. Eifrig
14-Feb-20Client
ASTM D4318 - Liquid Limit, Plastic Limit and Plasticity Index of Soils
Q.C. - Everett Code Violation Settlement Visual IdentificationDate Received:
B20-0116
0%
5%
10%
15%
20%
25%
30%
10 100
% M
oist
ure
Number of Blows, "N"
Liquid Limit
0.0 %
10.0 %
20.0 %
30.0 %
40.0 %
50.0 %
60.0 %
70.0 %
0% 10% 20% 30% 40% 50% 60% 70% 80% 90% 100% 110%
Plas
ticity
Inde
x
Liquid Limit
Plasticity Chart
MH or OH
ML or OLCL-ML

Materials Testing & Consulting, Inc. Geotechnical Engineering & Consulting ● Special Inspection ● Materials Testing ● Environmental Consulting
A l l r e s u l t s a p p l y o n l y t o a c t u a l l o c a t i o n s a n d m a t e r i a l s t e s t e d . A s a m u t u a l p r o t e c t i o n t o c l i e n t s , t h e p u b l i c a n d o u r s e l v e s , a l l r e p o r t s a r e s u b m i t t e d a s t h e c o n f i d e n t i a l p r o p e r t y o f c l i e n t s , a n d a u t h o r i z a t i o n f o r p u b l i c a t i o n o f s t a t e m e n t s , c o n c l u s i o n s o r e x t r a c t s f r o m o r r e g a r d i n g o u r r e p o r t s i s r e s e r v e d p e n d i n g o u r w r i t t e n a p p r o v a l . ©
2 0 0 8 - 2 0 1 5 M a t e r i a l s T e s t i n g & C o n s u l t i n g , I n c . A l l r i g h t s r e s e r v e d .
C or por a te 777 C hr ys le r D r ive • B ur l ing ton , WA 98233 • Phone 360 .755 .1990 • Fax 360 .755 .1980
R e g iona l Of f i ce s : O lympia B e l l i ngha m S i lve rda l e T ukw i l a 360 .534 .9777 360 .647 .6111 360 .698 .6787 206 .241 .1974
V i s i t ou r w e bs i t e : w w w .mtc - inc .ne t
SOILS SPECIFIC GRAVITY ASTM D-854
Project: Q.C. – Everett Code Violation Settlement Client: Anchor QEA
Project #: 20S051 Sampled by: Client Lab #: B20-0117 Date Sampled: 1-31-20
Location/Source: EM-HA6 @ 5.8-7.3 – 20200131 Tested by: A. Eifrig Description: Gray silt with clay Date Tested: 2-18-20
Equipment Used: SA-050 A2, CA-017, MI-007 Record the following weights to the nearest 0.01 grams. A Weight of Pan 720.70
B Oven Dry Weight of Soils & Pan 771.50
C Oven Dry Weight of Soils (B-A) 50.80
D Weight of Pycnometer filled with water 662.79
E Weight of Pycnometer filled with water & soils 695.64
F Temperature of water in Item “E” 86.0*F Technicians Record values to 3 decimal places & Clerical Report values to 2 decimal places G Specific Gravity C/(C+D-E) 2.83
H Temperature Correction Factor 0.9974
I Corrected Specific Gravity (H*G) 2.82
Temperature (*C) Temperature (*F) Relative Density of Water Correction Factor 18 64.4 0.9986244 1.0004 19 66.2 0.9984347 1.0002 20 68.0 0.9982343 1.0000 21 69.8 0.9980233 0.9998 22 71.6 0.9978019 0.9996 23 73.4 0.9975702 0.9993 24 75.2 0.9973286 0.9991 25 77.0 0.9970770 0.9988 26 78.8 0.9968156 0.9986 27 80.6 0.9965451 0.9983 28 82.4 0.9962652 0.9980 29 84.2 0.9959761 0.9977 30 86.0 0.9956780 0.9974
Reviewed by:
Meghan Blodgett-Carrillo

Project:Project #:
Client: Sample ColorSource:
Sample #:
#1 #2 #3 #4 #5 #6
Weight of Wet Soils + Pan:
Weight of Dry Soils + Pan: non-plastic
Weight of Pan:Weight of Dry Soils: Liquid Limit @ 25 Blows: N/AWeight of Moisture: Plastic Limit: N/A
% Moisture: Plasticity Index, IP: N/ANumber of Blows:
#1 #2 #3 #4 #5 #6Weight of Wet Soils + Pan:Weight of Dry Soils + Pan: non-plastic
Weight of Pan:Weight of Dry Soils:Weight of Moisture:
% Moisture:
Copyright Spears Engineering & Technical Services PS, 1996-98
Comments:
Reviewed by:Meghan Blodgett-Carrillo
Geotechnical Engineering • Special Inspections • Materials Testing • Environmental ConsultingMaterials Testing & Consulting, Inc.
Regional Offices: Olympia ~ 360.534.9777 Bellingham ~ 360.647.6111 Silverdale ~ 360.698.6787 Tukwila ~ 206.241.1974
18-Feb-20EM-HA6 @ 5.8-7.3 - 20200131Anchor QEA
A. Eifrig
14-Feb-20Client
ASTM D4318 - Liquid Limit, Plastic Limit and Plasticity Index of Soils
Q.C. - Everett Code Violation Settlement Visual IdentificationDate Received:
B20-0117
Visit our website: www.mtc-inc.net
Corporate ~ 777 Chrysler Drive • Burlington, WA 98233 • Phone (360) 755-1990 • Fax (360) 755-1980
Liquid Limit Determination
Non-plastic. Liquid limit cannot be established due to rapid dilation. Plastic limit cannot be determined as the material does not roll down to 1/8" threads.
Sampled By:Date Tested:
Tested By:
Plastic Limit Determination
All results apply only to actual locations and materials tested. As a mutual protection to clients, the public and ourselves, all reports are submitted as the confidential property of clients, and authorization for publication of statements, conclusions or extracts from or regarding our reports is reserved pending our written approval.
20S051 Silt with Clay
gray
0%
10%
20%
30%
40%
50%
60%
70%
80%
90%
100%
10 100
% M
oist
ure
Number of Blows, "N"
Liquid Limit
0.0 %
10.0 %
20.0 %
30.0 %
40.0 %
50.0 %
60.0 %
70.0 %
0% 10% 20% 30% 40% 50% 60% 70% 80% 90% 100% 110%
Plas
ticity
Inde
x
Liquid Limit
Plasticity Chart
MH or OH
ML or OLCL-ML
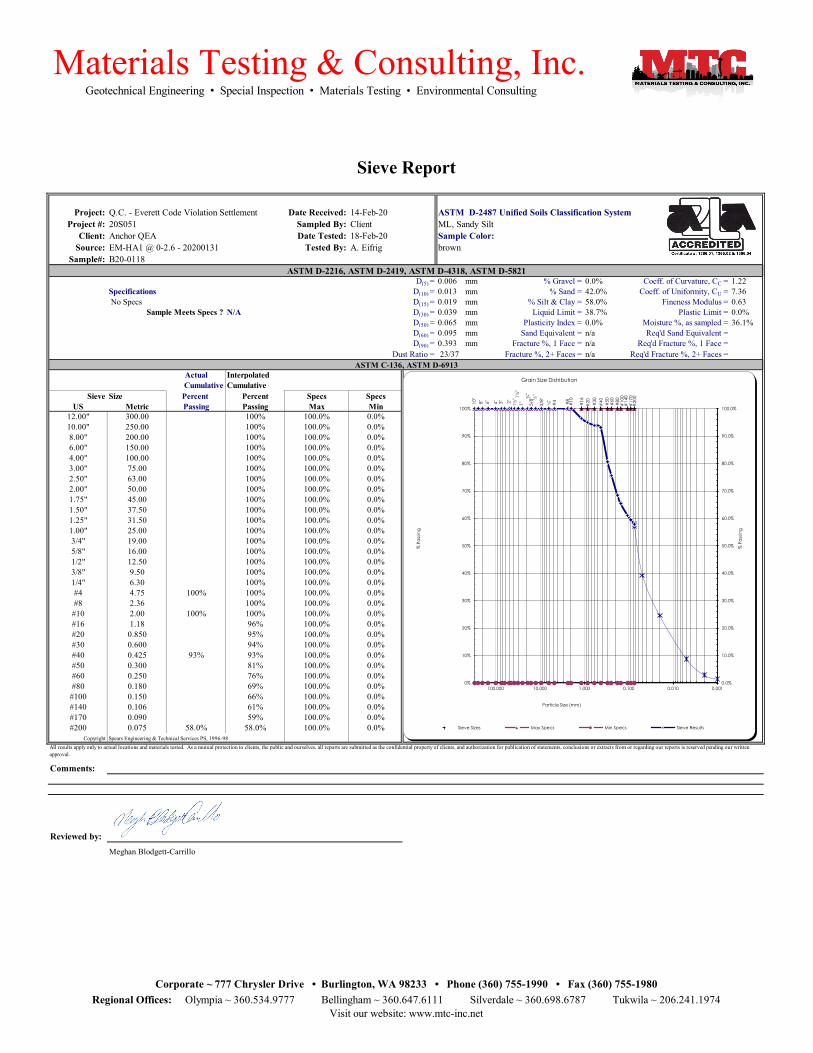
Project: Date Received: 14-Feb-20Project #: Sampled By: Client
Client: Date Tested: 18-Feb-20Source: Tested By: A. Eifrig
Sample#: B20-0118
D(5) = 0.006 mm % Gravel = 0.0% Coeff. of Curvature, CC = 1.22Specifications D(10) = 0.013 mm % Sand = 42.0% Coeff. of Uniformity, CU = 7.36 No Specs D(15) = 0.019 mm % Silt & Clay = 58.0% Fineness Modulus = 0.63
Sample Meets Specs ? N/A D(30) = 0.039 mm Liquid Limit = 38.7% Plastic Limit = 0.0%D(50) = 0.065 mm Plasticity Index = 0.0% Moisture %, as sampled = 36.1%D(60) = 0.095 mm Sand Equivalent = n/a Req'd Sand Equivalent = D(90) = 0.393 mm Fracture %, 1 Face = n/a Req'd Fracture %, 1 Face =
Dust Ratio = 23/37 Fracture %, 2+ Faces = n/a Req'd Fracture %, 2+ Faces =
Actual InterpolatedCumulative Cumulative
Sieve Size Percent Percent Specs SpecsUS Metric Passing Passing Max Min
12.00" 300.00 100% 100.0% 0.0%10.00" 250.00 100% 100.0% 0.0%8.00" 200.00 100% 100.0% 0.0%6.00" 150.00 100% 100.0% 0.0%4.00" 100.00 100% 100.0% 0.0%3.00" 75.00 100% 100.0% 0.0%2.50" 63.00 100% 100.0% 0.0%2.00" 50.00 100% 100.0% 0.0%1.75" 45.00 100% 100.0% 0.0%1.50" 37.50 100% 100.0% 0.0%1.25" 31.50 100% 100.0% 0.0%1.00" 25.00 100% 100.0% 0.0%3/4" 19.00 100% 100.0% 0.0%5/8" 16.00 100% 100.0% 0.0%1/2" 12.50 100% 100.0% 0.0%3/8" 9.50 100% 100.0% 0.0%1/4" 6.30 100% 100.0% 0.0%#4 4.75 100% 100% 100.0% 0.0%#8 2.36 100% 100.0% 0.0%
#10 2.00 100% 100% 100.0% 0.0%#16 1.18 96% 100.0% 0.0%#20 0.850 95% 100.0% 0.0%#30 0.600 94% 100.0% 0.0%#40 0.425 93% 93% 100.0% 0.0%#50 0.300 81% 100.0% 0.0%#60 0.250 76% 100.0% 0.0%#80 0.180 69% 100.0% 0.0%
#100 0.150 66% 100.0% 0.0%#140 0.106 61% 100.0% 0.0%#170 0.090 59% 100.0% 0.0%#200 0.075 58.0% 58.0% 100.0% 0.0%
Copyright Spears Engineering & Technical Services PS, 1996-98
Comments:
Reviewed by: Meghan Blodgett-Carrillo
Materials Testing & Consulting, Inc.
Visit our website: www.mtc-inc.net
All results apply only to actual locations and materials tested. As a mutual protection to clients, the public and ourselves, all reports are submitted as the confidential property of clients, and authorization for publication of statements, conclusions or extracts from or regarding our reports is reserved pending our written approval.
Corporate ~ 777 Chrysler Drive • Burlington, WA 98233 • Phone (360) 755-1990 • Fax (360) 755-1980Regional Offices: Olympia ~ 360.534.9777 Bellingham ~ 360.647.6111 Silverdale ~ 360.698.6787 Tukwila ~ 206.241.1974
Geotechnical Engineering • Special Inspection • Materials Testing • Environmental Consulting
Sieve Report
ASTM C-136, ASTM D-6913
20S051Anchor QEAEM-HA1 @ 0-2.6 - 20200131
ASTM D-2487 Unified Soils Classification System
ASTM D-2216, ASTM D-2419, ASTM D-4318, ASTM D-5821
ML, Sandy Silt
brownSample Color:
Q.C. - Everett Code Violation Settlement
8" 6" 4" 2"3" 1½" 1¼
"
10"
1"¾
"5/
8" ½"
3/8"
¼"
#4 #8
#10
#16
#20 #30
#40 #50
#60
#80
#10
0#
140
#17
0#
200
0%
10%
20%
30%
40%
50%
60%
70%
80%
90%
100%
0.0%
10.0%
20.0%
30.0%
40.0%
50.0%
60.0%
70.0%
80.0%
90.0%
100.0%
0.0010.0100.1001.00010.000100.000
% P
assin
g
% P
assin
g
Particle Size (mm)
Grain Size Distribution
Sieve Sizes Max Specs Min Specs Sieve Results

Project: Q.C. - Everett Code Violation Settlement Date Received: 14-Feb-20Project #: 20S051 Sampled By: Client
Client : Anchor QEA Date Tested: 18-Feb-20 Sample ColorSource: EM-HA1 @ 0-2.6 - 20200131 Tested By: A. Eifrig
Sample#: B20-0118
Sp Gr : 2.62Sample Weight: 50.19 grams
Hydroscopic Moist.: 3.33% Sieve PercentAdj. Sample Wgt : 48.57 grams Size Passing
3.0" 100% 75.000 mmHydrometer 2.0" 100% 50.000 mm
Reading Corrected Percent 1.5" 100% 37.500 mmMinutes Reading Passing 1.25" 100% 31.500 mm
2 14 29.1% 0.0367 mm 1.0" 100% 25.000 mm5 12 25.0% 0.0234 mm 3/4" 100% 19.000 mm
15 11.5 23.9% 0.0136 mm 5/8" 100% 16.000 mm30 8 16.6% 0.0098 mm 1/2" 100% 12.500 mm60 6.5 13.5% 0.0070 mm 3/8" 100% 9.500 mm
250 2.5 5.2% 0.0035 mm 1/4" 100% 6.300 mm1440 1 2.1% 0.0015 mm #4 100% 4.750 mm
#10 100% 2.000 mm% Gravel: 0.0% Liquid Limit: 38.7 % #20 95% 0.850 mm
% Sand: 42.0% Plastic Limit: 0.0 % #40 93% 0.425 mm% Silt: 49.2% Plasticity Index: 0.0 % #100 66% 0.150 mm
% Clay: 8.8% #200 58.0% 0.075 mmSilts 57.2% 0.074 mm
39.1% 0.050 mm24.6% 0.020 mm
Clays 8.8% 0.005 mm2.9% 0.002 mm
Colloids 1.4% 0.001 mm
Particle Size% Sand: 60.9% 2.0 - 0.05 mm
% Silt: 36.2% 0.05 - 0.002 mm% Clay: 2.9% < 0.002 mm
Sandy Loam
Comments:
Reviewed by:Meghan Blodgett-Carrillo
All results apply only to actual locations and materials tested. As a mutual protection to clients, the public and ourselves, all reports are submitted as the confidential property of clients, and authorization for publication of statements, conclusions or extracts from or regarding our reports is reserved pending our written approval.
USDA Soil Textural Classification
ASTM C-136
Soils Particle
ASTM D-422, HYDROMETER ANALYSISSieve Analysis
Grain Size Distribution
Visit our website: www.mtc-inc.net
Corporate ~ 777 Chrysler Drive • Burlington, WA 98233 • Phone (360) 755-1990 • Fax (360) 755-1980Regional Offices: Olympia ~ 360.534.9777 Bellingham ~ 360.647.6111 Silverdale ~ 360.698.6787 Tukwila ~ 206.241.1974
Materials Testing & Consulting, Inc. Geotechnical Engineering • Special Inspection • Materials Testing • Environmental Consulting
USDA Soil Textural Classification
Hydrometer Report
ML, Sandy Silt
Diameter
brown
Soils ParticleDiameter
ASTM D 2487 Soils Classification

Project:Project #:
Client: Sample ColorSource:
Sample #:
#1 #2 #3 #4 #5 #6
Weight of Wet Soils + Pan: 33.96 33.32 35.99
Weight of Dry Soils + Pan: 28.49 27.93 31.01
Weight of Pan: 14.63 14.92 19.32Weight of Dry Soils: 13.86 13.01 11.69 Liquid Limit @ 25 Blows: 38.7 %Weight of Moisture: 5.47 5.39 4.98 Plastic Limit: N/A
% Moisture: 39.5 % 41.4 % 42.6 % Plasticity Index, IP: N/ANumber of Blows: 22 15 10
#1 #2 #3 #4 #5 #6Weight of Wet Soils + Pan:Weight of Dry Soils + Pan: non-plastic
Weight of Pan:Weight of Dry Soils:Weight of Moisture:
% Moisture:
Copyright Spears Engineering & Technical Services PS, 1996-98
Comments:
Reviewed by:Meghan Blodgett-Carrillo
Geotechnical Engineering • Special Inspections • Materials Testing • Environmental ConsultingMaterials Testing & Consulting, Inc.
Regional Offices: Olympia ~ 360.534.9777 Bellingham ~ 360.647.6111 Silverdale ~ 360.698.6787 Tukwila ~ 206.241.1974
18-Feb-20EM-HA1 @ 0-2.6 - 20200131Anchor QEA
A. Eifrig
14-Feb-20Client
ASTM D4318 - Liquid Limit, Plastic Limit and Plasticity Index of Soils
Q.C. - Everett Code Violation Settlement ASTM D 2487 Unified Soils ClassificationDate Received:
B20-0118
Visit our website: www.mtc-inc.net
Corporate ~ 777 Chrysler Drive • Burlington, WA 98233 • Phone (360) 755-1990 • Fax (360) 755-1980
Liquid Limit Determination
Plastic limit cannot be determined as the material does not roll down to 1/8" threads.
Sampled By:Date Tested:
Tested By:
Plastic Limit Determination
All results apply only to actual locations and materials tested. As a mutual protection to clients, the public and ourselves, all reports are submitted as the confidential property of clients, and authorization for publication of statements, conclusions or extracts from or regarding our reports is reserved pending our written approval.
20S051 ML, Sandy Silt
brown
0%
5%
10%
15%
20%
25%
30%
35%
40%
45%
10 100
% M
oist
ure
Number of Blows, "N"
Liquid Limit
0.0 %
10.0 %
20.0 %
30.0 %
40.0 %
50.0 %
60.0 %
70.0 %
0% 10% 20% 30% 40% 50% 60% 70% 80% 90% 100% 110%
Plas
ticity
Inde
x
Liquid Limit
Plasticity Chart
MH or OH
ML or OLCL-ML

Materials Testing & Consulting, Inc. Geotechnical Engineering & Consulting ● Special Inspection ● Materials Testing ● Environmental Consulting
A l l r e s u l t s a p p l y o n l y t o a c t u a l l o c a t i o n s a n d m a t e r i a l s t e s t e d . A s a m u t u a l p r o t e c t i o n t o c l i e n t s , t h e p u b l i c a n d o u r s e l v e s , a l l r e p o r t s a r e s u b m i t t e d a s t h e c o n f i d e n t i a l p r o p e r t y o f c l i e n t s , a n d a u t h o r i z a t i o n f o r p u b l i c a t i o n o f s t a t e m e n t s , c o n c l u s i o n s o r e x t r a c t s f r o m o r r e g a r d i n g o u r r e p o r t s i s r e s e r v e d p e n d i n g o u r w r i t t e n a p p r o v a l . ©
2 0 0 8 - 2 0 1 5 M a t e r i a l s T e s t i n g & C o n s u l t i n g , I n c . A l l r i g h t s r e s e r v e d .
C or por a te 777 C hr ys le r D r ive • B ur l ing ton , WA 98233 • Phone 360 .755 .1990 • Fax 360 .755 .1980
R e g iona l Of f i ce s : O lympia B e l l i ngha m S i lve rda l e T ukw i l a 360 .534 .9777 360 .647 .6111 360 .698 .6787 206 .241 .1974
V i s i t ou r w e bs i t e : w w w .mtc - inc .ne t
SOILS SPECIFIC GRAVITY ASTM D-854
Project: Q.C. – Everett Code Violation Settlement Client: Anchor QEA
Project #: 20S051 Sampled by: Client Lab #: B20-0118 Date Sampled: 1-31-20
Location/Source: EM-HA1 @ 0-2.6 – 20200131 Tested by: A. Eifrig Description: Brown sandy silt with clay Date Tested: 2-18-20
Equipment Used: SA-050 A2, CA-017, MI-007 Record the following weights to the nearest 0.01 grams. A Weight of Pan 719.30
B Oven Dry Weight of Soils & Pan 774.80
C Oven Dry Weight of Soils (B-A) 55.50
D Weight of Pycnometer filled with water 663.00
E Weight of Pycnometer filled with water & soils 697.36
F Temperature of water in Item “E” 86.0*F Technicians Record values to 3 decimal places & Clerical Report values to 2 decimal places G Specific Gravity C/(C+D-E) 2.63
H Temperature Correction Factor 0.9974
I Corrected Specific Gravity (H*G) 2.62
Temperature (*C) Temperature (*F) Relative Density of Water Correction Factor 18 64.4 0.9986244 1.0004 19 66.2 0.9984347 1.0002 20 68.0 0.9982343 1.0000 21 69.8 0.9980233 0.9998 22 71.6 0.9978019 0.9996 23 73.4 0.9975702 0.9993 24 75.2 0.9973286 0.9991 25 77.0 0.9970770 0.9988 26 78.8 0.9968156 0.9986 27 80.6 0.9965451 0.9983 28 82.4 0.9962652 0.9980 29 84.2 0.9959761 0.9977 30 86.0 0.9956780 0.9974
Reviewed by:
Meghan Blodgett-Carrillo
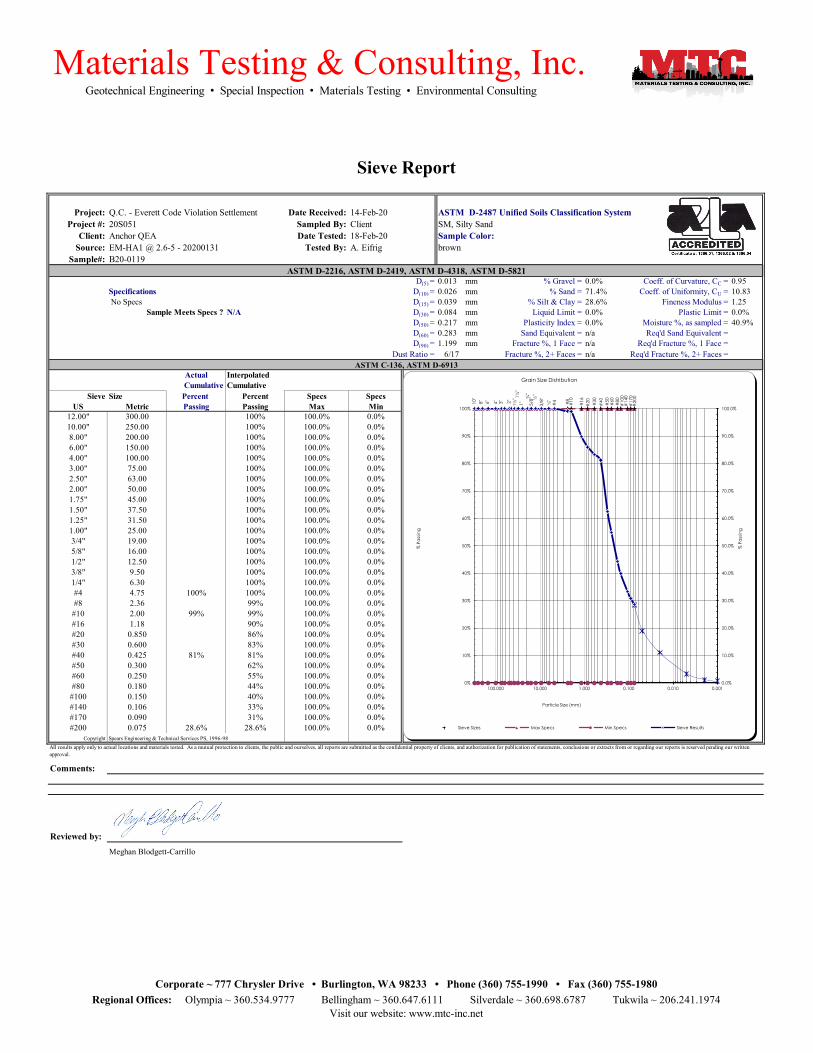
Project: Date Received: 14-Feb-20Project #: Sampled By: Client
Client: Date Tested: 18-Feb-20Source: Tested By: A. Eifrig
Sample#: B20-0119
D(5) = 0.013 mm % Gravel = 0.0% Coeff. of Curvature, CC = 0.95Specifications D(10) = 0.026 mm % Sand = 71.4% Coeff. of Uniformity, CU = 10.83 No Specs D(15) = 0.039 mm % Silt & Clay = 28.6% Fineness Modulus = 1.25
Sample Meets Specs ? N/A D(30) = 0.084 mm Liquid Limit = 0.0% Plastic Limit = 0.0%D(50) = 0.217 mm Plasticity Index = 0.0% Moisture %, as sampled = 40.9%D(60) = 0.283 mm Sand Equivalent = n/a Req'd Sand Equivalent =D(90) = 1.199 mm Fracture %, 1 Face = n/a Req'd Fracture %, 1 Face =
Dust Ratio = 6/17 Fracture %, 2+ Faces = n/a Req'd Fracture %, 2+ Faces =
Actual InterpolatedCumulative Cumulative
Sieve Size Percent Percent Specs SpecsUS Metric Passing Passing Max Min
12.00" 300.00 100% 100.0% 0.0%10.00" 250.00 100% 100.0% 0.0%8.00" 200.00 100% 100.0% 0.0%6.00" 150.00 100% 100.0% 0.0%4.00" 100.00 100% 100.0% 0.0%3.00" 75.00 100% 100.0% 0.0%2.50" 63.00 100% 100.0% 0.0%2.00" 50.00 100% 100.0% 0.0%1.75" 45.00 100% 100.0% 0.0%1.50" 37.50 100% 100.0% 0.0%1.25" 31.50 100% 100.0% 0.0%1.00" 25.00 100% 100.0% 0.0%3/4" 19.00 100% 100.0% 0.0%5/8" 16.00 100% 100.0% 0.0%1/2" 12.50 100% 100.0% 0.0%3/8" 9.50 100% 100.0% 0.0%1/4" 6.30 100% 100.0% 0.0%#4 4.75 100% 100% 100.0% 0.0%#8 2.36 99% 100.0% 0.0%
#10 2.00 99% 99% 100.0% 0.0%#16 1.18 90% 100.0% 0.0%#20 0.850 86% 100.0% 0.0%#30 0.600 83% 100.0% 0.0%#40 0.425 81% 81% 100.0% 0.0%#50 0.300 62% 100.0% 0.0%#60 0.250 55% 100.0% 0.0%#80 0.180 44% 100.0% 0.0%
#100 0.150 40% 100.0% 0.0%#140 0.106 33% 100.0% 0.0%#170 0.090 31% 100.0% 0.0%#200 0.075 28.6% 28.6% 100.0% 0.0%
Copyright Spears Engineering & Technical Services PS, 1996-98
Comments:
Reviewed by:Meghan Blodgett-Carrillo
EM-HA1 @ 2.6-5 - 20200131
ASTM D-2487 Unified Soils Classification System
ASTM D-2216, ASTM D-2419, ASTM D-4318, ASTM D-5821
SM, Silty Sand
brownSample Color:
Q.C. - Everett Code Violation Settlement
Materials Testing & Consulting, Inc.
Visit our website: www.mtc-inc.net
All results apply only to actual locations and materials tested. As a mutual protection to clients, the public and ourselves, all reports are submitted as the confidential property of clients, and authorization for publication of statements, conclusions or extracts from or regarding our reports is reserved pending our written approval.
Corporate ~ 777 Chrysler Drive • Burlington, WA 98233 • Phone (360) 755-1990 • Fax (360) 755-1980Regional Offices: Olympia ~ 360.534.9777 Bellingham ~ 360.647.6111 Silverdale ~ 360.698.6787 Tukwila ~ 206.241.1974
Geotechnical Engineering • Special Inspection • Materials Testing • Environmental Consulting
Sieve Report
ASTM C-136, ASTM D-6913
20S051Anchor QEA
8" 6" 4" 2"3" 1½" 1¼
"
10"
1"¾
"5/
8" ½"
3/8"
¼"
#4 #8
#10
#16
#20 #30
#40 #50
#60
#80
#10
0#
140
#17
0#
200
0%
10%
20%
30%
40%
50%
60%
70%
80%
90%
100%
0.0%
10.0%
20.0%
30.0%
40.0%
50.0%
60.0%
70.0%
80.0%
90.0%
100.0%
0.0010.0100.1001.00010.000100.000
% P
assin
g
% P
assin
g
Particle Size (mm)
Grain Size Distribution
Sieve Sizes Max Specs Min Specs Sieve Results

Project: Q.C. - Everett Code Violation Settlement Date Received: 14-Feb-20Project #: 20S051 Sampled By: Client
Client : Anchor QEA Date Tested: 18-Feb-20 Sample ColorSource: EM-HA1 @ 2.6-5 - 20200131 Tested By: A. Eifrig
Sample#: B20-0119
Sp Gr : 2.65Sample Weight: 100.46 grams
Hydroscopic Moist.: 4.08% Sieve PercentAdj. Sample Wgt : 96.52 grams Size Passing
3.0" 100% 75.000 mmHydrometer 2.0" 100% 50.000 mm
Reading Corrected Percent 1.5" 100% 37.500 mmMinutes Reading Passing 1.25" 100% 31.500 mm
2 13.5 13.9% 0.0364 mm 1.0" 100% 25.000 mm5 12 12.3% 0.0231 mm 3/4" 100% 19.000 mm
15 8.5 8.7% 0.0137 mm 5/8" 100% 16.000 mm30 7.5 7.7% 0.0097 mm 1/2" 100% 12.500 mm60 5.5 5.6% 0.0069 mm 3/8" 100% 9.500 mm
250 1.5 1.5% 0.0035 mm 1/4" 100% 6.300 mm1440 1 1.0% 0.0014 mm #4 100% 4.750 mm
#10 99% 2.000 mm% Gravel: 0.0% Liquid Limit: 0.0 % #20 86% 0.850 mm
% Sand: 71.4% Plastic Limit: 0.0 % #40 81% 0.425 mm% Silt: 25.3% Plasticity Index: 0.0 % #100 40% 0.150 mm
% Clay: 3.4% #200 28.6% 0.075 mmSilts 28.3% 0.074 mm
19.1% 0.050 mm11.1% 0.020 mm
Clays 3.4% 0.005 mm1.2% 0.002 mm
Colloids 0.7% 0.001 mm
Particle Size% Sand: 80.7% 2.0 - 0.05 mm
% Silt: 18.1% 0.05 - 0.002 mm% Clay: 1.2% < 0.002 mm
Loamy Sand
Comments:
Reviewed by:Meghan Blodgett-Carrillo
Materials Testing & Consulting, Inc. Geotechnical Engineering • Special Inspection • Materials Testing • Environmental Consulting
USDA Soil Textural Classification
Hydrometer Report
SM, Silty Sand
Diameter
brown
Soils ParticleDiameter
ASTM D 2487 Soils Classification
Visit our website: www.mtc-inc.net
Corporate ~ 777 Chrysler Drive • Burlington, WA 98233 • Phone (360) 755-1990 • Fax (360) 755-1980Regional Offices: Olympia ~ 360.534.9777 Bellingham ~ 360.647.6111 Silverdale ~ 360.698.6787 Tukwila ~ 206.241.1974
All results apply only to actual locations and materials tested. As a mutual protection to clients, the public and ourselves, all reports are submitted as the confidential property of clients, and authorization for publication of statements, conclusions or extracts from or regarding our reports is reserved pending our written approval.
USDA Soil Textural Classification
ASTM C-136
Soils Particle
ASTM D-422, HYDROMETER ANALYSISSieve Analysis
Grain Size Distribution
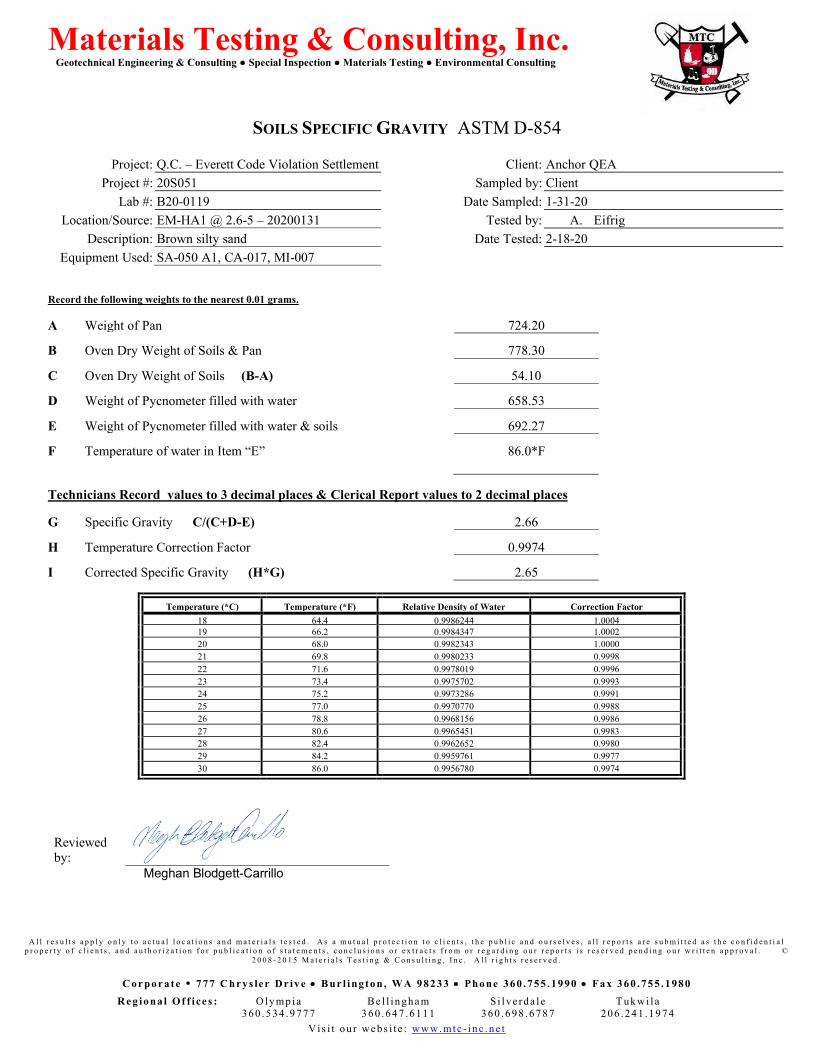
Materials Testing & Consulting, Inc. Geotechnical Engineering & Consulting ● Special Inspection ● Materials Testing ● Environmental Consulting
A l l r e s u l t s a p p l y o n l y t o a c t u a l l o c a t i o n s a n d m a t e r i a l s t e s t e d . A s a m u t u a l p r o t e c t i o n t o c l i e n t s , t h e p u b l i c a n d o u r s e l v e s , a l l r e p o r t s a r e s u b m i t t e d a s t h e c o n f i d e n t i a l p r o p e r t y o f c l i e n t s , a n d a u t h o r i z a t i o n f o r p u b l i c a t i o n o f s t a t e m e n t s , c o n c l u s i o n s o r e x t r a c t s f r o m o r r e g a r d i n g o u r r e p o r t s i s r e s e r v e d p e n d i n g o u r w r i t t e n a p p r o v a l . ©
2 0 0 8 - 2 0 1 5 M a t e r i a l s T e s t i n g & C o n s u l t i n g , I n c . A l l r i g h t s r e s e r v e d .
C or por a te 777 C hr ys le r D r ive • B ur l ing ton , WA 98233 • Phone 360 .755 .1990 • Fax 360 .755 .1980 R e g iona l Of f i ce s : O lympia B e l l i ngha m S i lve rda l e T ukw i l a
360 .534 .9777 360 .647 .6111 360 .698 .6787 206 .241 .1974 V i s i t ou r w e bs i t e : w w w .mtc - inc .ne t
SOILS SPECIFIC GRAVITY ASTM D-854
Project: Q.C. – Everett Code Violation Settlement Client: Anchor QEA Project #: 20S051 Sampled by: Client
Lab #: B20-0119 Date Sampled: 1-31-20 Location/Source: EM-HA1 @ 2.6-5 – 20200131 Tested by: A. Eifrig
Description: Brown silty sand Date Tested: 2-18-20 Equipment Used: SA-050 A1, CA-017, MI-007
Record the following weights to the nearest 0.01 grams.
A Weight of Pan 724.20
B Oven Dry Weight of Soils & Pan 778.30
C Oven Dry Weight of Soils (B-A) 54.10
D Weight of Pycnometer filled with water 658.53
E Weight of Pycnometer filled with water & soils 692.27
F Temperature of water in Item “E” 86.0*F
Technicians Record values to 3 decimal places & Clerical Report values to 2 decimal places
G Specific Gravity C/(C+D-E) 2.66
H Temperature Correction Factor 0.9974
I Corrected Specific Gravity (H*G) 2.65
Temperature (*C) Temperature (*F) Relative Density of Water Correction Factor 18 64.4 0.9986244 1.0004 19 66.2 0.9984347 1.0002 20 68.0 0.9982343 1.0000 21 69.8 0.9980233 0.9998 22 71.6 0.9978019 0.9996 23 73.4 0.9975702 0.9993 24 75.2 0.9973286 0.9991 25 77.0 0.9970770 0.9988 26 78.8 0.9968156 0.9986 27 80.6 0.9965451 0.9983 28 82.4 0.9962652 0.9980 29 84.2 0.9959761 0.9977 30 86.0 0.9956780 0.9974
Reviewed by:
Meghan Blodgett-Carrillo
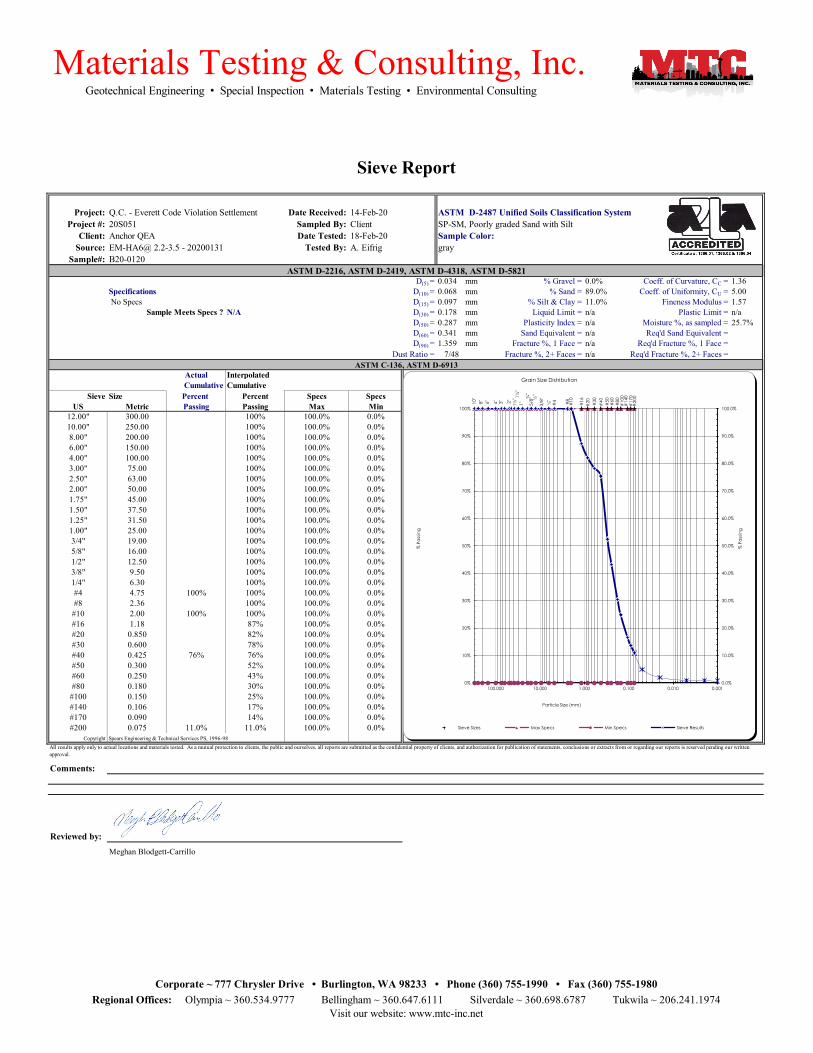
Project: Date Received: 14-Feb-20Project #: Sampled By: Client
Client: Date Tested: 18-Feb-20Source: Tested By: A. Eifrig
Sample#: B20-0120
D(5) = 0.034 mm % Gravel = 0.0% Coeff. of Curvature, CC = 1.36Specifications D(10) = 0.068 mm % Sand = 89.0% Coeff. of Uniformity, CU = 5.00 No Specs D(15) = 0.097 mm % Silt & Clay = 11.0% Fineness Modulus = 1.57
Sample Meets Specs ? N/A D(30) = 0.178 mm Liquid Limit = n/a Plastic Limit = n/aD(50) = 0.287 mm Plasticity Index = n/a Moisture %, as sampled = 25.7%D(60) = 0.341 mm Sand Equivalent = n/a Req'd Sand Equivalent =D(90) = 1.359 mm Fracture %, 1 Face = n/a Req'd Fracture %, 1 Face =
Dust Ratio = 7/48 Fracture %, 2+ Faces = n/a Req'd Fracture %, 2+ Faces =
Actual InterpolatedCumulative Cumulative
Sieve Size Percent Percent Specs SpecsUS Metric Passing Passing Max Min
12.00" 300.00 100% 100.0% 0.0%10.00" 250.00 100% 100.0% 0.0%8.00" 200.00 100% 100.0% 0.0%6.00" 150.00 100% 100.0% 0.0%4.00" 100.00 100% 100.0% 0.0%3.00" 75.00 100% 100.0% 0.0%2.50" 63.00 100% 100.0% 0.0%2.00" 50.00 100% 100.0% 0.0%1.75" 45.00 100% 100.0% 0.0%1.50" 37.50 100% 100.0% 0.0%1.25" 31.50 100% 100.0% 0.0%1.00" 25.00 100% 100.0% 0.0%3/4" 19.00 100% 100.0% 0.0%5/8" 16.00 100% 100.0% 0.0%1/2" 12.50 100% 100.0% 0.0%3/8" 9.50 100% 100.0% 0.0%1/4" 6.30 100% 100.0% 0.0%#4 4.75 100% 100% 100.0% 0.0%#8 2.36 100% 100.0% 0.0%
#10 2.00 100% 100% 100.0% 0.0%#16 1.18 87% 100.0% 0.0%#20 0.850 82% 100.0% 0.0%#30 0.600 78% 100.0% 0.0%#40 0.425 76% 76% 100.0% 0.0%#50 0.300 52% 100.0% 0.0%#60 0.250 43% 100.0% 0.0%#80 0.180 30% 100.0% 0.0%
#100 0.150 25% 100.0% 0.0%#140 0.106 17% 100.0% 0.0%#170 0.090 14% 100.0% 0.0%#200 0.075 11.0% 11.0% 100.0% 0.0%
Copyright Spears Engineering & Technical Services PS, 1996-98
Comments:
Reviewed by:Meghan Blodgett-Carrillo
Materials Testing & Consulting, Inc.
Visit our website: www.mtc-inc.net
All results apply only to actual locations and materials tested. As a mutual protection to clients, the public and ourselves, all reports are submitted as the confidential property of clients, and authorization for publication of statements, conclusions or extracts from or regarding our reports is reserved pending our written approval.
Corporate ~ 777 Chrysler Drive • Burlington, WA 98233 • Phone (360) 755-1990 • Fax (360) 755-1980Regional Offices: Olympia ~ 360.534.9777 Bellingham ~ 360.647.6111 Silverdale ~ 360.698.6787 Tukwila ~ 206.241.1974
Geotechnical Engineering • Special Inspection • Materials Testing • Environmental Consulting
Sieve Report
ASTM C-136, ASTM D-6913
ASTM D-2487 Unified Soils Classification System
ASTM D-2216, ASTM D-2419, ASTM D-4318, ASTM D-5821
SP-SM, Poorly graded Sand with Silt
graySample Color:
Q.C. - Everett Code Violation Settlement 20S051Anchor QEAEM-HA6@ 2.2-3.5 - 20200131
8" 6" 4" 2"3" 1½" 1¼
"
10"
1"¾
"5/
8" ½"
3/8"
¼"
#4 #8
#10
#16
#20 #30
#40 #50
#60
#80
#10
0#
140
#17
0#
200
0%
10%
20%
30%
40%
50%
60%
70%
80%
90%
100%
0.0%
10.0%
20.0%
30.0%
40.0%
50.0%
60.0%
70.0%
80.0%
90.0%
100.0%
0.0010.0100.1001.00010.000100.000
% P
assin
g
% P
assin
g
Particle Size (mm)
Grain Size Distribution
Sieve Sizes Max Specs Min Specs Sieve Results

Date Received: 14-Feb-20Sampled By: ClientDate Tested: 18-Feb-20 Sample Color
Tested By: A. Eifrig
Project: Q.C. - Everett Code Violation Settlement Project #: 20S051
Client : Anchor QEASource: EM-HA6 @ 2.2-3.5 - 20200131 Sample#: B20-0120
Sp Gr : 2.70Sample Weight: 100.57 grams
Hydroscopic Moist.: 0.34% Sieve PercentAdj. Sample Wgt : 100.23 grams Size Passing
3.0" 100% 75.000 mmHydrometer 2.0" 100% 50.000 mm
Reading Corrected Percent 1.5" 100% 37.500 mmMinutes Reading Passing 1.25" 100% 31.500 mm
2 2 2.0% 0.0380 mm 1.0" 100% 25.000 mm5 2 2.0% 0.0240 mm 3/4" 100% 19.000 mm
15 2 2.0% 0.0139 mm 5/8" 100% 16.000 mm30 1 1.0% 0.0098 mm 1/2" 100% 12.500 mm60 1 1.0% 0.0070 mm 3/8" 100% 9.500 mm
250 1 1.0% 0.0034 mm 1/4" 100% 6.300 mm1440 1 1.0% 0.0014 mm #4 100% 4.750 mm
#10 100% 2.000 mm% Gravel: 0.0% Liquid Limit: n/a #20 82% 0.850 mm
% Sand: 89.0% Plastic Limit: n/a #40 76% 0.425 mm% Silt: 10.0% Plasticity Index: n/a #100 25% 0.150 mm
% Clay: 1.0% #200 11.0% 0.075 mmSilts 10.8% 0.074 mm
4.9% 0.050 mm2.0% 0.020 mm
Clays 1.0% 0.005 mm1.0% 0.002 mm
Colloids 0.7% 0.001 mm
Particle Size% Sand: 95.1% 2.0 - 0.05 mm
% Silt: 3.9% 0.05 - 0.002 mm% Clay: 1.0% < 0.002 mm
Sand
Comments:
Reviewed by:Meghan Blodgett-Carrillo
All results apply only to actual locations and materials tested. As a mutual protection to clients, the public and ourselves, all reports are submitted as the confidential property of clients, and authorization for publication of statements, conclusions or extracts from or regarding our reports is reserved pending our written approval.
USDA Soil Textural Classification
ASTM C-136
Soils Particle
ASTM D-422, HYDROMETER ANALYSISSieve Analysis
Grain Size Distribution
Visit our website: www.mtc-inc.net
Corporate ~ 777 Chrysler Drive • Burlington, WA 98233 • Phone (360) 755-1990 • Fax (360) 755-1980Regional Offices: Olympia ~ 360.534.9777 Bellingham ~ 360.647.6111 Silverdale ~ 360.698.6787 Tukwila ~ 206.241.1974
Materials Testing & Consulting, Inc. Geotechnical Engineering • Special Inspection • Materials Testing • Environmental Consulting
USDA Soil Textural Classification
Hydrometer Report
SP-SM, Poorly graded Sand with Silt
Diameter
gray
Soils ParticleDiameter
ASTM D 2487 Soils Classification

Materials Testing & Consulting, Inc. Geotechnical Engineering & Consulting ● Special Inspection ● Materials Testing ● Environmental Consulting
A l l r e s u l t s a p p l y o n l y t o a c t u a l l o c a t i o n s a n d m a t e r i a l s t e s t e d . A s a m u t u a l p r o t e c t i o n t o c l i e n t s , t h e p u b l i c a n d o u r s e l v e s , a l l r e p o r t s a r e s u b m i t t e d a s t h e c o n f i d e n t i a l p r o p e r t y o f c l i e n t s , a n d a u t h o r i z a t i o n f o r p u b l i c a t i o n o f s t a t e m e n t s , c o n c l u s i o n s o r e x t r a c t s f r o m o r r e g a r d i n g o u r r e p o r t s i s r e s e r v e d p e n d i n g o u r w r i t t e n a p p r o v a l . ©
2 0 0 8 - 2 0 1 5 M a t e r i a l s T e s t i n g & C o n s u l t i n g , I n c . A l l r i g h t s r e s e r v e d .
C or por a te 777 C hr ys le r D r ive • B ur l ing ton , WA 98233 • Phone 360 .755 .1990 • Fax 360 .755 .1980 R e g iona l Of f i ce s : O lympia B e l l i ngha m S i lve rda l e T ukw i l a
360 .534 .9777 360 .647 .6111 360 .698 .6787 206 .241 .1974 V i s i t ou r w e bs i t e : w w w .mtc - inc .ne t
SOILS SPECIFIC GRAVITY ASTM D-854
Project: Q.C. – Everett Code Violation Settlement Client: Anchor QEA Project #: 20S051 Sampled by: Client
Lab #: B20-0120 Date Sampled: 1-31-20 Location/Source: EM-HA6 @ 2.2-3.5 – 20200131 Tested by: A. Eifrig
Description: gray silty sand Date Tested: 2-18-20 Equipment Used: SA-050 A1, CA-017, MI-007
Record the following weights to the nearest 0.01 grams.
A Weight of Pan 645.00
B Oven Dry Weight of Soils & Pan 710.20
C Oven Dry Weight of Soils (B-A) 65.20
D Weight of Pycnometer filled with water 658.48
E Weight of Pycnometer filled with water & soils 699.62
F Temperature of water in Item “E” 86.0*F
Technicians Record values to 3 decimal places & Clerical Report values to 2 decimal places
G Specific Gravity C/(C+D-E) 2.71
H Temperature Correction Factor 0.9974
I Corrected Specific Gravity (H*G) 2.70
Temperature (*C) Temperature (*F) Relative Density of Water Correction Factor 18 64.4 0.9986244 1.0004 19 66.2 0.9984347 1.0002 20 68.0 0.9982343 1.0000 21 69.8 0.9980233 0.9998 22 71.6 0.9978019 0.9996 23 73.4 0.9975702 0.9993 24 75.2 0.9973286 0.9991 25 77.0 0.9970770 0.9988 26 78.8 0.9968156 0.9986 27 80.6 0.9965451 0.9983 28 82.4 0.9962652 0.9980 29 84.2 0.9959761 0.9977 30 86.0 0.9956780 0.9974
Reviewed by:
Meghan Blodgett-Carrillo
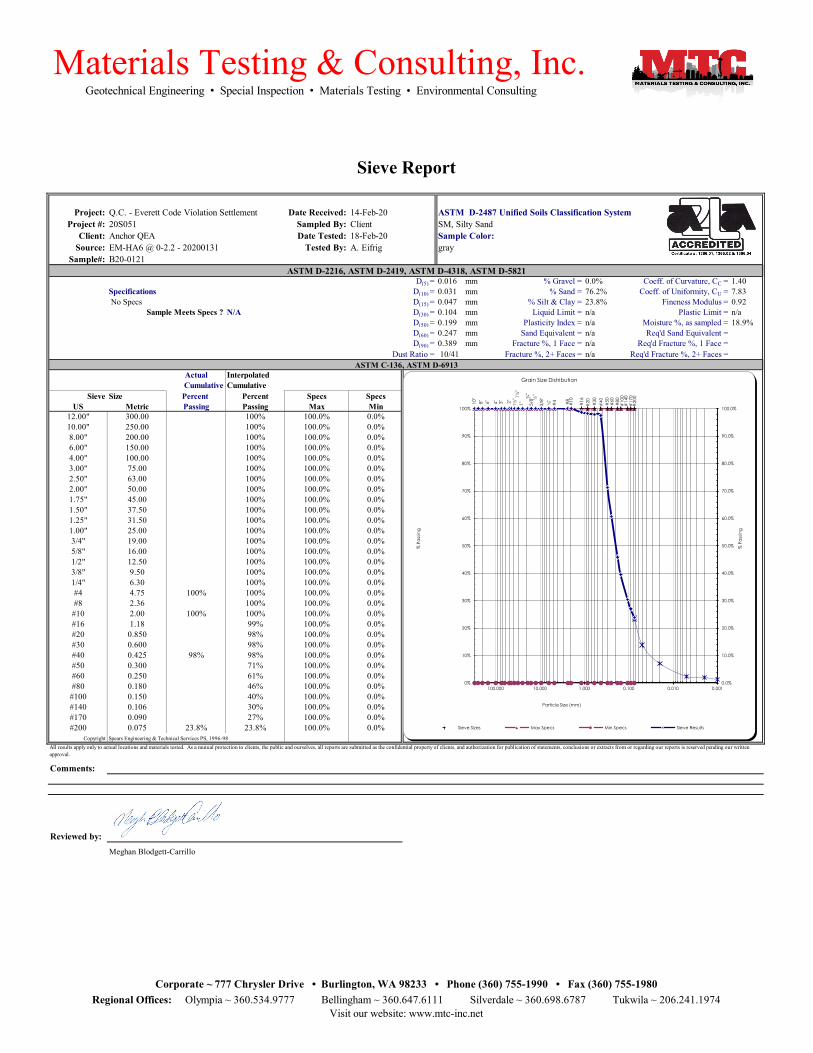
Project: Date Received: 14-Feb-20Project #: Sampled By: Client
Client: Date Tested: 18-Feb-20Source: Tested By: A. Eifrig
Sample#: B20-0121
D(5) = 0.016 mm % Gravel = 0.0% Coeff. of Curvature, CC = 1.40Specifications D(10) = 0.031 mm % Sand = 76.2% Coeff. of Uniformity, CU = 7.83 No Specs D(15) = 0.047 mm % Silt & Clay = 23.8% Fineness Modulus = 0.92
Sample Meets Specs ? N/A D(30) = 0.104 mm Liquid Limit = n/a Plastic Limit = n/aD(50) = 0.199 mm Plasticity Index = n/a Moisture %, as sampled = 18.9%D(60) = 0.247 mm Sand Equivalent = n/a Req'd Sand Equivalent =D(90) = 0.389 mm Fracture %, 1 Face = n/a Req'd Fracture %, 1 Face =
Dust Ratio = 10/41 Fracture %, 2+ Faces = n/a Req'd Fracture %, 2+ Faces =
Actual InterpolatedCumulative Cumulative
Sieve Size Percent Percent Specs SpecsUS Metric Passing Passing Max Min
12.00" 300.00 100% 100.0% 0.0%10.00" 250.00 100% 100.0% 0.0%8.00" 200.00 100% 100.0% 0.0%6.00" 150.00 100% 100.0% 0.0%4.00" 100.00 100% 100.0% 0.0%3.00" 75.00 100% 100.0% 0.0%2.50" 63.00 100% 100.0% 0.0%2.00" 50.00 100% 100.0% 0.0%1.75" 45.00 100% 100.0% 0.0%1.50" 37.50 100% 100.0% 0.0%1.25" 31.50 100% 100.0% 0.0%1.00" 25.00 100% 100.0% 0.0%3/4" 19.00 100% 100.0% 0.0%5/8" 16.00 100% 100.0% 0.0%1/2" 12.50 100% 100.0% 0.0%3/8" 9.50 100% 100.0% 0.0%1/4" 6.30 100% 100.0% 0.0%#4 4.75 100% 100% 100.0% 0.0%#8 2.36 100% 100.0% 0.0%
#10 2.00 100% 100% 100.0% 0.0%#16 1.18 99% 100.0% 0.0%#20 0.850 98% 100.0% 0.0%#30 0.600 98% 100.0% 0.0%#40 0.425 98% 98% 100.0% 0.0%#50 0.300 71% 100.0% 0.0%#60 0.250 61% 100.0% 0.0%#80 0.180 46% 100.0% 0.0%
#100 0.150 40% 100.0% 0.0%#140 0.106 30% 100.0% 0.0%#170 0.090 27% 100.0% 0.0%#200 0.075 23.8% 23.8% 100.0% 0.0%
Copyright Spears Engineering & Technical Services PS, 1996-98
Comments:
Reviewed by:Meghan Blodgett-Carrillo
ASTM D-2487 Unified Soils Classification System
ASTM D-2216, ASTM D-2419, ASTM D-4318, ASTM D-5821
SM, Silty Sand
graySample Color:
Materials Testing & Consulting, Inc.
Visit our website: www.mtc-inc.net
All results apply only to actual locations and materials tested. As a mutual protection to clients, the public and ourselves, all reports are submitted as the confidential property of clients, and authorization for publication of statements, conclusions or extracts from or regarding our reports is reserved pending our written approval.
Corporate ~ 777 Chrysler Drive • Burlington, WA 98233 • Phone (360) 755-1990 • Fax (360) 755-1980Regional Offices: Olympia ~ 360.534.9777 Bellingham ~ 360.647.6111 Silverdale ~ 360.698.6787 Tukwila ~ 206.241.1974
Geotechnical Engineering • Special Inspection • Materials Testing • Environmental Consulting
Sieve Report
ASTM C-136, ASTM D-6913
Q.C. - Everett Code Violation Settlement 20S051Anchor QEAEM-HA6 @ 0-2.2 - 20200131
8" 6" 4" 2"3" 1½" 1¼
"
10"
1"¾
"5/
8" ½"
3/8"
¼"
#4 #8
#10
#16
#20 #30
#40 #50
#60
#80
#10
0#
140
#17
0#
200
0%
10%
20%
30%
40%
50%
60%
70%
80%
90%
100%
0.0%
10.0%
20.0%
30.0%
40.0%
50.0%
60.0%
70.0%
80.0%
90.0%
100.0%
0.0010.0100.1001.00010.000100.000
% P
assin
g
% P
assin
g
Particle Size (mm)
Grain Size Distribution
Sieve Sizes Max Specs Min Specs Sieve Results
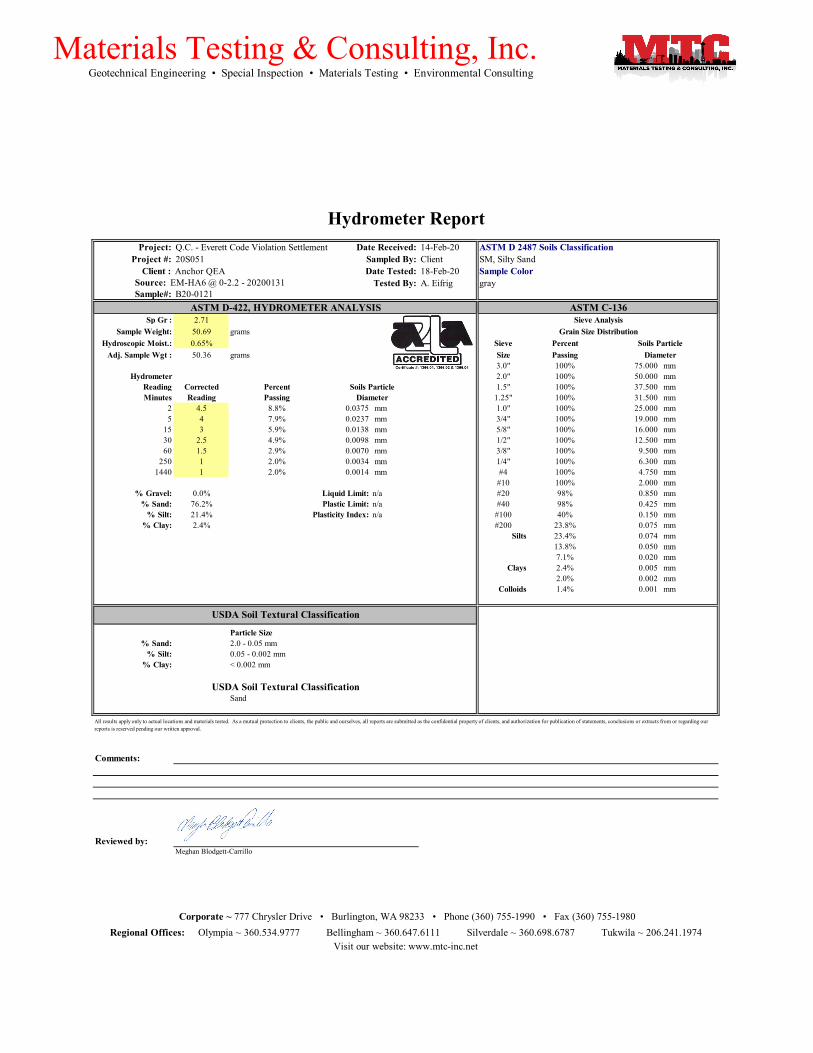
Project: Q.C. - Everett Code Violation Settlement Date Received: 14-Feb-20Project #: 20S051 Sampled By: Client
Date Tested: 18-Feb-20 Sample ColorTested By: A. Eifrig
Client : Anchor QEASource: EM-HA6 @ 0-2.2 - 20200131 Sample#: B20-0121
Sp Gr : 2.71Sample Weight: 50.69 grams
Hydroscopic Moist.: 0.65% Sieve PercentAdj. Sample Wgt : 50.36 grams Size Passing
3.0" 100% 75.000 mmHydrometer 2.0" 100% 50.000 mm
Reading Corrected Percent 1.5" 100% 37.500 mmMinutes Reading Passing 1.25" 100% 31.500 mm
2 4.5 8.8% 0.0375 mm 1.0" 100% 25.000 mm5 4 7.9% 0.0237 mm 3/4" 100% 19.000 mm
15 3 5.9% 0.0138 mm 5/8" 100% 16.000 mm30 2.5 4.9% 0.0098 mm 1/2" 100% 12.500 mm60 1.5 2.9% 0.0070 mm 3/8" 100% 9.500 mm
250 1 2.0% 0.0034 mm 1/4" 100% 6.300 mm1440 1 2.0% 0.0014 mm #4 100% 4.750 mm
#10 100% 2.000 mm% Gravel: 0.0% Liquid Limit: n/a #20 98% 0.850 mm
% Sand: 76.2% Plastic Limit: n/a #40 98% 0.425 mm% Silt: 21.4% Plasticity Index: n/a #100 40% 0.150 mm
% Clay: 2.4% #200 23.8% 0.075 mmSilts 23.4% 0.074 mm
13.8% 0.050 mm7.1% 0.020 mm
Clays 2.4% 0.005 mm2.0% 0.002 mm
Colloids 1.4% 0.001 mm
Particle Size% Sand: 86.2% 2.0 - 0.05 mm
% Silt: 11.9% 0.05 - 0.002 mm% Clay: 2.0% < 0.002 mm
Sand
Comments:
Reviewed by:Meghan Blodgett-Carrillo
Materials Testing & Consulting, Inc. Geotechnical Engineering • Special Inspection • Materials Testing • Environmental Consulting
USDA Soil Textural Classification
Hydrometer Report
SM, Silty Sand
Diameter
gray
Soils ParticleDiameter
ASTM D 2487 Soils Classification
Visit our website: www.mtc-inc.net
Corporate ~ 777 Chrysler Drive • Burlington, WA 98233 • Phone (360) 755-1990 • Fax (360) 755-1980Regional Offices: Olympia ~ 360.534.9777 Bellingham ~ 360.647.6111 Silverdale ~ 360.698.6787 Tukwila ~ 206.241.1974
All results apply only to actual locations and materials tested. As a mutual protection to clients, the public and ourselves, all reports are submitted as the confidential property of clients, and authorization for publication of statements, conclusions or extracts from or regarding our reports is reserved pending our written approval.
USDA Soil Textural Classification
ASTM C-136
Soils Particle
ASTM D-422, HYDROMETER ANALYSISSieve Analysis
Grain Size Distribution

Project:Project #:
Client: Sample ColorSource:
Sample #:
#1 #2 #3 #4 #5 #6
Weight of Wet Soils + Pan:
Weight of Dry Soils + Pan: non-plastic
Weight of Pan:Weight of Dry Soils: Liquid Limit @ 25 Blows: N/AWeight of Moisture: Plastic Limit: N/A
% Moisture: Plasticity Index, IP: N/ANumber of Blows:
#1 #2 #3 #4 #5 #6Weight of Wet Soils + Pan:Weight of Dry Soils + Pan: non-plastic
Weight of Pan:Weight of Dry Soils:Weight of Moisture:
% Moisture:
Copyright Spears Engineering & Technical Services PS, 1996-98
Comments:
Reviewed by:Meghan Blodgett-Carrillo
Sampled By:Date Tested:
Tested By:
Plastic Limit Determination
All results apply only to actual locations and materials tested. As a mutual protection to clients, the public and ourselves, all reports are submitted as the confidential property of clients, and authorization for publication of statements, conclusions or extracts from or regarding our reports is reserved pending our written approval.
SM, Silty Sand
gray
Visit our website: www.mtc-inc.net
Corporate ~ 777 Chrysler Drive • Burlington, WA 98233 • Phone (360) 755-1990 • Fax (360) 755-1980
Liquid Limit Determination
dilation. Non-plastic Plastic limit cannot be determined as the material does not roll down to 1/8" threads. Liquid limit cannot be established as the material shows rapid
Geotechnical Engineering • Special Inspections • Materials Testing • Environmental ConsultingMaterials Testing & Consulting, Inc.
Regional Offices: Olympia ~ 360.534.9777 Bellingham ~ 360.647.6111 Silverdale ~ 360.698.6787 Tukwila ~ 206.241.1974
18-Feb-20A. Eifrig
14-Feb-20Client
ASTM D4318 - Liquid Limit, Plastic Limit and Plasticity Index of Soils
ASTM D 2487 Unified Soils ClassificationDate Received:Q.C. - Everett Code Violation Settlement 20S051Anchor QEAEM-HA6 @ 0-2.2 - 20200131B20-0121
0%
10%
20%
30%
40%
50%
60%
70%
80%
90%
100%
10 100
% M
oist
ure
Number of Blows, "N"
Liquid Limit
0.0 %
10.0 %
20.0 %
30.0 %
40.0 %
50.0 %
60.0 %
70.0 %
0% 10% 20% 30% 40% 50% 60% 70% 80% 90% 100% 110%
Plas
ticity
Inde
x
Liquid Limit
Plasticity Chart
MH or OH
ML or OLCL-ML

Materials Testing & Consulting, Inc. Geotechnical Engineering & Consulting ● Special Inspection ● Materials Testing ● Environmental Consulting
A l l r e s u l t s a p p l y o n l y t o a c t u a l l o c a t i o n s a n d m a t e r i a l s t e s t e d . A s a m u t u a l p r o t e c t i o n t o c l i e n t s , t h e p u b l i c a n d o u r s e l v e s , a l l r e p o r t s a r e s u b m i t t e d a s t h e c o n f i d e n t i a l p r o p e r t y o f c l i e n t s , a n d a u t h o r i z a t i o n f o r p u b l i c a t i o n o f s t a t e m e n t s , c o n c l u s i o n s o r e x t r a c t s f r o m o r r e g a r d i n g o u r r e p o r t s i s r e s e r v e d p e n d i n g o u r w r i t t e n a p p r o v a l . ©
2 0 0 8 - 2 0 1 5 M a t e r i a l s T e s t i n g & C o n s u l t i n g , I n c . A l l r i g h t s r e s e r v e d .
C or por a te 777 C hr ys le r D r ive • B ur l ing ton , WA 98233 • Phone 360 .755 .1990 • Fax 360 .755 .1980 R e g iona l Of f i ce s : O lympia B e l l i ngha m S i lve rda l e T ukw i l a
360 .534 .9777 360 .647 .6111 360 .698 .6787 206 .241 .1974 V i s i t ou r w e bs i t e : w w w .mtc - inc .ne t
SOILS SPECIFIC GRAVITY ASTM D-854
Project: Q.C. – Everett Code Violation Settlement Client: Anchor QEA Project #: 20S051 Sampled by: Client
Lab #: B20-0121 Date Sampled: 1-31-20 Location/Source: EM-HA6 @ 0-2.2 – 20200131 Tested by: A. Eifrig
Description: gray sandy silt Date Tested: 2-18-20 Equipment Used: SA-050 A1, CA-017, MI-007
Record the following weights to the nearest 0.01 grams.
A Weight of Pan 688.22
B Oven Dry Weight of Soils & Pan 738.50
C Oven Dry Weight of Soils (B-A) 50.28
D Weight of Pycnometer filled with water 658.19
E Weight of Pycnometer filled with water & soils 689.96
F Temperature of water in Item “E” 86.0*F
Technicians Record values to 3 decimal places & Clerical Report values to 2 decimal places
G Specific Gravity C/(C+D-E) 2.72
H Temperature Correction Factor 0.9974
I Corrected Specific Gravity (H*G) 2.71
Temperature (*C) Temperature (*F) Relative Density of Water Correction Factor 18 64.4 0.9986244 1.0004 19 66.2 0.9984347 1.0002 20 68.0 0.9982343 1.0000 21 69.8 0.9980233 0.9998 22 71.6 0.9978019 0.9996 23 73.4 0.9975702 0.9993 24 75.2 0.9973286 0.9991 25 77.0 0.9970770 0.9988 26 78.8 0.9968156 0.9986 27 80.6 0.9965451 0.9983 28 82.4 0.9962652 0.9980 29 84.2 0.9959761 0.9977 30 86.0 0.9956780 0.9974
Reviewed by:
Meghan Blodgett-Carrillo

Materials Testing & Consulting, Inc. Geotechnical Engineering & Consulting ● Special Inspection ● Materials Testing ● Environmental Consulting
A l l r e s u l t s a p p l y o n l y t o a c t u a l l o c a t i o n s a n d m a t e r i a l s t e s t e d . A s a m u t u a l p r o t e c t i o n t o c l i e n t s , t h e p u b l i c a n d o u r s e l v e s , a l l r e p o r t s a r e s u b m i t t e d a s t h e c o n f i d e n t i a l p r o p e r t y o f c l i e n t s , a n d a u t h o r i z a t i o n f o r p u b l i c a t i o n o f s t a t e m e n t s , c o n c l u s i o n s o r e x t r a c t s f r o m o r r e g a r d i n g o u r r e p o r t s i s r e s e r v e d p e n d i n g o u r w r i t t e n a p p r o v a l . ©
2 0 0 8 - 2 0 1 5 M a t e r i a l s T e s t i n g & C o n s u l t i n g , I n c . A l l r i g h t s r e s e r v e d .
C or por a te 777 C hr ys le r D r ive • B ur l ing ton , WA 98233 • Phone 360 .755 .1990 • Fax 360 .755 .1980 R e g iona l Of f i ce s : O lympia B e l l i ngha m S i lve rda l e T ukw i l a
360 .534 .9777 360 .647 .6111 360 .698 .6787 206 .241 .1974 V i s i t ou r w e bs i t e : w w w .mtc - inc .ne t
SOILS SPECIFIC GRAVITY ASTM D-854
Project: Q.C. – Everett Code Violation Settlement Client: Anchor QEA Project #: 20S051 Sampled by: Client
Lab #: B20-0122 Date Sampled: 1-31-20 Location/Source: EM-HA6 @ 3.5-5.8 – 20200131 Tested by: A. Eifrig
Description: Gray-brown silty sand Date Tested: 2-18-20 Equipment Used: SA-050 A2, CA-017, MI-007
Record the following weights to the nearest 0.01 grams.
A Weight of Pan 764.65
B Oven Dry Weight of Soils & Pan 818.5
C Oven Dry Weight of Soils (B-A) 53.85
D Weight of Pycnometer filled with water 663.23
E Weight of Pycnometer filled with water & soils 697.08
F Temperature of water in Item “E” 86.0*F
Technicians Record values to 3 decimal places & Clerical Report values to 2 decimal places
G Specific Gravity C/(C+D-E) 2.69
H Temperature Correction Factor 0.9974
I Corrected Specific Gravity (H*G) 2.68
Temperature (*C) Temperature (*F) Relative Density of Water Correction Factor 18 64.4 0.9986244 1.0004 19 66.2 0.9984347 1.0002 20 68.0 0.9982343 1.0000 21 69.8 0.9980233 0.9998 22 71.6 0.9978019 0.9996 23 73.4 0.9975702 0.9993 24 75.2 0.9973286 0.9991 25 77.0 0.9970770 0.9988 26 78.8 0.9968156 0.9986 27 80.6 0.9965451 0.9983 28 82.4 0.9962652 0.9980 29 84.2 0.9959761 0.9977 30 86.0 0.9956780 0.9974
Reviewed by:
Meghan Blodgett-Carrillo
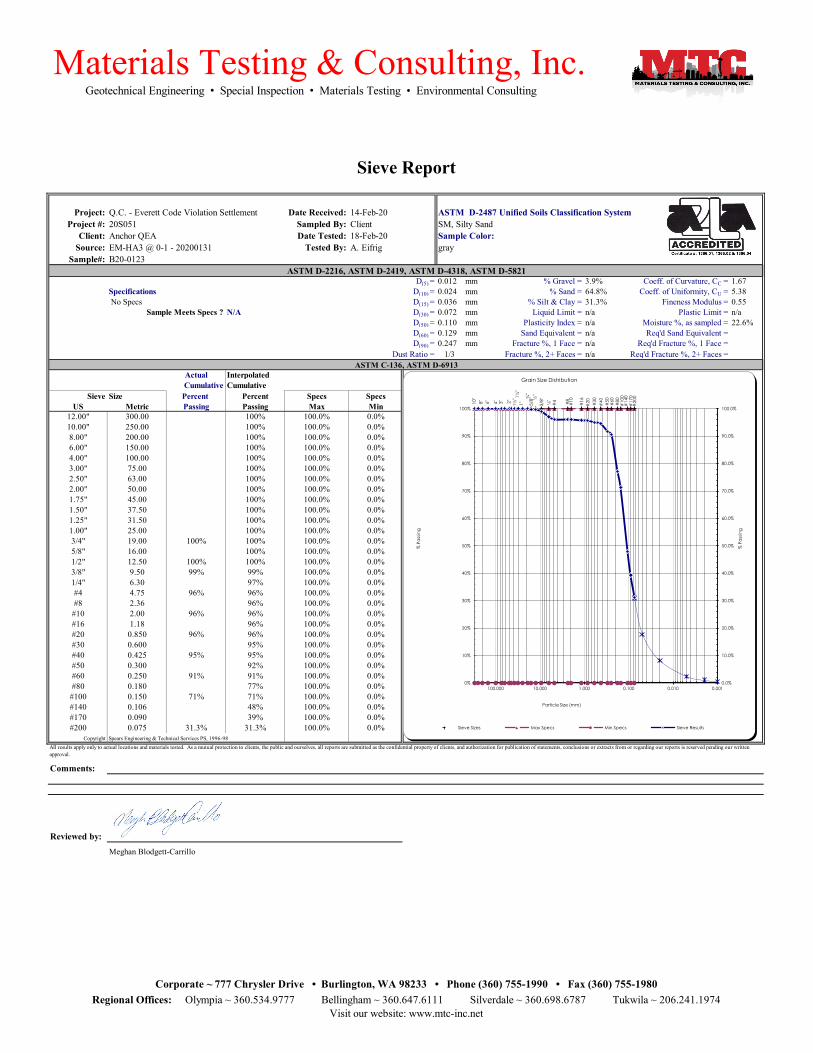
Project: Date Received: 14-Feb-20Project #: Sampled By: Client
Client: Date Tested: 18-Feb-20Source: Tested By: A. Eifrig
Sample#: B20-0123
D(5) = 0.012 mm % Gravel = 3.9% Coeff. of Curvature, CC = 1.67Specifications D(10) = 0.024 mm % Sand = 64.8% Coeff. of Uniformity, CU = 5.38 No Specs D(15) = 0.036 mm % Silt & Clay = 31.3% Fineness Modulus = 0.55
Sample Meets Specs ? N/A D(30) = 0.072 mm Liquid Limit = n/a Plastic Limit = n/aD(50) = 0.110 mm Plasticity Index = n/a Moisture %, as sampled = 22.6%D(60) = 0.129 mm Sand Equivalent = n/a Req'd Sand Equivalent =D(90) = 0.247 mm Fracture %, 1 Face = n/a Req'd Fracture %, 1 Face =
Dust Ratio = 1/3 Fracture %, 2+ Faces = n/a Req'd Fracture %, 2+ Faces =
Actual InterpolatedCumulative Cumulative
Sieve Size Percent Percent Specs SpecsUS Metric Passing Passing Max Min
12.00" 300.00 100% 100.0% 0.0%10.00" 250.00 100% 100.0% 0.0%8.00" 200.00 100% 100.0% 0.0%6.00" 150.00 100% 100.0% 0.0%4.00" 100.00 100% 100.0% 0.0%3.00" 75.00 100% 100.0% 0.0%2.50" 63.00 100% 100.0% 0.0%2.00" 50.00 100% 100.0% 0.0%1.75" 45.00 100% 100.0% 0.0%1.50" 37.50 100% 100.0% 0.0%1.25" 31.50 100% 100.0% 0.0%1.00" 25.00 100% 100.0% 0.0%3/4" 19.00 100% 100% 100.0% 0.0%5/8" 16.00 100% 100.0% 0.0%1/2" 12.50 100% 100% 100.0% 0.0%3/8" 9.50 99% 99% 100.0% 0.0%1/4" 6.30 97% 100.0% 0.0%#4 4.75 96% 96% 100.0% 0.0%#8 2.36 96% 100.0% 0.0%
#10 2.00 96% 96% 100.0% 0.0%#16 1.18 96% 100.0% 0.0%#20 0.850 96% 96% 100.0% 0.0%#30 0.600 95% 100.0% 0.0%#40 0.425 95% 95% 100.0% 0.0%#50 0.300 92% 100.0% 0.0%#60 0.250 91% 91% 100.0% 0.0%#80 0.180 77% 100.0% 0.0%
#100 0.150 71% 71% 100.0% 0.0%#140 0.106 48% 100.0% 0.0%#170 0.090 39% 100.0% 0.0%#200 0.075 31.3% 31.3% 100.0% 0.0%
Copyright Spears Engineering & Technical Services PS, 1996-98
Comments:
Reviewed by:Meghan Blodgett-Carrillo
Materials Testing & Consulting, Inc.
Visit our website: www.mtc-inc.net
All results apply only to actual locations and materials tested. As a mutual protection to clients, the public and ourselves, all reports are submitted as the confidential property of clients, and authorization for publication of statements, conclusions or extracts from or regarding our reports is reserved pending our written approval.
Corporate ~ 777 Chrysler Drive • Burlington, WA 98233 • Phone (360) 755-1990 • Fax (360) 755-1980Regional Offices: Olympia ~ 360.534.9777 Bellingham ~ 360.647.6111 Silverdale ~ 360.698.6787 Tukwila ~ 206.241.1974
Geotechnical Engineering • Special Inspection • Materials Testing • Environmental Consulting
Sieve Report
ASTM C-136, ASTM D-6913
20S051Anchor QEAEM-HA3 @ 0-1 - 20200131
ASTM D-2487 Unified Soils Classification System
ASTM D-2216, ASTM D-2419, ASTM D-4318, ASTM D-5821
SM, Silty Sand
graySample Color:
Q.C. - Everett Code Violation Settlement
8" 6" 4" 2"3" 1½" 1¼
"
10"
1"¾
"5/
8" ½"
3/8"
¼"
#4 #8
#10
#16
#20 #30
#40 #50
#60
#80
#10
0#
140
#17
0#
200
0%
10%
20%
30%
40%
50%
60%
70%
80%
90%
100%
0.0%
10.0%
20.0%
30.0%
40.0%
50.0%
60.0%
70.0%
80.0%
90.0%
100.0%
0.0010.0100.1001.00010.000100.000
% P
assin
g
% P
assin
g
Particle Size (mm)
Grain Size Distribution
Sieve Sizes Max Specs Min Specs Sieve Results
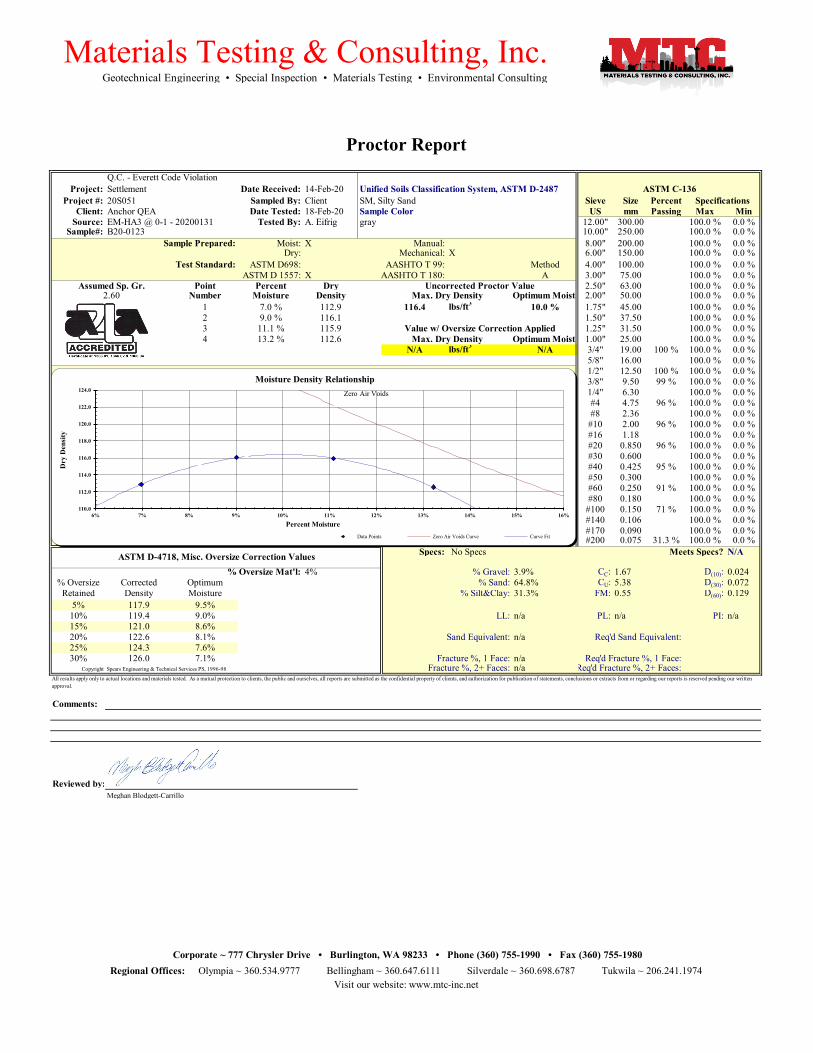
Project: Date Received: 14-Feb-20Project #: Sampled By: Client Sieve Size Percent
Client: Date Tested: 18-Feb-20 Sample Color US mm Passing Max MinSource: Tested By: A. Eifrig 12.00" 300.00 100.0 % 0.0 %
Sample#: 10.00" 250.00 100.0 % 0.0 %Sample Prepared: Moist: X Manual: 8.00" 200.00 100.0 % 0.0 %
Dry: Mechanical: X 6.00" 150.00 100.0 % 0.0 %Test Standard: ASTM D698: AASHTO T 99: Method 4.00" 100.00 100.0 % 0.0 %
ASTM D 1557: X AASHTO T 180: A 3.00" 75.00 100.0 % 0.0 %Point Percent Dry 2.50" 63.00 100.0 % 0.0 %
Number Moisture Density Optimum Moist. 2.00" 50.00 100.0 % 0.0 %1 7.0 % 112.9 116.4 lbs/ft3 10.0 % 1.75" 45.00 100.0 % 0.0 %2 9.0 % 116.1 1.50" 37.50 100.0 % 0.0 %3 11.1 % 115.9 1.25" 31.50 100.0 % 0.0 %4 13.2 % 112.6 Optimum Moist. 1.00" 25.00 100.0 % 0.0 %
N/A lbs/ft3 N/A 3/4" 19.00 100 % 100.0 % 0.0 %5/8" 16.00 100.0 % 0.0 %1/2" 12.50 100 % 100.0 % 0.0 %3/8" 9.50 99 % 100.0 % 0.0 %1/4" 6.30 100.0 % 0.0 %#4 4.75 96 % 100.0 % 0.0 %#8 2.36 100.0 % 0.0 %
#10 2.00 96 % 100.0 % 0.0 %#16 1.18 100.0 % 0.0 %#20 0.850 96 % 100.0 % 0.0 %#30 0.600 100.0 % 0.0 %#40 0.425 95 % 100.0 % 0.0 %#50 0.300 100.0 % 0.0 %#60 0.250 91 % 100.0 % 0.0 %#80 0.180 100.0 % 0.0 %
#100 0.150 71 % 100.0 % 0.0 %#140 0.106 100.0 % 0.0 %#170 0.090 100.0 % 0.0 %#200 0.075 31.3 % 100.0 % 0.0 %
Specs: Meets Specs? N/A
% Oversize Mat'l: 4% % Gravel: 3.9% CC: 1.67 D(10): 0.024% Oversize Corrected Optimum % Sand: 64.8% CU: 5.38 D(30): 0.072
Retained Density Moisture % Silt&Clay: 31.3% FM: 0.55 D(60): 0.1295% 117.9 9.5%
10% 119.4 9.0% LL: n/a PL: n/a PI: n/a15% 121.0 8.6%20% 122.6 8.1% Sand Equivalent: n/a Req'd Sand Equivalent:25% 124.3 7.6%30% 126.0 7.1% Fracture %, 1 Face: n/a Req'd Fracture %, 1 Face:
Copyright Spears Engineering & Technical Services PS, 1996-98 Fracture %, 2+ Faces: n/a Req'd Fracture %, 2+ Faces:
Comments:
Reviewed by:Meghan Blodgett-Carrillo
Materials Testing & Consulting, Inc.Geotechnical Engineering • Special Inspection • Materials Testing • Environmental Consulting
Proctor Report
ASTM C-136Q.C. - Everett Code ViolationSettlement Unified Soils Classification System, ASTM D-2487
B20-0123
Specifications
Uncorrected Proctor Value
All results apply only to actual locations and materials tested. As a mutual protection to clients, the public and ourselves, all reports are submitted as the confidential property of clients, and authorization for publication of statements, conclusions or extracts from or regarding our reports is reserved pending our written approval.
Value w/ Oversize Correction Applied
Assumed Sp. Gr.
ASTM D-4718, Misc. Oversize Correction Values
grayEM-HA3 @ 0-1 - 20200131
20S051 SM, Silty SandAnchor QEA
2.60 Max. Dry Density
Max. Dry Density
No Specs
Regional Offices: Olympia ~ 360.534.9777 Bellingham ~ 360.647.6111 Silverdale ~ 360.698.6787 Tukwila ~ 206.241.1974Visit our website: www.mtc-inc.net
Corporate ~ 777 Chrysler Drive • Burlington, WA 98233 • Phone (360) 755-1990 • Fax (360) 755-1980
Zero Air Voids
110.0
112.0
114.0
116.0
118.0
120.0
122.0
124.0
6% 7% 8% 9% 10% 11% 12% 13% 14% 15% 16%
Dry
Den
sity
Percent Moisture
Moisture Density Relationship
Data Points Zero Air Voids Curve Curve Fit
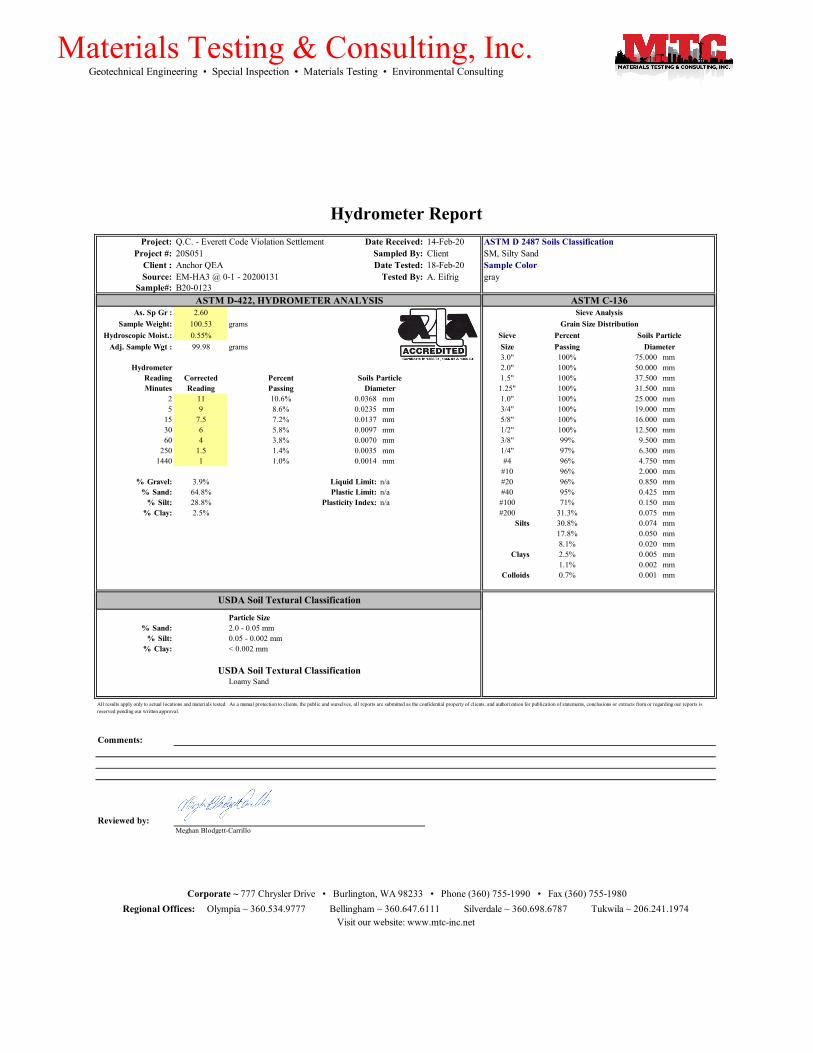
Project: Q.C. - Everett Code Violation Settlement Date Received: 14-Feb-20Project #: 20S051 Sampled By: Client
Client : Anchor QEA Date Tested: 18-Feb-20 Sample ColorSource: EM-HA3 @ 0-1 - 20200131 Tested By: A. Eifrig
Sample#: B20-0123
As. Sp Gr : 2.60Sample Weight: 100.53 grams
Hydroscopic Moist.: 0.55% Sieve PercentAdj. Sample Wgt : 99.98 grams Size Passing
3.0" 100% 75.000 mmHydrometer 2.0" 100% 50.000 mm
Reading Corrected Percent 1.5" 100% 37.500 mmMinutes Reading Passing 1.25" 100% 31.500 mm
2 11 10.6% 0.0368 mm 1.0" 100% 25.000 mm5 9 8.6% 0.0235 mm 3/4" 100% 19.000 mm
15 7.5 7.2% 0.0137 mm 5/8" 100% 16.000 mm30 6 5.8% 0.0097 mm 1/2" 100% 12.500 mm60 4 3.8% 0.0070 mm 3/8" 99% 9.500 mm
250 1.5 1.4% 0.0035 mm 1/4" 97% 6.300 mm1440 1 1.0% 0.0014 mm #4 96% 4.750 mm
#10 96% 2.000 mm% Gravel: 3.9% Liquid Limit: n/a #20 96% 0.850 mm
% Sand: 64.8% Plastic Limit: n/a #40 95% 0.425 mm% Silt: 28.8% Plasticity Index: n/a #100 71% 0.150 mm
% Clay: 2.5% #200 31.3% 0.075 mmSilts 30.8% 0.074 mm
17.8% 0.050 mm8.1% 0.020 mm
Clays 2.5% 0.005 mm1.1% 0.002 mm
Colloids 0.7% 0.001 mm
Particle Size% Sand: 81.5% 2.0 - 0.05 mm
% Silt: 17.3% 0.05 - 0.002 mm% Clay: 1.1% < 0.002 mm
Loamy Sand
Comments:
Reviewed by:Meghan Blodgett-Carrillo
All results apply only to actual locations and materials tested. As a mutual protection to clients, the public and ourselves, all reports are submitted as the confidential property of clients, and authorization for publication of statements, conclusions or extracts from or regarding our reports is reserved pending our written approval.
USDA Soil Textural Classification
ASTM C-136
Soils Particle
ASTM D-422, HYDROMETER ANALYSISSieve Analysis
Grain Size Distribution
Visit our website: www.mtc-inc.net
Corporate ~ 777 Chrysler Drive • Burlington, WA 98233 • Phone (360) 755-1990 • Fax (360) 755-1980Regional Offices: Olympia ~ 360.534.9777 Bellingham ~ 360.647.6111 Silverdale ~ 360.698.6787 Tukwila ~ 206.241.1974
Materials Testing & Consulting, Inc. Geotechnical Engineering • Special Inspection • Materials Testing • Environmental Consulting
USDA Soil Textural Classification
Hydrometer Report
SM, Silty Sand
Diameter
gray
Soils ParticleDiameter
ASTM D 2487 Soils Classification

Project:Project #:
Client: Sample ColorSource:
Sample #:
#1 #2 #3 #4 #5 #6
Weight of Wet Soils + Pan:
Weight of Dry Soils + Pan: non-plastic
Weight of Pan:Weight of Dry Soils: Liquid Limit @ 25 Blows: N/AWeight of Moisture: Plastic Limit: N/A
% Moisture: Plasticity Index, IP: N/ANumber of Blows:
#1 #2 #3 #4 #5 #6Weight of Wet Soils + Pan:Weight of Dry Soils + Pan: non-plastic
Weight of Pan:Weight of Dry Soils:Weight of Moisture:
% Moisture:
Copyright Spears Engineering & Technical Services PS, 1996-98
Comments:
Reviewed by:Meghan Blodgett-Carrillo
Geotechnical Engineering • Special Inspections • Materials Testing • Environmental ConsultingMaterials Testing & Consulting, Inc.
Regional Offices: Olympia ~ 360.534.9777 Bellingham ~ 360.647.6111 Silverdale ~ 360.698.6787 Tukwila ~ 206.241.1974
18-Feb-20EM-HA3 @ 0-1 - 20200131Anchor QEA
A. Eifrig
14-Feb-20Client
ASTM D4318 - Liquid Limit, Plastic Limit and Plasticity Index of Soils
Q.C. - Everett Code Violation Settlement ASTM D 2487 Unified Soils ClassificationDate Received:
B20-0123
Visit our website: www.mtc-inc.net
Corporate ~ 777 Chrysler Drive • Burlington, WA 98233 • Phone (360) 755-1990 • Fax (360) 755-1980
Liquid Limit Determination
dilation. Non-plastic Plastic limit cannot be determined as the material does not roll down to 1/8" threads. Liquid limit cannot be established as the material shows rapid
Sampled By:Date Tested:
Tested By:
Plastic Limit Determination
All results apply only to actual locations and materials tested. As a mutual protection to clients, the public and ourselves, all reports are submitted as the confidential property of clients, and authorization for publication of statements, conclusions or extracts from or regarding our reports is reserved pending our written approval.
20S051 SM, Silty Sand
gray
0%
10%
20%
30%
40%
50%
60%
70%
80%
90%
100%
10 100
% M
oist
ure
Number of Blows, "N"
Liquid Limit
0.0 %
10.0 %
20.0 %
30.0 %
40.0 %
50.0 %
60.0 %
70.0 %
0% 10% 20% 30% 40% 50% 60% 70% 80% 90% 100% 110%
Plas
ticity
Inde
x
Liquid Limit
Plasticity Chart
MH or OH
ML or OLCL-ML

Project: Date Received: 14-Feb-20Project #: Sampled By: Client
Client: Date Tested: 18-Feb-20Source: Tested By: A. Eifrig
Sample#: B20-0124
D(5) = 0.011 mm % Gravel = 9.0% Coeff. of Curvature, CC = 0.63Specifications D(10) = 0.022 mm % Sand = 57.4% Coeff. of Uniformity, CU = 14.35 No Specs D(15) = 0.033 mm % Silt & Clay = 33.6% Fineness Modulus = 1.66
Sample Meets Specs ? N/A D(30) = 0.067 mm Liquid Limit = 35.0% Plastic Limit = n/aD(50) = 0.202 mm Plasticity Index = n/a Moisture %, as sampled = 34.7%D(60) = 0.320 mm Sand Equivalent = n/a Req'd Sand Equivalent =D(90) = 3.837 mm Fracture %, 1 Face = n/a Req'd Fracture %, 1 Face =
Dust Ratio = 1/2 Fracture %, 2+ Faces = n/a Req'd Fracture %, 2+ Faces =
Actual InterpolatedCumulative Cumulative
Sieve Size Percent Percent Specs SpecsUS Metric Passing Passing Max Min
12.00" 300.00 100% 100.0% 0.0%10.00" 250.00 100% 100.0% 0.0%8.00" 200.00 100% 100.0% 0.0%6.00" 150.00 100% 100.0% 0.0%4.00" 100.00 100% 100.0% 0.0%3.00" 75.00 100% 100.0% 0.0%2.50" 63.00 100% 100.0% 0.0%2.00" 50.00 100% 100.0% 0.0%1.75" 45.00 100% 100.0% 0.0%1.50" 37.50 100% 100.0% 0.0%1.25" 31.50 100% 100.0% 0.0%1.00" 25.00 100% 100.0% 0.0%3/4" 19.00 100% 100% 100.0% 0.0%5/8" 16.00 100% 100.0% 0.0%1/2" 12.50 99% 99% 100.0% 0.0%3/8" 9.50 98% 98% 100.0% 0.0%1/4" 6.30 93% 100.0% 0.0%#4 4.75 91% 91% 100.0% 0.0%#8 2.36 88% 100.0% 0.0%
#10 2.00 88% 88% 100.0% 0.0%#16 1.18 81% 100.0% 0.0%#20 0.850 79% 79% 100.0% 0.0%#30 0.600 72% 100.0% 0.0%#40 0.425 67% 67% 100.0% 0.0%#50 0.300 59% 100.0% 0.0%#60 0.250 55% 55% 100.0% 0.0%#80 0.180 48% 100.0% 0.0%
#100 0.150 45% 45% 100.0% 0.0%#140 0.106 38% 100.0% 0.0%#170 0.090 36% 100.0% 0.0%#200 0.075 33.6% 33.6% 100.0% 0.0%
Copyright Spears Engineering & Technical Services PS, 1996-98
Comments:
Reviewed by:Meghan Blodgett-Carrillo
Materials Testing & Consulting, Inc.
Visit our website: www.mtc-inc.net
All results apply only to actual locations and materials tested. As a mutual protection to clients, the public and ourselves, all reports are submitted as the confidential property of clients, and authorization for publication of statements, conclusions or extracts from or regarding our reports is reserved pending our written approval.
Corporate ~ 777 Chrysler Drive • Burlington, WA 98233 • Phone (360) 755-1990 • Fax (360) 755-1980Regional Offices: Olympia ~ 360.534.9777 Bellingham ~ 360.647.6111 Silverdale ~ 360.698.6787 Tukwila ~ 206.241.1974
Geotechnical Engineering • Special Inspection • Materials Testing • Environmental Consulting
Sieve Report
ASTM C-136, ASTM D-6913
20S051Anchor QEAEM-HA5 @ 0-2 - 20200131
ASTM D-2487 Unified Soils Classification System
ASTM D-2216, ASTM D-2419, ASTM D-4318, ASTM D-5821
SM, Silty Sand
brownSample Color:
Q.C. - Everett Code Violation Settlement
8" 6" 4" 2"3" 1½" 1¼
"
10"
1"¾
"5/
8" ½"
3/8"
¼"
#4 #8
#10
#16
#20 #30
#40 #50
#60
#80
#10
0#
140
#17
0#
200
0%
10%
20%
30%
40%
50%
60%
70%
80%
90%
100%
0.0%
10.0%
20.0%
30.0%
40.0%
50.0%
60.0%
70.0%
80.0%
90.0%
100.0%
0.0010.0100.1001.00010.000100.000
% P
assin
g
% P
assin
g
Particle Size (mm)
Grain Size Distribution
Sieve Sizes Max Specs Min Specs Sieve Results
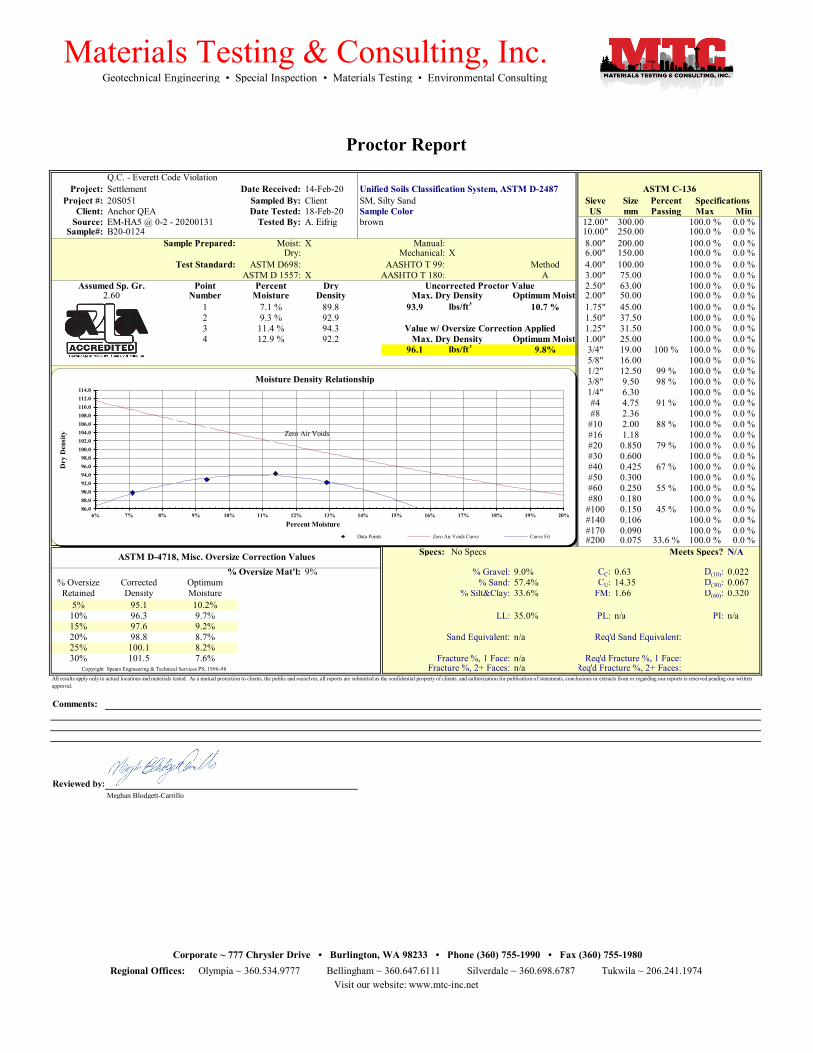
Project: Date Received: 14-Feb-20Project #: Sampled By: Client Sieve Size Percent
Client: Date Tested: 18-Feb-20 Sample Color US mm Passing Max MinSource: Tested By: A. Eifrig 12.00" 300.00 100.0 % 0.0 %
Sample#: 10.00" 250.00 100.0 % 0.0 %Sample Prepared: Moist: X Manual: 8.00" 200.00 100.0 % 0.0 %
Dry: Mechanical: X 6.00" 150.00 100.0 % 0.0 %Test Standard: ASTM D698: AASHTO T 99: Method 4.00" 100.00 100.0 % 0.0 %
ASTM D 1557: X AASHTO T 180: A 3.00" 75.00 100.0 % 0.0 %Point Percent Dry 2.50" 63.00 100.0 % 0.0 %
Number Moisture Density Optimum Moist. 2.00" 50.00 100.0 % 0.0 %1 7.1 % 89.8 93.9 lbs/ft3 10.7 % 1.75" 45.00 100.0 % 0.0 %2 9.3 % 92.9 1.50" 37.50 100.0 % 0.0 %3 11.4 % 94.3 1.25" 31.50 100.0 % 0.0 %4 12.9 % 92.2 Optimum Moist. 1.00" 25.00 100.0 % 0.0 %
96.1 lbs/ft3 9.8% 3/4" 19.00 100 % 100.0 % 0.0 %5/8" 16.00 100.0 % 0.0 %1/2" 12.50 99 % 100.0 % 0.0 %3/8" 9.50 98 % 100.0 % 0.0 %1/4" 6.30 100.0 % 0.0 %#4 4.75 91 % 100.0 % 0.0 %#8 2.36 100.0 % 0.0 %
#10 2.00 88 % 100.0 % 0.0 %#16 1.18 100.0 % 0.0 %#20 0.850 79 % 100.0 % 0.0 %#30 0.600 100.0 % 0.0 %#40 0.425 67 % 100.0 % 0.0 %#50 0.300 100.0 % 0.0 %#60 0.250 55 % 100.0 % 0.0 %#80 0.180 100.0 % 0.0 %
#100 0.150 45 % 100.0 % 0.0 %#140 0.106 100.0 % 0.0 %#170 0.090 100.0 % 0.0 %#200 0.075 33.6 % 100.0 % 0.0 %
Specs: Meets Specs? N/A
% Oversize Mat'l: 9% % Gravel: 9.0% CC: 0.63 D(10): 0.022% Oversize Corrected Optimum % Sand: 57.4% CU: 14.35 D(30): 0.067
Retained Density Moisture % Silt&Clay: 33.6% FM: 1.66 D(60): 0.3205% 95.1 10.2%
10% 96.3 9.7% LL: 35.0% PL: n/a PI: n/a15% 97.6 9.2%20% 98.8 8.7% Sand Equivalent: n/a Req'd Sand Equivalent:25% 100.1 8.2%30% 101.5 7.6% Fracture %, 1 Face: n/a Req'd Fracture %, 1 Face:
Copyright Spears Engineering & Technical Services PS, 1996-98 Fracture %, 2+ Faces: n/a Req'd Fracture %, 2+ Faces:
Comments:
Reviewed by:Meghan Blodgett-Carrillo
Materials Testing & Consulting, Inc.Geotechnical Engineering • Special Inspection • Materials Testing • Environmental Consulting
Proctor Report
ASTM C-136Q.C. - Everett Code ViolationSettlement Unified Soils Classification System, ASTM D-2487
B20-0124
Specifications
Uncorrected Proctor Value
All results apply only to actual locations and materials tested. As a mutual protection to clients, the public and ourselves, all reports are submitted as the confidential property of clients, and authorization for publication of statements, conclusions or extracts from or regarding our reports is reserved pending our written approval.
Value w/ Oversize Correction Applied
Assumed Sp. Gr.
ASTM D-4718, Misc. Oversize Correction Values
brownEM-HA5 @ 0-2 - 20200131
20S051 SM, Silty SandAnchor QEA
2.60 Max. Dry Density
Max. Dry Density
No Specs
Regional Offices: Olympia ~ 360.534.9777 Bellingham ~ 360.647.6111 Silverdale ~ 360.698.6787 Tukwila ~ 206.241.1974Visit our website: www.mtc-inc.net
Corporate ~ 777 Chrysler Drive • Burlington, WA 98233 • Phone (360) 755-1990 • Fax (360) 755-1980
Zero Air Voids
86.088.090.092.094.096.098.0
100.0102.0104.0106.0108.0110.0112.0114.0
6% 7% 8% 9% 10% 11% 12% 13% 14% 15% 16% 17% 18% 19% 20%
Dry
Den
sity
Percent Moisture
Moisture Density Relationship
Data Points Zero Air Voids Curve Curve Fit

Project: Q.C. - Everett Code Violation Settlement Date Received: 14-Feb-20Project #: 20S051 Sampled By: Client
Client : Anchor QEA Date Tested: 18-Feb-20 Sample ColorSource: EM-HA5 @ 0-2 - 20200131 Tested By: A. Eifrig
Sample#: B20-0124
As. Sp Gr : 2.60Sample Weight: 50.76 grams
Hydroscopic Moist.: 6.51% Sieve PercentAdj. Sample Wgt : 47.66 grams Size Passing
3.0" 100% 75.000 mmHydrometer 2.0" 100% 50.000 mm
Reading Corrected Percent 1.5" 100% 37.500 mmMinutes Reading Passing 1.25" 100% 31.500 mm
2 15.5 28.6% 0.0359 mm 1.0" 100% 25.000 mm5 14.5 26.8% 0.0228 mm 3/4" 100% 19.000 mm
15 11 20.3% 0.0134 mm 5/8" 100% 16.000 mm30 9.5 17.5% 0.0096 mm 1/2" 99% 12.500 mm60 7 12.9% 0.0069 mm 3/8" 98% 9.500 mm
250 3 5.5% 0.0034 mm 1/4" 93% 6.300 mm1440 1 1.8% 0.0014 mm #4 91% 4.750 mm
#10 88% 2.000 mm% Gravel: 9.0% Liquid Limit: 35.0 % #20 79% 0.850 mm
% Sand: 57.4% Plastic Limit: n/a #40 67% 0.425 mm% Silt: 24.7% Plasticity Index: n/a #100 45% 0.150 mm
% Clay: 8.9% #200 33.6% 0.075 mmSilts 33.5% 0.074 mm
30.4% 0.050 mm24.8% 0.020 mm
Clays 8.9% 0.005 mm2.9% 0.002 mm
Colloids 1.3% 0.001 mm
Particle Size% Sand: 65.4% 2.0 - 0.05 mm
% Silt: 31.3% 0.05 - 0.002 mm% Clay: 3.3% < 0.002 mm
Sandy Loam
Comments:
Reviewed by:Meghan Blodgett-Carrillo
All results apply only to actual locations and materials tested. As a mutual protection to clients, the public and ourselves, all reports are submitted as the confidential property of clients, and authorization for publication of statements, conclusions or extracts from or regarding our reports is reserved pending our written approval.
USDA Soil Textural Classification
ASTM C-136
Soils Particle
ASTM D-422, HYDROMETER ANALYSISSieve Analysis
Grain Size Distribution
Visit our website: www.mtc-inc.net
Corporate ~ 777 Chrysler Drive • Burlington, WA 98233 • Phone (360) 755-1990 • Fax (360) 755-1980Regional Offices: Olympia ~ 360.534.9777 Bellingham ~ 360.647.6111 Silverdale ~ 360.698.6787 Tukwila ~ 206.241.1974
Materials Testing & Consulting, Inc. Geotechnical Engineering • Special Inspection • Materials Testing • Environmental Consulting
USDA Soil Textural Classification
Hydrometer Report
SM, Silty Sand
Diameter
brown
Soils ParticleDiameter
ASTM D 2487 Soils Classification
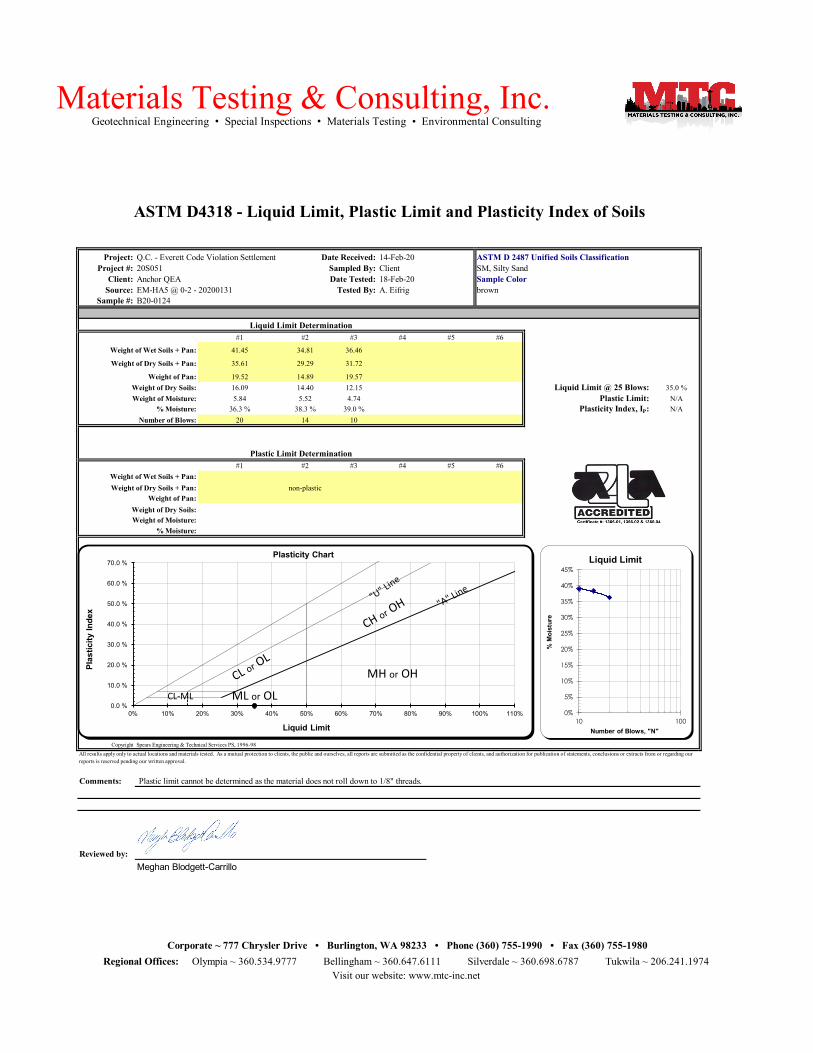
Project:Project #:
Client: Sample ColorSource:
Sample #:
#1 #2 #3 #4 #5 #6
Weight of Wet Soils + Pan: 41.45 34.81 36.46
Weight of Dry Soils + Pan: 35.61 29.29 31.72
Weight of Pan: 19.52 14.89 19.57Weight of Dry Soils: 16.09 14.40 12.15 Liquid Limit @ 25 Blows: 35.0 %Weight of Moisture: 5.84 5.52 4.74 Plastic Limit: N/A
% Moisture: 36.3 % 38.3 % 39.0 % Plasticity Index, IP: N/ANumber of Blows: 20 14 10
#1 #2 #3 #4 #5 #6Weight of Wet Soils + Pan:Weight of Dry Soils + Pan: non-plastic
Weight of Pan:Weight of Dry Soils:Weight of Moisture:
% Moisture:
Copyright Spears Engineering & Technical Services PS, 1996-98
Comments:
Reviewed by:Meghan Blodgett-Carrillo
Geotechnical Engineering • Special Inspections • Materials Testing • Environmental ConsultingMaterials Testing & Consulting, Inc.
Regional Offices: Olympia ~ 360.534.9777 Bellingham ~ 360.647.6111 Silverdale ~ 360.698.6787 Tukwila ~ 206.241.1974
18-Feb-20EM-HA5 @ 0-2 - 20200131Anchor QEA
A. Eifrig
14-Feb-20Client
ASTM D4318 - Liquid Limit, Plastic Limit and Plasticity Index of Soils
Q.C. - Everett Code Violation Settlement ASTM D 2487 Unified Soils ClassificationDate Received:
B20-0124
Visit our website: www.mtc-inc.net
Corporate ~ 777 Chrysler Drive • Burlington, WA 98233 • Phone (360) 755-1990 • Fax (360) 755-1980
Liquid Limit Determination
Plastic limit cannot be determined as the material does not roll down to 1/8" threads.
Sampled By:Date Tested:
Tested By:
Plastic Limit Determination
All results apply only to actual locations and materials tested. As a mutual protection to clients, the public and ourselves, all reports are submitted as the confidential property of clients, and authorization for publication of statements, conclusions or extracts from or regarding our reports is reserved pending our written approval.
20S051 SM, Silty Sand
brown
0%
5%
10%
15%
20%
25%
30%
35%
40%
45%
10 100
% M
oist
ure
Number of Blows, "N"
Liquid Limit
0.0 %
10.0 %
20.0 %
30.0 %
40.0 %
50.0 %
60.0 %
70.0 %
0% 10% 20% 30% 40% 50% 60% 70% 80% 90% 100% 110%
Plas
ticity
Inde
x
Liquid Limit
Plasticity Chart
MH or OH
ML or OLCL-ML
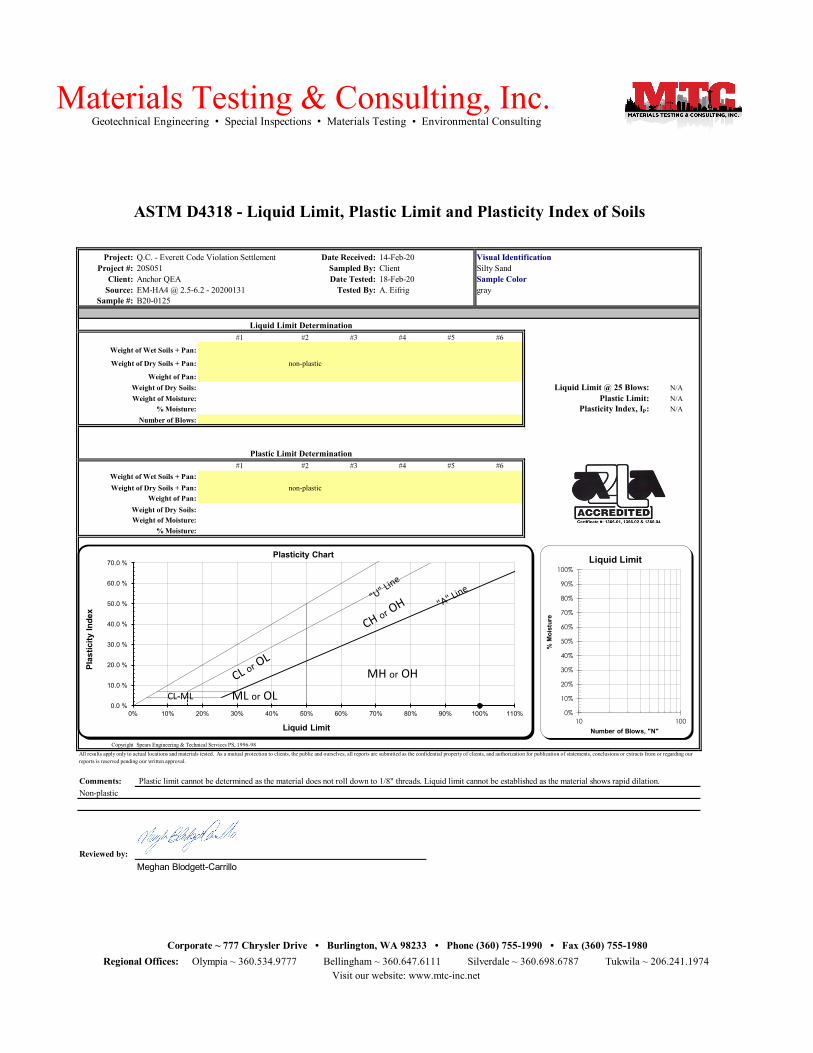
Project:Project #:
Client: Sample ColorSource:
Sample #:
#1 #2 #3 #4 #5 #6
Weight of Wet Soils + Pan:
Weight of Dry Soils + Pan: non-plastic
Weight of Pan:Weight of Dry Soils: Liquid Limit @ 25 Blows: N/AWeight of Moisture: Plastic Limit: N/A
% Moisture: Plasticity Index, IP: N/ANumber of Blows:
#1 #2 #3 #4 #5 #6Weight of Wet Soils + Pan:Weight of Dry Soils + Pan: non-plastic
Weight of Pan:Weight of Dry Soils:Weight of Moisture:
% Moisture:
Copyright Spears Engineering & Technical Services PS, 1996-98
Comments:
Reviewed by:Meghan Blodgett-Carrillo
Geotechnical Engineering • Special Inspections • Materials Testing • Environmental ConsultingMaterials Testing & Consulting, Inc.
Regional Offices: Olympia ~ 360.534.9777 Bellingham ~ 360.647.6111 Silverdale ~ 360.698.6787 Tukwila ~ 206.241.1974
18-Feb-20EM-HA4 @ 2.5-6.2 - 20200131Anchor QEA
A. Eifrig
14-Feb-20Client
ASTM D4318 - Liquid Limit, Plastic Limit and Plasticity Index of Soils
Q.C. - Everett Code Violation Settlement Visual IdentificationDate Received:
B20-0125
Visit our website: www.mtc-inc.net
Corporate ~ 777 Chrysler Drive • Burlington, WA 98233 • Phone (360) 755-1990 • Fax (360) 755-1980
Liquid Limit Determination
Non-plastic Plastic limit cannot be determined as the material does not roll down to 1/8" threads. Liquid limit cannot be established as the material shows rapid dilation.
Sampled By:Date Tested:
Tested By:
Plastic Limit Determination
All results apply only to actual locations and materials tested. As a mutual protection to clients, the public and ourselves, all reports are submitted as the confidential property of clients, and authorization for publication of statements, conclusions or extracts from or regarding our reports is reserved pending our written approval.
20S051 Silty Sand
gray
0%
10%
20%
30%
40%
50%
60%
70%
80%
90%
100%
10 100
% M
oist
ure
Number of Blows, "N"
Liquid Limit
0.0 %
10.0 %
20.0 %
30.0 %
40.0 %
50.0 %
60.0 %
70.0 %
0% 10% 20% 30% 40% 50% 60% 70% 80% 90% 100% 110%
Plas
ticity
Inde
x
Liquid Limit
Plasticity Chart
MH or OH
ML or OLCL-ML

Materials Testing & Consulting, Inc. Geotechnical Engineering & Consulting ● Special Inspection ● Materials Testing ● Environmental Consulting
A l l r e s u l t s a p p l y o n l y t o a c t u a l l o c a t i o n s a n d m a t e r i a l s t e s t e d . A s a m u t u a l p r o t e c t i o n t o c l i e n t s , t h e p u b l i c a n d o u r s e l v e s , a l l r e p o r t s a r e s u b m i t t e d a s t h e c o n f i d e n t i a l p r o p e r t y o f c l i e n t s , a n d a u t h o r i z a t i o n f o r p u b l i c a t i o n o f s t a t e m e n t s , c o n c l u s i o n s o r e x t r a c t s f r o m o r r e g a r d i n g o u r r e p o r t s i s r e s e r v e d p e n d i n g o u r w r i t t e n a p p r o v a l . ©
2 0 0 8 - 2 0 1 5 M a t e r i a l s T e s t i n g & C o n s u l t i n g , I n c . A l l r i g h t s r e s e r v e d .
C or por a te 777 C hr ys le r D r ive • B ur l ing ton , WA 98233 • Phone 360 .755 .1990 • Fax 360 .755 .1980 R e g iona l Of f i ce s : O lympia B e l l i ngha m S i lve rda l e T ukw i l a
360 .534 .9777 360 .647 .6111 360 .698 .6787 206 .241 .1974 V i s i t ou r w e bs i t e : w w w .mtc - inc .ne t
SOILS SPECIFIC GRAVITY ASTM D-854
Project: Q.C. – Everett Code Violation Settlement Client: Anchor QEA Project #: 20S051 Sampled by: Client
Lab #: B20-0125 Date Sampled: 1-31-20 Location/Source: EM-HA4 @ 2.5-6.2 – 20200131 Tested by: A. Eifrig
Description: Gray silty sand Date Tested: 2-18-20 Equipment Used: SA-050 A3, CA-017, MI-007
Record the following weights to the nearest 0.01 grams.
A Weight of Pan 687.75
B Oven Dry Weight of Soils & Pan 748.60
C Oven Dry Weight of Soils (B-A) 60.85
D Weight of Pycnometer filled with water 659.06
E Weight of Pycnometer filled with water & soils 697.32
F Temperature of water in Item “E” 86.0*F
Technicians Record values to 3 decimal places & Clerical Report values to 2 decimal places
G Specific Gravity C/(C+D-E) 2.69
H Temperature Correction Factor 0.9974
I Corrected Specific Gravity (H*G) 2.68
Temperature (*C) Temperature (*F) Relative Density of Water Correction Factor 18 64.4 0.9986244 1.0004 19 66.2 0.9984347 1.0002 20 68.0 0.9982343 1.0000 21 69.8 0.9980233 0.9998 22 71.6 0.9978019 0.9996 23 73.4 0.9975702 0.9993 24 75.2 0.9973286 0.9991 25 77.0 0.9970770 0.9988 26 78.8 0.9968156 0.9986 27 80.6 0.9965451 0.9983 28 82.4 0.9962652 0.9980 29 84.2 0.9959761 0.9977 30 86.0 0.9956780 0.9974
Reviewed by:
Meghan Blodgett-Carrillo

Appendix D Limitations Document

Geotechnical Investigation and Recommendations D-1 March 2020
Important Information About Your Geotechnical/Environmental Report
Consulting Services Are Performed for Specific Purposes and for Specific Clients Consultants prepare reports to meet the specific needs of specific individuals. A report prepared for a civil engineer may not be adequate for a construction contractor or even another civil engineer. Unless indicated otherwise, your consultant prepared your report expressly for you and expressly for the purposes you indicated. No one other than you should apply this report for its intended purpose without first conferring with the consultant. No party should apply this report for any purpose other than that originally contemplated without first conferring with the consultant.
The Consultant's Report Is Based on Project-Specific Factors A geotechnical/environmental report is based on an investigation plan designed to consider a unique set of project-specific factors. Depending on the project, these may include: the general nature of the structure and property involved; its size and configuration; its historical use and practice; the location of the structure on the site and its orientation; other improvements such as access roads, parking lots, and underground utilities; and the additional risk created by scope-of-service limitations imposed by the client. To help avoid costly problems, ask the consultant to evaluate how any factors that change subsequent to the date of the report may affect the recommendations. Unless your consultant indicates otherwise, your report should not be used: 1) when the nature of the proposed project is changed (for example, if an office building will be erected instead of a parking garage, or if a refrigerated warehouse will be built instead of an unrefrigerated one, or chemicals are discovered on or near the site); 2) when the size, elevation, or configuration of the proposed project is altered; 3) when the location or orientation of the proposed project is modified; 4) when there is a change of ownership; or 5) for application to an adjacent site. Consultants cannot accept responsibility for problems that may occur if they are not consulted after factors which were considered in the development of the report have changed.
Subsurface Conditions Can Change Subsurface conditions may be affected as a result of natural processes or human activity. Because a geotechnical/environmental report is based on conditions that existed at the time of subsurface exploration, construction decisions should not be based on a report whose adequacy may have been affected by time. Ask the consultant to advise if additional tests are desirable before construction starts; for example, groundwater conditions commonly vary seasonally.
Geotechnical Investigation and Recommendations D-2 March 2020
Construction operations at or adjacent to the site and natural events such as floods, earthquakes, or groundwater fluctuations may also affect subsurface conditions and, thus, the continuing adequacy of a geotechnical/environmental report. The consultant should be kept apprised of any such events, and should be consulted to determine if additional tests are necessary.
Most Recommendations Are Professional Judgments Site exploration and testing identifies actual surface and subsurface conditions only at those points where samples are taken. The data were extrapolated by your consultant, who then applied judgment to render an opinion about overall subsurface conditions. The actual interface between materials may be far more gradual or abrupt than your report indicates. Actual conditions in areas not sampled may differ from those predicted in your report. While nothing can be done to prevent such situations, you and your consultant can work together to help reduce their impacts. Retaining your consultant to observe subsurface construction operations can be particularly beneficial in this respect.
A Report's Conclusions Are Preliminary The conclusions contained in your consultant's report are preliminary because they must be based on the assumption that conditions revealed through selective exploratory sampling are indicative of actual conditions throughout a site. Actual subsurface conditions can be discerned only during earthwork; therefore, you should retain your consultant to observe actual conditions and to provide conclusions. Only the consultant who prepared the report is fully familiar with the background information needed to determine whether or not the report's recommendations based on those conclusions are valid and whether or not the contractor is abiding by applicable recommendations. The consultant who developed your report cannot assume responsibility or liability for the adequacy of the report's recommendations if another party is retained to observe construction.
The Consultant's Report Is Subject to Misinterpretation Costly problems can occur when other design professionals develop their plans based on misinterpretation of a geotechnical/environmental report. To help avoid these problems, the consultant should be retained to work with other project design professionals to explain relevant geotechnical, geological, hydrogeological, and environmental findings, and to review the adequacy of their plans and specifications relative to these issues.
Boring Logs And/or Monitoring Well Data Should Not Be Separated from the Report Final boring logs developed by the consultant are based upon interpretation of field logs (assembled by site personnel), field test results, and laboratory and/or office evaluation of field samples and data. Only final boring logs and data are customarily included in geotechnical/environmental reports.
Geotechnical Investigation and Recommendations D-3 March 2020
These final logs should not, under any circumstances, be redrawn for inclusion in architectural or other design drawings, because drafters may commit errors or omissions in the transfer process.
To reduce the likelihood of boring log or monitoring well misinterpretation, contractors should be given ready access to the complete geotechnical engineering/environmental report prepared or authorized for their use. If access is provided only to the report prepared for you, you should advise contractors of the report's limitations, assuming that a contractor was not one of the specific persons for whom the report was prepared, and that developing construction cost estimates was not one of the specific purposes for which it was prepared. While a contractor may gain important knowledge from a report prepared for another party, the contractor should discuss the report with your consultant and perform the additional or alternative work believed necessary to obtain the data specifically appropriate for construction cost estimating purposes. Some clients hold the mistaken impression that simply disclaiming responsibility for the accuracy of subsurface information always insulates them from attendant liability. Providing the best available information to contractors helps prevent costly construction problems and the adversarial attitudes that aggravate them to a disproportionate scale.
Read Responsibility Clauses Closely Because geotechnical/environmental engineering is based extensively on judgment and opinion, it is far less exact than other design disciplines. This situation has resulted in wholly unwarranted claims being lodged against consultants. To help prevent this problem, consultants have developed a number of clauses for use in their contracts, reports and other documents. These responsibility clauses are not exculpatory clauses designed to transfer the consultant's liabilities to other parties; rather, they are definitive clauses that identify where the consultant's responsibilities begin and end. Their use helps all parties involved recognize their individual responsibilities and take appropriate action. Some of these definitive clauses are likely to appear in your report, and you are encouraged to read them closely. Your consultant will be pleased to give full and frank answers to your questions.