Embed Size (px)
Citation preview

FEMA 451B Topic 15-4 Notes Geotechnical Engineering 15-4 - 1
Instructional Material Complementing FEMA 451, Design Examples Geotechnical 15-4 - 1
GEOTECHNICAL EARTHQUAKE ENGINEERING
Typically concerned with: • Determining ground motions – especially as to
effects of local site conditions • Liquefaction and liquefaction-related evaluations –
(settlements, lateral spreading movements, etc.)• Slope/landslide evaluation• Dams/embankments• Design of retaining structures• Deep and shallow foundation analysis• Underground structures (tunnels, etc.)
All slides are annotated.

FEMA 451B Topic 15-4 Notes Geotechnical Engineering 15-4 - 2
Instructional Material Complementing FEMA 451, Design Examples Geotechnical 15-4 - 2
Kramer, Steven L. 1996. Geotechnical Earthquake Engineering. Prentice Hall, 653 pp.
Key Reference
None.
FEMA 451B Topic 15-4 Notes Geotechnical Engineering 15-4 - 3
Instructional Material Complementing FEMA 451, Design Examples Geotechnical 15-4 - 3
“While many cases of soil effects had been observed and reported for many years, it was not until a series of catastrophic failures, involving landslides at Anchorage, Valdez and Seward in the 1964 Alaska earthquake, and extensive liquefaction in Niigata, Japan, during the earthquake in 1964, caused geotechnical engineers to become far more aware of, and eventually engaged in understanding, these phenomena.”
(I. M. Idriss, 2002)
Historical Perspective
The 1964 Alaska and Niigata, Japan, earthquakes caused the geotechnical engineering community to better appreciate liquefaction and related effects during earthquakes.
FEMA 451B Topic 15-4 Notes Geotechnical Engineering 15-4 - 4
Instructional Material Complementing FEMA 451, Design Examples Geotechnical 15-4 - 4
Important Learning Opportunities• 1964 Niigata and 1964 Alaska• 1967 Caracas• 1971 San Fernando• 1979 Imperial valley• 1985 Mexico City• 1989 Loma Prieta• 1995 Kobe (Japan)• 1999 Kocaeli (Turkey)• 1999 Chi Chi (Taiwan)
These earthquakes each represented important learning opportunities for the geotechnical earthquake engineering community.
FEMA 451B Topic 15-4 Notes Geotechnical Engineering 15-4 - 5
Instructional Material Complementing FEMA 451, Design Examples Geotechnical 15-4 - 5
Site Effects – Some History
“… a movement … must be modified whilepassing through media of different constitutions. Therefore, the earthquake effects will arrive to the surface with higher or lesser violence according to the state of aggregation of the terrain which conducted the movement. This seems to be, in fact, what we have observed in the Colchagua Province (of Chile) as well as in many other cases.”
- from Del Barrio (1855) in Toro and Silva (2001)
Quotation originally taken from: Rix, G. J., 2001, “Site Response and Ground Motions in the Charleston, SC Area,” short-course presentation for NSF-sponsored MAE Center, Mills House Hotel, Charleston, SC, November. Amazing that researchers/observers from this early period noted the importance of site effects.
FEMA 451B Topic 15-4 Notes Geotechnical Engineering 15-4 - 6
Instructional Material Complementing FEMA 451, Design Examples Geotechnical 15-4 - 6
• Soil profile acts as filter• Change in frequency content of motion• Layering complicates the issue• Amplification or de-amplification of
ground motions can occur• Duration of motion is increased
Site Effects on Ground Motions
None.
FEMA 451B Topic 15-4 Notes Geotechnical Engineering 15-4 - 7
Instructional Material Complementing FEMA 451, Design Examples Geotechnical 15-4 - 7
A
B
Rock
ShaleSand
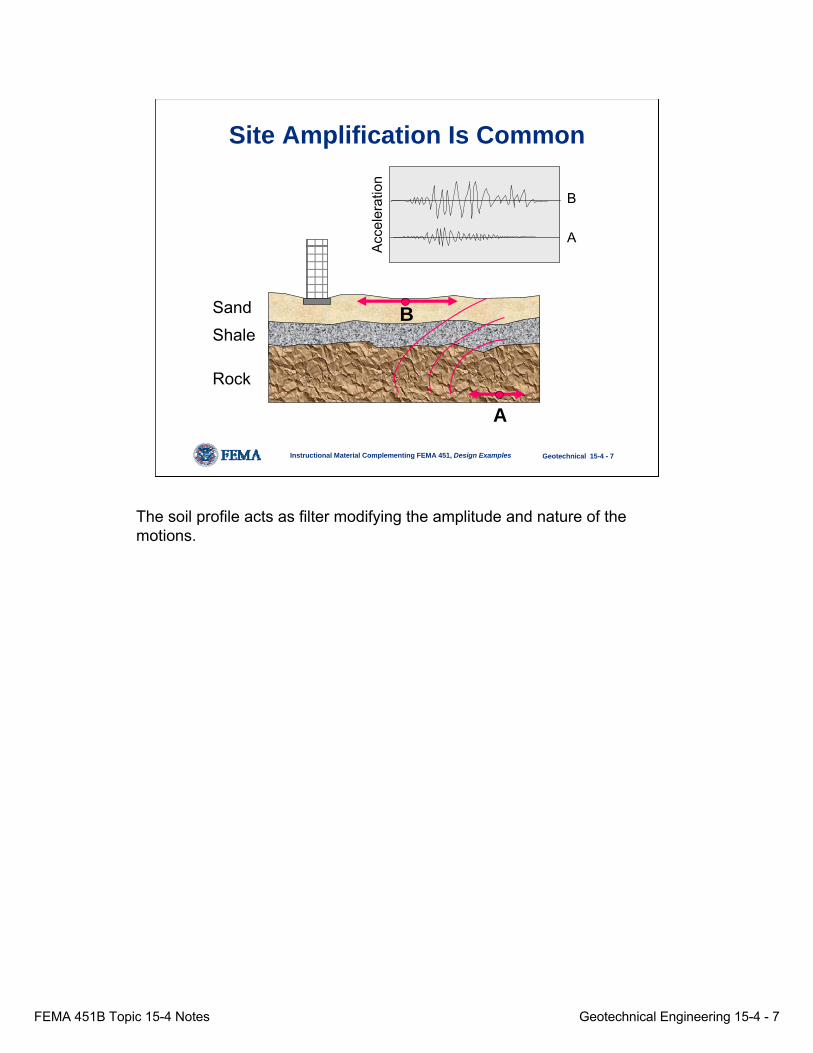
Site Amplification Is Common
A
B
Acc
eler
atio
n
The soil profile acts as filter modifying the amplitude and nature of the motions.
FEMA 451B Topic 15-4 Notes Geotechnical Engineering 15-4 - 8
Instructional Material Complementing FEMA 451, Design Examples Geotechnical 15-4 - 8
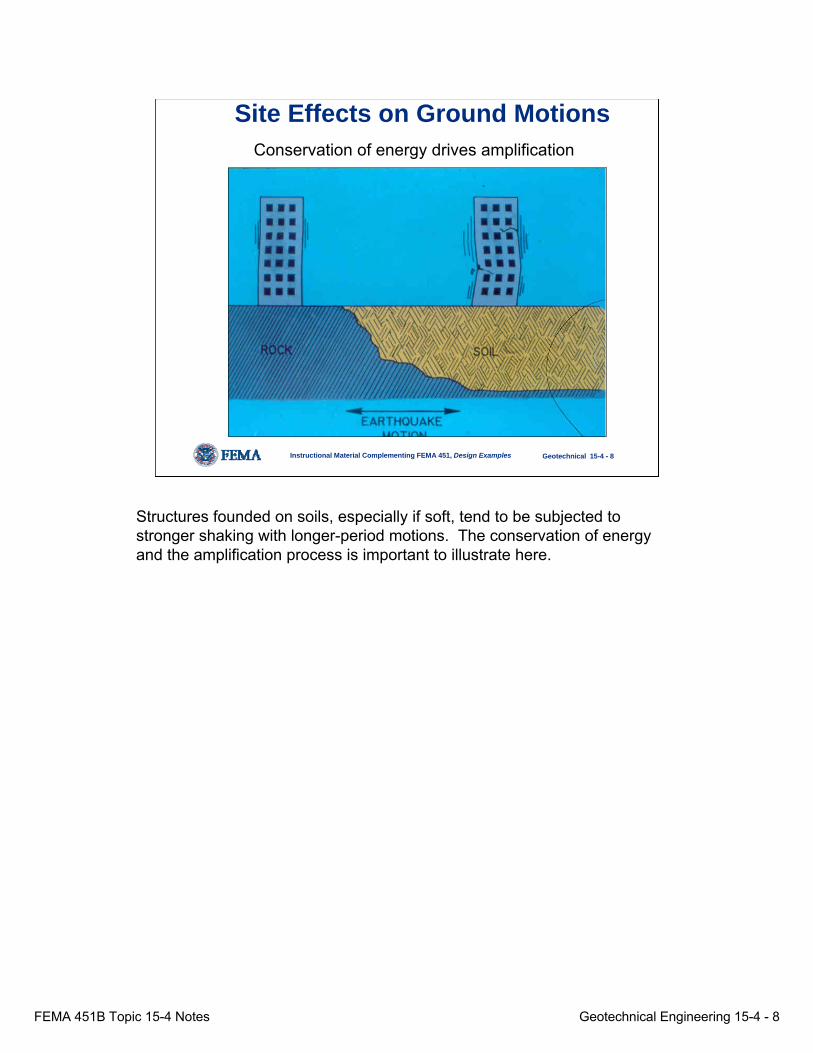
Site Effects on Ground MotionsConservation of energy drives amplification
Structures founded on soils, especially if soft, tend to be subjected to stronger shaking with longer-period motions. The conservation of energy and the amplification process is important to illustrate here.
FEMA 451B Topic 15-4 Notes Geotechnical Engineering 15-4 - 9
Instructional Material Complementing FEMA 451, Design Examples Geotechnical 15-4 - 9
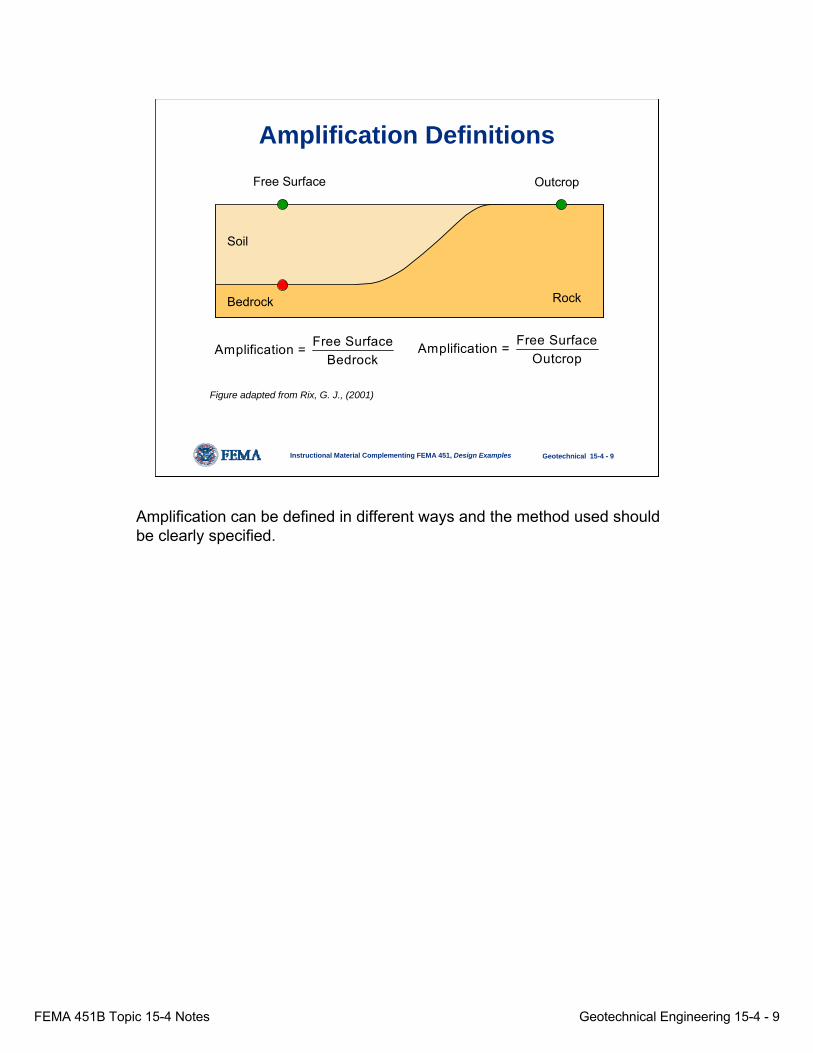
Amplification Definitions
Soil
Rock
OutcropFree Surface
Bedrock
Free SurfaceAmplification = Bedrock
Free SurfaceAmplification = Outcrop
Figure adapted from Rix, G. J., (2001)
Amplification can be defined in different ways and the method used should be clearly specified.
FEMA 451B Topic 15-4 Notes Geotechnical Engineering 15-4 - 10
Instructional Material Complementing FEMA 451, Design Examples Geotechnical 15-4 - 10
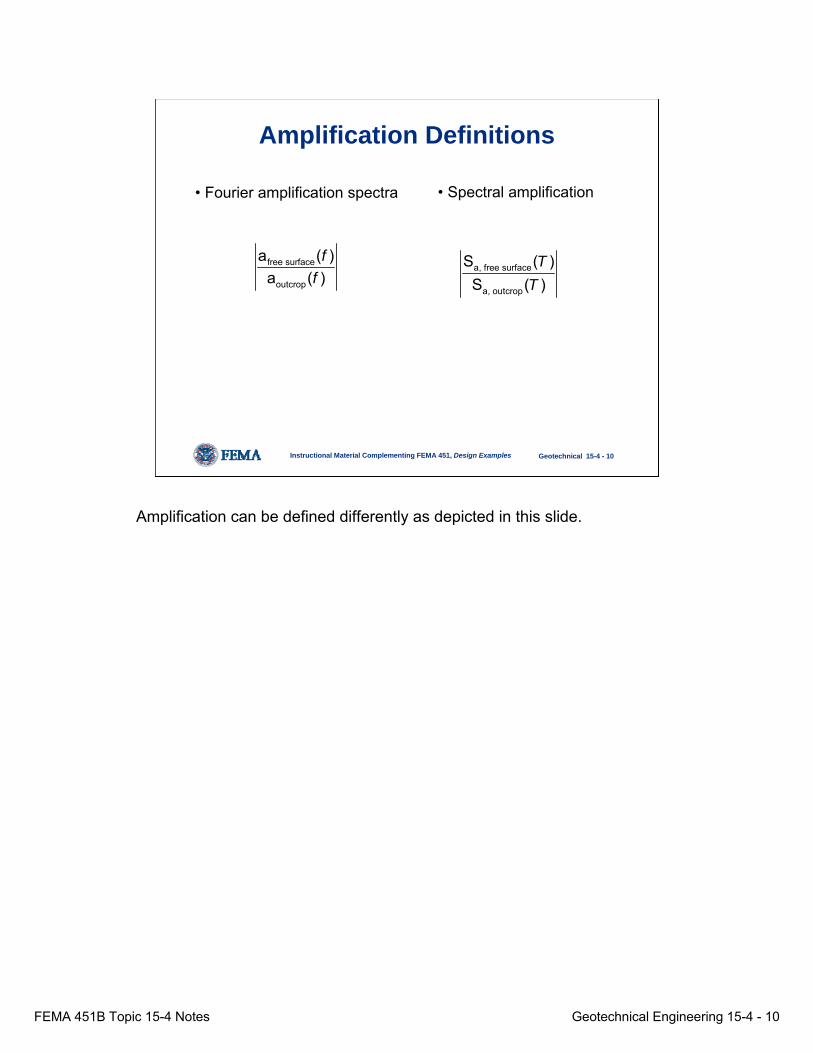
Amplification Definitions
• Fourier amplification spectra • Spectral amplification
free surface
outcrop
a ( )a ( )
ff
a, free surface
a, outcrop
S ( )S ( )
TT
Amplification can be defined differently as depicted in this slide.
FEMA 451B Topic 15-4 Notes Geotechnical Engineering 15-4 - 11
Instructional Material Complementing FEMA 451, Design Examples Geotechnical 15-4 - 11
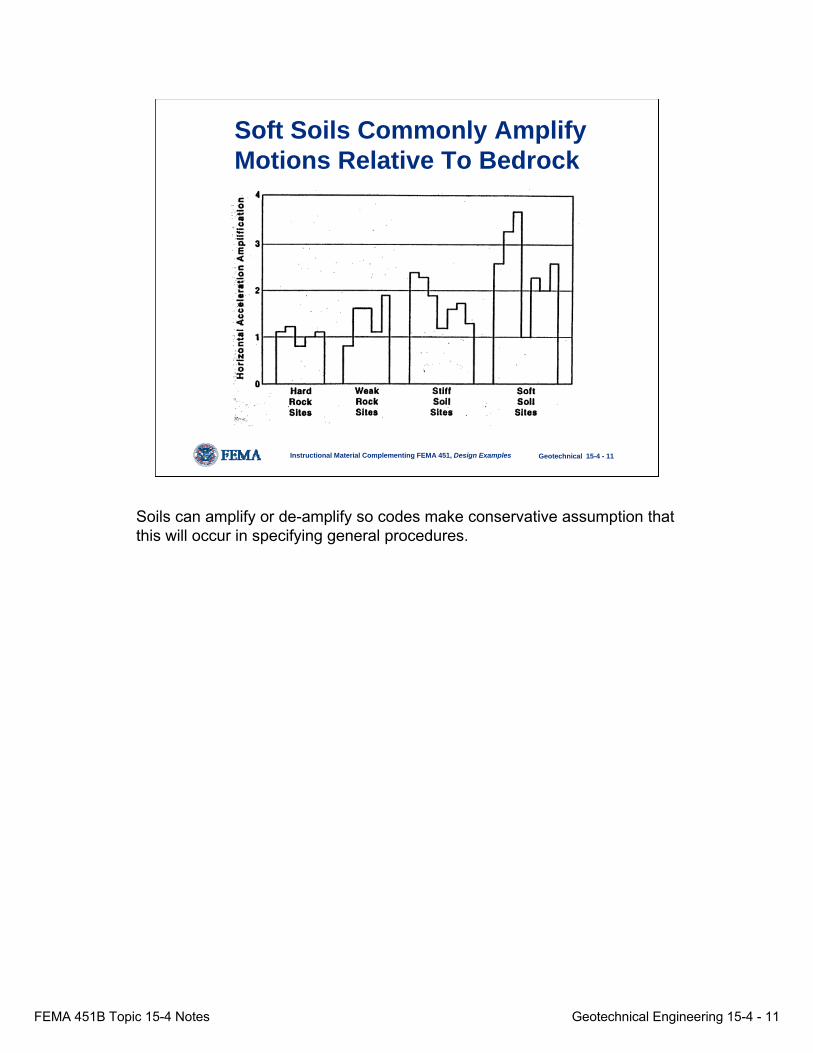
Soft Soils Commonly Amplify Motions Relative To Bedrock
Soils can amplify or de-amplify so codes make conservative assumption that this will occur in specifying general procedures.
FEMA 451B Topic 15-4 Notes Geotechnical Engineering 15-4 - 12
Instructional Material Complementing FEMA 451, Design Examples Geotechnical 15-4 - 12
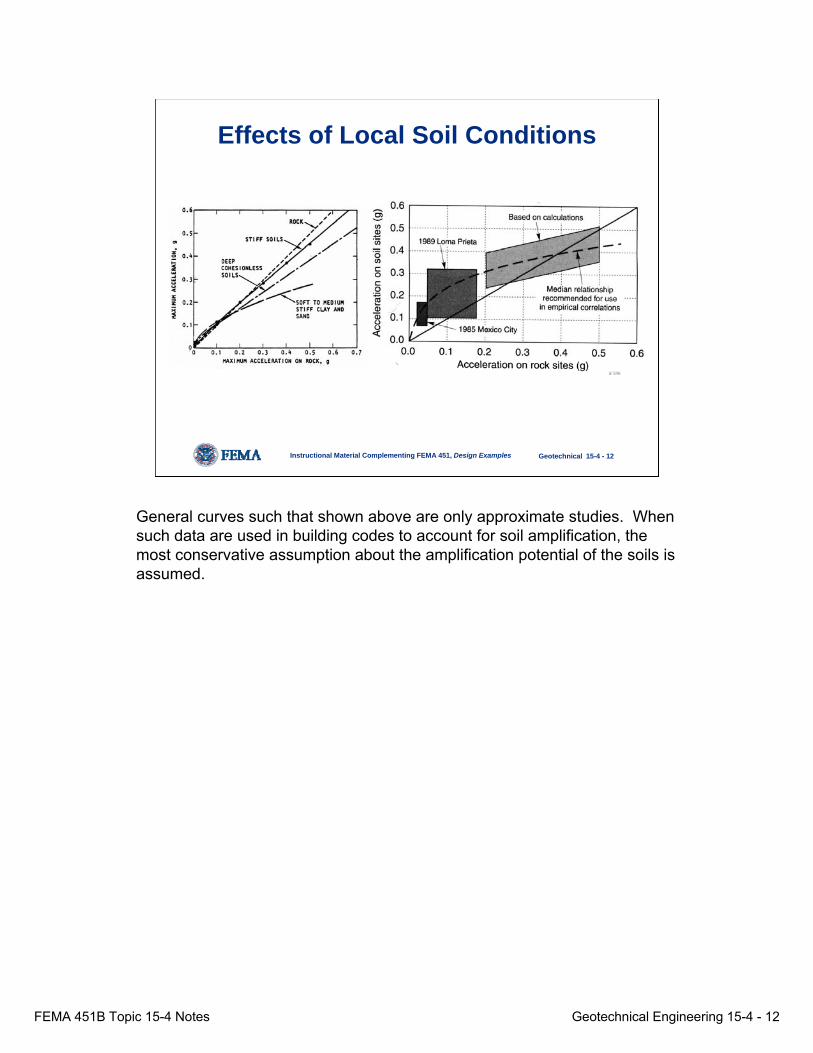
Effects of Local Soil Conditions
General curves such that shown above are only approximate studies. When such data are used in building codes to account for soil amplification, the most conservative assumption about the amplification potential of the soils is assumed.
FEMA 451B Topic 15-4 Notes Geotechnical Engineering 15-4 - 13
Instructional Material Complementing FEMA 451, Design Examples Geotechnical 15-4 - 13
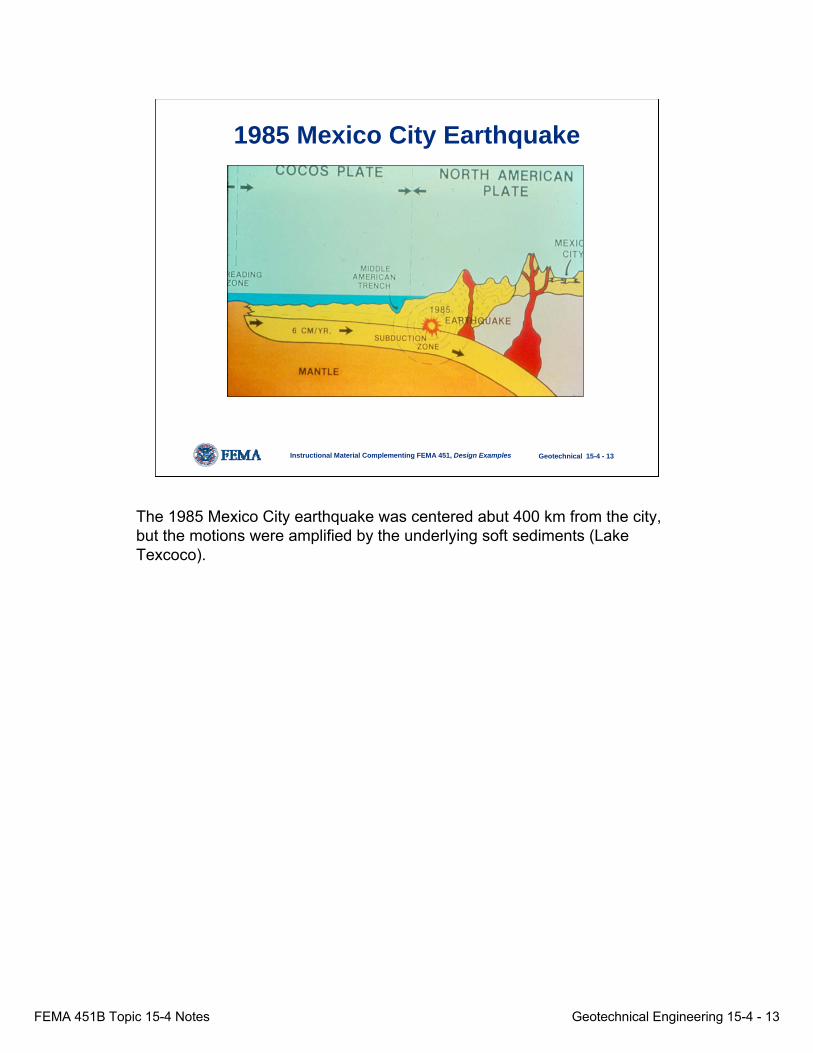
1985 Mexico City Earthquake
The 1985 Mexico City earthquake was centered abut 400 km from the city, but the motions were amplified by the underlying soft sediments (Lake Texcoco).
FEMA 451B Topic 15-4 Notes Geotechnical Engineering 15-4 - 14
Instructional Material Complementing FEMA 451, Design Examples Geotechnical 15-4 - 14
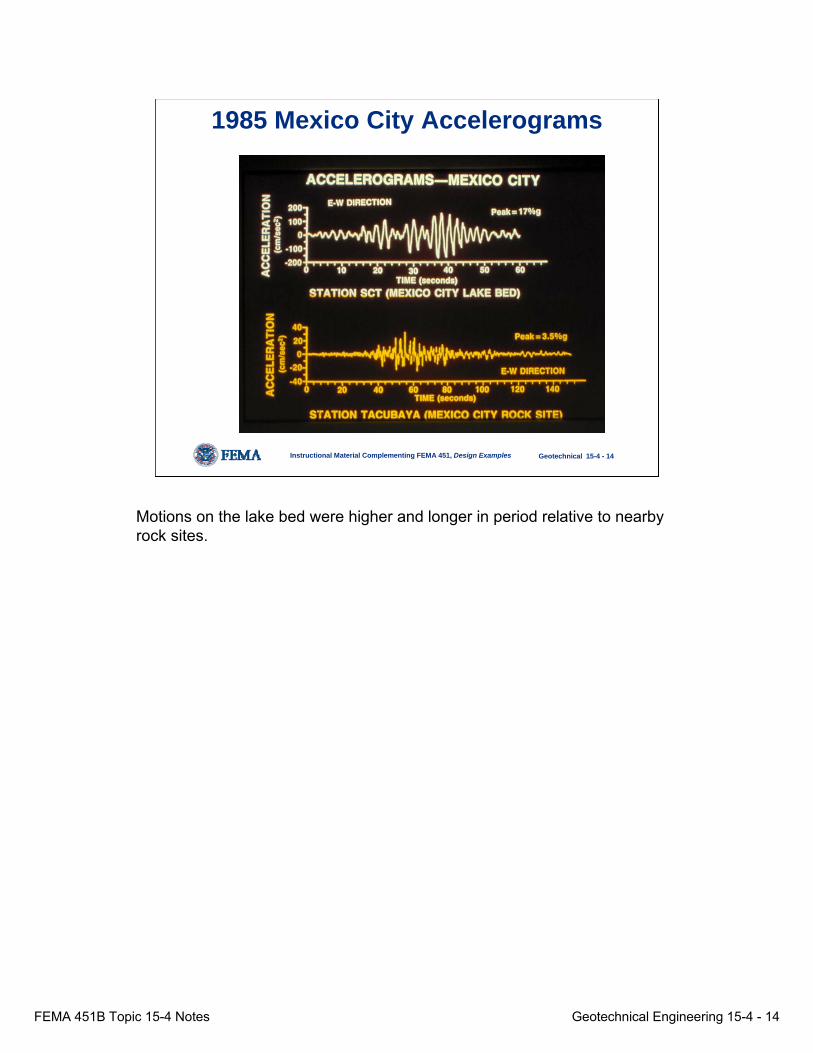
1985 Mexico City Accelerograms
Motions on the lake bed were higher and longer in period relative to nearby rock sites.
FEMA 451B Topic 15-4 Notes Geotechnical Engineering 15-4 - 15
Instructional Material Complementing FEMA 451, Design Examples Geotechnical 15-4 - 15
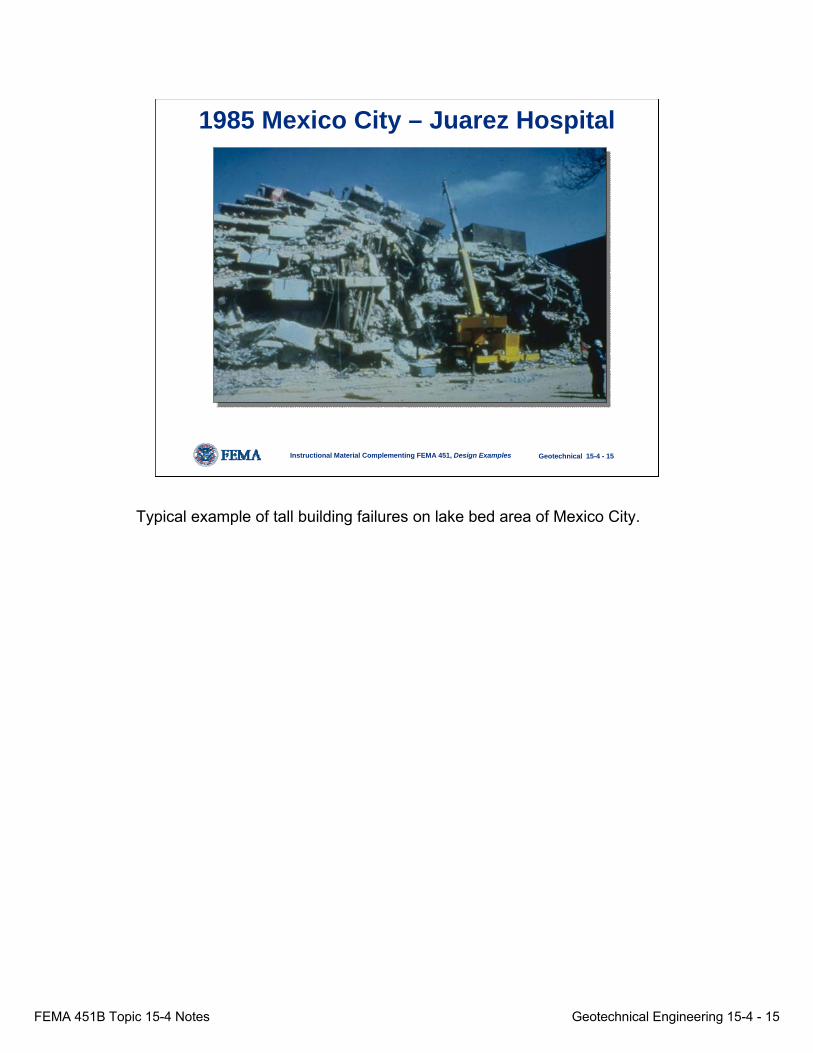
1985 Mexico City – Juarez Hospital
Typical example of tall building failures on lake bed area of Mexico City.
FEMA 451B Topic 15-4 Notes Geotechnical Engineering 15-4 - 16
Instructional Material Complementing FEMA 451, Design Examples Geotechnical 15-4 - 16
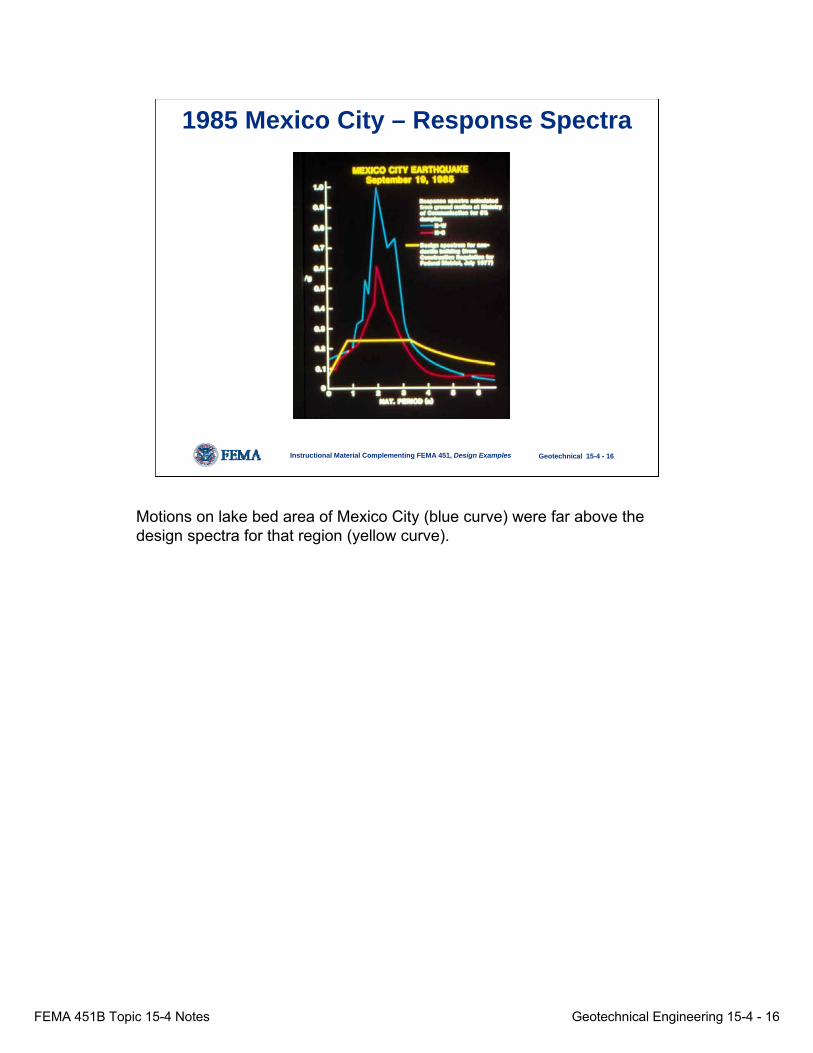
1985 Mexico City – Response Spectra
Motions on lake bed area of Mexico City (blue curve) were far above the design spectra for that region (yellow curve).
FEMA 451B Topic 15-4 Notes Geotechnical Engineering 15-4 - 17
Instructional Material Complementing FEMA 451, Design Examples Geotechnical 15-4 - 17
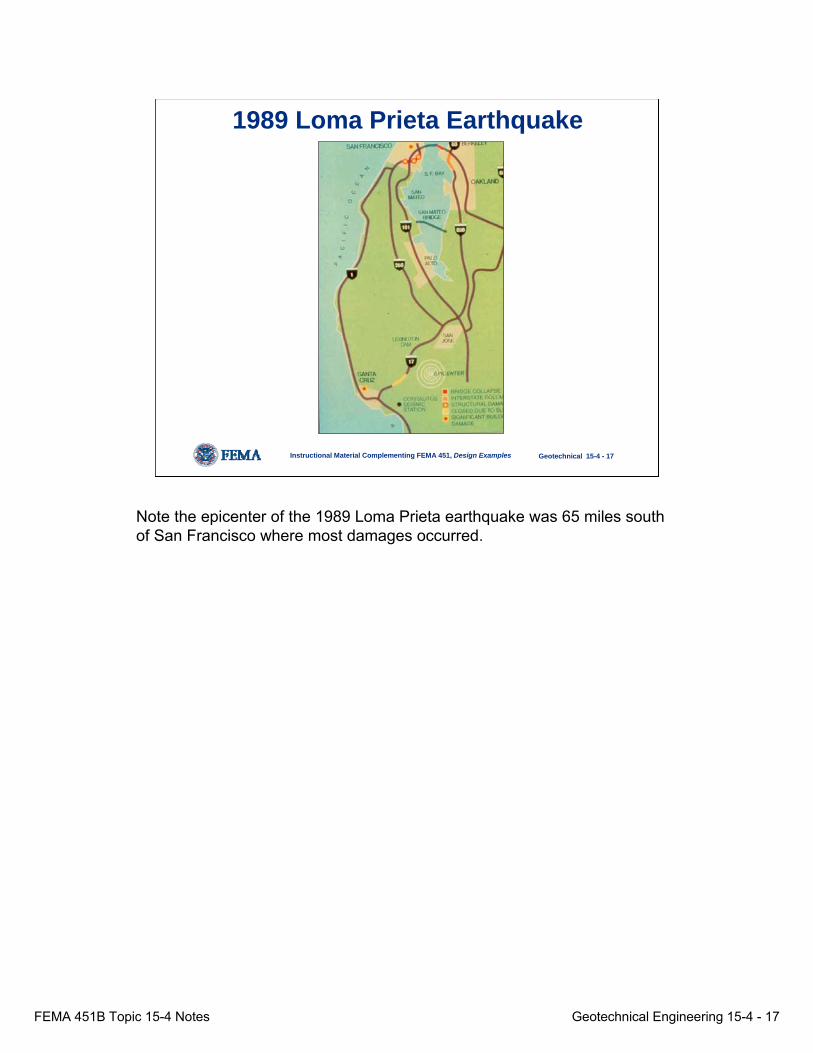
1989 Loma Prieta Earthquake
Note the epicenter of the 1989 Loma Prieta earthquake was 65 miles south of San Francisco where most damages occurred.
FEMA 451B Topic 15-4 Notes Geotechnical Engineering 15-4 - 18
Instructional Material Complementing FEMA 451, Design Examples Geotechnical 15-4 - 18
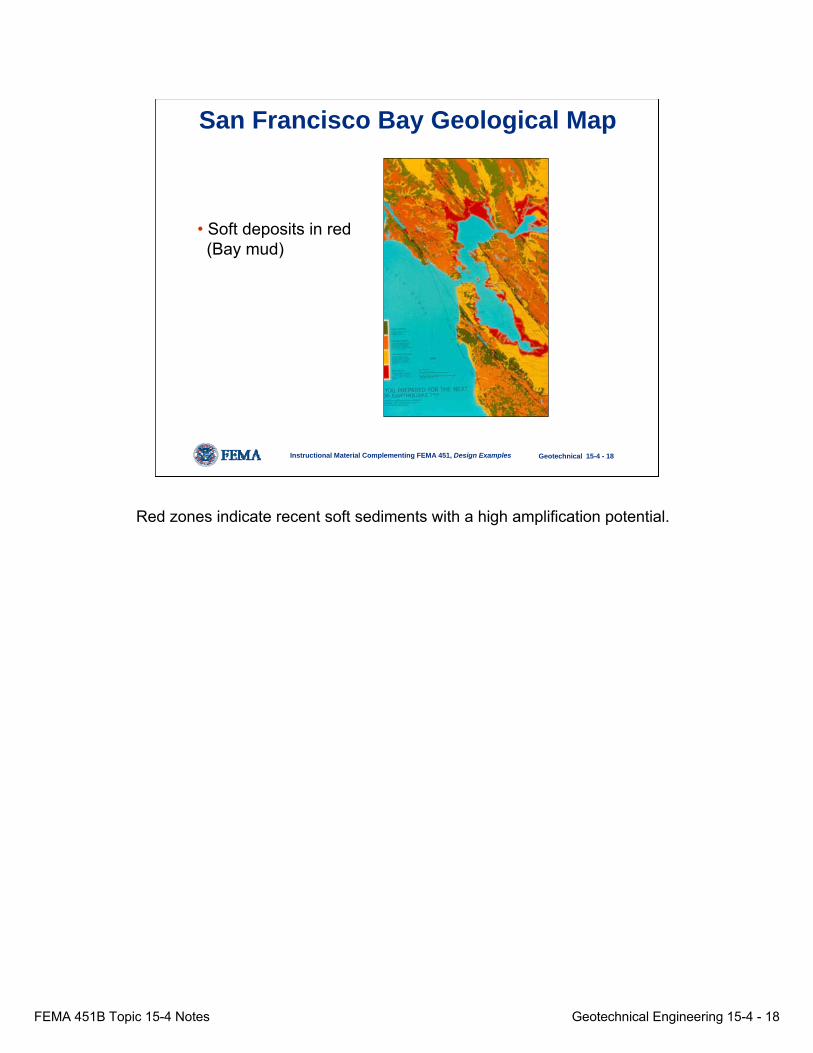
San Francisco Bay Geological Map
• Soft deposits in red (Bay mud)
Red zones indicate recent soft sediments with a high amplification potential.
FEMA 451B Topic 15-4 Notes Geotechnical Engineering 15-4 - 19
Instructional Material Complementing FEMA 451, Design Examples Geotechnical 15-4 - 19
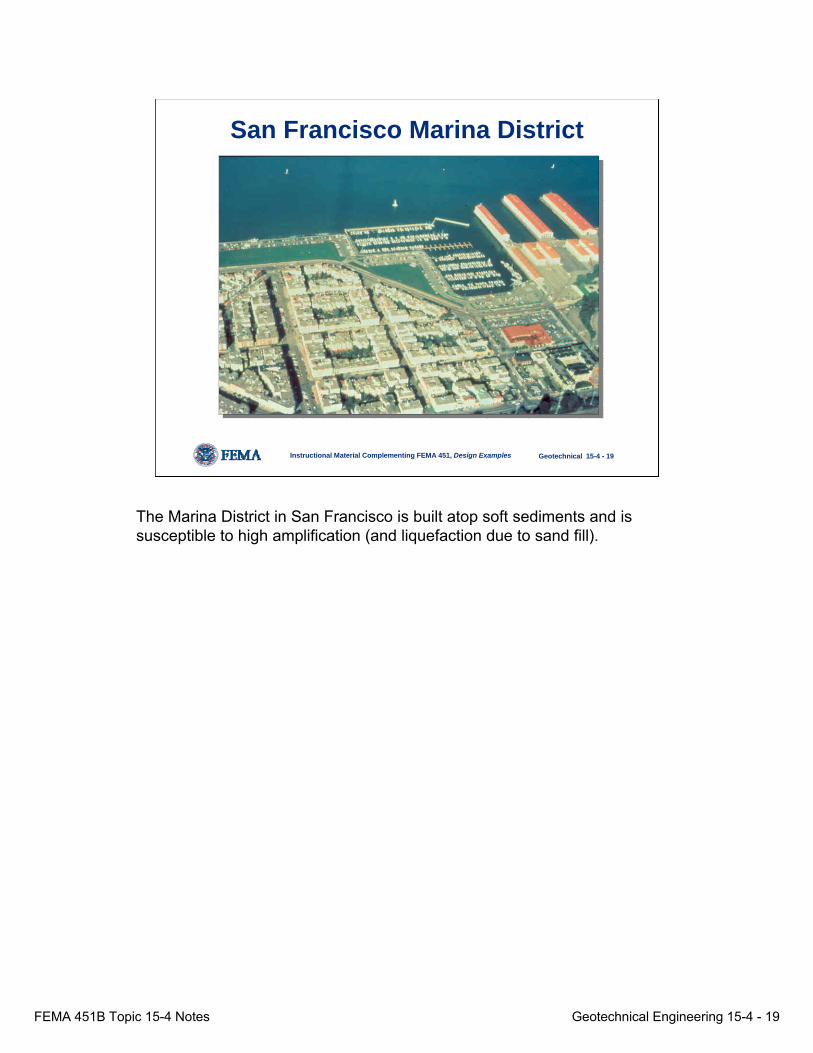
San Francisco Marina District
The Marina District in San Francisco is built atop soft sediments and is susceptible to high amplification (and liquefaction due to sand fill).
FEMA 451B Topic 15-4 Notes Geotechnical Engineering 15-4 - 20
Instructional Material Complementing FEMA 451, Design Examples Geotechnical 15-4 - 20
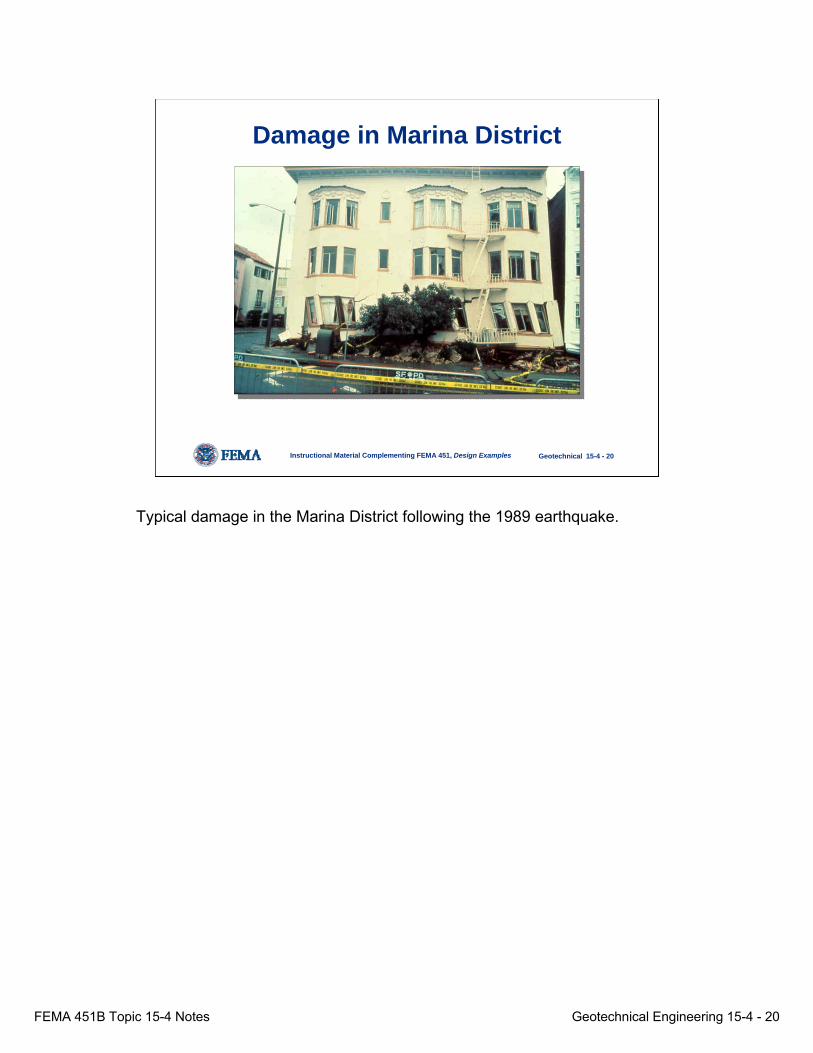
Damage in Marina District
Typical damage in the Marina District following the 1989 earthquake.
FEMA 451B Topic 15-4 Notes Geotechnical Engineering 15-4 - 21
Instructional Material Complementing FEMA 451, Design Examples Geotechnical 15-4 - 21
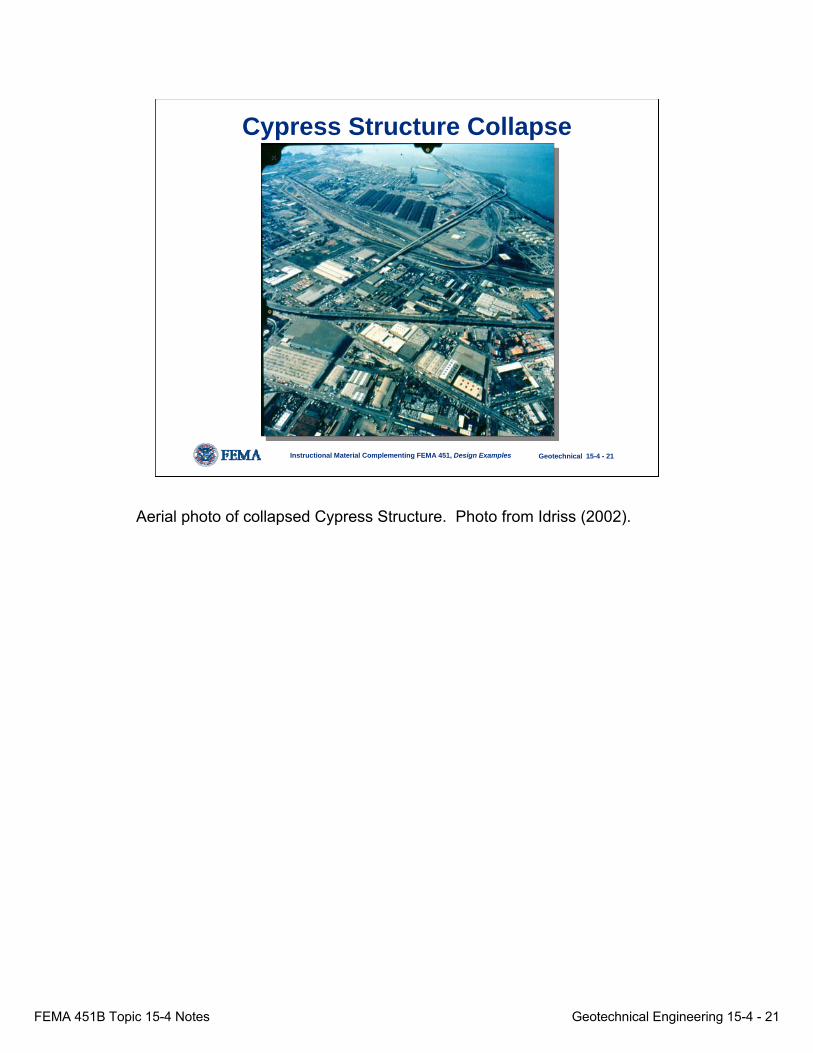
Cypress Structure Collapse
Aerial photo of collapsed Cypress Structure. Photo from Idriss (2002).
FEMA 451B Topic 15-4 Notes Geotechnical Engineering 15-4 - 22
Instructional Material Complementing FEMA 451, Design Examples Geotechnical 15-4 - 22
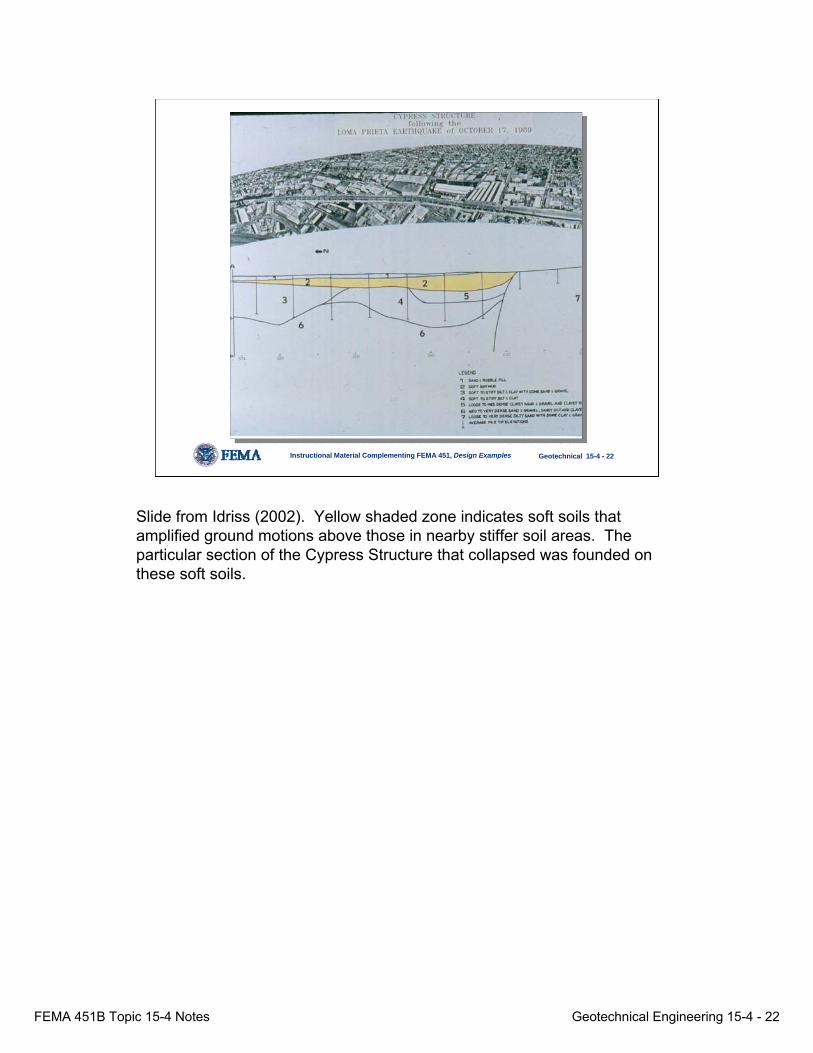
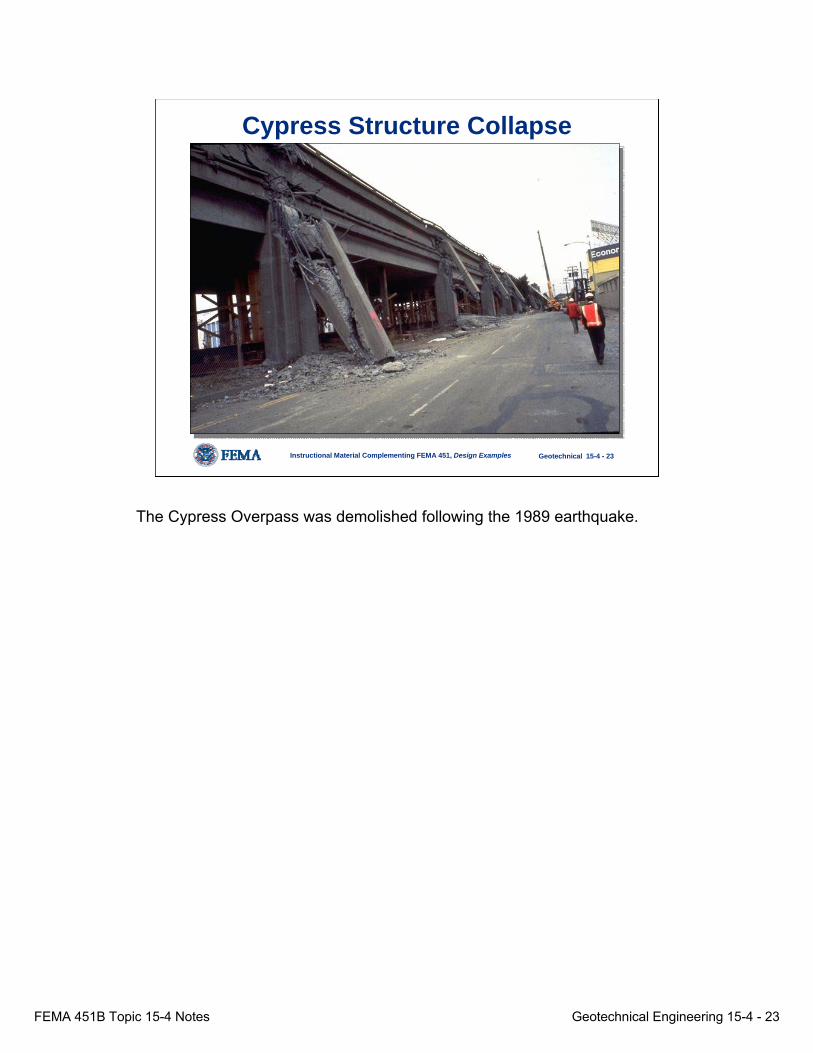
Slide from Idriss (2002). Yellow shaded zone indicates soft soils that amplified ground motions above those in nearby stiffer soil areas. The particular section of the Cypress Structure that collapsed was founded on these soft soils.
FEMA 451B Topic 15-4 Notes Geotechnical Engineering 15-4 - 23
Instructional Material Complementing FEMA 451, Design Examples Geotechnical 15-4 - 23
Cypress Structure Collapse
The Cypress Overpass was demolished following the 1989 earthquake.
FEMA 451B Topic 15-4 Notes Geotechnical Engineering 15-4 - 24
Instructional Material Complementing FEMA 451, Design Examples Geotechnical 15-4 - 24
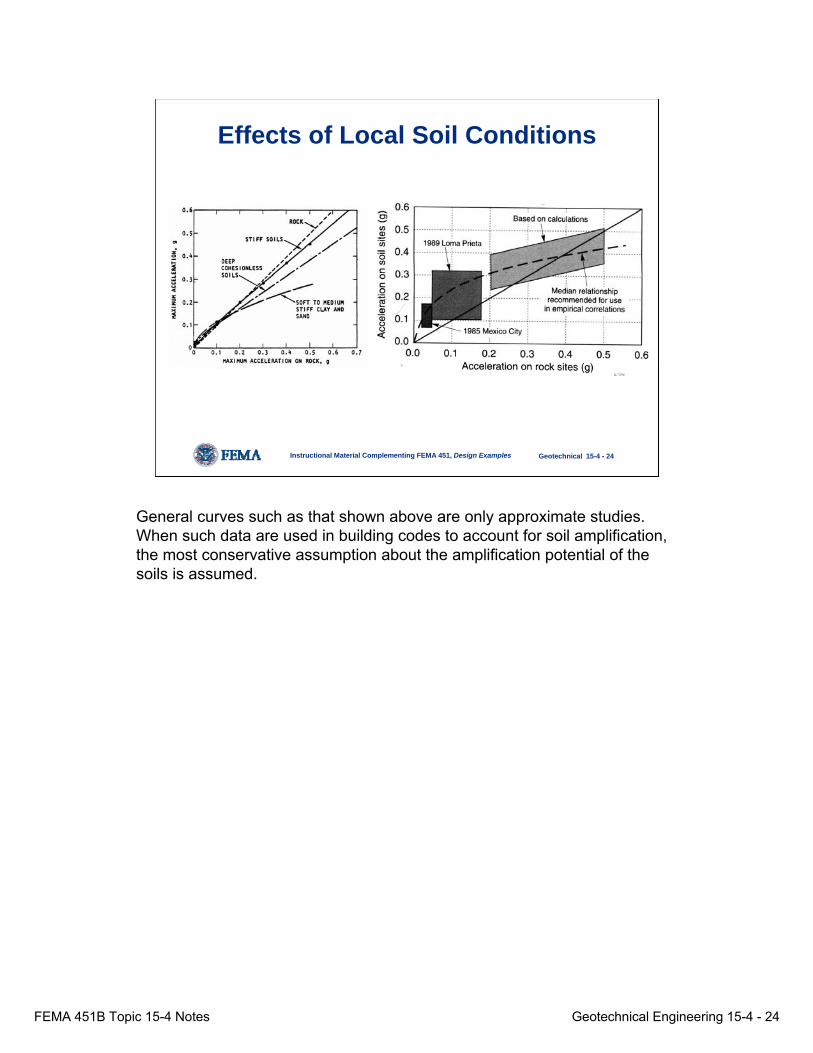
Effects of Local Soil Conditions
General curves such as that shown above are only approximate studies. When such data are used in building codes to account for soil amplification, the most conservative assumption about the amplification potential of the soils is assumed.
FEMA 451B Topic 15-4 Notes Geotechnical Engineering 15-4 - 25
Instructional Material Complementing FEMA 451, Design Examples Geotechnical 15-4 - 25
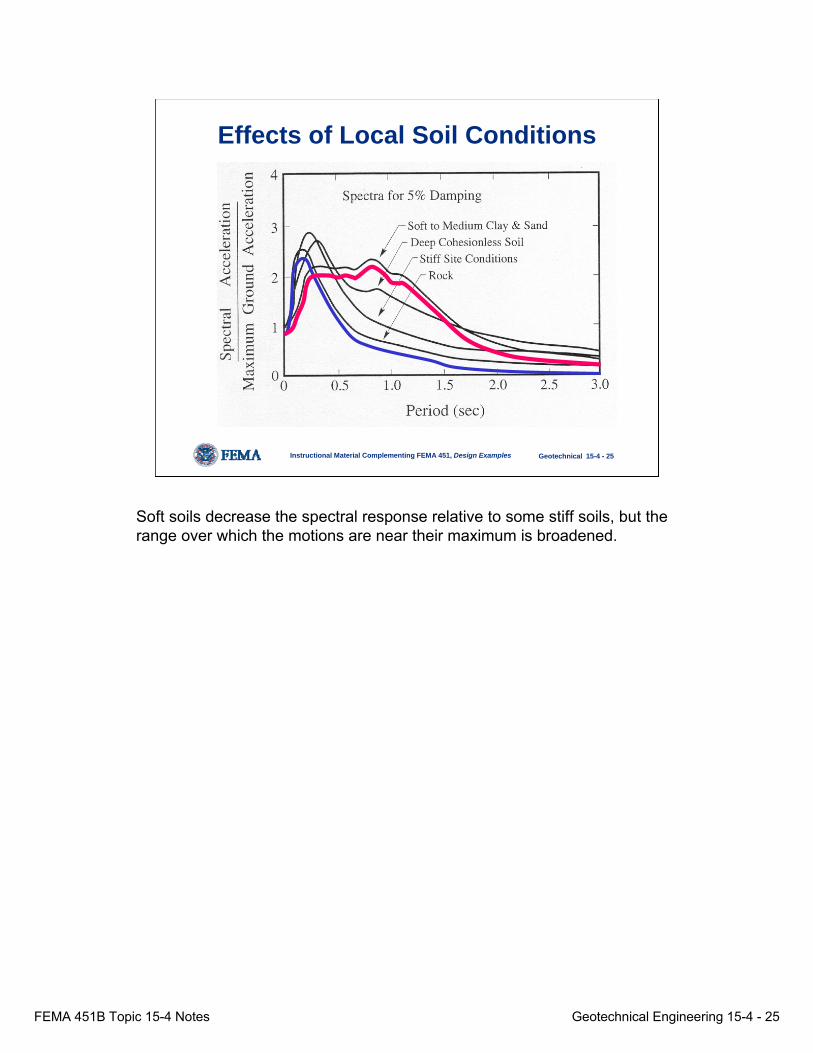
Effects of Local Soil Conditions
Soft soils decrease the spectral response relative to some stiff soils, but the range over which the motions are near their maximum is broadened.

FEMA 451B Topic 15-4 Notes Geotechnical Engineering 15-4 - 26
Instructional Material Complementing FEMA 451, Design Examples Geotechnical 15-4 - 26
Pre-Loma Prieta Design Spectra
Spectral design curves used prior to the 1989 Loma Prieta earthquake. Note the S4 design curve for soft soils. As will be shown in the following slide, the motions from the 1989 quake greatly exceed the design spectrum being used at the time. The slide was developed from Treasure Island, a deep soft soil site. This prompted the development of Category F for such soils that require site-specific analysis instead of simplified analysis (see following slides from IBC 2003 procedure).
FEMA 451B Topic 15-4 Notes Geotechnical Engineering 15-4 - 27
Instructional Material Complementing FEMA 451, Design Examples Geotechnical 15-4 - 27
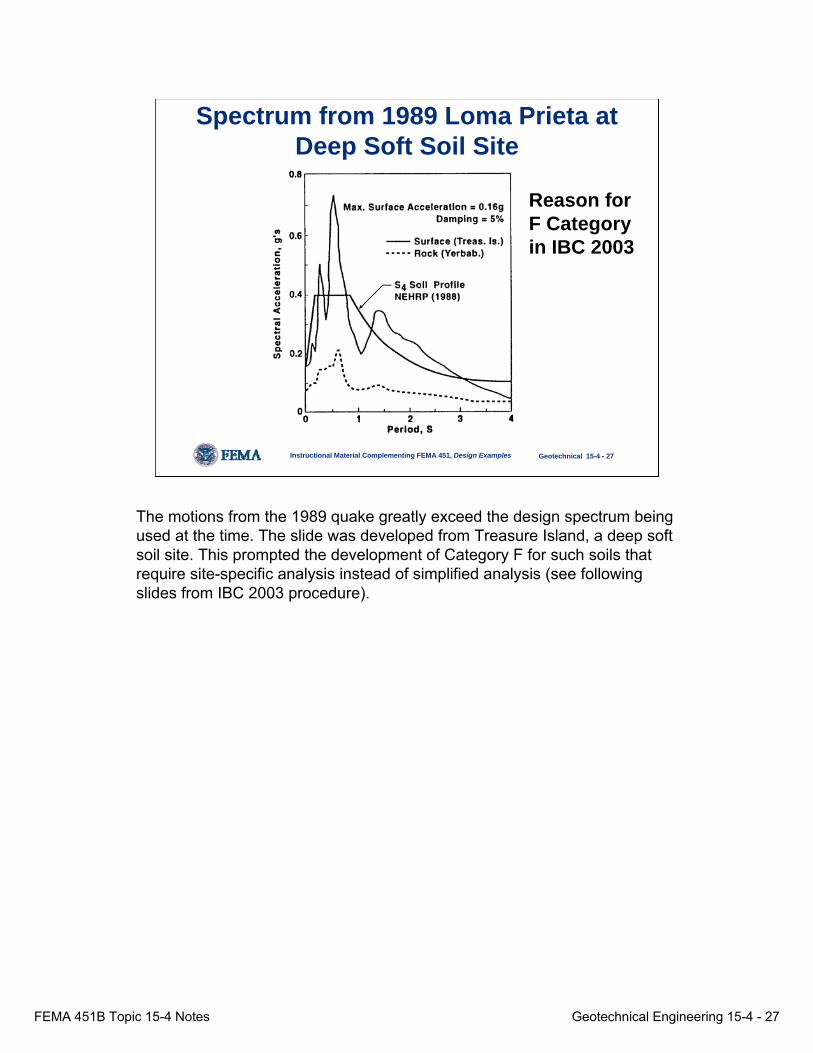
Spectrum from 1989 Loma Prieta at Deep Soft Soil Site
Reason for F Category in IBC 2003
The motions from the 1989 quake greatly exceed the design spectrum being used at the time. The slide was developed from Treasure Island, a deep soft soil site. This prompted the development of Category F for such soils that require site-specific analysis instead of simplified analysis (see following slides from IBC 2003 procedure).
FEMA 451B Topic 15-4 Notes Geotechnical Engineering 15-4 - 28
Instructional Material Complementing FEMA 451, Design Examples Geotechnical 15-4 - 28
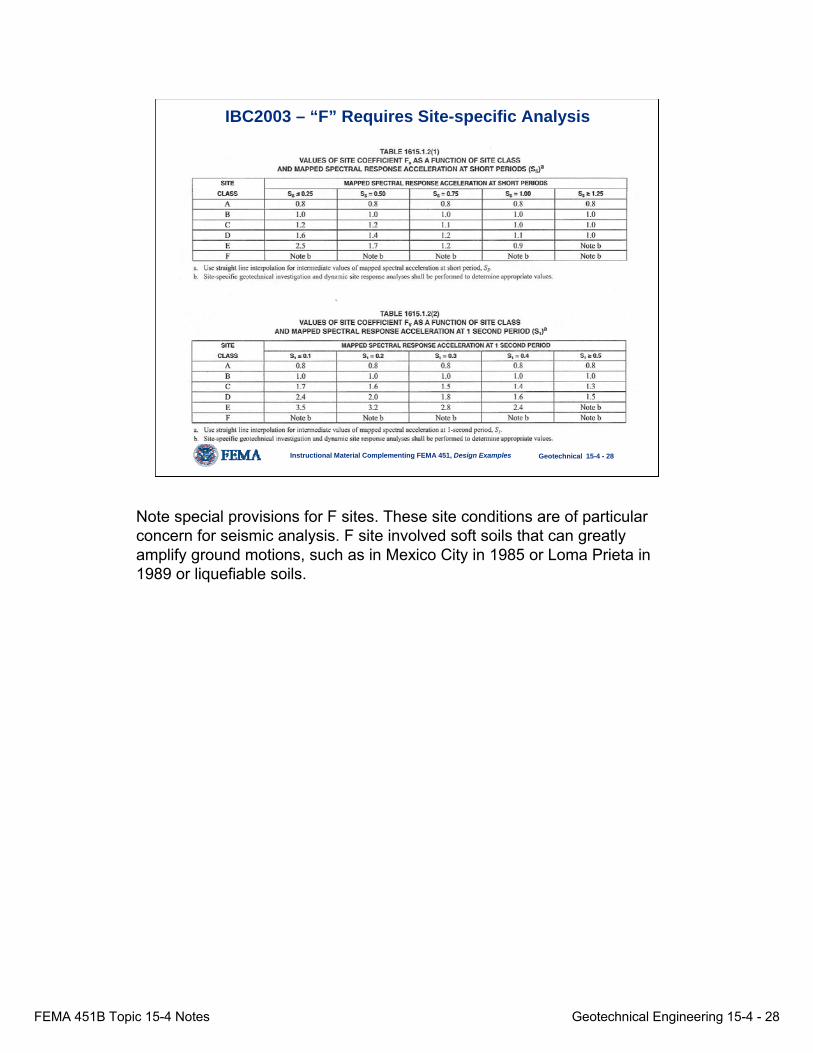
IBC2003 – “F” Requires Site-specific Analysis
Note special provisions for F sites. These site conditions are of particular concern for seismic analysis. F site involved soft soils that can greatly amplify ground motions, such as in Mexico City in 1985 or Loma Prieta in 1989 or liquefiable soils.

FEMA 451B Topic 15-4 Notes Geotechnical Engineering 15-4 - 29
Instructional Material Complementing FEMA 451, Design Examples Geotechnical 15-4 - 29
IBC2003 – “F” Requires Site-specific Analysis
• Determine site class based on top 30 m:
Note special provisions for F sites. These site conditions are of particular concern for seismic analysis. F site involved soft soils that can greatly amplify ground motions, such as in Mexico City in 1985 or Loma Prieta in 1989 or liquefiable soils. Site classification with IBC 2003 is a very important issue. However, this procedure does not work well for highly stratified sites.
FEMA 451B Topic 15-4 Notes Geotechnical Engineering 15-4 - 30
Instructional Material Complementing FEMA 451, Design Examples Geotechnical 15-4 - 30
0.00
0.50
1.00
1.50
2.00
2.50
3.00
0.00 0.25 0.50 0.75 1.00 1.25 1.50Short Period Spectral Accel. Ss (g’s)
Am
plifi
catio
n Fa
ABCDE
Site Class
0.00
0.50
1.00
1.50
2.00
2.50
3.00
3.50
4.00
0.00 0.25 0.50 0.75 1.00 1.25 1.50Long Period Spectral Accel. S1 (g’s)
Am
plifi
catio
n Fv
ABCDE
Site Class
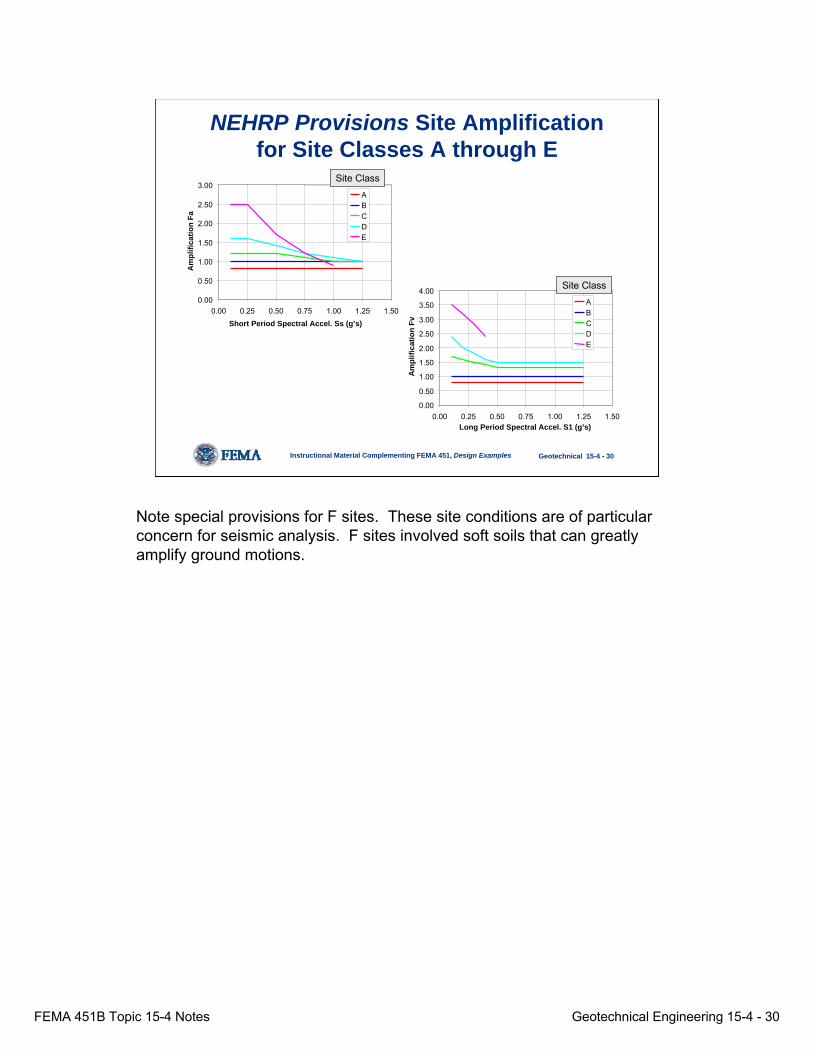
NEHRP Provisions Site Amplificationfor Site Classes A through E
Note special provisions for F sites. These site conditions are of particular concern for seismic analysis. F sites involved soft soils that can greatly amplify ground motions.
FEMA 451B Topic 15-4 Notes Geotechnical Engineering 15-4 - 31
Instructional Material Complementing FEMA 451, Design Examples Geotechnical 15-4 - 31
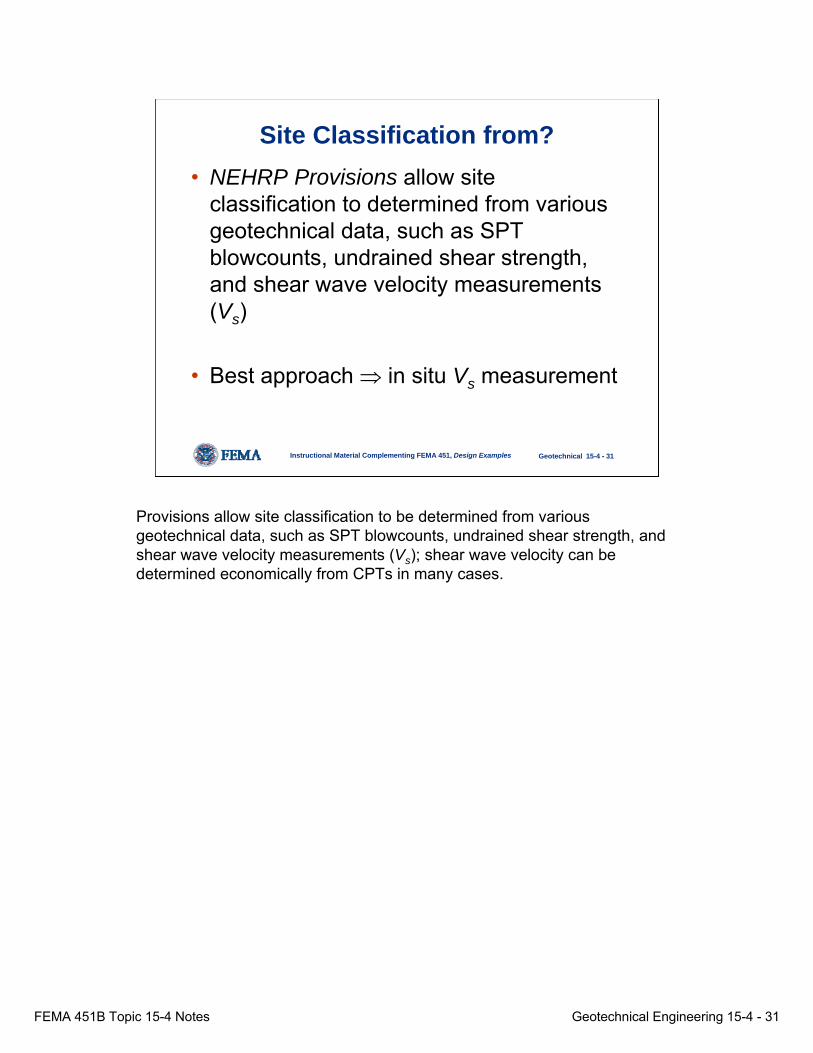
Site Classification from?• NEHRP Provisions allow site
classification to determined from various geotechnical data, such as SPT blowcounts, undrained shear strength, and shear wave velocity measurements (Vs)
• Best approach ⇒ in situ Vs measurement
Provisions allow site classification to be determined from various geotechnical data, such as SPT blowcounts, undrained shear strength, and shear wave velocity measurements (Vs); shear wave velocity can be determined economically from CPTs in many cases.
FEMA 451B Topic 15-4 Notes Geotechnical Engineering 15-4 - 32
Instructional Material Complementing FEMA 451, Design Examples Geotechnical 15-4 - 32
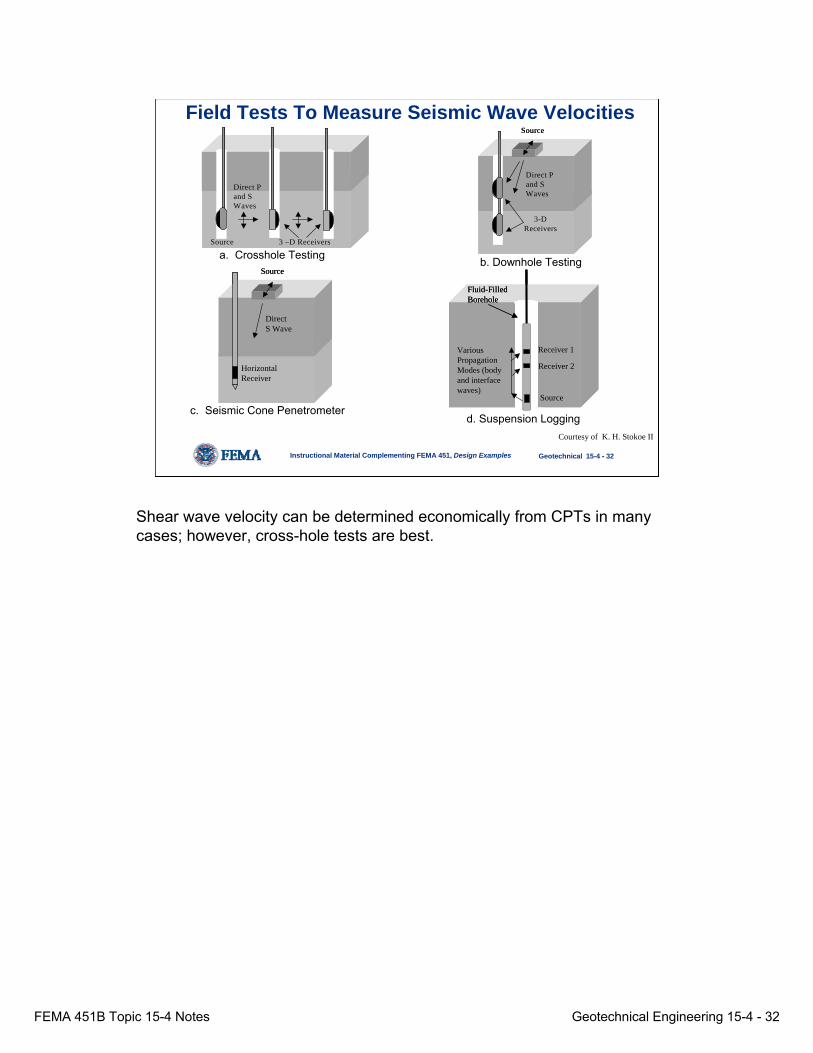
Field Tests To Measure Seismic Wave Velocities
Source 3 –D Receivers
Direct P and S Waves
Source 3 –D Receivers
Direct P and S Waves
Source
Direct P and S Waves
3-DReceivers
Source
Direct P and S Waves
3-DReceivers
Source
Horizontal Receiver
Direct S Wave
Source
Horizontal Receiver
Direct S Wave
b. Downhole Testing Arrangement
Various Propagation Modes (body and interface waves)
Receiver 1
Source
Receiver 2
Fluid-Filled Borehole
b. Downhole Testing Arrangement
Various Propagation Modes (body and interface waves)
Receiver 1
Source
Receiver 2
Fluid-Filled BoreholeFluid-Filled Borehole
a. Crosshole Testing b. Downhole Testing
d. Suspension Loggingc. Seismic Cone Penetrometer
Courtesy of K. H. Stokoe II
Shear wave velocity can be determined economically from CPTs in many cases; however, cross-hole tests are best.
FEMA 451B Topic 15-4 Notes Geotechnical Engineering 15-4 - 33
Instructional Material Complementing FEMA 451, Design Examples Geotechnical 15-4 - 33
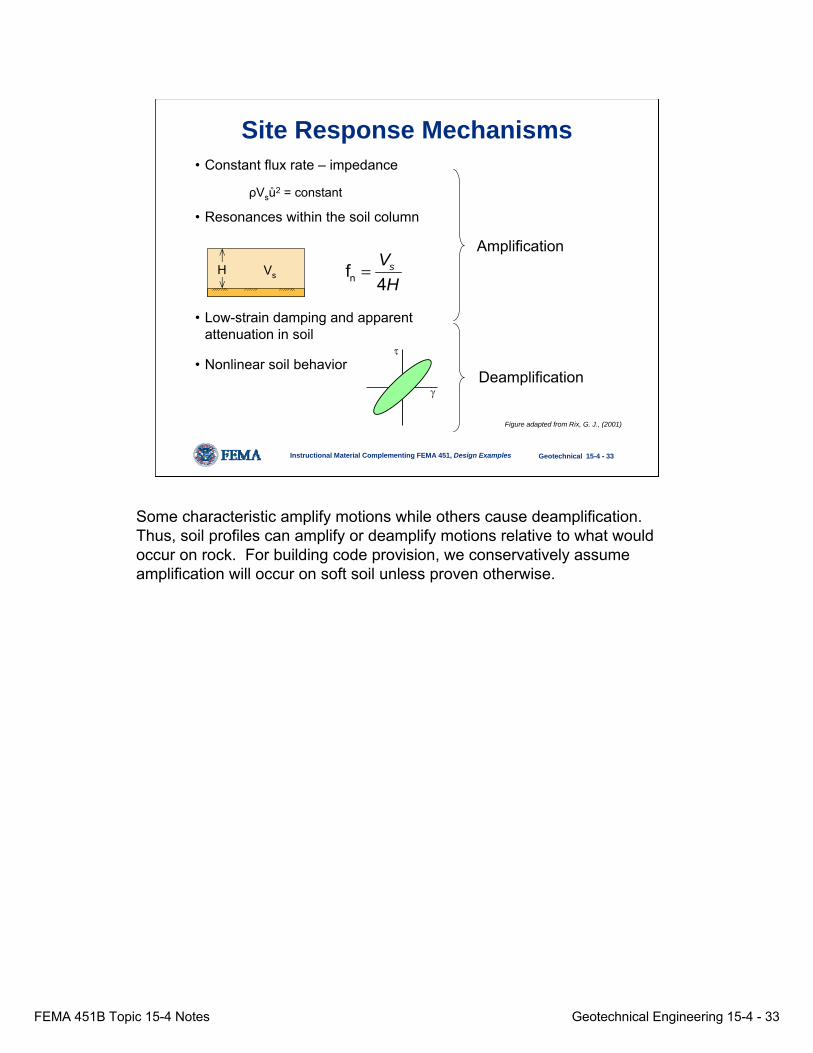
Site Response Mechanisms• Constant flux rate – impedance
• Resonances within the soil column
• Low-strain damping and apparent attenuation in soil
• Nonlinear soil behavior
nf 4sVH
=
τ
γ
Amplification
Deamplification
H Vs
Figure adapted from Rix, G. J., (2001)
ρVsů2 = constant
Some characteristic amplify motions while others cause deamplification. Thus, soil profiles can amplify or deamplify motions relative to what would occur on rock. For building code provision, we conservatively assume amplification will occur on soft soil unless proven otherwise.
FEMA 451B Topic 15-4 Notes Geotechnical Engineering 15-4 - 34
Instructional Material Complementing FEMA 451, Design Examples Geotechnical 15-4 - 34
Site Response Analysis - Two Steps
(1) Modeling the soil profile
(2) Calculating the site-modified time histories or other motions at various level within the profile, typically, at the ground surface
None.

FEMA 451B Topic 15-4 Notes Geotechnical Engineering 15-4 - 35
Instructional Material Complementing FEMA 451, Design Examples Geotechnical 15-4 - 35
(1) Modeling the Soil Profile• The stratigraphy and dynamic properties (dynamic
moduli and damping characteristics) of the soil profile are modeled.
• If soil depth is reasonably constant beneath the structure and the soil layers and ground surface reasonably flat, then a one-dimensional analysis can be used.
• Two- or three-dimensional models of the site can be used where above conditions are not met.
• Unless soil properties are well constrained a range of properties should be defined for the soil layers to account for uncertainties.
In modeling soil profiles, it is important to remember that unless soil properties are well constrained, a range of properties should be defined for the soil layers to account for uncertainties.
FEMA 451B Topic 15-4 Notes Geotechnical Engineering 15-4 - 36
Instructional Material Complementing FEMA 451, Design Examples Geotechnical 15-4 - 36
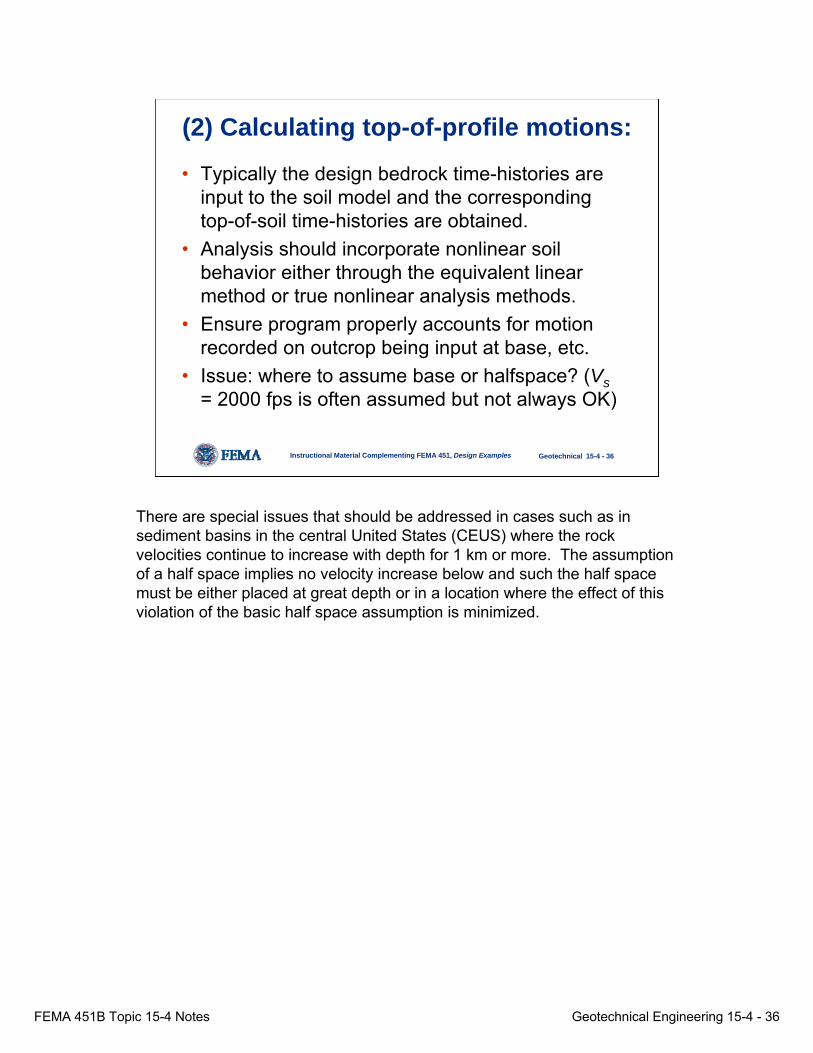
(2) Calculating top-of-profile motions:
• Typically the design bedrock time-histories are input to the soil model and the corresponding top-of-soil time-histories are obtained.
• Analysis should incorporate nonlinear soil behavior either through the equivalent linear method or true nonlinear analysis methods.
• Ensure program properly accounts for motion recorded on outcrop being input at base, etc.
• Issue: where to assume base or halfspace? (Vs= 2000 fps is often assumed but not always OK)
There are special issues that should be addressed in cases such as in sediment basins in the central United States (CEUS) where the rock velocities continue to increase with depth for 1 km or more. The assumption of a half space implies no velocity increase below and such the half space must be either placed at great depth or in a location where the effect of this violation of the basic half space assumption is minimized.
FEMA 451B Topic 15-4 Notes Geotechnical Engineering 15-4 - 37
Instructional Material Complementing FEMA 451, Design Examples Geotechnical 15-4 - 37
Site Response Analysis Techniques
•Linear analyses
•Quarter-wavelength approximation
•Equivalent linear analyses
•Nonlinear analyses
None.
FEMA 451B Topic 15-4 Notes Geotechnical Engineering 15-4 - 38
Instructional Material Complementing FEMA 451, Design Examples Geotechnical 15-4 - 38
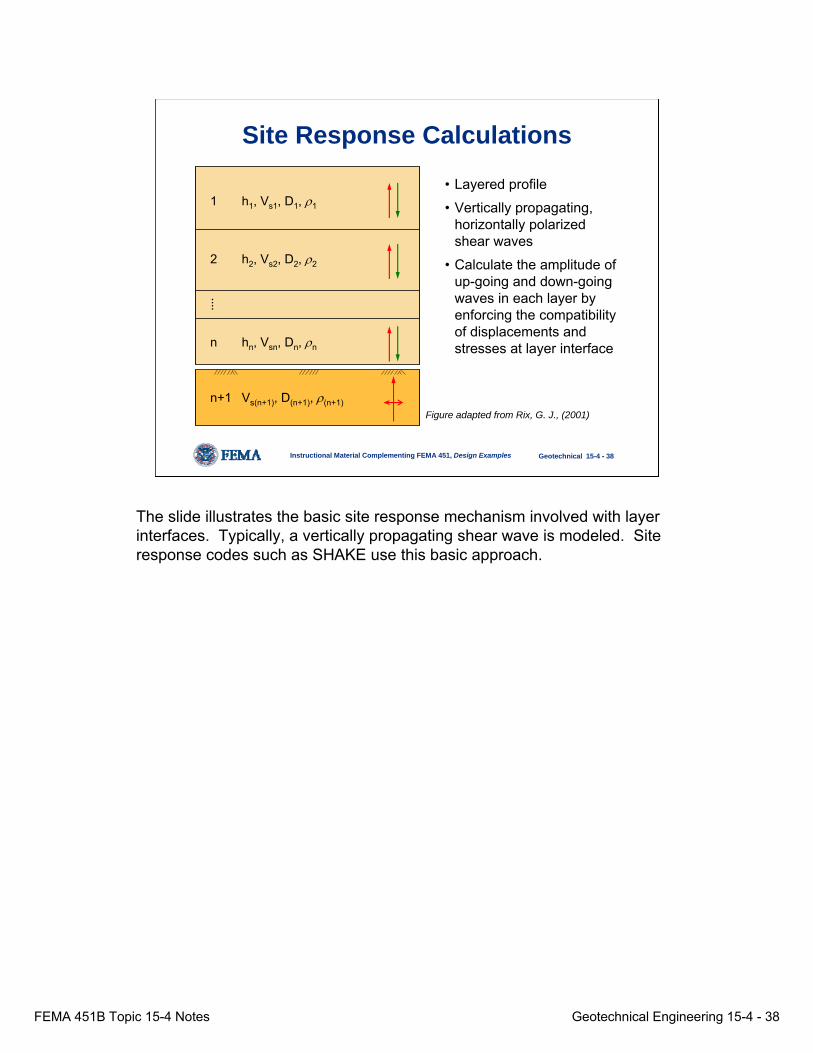
Site Response Calculations
• Layered profile
• Vertically propagating, horizontally polarized shear waves
• Calculate the amplitude of up-going and down-going waves in each layer by enforcing the compatibility of displacements and stresses at layer interface
1 h1, Vs1, D1, ρ1
n hn, Vsn, Dn, ρn
2 h2, Vs2, D2, ρ2
n+1 Vs(n+1), D(n+1), ρ(n+1)Figure adapted from Rix, G. J., (2001)
The slide illustrates the basic site response mechanism involved with layer interfaces. Typically, a vertically propagating shear wave is modeled. Site response codes such as SHAKE use this basic approach.
FEMA 451B Topic 15-4 Notes Geotechnical Engineering 15-4 - 39
Instructional Material Complementing FEMA 451, Design Examples Geotechnical 15-4 - 39
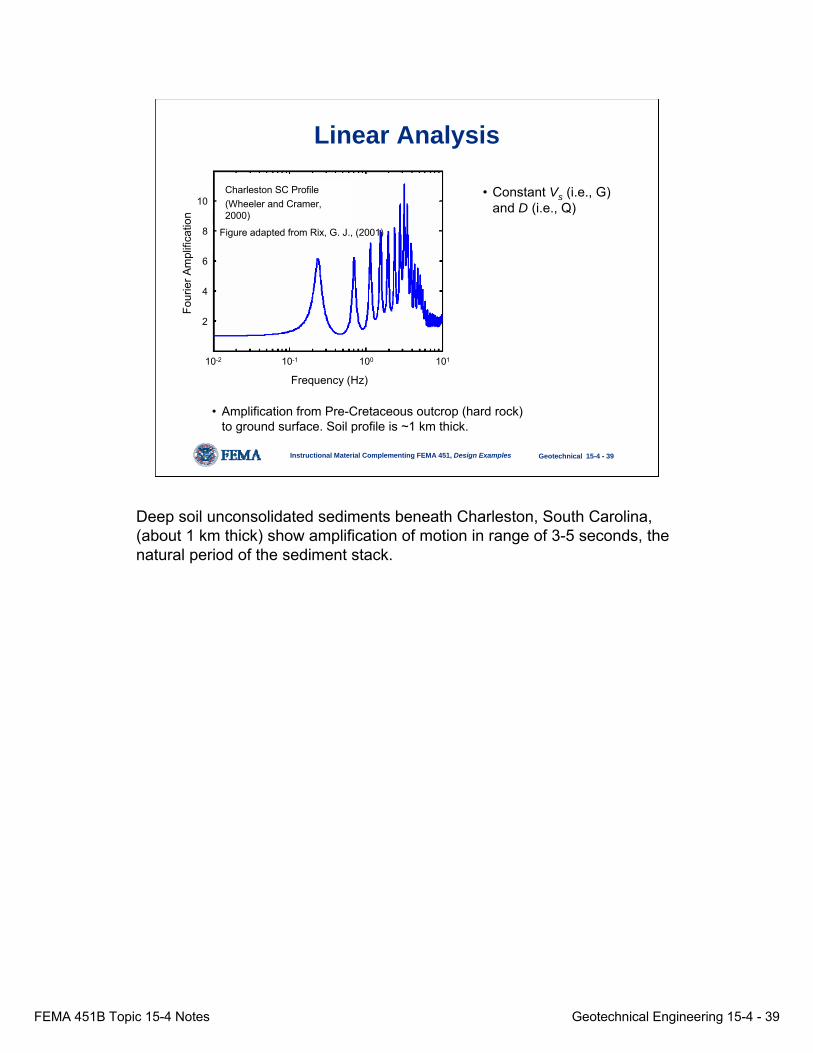
Linear Analysis
Frequency (Hz)
Charleston SC Profile(Wheeler and Cramer, 2000)
10-2 10-1 100 101
2
4
6
8
10Fo
urie
r Am
plifi
catio
n• Constant Vs (i.e., G)
and D (i.e., Q)
• Amplification from Pre-Cretaceous outcrop (hard rock) to ground surface. Soil profile is ~1 km thick.
Figure adapted from Rix, G. J., (2001)
Deep soil unconsolidated sediments beneath Charleston, South Carolina, (about 1 km thick) show amplification of motion in range of 3-5 seconds, the natural period of the sediment stack.
FEMA 451B Topic 15-4 Notes Geotechnical Engineering 15-4 - 40
Instructional Material Complementing FEMA 451, Design Examples Geotechnical 15-4 - 40
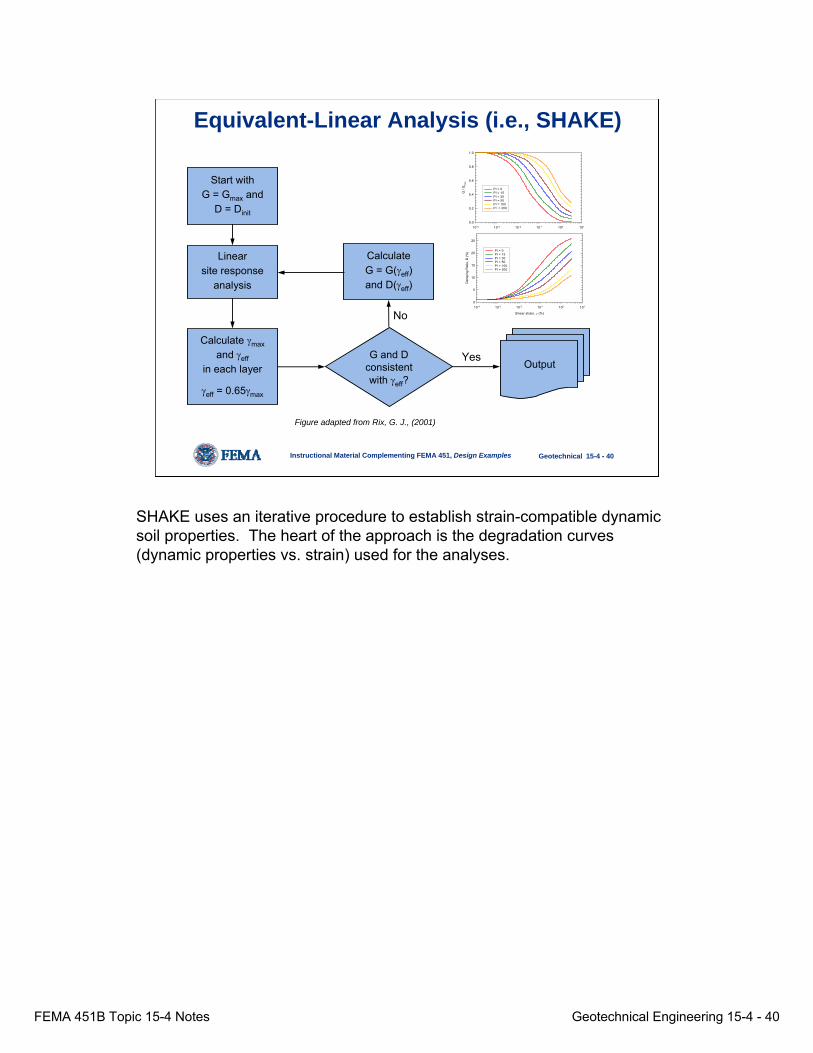
Equivalent-Linear Analysis (i.e., SHAKE)
Start withG = Gmax and
D = Dinit
Output
Linearsite response
analysis
Calculate γmaxand γeff
in each layer
γeff = 0.65γmax
G and Dconsistentwith γeff?
Calculate G = G(γeff)and D(γeff)
No
Yes
Shear strain, γ (%)
10-4 10-3 10-2 10-1 100 101
Dam
ping
Rat
io, D
(%)
0
5
10
15
20
25
PI = 0PI = 15PI = 30PI = 50PI = 100PI = 200
10-4 10-3 10-2 10-1 100 101
G /
Gm
ax
0.0
0.2
0.4
0.6
0.8
1.0
PI = 0PI = 15PI = 30PI = 50PI = 100PI = 200
Figure adapted from Rix, G. J., (2001)
SHAKE uses an iterative procedure to establish strain-compatible dynamic soil properties. The heart of the approach is the degradation curves (dynamic properties vs. strain) used for the analyses.
FEMA 451B Topic 15-4 Notes Geotechnical Engineering 15-4 - 41
Instructional Material Complementing FEMA 451, Design Examples Geotechnical 15-4 - 41
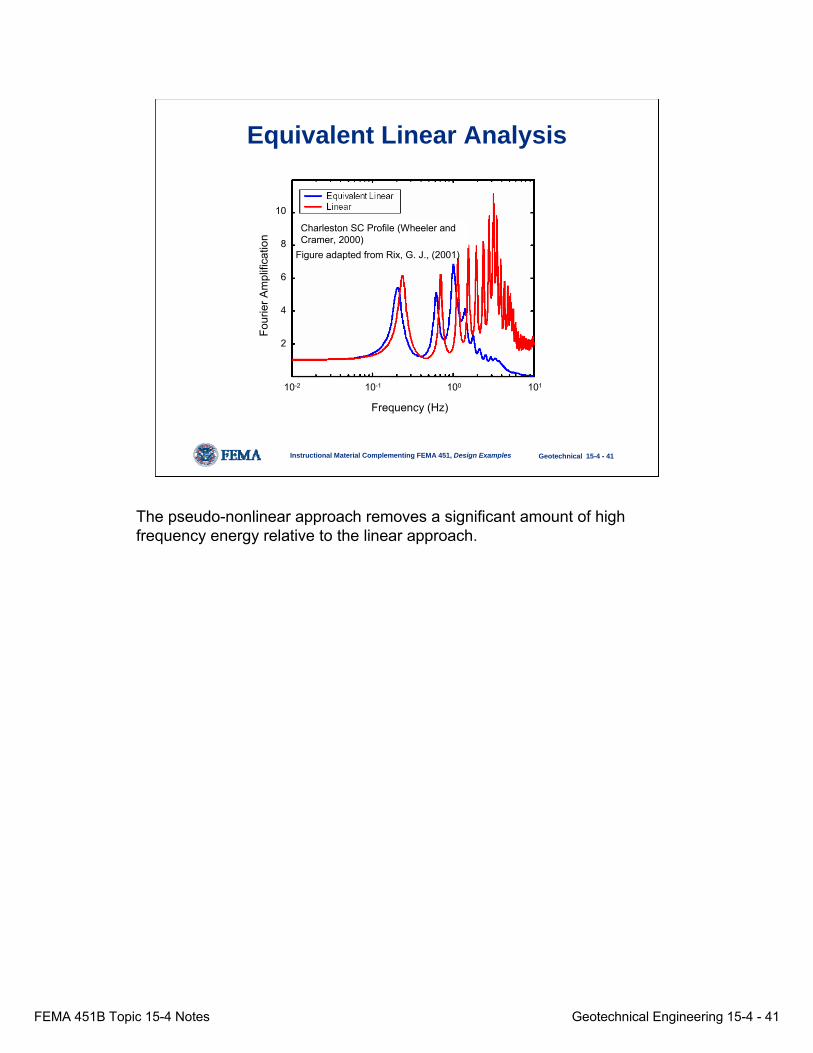
Equivalent Linear Analysis
Frequency (Hz)
10-2 10-1 100 101
2
4
6
8
10
Four
ier A
mpl
ifica
tion
Charleston SC Profile (Wheeler and Cramer, 2000)
Figure adapted from Rix, G. J., (2001)
The pseudo-nonlinear approach removes a significant amount of high frequency energy relative to the linear approach.
FEMA 451B Topic 15-4 Notes Geotechnical Engineering 15-4 - 42
Instructional Material Complementing FEMA 451, Design Examples Geotechnical 15-4 - 42
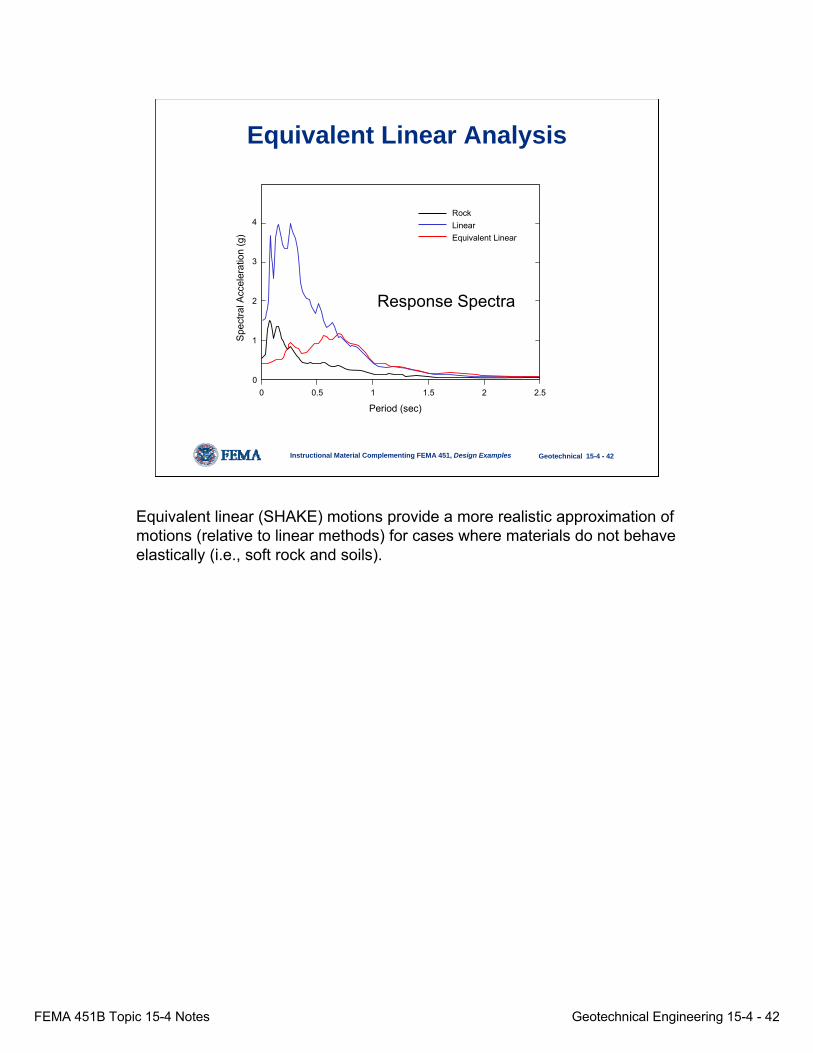
Equivalent Linear Analysis
0
Period (sec)0.5 1 1.5 2 2.5
1
2
3
4
Spec
tral A
ccel
erat
ion
(g)
0
RockLinearEquivalent Linear
Response Spectra
Equivalent linear (SHAKE) motions provide a more realistic approximation of motions (relative to linear methods) for cases where materials do not behave elastically (i.e., soft rock and soils).
FEMA 451B Topic 15-4 Notes Geotechnical Engineering 15-4 - 43
Instructional Material Complementing FEMA 451, Design Examples Geotechnical 15-4 - 43
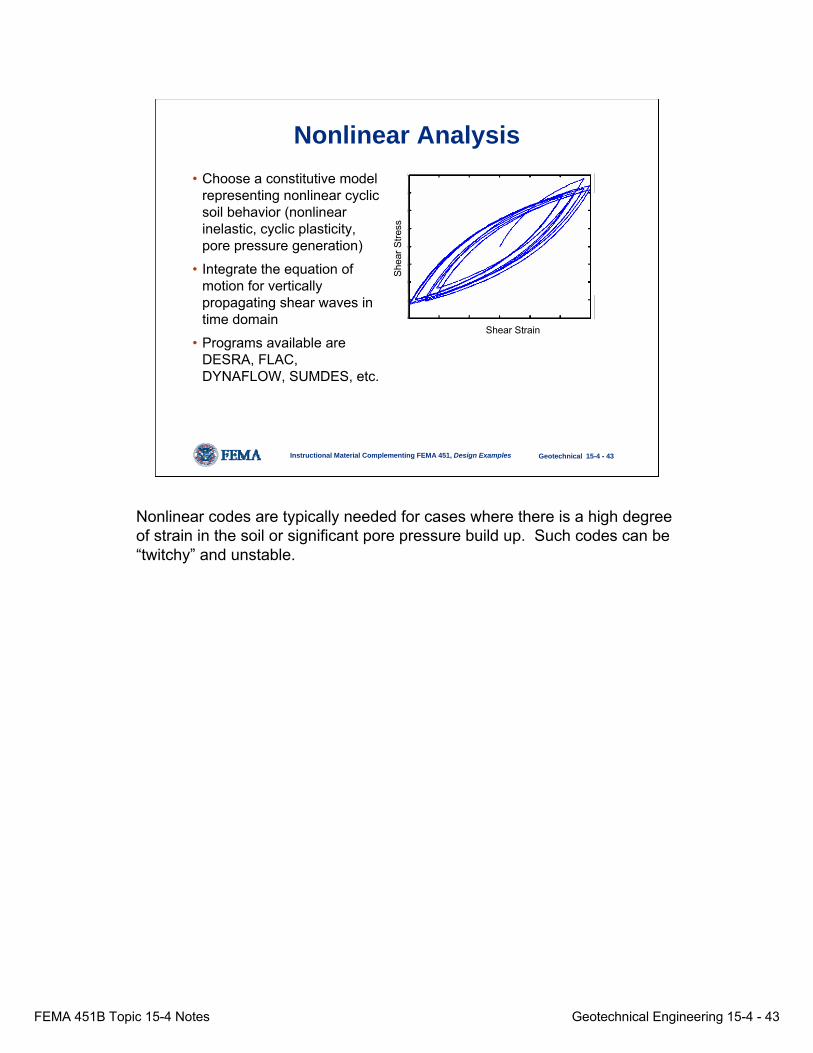
Nonlinear Analysis
Shear Strain
She
ar S
tress
• Choose a constitutive model representing nonlinear cyclic soil behavior (nonlinear inelastic, cyclic plasticity, pore pressure generation)
• Integrate the equation of motion for vertically propagating shear waves in time domain
• Programs available are DESRA, FLAC, DYNAFLOW, SUMDES, etc.
Nonlinear codes are typically needed for cases where there is a high degree of strain in the soil or significant pore pressure build up. Such codes can be “twitchy” and unstable.
FEMA 451B Topic 15-4 Notes Geotechnical Engineering 15-4 - 44
Instructional Material Complementing FEMA 451, Design Examples Geotechnical 15-4 - 44
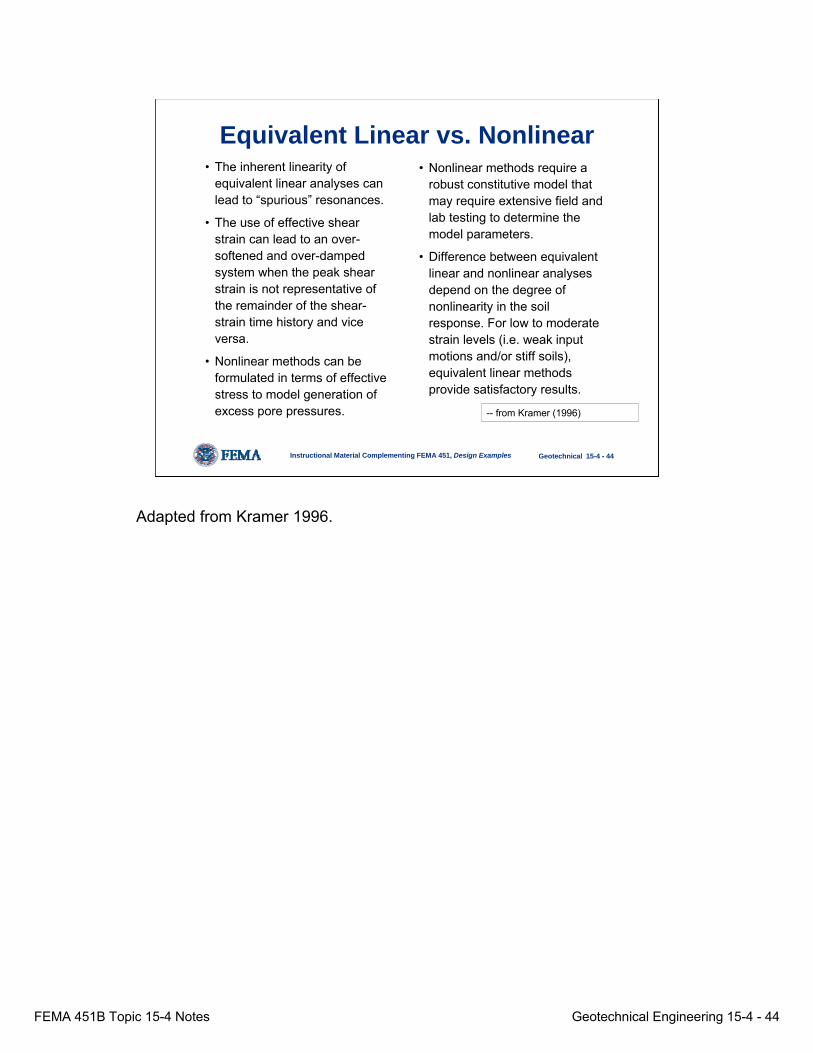
Equivalent Linear vs. Nonlinear• The inherent linearity of
equivalent linear analyses can lead to “spurious” resonances.
• The use of effective shear strain can lead to an over-softened and over-damped system when the peak shear strain is not representative of the remainder of the shear-strain time history and vice versa.
• Nonlinear methods can be formulated in terms of effective stress to model generation of excess pore pressures.
• Nonlinear methods require a robust constitutive model that may require extensive field and lab testing to determine the model parameters.
• Difference between equivalent linear and nonlinear analyses depend on the degree of nonlinearity in the soil response. For low to moderate strain levels (i.e. weak input motions and/or stiff soils), equivalent linear methods provide satisfactory results.
-- from Kramer (1996)
Adapted from Kramer 1996.
FEMA 451B Topic 15-4 Notes Geotechnical Engineering 15-4 - 45
Instructional Material Complementing FEMA 451, Design Examples Geotechnical 15-4 - 45
Site Response Analysis Codes
A. One-dimensional equivalent-linear codes:
• SHAKE (Schnabel, Seed, and Lysmer 1972; Idriss and Sun 1992)
• WESHAKE (Sykora, Wahl, and Wallace 1992);
SHAKE is the most widely used equivalent linear code to predict motions within and atop layered soil profiles.
FEMA 451B Topic 15-4 Notes Geotechnical Engineering 15-4 - 46
Instructional Material Complementing FEMA 451, Design Examples Geotechnical 15-4 - 46
Site Response Analysis Codes
B. One-dimensional nonlinear codes:
• DESRA-2 (Lee and Finn 1978), DESRA-MUSC (Qiu1998)
• SUMDES (Li, Wang, and Shen 1992) • MARDES (Chang et al. 1990) • D-MOD (Matasovic 1993)• TESS (Pyke 1992)
Again, nonlinear codes are typically needed for cases where there is a high degree of strain in the soil or significant pore pressure build up. Such codes can be “twitchy” and unstable.
FEMA 451B Topic 15-4 Notes Geotechnical Engineering 15-4 - 47
Instructional Material Complementing FEMA 451, Design Examples Geotechnical 15-4 - 47
Site Response Analysis Codes
C. 2-D and 3-D equivalent linear codes:
• FLUSH (2-D) (Lysmer et al. 1975) • QUAD4M (Hudson, Idriss, and Beikae 1994) • SASSI (2-D or 3-D) (Lysmer et al. 1991)
Two-dimensional codes are used for cases that cannot be modeled in a one-dimensional fashion, such as an earth dam.
FEMA 451B Topic 15-4 Notes Geotechnical Engineering 15-4 - 48
Instructional Material Complementing FEMA 451, Design Examples Geotechnical 15-4 - 48
Dynamic Soil Properties
τ
γ
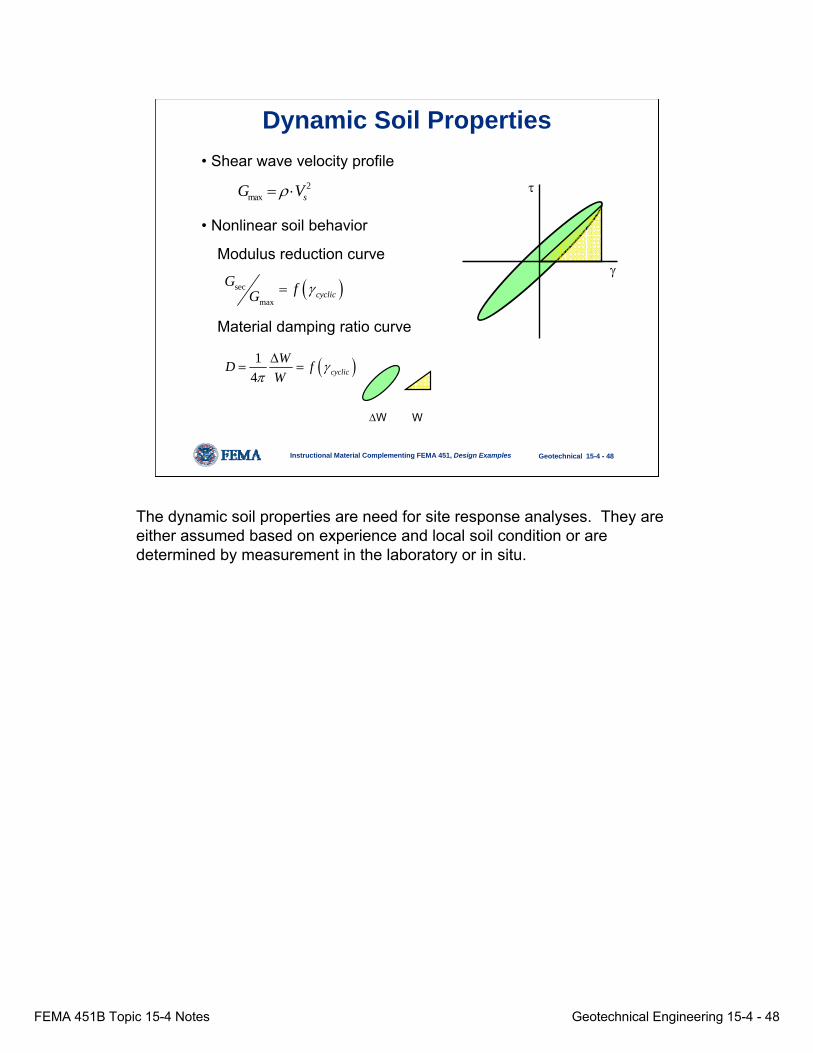
• Shear wave velocity profile
• Nonlinear soil behavior
Modulus reduction curve
Material damping ratio curve
2max sG Vρ= ⋅
( )sec
maxcyclic
G fG γ=
( )14 cyclic
WD fW
γπΔ
= =
WΔW
The dynamic soil properties are need for site response analyses. They are either assumed based on experience and local soil condition or are determined by measurement in the laboratory or in situ.
FEMA 451B Topic 15-4 Notes Geotechnical Engineering 15-4 - 49
Instructional Material Complementing FEMA 451, Design Examples Geotechnical 15-4 - 49
Laboratory Methods
•Resonant column
•Torsional shear
•Cyclic simple shear
•Cyclic triaxial
•Bender elements
A number of laboratory methods are used to determine dynamic soil properties. Low-strain damping is usually more difficult to determine in the laboratory.
FEMA 451B Topic 15-4 Notes Geotechnical Engineering 15-4 - 50
Instructional Material Complementing FEMA 451, Design Examples Geotechnical 15-4 - 50
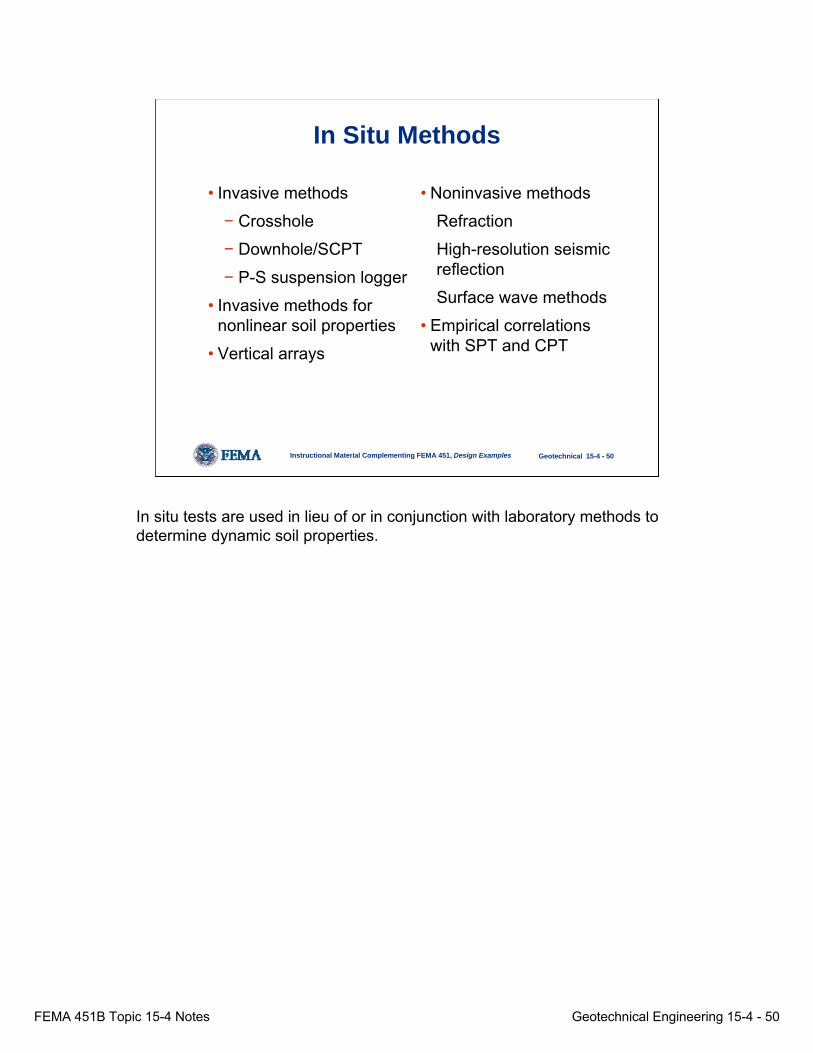
In Situ Methods
• Invasive methods
− Crosshole
− Downhole/SCPT
− P-S suspension logger
• Invasive methods for nonlinear soil properties
• Vertical arrays
• Noninvasive methods
Refraction
High-resolution seismic reflection
Surface wave methods
• Empirical correlations with SPT and CPT
In situ tests are used in lieu of or in conjunction with laboratory methods to determine dynamic soil properties.
FEMA 451B Topic 15-4 Notes Geotechnical Engineering 15-4 - 51
Instructional Material Complementing FEMA 451, Design Examples Geotechnical 15-4 - 51
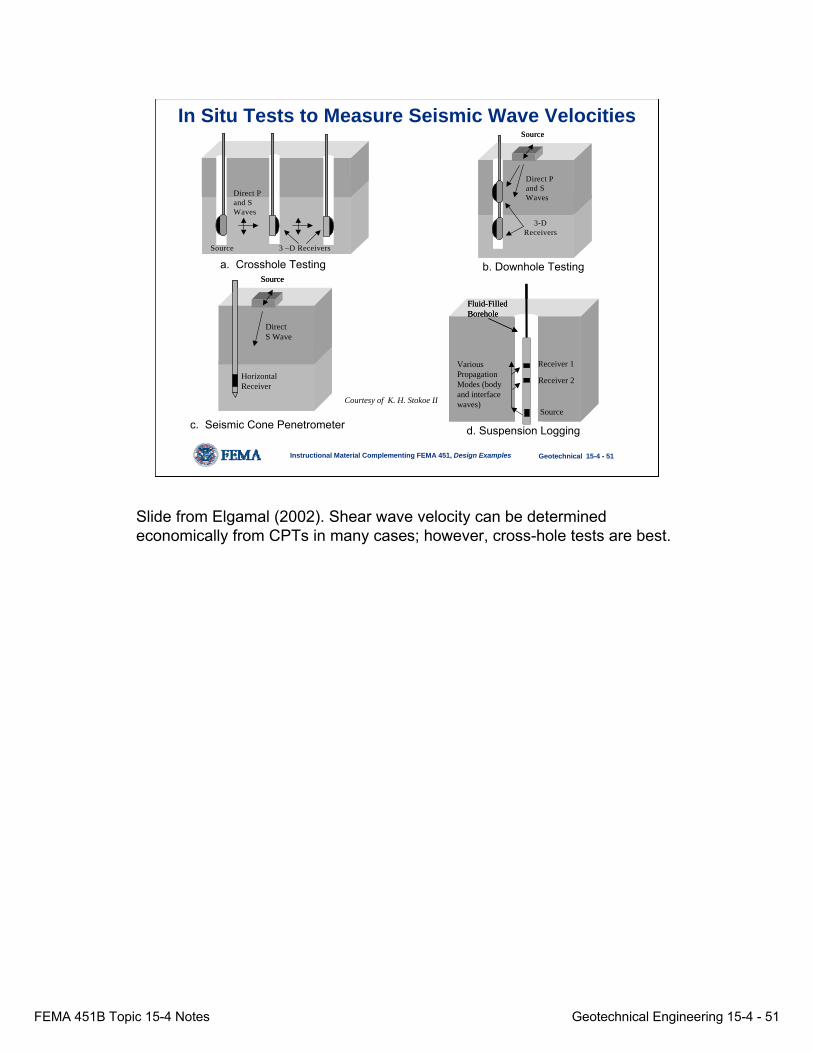
In Situ Tests to Measure Seismic Wave Velocities
Source 3 –D Receivers
Direct P and S Waves
Source 3 –D Receivers
Direct P and S Waves
Source
Direct P and S Waves
3-DReceivers
Source
Direct P and S Waves
3-DReceivers
Source
Horizontal Receiver
Direct S Wave
Source
Horizontal Receiver
Direct S Wave b. Downhole Testing Arrangement
Various Propagation Modes (body and interface waves)
Receiver 1
Source
Receiver 2
Fluid-Filled Borehole
b. Downhole Testing Arrangement
Various Propagation Modes (body and interface waves)
Receiver 1
Source
Receiver 2
Fluid-Filled BoreholeFluid-Filled Borehole
a. Crosshole Testing b. Downhole Testing
d. Suspension Loggingc. Seismic Cone Penetrometer
Courtesy of K. H. Stokoe II
Slide from Elgamal (2002). Shear wave velocity can be determined economically from CPTs in many cases; however, cross-hole tests are best.
FEMA 451B Topic 15-4 Notes Geotechnical Engineering 15-4 - 52
Instructional Material Complementing FEMA 451, Design Examples Geotechnical 15-4 - 52
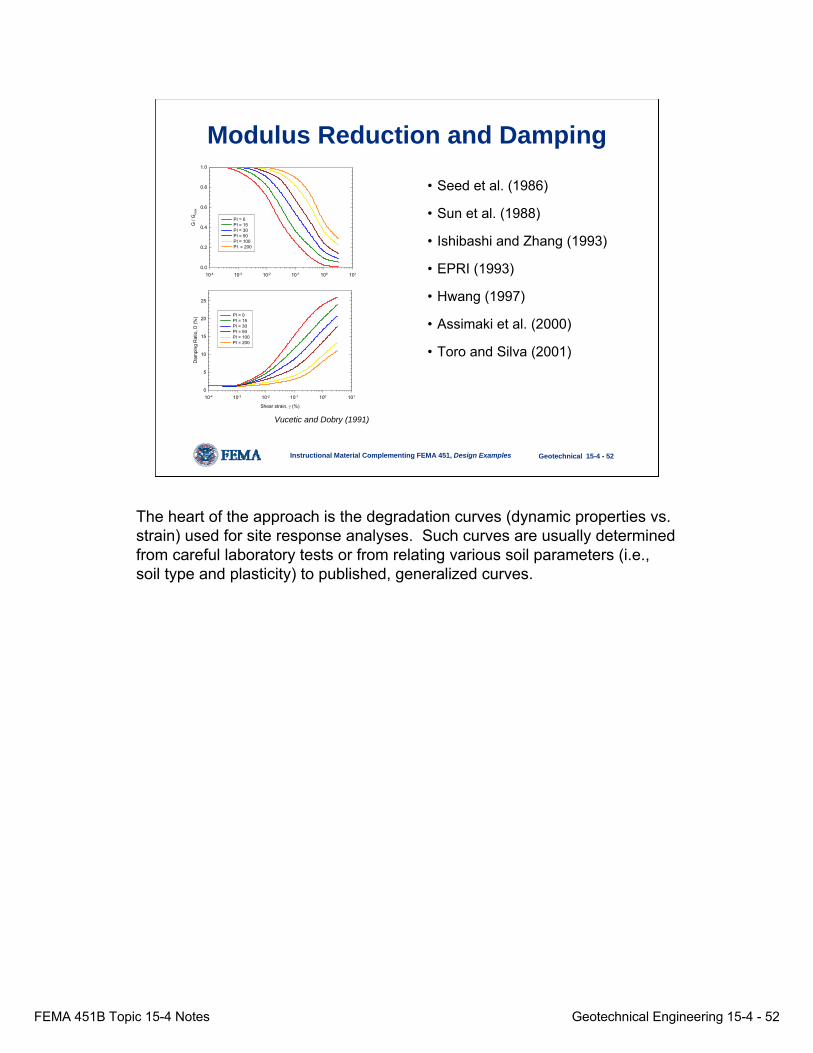
Modulus Reduction and Damping
• Seed et al. (1986)
• Sun et al. (1988)
• Ishibashi and Zhang (1993)
• EPRI (1993)
• Hwang (1997)
• Assimaki et al. (2000)
• Toro and Silva (2001)
10-4 10-3 10-2 10-1 100 101
G /
Gm
ax
0.0
0.2
0.4
0.6
0.8
1.0
PI = 0PI = 15PI = 30PI = 50PI = 100PI = 200
Shear strain, γ (%)
10-4 10-3 10-2 10-1 100 101
Dam
ping
Rat
io, D
(%)
0
5
10
15
20
25
PI = 0PI = 15PI = 30PI = 50PI = 100PI = 200
Vucetic and Dobry (1991)
The heart of the approach is the degradation curves (dynamic properties vs. strain) used for site response analyses. Such curves are usually determined from careful laboratory tests or from relating various soil parameters (i.e., soil type and plasticity) to published, generalized curves.
FEMA 451B Topic 15-4 Notes Geotechnical Engineering 15-4 - 53
Instructional Material Complementing FEMA 451, Design Examples Geotechnical 15-4 - 53
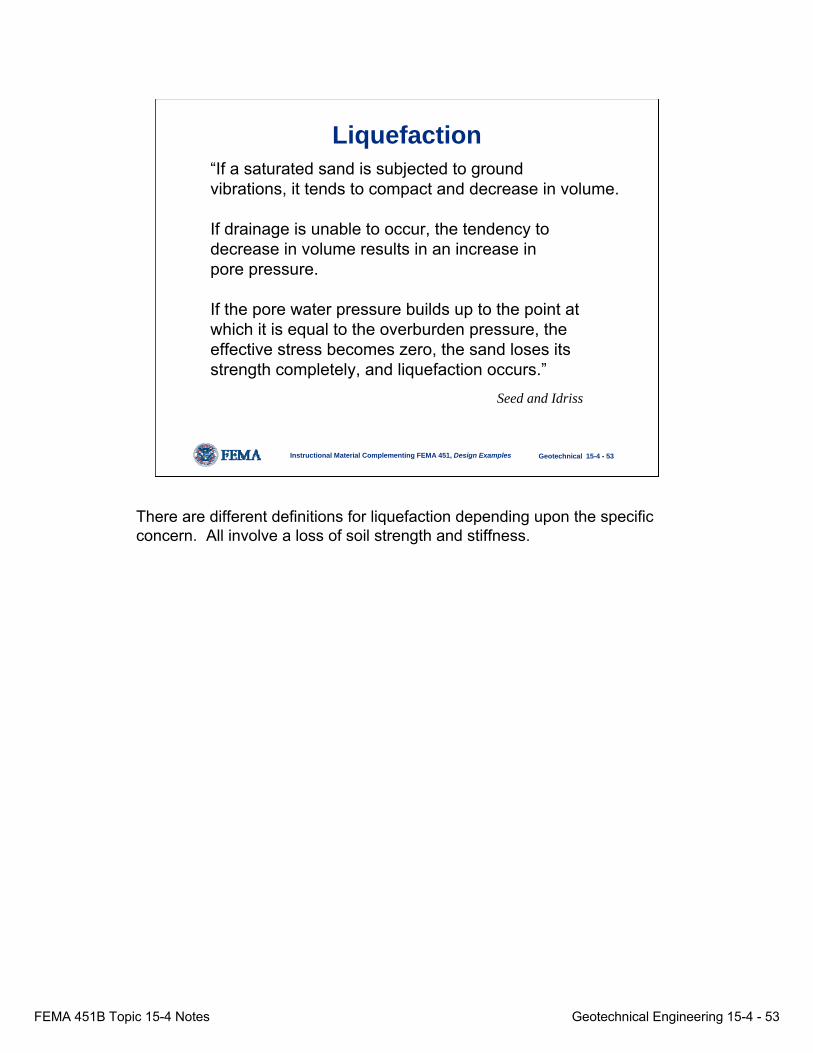
“If a saturated sand is subjected to groundvibrations, it tends to compact and decrease in volume.
If drainage is unable to occur, the tendency todecrease in volume results in an increase inpore pressure.
If the pore water pressure builds up to the point atwhich it is equal to the overburden pressure, theeffective stress becomes zero, the sand loses itsstrength completely, and liquefaction occurs.”
Seed and Idriss
Liquefaction
There are different definitions for liquefaction depending upon the specific concern. All involve a loss of soil strength and stiffness.
FEMA 451B Topic 15-4 Notes Geotechnical Engineering 15-4 - 54
Instructional Material Complementing FEMA 451, Design Examples Geotechnical 15-4 - 54
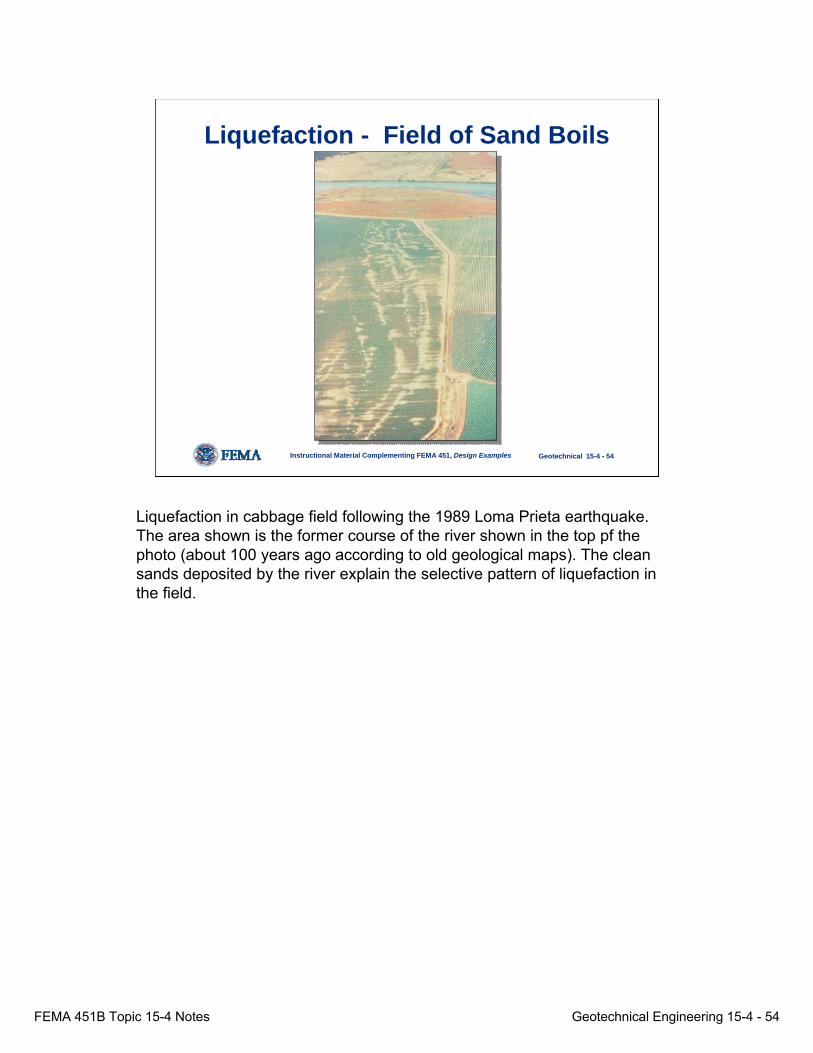
Liquefaction - Field of Sand Boils
Liquefaction in cabbage field following the 1989 Loma Prieta earthquake. The area shown is the former course of the river shown in the top pf the photo (about 100 years ago according to old geological maps). The clean sands deposited by the river explain the selective pattern of liquefaction in the field.

FEMA 451B Topic 15-4 Notes Geotechnical Engineering 15-4 - 55
Instructional Material Complementing FEMA 451, Design Examples Geotechnical 15-4 - 55
This is a close-up shot of the aerial photo in the previous slide.
FEMA 451B Topic 15-4 Notes Geotechnical Engineering 15-4 - 56
Instructional Material Complementing FEMA 451, Design Examples Geotechnical 15-4 - 56
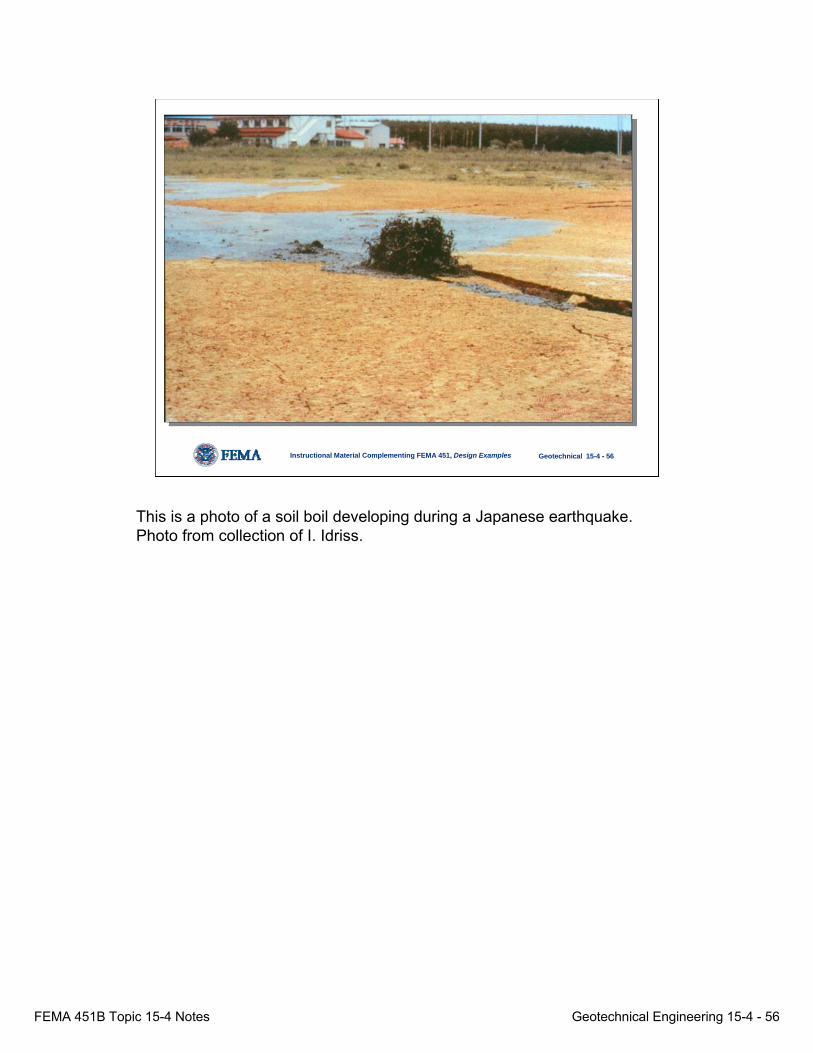
This is a photo of a soil boil developing during a Japanese earthquake. Photo from collection of I. Idriss.
FEMA 451B Topic 15-4 Notes Geotechnical Engineering 15-4 - 57
Instructional Material Complementing FEMA 451, Design Examples Geotechnical 15-4 - 57
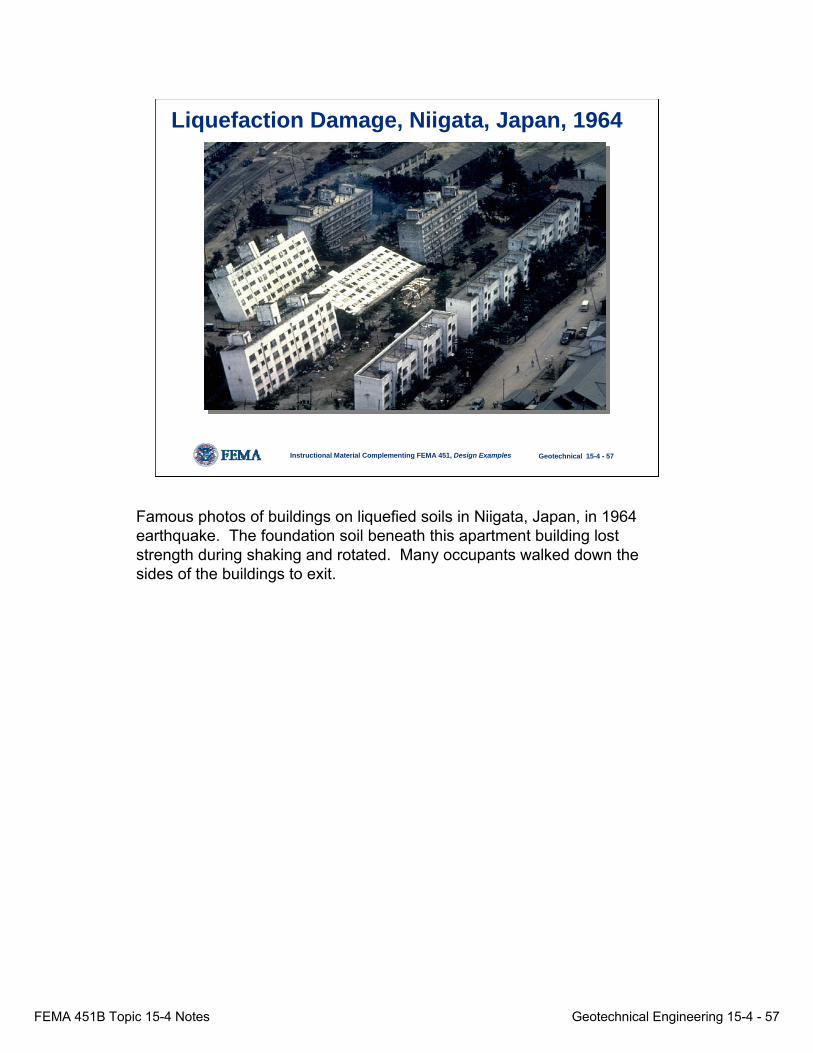
Liquefaction Damage, Niigata, Japan, 1964
Famous photos of buildings on liquefied soils in Niigata, Japan, in 1964 earthquake. The foundation soil beneath this apartment building lost strength during shaking and rotated. Many occupants walked down the sides of the buildings to exit.
FEMA 451B Topic 15-4 Notes Geotechnical Engineering 15-4 - 58
Instructional Material Complementing FEMA 451, Design Examples Geotechnical 15-4 - 58
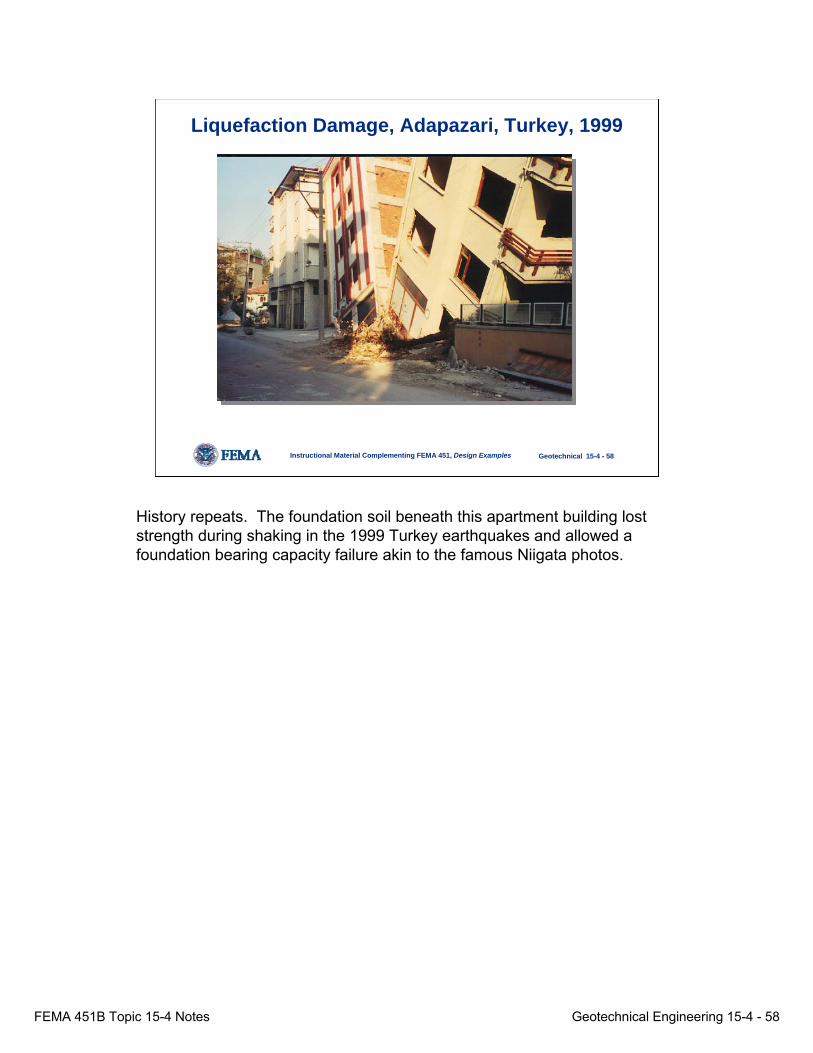
Liquefaction Damage, Adapazari, Turkey, 1999
History repeats. The foundation soil beneath this apartment building lost strength during shaking in the 1999 Turkey earthquakes and allowed a foundation bearing capacity failure akin to the famous Niigata photos.
FEMA 451B Topic 15-4 Notes Geotechnical Engineering 15-4 - 59
Instructional Material Complementing FEMA 451, Design Examples Geotechnical 15-4 - 59
Sandboils
Unliquefiedsoil
Liquefiedsoil
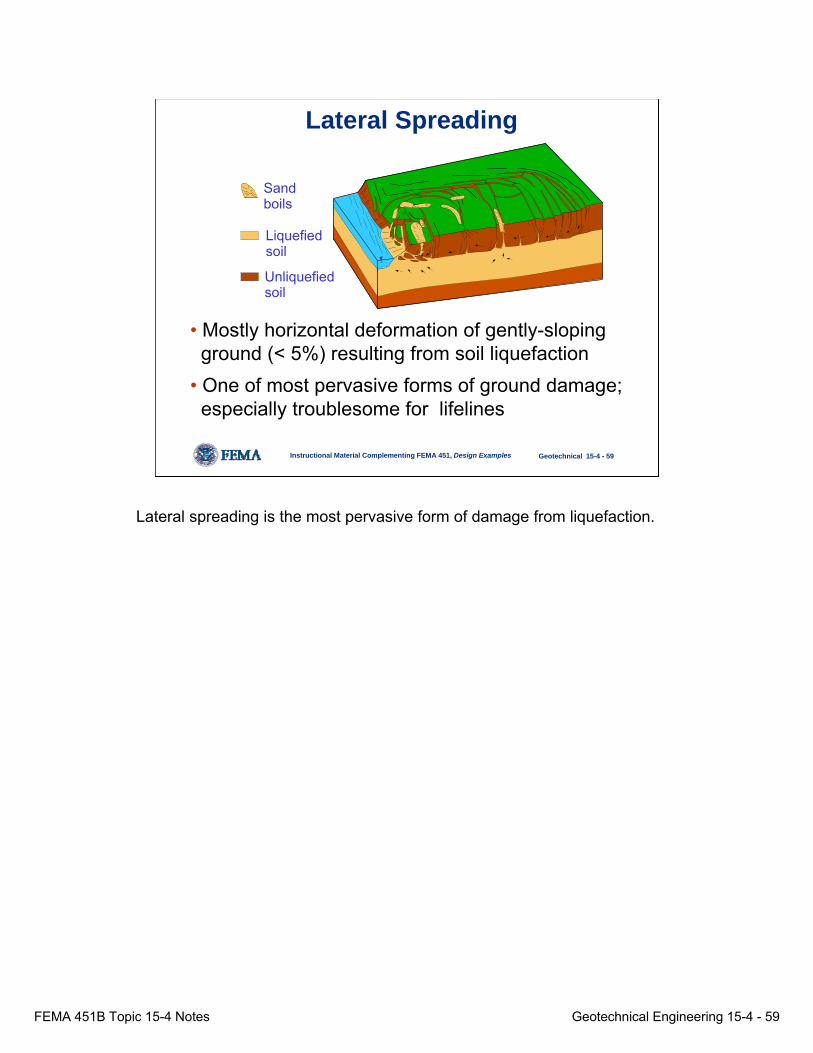
• Mostly horizontal deformation of gently-sloping ground (< 5%) resulting from soil liquefaction
• One of most pervasive forms of ground damage;especially troublesome for lifelines
Lateral Spreading
Lateral spreading is the most pervasive form of damage from liquefaction.
FEMA 451B Topic 15-4 Notes Geotechnical Engineering 15-4 - 60
Instructional Material Complementing FEMA 451, Design Examples Geotechnical 15-4 - 60
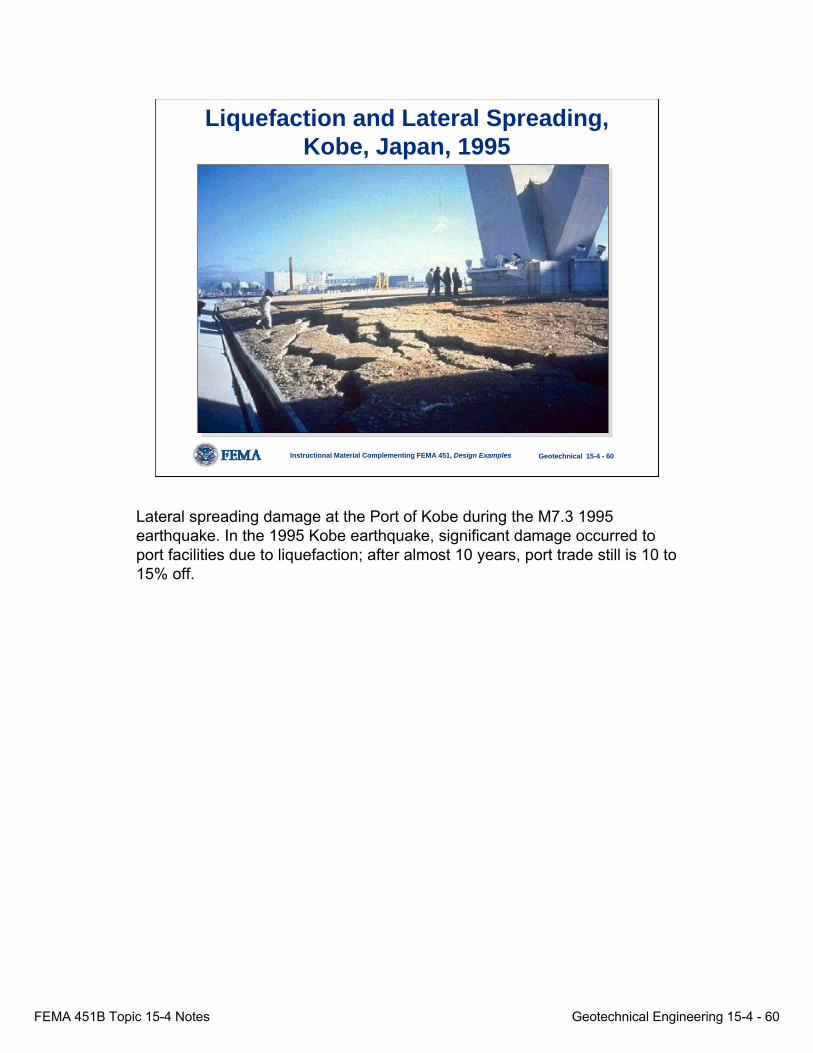
Liquefaction and Lateral Spreading, Kobe, Japan, 1995
Lateral spreading damage at the Port of Kobe during the M7.3 1995 earthquake. In the 1995 Kobe earthquake, significant damage occurred to port facilities due to liquefaction; after almost 10 years, port trade still is 10 to 15% off.
FEMA 451B Topic 15-4 Notes Geotechnical Engineering 15-4 - 61
Instructional Material Complementing FEMA 451, Design Examples Geotechnical 15-4 - 61
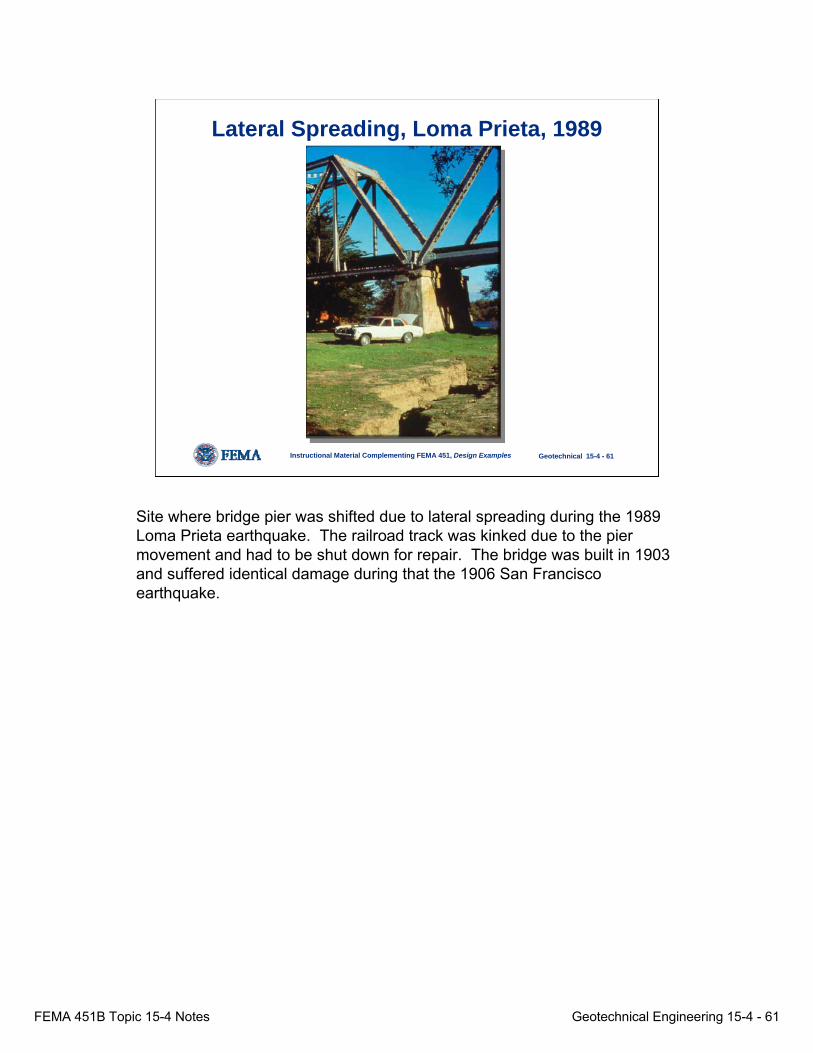
Lateral Spreading, Loma Prieta, 1989
Site where bridge pier was shifted due to lateral spreading during the 1989 Loma Prieta earthquake. The railroad track was kinked due to the pier movement and had to be shut down for repair. The bridge was built in 1903 and suffered identical damage during that the 1906 San Franciscoearthquake.

FEMA 451B Topic 15-4 Notes Geotechnical Engineering 15-4 - 62
Instructional Material Complementing FEMA 451, Design Examples Geotechnical 15-4 - 62
Photo courtesy of Professor T. L. Youd from Elgamal (2002)
Pile Damage Beneath Building by Lateral Spread 1964, Niigata, Japan
This slide shows damaged piles beneath a structure found in liquefiable soils subjected to later spreading movement. The soil was excavated and hosed away following the earthquake to reveal the condition of the piles.
FEMA 451B Topic 15-4 Notes Geotechnical Engineering 15-4 - 63
Instructional Material Complementing FEMA 451, Design Examples Geotechnical 15-4 - 63
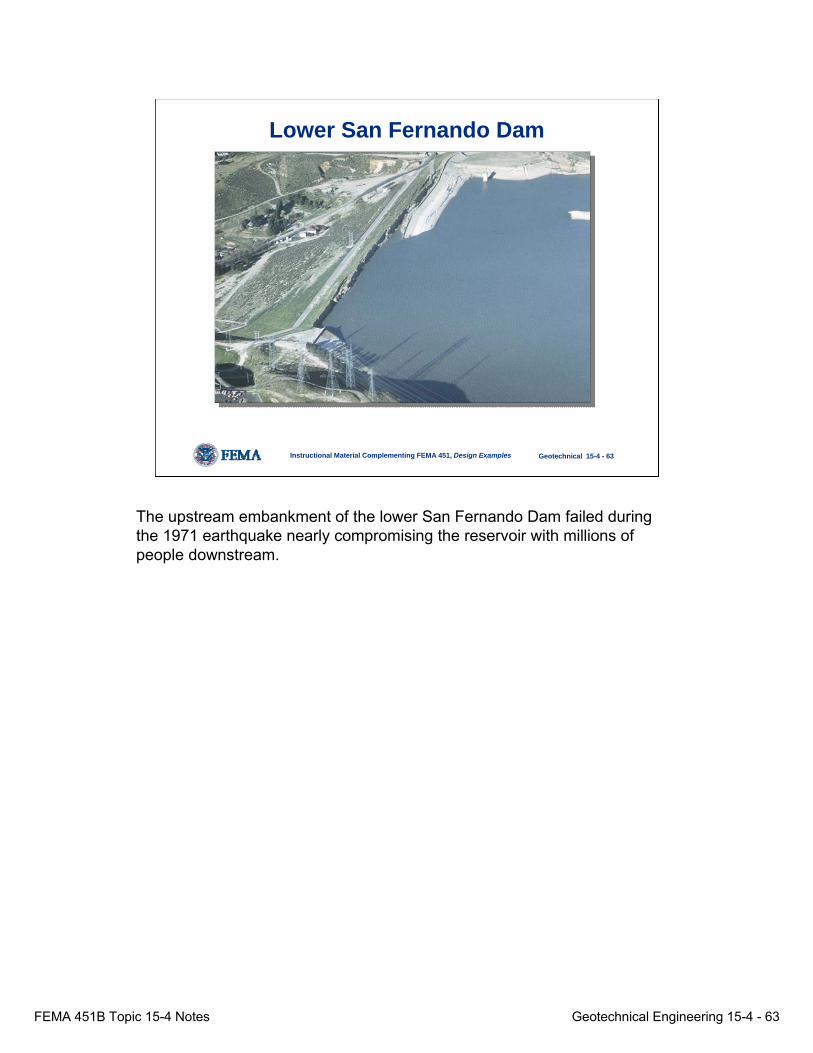
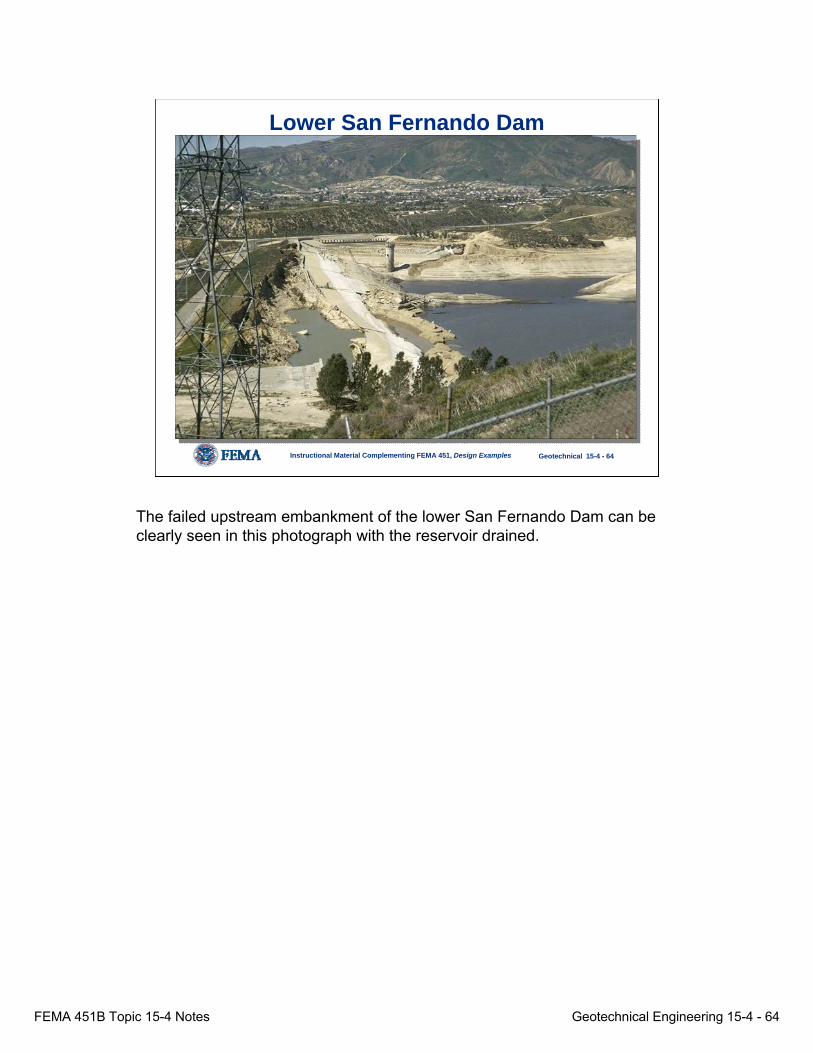
Lower San Fernando Dam
The upstream embankment of the lower San Fernando Dam failed during the 1971 earthquake nearly compromising the reservoir with millions of people downstream.
FEMA 451B Topic 15-4 Notes Geotechnical Engineering 15-4 - 64
Instructional Material Complementing FEMA 451, Design Examples Geotechnical 15-4 - 64
Lower San Fernando Dam
The failed upstream embankment of the lower San Fernando Dam can be clearly seen in this photograph with the reservoir drained.
FEMA 451B Topic 15-4 Notes Geotechnical Engineering 15-4 - 65
Instructional Material Complementing FEMA 451, Design Examples Geotechnical 15-4 - 65
Liquefaction Damage • In the 1994 Northridge earthquake,
homes damaged by liquefaction or ground failure were 30 times more likely to require demolition than those homes only damaged by ground shaking (ABAG)
• In the 1995 Kobe Japan Earthquake, significant damages occurred to port facilities due to liquefaction; after almost 10 years post trade still 10-15% off
None.
FEMA 451B Topic 15-4 Notes Geotechnical Engineering 15-4 - 66
Instructional Material Complementing FEMA 451, Design Examples Geotechnical 15-4 - 66
Youd et al. 2001. “Liquefaction Resistance Of Soils: Summary Report from the 1996 NCEER and 1998 NCEER/NSF Workshops on Evaluation of Liquefaction Resistance ofSoils,” Journal of Geotechnical and Geoenvironmental Engineering, October, pp. 817-833.
Key Reference
None.
FEMA 451B Topic 15-4 Notes Geotechnical Engineering 15-4 - 67
Instructional Material Complementing FEMA 451, Design Examples Geotechnical 15-4 - 67
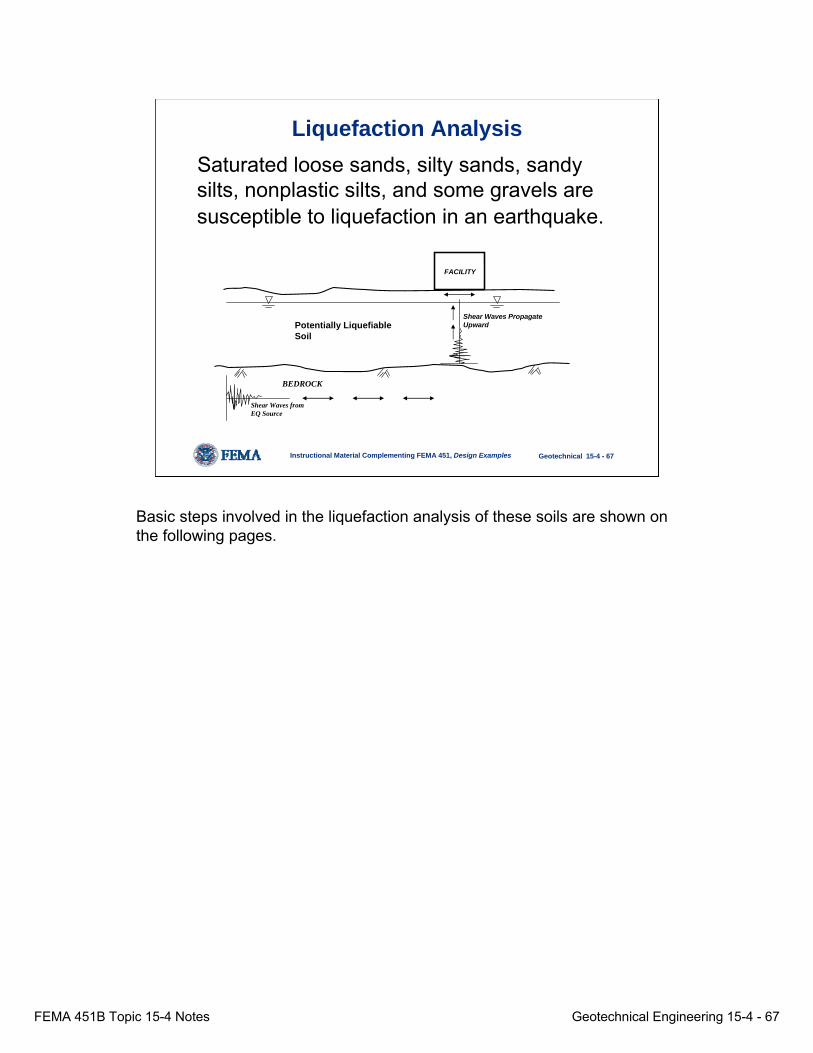
Liquefaction AnalysisSaturated loose sands, silty sands, sandy silts, nonplastic silts, and some gravels are susceptible to liquefaction in an earthquake.
FACILITY
BEDROCK
Potentially Liquefiable Soil
Shear Waves fromEQ Source
Shear Waves Propagate Upward
Basic steps involved in the liquefaction analysis of these soils are shown on the following pages.
FEMA 451B Topic 15-4 Notes Geotechnical Engineering 15-4 - 68
Instructional Material Complementing FEMA 451, Design Examples Geotechnical 15-4 - 68
Liquefaction Analysis
• A quantified measure of seismically induced shaking within a soil profile is termed the earthquake demand. The most commonly used measure of demand in current practice is the cyclic stress ratio (CSR).
• The soil’s ability to resist this shaking without liquefaction is determined by one or more methods, and is indicated by its cyclic resistance ratio (CRR).
The main parameters to be determined in a liquefaction evaluation are the demand and the resistance.
FEMA 451B Topic 15-4 Notes Geotechnical Engineering 15-4 - 69
Instructional Material Complementing FEMA 451, Design Examples Geotechnical 15-4 - 69
Liquefaction Analysis StepsStep 1 -- Estimate the maximum acceleration at the ground surface, amax:
This can be obtained from: (a) an actual acceleration record from nearby; (b) from “attenuation” relationships that relate amax to the earthquake magnitude and include the effects of soil directly; (c) from a site response analysis using a series of time histories (if this is done, CSR can be determined directly from the output); (d) soft soil amplification factors such as Idriss (1990); and (e) national seismic hazard maps.
None.
FEMA 451B Topic 15-4 Notes Geotechnical Engineering 15-4 - 70
Instructional Material Complementing FEMA 451, Design Examples Geotechnical 15-4 - 70
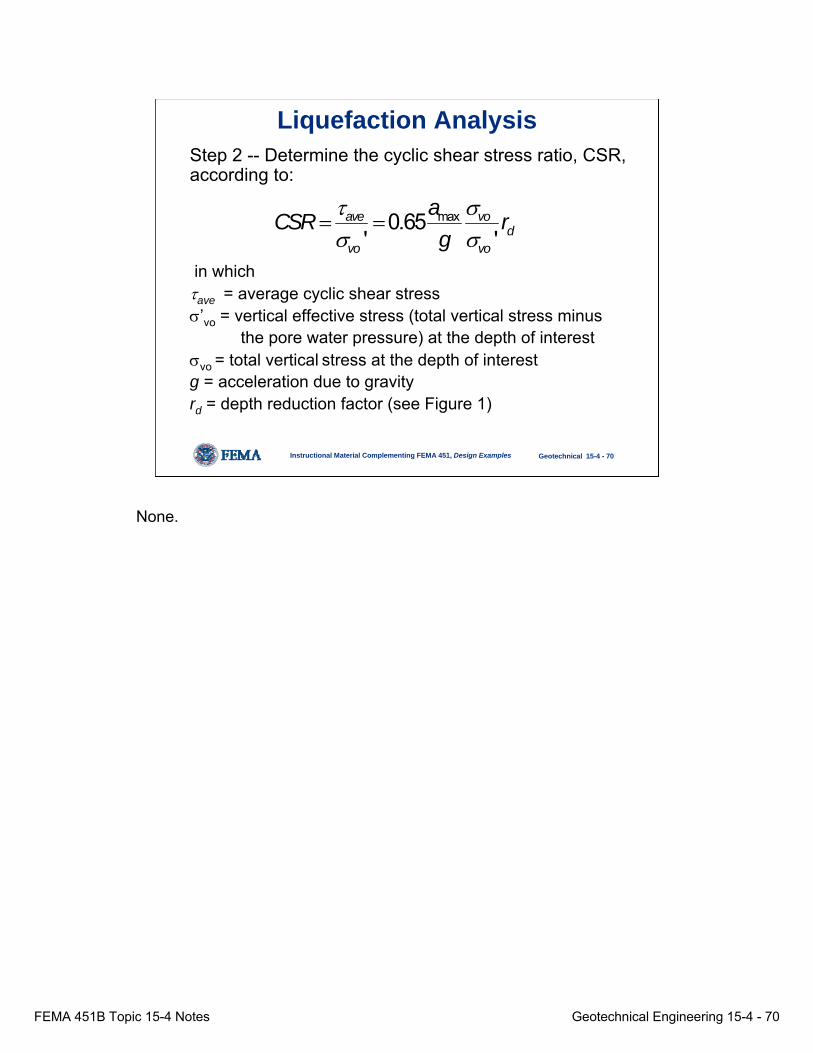
Liquefaction AnalysisStep 2 -- Determine the cyclic shear stress ratio, CSR, according to:
in which τave = average cyclic shear stress σ’vo = vertical effective stress (total vertical stress minus
the pore water pressure) at the depth of interestσvo = total vertical stress at the depth of interestg = acceleration due to gravityrd = depth reduction factor (see Figure 1)
max0.65' '
ave vod
vo vo
aCSR rg
τ σσ σ
= =
None.
FEMA 451B Topic 15-4 Notes Geotechnical Engineering 15-4 - 71
Instructional Material Complementing FEMA 451, Design Examples Geotechnical 15-4 - 71
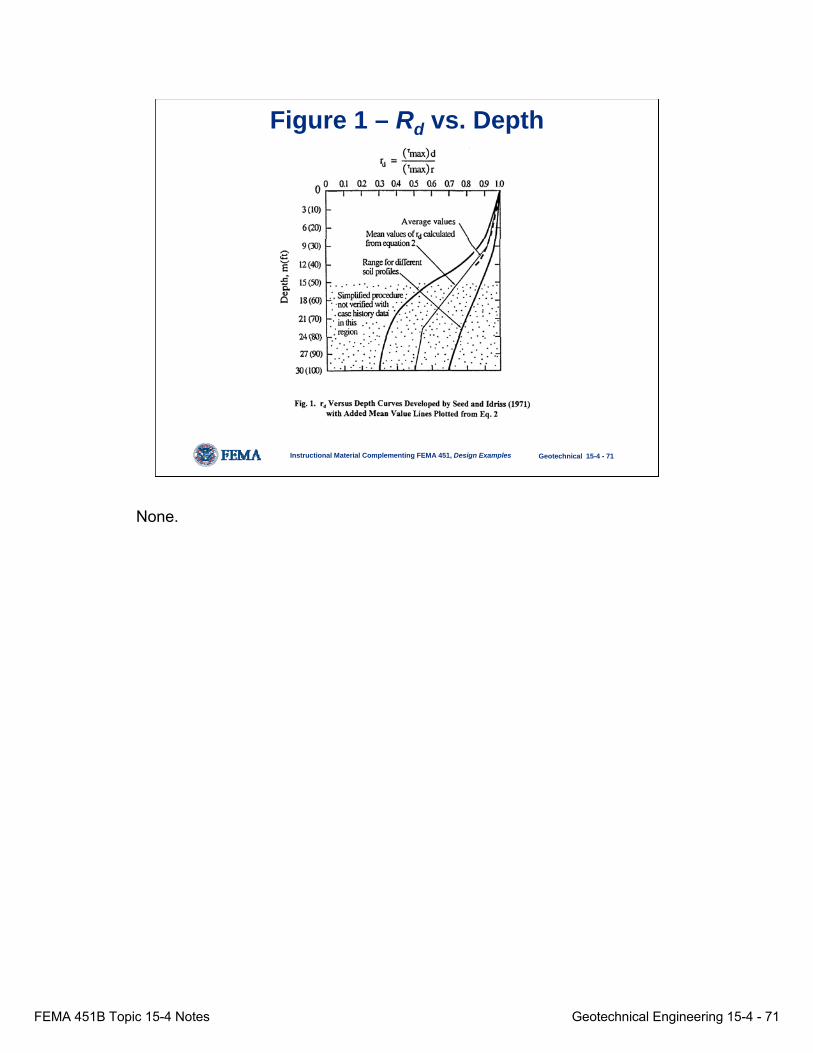
Figure 1 – Rd vs. Depth
None.

FEMA 451B Topic 15-4 Notes Geotechnical Engineering 15-4 - 72
Instructional Material Complementing FEMA 451, Design Examples Geotechnical 15-4 - 72
Liquefaction AnalysisStep 3 -- Determine the soil resistance to liquefaction, CRR.
CRR can be determined from the results of Standard Penetration Tests (SPT) – see Figure 2, Cone Penetration Tests (CPT) – see Figure 3, or Shear Wave Velocity Measurements (Vs) - see Figure 4, may be used. Characteristics and comparisons of these test methods are given in Table 1.⇒ The SPT N-value method is described here for level ground.
None.

FEMA 451B Topic 15-4 Notes Geotechnical Engineering 15-4 - 73
Instructional Material Complementing FEMA 451, Design Examples Geotechnical 15-4 - 73
Figure 2- N1,60 vs. CSR/CRR
Note that the relationship between cyclic resistance and blow count was developed from empirical data (observations).
FEMA 451B Topic 15-4 Notes Geotechnical Engineering 15-4 - 74
Instructional Material Complementing FEMA 451, Design Examples Geotechnical 15-4 - 74
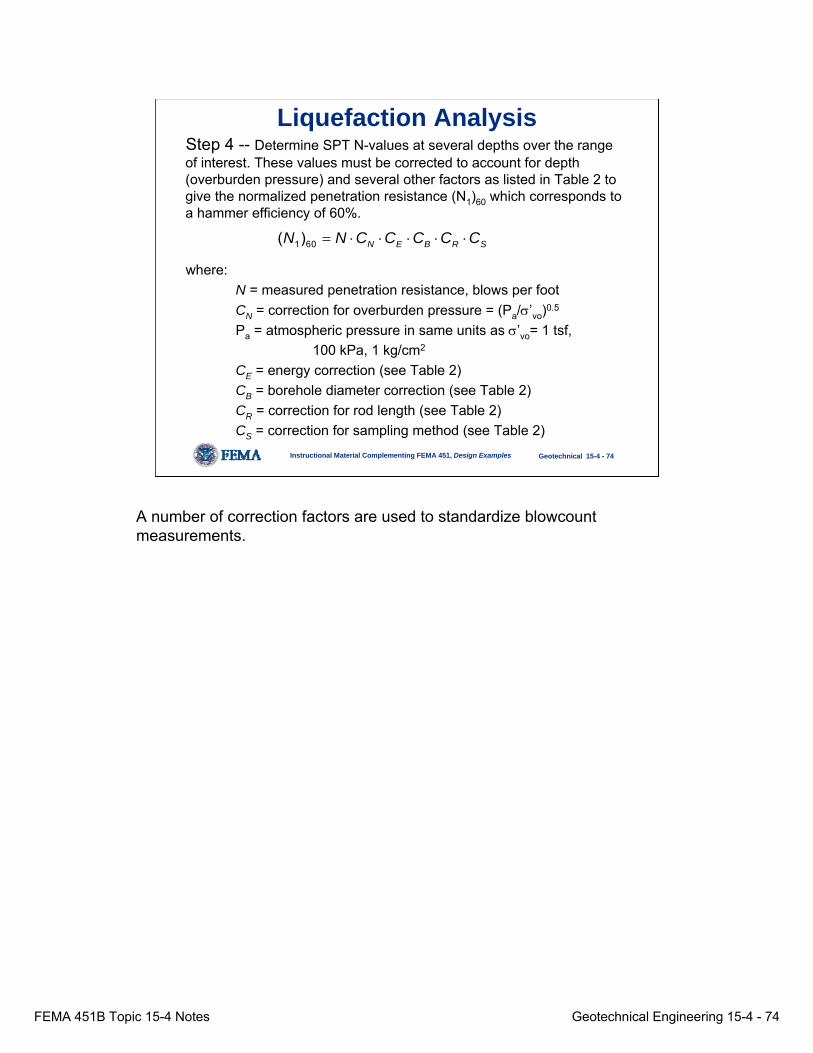
Liquefaction AnalysisStep 4 -- Determine SPT N-values at several depths over the range of interest. These values must be corrected to account for depth(overburden pressure) and several other factors as listed in Table 2 to give the normalized penetration resistance (N1)60 which corresponds to a hammer efficiency of 60%.
where:N = measured penetration resistance, blows per footCN = correction for overburden pressure = (Pa/σ’vo)0.5
Pa = atmospheric pressure in same units as σ’vo= 1 tsf, 100 kPa, 1 kg/cm2
CE = energy correction (see Table 2)CB = borehole diameter correction (see Table 2)CR = correction for rod length (see Table 2)CS = correction for sampling method (see Table 2)
1 60( ) N E B R SN N C C C C C= ⋅ ⋅ ⋅ ⋅ ⋅
A number of correction factors are used to standardize blowcountmeasurements.
FEMA 451B Topic 15-4 Notes Geotechnical Engineering 15-4 - 75
Instructional Material Complementing FEMA 451, Design Examples Geotechnical 15-4 - 75
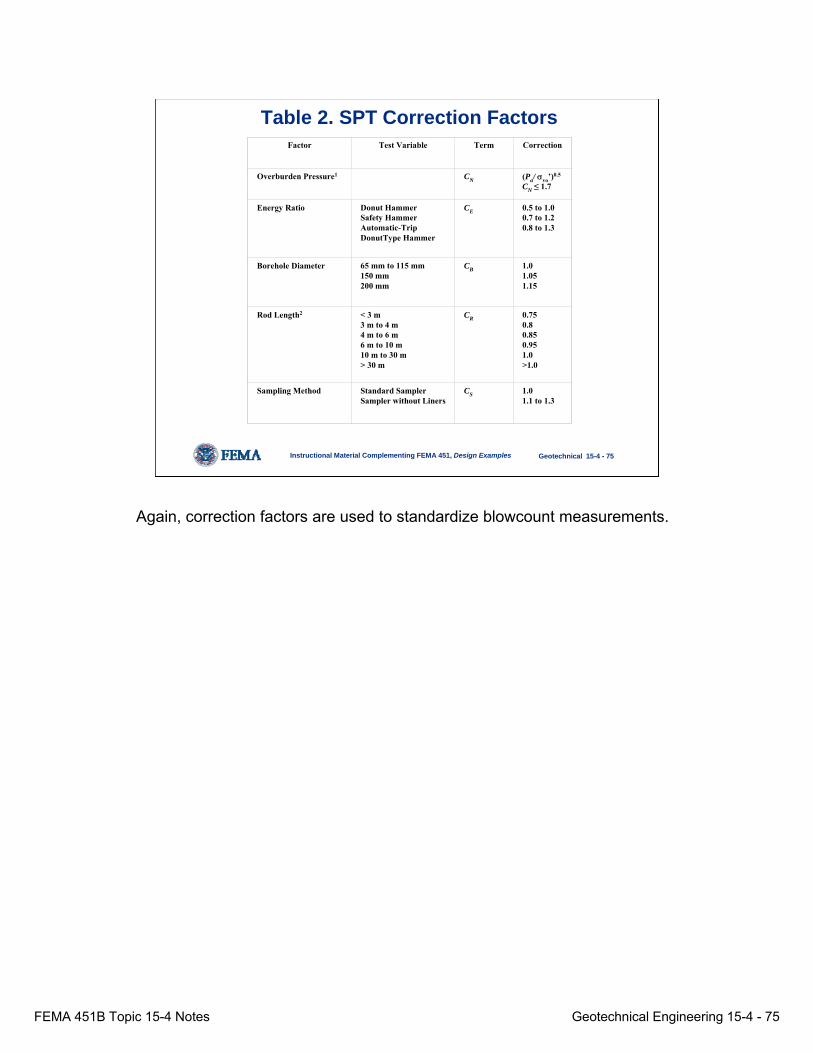
Table 2. SPT Correction FactorsFactor Test Variable Term Correction
Overburden Pressure1 CN (Pa/ σvo’)0.5
CN ≤ 1.7
Energy Ratio Donut HammerSafety HammerAutomatic-Trip DonutType Hammer
CE 0.5 to 1.00.7 to 1.20.8 to 1.3
Borehole Diameter 65 mm to 115 mm150 mm200 mm
CB 1.01.051.15
Rod Length2 < 3 m3 m to 4 m4 m to 6 m6 m to 10 m10 m to 30 m> 30 m
CR 0.750.80.850.951.0>1.0
Sampling Method Standard SamplerSampler without Liners
CS 1.01.1 to 1.3
Again, correction factors are used to standardize blowcount measurements.
FEMA 451B Topic 15-4 Notes Geotechnical Engineering 15-4 - 76
Instructional Material Complementing FEMA 451, Design Examples Geotechnical 15-4 - 76
Liquefaction Analysis
Step 5 -- Locate (N1)60 on Figure 2. If the earthquake magnitude is 7.5 and the depth of the point being evaluate corresponds to an effective overburden pressure of 1 tsf, 100 kPa, or 1 kg/cm2, then the cyclic resistance ratio (CRR) is given by the corresponding value from the curve that separates the zones of liquefaction and no liquefaction (note that the appropriate curve to use depends on the fines content of the soil).
None.
FEMA 451B Topic 15-4 Notes Geotechnical Engineering 15-4 - 77
Instructional Material Complementing FEMA 451, Design Examples Geotechnical 15-4 - 77
Liquefaction AnalysisStep 6 -- If the effective overburden pressure (σ’vo) is greater than 1 tsf, 100 kPa or 1 kg/sq. cm, then the CRR should be reduced according to Figure 5 by:
(CRR) (σ’vo) = (CRR) (σ’vo)=1 x Kσ
If the earthquake magnitude is less than 7.5, then the CRR should be increased according to:
(CRR)M<7.5 = (CRR)M=7.5 x MSF
The Magnitude Scaling Factor (MSF) is given by the shaded zone in Figure 6. Similarly, if the magnitude is greater than 7.5, then the CRR should be reduced according to the relationship in Figure 4.
None.
FEMA 451B Topic 15-4 Notes Geotechnical Engineering 15-4 - 78
Instructional Material Complementing FEMA 451, Design Examples Geotechnical 15-4 - 78
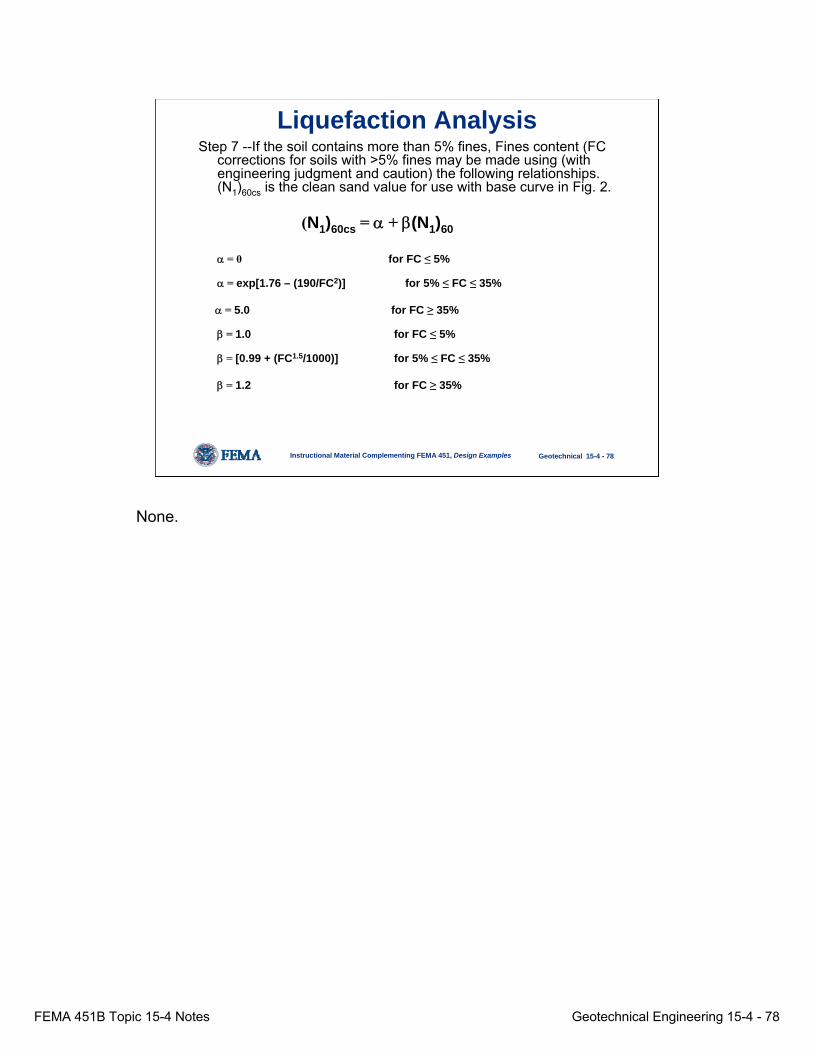
Liquefaction AnalysisStep 7 --If the soil contains more than 5% fines, Fines content (FC
corrections for soils with >5% fines may be made using (with engineering judgment and caution) the following relationships. (N1)60cs is the clean sand value for use with base curve in Fig. 2.
(N1)60cs = α + β(N1)60
α = 0 for FC ≤ 5%
α = exp[1.76 – (190/FC2)] for 5% ≤ FC ≤ 35%
α = 5.0 for FC ≥ 35%
β = 1.0 for FC ≤ 5%
β = [0.99 + (FC1.5/1000)] for 5% ≤ FC ≤ 35%
β = 1.2 for FC ≥ 35%
None.
FEMA 451B Topic 15-4 Notes Geotechnical Engineering 15-4 - 79
Instructional Material Complementing FEMA 451, Design Examples Geotechnical 15-4 - 79
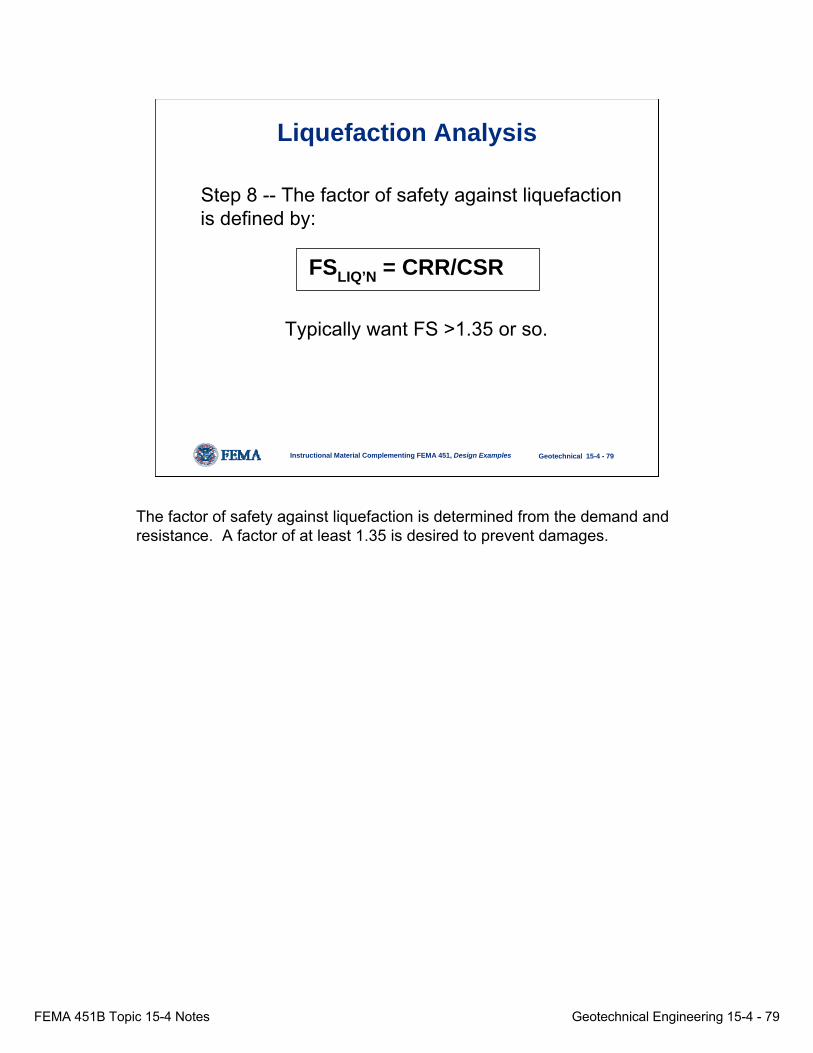
Liquefaction Analysis
Step 8 -- The factor of safety against liquefaction is defined by:
FSLIQ’N = CRR/CSR
Typically want FS >1.35 or so.
The factor of safety against liquefaction is determined from the demand and resistance. A factor of at least 1.35 is desired to prevent damages.
FEMA 451B Topic 15-4 Notes Geotechnical Engineering 15-4 - 80
Instructional Material Complementing FEMA 451, Design Examples Geotechnical 15-4 - 80
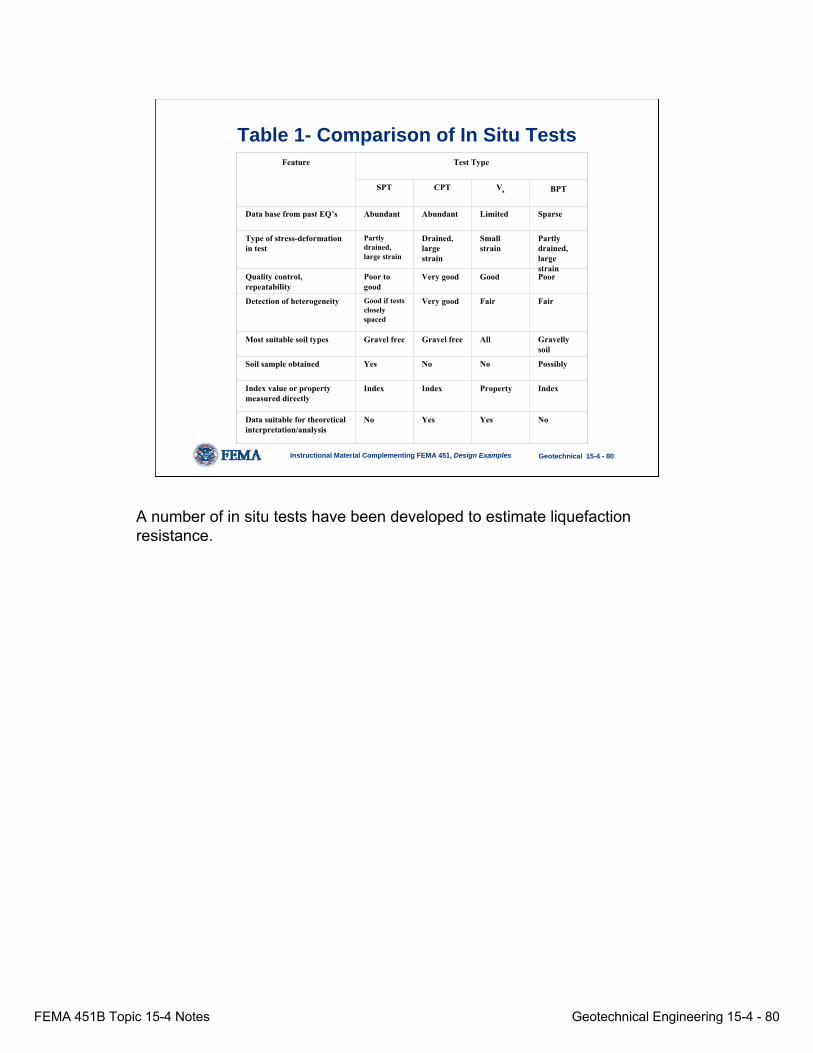
Table 1- Comparison of In Situ TestsFeature Test Type
SPT CPT Vs BPT
Data base from past EQ’s Abundant Abundant Limited Sparse
Type of stress-deformation in test
Partly drained, large strain
Drained, large strain
Small strain
Partly drained, large strain
Quality control, repeatability
Poor to good
Very good Good Poor
Detection of heterogeneity Good if tests closely spaced
Very good Fair Fair
Most suitable soil types Gravel free Gravel free All Gravelly soil
Soil sample obtained Yes No No Possibly
Index value or property measured directly
Index Index Property Index
Data suitable for theoretical interpretation/analysis
No Yes Yes No
A number of in situ tests have been developed to estimate liquefaction resistance.
FEMA 451B Topic 15-4 Notes Geotechnical Engineering 15-4 - 81
Instructional Material Complementing FEMA 451, Design Examples Geotechnical 15-4 - 81
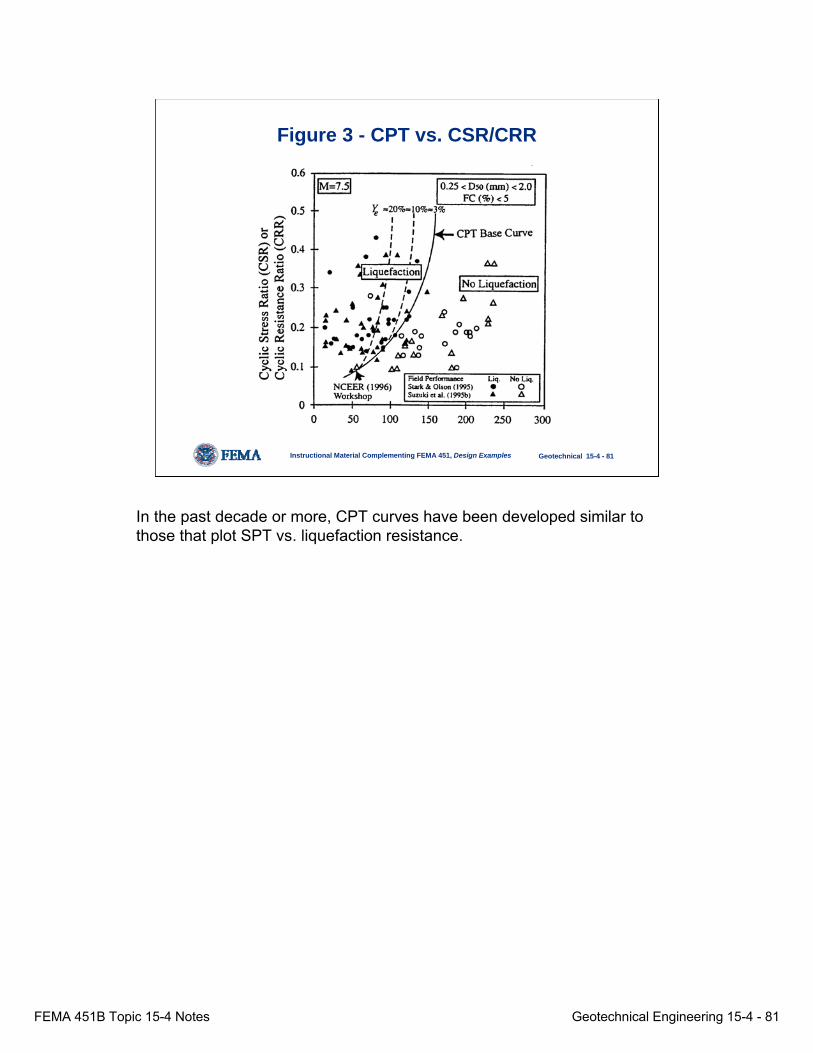
Figure 3 - CPT vs. CSR/CRR
In the past decade or more, CPT curves have been developed similar to those that plot SPT vs. liquefaction resistance.
FEMA 451B Topic 15-4 Notes Geotechnical Engineering 15-4 - 82
Instructional Material Complementing FEMA 451, Design Examples Geotechnical 15-4 - 82
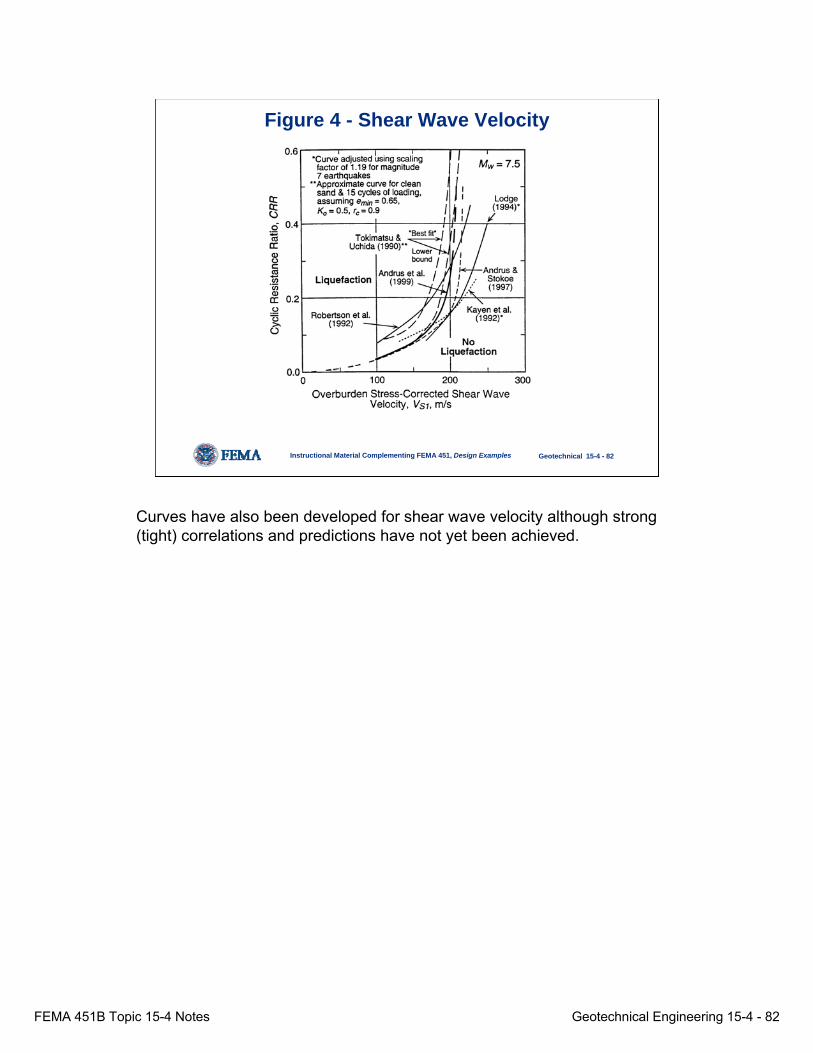
Figure 4 - Shear Wave Velocity
Curves have also been developed for shear wave velocity although strong (tight) correlations and predictions have not yet been achieved.
FEMA 451B Topic 15-4 Notes Geotechnical Engineering 15-4 - 83
Instructional Material Complementing FEMA 451, Design Examples Geotechnical 15-4 - 83
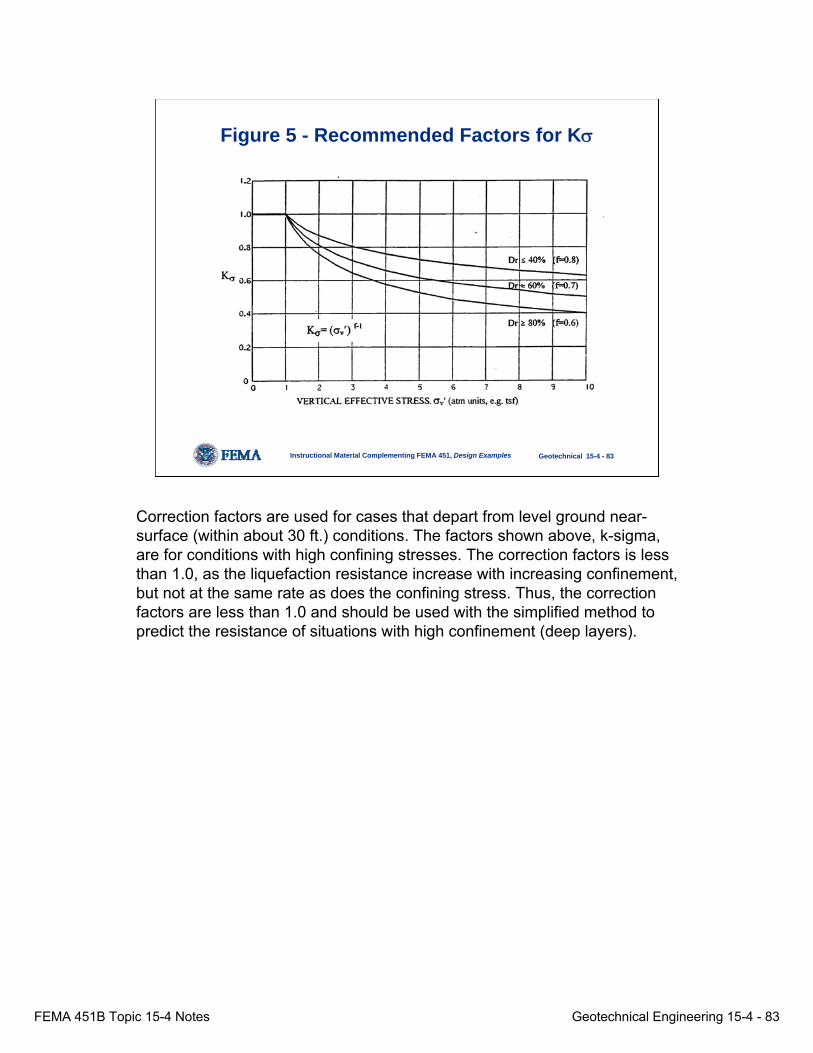
Figure 5 - Recommended Factors for Kσ
Correction factors are used for cases that depart from level ground near-surface (within about 30 ft.) conditions. The factors shown above, k-sigma, are for conditions with high confining stresses. The correction factors is less than 1.0, as the liquefaction resistance increase with increasing confinement, but not at the same rate as does the confining stress. Thus, the correction factors are less than 1.0 and should be used with the simplified method to predict the resistance of situations with high confinement (deep layers).
FEMA 451B Topic 15-4 Notes Geotechnical Engineering 15-4 - 84
Instructional Material Complementing FEMA 451, Design Examples Geotechnical 15-4 - 84
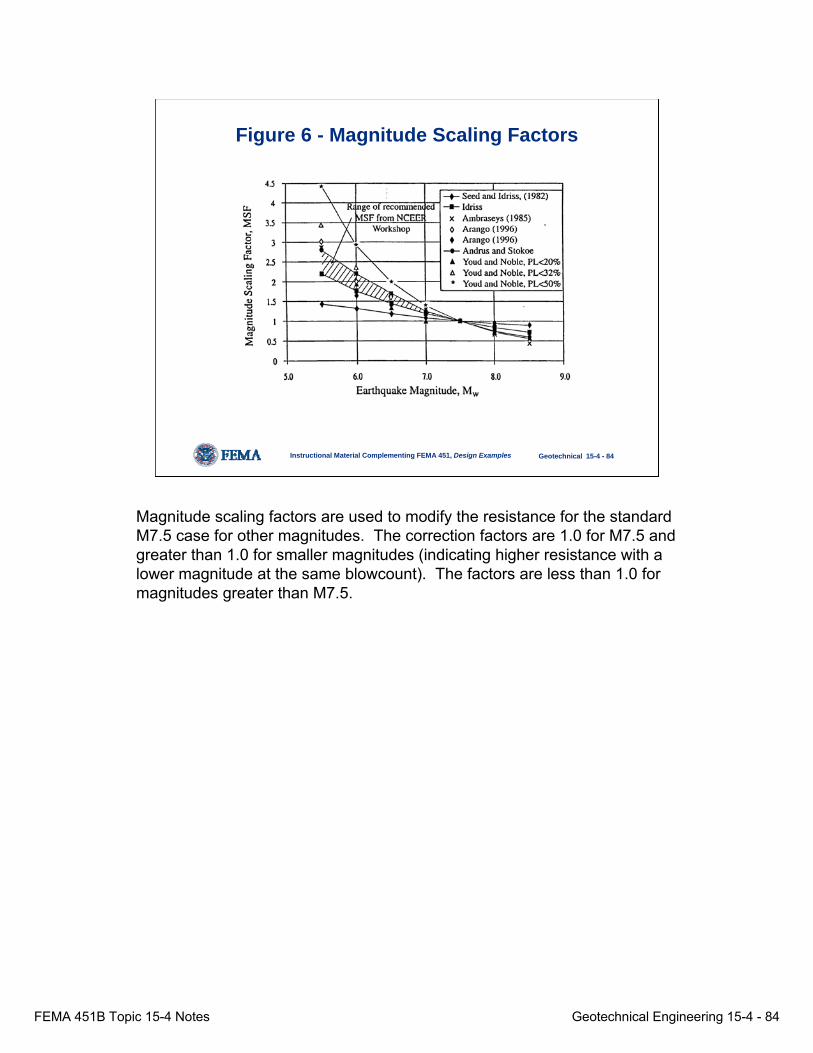
Figure 6 - Magnitude Scaling Factors
Magnitude scaling factors are used to modify the resistance for the standard M7.5 case for other magnitudes. The correction factors are 1.0 for M7.5 and greater than 1.0 for smaller magnitudes (indicating higher resistance with a lower magnitude at the same blowcount). The factors are less than 1.0 for magnitudes greater than M7.5.
FEMA 451B Topic 15-4 Notes Geotechnical Engineering 15-4 - 85
Instructional Material Complementing FEMA 451, Design Examples Geotechnical 15-4 - 85
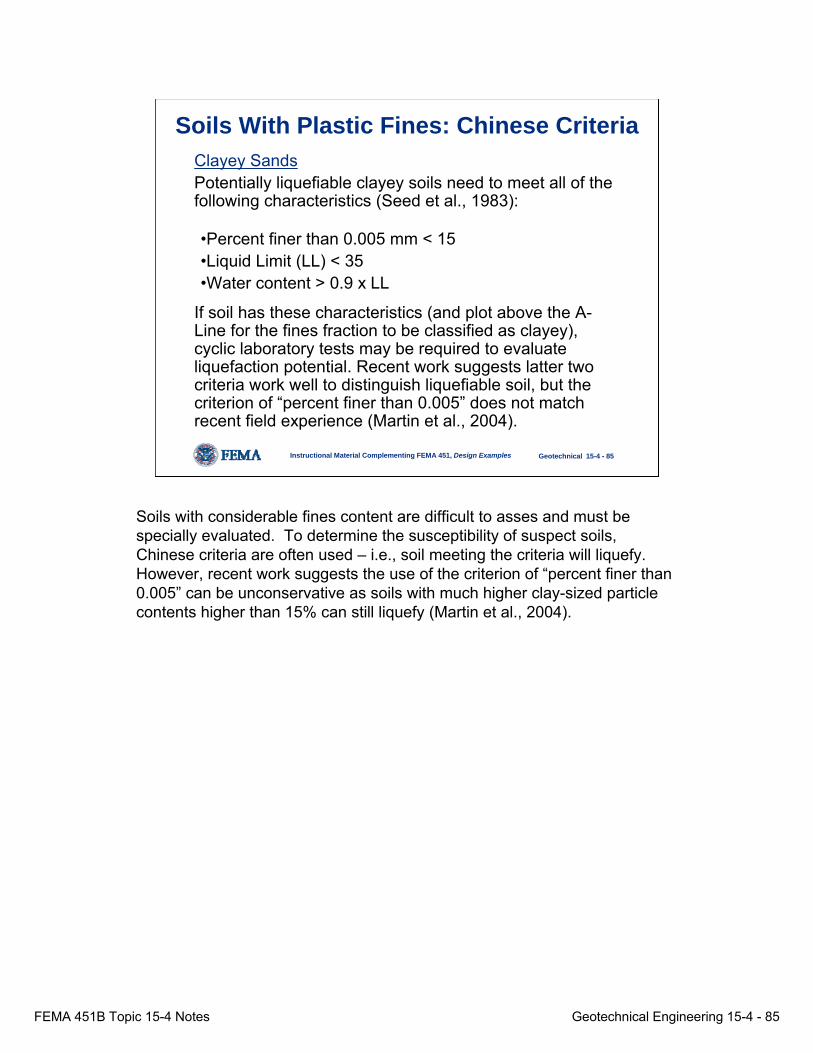
Soils With Plastic Fines: Chinese CriteriaClayey SandsPotentially liquefiable clayey soils need to meet all of the following characteristics (Seed et al., 1983):
•Percent finer than 0.005 mm < 15•Liquid Limit (LL) < 35•Water content > 0.9 x LL
If soil has these characteristics (and plot above the A-Line for the fines fraction to be classified as clayey), cyclic laboratory tests may be required to evaluate liquefaction potential. Recent work suggests latter two criteria work well to distinguish liquefiable soil, but the criterion of “percent finer than 0.005” does not match recent field experience (Martin et al., 2004).
Soils with considerable fines content are difficult to asses and must be specially evaluated. To determine the susceptibility of suspect soils, Chinese criteria are often used – i.e., soil meeting the criteria will liquefy. However, recent work suggests the use of the criterion of “percent finer than 0.005” can be unconservative as soils with much higher clay-sized particle contents higher than 15% can still liquefy (Martin et al., 2004).
FEMA 451B Topic 15-4 Notes Geotechnical Engineering 15-4 - 86
Instructional Material Complementing FEMA 451, Design Examples Geotechnical 15-4 - 86
Liquefaction Remediation• Basic approach is to either increase
capacity (i.e., increase density, bind particles together), or decrease demand (i.e., soil reinforcement)
• Recent studies indicate cost/benefit ratio of liquefaction and site remediation is generally > 1.0
• Excellent summary of performance and techniques available from:http://www.ce.berkeley.edu/~hausler/home.html
None.
FEMA 451B Topic 15-4 Notes Geotechnical Engineering 15-4 - 87
Instructional Material Complementing FEMA 451, Design Examples Geotechnical 15-4 - 87
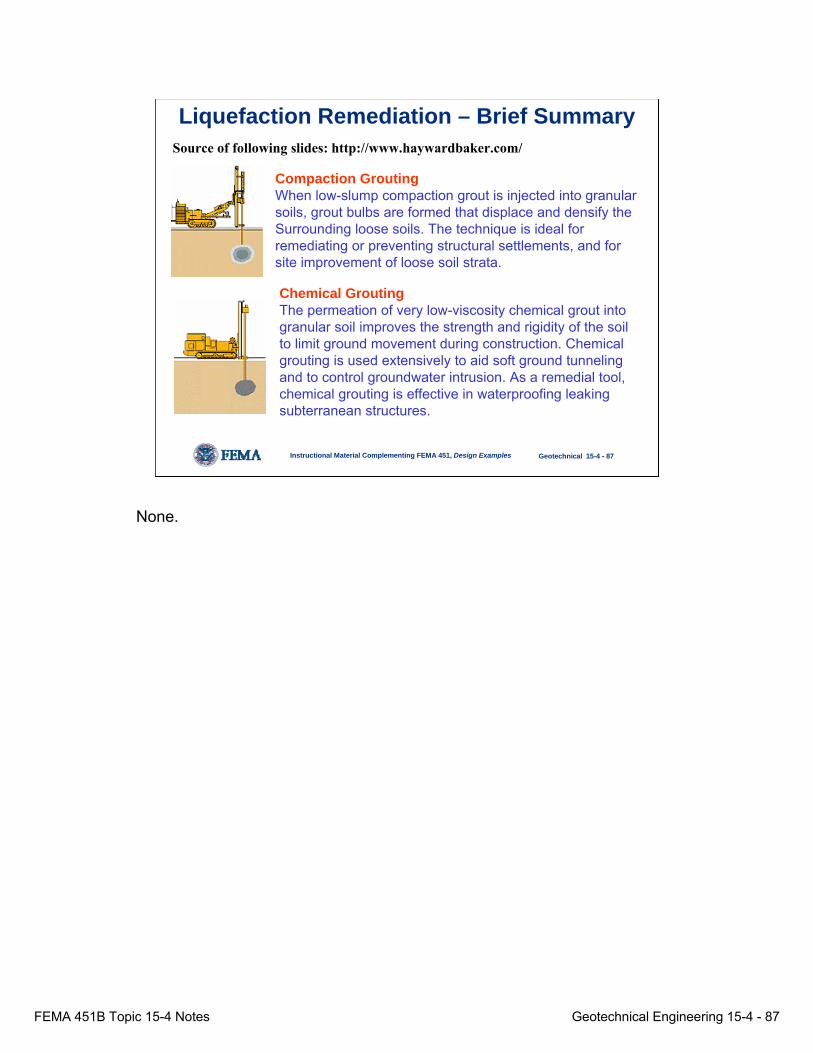
Source of following slides: http://www.haywardbaker.com/
Compaction GroutingWhen low-slump compaction grout is injected into granular soils, grout bulbs are formed that displace and densify the Surrounding loose soils. The technique is ideal for remediating or preventing structural settlements, and for site improvement of loose soil strata.
Chemical GroutingThe permeation of very low-viscosity chemical grout into granular soil improves the strength and rigidity of the soil to limit ground movement during construction. Chemical grouting is used extensively to aid soft ground tunneling and to control groundwater intrusion. As a remedial tool, chemical grouting is effective in waterproofing leaking subterranean structures.
Liquefaction Remediation – Brief Summary
None.
FEMA 451B Topic 15-4 Notes Geotechnical Engineering 15-4 - 88
Instructional Material Complementing FEMA 451, Design Examples Geotechnical 15-4 - 88
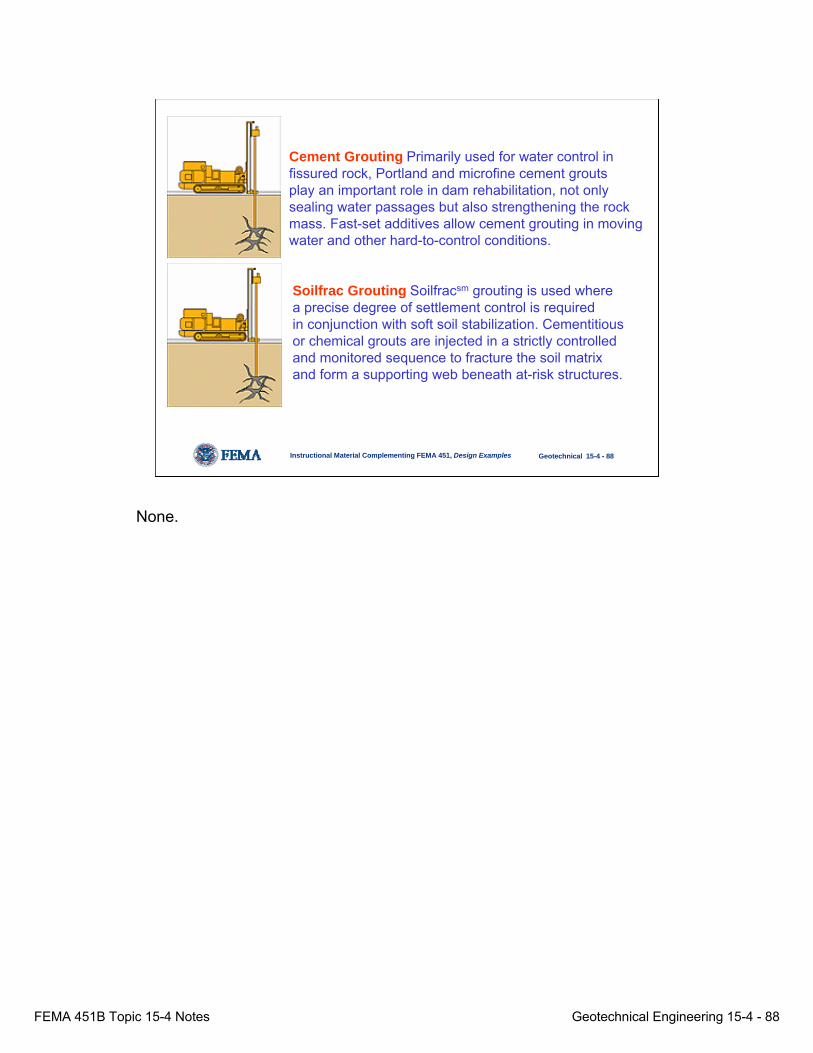
Cement Grouting Primarily used for water control in fissured rock, Portland and microfine cement grouts play an important role in dam rehabilitation, not only sealing water passages but also strengthening the rock mass. Fast-set additives allow cement grouting in movingwater and other hard-to-control conditions.
Soilfrac Grouting Soilfracsm grouting is used where a precise degree of settlement control is required in conjunction with soft soil stabilization. Cementitiousor chemical grouts are injected in a strictly controlled and monitored sequence to fracture the soil matrix and form a supporting web beneath at-risk structures.
None.
FEMA 451B Topic 15-4 Notes Geotechnical Engineering 15-4 - 89
Instructional Material Complementing FEMA 451, Design Examples Geotechnical 15-4 - 89
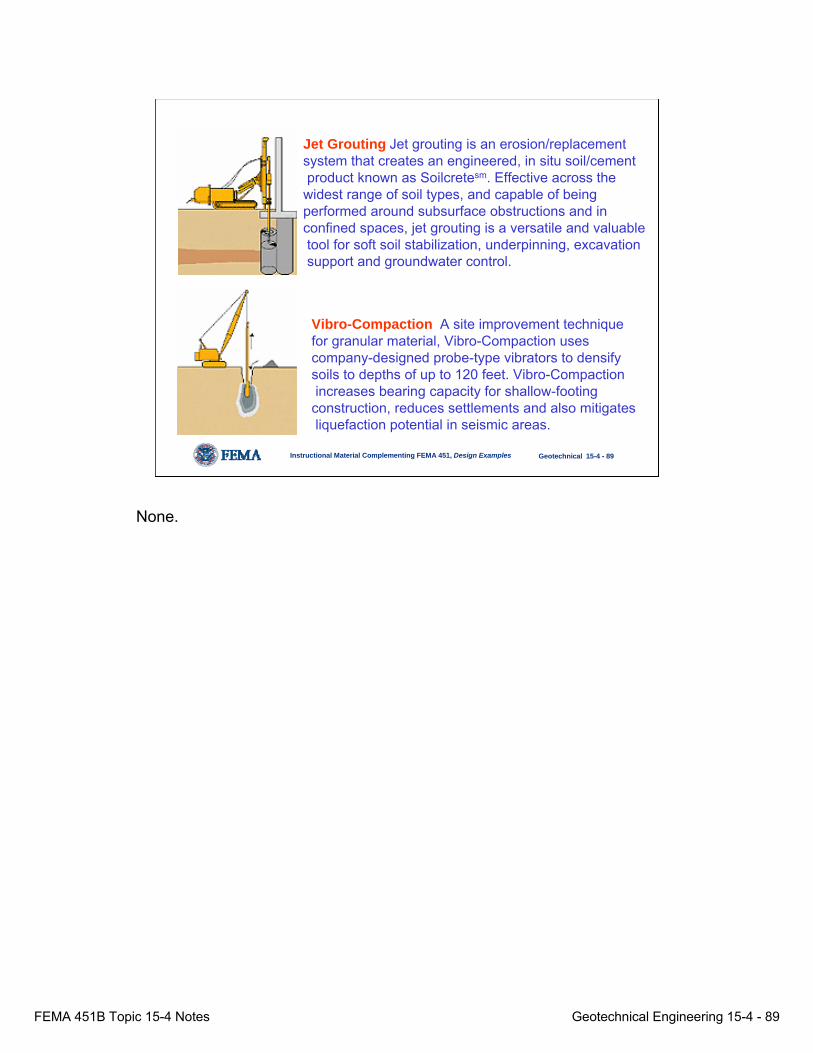
Jet Grouting Jet grouting is an erosion/replacement system that creates an engineered, in situ soil/cementproduct known as Soilcretesm. Effective across the
widest range of soil types, and capable of being performed around subsurface obstructions and in confined spaces, jet grouting is a versatile and valuabletool for soft soil stabilization, underpinning, excavationsupport and groundwater control.
Vibro-Compaction A site improvement technique for granular material, Vibro-Compaction uses company-designed probe-type vibrators to densify soils to depths of up to 120 feet. Vibro-Compactionincreases bearing capacity for shallow-footing
construction, reduces settlements and also mitigatesliquefaction potential in seismic areas.
None.
FEMA 451B Topic 15-4 Notes Geotechnical Engineering 15-4 - 90
Instructional Material Complementing FEMA 451, Design Examples Geotechnical 15-4 - 90
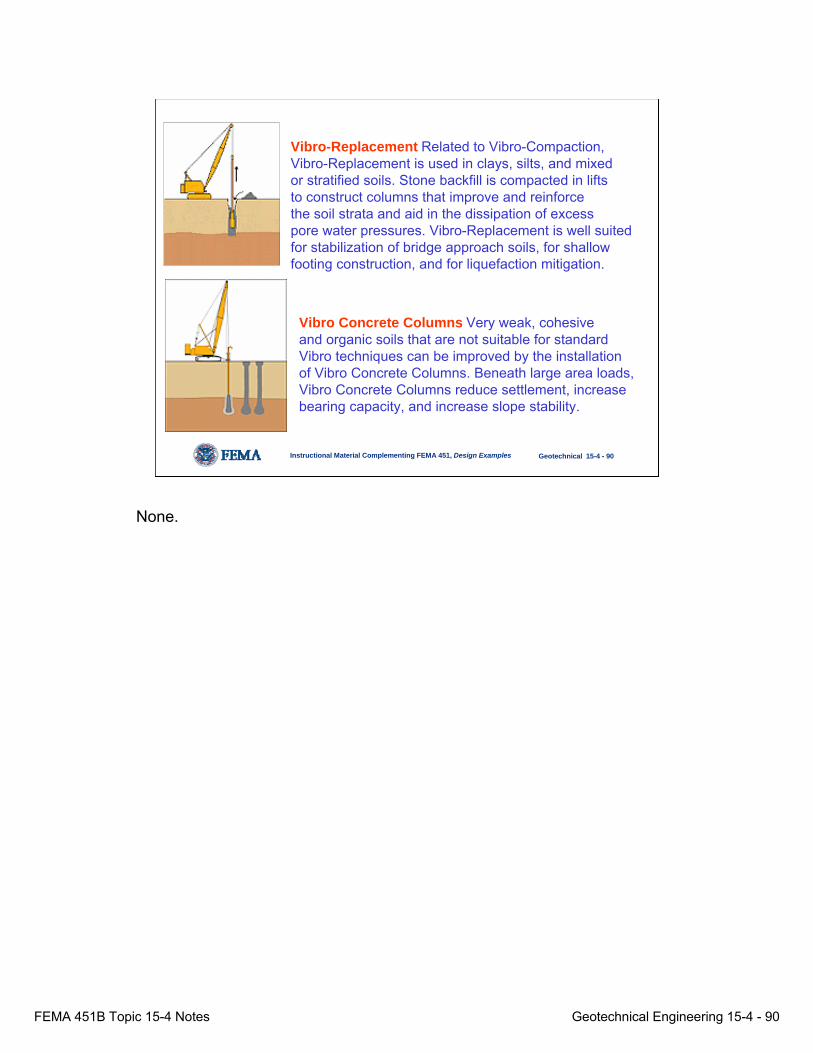
Vibro-Replacement Related to Vibro-Compaction, Vibro-Replacement is used in clays, silts, and mixed or stratified soils. Stone backfill is compacted in lifts to construct columns that improve and reinforce the soil strata and aid in the dissipation of excess pore water pressures. Vibro-Replacement is well suited for stabilization of bridge approach soils, for shallow footing construction, and for liquefaction mitigation.
Vibro Concrete Columns Very weak, cohesive and organic soils that are not suitable for standard Vibro techniques can be improved by the installation of Vibro Concrete Columns. Beneath large area loads, Vibro Concrete Columns reduce settlement, increase bearing capacity, and increase slope stability.
None.
FEMA 451B Topic 15-4 Notes Geotechnical Engineering 15-4 - 91
Instructional Material Complementing FEMA 451, Design Examples Geotechnical 15-4 - 91
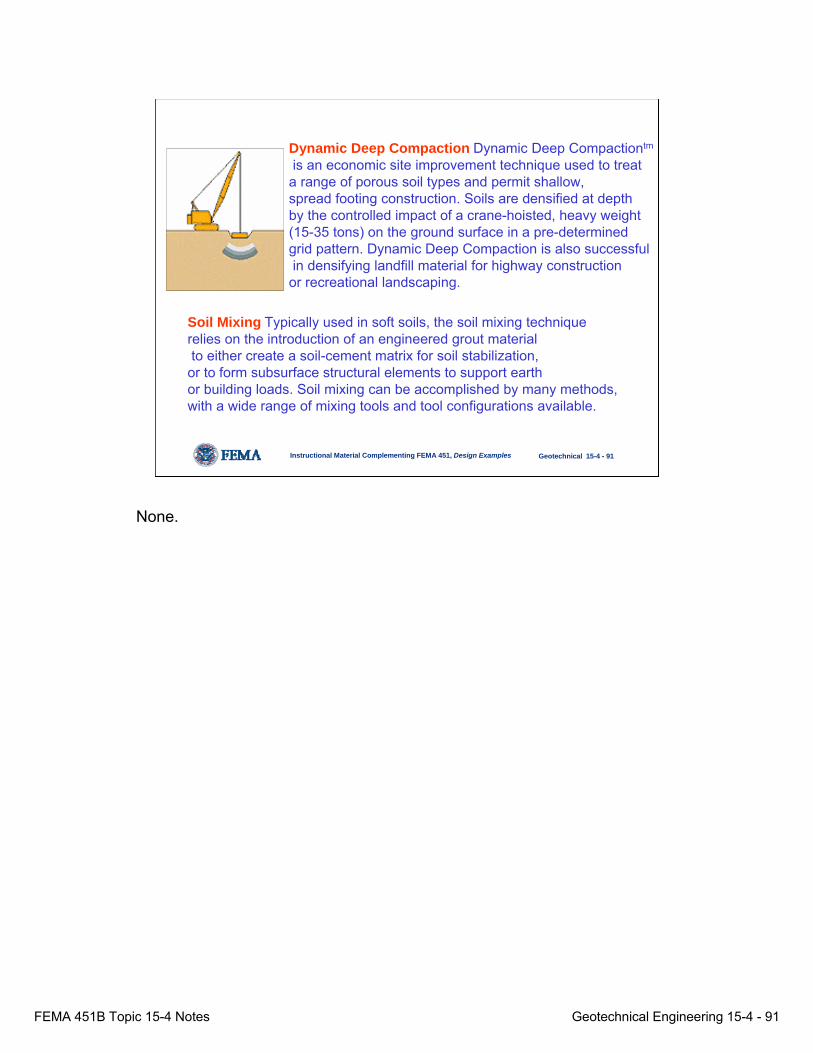
Dynamic Deep Compaction Dynamic Deep Compactiontm
is an economic site improvement technique used to treat a range of porous soil types and permit shallow, spread footing construction. Soils are densified at depth by the controlled impact of a crane-hoisted, heavy weight (15-35 tons) on the ground surface in a pre-determined grid pattern. Dynamic Deep Compaction is also successfulin densifying landfill material for highway construction
or recreational landscaping.
Soil Mixing Typically used in soft soils, the soil mixing technique relies on the introduction of an engineered grout materialto either create a soil-cement matrix for soil stabilization, or to form subsurface structural elements to support earth or building loads. Soil mixing can be accomplished by many methods, with a wide range of mixing tools and tool configurations available.
None.
FEMA 451B Topic 15-4 Notes Geotechnical Engineering 15-4 - 92
Instructional Material Complementing FEMA 451, Design Examples Geotechnical 15-4 - 92
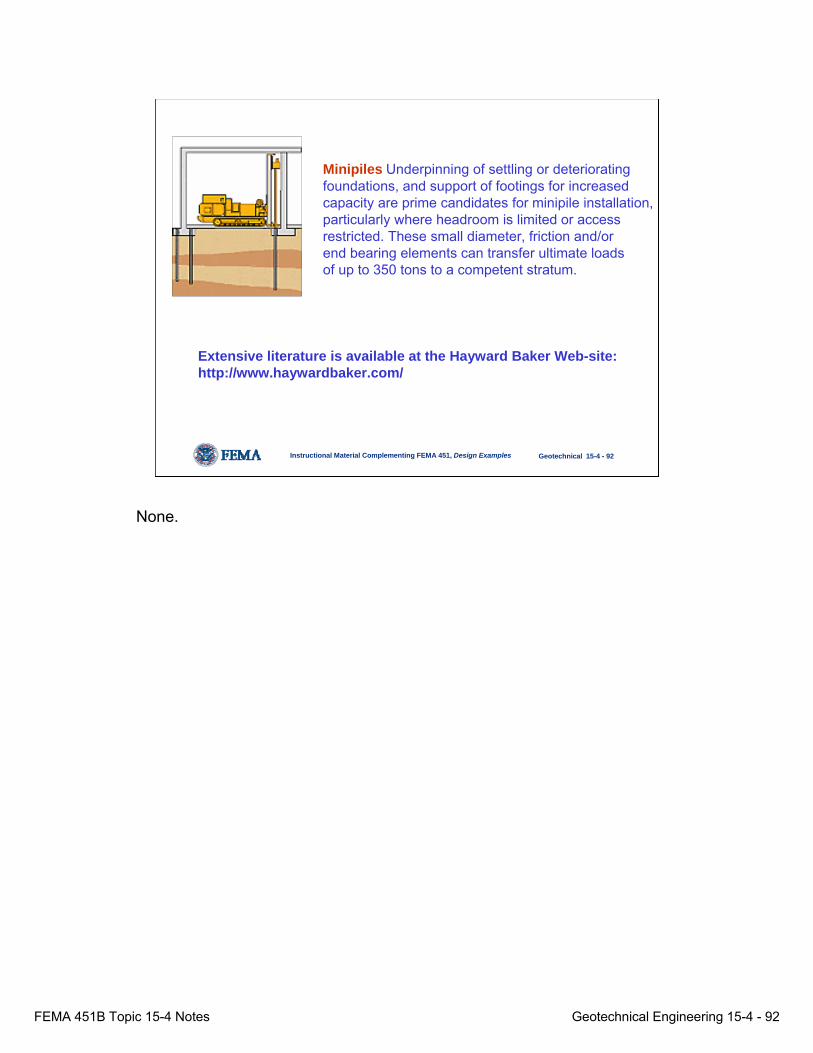
Minipiles Underpinning of settling or deteriorating foundations, and support of footings for increased capacity are prime candidates for minipile installation,particularly where headroom is limited or access restricted. These small diameter, friction and/or end bearing elements can transfer ultimate loads of up to 350 tons to a competent stratum.
Extensive literature is available at the Hayward Baker Web-site:http://www.haywardbaker.com/
None.

FEMA 451B Topic 15-4 Notes Geotechnical Engineering 15-4 - 93
Instructional Material Complementing FEMA 451, Design Examples Geotechnical 15-4 - 93
Vibrocompaction/Vibroreplacement
Figure adapted from Hayward Baker, Inc.
Vibrocompaction/virboreplacement can be an economical liquefaction mitigation approach depending largely upon the fines content of the soil and depth to firm bearing stratum.
FEMA 451B Topic 15-4 Notes Geotechnical Engineering 15-4 - 94
Instructional Material Complementing FEMA 451, Design Examples Geotechnical 15-4 - 94
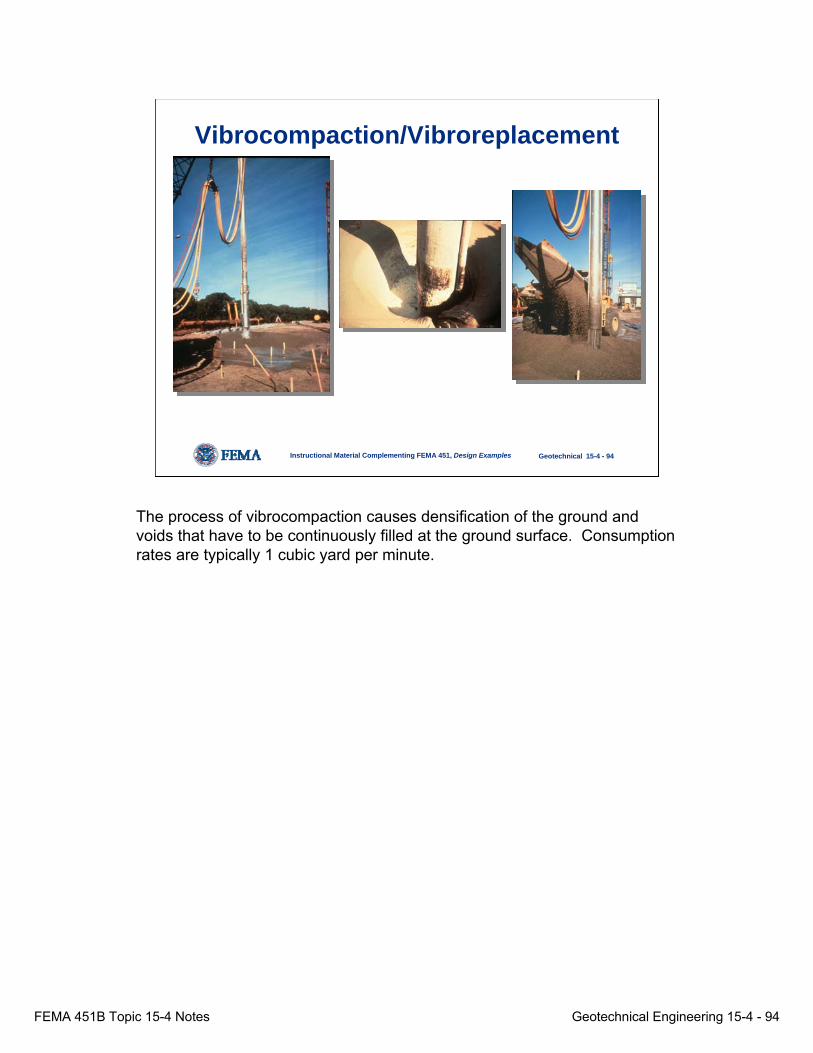
Vibrocompaction/Vibroreplacement
The process of vibrocompaction causes densification of the ground and voids that have to be continuously filled at the ground surface. Consumption rates are typically 1 cubic yard per minute.

FEMA 451B Topic 15-4 Notes Geotechnical Engineering 15-4 - 95
Instructional Material Complementing FEMA 451, Design Examples Geotechnical 15-4 - 95
Vibroreplacement
Vibroreplacement involves significant quantities of stone and/or high quality fill being added and densified.
FEMA 451B Topic 15-4 Notes Geotechnical Engineering 15-4 - 96
Instructional Material Complementing FEMA 451, Design Examples Geotechnical 15-4 - 96
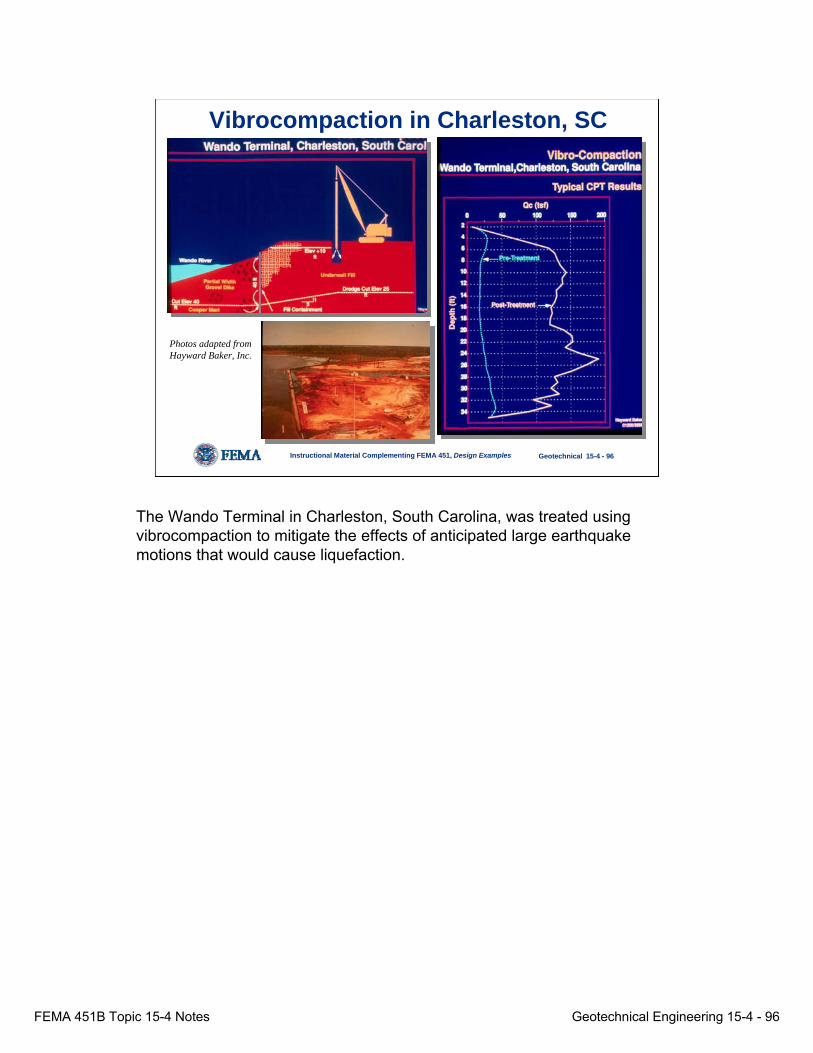
Vibrocompaction in Charleston, SC
Photos adapted from Hayward Baker, Inc.
The Wando Terminal in Charleston, South Carolina, was treated using vibrocompaction to mitigate the effects of anticipated large earthquake motions that would cause liquefaction.
FEMA 451B Topic 15-4 Notes Geotechnical Engineering 15-4 - 97
Instructional Material Complementing FEMA 451, Design Examples Geotechnical 15-4 - 97
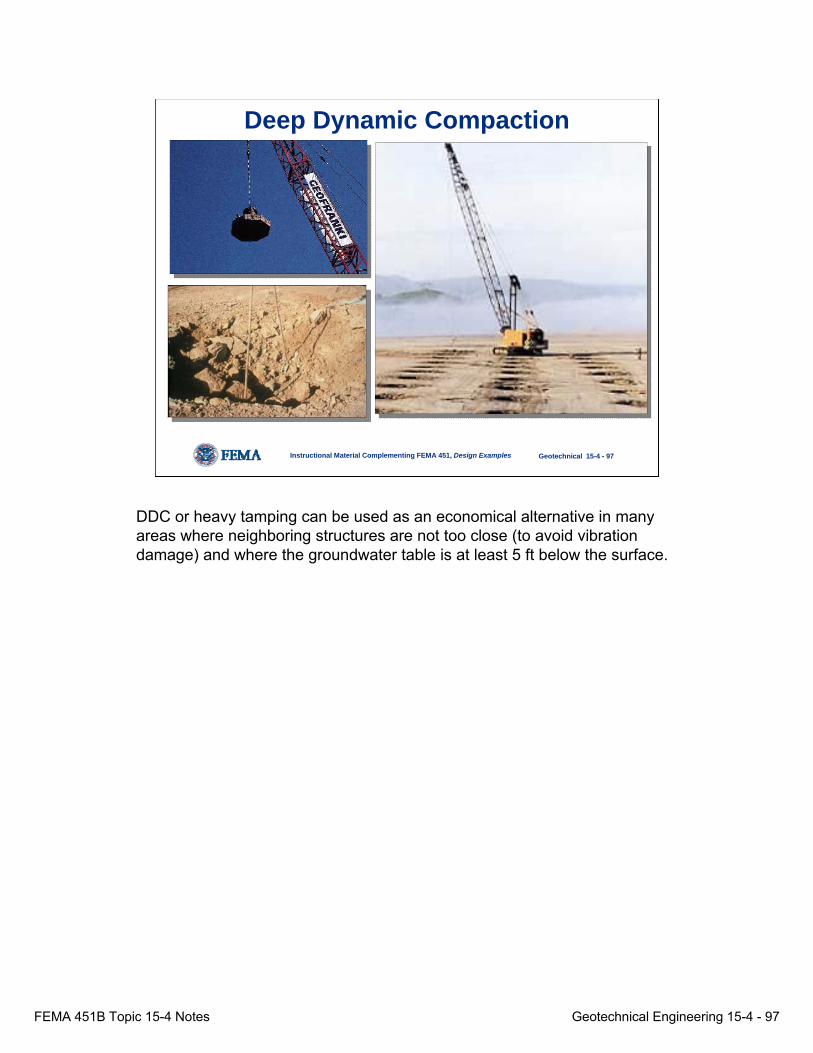
Deep Dynamic Compaction
DDC or heavy tamping can be used as an economical alternative in many areas where neighboring structures are not too close (to avoid vibration damage) and where the groundwater table is at least 5 ft below the surface.
FEMA 451B Topic 15-4 Notes Geotechnical Engineering 15-4 - 98
Instructional Material Complementing FEMA 451, Design Examples Geotechnical 15-4 - 98
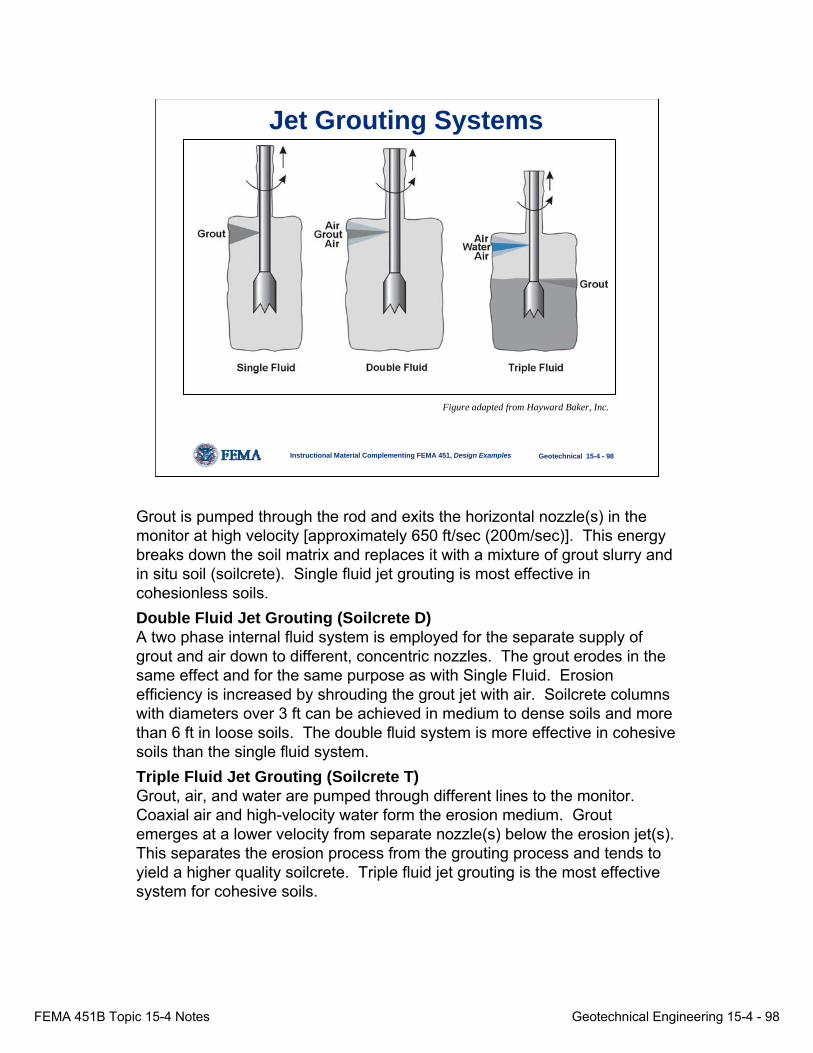
Jet Grouting Systems
Figure adapted from Hayward Baker, Inc.
Grout is pumped through the rod and exits the horizontal nozzle(s) in the monitor at high velocity [approximately 650 ft/sec (200m/sec)]. This energy breaks down the soil matrix and replaces it with a mixture of grout slurry and in situ soil (soilcrete). Single fluid jet grouting is most effective in cohesionless soils. Double Fluid Jet Grouting (Soilcrete D)A two phase internal fluid system is employed for the separate supply of grout and air down to different, concentric nozzles. The grout erodes in the same effect and for the same purpose as with Single Fluid. Erosion efficiency is increased by shrouding the grout jet with air. Soilcrete columns with diameters over 3 ft can be achieved in medium to dense soils and more than 6 ft in loose soils. The double fluid system is more effective in cohesive soils than the single fluid system. Triple Fluid Jet Grouting (Soilcrete T) Grout, air, and water are pumped through different lines to the monitor. Coaxial air and high-velocity water form the erosion medium. Grout emerges at a lower velocity from separate nozzle(s) below the erosion jet(s). This separates the erosion process from the grouting process and tends to yield a higher quality soilcrete. Triple fluid jet grouting is the most effective system for cohesive soils.
FEMA 451B Topic 15-4 Notes Geotechnical Engineering 15-4 - 99
Instructional Material Complementing FEMA 451, Design Examples Geotechnical 15-4 - 99
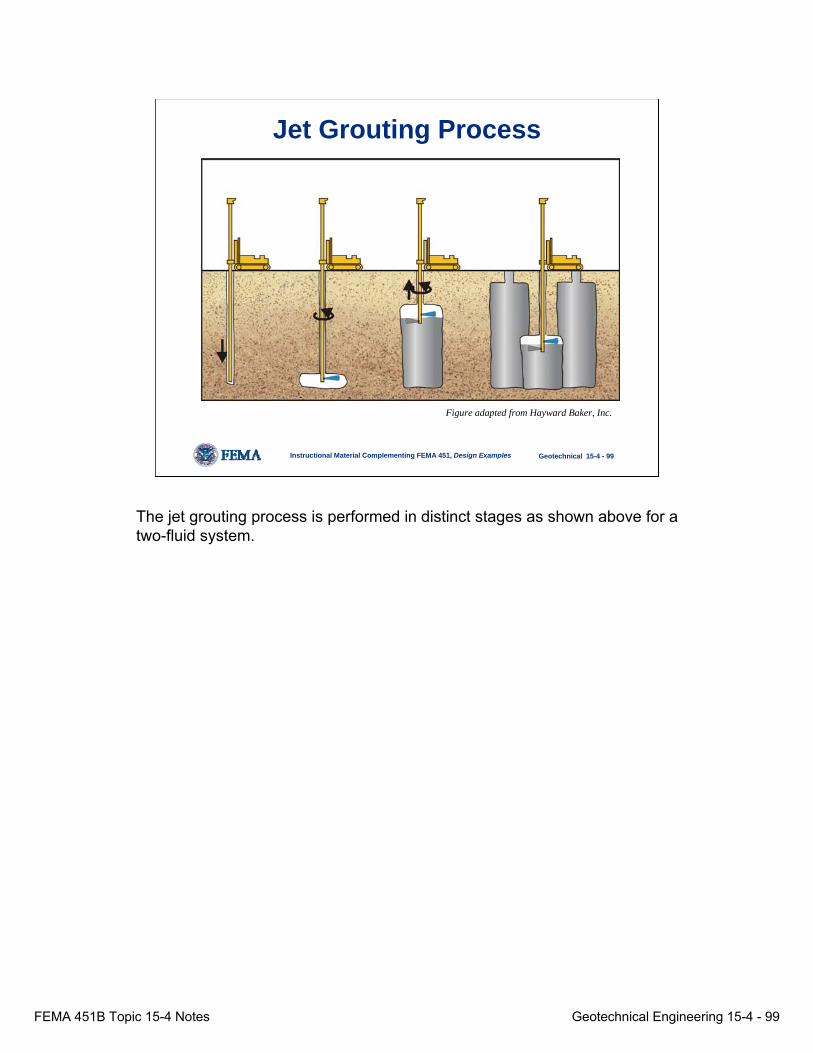
Jet Grouting Process
Figure adapted from Hayward Baker, Inc.
The jet grouting process is performed in distinct stages as shown above for a two-fluid system.
FEMA 451B Topic 15-4 Notes Geotechnical Engineering 15-4 - 100
Instructional Material Complementing FEMA 451, Design Examples Geotechnical 15-4 - 100
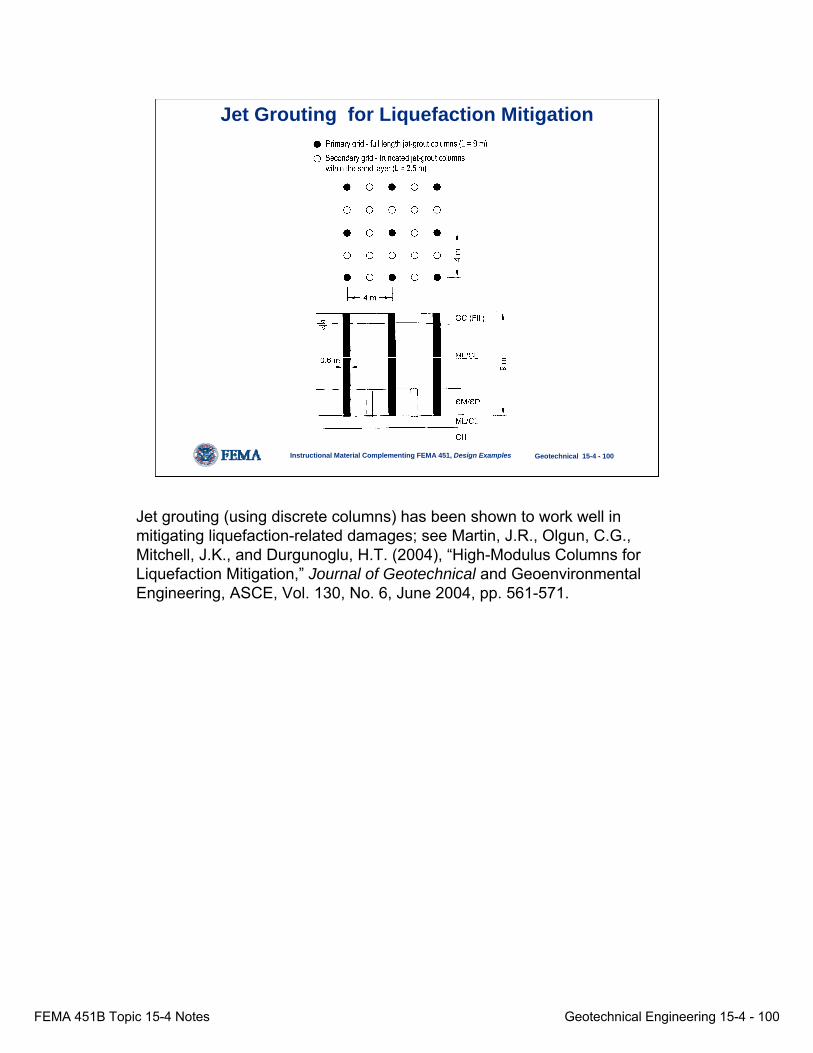
Jet Grouting for Liquefaction Mitigation
Jet grouting (using discrete columns) has been shown to work well in mitigating liquefaction-related damages; see Martin, J.R., Olgun, C.G., Mitchell, J.K., and Durgunoglu, H.T. (2004), “High-Modulus Columns for Liquefaction Mitigation,” Journal of Geotechnical and GeoenvironmentalEngineering, ASCE, Vol. 130, No. 6, June 2004, pp. 561-571.
FEMA 451B Topic 15-4 Notes Geotechnical Engineering 15-4 - 101
Instructional Material Complementing FEMA 451, Design Examples Geotechnical 15-4 - 101
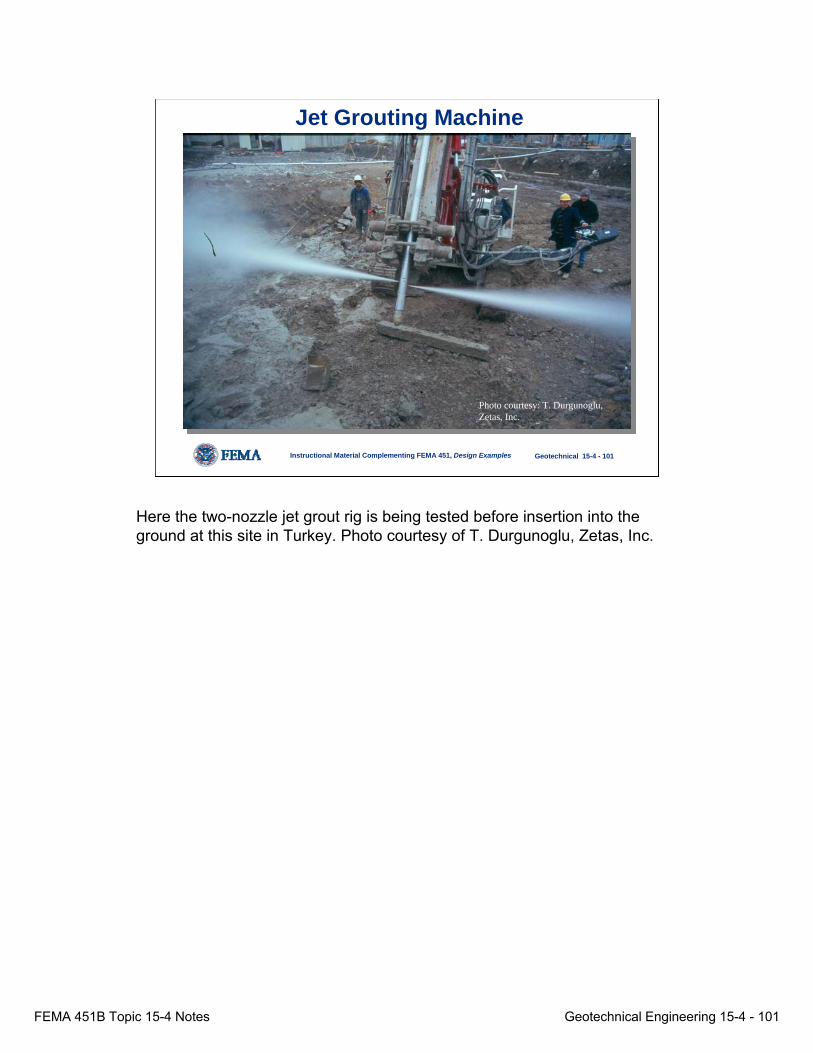
Jet Grouting Machine
Photo courtesy: T. Durgunoglu, Zetas, Inc.
Here the two-nozzle jet grout rig is being tested before insertion into the ground at this site in Turkey. Photo courtesy of T. Durgunoglu, Zetas, Inc.

FEMA 451B Topic 15-4 Notes Geotechnical Engineering 15-4 - 102
Instructional Material Complementing FEMA 451, Design Examples Geotechnical 15-4 - 102
Excavated Jet-Grout Columns
Note variability of column diameters. Strengths also vary greatly. Uncertainty of column diameters is a major source of inefficiency in jet grouting, and one reason this technology is relatively expensive.
FEMA 451B Topic 15-4 Notes Geotechnical Engineering 15-4 - 103
Instructional Material Complementing FEMA 451, Design Examples Geotechnical 15-4 - 103
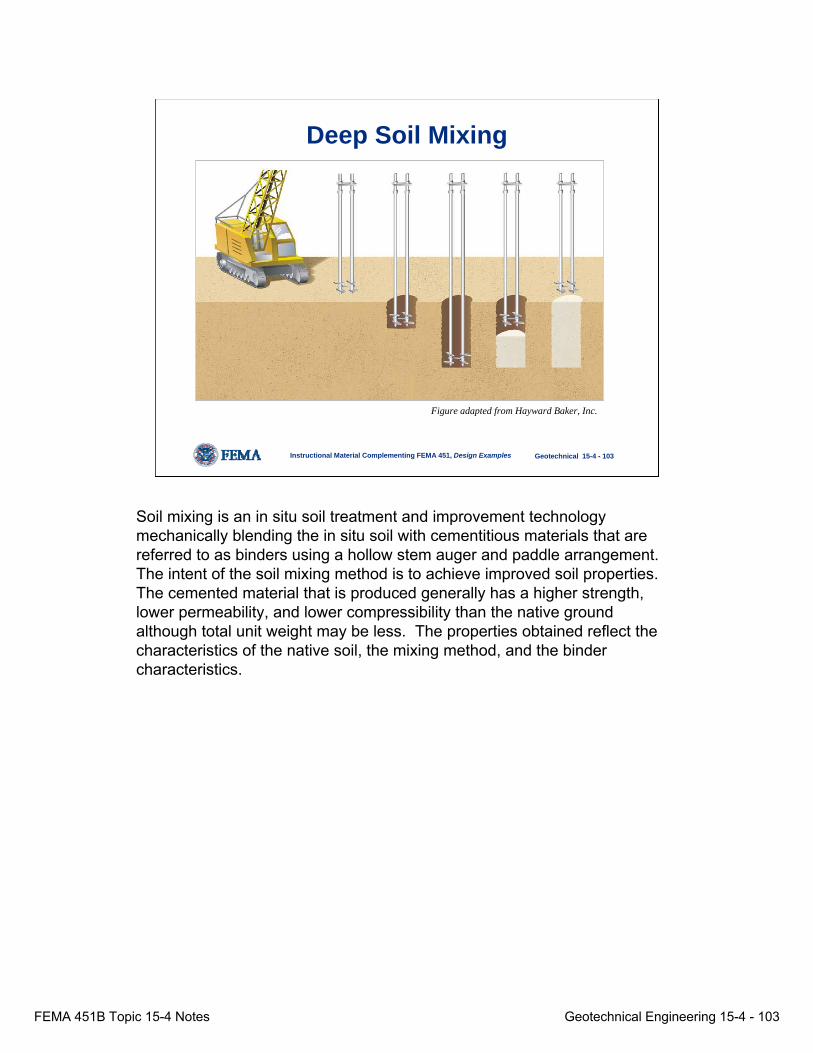
Deep Soil Mixing
Figure adapted from Hayward Baker, Inc.
Soil mixing is an in situ soil treatment and improvement technology mechanically blending the in situ soil with cementitious materials that are referred to as binders using a hollow stem auger and paddle arrangement. The intent of the soil mixing method is to achieve improved soil properties. The cemented material that is produced generally has a higher strength, lower permeability, and lower compressibility than the native ground although total unit weight may be less. The properties obtained reflect the characteristics of the native soil, the mixing method, and the binder characteristics.
FEMA 451B Topic 15-4 Notes Geotechnical Engineering 15-4 - 104
Instructional Material Complementing FEMA 451, Design Examples Geotechnical 15-4 - 104
Deep Soil Mixing
None.
FEMA 451B Topic 15-4 Notes Geotechnical Engineering 15-4 - 105
Instructional Material Complementing FEMA 451, Design Examples Geotechnical 15-4 - 105
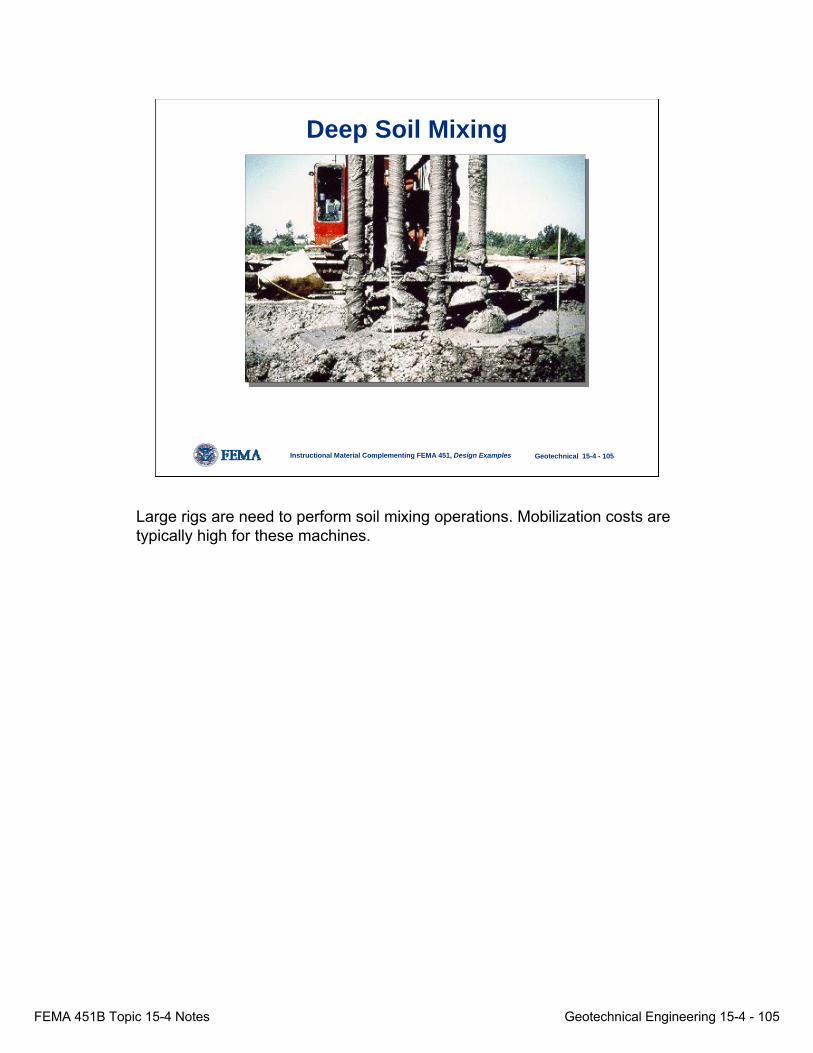
Deep Soil Mixing
Large rigs are need to perform soil mixing operations. Mobilization costs are typically high for these machines.
FEMA 451B Topic 15-4 Notes Geotechnical Engineering 15-4 - 106
Instructional Material Complementing FEMA 451, Design Examples Geotechnical 15-4 - 106
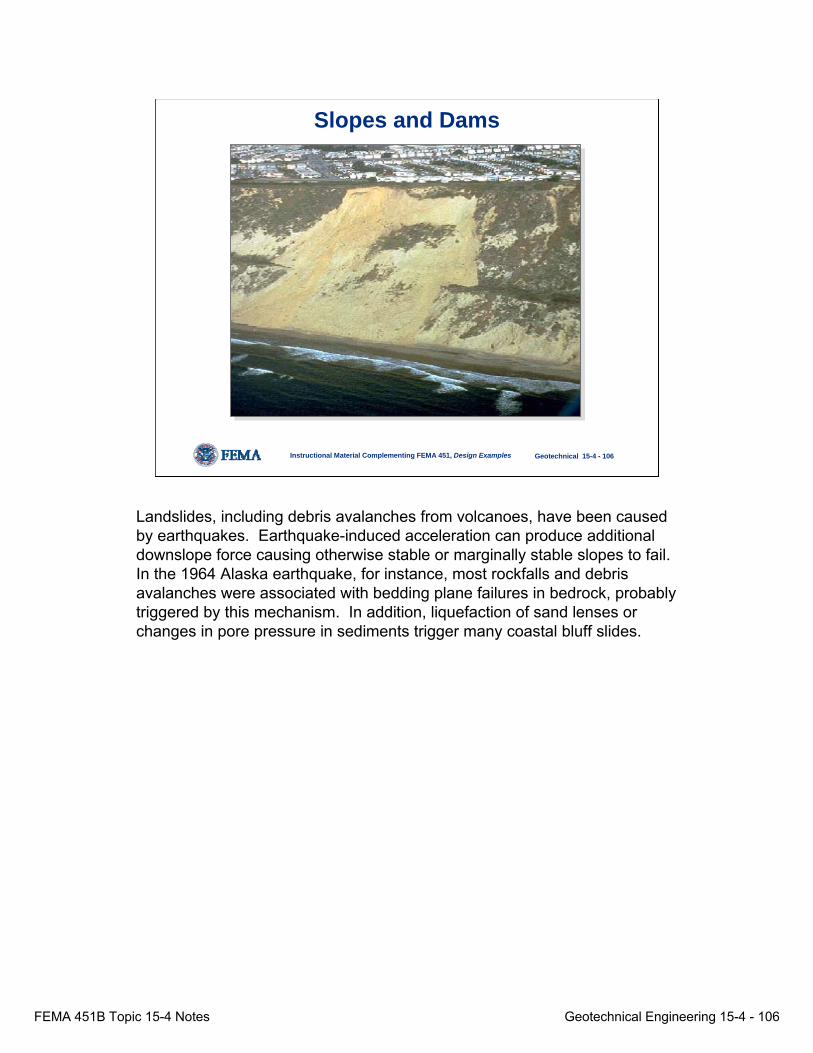
Slopes and Dams
Landslides, including debris avalanches from volcanoes, have been caused by earthquakes. Earthquake-induced acceleration can produce additional downslope force causing otherwise stable or marginally stable slopes to fail. In the 1964 Alaska earthquake, for instance, most rockfalls and debris avalanches were associated with bedding plane failures in bedrock, probably triggered by this mechanism. In addition, liquefaction of sand lenses or changes in pore pressure in sediments trigger many coastal bluff slides.

FEMA 451B Topic 15-4 Notes Geotechnical Engineering 15-4 - 107
Instructional Material Complementing FEMA 451, Design Examples Geotechnical 15-4 - 107
Pseudostatic Analysis
C-of-G
khW
W
τ
σ
• stability is related to the resisting forces (soil strength) and driving forces (inertial forces)
• seismic coefficient (kh) to represent horizontal inertia forces from earthquake
• seismic coefficient is related to PGA
• insufficient to represent dynamics of the problem
Pseudostatic analysis is used for simple slope design to account for seismicforces.
FEMA 451B Topic 15-4 Notes Geotechnical Engineering 15-4 - 108
Instructional Material Complementing FEMA 451, Design Examples Geotechnical 15-4 - 108
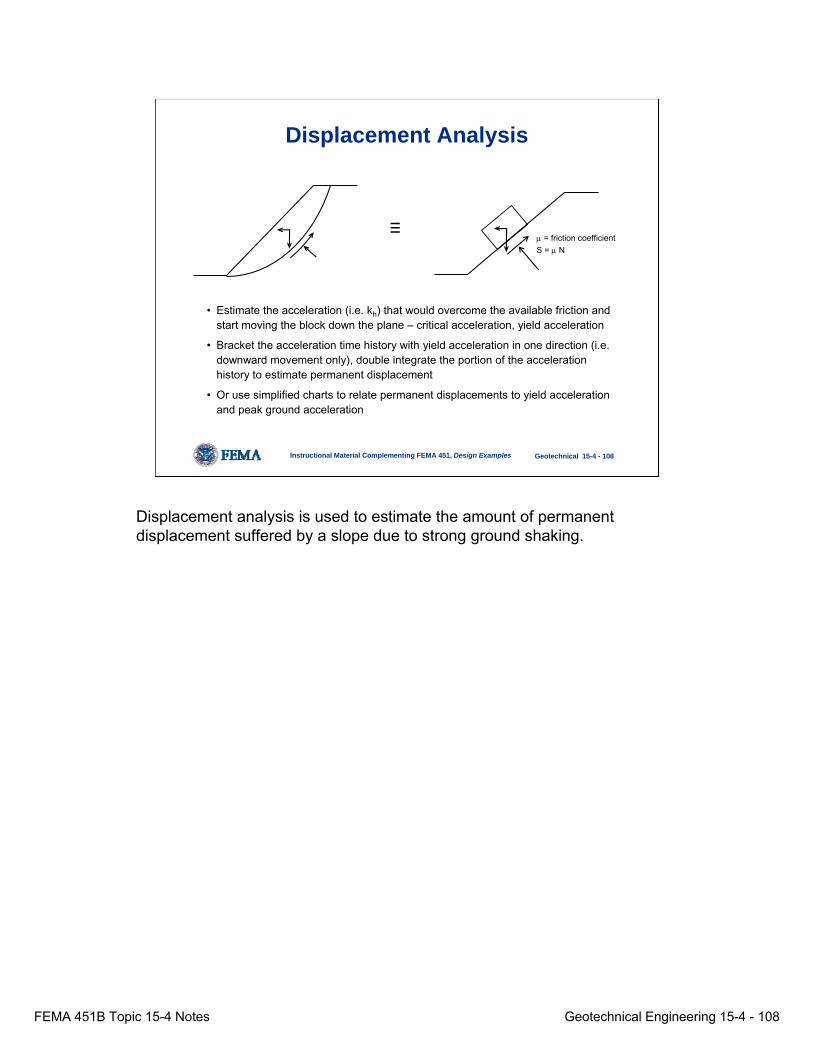
Displacement Analysis
• Estimate the acceleration (i.e. kh) that would overcome the available friction and start moving the block down the plane – critical acceleration, yield acceleration
• Bracket the acceleration time history with yield acceleration in one direction (i.e. downward movement only), double integrate the portion of the acceleration history to estimate permanent displacement
• Or use simplified charts to relate permanent displacements to yield acceleration and peak ground acceleration
≡μ = friction coefficientS = μ N
Displacement analysis is used to estimate the amount of permanent displacement suffered by a slope due to strong ground shaking.
FEMA 451B Topic 15-4 Notes Geotechnical Engineering 15-4 - 109
Instructional Material Complementing FEMA 451, Design Examples Geotechnical 15-4 - 109
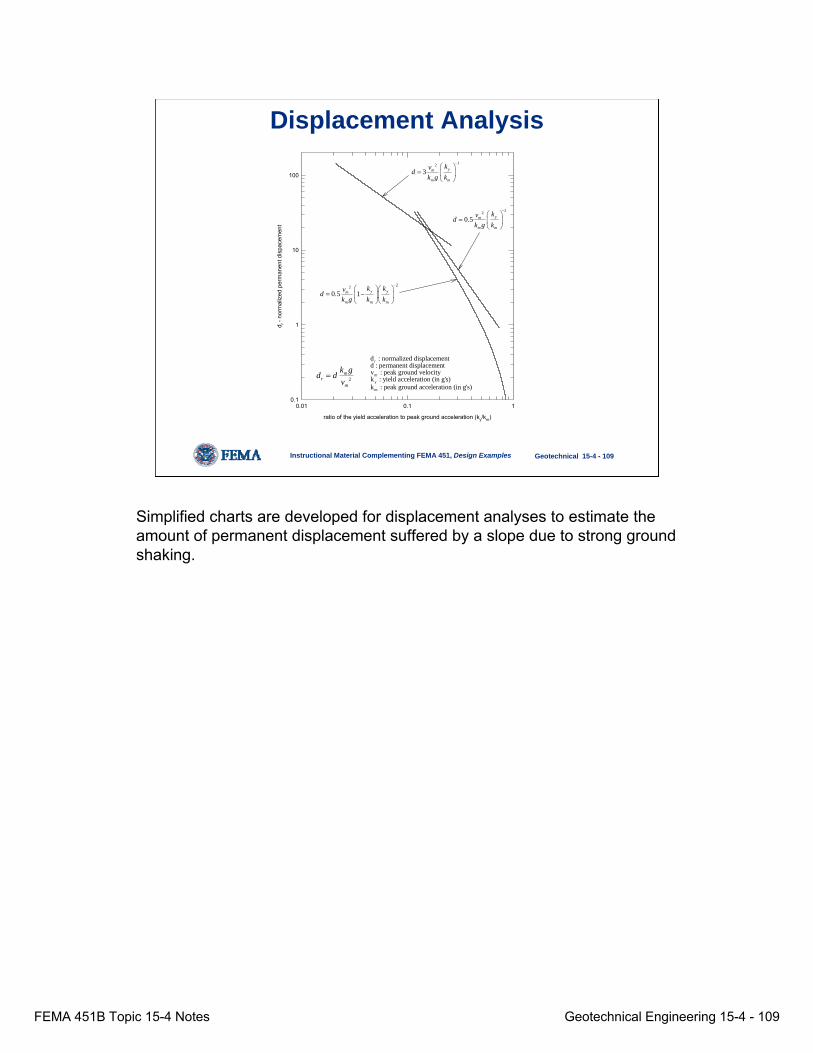
Displacement Analysis
ratio of the yield acceleration to peak ground acceleration (ky/km)
0.01 0.1 1
d r - n
orm
aliz
ed p
erm
anen
t dis
pace
men
t
0.1
1
10
100
22
0.5 1 y ym
m m m
k kvdk g k k
−⎛ ⎞⎛ ⎞
= −⎜ ⎟⎜ ⎟⎝ ⎠⎝ ⎠
22
0.5 ym
m m
kvdk g k
−⎛ ⎞
= ⎜ ⎟⎝ ⎠
12
3 ym
m m
kvdk g k
−⎛ ⎞
= ⎜ ⎟⎝ ⎠
2m
rm
k gd dv
=
r
m
y
m
d : normalized displacementd : permanent displacementv : peak ground velocityk : yield acceleration (in g's)k : peak ground acceleration (in g's)
Simplified charts are developed for displacement analyses to estimate the amount of permanent displacement suffered by a slope due to strong ground shaking.
FEMA 451B Topic 15-4 Notes Geotechnical Engineering 15-4 - 110
Instructional Material Complementing FEMA 451, Design Examples Geotechnical 15-4 - 110
Soil-Structure Foundation Interaction- SSFI
• Traditionally considered conservative to ignore (flexible foundations transmit less motion to superstructure, vice versa);
• However, recent studies from (i.e., 1995 Kobe, Japan EQ) suggest SSFI effects may actually increase ductility demand in some structures
None.
FEMA 451B Topic 15-4 Notes Geotechnical Engineering 15-4 - 111
Instructional Material Complementing FEMA 451, Design Examples Geotechnical 15-4 - 111
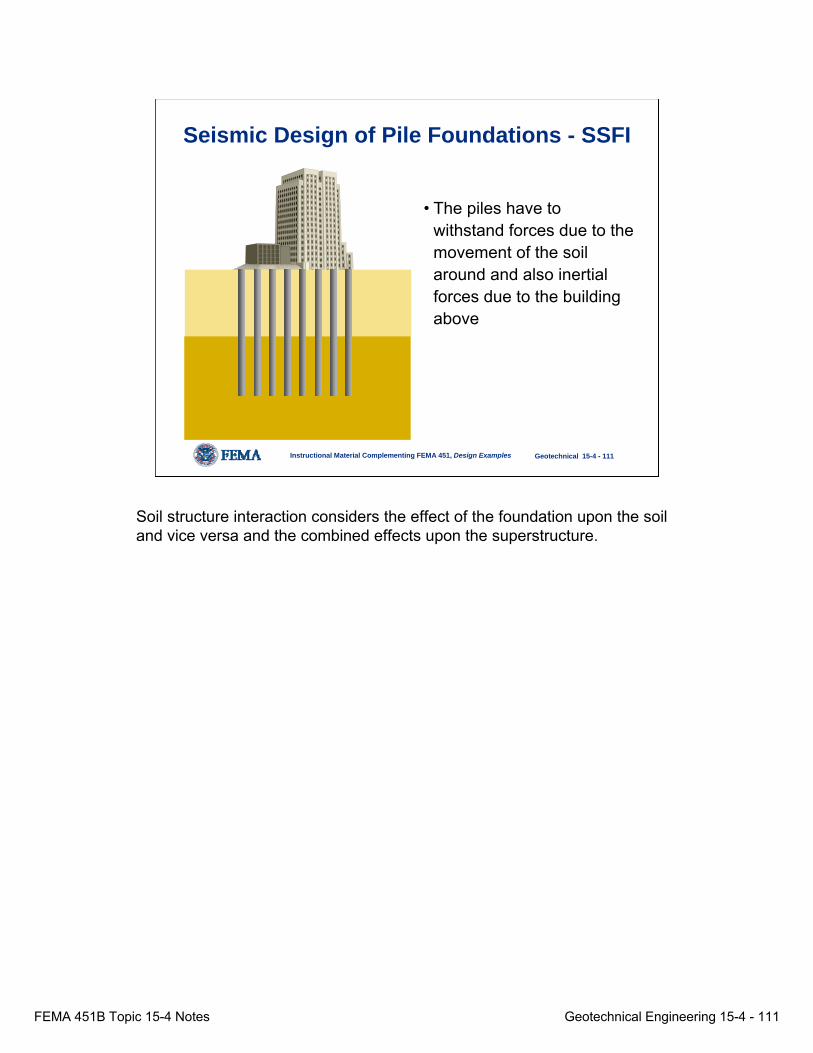
Seismic Design of Pile Foundations - SSFI
• The piles have to withstand forces due to the movement of the soil around and also inertial forces due to the building above
Soil structure interaction considers the effect of the foundation upon the soil and vice versa and the combined effects upon the superstructure.
FEMA 451B Topic 15-4 Notes Geotechnical Engineering 15-4 - 112
Instructional Material Complementing FEMA 451, Design Examples Geotechnical 15-4 - 112
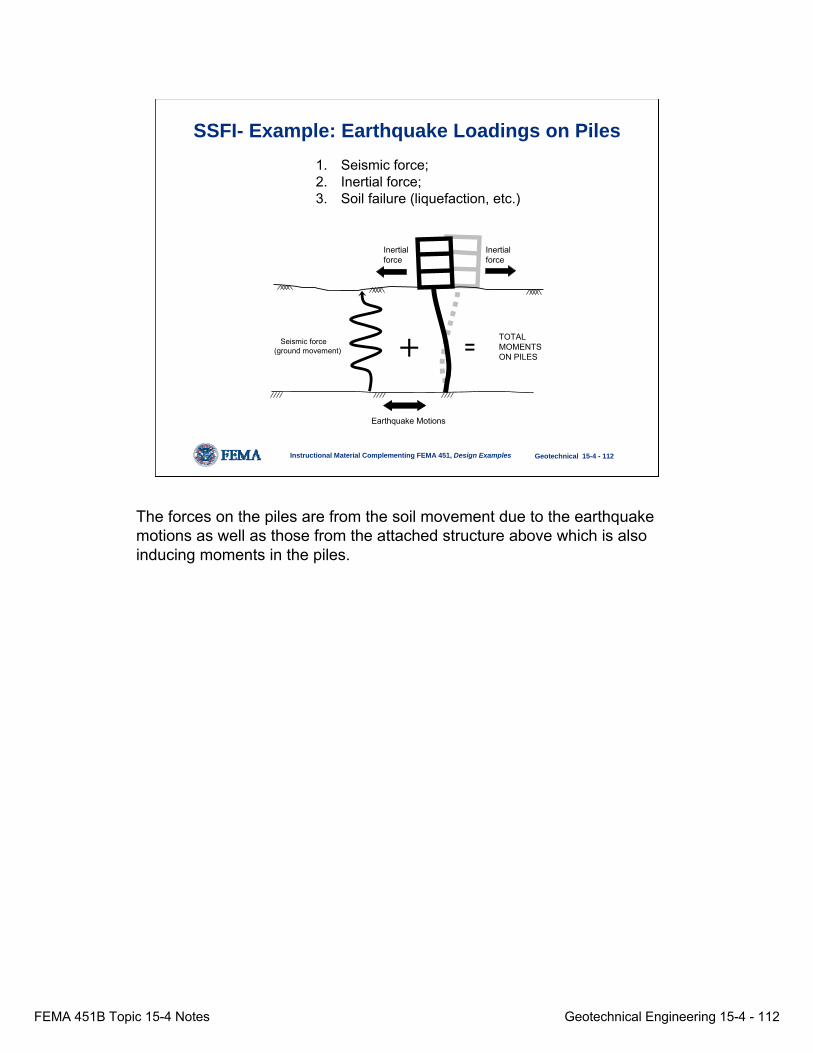
SSFI- Example: Earthquake Loadings on Piles
+Seismic force(ground movement)
Inertial force
Inertial force
TOTAL MOMENTS ON PILES
=
Earthquake Motions
1. Seismic force; 2. Inertial force; 3. Soil failure (liquefaction, etc.)
The forces on the piles are from the soil movement due to the earthquake motions as well as those from the attached structure above which is also inducing moments in the piles.
FEMA 451B Topic 15-4 Notes Geotechnical Engineering 15-4 - 113
Instructional Material Complementing FEMA 451, Design Examples Geotechnical 15-4 - 113
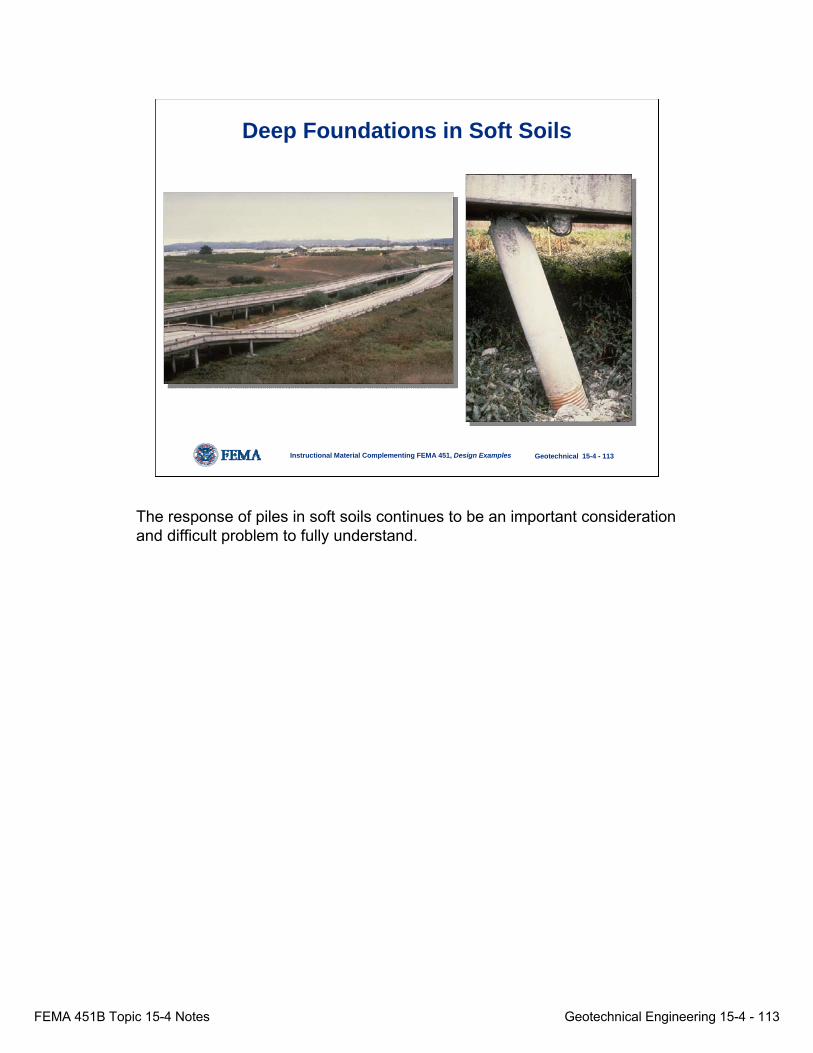
Deep Foundations in Soft Soils
The response of piles in soft soils continues to be an important consideration and difficult problem to fully understand.
FEMA 451B Topic 15-4 Notes Geotechnical Engineering 15-4 - 114
Instructional Material Complementing FEMA 451, Design Examples Geotechnical 15-4 - 114
IBC 2003 Primary Geotechnical Issues
• Map-based procedure not ideally suited for geotechnical analyses
• Interpretation of soil categories not straight forward (i.e., What is “F” site?)
There are a number of specific IBC 2003 geotechnical issues and concerns.
FEMA 451B Topic 15-4 Notes Geotechnical Engineering 15-4 - 115
Instructional Material Complementing FEMA 451, Design Examples Geotechnical 15-4 - 115
National Seismic Hazard Maps & IBC Issues for Geotechnical Use
• Maps generalized and not originally intended for site-specific analysis that account for the effects of local soil conditions, such as liquefaction.
• Map-based site classification procedure does not work as well for complex, layered soil profiles (site class based on average of top 30 m or 100 ft.)– think of 30 ft. of medium clay on top of hard rock– should this really be a “C” site?
• Modifications of ground motions for the effects of local soil conditions using the maps is not well-established
• Maps do not account for regional geology
None.
FEMA 451B Topic 15-4 Notes Geotechnical Engineering 15-4 - 116
Instructional Material Complementing FEMA 451, Design Examples Geotechnical 15-4 - 116
National Seismic Hazard Maps & IBCIssues for Geotechnical Use
• Further away from original design intent, the fewer guidelines are available (structural engineer⇒geotech engineer ⇒ seismologist)
• Maps developed mainly for structural design • Earthquake magnitude/duration not provided directly,
only pga’s (M requires deaggregation)• For structures with elastic response, duration is not as
important per se• Magnitude/duration is very important for most
geotechnical analyses (non-linear behavior)
None.
FEMA 451B Topic 15-4 Notes Geotechnical Engineering 15-4 - 117
Instructional Material Complementing FEMA 451, Design Examples Geotechnical 15-4 - 117
IBC 2003 Geotechnical Design Issues
• Provisions (Chap. 18) recommend SDS/2.5 for liquefaction analysis ⇒ SDS factored by 2/3, and 2/3 is from structural considerations, not soil-- this is inconsistent!!
• Structures can factor MCE by 2/3, but not soils ⇒ new IBC Provisions affect geotechnical analyses more than structural analyses
• 20% limitation in reduction of map-based design motions based on site-specific analysis, but no simplified approach available for Class “F” sites ⇒leads to loophole.
• What is “F” site not always clear (i.e. “liquefaction”)
None.

FEMA 451B Topic 15-4 Notes Geotechnical Engineering 15-4 - 118
Instructional Material Complementing FEMA 451, Design Examples Geotechnical 15-4 - 118
IBC Geotechnical issues
Again, the F sites are of primary concern and require site-specific analysis.
FEMA 451B Topic 15-4 Notes Geotechnical Engineering 15-4 - 119
Instructional Material Complementing FEMA 451, Design Examples Geotechnical 15-4 - 119
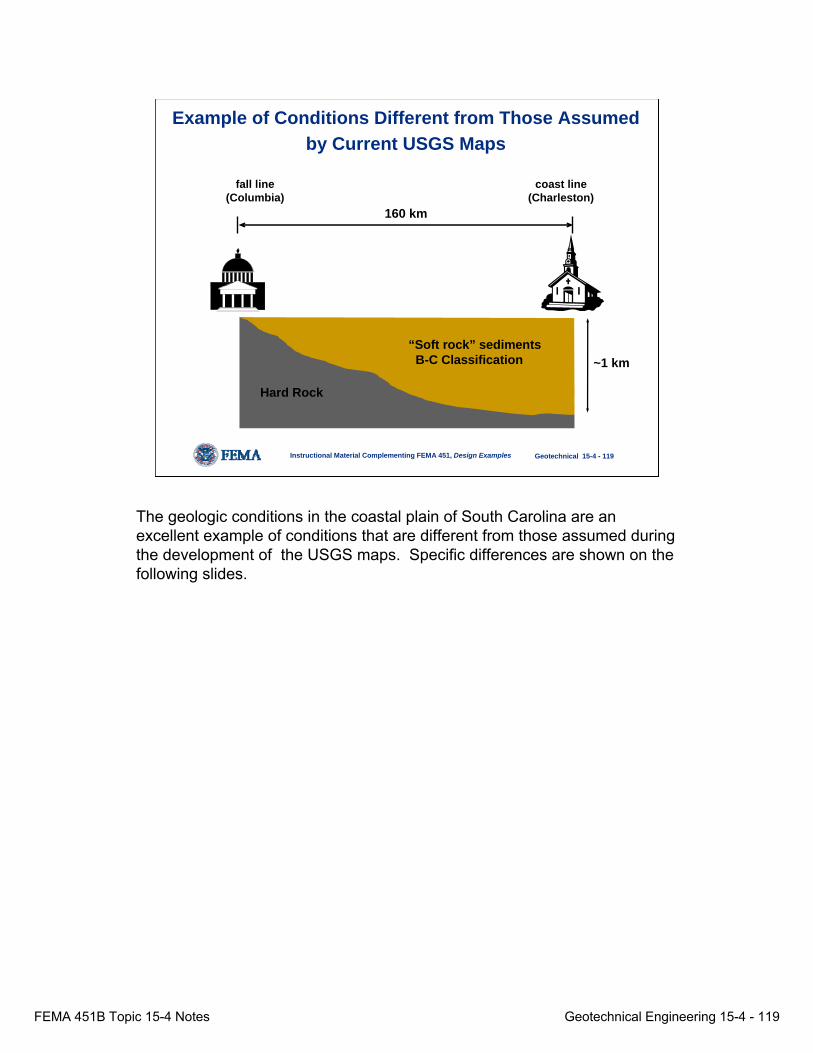
Example of Conditions Different from Those Assumed by Current USGS Maps
coast line(Charleston)
fall line(Columbia)
160 km
~1 km“Soft rock” sediments
B-C Classification
Hard Rock
The geologic conditions in the coastal plain of South Carolina are an excellent example of conditions that are different from those assumed during the development of the USGS maps. Specific differences are shown on the following slides.
FEMA 451B Topic 15-4 Notes Geotechnical Engineering 15-4 - 120
Instructional Material Complementing FEMA 451, Design Examples Geotechnical 15-4 - 120
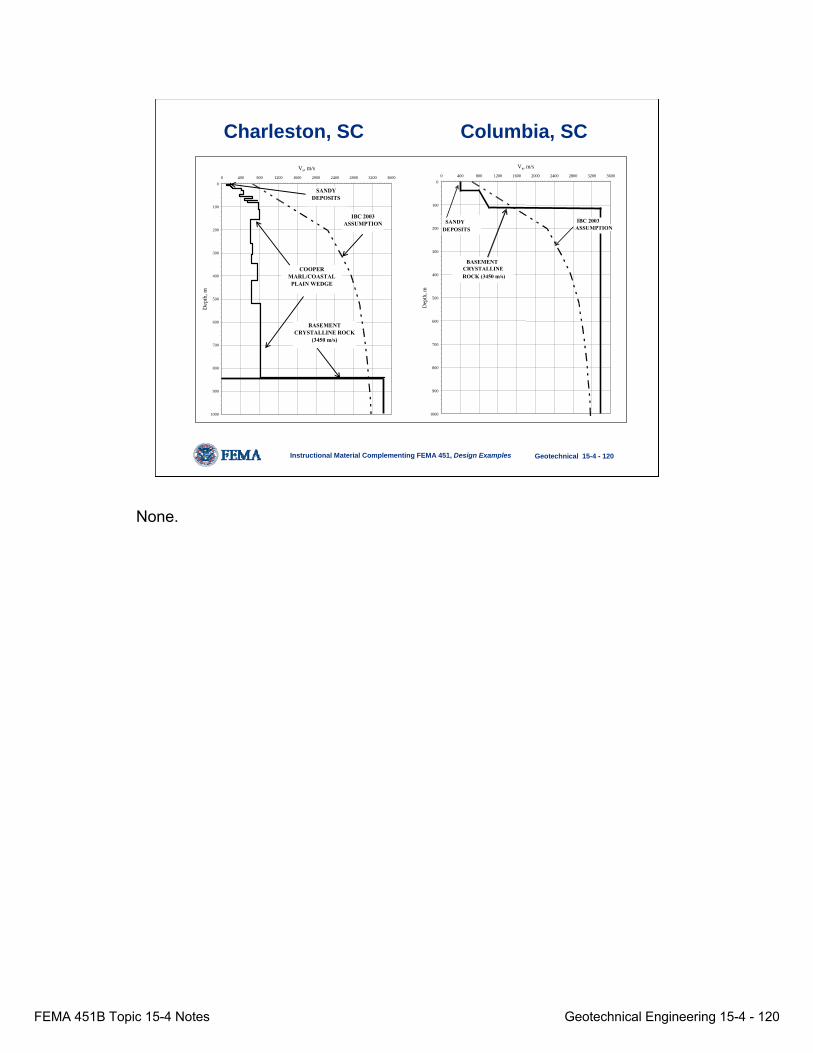
Charleston, SC Columbia, SC
0
100
200
300
400
500
600
700
800
900
1000
0 400 800 1200 1600 2000 2400 2800 3200 3600
Vs, m/s
Dep
th, m
SANDY DEPOSITS
BASEMENT CRYSTALLINE ROCK
(3450 m/s)
COOPER MARL/COASTAL PLAIN WEDGE
IBC 2003 ASSUMPTION
0
100
200
300
400
500
600
700
800
900
1000
0 400 800 1200 1600 2000 2400 2800 3200 3600
Vs, m/s
Dep
th, m
SANDY DEPOSITS
BASEMENT CRYSTALLINE ROCK (3450 m/s)
IBC 2003 ASSUMPTION
None.
FEMA 451B Topic 15-4 Notes Geotechnical Engineering 15-4 - 121
Instructional Material Complementing FEMA 451, Design Examples Geotechnical 15-4 - 121
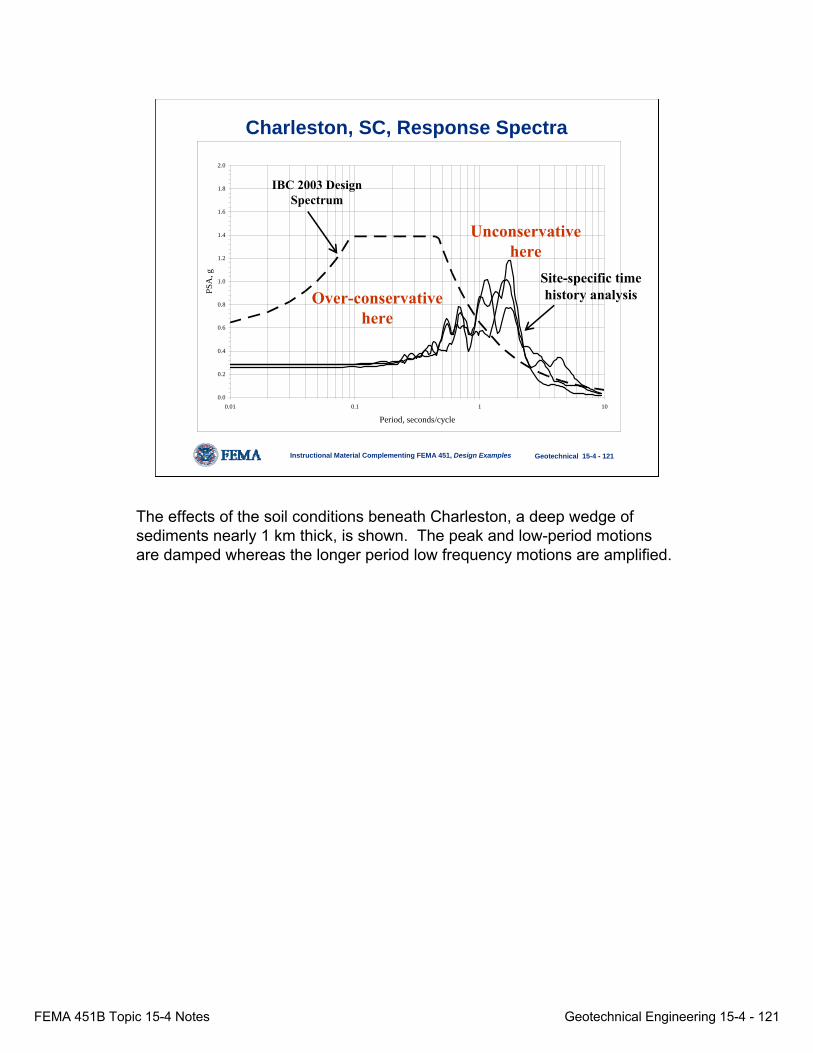
Charleston, SC, Response Spectra
0.0
0.2
0.4
0.6
0.8
1.0
1.2
1.4
1.6
1.8
2.0
0.01 0.1 1 10
Period, seconds/cycle
PSA
, g
IBC 2003 Design Spectrum
Unconservative here
Over-conservative here
Site-specific time history analysis
The effects of the soil conditions beneath Charleston, a deep wedge of sediments nearly 1 km thick, is shown. The peak and low-period motions are damped whereas the longer period low frequency motions are amplified.
FEMA 451B Topic 15-4 Notes Geotechnical Engineering 15-4 - 122
Instructional Material Complementing FEMA 451, Design Examples Geotechnical 15-4 - 122
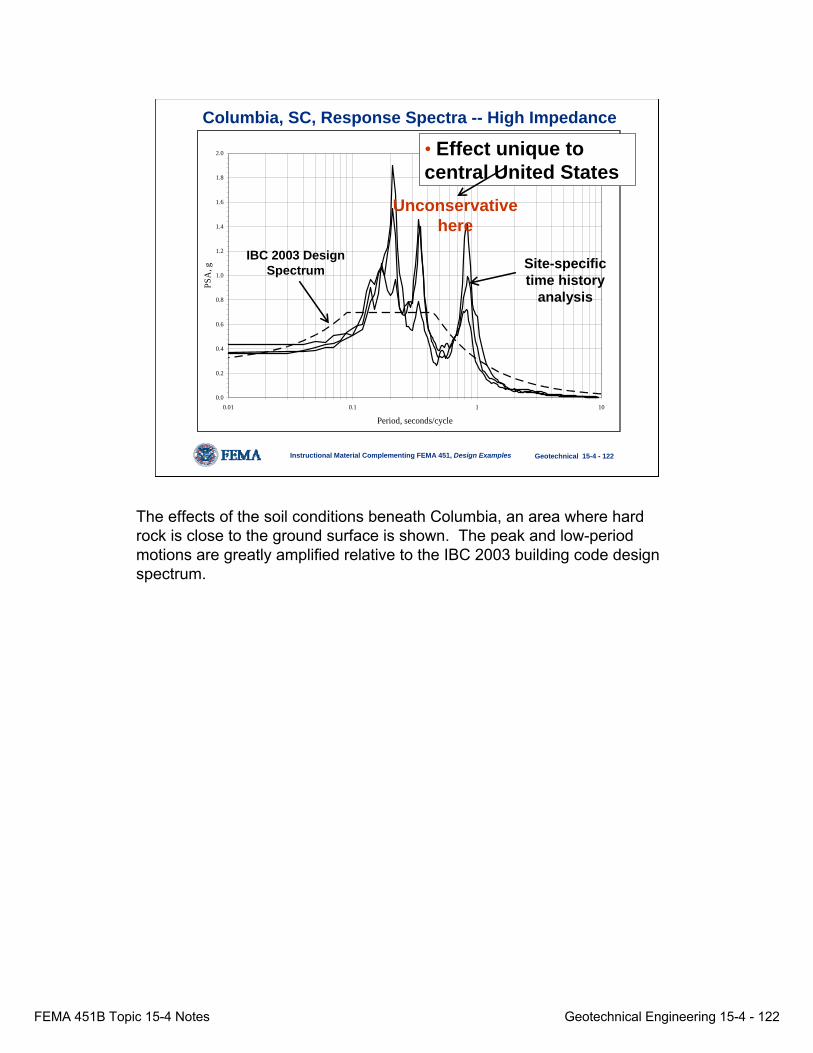
Columbia, SC, Response Spectra -- High Impedance
0.0
0.2
0.4
0.6
0.8
1.0
1.2
1.4
1.6
1.8
2.0
0.01 0.1 1 10
Period, seconds/cycle
PSA
, g Site-specific time history
analysis
IBC 2003 Design Spectrum
Unconservative here
• Effect unique to central United States
The effects of the soil conditions beneath Columbia, an area where hard rock is close to the ground surface is shown. The peak and low-period motions are greatly amplified relative to the IBC 2003 building code design spectrum.
FEMA 451B Topic 15-4 Notes Geotechnical Engineering 15-4 - 123
Instructional Material Complementing FEMA 451, Design Examples Geotechnical 15-4 - 123
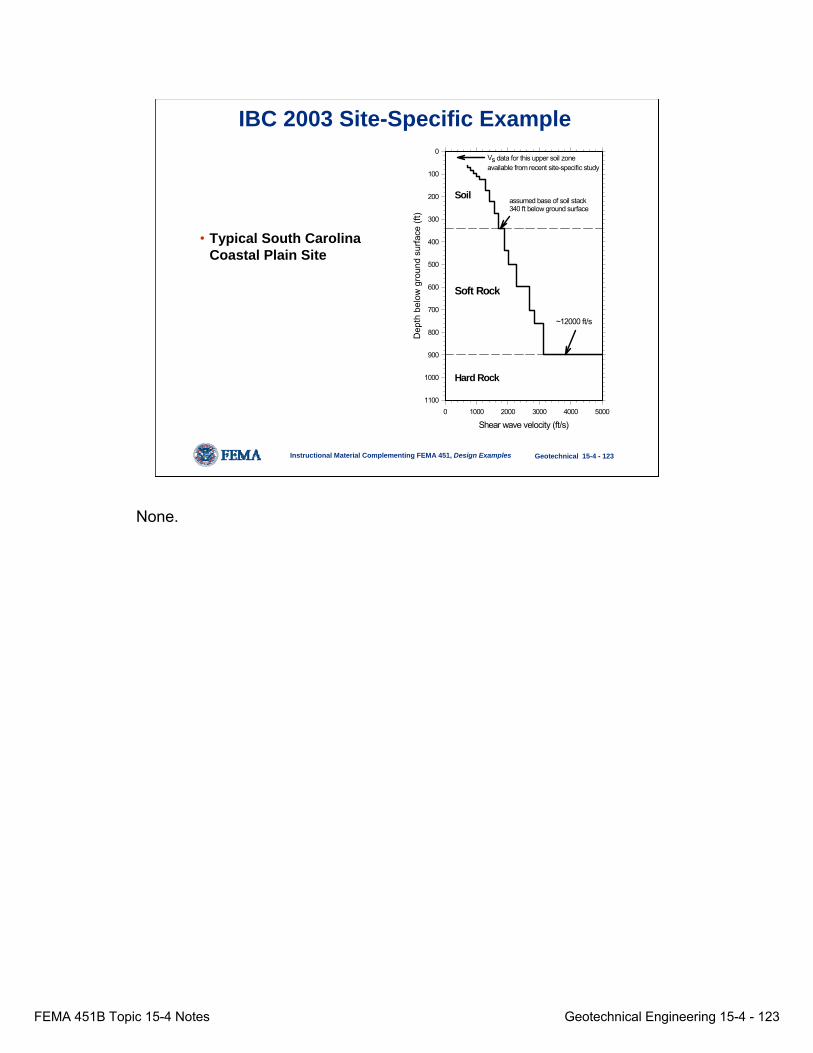
• Typical South CarolinaCoastal Plain Site
Shear wave velocity (ft/s)0 1000 2000 3000 4000 5000
Dep
th b
elow
gro
und
surfa
ce (f
t)
0
100
200
300
400
500
600
700
800
900
1000
1100
Vs data for this upper soil zone available from recent site-specific study
Soil
Soft Rock
Hard Rock
assumed base of soil stack 340 ft below ground surface
~12000 ft/s
IBC 2003 Site-Specific Example
None.
FEMA 451B Topic 15-4 Notes Geotechnical Engineering 15-4 - 124
Instructional Material Complementing FEMA 451, Design Examples Geotechnical 15-4 - 124
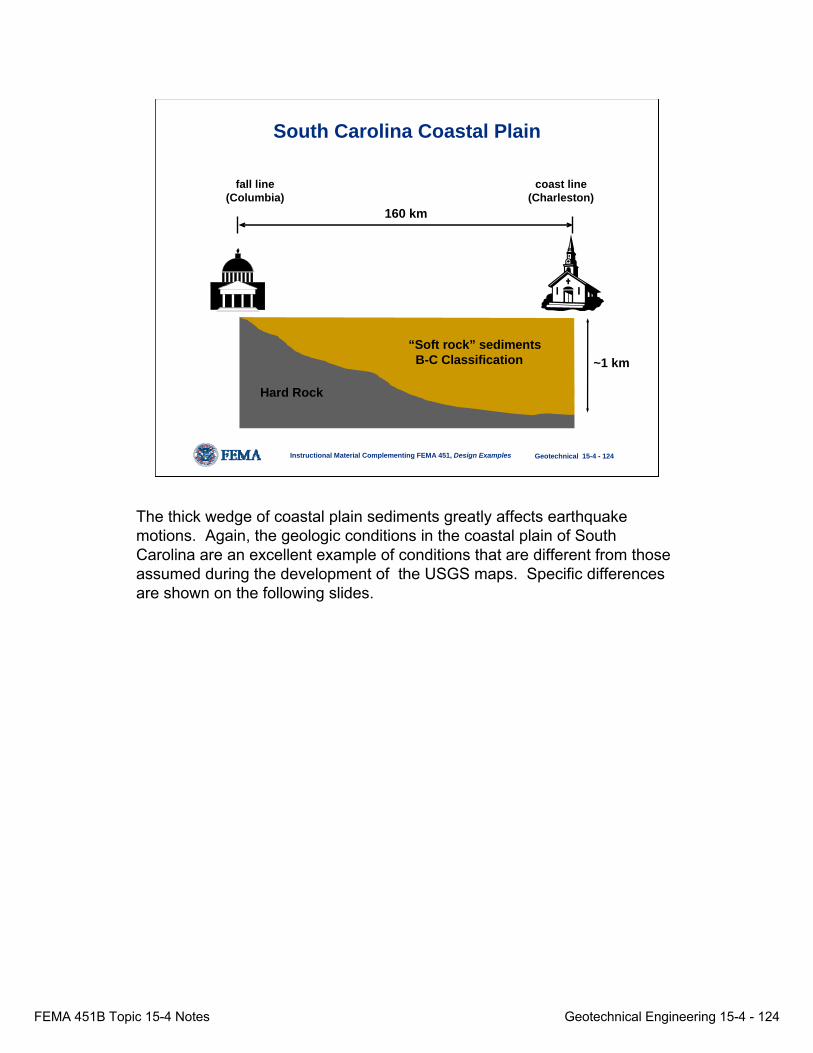
South Carolina Coastal Plain
coast line(Charleston)
fall line(Columbia)
160 km
~1 km“Soft rock” sediments
B-C Classification
Hard Rock
The thick wedge of coastal plain sediments greatly affects earthquake motions. Again, the geologic conditions in the coastal plain of South Carolina are an excellent example of conditions that are different from those assumed during the development of the USGS maps. Specific differences are shown on the following slides.
FEMA 451B Topic 15-4 Notes Geotechnical Engineering 15-4 - 125
Instructional Material Complementing FEMA 451, Design Examples Geotechnical 15-4 - 125
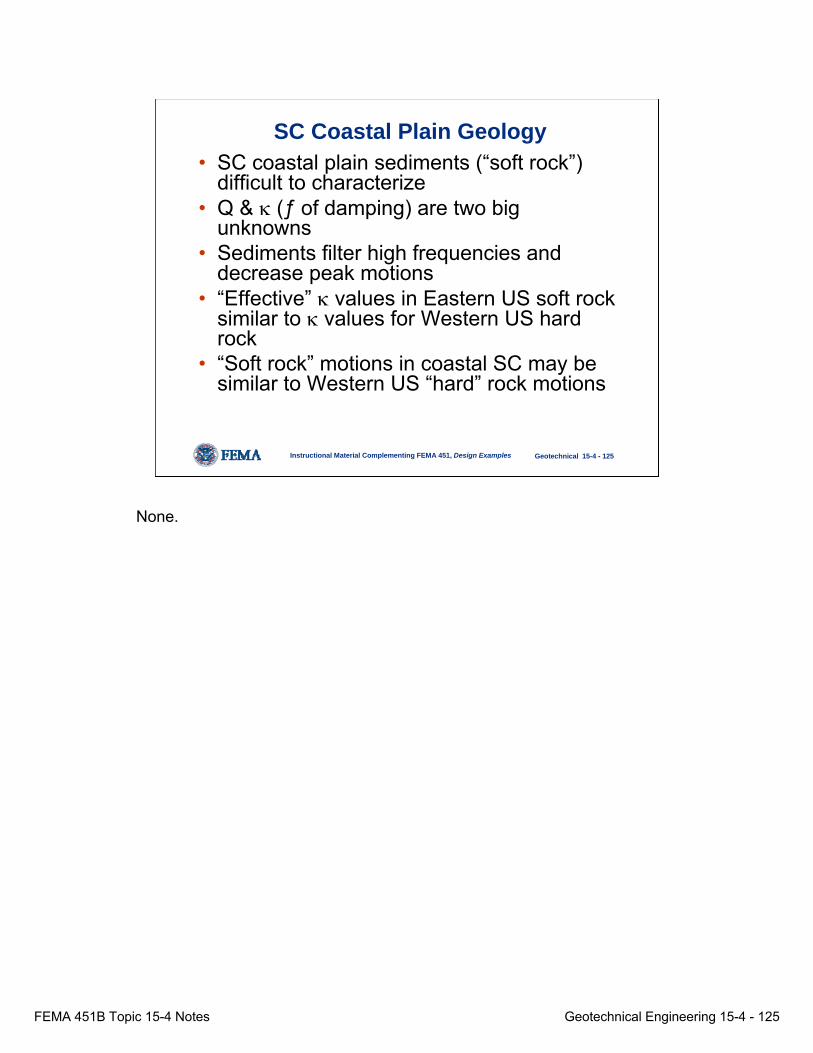
SC Coastal Plain Geology• SC coastal plain sediments (“soft rock”)
difficult to characterize • Q & κ (ƒ of damping) are two big
unknowns• Sediments filter high frequencies and
decrease peak motions• “Effective” κ values in Eastern US soft rock
similar to κ values for Western US hard rock
• “Soft rock” motions in coastal SC may be similar to Western US “hard” rock motions
None.
FEMA 451B Topic 15-4 Notes Geotechnical Engineering 15-4 - 126
Instructional Material Complementing FEMA 451, Design Examples Geotechnical 15-4 - 126
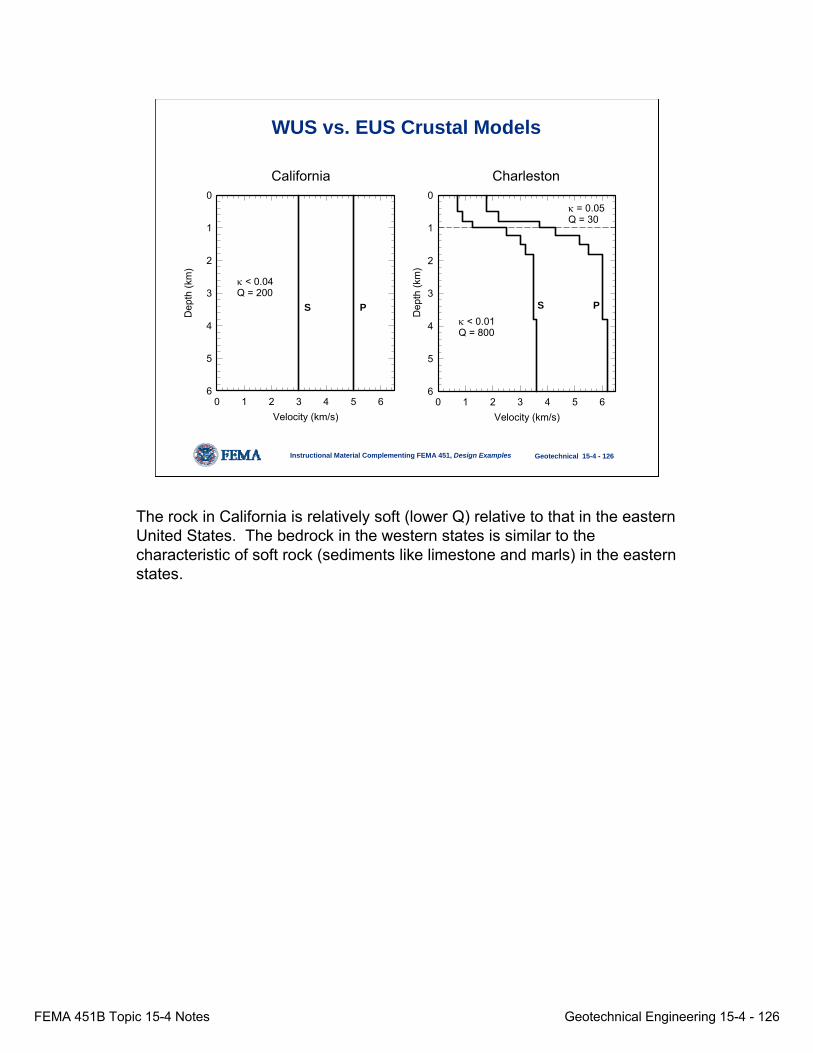
WUS vs. EUS Crustal Models
κ < 0.04Q = 200
S P
Velocity (km/s)0 1 2 3 4 5 6
Dep
th (k
m)
0
1
2
3
4
5
6
κ = 0.05Q = 30
κ < 0.01Q = 800
S P
Velocity (km/s)0 1 2 3 4 5 6
Dep
th (k
m)
0
1
2
3
4
5
6
California Charleston
The rock in California is relatively soft (lower Q) relative to that in the eastern United States. The bedrock in the western states is similar to the characteristic of soft rock (sediments like limestone and marls) in the eastern states.
FEMA 451B Topic 15-4 Notes Geotechnical Engineering 15-4 - 127
Instructional Material Complementing FEMA 451, Design Examples Geotechnical 15-4 - 127
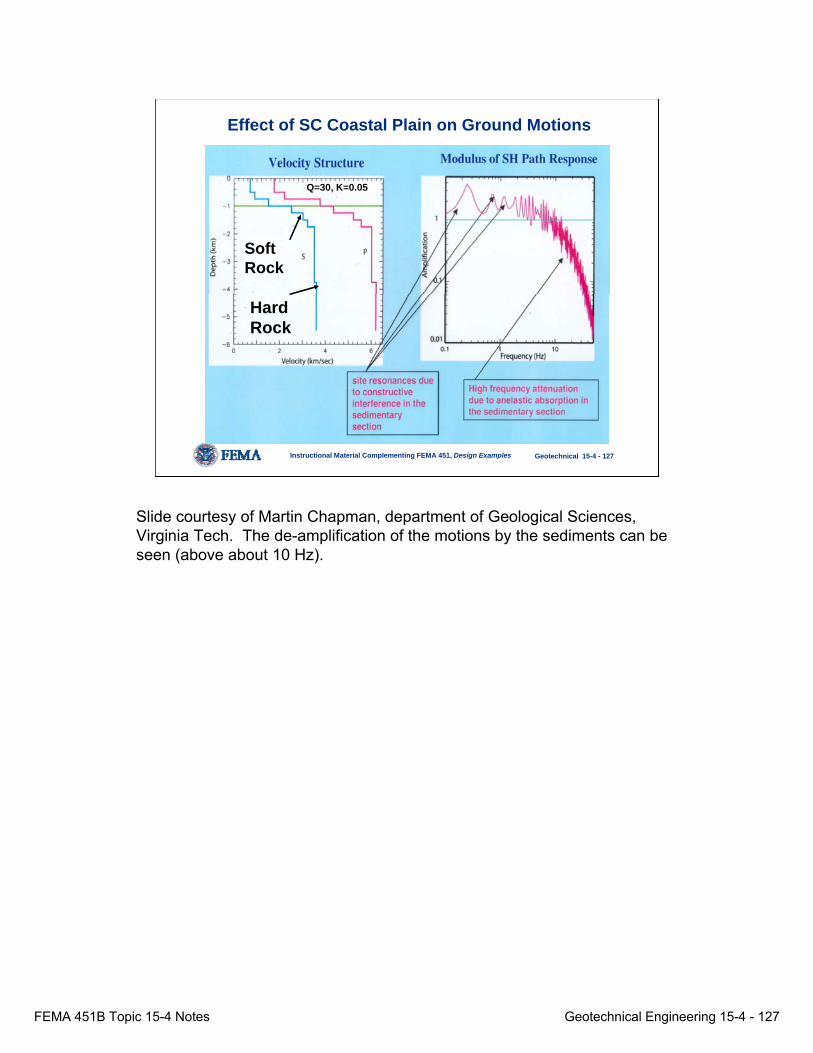
Effect of SC Coastal Plain on Ground Motions
Q=30, K=0.05
Hard Rock
Soft Rock
Slide courtesy of Martin Chapman, department of Geological Sciences, Virginia Tech. The de-amplification of the motions by the sediments can be seen (above about 10 Hz).
FEMA 451B Topic 15-4 Notes Geotechnical Engineering 15-4 - 128
Instructional Material Complementing FEMA 451, Design Examples Geotechnical 15-4 - 128
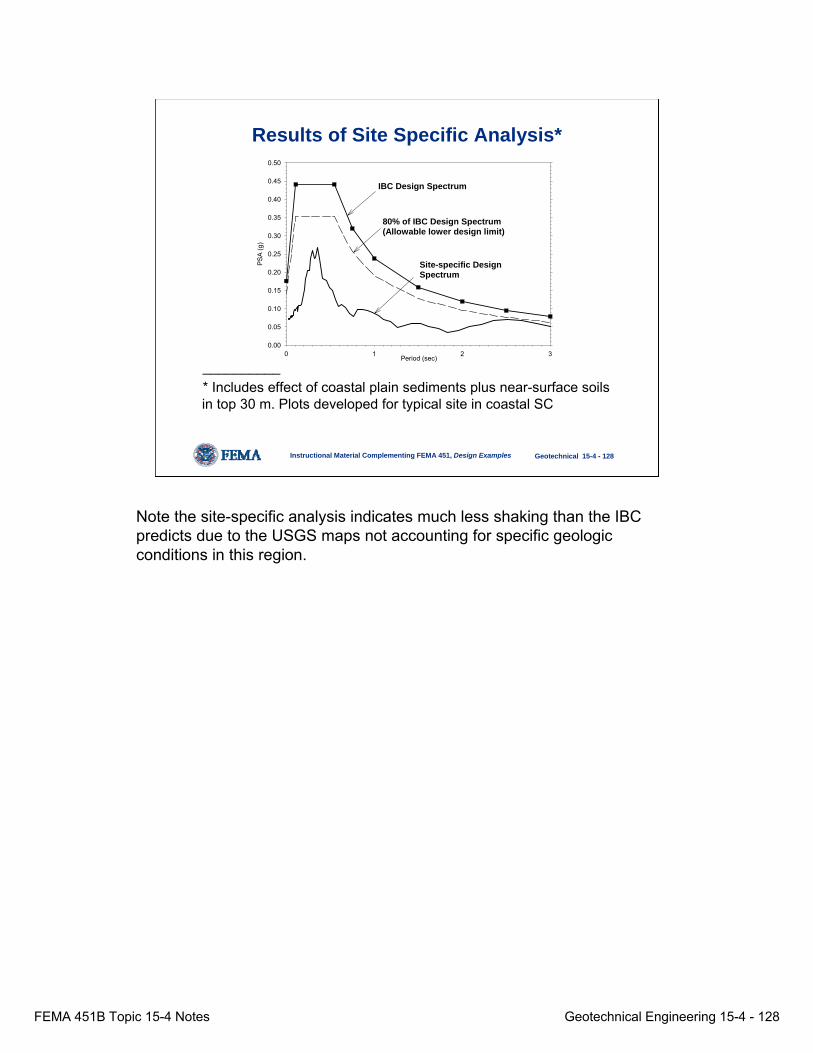
Results of Site Specific Analysis*
__________* Includes effect of coastal plain sediments plus near-surface soils in top 30 m. Plots developed for typical site in coastal SC
Period (sec)0 1 2 3
PSA
(g)
0.00
0.05
0.10
0.15
0.20
0.25
0.30
0.35
0.40
0.45
0.50
IBC Design Spectrum
Site-specific Design Spectrum
80% of IBC Design Spectrum(Allowable lower design limit)
Note the site-specific analysis indicates much less shaking than the IBC predicts due to the USGS maps not accounting for specific geologic conditions in this region.
FEMA 451B Topic 15-4 Notes Geotechnical Engineering 15-4 - 129
Instructional Material Complementing FEMA 451, Design Examples Geotechnical 15-4 - 129
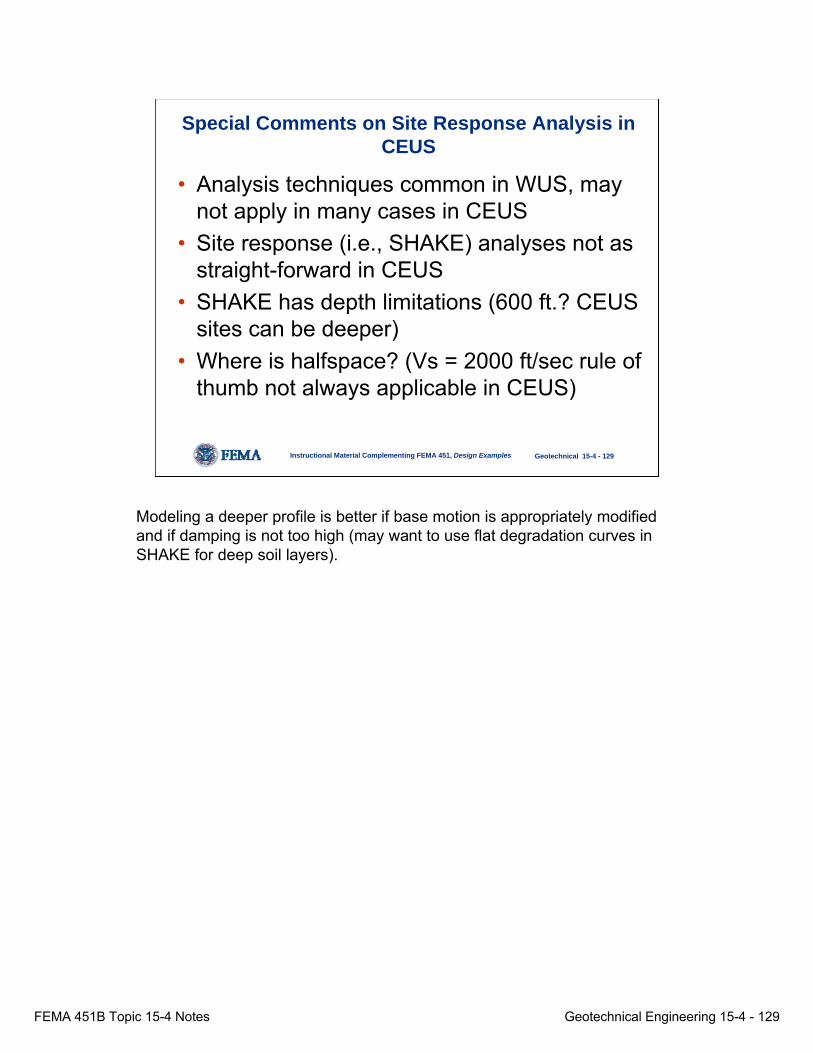
Special Comments on Site Response Analysis in CEUS
• Analysis techniques common in WUS, may not apply in many cases in CEUS
• Site response (i.e., SHAKE) analyses not as straight-forward in CEUS
• SHAKE has depth limitations (600 ft.? CEUS sites can be deeper)
• Where is halfspace? (Vs = 2000 ft/sec rule of thumb not always applicable in CEUS)
Modeling a deeper profile is better if base motion is appropriately modified and if damping is not too high (may want to use flat degradation curves in SHAKE for deep soil layers).
FEMA 451B Topic 15-4 Notes Geotechnical Engineering 15-4 - 130
Instructional Material Complementing FEMA 451, Design Examples Geotechnical 15-4 - 130
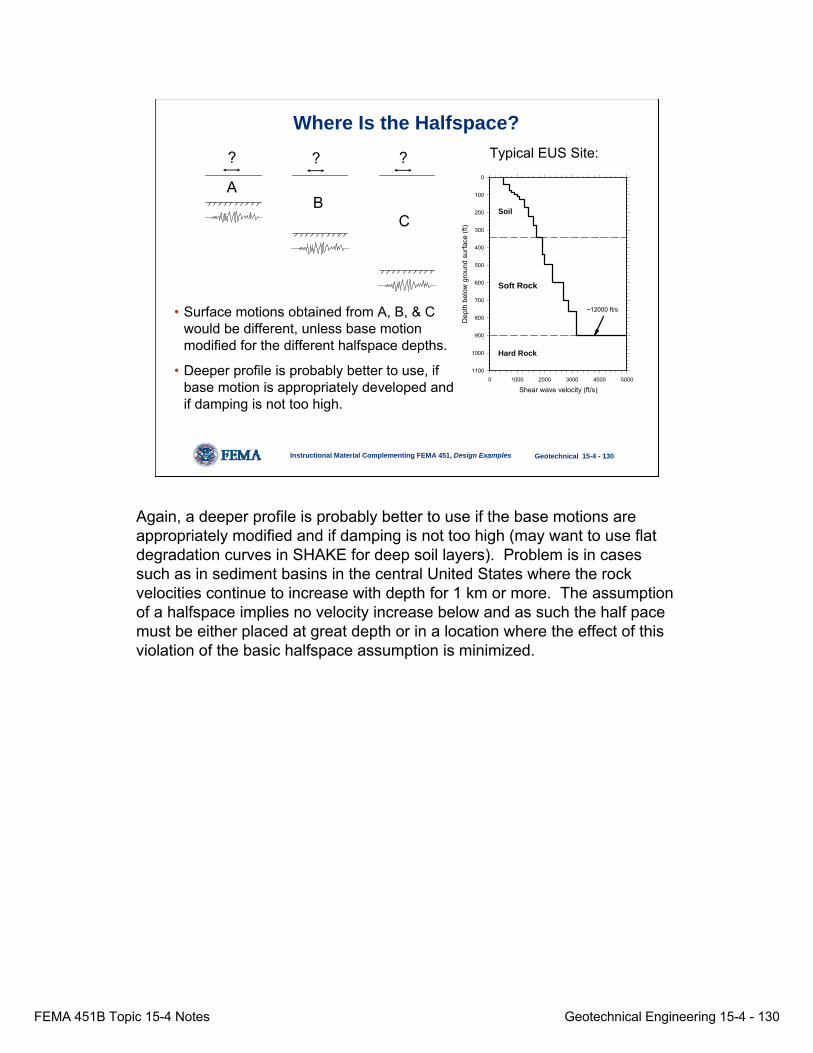
Where Is the Halfspace?
• Surface motions obtained from A, B, & C would be different, unless base motion modified for the different halfspace depths.
• Deeper profile is probably better to use, if base motion is appropriately developed and if damping is not too high.
Shear wave velocity (ft/s)0 1000 2000 3000 4000 5000
Dep
th b
elow
gro
und
surfa
ce (f
t)
0
100
200
300
400
500
600
700
800
900
1000
1100
Soil
Soft Rock
Hard Rock
~12000 ft/s
Typical EUS Site:? ??
A
CB
Again, a deeper profile is probably better to use if the base motions are appropriately modified and if damping is not too high (may want to use flat degradation curves in SHAKE for deep soil layers). Problem is in cases such as in sediment basins in the central United States where the rock velocities continue to increase with depth for 1 km or more. The assumption of a halfspace implies no velocity increase below and as such the half pace must be either placed at great depth or in a location where the effect of this violation of the basic halfspace assumption is minimized.
FEMA 451B Topic 15-4 Notes Geotechnical Engineering 15-4 - 131
Instructional Material Complementing FEMA 451, Design Examples Geotechnical 15-4 - 131
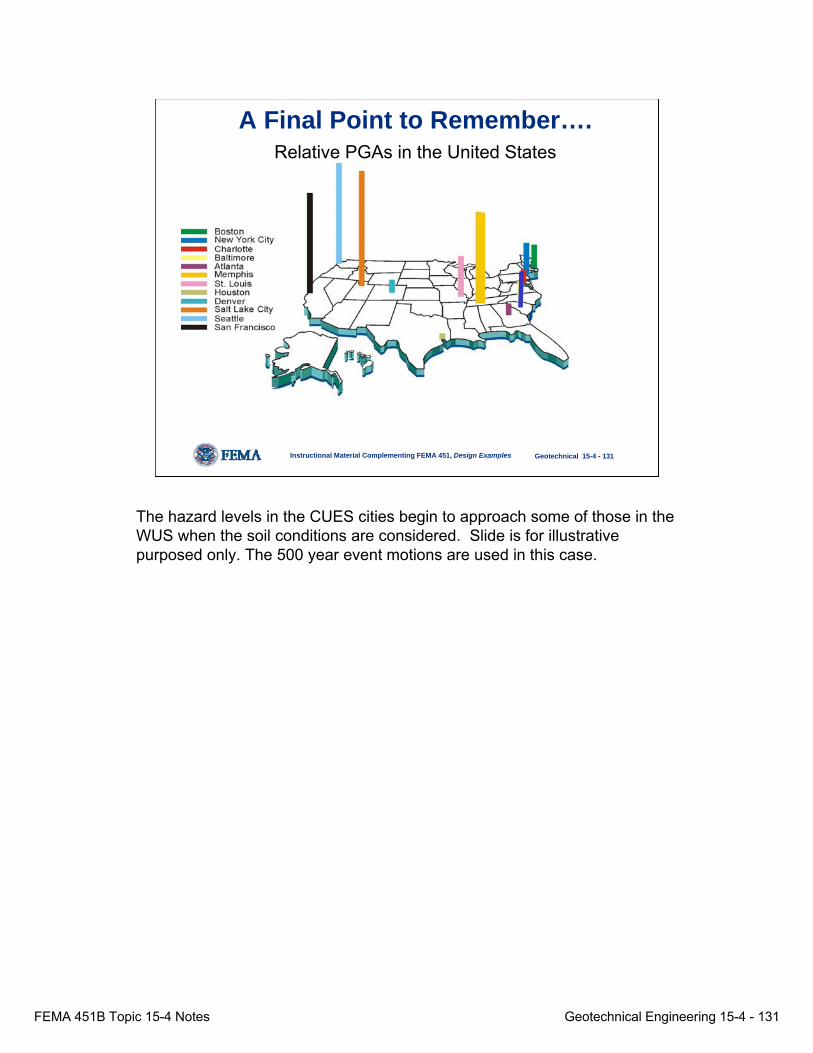
Relative PGAs in the United StatesA Final Point to Remember….
The hazard levels in the CUES cities begin to approach some of those in the WUS when the soil conditions are considered. Slide is for illustrative purposed only. The 500 year event motions are used in this case.
FEMA 451B Topic 15-4 Notes Geotechnical Engineering 15-4 - 132
Instructional Material Complementing FEMA 451, Design Examples Geotechnical 15-4 - 132
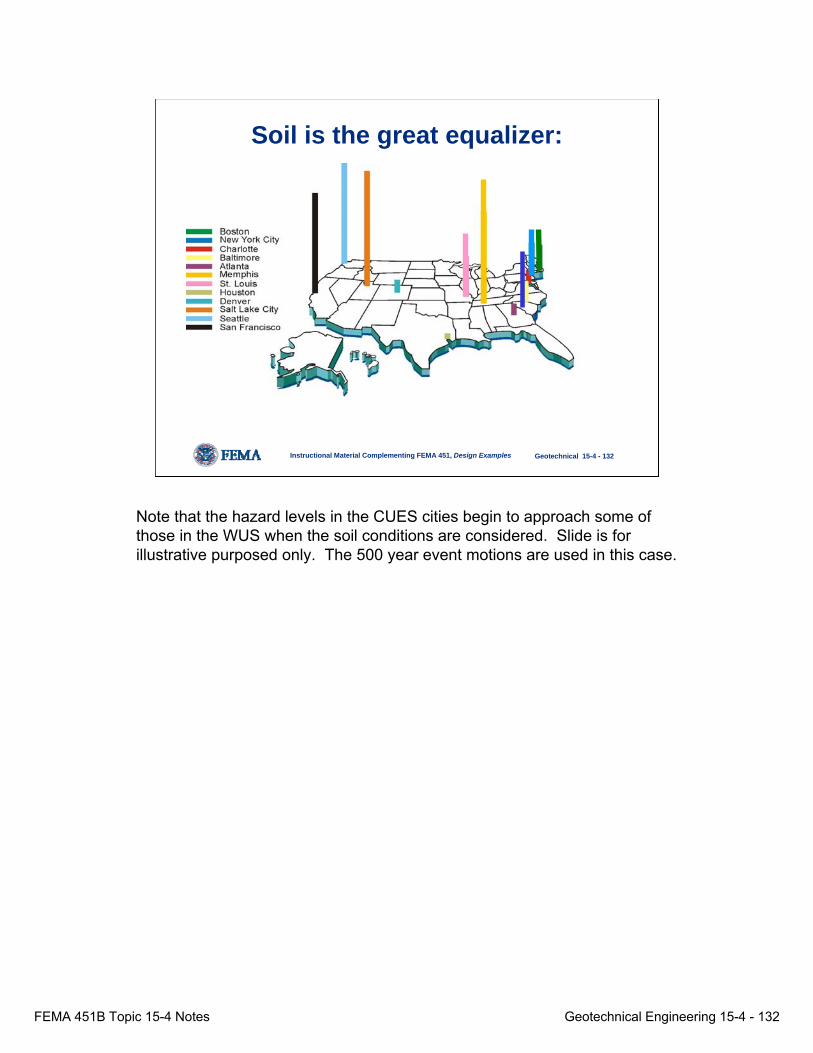
Soil is the great equalizer:
Note that the hazard levels in the CUES cities begin to approach some of those in the WUS when the soil conditions are considered. Slide is for illustrative purposed only. The 500 year event motions are used in this case.
FEMA 451B Topic 15-4 Notes Geotechnical Engineering 15-4 - 133
Instructional Material Complementing FEMA 451, Design Examples Geotechnical 15-4 - 133
Summary• Losses from earthquakes continue to
exceed those from other natural hazards (with the exception of megadisasters like Hurricane Katrina).
• Poor soils tend to increase damages from earthquakes.
• Earthquake soil mitigation, especially for soil liquefaction, is effective.
None.
FEMA 451B Topic 15-4 Notes Geotechnical Engineering 15-4 - 134
Instructional Material Complementing FEMA 451, Design Examples Geotechnical 15-4 - 134
Summary• Current IBC 2003 procedures are based on
WUS practice and experience.
• IBC provisions may not yet adequately account for unique CEUS conditions.
• Soil conditions in CEUS increase hazard.
None.