Embed Size (px)
Citation preview

GEOTECHNICAL DESIGN REPORT NEW MEADOWS NO. 2 BRIDGE NO. 2604 OVER THE NEW MEADOWS RIVER MAINE DOT WIN 20478.00 BRUNSWICK‐BATH, MAINE Prepared for:
Maine Department of Transportation Augusta, ME February 2016 09.0025900.00 Prepared by:
GZA GeoEnvironmental, Inc. 477 Congress Street | Suite 700 | Portland, Maine 04101 207.879.9190 27 Offices Nationwide www.gza.com


02/25/2016
NEW MEADOWS BRIDGE NO. 2 REPLACEMENT 09.0025900.00
TABLE OF CONTENTS
i
Geotechnical
Environmental
Ecological
Water
Construction Management
Page
1.0 INTRODUCTION 1
1.1 BACKGROUND 1
1.2 OBJECTIVES AND SCOPE OF SERVICES 2
2.0 SUBSURFACE EXPLORATIONS 2
2.1 TEST BORINGS 2
2.2 REVIEW OF ROCK CORE 3
3.0 LABORATORY TESTING 3
4.0 SUBSURFACE CONDITIONS 3
4.1 SURFICIAL AND BEDROCK GEOLOGY 3
4.2 SUBSURFACE PROFILE 3
4.2.1 Bedrock 4
4.2.2 Groundwater 4
5.0 ENGINEERING EVALUATIONS 5
5.1 GENERAL 5
5.2 APPROACH EMBANKMENTS 5
5.2.1 Settlement 5
5.2.2 Stability 6
5.3 SEISMIC DESIGN CONSIDERATIONS 6
5.4 EVALUATION OF FOUNDATIONS 7
5.4.1 Foundation Type Assessment 7
5.4.2 Pile Design Considerations 7
5.4.3 Load and Resistance Factors 7
5.4.4 Pile Type 8
5.4.5 Downdrag 8
5.4.6 Loading Data 8
5.4.7 Wave Equation Analyses 9
5.4.8 Lateral Pile Analysis 9
5.4.9 Lateral Earth Pressure 11
5.4.10 Frost Penetration 11
6.0 RECOMMENDATIONS 12
6.1 SEISMIC DESIGN 12
6.2 EMBANKMENT CONSTRUCTION 12
6.3 ABUTMENT AND WINGWALL DESIGN 12
6.4 PILE DESIGN 13
7.0 CONSTRUCTION CONSIDERATIONS 14
7.1 PILE INSTALLATION CONTROL 14

02/25/2016
NEW MEADOWS BRIDGE NO.2 REPLACEMENT 09.0025900.00
TABLE OF CONTENTS (continued)
GZA GeoEnvironmental, Inc. ‐ ii
7.2 PILE OBSTRUCTIONS 14
7.3 CONSTRUCTION SEQUENCE 14
7.4 EXCAVATION, TEMPORARY LATERAL SUPPORT AND DEWATERING 14
7.5 REUSE OF ON‐SITE MATERIALS 15
FIGURES
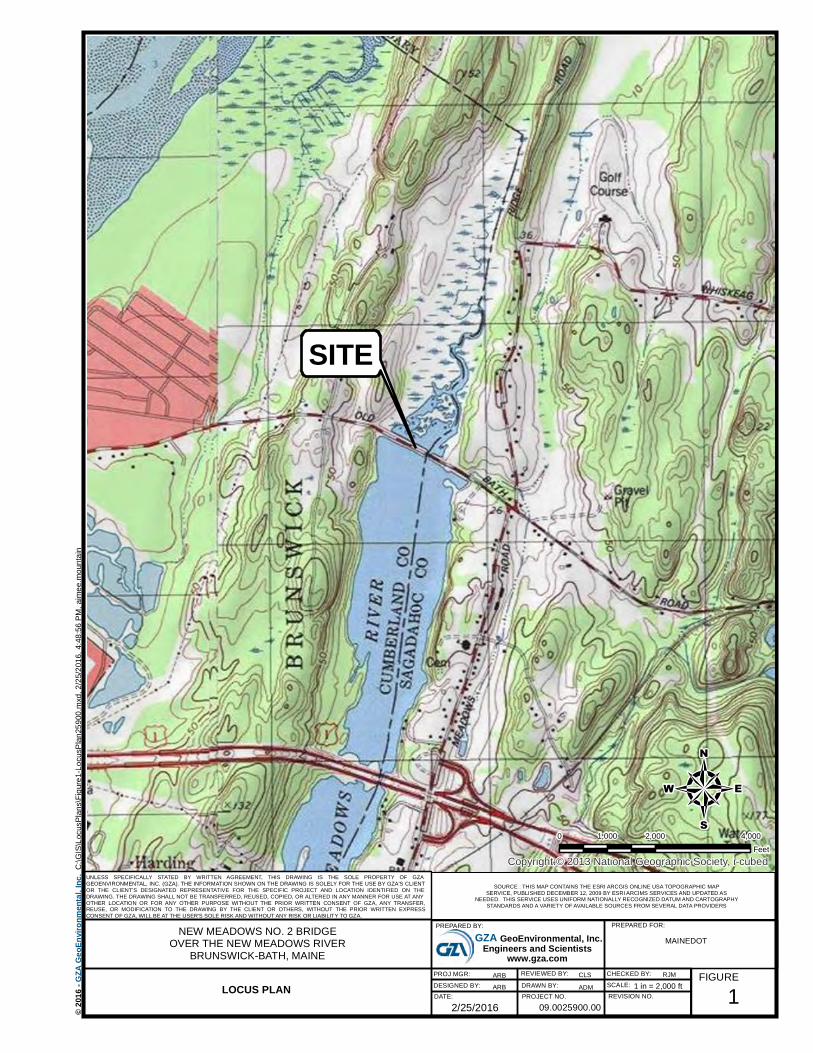
FIGURE 1 Locus Plan
FIGURE 2 Boring Location Plan & Interpretive Subsurface Profile
APPENDICES
APPENDIX A Limitations
APPENDIX B Test Boring Logs
APPENDIX C Laboratory Test Results
APPENDIX D Geotechnical Engineering Calculations

02/25/2016
NEW MEADOWS NO.2 BRIDGE REPLACEMENT 09.0025900.00
1
1.0 INTRODUCTION
This report presents the results of the geotechnical evaluation completed by GZA GeoEnvironmental, Inc. (GZA) for the proposed replacement of Maine Department of Transportation (MaineDOT) Bridge No. 2604 over the New Meadows River. Our services were provided in accordance with Assignment Letter No. 2, dated October 14, 2015, issued under Multi‐PIN Project Contract Number 20150608000000000793 between MaineDOT and (GZA) dated July 22, 2015, which incorporates GZA’s proposal No. 09.P000047.16, dated October 2, 2015, and the attached Limitations included in Appendix A. 1.1 BACKGROUND
New Meadows No. 2 Bridge No. 2604 carries Old Bath / Old Brunswick Road over the New Meadows River between Brunswick and Bath, at the location shown on Figure 1, Locus Plan. Our understanding of the existing bridge is based on our review of the Preliminary Design Report1 and portions of the 1917 and 1936 bridge plans. The existing bridge was constructed in 1918 then widened with a superstructure replacement in 1974. The existing bridge consists of a 51‐foot‐long, single‐span, thru‐girder bridge supported by two abutments consisting of stone masonry jacketed with concrete. Each abutment is supported on 27 timber pile foundations. The piles supporting each abutment are surrounded by sheet piles. The approach embankments are generally riprap covered and have slope inclinations of 1.5 horizontal to 1 vertical (1.5H:1V) or steeper. On the upstream side of the bridge, a near‐vertical, dry‐laid, stone masonry retaining wall extends approximately 30 feet from the abutment. Voids in the masonry retaining wall up to 4.5 feet were noted the Preliminary Design Report. MaineDOT plans2 show that the replacement bridge will consist of an approximately 63‐foot‐long, single‐span bridge, extending from approximately Sta. 11+65.50 to Sta. 12+28.50, the location of which is shown on Figure 2, Boring Location Plan & Interpretive Subsurface Profile. The new bridge is proposed to consist of a precast concrete voided beam superstructure with integral abutment substructures, supported by driven steel H‐piles. The new abutments will be constructed behind the existing abutments, portions of which will remain in place. Devan Eaton of MaineDOT, the bridge designer, provided an estimated thermal deformation of the bridge superstructure of 0.8 inches, which would result in approximately 0.4 inches of pile head translation at each abutment. The horizontal alignment of the roadway and bridge in the project area is not being modified as part of the project. The total project length is 200 feet (Sta. 11+00 to 13+00). Proposed pavement grades will be within 1 foot of existing grades. Approach embankment modifications will include widening the top of the embankments by about 2 to 8 feet and placing additional fill and riprap along both sides to provide a slope inclination of 1.75 horizontal to 1 vertical (1.75H:1V), with plain riprap protection. Fill and riprap will also be placed in front of each abutment at an inclination of 1.75H:1V. In areas where the embankments are currently retained by a stone masonry walls, the walls will remain in place and additional fill and riprap will be placed to provide an inclination of 1.75H:1V. The most significant fill placement is at
1 MaineDOT’s “Preliminary Design Report, New Meadows No. 2 Bridge #2604 over New Meadows River, WIN
020248.00.” 2 Plans reviewed during preparation of this report consisted of a Pre‐PS&E set provided by MaineDOT dated February
22, 2016.

02/25/2016
NEW MEADOWS NO.2 BRIDGE REPLACEMENT 09.0025900.00
2
Abutment 1 (Station 11+60 Left), where a triangular‐shaped fill (in section) will be approximately 9 feet high and 25 feet wide at the bottom. The existing abutments will be left in‐place below El. 0. Old Bath/Old Brunswick Road will be closed at the bridge crossing and detoured during construction of the new bridge. 1.2 OBJECTIVES AND SCOPE OF SERVICES
The objectives of our work were to evaluate subsurface conditions and to provide final geotechnical engineering recommendations for the proposed New Meadows No. 2 Bridge No. 2604 replacement. To meet these objectives, GZA completed the following Scope of Services:
Conducted site visits to observe surficial conditions and reviewed mapped surficial and bedrock geology of the site;
Conducted geotechnical engineering analyses to evaluate foundation design for the replacement bridge, embankment design considerations, and seismic design considerations;
Developed geotechnical engineering recommendations including foundation design recommendations for driven H‐piles, lateral earth pressures and seismic design parameters; and
Prepared this final report summarizing our findings and design recommendations.
2.0 SUBSURFACE EXPLORATIONS
Prior to GZA’s engagement in the project, an exploration program was completed by MaineDOT in 2015. Details of this program are described below. 2.1 TEST BORINGS
Northern Test Boring and MaineDOT drilled two test borings, BB‐NMR‐101 and BB‐NMR‐102 between March 11 and March 26, 2015. Bruce Wilder of MaineDOT logged the borings. The as‐drilled boring locations and elevations were surveyed and provided by MaineDOT (in station/offset format for the locations) and are included on the logs in Appendix B. BB‐NMR‐101 and BB‐NMR 102 were located behind the existing west and east abutments, respectively, as shown on the Boring Location Plan (prepared by MaineDOT), Figure 2. The test borings were drilled through the overburden soil and terminated approximately 6 to 10 feet into bedrock. Depths of borings ranged from approximately 82.9 to 113.5 feet below ground surface (bgs). The borings were drilled using 3‐and 4‐inch casing and drive and wash techniques. Standard penetration testing (SPT) and split spoon sampling were performed at 2‐ to 10‐foot intervals in the borings. Field vane shear tests were conducted throughout the marine clay layer. Bedrock cores were obtained using NQ2 wire line coring equipment. Drafts of the logs for BB‐NMR‐101 and ‐102 were prepared by MaineDOT and provided to GZA. GZA subsequently reviewed the logs and made edits to reflect laboratory soil test results and our analysis of stratification. The final logs including GZA’s edits are provided in Appendix B.
02/25/2016
NEW MEADOWS NO.2 BRIDGE REPLACEMENT 09.0025900.00
3
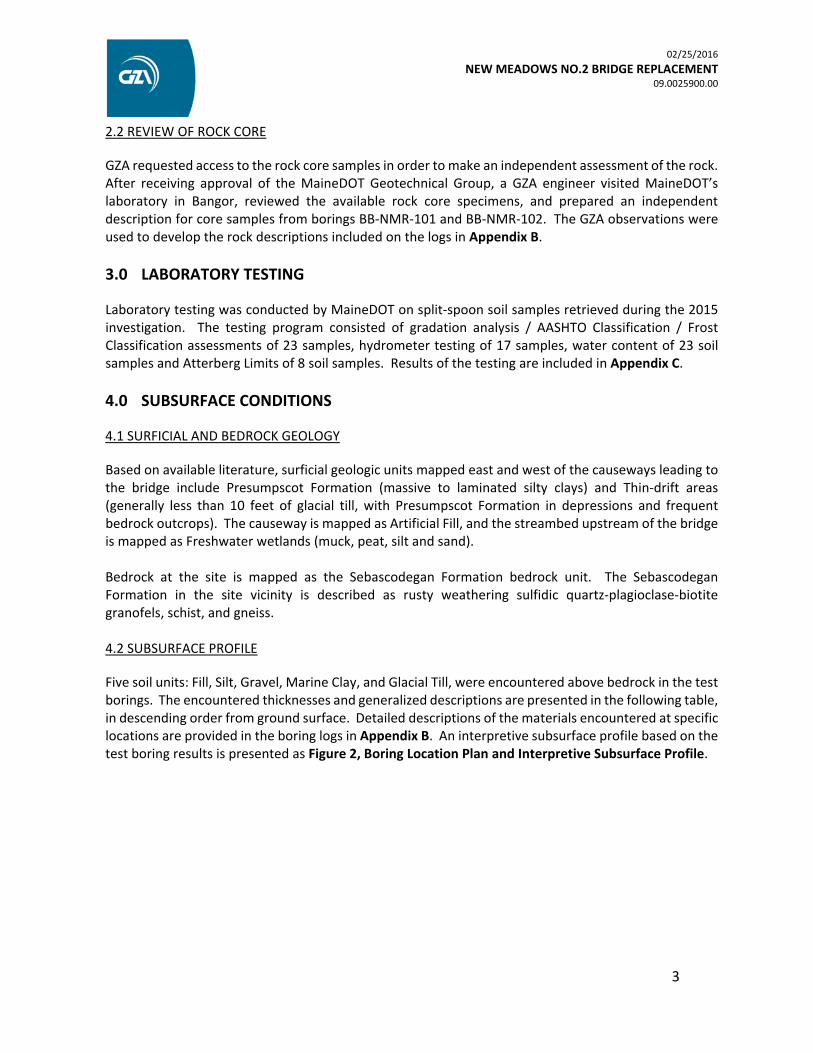
2.2 REVIEW OF ROCK CORE
GZA requested access to the rock core samples in order to make an independent assessment of the rock. After receiving approval of the MaineDOT Geotechnical Group, a GZA engineer visited MaineDOT’s laboratory in Bangor, reviewed the available rock core specimens, and prepared an independent description for core samples from borings BB‐NMR‐101 and BB‐NMR‐102. The GZA observations were used to develop the rock descriptions included on the logs in Appendix B.
3.0 LABORATORY TESTING
Laboratory testing was conducted by MaineDOT on split‐spoon soil samples retrieved during the 2015 investigation. The testing program consisted of gradation analysis / AASHTO Classification / Frost Classification assessments of 23 samples, hydrometer testing of 17 samples, water content of 23 soil samples and Atterberg Limits of 8 soil samples. Results of the testing are included in Appendix C.
4.0 SUBSURFACE CONDITIONS
4.1 SURFICIAL AND BEDROCK GEOLOGY
Based on available literature, surficial geologic units mapped east and west of the causeways leading to the bridge include Presumpscot Formation (massive to laminated silty clays) and Thin‐drift areas (generally less than 10 feet of glacial till, with Presumpscot Formation in depressions and frequent bedrock outcrops). The causeway is mapped as Artificial Fill, and the streambed upstream of the bridge is mapped as Freshwater wetlands (muck, peat, silt and sand). Bedrock at the site is mapped as the Sebascodegan Formation bedrock unit. The Sebascodegan Formation in the site vicinity is described as rusty weathering sulfidic quartz‐plagioclase‐biotite granofels, schist, and gneiss. 4.2 SUBSURFACE PROFILE
Five soil units: Fill, Silt, Gravel, Marine Clay, and Glacial Till, were encountered above bedrock in the test borings. The encountered thicknesses and generalized descriptions are presented in the following table, in descending order from ground surface. Detailed descriptions of the materials encountered at specific locations are provided in the boring logs in Appendix B. An interpretive subsurface profile based on the test boring results is presented as Figure 2, Boring Location Plan and Interpretive Subsurface Profile.

02/25/2016
NEW MEADOWS NO.2 BRIDGE REPLACEMENT 09.0025900.00
4
Soil Unit Approx.
Encountered Thickness (ft)
Generalized Description
Fill 8
Brown, dense, fine to coarse SAND, little to some Gravel, trace to some Silt. (USCS: SM, SW‐SM) MaineDOT Frost Classification = 0‐II. Encountered in both borings.
Silt 4 to 15
Olive‐gray to dark brown, very soft to stiff, SILT, some Clay, trace to some Sand, trace Gravel, with organics, shell fragments, and Peat. (USCS: ML) MaineDOT Frost Classification = IV. Encountered in both borings below Fill.
Gravel 5
Brown, medium dense, GRAVEL, some fine to coarse Sand, little Silt. (USCS: GC‐GM) MaineDOT Frost Classification = III. Encountered beneath Silt in boring BB‐NMR‐102 only.
Marine Clay 49 to 53
Gray, Silty CLAY, trace to some fine Sand. (USCS: CL). Upper 5 to 10 feet is stiff to very stiff (crust), becomes medium stiff to soft with depth. MaineDOT Frost Classification = III‐IV.
Conducted 31 field vanes: Peak Undrained Shear Strength (Su) = 312‐670 psf, Residual Su = 45‐247 psf
Atterberg limits: Liquid Limit (LL) = 32‐40, Plasticity Index (PI) = 13‐17, water content = 30.1‐49.4 percent
Encountered beneath Silt in BB‐NMR‐101 and beneath Gravel in BB‐NMR‐102.
Glacial Till 10 to 27
Gray to brown, medium dense to very dense, fine to coarse SAND, with varying amounts of Gravel, Silt, Cobbles and Boulders. (USCS: SC‐SM, SM, ML, GC‐GM) MaineDOT Frost Classification = II‐IV. Encountered beneath Marine Clay in both borings.
Top of Bedrock Elevation
El. ‐92.3 (BB‐NMR‐101) and El. ‐66.1 (BB‐NMR‐102)
GZA did not observe the soil samples during our work. We relied on classifications made by MaineDOT combined with laboratory test results for our description of the soil.
4.2.1 Bedrock
Bedrock encountered in the borings consisted of Schist in BB‐NMR‐101 and Metavolcanic rock in BB‐NMR‐102 and was generally described as very hard to hard, fresh, fine grained and gray (Schist) or white (Metavolcanic). Joints were extremely close to moderately spaced, low angle to moderately dipping, undulating, rough, fresh to discolored and tight to partially open. Other than the first foot of rock cored at BB‐NMR‐101 which had Rock Quality Designation (RQD) of 0 percent, the RQD ranged from 25 to 55 percent.
4.2.2 Groundwater
Groundwater was measured by MaineDOT in the boreholes. The times, borehole depths, and casing conditions at the time of the measurements were not provided to GZA. The measured groundwater level in BB‐NMR‐101 was 15 feet bgs, corresponding to approximately El. ‐4.2. Elevations

02/25/2016
NEW MEADOWS NO.2 BRIDGE REPLACEMENT 09.0025900.00
5
used herein are referenced to NAVD88 datum. The water level was not observed in BB‐NMR‐102. Water levels in the river are understood to be tidally influenced. Mean High Water (MHW) elevation at the site is El. 4.17. The groundwater observations were made at the times and under the conditions stated in the boring logs. Groundwater levels fluctuate due to season, tidal variation, precipitation, infiltration and construction activity in the area. Therefore, groundwater levels during and after construction are likely to vary from those encountered at the time of the test borings.
5.0 ENGINEERING EVALUATIONS
5.1 GENERAL
GZA has conducted geotechnical engineering evaluations in accordance with 2014 AASHTO LRFD Bridge Design Specifications, 7th Edition, with Interims (herein known as AASHTO) and the MaineDOT Bridge Design Guide, 2014 Edition (MaineDOT BDG). The sections that follow describe the evaluations and the geotechnical basis for each element. Supporting calculations developed by GZA for the project are attached in Appendix D of this report. 5.2 APPROACH EMBANKMENTS
The approach embankments are expected to remain approximately at existing pavement grades, but they will be widened by several feet, resulting in a typical grade raise of 1 to 4 feet above existing slope grades. The new fill adjacent to the proposed abutments will be up to 9 feet high and 25 feet wide. The anticipated generalized soil profile beneath each widened embankment is summarized below.
GENERALIZED SUBSURFACE CONDITIONS, PROPOSED APPROACH FILLS
Soil Unit, Density/Stiffness Estimated Thickness (feet)
West Approach (Abutment 1)
East Approach (Abutment 2)
SILT, very soft to stiff 15 5
GRAVEL, medium dense 0 5
MARINE CLAY Crust, stiff to very stiff 5 10
MARINE CLAY, medium stiff to soft 48 39
GLACIAL TILL, medium dense to very dense 27 10
Glacial Till is underlain by bedrock, which does not influence the approach embankment evaluations.
5.2.1 Settlement
Settlement will occur during and following construction of widened portions of the approach embankments. The strata considered for contribution to embankment settlement are the Marine Clay and Silt. Based on SPT N‐values, the Marine Clay crust at this site is judged to be highly overconsolidated. Based on the in‐situ vane shear test results from the lower Marine Clay, the deeper material is judged to be

02/25/2016
NEW MEADOWS NO.2 BRIDGE REPLACEMENT 09.0025900.00
6
lightly to moderately overconsolidated. We evaluated the maximum stress increase under the new fill at the edge of the embankment to be less than 300 psf at the top of the lower Marine Clay. We anticipate that Marine Clay will be experience less than ½ inch or less of total settlement under the new fill load, some of which will occur during construction. Consequently, post‐construction settlement of the Marine Clay is not anticipated to exceed 0.4 inches, and it is not necessary to consider downdrag loading from this layer. Therefore, GZA’s settlement evaluation will focus primarily on the Silt stratum. Silt settlement was evaluated using the Hough method (AASHTO Article 10.6.2.4), which implicitly includes elastic and consolidation settlement in silt and clay soils. Compressibility of the Silt was approximated for use in our evaluations based on the available data including SPT N‐values, water content and sand content. Total embankment settlement is estimated to be on the order of 3 to 6 inches adjacent to Abutment 1 and 1 to 3 inches adjacent to Abutment 2 (see Appendix D for calculation). Given the high sand content encountered in some samples and the apparent low plasticity, the rate of settlement is judged to be relatively high. We anticipate that the maximum settlement will occur near the guardrail along the left (upstream) side of the road, where the new fill thickness is greatest. Settlement of the Silt may occur relatively quickly as the embankment is constructed, reducing post‐construction settlement from the values stated above. Since more than 0.4 inch of settlement could occur in the Silt and overlying Fill after pile installation, downdrag loading should be considered in the design of the piles at both abutments, as discussed in Section 5.4.2.
5.2.2 Stability
Placement of new riprap materials along the side slopes of the approach embankment will result in a roughly 10‐foot high embankment with 1.75H:1V typical side slopes. During our site observations and review of inspection photographs, we did not observe signs of instability of the existing embankment. Since the proposed embankment slopes will be flatter than the existing slopes, and the overall height is only about 10 feet, it is our opinion that the potential for global instability of the proposed embankments is low. 5.3 SEISMIC DESIGN CONSIDERATIONS
The subsurface profile for seismic design includes the approach fills (including backfill behind abutments) and underlying Silt, Marine Clay and Glacial Till. Seismic site class was determined in general accordance with LRFD Table C3.10.3.1 for a mixed soil profile, considering the average SPT N‐value of granular soils and the average undrained shear strength of cohesive soils encountered in the borings. LRFD allows the assumption that rock within the upper 100 feet of the profile has an N‐value equal to 100. However, the SPT N‐value used to determine the site class was evaluated by including only the soil profile, resulting in an effective profile thickness ranging from 77 to 100 feet. The average SPT N‐value for encountered granular soils (Fill, Gravel and Glacial Till) is above 15 blows per foot, and the average undrained shear strength for encountered cohesive soils (Silt and Marine Clay) is below 1,000 psf. LRFD requires that the site class be based on the worst case of these two methods for a mixed profile. Therefore, the bridge is assigned to Site Class E.

02/25/2016
NEW MEADOWS NO.2 BRIDGE REPLACEMENT 09.0025900.00
7
The available subsurface data indicates that the natural materials encountered at the site are sufficiently cohesive or dense that the potential for liquefaction is low. 5.4 EVALUATION OF FOUNDATIONS
5.4.1 Foundation Type Assessment
Based on constructability and cost considerations, MaineDOT selected an integral abutment bridge supported on steel H‐piles. Design considerations are presented below.
5.4.2 Pile Design Considerations
Evaluations were conducted for axial compressive geotechnical resistance of the piles. Side friction was calculated using the Meyerhof (SPT) for granular layers (Gravel and Glacial Till) and the α‐method for the silt and marine clay layers in accordance with AASHTO Article 10.7. Based on our experience with similar soils, we anticipate that the piles will be driven near or into bedrock to achieve the required resistance. The results of our evaluations indicate the piles will gain support through a combination of friction in overburden soils and end bearing in glacial till or on bedrock. The geotechnical side resistance was used as an input in wave equation analyses conducted to assess the pile drivability. Axial tensile geotechnical (uplift) resistance was not evaluated because the integral abutment configuration will not impose uplift loading on the piles. Since the piles will gain support in primarily dense granular soil and/or bedrock, there is no reduction for group interaction in axial compression. By utilizing end bearing steel H‐piles, total and differential settlement will be limited to elastic compression of the piles and should be less than ½ inch. The piles will be installed on land through the approach embankments. Therefore, corrosion was not considered in the design. Pile design recommendations are presented in Section 6.4 of this report.
5.4.3 Load and Resistance Factors
Piles should be designed at the strength limit state considering the structural resistance of the piles and a resistance factor of 0.50, per LRFD Section 10.7.3.2.3 for hard driving conditions and the geotechnical resistance of the piles. In GZA’s experience for end bearing piles on bedrock, the drivability resistance typically controls the geotechnical static resistance of the pile. The pile driving criteria are expected to be established based on dynamic pile testing with signal matching analysis. The piles should be driven to a nominal resistance calculated by dividing the maximum factored pile load by a resistance factor of 0.65, per AASHTO Table 10.5.5.2.3‐1. AASHTO LRFD load factors should be applied to horizontal earth pressure (EH), vertical earth pressure
(EV) and earth surcharge (ES) loads using the load factors for permanent loads (p) provided in AASHTO Table 3.4.1‐2 for strength and extreme limit state design. A load factor (p) of 1.0 should be applied to downdrag loads in cohesive and cohesionless downdrag zones. A load factor of 1.5 may be applied to
02/25/2016
NEW MEADOWS NO.2 BRIDGE REPLACEMENT 09.0025900.00
8
the passive pressure used to design the integral backwall (end diaphragm) to account for deformation of the backwall into the soil as a result of thermal expansion of the integral bridge deck.
5.4.4 Pile Type
The abutments are planned to be supported on ASTM A572, Grade 50 (fy=50 ksi) steel H‐piles. Each abutment will include a single row of four, HP14x89 piles.
5.4.5 Downdrag
Given the potential for greater than 0.4 inch of settlement to occur relative to the abutment piles, the piles should be designed to resist downdrag loading. GZA’s estimates show anticipated settlements of less than 0.4 inches in the marine clay deposits. Therefore, the marine clay layer will not contribute to downdrag loading of the new piles. Settlement is anticipated to exceed 0.4 inches in the Silt stratum. Therefore, the portion of the pile extending through Fill and Silt was considered for downdrag loading.
Downdrag loading will be greater at Abutment 1 than Abutment 2 due to the additional pile length in settling soils. For simplicity, we analyzed downdrag at Abutment 1 to represent the worst‐case condition, which will be used for both abutments.
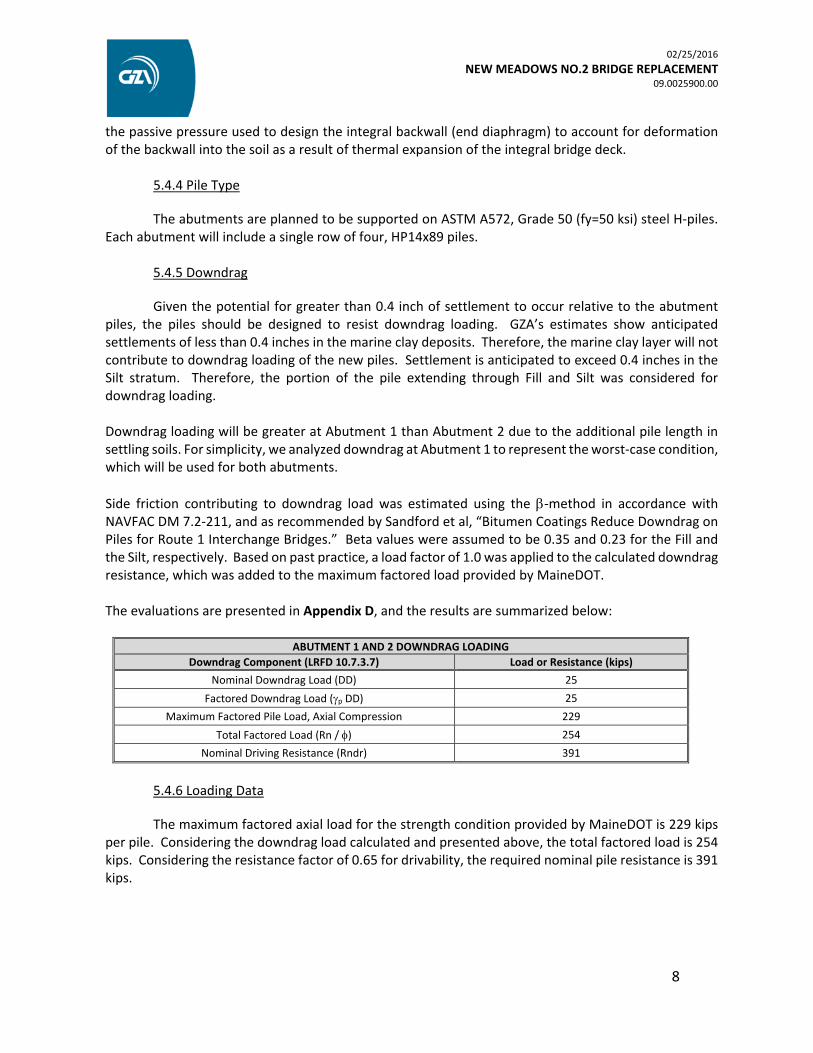
Side friction contributing to downdrag load was estimated using the ‐method in accordance with NAVFAC DM 7.2‐211, and as recommended by Sandford et al, “Bitumen Coatings Reduce Downdrag on Piles for Route 1 Interchange Bridges.” Beta values were assumed to be 0.35 and 0.23 for the Fill and the Silt, respectively. Based on past practice, a load factor of 1.0 was applied to the calculated downdrag resistance, which was added to the maximum factored load provided by MaineDOT. The evaluations are presented in Appendix D, and the results are summarized below:
ABUTMENT 1 AND 2 DOWNDRAG LOADING
Downdrag Component (LRFD 10.7.3.7) Load or Resistance (kips)
Nominal Downdrag Load (DD) 25
Factored Downdrag Load (p DD) 25
Maximum Factored Pile Load, Axial Compression 229
Total Factored Load (Rn / ) 254
Nominal Driving Resistance (Rndr) 391
5.4.6 Loading Data
The maximum factored axial load for the strength condition provided by MaineDOT is 229 kips per pile. Considering the downdrag load calculated and presented above, the total factored load is 254 kips. Considering the resistance factor of 0.65 for drivability, the required nominal pile resistance is 391 kips.

02/25/2016
NEW MEADOWS NO.2 BRIDGE REPLACEMENT 09.0025900.00
9
5.4.7 Wave Equation Analyses
Wave equation analyses were performed to assess pile drivability; results are included in Appendix D. During preliminary evaluations, analyses were conducted to estimate the largest nominal pile resistance that could be achieved with the selected soil model and hammer system for three pile sections (HP 14x73, 14x89 and 14x117), the results of which were provided to MaineDOT to support structural design and indicated a drivability resistance of 745 to 775 kips for an HP14x89 pile. The design‐basis factored load was provided subsequently and is significantly less than the limiting resistance based on drivability. Therefore, we re‐evaluated drivability for a required nominal resistance of 391 kips to evaluate a driving system that would achieve the required resistance with an appropriate final penetration resistance. The analyses used the design soil profiles from BB‐NMR‐101 (Abutment 1) and BB‐NMR‐102 (Abutment 2), with embedded pile lengths of approximately 97 and 71 feet, respectively. The contribution of skin friction to the required nominal pile resistance was 30 and 40 percent for the short pile and long pile, respectively, at the required nominal resistance. A Delmag D16‐32 open‐end diesel hammer with a rated energy of 40,200 ft‐lbs, operated at the maximum fuel setting, was used for the evaluation. The results are summarized below.
DESIGN BASIS WAVE EQUATION ANALYSIS RESULTS
Pile Type Embedded Pile Length
Driving System Required Nominal
Geotechnical Resistance (kips)
Max Driving Stress (ksi)
Final Penetration Resistance
(blows per inch)
HP 14x89 71 feet Delmag D16‐32 (40,200 ft‐lbs)
391 26.6 10
HP 14x89 97 feet Delmag D16‐32 (40,200 ft‐lbs)
391 26.7 11
Since the driving stresses do not exceed the limiting driving stress of 45 ksi for ASTM A572 steel (50 ksi yield stress), and the calculated penetration resistance is within the MaineDOT preferred range of 6 to 15 blows per inch, the analyzed hammer system is judged acceptable to install the piles to the required nominal resistance noted.
5.4.8 Lateral Pile Analysis
The subsurface strata encountered near the top of the piles included primarily Silt at Abutment 1 and a combination of Silt and Gravel at Abutment 2. The lateral pile analyses were anticipated to be sensitive to the varying soil types near the pile head. Therefore, we added a third design profile, with a thicker sand layer at the top of the pile and excluding the Silt stratum, in case that condition exists for some of the piles. The following soil profiles were developed for lateral pile evaluations at each abutment.

02/25/2016
NEW MEADOWS NO.2 BRIDGE REPLACEMENT 09.0025900.00
10
GZA conducted lateral pile analyses based on a maximum thermal deflection of 0.394 inches, as provided by MaineDOT. We assumed a fixed‐head condition (zero rotation) and imposed the estimated thermal deflection at the pile head. The orientation of the HP14x89 piles represented weak‐axis bending. The assumed axial load was 479 kips, representing the maximum factored axial load at the time of our evaluation. MaineDOT’s bridge designer did not request that GZA re‐run our analyses after the maximum factored axial load was reduced. Our results are summarized in the table below.
L‐PILE® INPUT PARAMETERS, ALL CLAY HEAD CONDITION ABUTMENT 1, PILE LENGTH = 97’ (BORING BB‐NMR‐101)
Stratum Soil Model Top of Layer Elevation (ft‐ NAVD 88)
Layer Thickness (ft)
k (pci) / E50 φ' (deg)/ Su (psf)
γe (pcf)
Silt Matlock Clay 5 18 E50 = 0.02 375 psf 48
Marine Clay (Crust) Matlock Clay ‐13 4 E50 = 0.008 1000 psf 56
Marine Clay Matlock Clay ‐17 48 E50 = 0.008 465 psf 56
Glacial Till Reese Sand ‐65 27 100 38 67
L‐PILE® INPUT PARAMETERS, MIXED HEAD CONDITION ABUTMENT 2, PILE LENGTH = 71’ (BORING BB‐NMR‐102)
Stratum Soil Model Top of Layer Elevation (ft‐ NAVD 88)
Layer Thickness (ft)
k (pci) / E50 φ' (deg)/ Su (psf)
γe (pcf)
Fill Reese Sand 5 3 60 35 62
Silt Matlock Clay 2 4 E50 = 0.02 375 psf 48
Gravel Reese Sand ‐2 5 100 38 67
Marine Clay (Crust) Matlock Clay ‐7 11 E50 = 0.008 1000 psf 56
Marine Clay Matlock Clay ‐18 38 E50 = 0.008 520 psf 56
Glacial Till Reese Sand ‐56 10 100 38 67
L‐PILE® INPUT PARAMETERS, ALL SAND HEAD CONDITION ABUTMENT 2, PILE LENGTH = 71’ (BORING BB‐NMR‐102, Modified Upper Strata)
Stratum Soil Model Top of Layer Elevation (ft‐ NAVD 88)
Layer Thickness (ft)
k (pci) / E50 φ' (deg)/ Su (psf)
γe (pcf)
Fill Reese Sand 5 12 60 35 62
Marine Clay (Crust) Matlock Clay ‐7 11 E50 = 0.008 1000 psf 56
Marine Clay Matlock Clay ‐18 38 E50 = 0.008 520 psf 56
Glacial Till Reese Sand ‐56 10 100 38 67

02/25/2016
NEW MEADOWS NO.2 BRIDGE REPLACEMENT 09.0025900.00
11
L‐PILE® RESULTS
Location Pile Head Soil Conditions
Axial Load (kips) Shear Force for Lateral deflection of 0.394 in.
(kips)
Moment at Pile Head (ft‐kips)
Bending Stress at Pile Head (ksi)
Abutment 1 All Clay 478.9 10.8 ‐62.2 15.8
Abutment 2 Mixed 478.9 17.6 ‐89.5 22.8
Abutment 2 All Sand 478.9 24.4 ‐111.4 28.4
Axial pile stress at the maximum factored pile load of 254 kips is 9.5 ksi. Therefore, the maximum combined stress based on our L‐PILE® output ranges from 25.3 to 37.9 ksi.
5.4.9 Lateral Earth Pressure
Thermal expansion of the bridge will cause the backwalls and wingwalls of the integral abutment to move towards the backfill, which will result in earth pressures ranging from at‐rest to passive earth pressure. The material properties will be controlled by the backfill material, which is proposed to consist of BDG Type 4 soil. Soil properties for Type 4 soil are provided in Section 6.3 of this report. Based on the estimated thermal bridge expansion of 0.394 inches and the abutment height of 8.75 feet, the calculated abutment rotation is 0.00375 feet/foot. In accordance with the requirements of the BDG Section 5.4.2.11, integral abutment reinforcement is to be designed for full Coloumb passive pressure if the wall rotation is greater than 0.005 feet/foot. Considering that the anticipated rotation is only 75 percent of the value that triggers full Coloumb, we conclude that Rankine passive earth pressure may be used for design.
Lateral earth pressure evaluations for abutments are based on the BDG summarized below:
Passive earth pressure coefficients were developed using Rankine theory for Type 4 soil.
AASHTO Commentary C3.10.9.1 specifies that single‐span bridges are not required to include acceleration‐augmented (earthquake‐induced) soil pressures for design.
Design lateral earth pressure recommendations are provided in Section 6.3 of this report.
5.4.10 Frost Penetration
Fill soils are anticipated to be present at the abutments, either as existing fill or imported backfill. Based on the MaineDOT BDG, Section 5.2.1, the Freezing Index for the site is 1,310, and with low to moderate moisture content (±15%) soils, the estimated depth of frost penetration is 4.5 feet.

02/25/2016
NEW MEADOWS NO.2 BRIDGE REPLACEMENT 09.0025900.00
12
6.0 RECOMMENDATIONS
6.1 SEISMIC DESIGN
The United States Geological Survey online Design Maps Tool was used to develop parameters for bridge design. Based on the site coordinates, the software provided the recommended AASHTO Response Spectra (Site Class E) for a 7 percent probability of exceedance in 75 years. These results are summarized for the site as follows:
SITE CLASS E SEISMIC DESIGN PARAMETERS
Parameter Design Value
Fpga 2.5
Fa 2.5
Fv 3.5
As (Period = 0.0 sec) 0.190 g
SDs (Period = 0.2 sec) 0.393 g
SD1 (Period = 1.0 sec) 0.153 g
Per AASHTO Article 4.7.4.2, single span bridges need not be analyzed for seismic loads, but the minimum requirements specified in AASHTO Articles 4.7.4.4 and 3.10.9 apply. 6.2 EMBANKMENT CONSTRUCTION
Portions of the widened approach embankments will be constructed in the inter‐tidal zone. Therefore, fill placement could be completed in‐the‐dry either working with the tides or inside of a cofferdam. If embankment construction in‐the‐wet is considered, permitting considerations for work in the river should be addressed, which we anticipate would include the use of a silt curtain at a minimum. The current subgrade material beneath the widened embankments is anticipated to consist of up to a few feet of existing Fill, underlain by relatively weak Silt. Conventional embankment construction procedures should be suitable, provided the work is completed in‐the‐dry. The Silt stratum appears to become softer with depth at the Abutment 1 approach; therefore, overexcavation of this material should be avoided. If necessary, an initial layer of separation geotextile beneath coarse aggregate or choked riprap may be appropriate to provide a stable subgrade for subsequent filling. All fill placed below the Mean High Water level (El. 4.17) should consist of Maine DOT 703.19 Granular Borrow for Underwater Backfill. We recommend that embankment construction be scheduled early in the project to allow embankment settlement to occur during construction, thereby reducing the magnitude of long‐term settlement. This may include overbuilding the embankments in the most significant fill areas, near the abutments, prior to installation of piles. 6.3 ABUTMENT AND WINGWALL DESIGN
Backfill between new abutments and a 1.5H:1V plane extending up from the bottom of the abutment to the pavement subgrade should consist of Maine DOT 703.19 Granular Borrow for

02/25/2016
NEW MEADOWS NO.2 BRIDGE REPLACEMENT 09.0025900.00
13
Underwater Backfill, BDG Type 4 soil. Recommended soil properties for Type 4 soils to be used as backfill are as follows:
Internal Friction Angle of Soil = 32°
Soil Total Unit Weight = 125 pcf
Rankine Coefficient of Passive Earth Pressure, Kp= 3.25 (use for design of backwalls and wingwalls)
Live load surcharge should be applied as a uniform lateral surcharge pressure using the equivalent fill height (Heq) values developed in accordance with AASHTO Article 3.11.6.4 based on the abutment/wingwall height and distance from the wall backface to the edge of traffic.
Foundation drainage should be provided in accordance with Section 5.4.1.9 of the BDG.
We recommend the use of French drains on the uphill side of abutments and wing walls to prevent buildup of differential hydrostatic pressure. Foundation drains should be sloped to drain by gravity and should daylight through weep holes in the abutments.
6.4 PILE DESIGN
The proposed abutments may be supported on HP14x89 ASTM A572, Grade 50 steel (50 ksi yield stress) H‐piles driven to the required nominal resistance, anticipated to be developed through a combination of skin friction and end‐bearing on or near the bedrock surface.
Cast steel pile points should be provided to limit pile damage during driving.
Pile installation should be controlled using wave equation analysis and field logging of the pile installation with final penetration resistance based on dynamic pile testing with signal matching analysis.
The piles should be driven to a nominal resistance of 391 kips, calculated by dividing the maximum factored pile load of 254 kips by a resistance factor of 0.65.
Preliminary wave equation analyses indicate that the piles can be driven to a nominal resistance of 391 kips using a diesel hammer with a rated energy of about 40,000 foot‐pounds for the anticipated 70 to 100‐foot‐long, ASTM A572 Grade 50 HP14x89 piles without exceeding the allowable driving stress of 45 ksi (0.9Fy for 50 ksi steel). The final penetration resistance was 10 to 11 bpi, which is within the Maine DOT range of 3 to 15 blows per inch. In GZA’s experience, the preferred range of final penetration resistance is 6 to 10 blows per inch.
The pile tip elevations used in the drawings should correspond to the bedrock elevations encountered in the borings (El. ‐66.1 at Abutment 1, El. ‐92.3 at Abutment 2), plus or minus 5 feet to account for variability in the top of rock surface and the potential for piles to penetrate a short distance into the bedrock.
We recommend that one pile at each abutment be dynamically tested at the end of initial drive to assess driving stress and establish the penetration resistance criteria to achieve the required nominal resistance for the production piles. The plans should also require a restrike test on each pile. In the event that the initial driving results are favorable and show sufficient excess resistance to allow for some relaxation, the restrike tests may be waived.
Piles shall be spliced in accordance with MaineDOT Section 501.047.
02/25/2016
NEW MEADOWS NO.2 BRIDGE REPLACEMENT 09.0025900.00
14
The structural engineer should complete structural evaluation of the piles using the bending stress results from the LPile analyses summarized in Section 5.4.7 (output provided in Appendix D) in accordance with the design steps listed in BDG Section 5.4.2.4.C.
7.0 CONSTRUCTION CONSIDERATIONS
This section provides guidance regarding quality control during pile installation, excavation, dewatering, and foundation subgrade preparation and protection. These items are given in the paragraphs that follow. 7.1 PILE INSTALLATION CONTROL
We recommend that the pile installation be controlled using wave equation analysis and field logging of the pile installation and that final penetration resistance be based on dynamic pile testing with signal matching analysis. As previously noted, the piles should be driven to a nominal capacity calculated by dividing the maximum factored pile load by a resistance factor of 0.65, per AASHTO Table 10.5.5.2.3‐1. AASHTO Table 10.5.5.2.3‐1 requires that at least one load test with signal matching be performed per substructure to use a resistance factor of 0.65. Therefore, it is recommended that two PDA tests with Signal Matching be completed, including one pile at each abutment. Consistent with MaineDOT practice, restrike tests should be conducted for each pile analyzed at end‐of‐initial driving using the PDA. Additional PDA testing may be recommended if unanticipated conditions are encountered during installation, including early pile take‐up, pile driving out‐of‐plumb, or otherwise unexplained variations in hammer performance. In the event that the initial driving results are favorable and show sufficient excess resistance to allow for some relaxation, the restrike tests may be waived. 7.2 PILE OBSTRUCTIONS
Pre‐drilling, pre‐excavation or spudding may be necessary to bypass potential obstructions, such as boulders, rock fill or existing foundations and stone masonry. 7.3 CONSTRUCTION SEQUENCE
We recommend that the construction sequence include completion of fill placement to widen the approach embankments as early as practical during construction, especially in the area with the greatest height and plan limits of new fill near the abutments. This will help limit the post‐construction embankment settlement and improve serviceability of the approaches. 7.4 EXCAVATION, TEMPORARY LATERAL SUPPORT AND DEWATERING
Excavations for abutment foundations are anticipated to range from 10 to 12 feet below existing pavement grades. It is our understanding that Old Bath/Old Brunswick Road will be out service during construction of the new bridge. In areas where sufficient space is available and water conditions permit, the excavation slopes may consist of sloped, open‐cuts. In all cases, temporary excavations should comply with OSHA excavation safety requirements.

02/25/2016
NEW MEADOWS NO.2 BRIDGE REPLACEMENT 09.0025900.00
15
Considering the proximity of the required abutment excavation to the river water level, management of water will be related to tidal conditions. Considering the deepest excavation levels at El. 1.5 to El. 2 and MHW at El. 4.17, water levels may exceed the bottom of excavation level by 2.5 to 3 feet during a typical tide cycle. It may be desirable to over‐excavate and place an 8‐ to 12‐inch thick crushed stone working mat to improve accessibility and allow dewatering. If space is limited, it may be necessary to install a three‐sided (open) cofferdam around each abutment to allow excavation, fill placement and concrete placement to be completed. We anticipate that the inflow of groundwater or surface water to excavations can be handled by open pumping from sumps installed at the bottom of excavations if cofferdams are installed. The contractor should be responsible for controlling groundwater, surface runoff, tidal inflow, infiltration and water from all other sources by methods which preserve the undisturbed condition of the subgrade and permit foundation construction in‐the‐dry. Discharge of pumped groundwater and river water should comply with all local, State, and federal regulations. 7.5 REUSE OF ON‐SITE MATERIALS
Based on the test boring results, two of the four fill samples tested had greater than 20 percent passing the No. 200 sieve, indicating the fill may not meet MaineDOT specifications for Granular Borrow and/or Granular Borrow for Underwater Backfill and is unsuitable for use as structural backfill. The material is considered suitable for use as Common Borrow. If the contractor wishes to reuse excavated material as embankment fill or in other areas, we recommend that the proposed material be stockpiled and tested for grain size distribution. Stockpiled materials meeting the appropriate MaineDOT specifications may be reused on the project. P:\09 Jobs\0025900s\09.0025900.00 ‐ MDOT Brunswick‐Bath\Report\Draft 25900 New Meadows Bridge Geotech RPT 02‐17‐16.docx

02/25/2016
NEW MEADOWS BRIDGE NO.2 REPLACEMENT 09.0025900.00
FIGURES
Copyright:© 2013 National Geographic Society, i-cubed
© 20
16 - G
ZA G
eoEn
viron
menta
l, Inc
. C:\
GIS
\Loc
usP
lan
s\F
igur
e1-
Lo
cusP
lan
259
00.m
xd, 2
/25/
201
6, 4
:48
:56
PM
, ai
me
e.m
oun
tain
1FIGURE
09.0025900.002/25/2016
RJMARB
ARB
CLS
ADM
MAINEDOT
1 in = 2,000 ft
NEW MEADOWS NO. 2 BRIDGEOVER THE NEW MEADOWS RIVER
BRUNSWICK-BATH, MAINE
LOCUS PLAN
40 2,000 4,0001,000
Feet
SITE
UNLESS SPECIFICALLY STATED BY WRITTEN AGREEMENT, THIS DRAWING IS THE SOLE PROPERTY OF GZAGEOENVIRONMENTAL, INC. (GZA). THE INFORMATION SHOWN ON THE DRAWING IS SOLELY FOR THE USE BY GZA'S CLIENTOR THE CLIENT'S DESIGNATED REPRESENTATIVE FOR THE SPECIFIC PROJECT AND LOCATION IDENTIFIED ON THEDRAWING. THE DRAWING SHALL NOT BE TRANSFERRED, REUSED, COPIED, OR ALTERED IN ANY MANNER FOR USE AT ANYOTHER LOCATION OR FOR ANY OTHER PURPOSE WITHOUT THE PRIOR WRITTEN CONSENT OF GZA, ANY TRANSFER,REUSE, OR MODIFICATION TO THE DRAWING BY THE CLIENT OR OTHERS, WITHOUT THE PRIOR WRITTEN EXPRESSCONSENT OF GZA, WILL BE AT THE USER'S SOLE RISK AND WITHOUT ANY RISK OR LIABILITY TO GZA.
PREPARED FOR:
SOURCE : THIS MAP CONTAINS THE ESRI ARCGIS ONLINE USA TOPOGRAPHIC MAPSERVICE, PUBLISHED DECEMBER 12, 2009 BY ESRI ARCIMS SERVICES AND UPDATED AS
NEEDED. THIS SERVICE USES UNIFORM NATIONALLY RECOGNIZED DATUM AND CARTOGRAPHYSTANDARDS AND A VARIETY OF AVAILABLE SOURCES FROM SEVERAL DATA PROVIDERS
DATE:
DESIGNED BY:
PROJ MGR:
PROJECT NO.
DRAWN BY:
REVIEWED BY:
REVISION NO.
SCALE:
CHECKED BY:
PREPARED BY:
GZA GeoEnvironmental, Inc.Engineers and Scientists
www.gza.com


02/25/2016
NEW MEADOWS BRIDGE NO.2 REPLACEMENT 09.0025900.00
APPENDIX A
LIMITATIONS

02/25/2016
NEW MEADOWS BRIDGE NO.2 REPLACEMENT 09.0025900.00
A‐1
GEOTECHNICAL LIMITATIONS Use of Report 1. GZA GeoEnvironmental, Inc. (GZA) prepared this report on behalf of, and for the exclusive use of our
Client for the stated purpose(s) and location(s) identified in the Proposal for Services and/or Report. Use of this report, in whole or in part, at other locations, or for other purposes, may lead to inappropriate conclusions; and we do not accept any responsibility for the consequences of such use(s). Further, reliance by any party not expressly identified in the contract documents, for any use, without our prior written permission, shall be at that party’s sole risk, and without any liability to GZA.
Standard of Care 2. GZA’s findings and conclusions are based on the work conducted as part of the Scope of Services set
forth in Proposal for Services and/or Report, and reflect our professional judgment. These findings and conclusions must be considered not as scientific or engineering certainties, but rather as our professional opinions concerning the limited data gathered during the course of our work. If conditions other than those described in this report are found at the subject location(s), or the design has been altered in any way, GZA shall be so notified and afforded the opportunity to revise the report, as appropriate, to reflect the unanticipated changed conditions .
3. GZA’s services were performed using the degree of skill and care ordinarily exercised by qualified
professionals performing the same type of services, at the same time, under similar conditions, at the same or a similar property. No warranty, expressed or implied, is made.
4. In conducting our work, GZA relied upon certain information made available by public agencies,
Client and/or others. GZA did not attempt to independently verify the accuracy or completeness of that information. Inconsistencies in this information which we have noted, if any, are discussed in the Report.
Subsurface Conditions 5. The generalized soil profile(s) provided in our Report are based on widely‐spaced subsurface
explorations and are intended only to convey trends in subsurface conditions. The boundaries between strata are approximate and idealized, and were based on our assessment of subsurface conditions. The composition of strata, and the transitions between strata, may be more variable and more complex than indicated. For more specific information on soil conditions at a specific location refer to the exploration logs. The nature and extent of variations between these explorations may not become evident until further exploration or construction. If variations or other latent conditions then become evident, it will be necessary to reevaluate the conclusions and recommendations of this report.
6. In preparing this report, GZA relied on certain information provided by the Client, state and local
officials, and other parties referenced therein which were made available to GZA at the time of our evaluation. GZA did not attempt to independently verify the accuracy or completeness of all information reviewed or received during the course of this evaluation.

02/25/2016
NEW MEADOWS BRIDGE NO.2 REPLACEMENT 09.0025900.00
A‐2
7. Water level readings have been made in test holes (as described in this Report) and monitoring wells at the specified times and under the stated conditions. These data have been reviewed and interpretations have been made in this Report. Fluctuations in the level of the groundwater however occur due to temporal or spatial variations in areal recharge rates, soil heterogeneities, the presence of subsurface utilities, and/or natural or artificially induced perturbations. The water table encountered in the course of the work may differ from that indicated in the Report.
8. GZA’s services did not include an assessment of the presence of oil or hazardous materials at the
property. Consequently, we did not consider the potential impacts (if any) that contaminants in soil or groundwater may have on construction activities, or the use of structures on the property.
9. Recommendations for foundation drainage, waterproofing, and moisture control address the
conventional geotechnical engineering aspects of seepage control. These recommendations may not preclude an environment that allows the infestation of mold or other biological pollutants.
Compliance with Codes and Regulations 10. We used reasonable care in identifying and interpreting applicable codes and regulations. These
codes and regulations are subject to various, and possibly contradictory, interpretations. Compliance with codes and regulations by other parties is beyond our control.
Cost Estimates 11. Unless otherwise stated, our cost estimates are only for comparative and general planning purposes.
These estimates may involve approximate quantity evaluations. Note that these quantity estimates are not intended to be sufficiently accurate to develop construction bids, or to predict the actual cost of work addressed in this Report. Further, since we have no control over either when the work will take place or the labor and material costs required to plan and execute the anticipated work, our cost estimates were made by relying on our experience, the experience of others, and other sources of readily available information. Actual costs may vary over time and could be significantly more, or less, than stated in the Report.
Additional Services 12. GZA recommends that we be retained to provide services during any future: site observations,
design, implementation activities, construction and/or property development/redevelopment. This will allow us the opportunity to: i) observe conditions and compliance with our design concepts and opinions; ii) allow for changes in the event that conditions are other than anticipated; iii) provide modifications to our design; and iv) assess the consequences of changes in technologies and/or regulations.

02/25/2016
NEW MEADOWS BRIDGE NO.2 REPLACEMENT 09.0025900.00
APPENDIX B
TEST BORING LOGS

0
5
10
15
20
25
S1
1D
2D
3D
4D/MV
24/13
24/18
24/24
24/24
2.5 - 4.0
5.0 - 7.0
10.0 - 12.0
15.0 - 17.0
20.0 - 22.0
36/15/13/10
3/3/3/3
WOH/WOH/WOH/WOH
2/2/2/3
28
6
---
4
42
9
6
SSA
15
16
18
21
20
a14OPEN
HOLE
10.6
2.7
-12.3
7" Pavement0.6
Brown, damp, Gravelly fine to coarse SAND, trace silt.-FILL- (SW-SM)
Light brown, moist, dense, fine to coarse SAND, littlesilt, little gravel.-SAND/POSSIBLE FILL- (SM)
8.5
Olive-grey, wet, stiff, Clayey SILT, trace sand, tracegravel, with organics and wood.-SILT- (ML)
Set in HW Casing at 15.0 ft bgs.Olive grey, wet, very soft, SILT, some clay, trace sand,trace gravel, with shells.-SILT- (ML)
a14 blows for 0.5 ft.Failed 65x130 mm vane attempt, would not push.Dark brown, wet, medium stiff, SILT, some sand, someclay, trace gravel, with organics and peat.-SILT- (ML)
23.5
G#263381A-1-b, SW-SM
WC=3.7%
G#263382A-2-4, SMWC=6.9%
G#263383A-4, ML
WC=46.1%
G#263384A-4, ML
WC=47.0%Non-Plastic
G#263385A-4, ML
WC=67.1%
Maine Department of Transportation Project: New Meadows No. 2 Bridge #2604 carriesOld Brunswick/Bath Road over the New
Boring No.: BB-NMR-101Soil/Rock Exploration Log
Location: Bath-Brunswick, MaineUS CUSTOMARY UNITS PIN: 20478.00
Driller: MaineDOT Elevation (ft.) 11.2 Auger ID/OD: 5" Solid Stem
Operator: Giles/Daggett Datum: NAVD88 Sampler: Standard Split
Logged By: B. Wilder Rig Type: CME 45C Hammer Wt./Fall: 140#/30"
Date Start/Finish: 3/19/2015, 3/25,26/2015 Drilling Method: Cased Wash Boring Core Barrel: NQ-2"
Boring Location: 1+60.1, 6.1 ft Lt. Casing ID/OD: HW & NW Water Level*: 15.0 ft bgs.
Hammer Efficiency Factor: 0.908 Hammer Type: Automatic Hydraulic Rope & Cathead Definitions: R = Rock Core Sample Su = Insitu Field Vane Shear Strength (psf) Su(lab) = Lab Vane Shear Strength (psf)D = Split Spoon Sample SSA = Solid Stem Auger Tv = Pocket Torvane Shear Strength (psf) WC = water content, percentMD = Unsuccessful Split Spoon Sample attempt HSA = Hollow Stem Auger qp = Unconfined Compressive Strength (ksf) LL = Liquid LimitU = Thin Wall Tube Sample RC = Roller Cone N-uncorrected = Raw field SPT N-value PL = Plastic LimitMU = Unsuccessful Thin Wall Tube Sample attempt WOH = weight of 140lb. hammer Hammer Efficiency Factor = Annual Calibration Value PI = Plasticity IndexV = Insitu Vane Shear Test WOR = weight of rods N60 = SPT N-uncorrected corrected for hammer efficiency G = Grain Size AnalysisMV = Unsuccessful Insitu Vane Shear Test attempt WO1P = Weight of one person N60 = (Hammer Efficiency Factor/60%)*N-uncorrected C = Consolidation Test
Remarks:
1. GZA reviewed and updated preliminary logs prepared by Maine DOT based on lab test results and GZA interpretations.
Stratification lines represent approximate boundaries between soil types; transitions may be gradual.* Water level readings have been made at times and under conditions stated. Groundwater fluctuations may occur due to conditions other than those
present at the time measurements were made. Boring No.: BB-NMR-101
Dept
h (f
t.)
Sam
ple
No.
Sample Information
Pen
./Rec.
(in
.)
Sam
ple
Dept
h(f
t.)
Blo
ws
(/6
in.)
She
ar
Str
ength
(psf
)or
RQ
D (
%)
N-u
nco
rrec
ted
N60
Cas
ing
Blo
ws
Ele
vatio
n(f
t.)
Gra
phi
c Log
Visual Description and Remarks
LaboratoryTesting Results/
AASHTO and
Unified Class.
Page 1 of 5

25
30
35
40
45
50
5D/MV
6DV1
V2
V3
V4
7D/MU
V5
V6
MU
MV8D
24/24
24/24
24/24
18/0
24/24
25.0 - 27.0
30.0 - 32.030.6 - 31.0
31.6 - 32.0
35.6 - 36.0
36.6 - 37.0
40.0 - 42.0
42.6 - 43.0
43.6 - 44.0
45.0 - 46.5
46.6 - 48.6
2/3/3/3
WOR/WOR/WOR/WOR
Su=412/110 psfSu=330/110 psf
Su=426/110 psf
Su=412/110 psf
WOR/WOR/WOR/WOR
Su=467/137 psf
Su=607/137 psf
Piston Sample
WOR/WOR/WOR/WOR
6
---
---
---
9Failed 65x130 mm vane attempt, would not push.Grey, wet, stiff, Silty CLAY, trace fine sand.-MARINE CLAY- (CL)
Grey, wet, soft, CLAY, some silt, trace fine sand.-MARINE CLAY- (CL)65x130 mm vane raw torque readings:V1: 15.0/4.0 ft-lbs.V2: 12.0/4.0 ft-lbs.
65x130 mm vane raw torque readings:V3: 15.5/4.0 ft-lbs.V4: 15.0/4.0 ft-lbs.
Failed tube attempt by Piston Sample.Dark grey, wet, soft, Silty CLAY, trace fine sand.-MARINE CLAY- (CL)Washed ahead to 42.0 ft bgs, then took vanes.
65x130 mm vane raw torque readings:V5: 17.0/5.0 ft-lbs.V6: 21.0/5.0 ft-lbs.
Failed tube attempt, possible cobble / obstruction.
Failed 65x130 mm vane attempt, would not push.Dark grey, wet, medium stiff, Silty CLAY, trace finesand.-MARINE CLAY- (CL)
G#263386A-6, CL
WC=32.8%LL=32PL=19PI=13
G#263387A-6, CL
WC=41.8%LL=38PL=22PI=16
G#264776A-6, CL
WC=34.4%
G#264777A-6, CL
WC=40.0%LL=39PL=24PI=15
Maine Department of Transportation Project: New Meadows No. 2 Bridge #2604 carriesOld Brunswick/Bath Road over the New
Boring No.: BB-NMR-101Soil/Rock Exploration Log
Location: Bath-Brunswick, MaineUS CUSTOMARY UNITS PIN: 20478.00
Driller: MaineDOT Elevation (ft.) 11.2 Auger ID/OD: 5" Solid Stem
Operator: Giles/Daggett Datum: NAVD88 Sampler: Standard Split
Logged By: B. Wilder Rig Type: CME 45C Hammer Wt./Fall: 140#/30"
Date Start/Finish: 3/19/2015, 3/25,26/2015 Drilling Method: Cased Wash Boring Core Barrel: NQ-2"
Boring Location: 1+60.1, 6.1 ft Lt. Casing ID/OD: HW & NW Water Level*: 15.0 ft bgs.
Hammer Efficiency Factor: 0.908 Hammer Type: Automatic Hydraulic Rope & Cathead Definitions: R = Rock Core Sample Su = Insitu Field Vane Shear Strength (psf) Su(lab) = Lab Vane Shear Strength (psf)D = Split Spoon Sample SSA = Solid Stem Auger Tv = Pocket Torvane Shear Strength (psf) WC = water content, percentMD = Unsuccessful Split Spoon Sample attempt HSA = Hollow Stem Auger qp = Unconfined Compressive Strength (ksf) LL = Liquid LimitU = Thin Wall Tube Sample RC = Roller Cone N-uncorrected = Raw field SPT N-value PL = Plastic LimitMU = Unsuccessful Thin Wall Tube Sample attempt WOH = weight of 140lb. hammer Hammer Efficiency Factor = Annual Calibration Value PI = Plasticity IndexV = Insitu Vane Shear Test WOR = weight of rods N60 = SPT N-uncorrected corrected for hammer efficiency G = Grain Size AnalysisMV = Unsuccessful Insitu Vane Shear Test attempt WO1P = Weight of one person N60 = (Hammer Efficiency Factor/60%)*N-uncorrected C = Consolidation Test
Remarks:
1. GZA reviewed and updated preliminary logs prepared by Maine DOT based on lab test results and GZA interpretations.
Stratification lines represent approximate boundaries between soil types; transitions may be gradual.* Water level readings have been made at times and under conditions stated. Groundwater fluctuations may occur due to conditions other than those
present at the time measurements were made. Boring No.: BB-NMR-101
Dept
h (f
t.)
Sam
ple
No.
Sample Information
Pen
./Rec.
(in
.)
Sam
ple
Depth
(ft.)
Blo
ws
(/6
in.)
She
ar
Str
ength
(psf
)or
RQ
D (
%)
N-u
nco
rrec
ted
N60
Cas
ing
Blo
ws
Ele
vatio
n(f
t.)
Gra
phi
c Log
Visual Description and Remarks
LaboratoryTesting Results/
AASHTO and
Unified Class.
Page 2 of 5

50
55
60
65
70
75
9DV7
V8
V9
V10
10DV11
V12
V13
V14
11DV15
V16
24/24
24/24
24/20
50.0 - 52.050.6 - 51.0
51.6 - 52.0
55.6 - 56.0
56.6 - 57.0
60.0 - 62.060.6 - 61.0
61.6 - 62.0
65.5 - 65.9
66.5 - 66.9
70.0 - 72.070.6 - 71.0
71.6 - 72.0
WOR/WOR/WOR/WOR
Su=522/247 psfSu=632/247 psf
Su=424/89 psf
Su=446/89 psf
WOR/WOR/WOR/WOR
Su=670/45 psfSu=625/45 psf
Su=312/45 psf
Su=312/112 psf
WOR/WOR/WOR/WOR
Su=379/112 psfSu=491/134 psf
---
---
---
HYDPUSH
Dark grey, wet, medium stiff, Silty CLAY, trace finesand.-MARINE CLAY- (CLChanged to NW Casing at 50.0 ft bgs.65x130 mm vane raw torque readings:V7: 19.0/9.0 ft-lbs.V8: 23.0/9.0 ft lbs.
Hit 1/2" sand seam at 55.4 ft bgs.55/110 mm vane raw torque readings:V9: 9.5/2.0 ft-lbs.V10: 10.0/2.0 ft-lbs.
Dark grey, wet, medium stiff, Silty CLAY, trace finesand.-MARINE CLAY- (CL)55/110 mm vane raw torque readings:V11: 15.0/1.0 ft-lbs.V12: 14.0/1.0 ft-lbs.
Similar to 10D, soft.-MARINE CLAY- (CL)55/110 mm vane raw torque readings:V13: 7.0/1.0 ft-lbs.V14: 7.0/2.5 ft-lbs.
Grey, wet, soft, Silty CLAY, trace fine sand.-MARINE CLAY- (CL)55/110 mm vane raw torque readings:V15: 8.5/2.5 ft-lbs.V16: 11.0/3.0 ft-lbs.
Combined w/8D
G#264778A-6, CL
WC=37.7%
Maine Department of Transportation Project: New Meadows No. 2 Bridge #2604 carriesOld Brunswick/Bath Road over the New
Boring No.: BB-NMR-101Soil/Rock Exploration Log
Location: Bath-Brunswick, MaineUS CUSTOMARY UNITS PIN: 20478.00
Driller: MaineDOT Elevation (ft.) 11.2 Auger ID/OD: 5" Solid Stem
Operator: Giles/Daggett Datum: NAVD88 Sampler: Standard Split
Logged By: B. Wilder Rig Type: CME 45C Hammer Wt./Fall: 140#/30"
Date Start/Finish: 3/19/2015, 3/25,26/2015 Drilling Method: Cased Wash Boring Core Barrel: NQ-2"
Boring Location: 1+60.1, 6.1 ft Lt. Casing ID/OD: HW & NW Water Level*: 15.0 ft bgs.
Hammer Efficiency Factor: 0.908 Hammer Type: Automatic Hydraulic Rope & Cathead Definitions: R = Rock Core Sample Su = Insitu Field Vane Shear Strength (psf) Su(lab) = Lab Vane Shear Strength (psf)D = Split Spoon Sample SSA = Solid Stem Auger Tv = Pocket Torvane Shear Strength (psf) WC = water content, percentMD = Unsuccessful Split Spoon Sample attempt HSA = Hollow Stem Auger qp = Unconfined Compressive Strength (ksf) LL = Liquid LimitU = Thin Wall Tube Sample RC = Roller Cone N-uncorrected = Raw field SPT N-value PL = Plastic LimitMU = Unsuccessful Thin Wall Tube Sample attempt WOH = weight of 140lb. hammer Hammer Efficiency Factor = Annual Calibration Value PI = Plasticity IndexV = Insitu Vane Shear Test WOR = weight of rods N60 = SPT N-uncorrected corrected for hammer efficiency G = Grain Size AnalysisMV = Unsuccessful Insitu Vane Shear Test attempt WO1P = Weight of one person N60 = (Hammer Efficiency Factor/60%)*N-uncorrected C = Consolidation Test
Remarks:
1. GZA reviewed and updated preliminary logs prepared by Maine DOT based on lab test results and GZA interpretations.
Stratification lines represent approximate boundaries between soil types; transitions may be gradual.* Water level readings have been made at times and under conditions stated. Groundwater fluctuations may occur due to conditions other than those
present at the time measurements were made. Boring No.: BB-NMR-101
Dept
h (f
t.)
Sam
ple
No.
Sample Information
Pen
./Rec.
(in
.)
Sam
ple
Depth
(ft.)
Blo
ws
(/6
in.)
She
ar
Str
ength
(psf
)or
RQ
D (
%)
N-u
nco
rrec
ted
N60
Cas
ing
Blo
ws
Ele
vatio
n(f
t.)
Gra
phi
c Log
Visual Description and Remarks
LaboratoryTesting Results/
AASHTO and
Unified Class.
Page 3 of 5

75
80
85
90
95
100
12DV17
MV
13D
14D
15D
24/17
24/12
24/16
24/17
75.0 - 77.075.6 - 76.0
80.0 - 82.0
85.0 - 87.0
90.0 - 92.0
WOR/WOR/2/13Su=446/125 psf
14/7/13/12
22/11/11/11
14/16/15/13
2
20
22
31
3
30
33
47
23
26
49
52
45
52
54
63
55
28
37
41
38
60
57
69
81
97
93
31
30
28
31
39
-65.2
Grey, wet, soft, Silty CLAY, some fine sand.-MARINE CLAY- (CL)1" sand seam at 75.4 ft bgs.55/110 mm vane raw torque readings:V17: 10.0/2.8 ft-lbs.
76.4Grey, wet, very loose, fine to coarse SAND, some gravel,some silt, trace clay.-GLACIAL TILL- (SC-SM)Failed 55x110 mm vane attempt, would not push.
Grey, wet, medium dense, fine to coarse SAND, somegravel, some silt, trace clay.=GLACIAL TILL- (SC-SM)
Grey, wet, dense, fine to coarse SAND, little silt, tracegravel.Roller Coned ahead to 90.0 ft bgs.-GLACIAL TILL- (SM)
Grey, wet, hard, SILT, some sand, little gravel, trace silt.Roller Coned ahead to 100.0 ft bgs.-GLACIAL TILL- (ML)
G#264779A-2-4, SC-SM
WC=12.5%
G#264780A-2-4, SMWC=15.3%
G#264781A-4, ML
WC=10.7%
Maine Department of Transportation Project: New Meadows No. 2 Bridge #2604 carriesOld Brunswick/Bath Road over the New
Boring No.: BB-NMR-101Soil/Rock Exploration Log
Location: Bath-Brunswick, MaineUS CUSTOMARY UNITS PIN: 20478.00
Driller: MaineDOT Elevation (ft.) 11.2 Auger ID/OD: 5" Solid Stem
Operator: Giles/Daggett Datum: NAVD88 Sampler: Standard Split
Logged By: B. Wilder Rig Type: CME 45C Hammer Wt./Fall: 140#/30"
Date Start/Finish: 3/19/2015, 3/25,26/2015 Drilling Method: Cased Wash Boring Core Barrel: NQ-2"
Boring Location: 1+60.1, 6.1 ft Lt. Casing ID/OD: HW & NW Water Level*: 15.0 ft bgs.
Hammer Efficiency Factor: 0.908 Hammer Type: Automatic Hydraulic Rope & Cathead Definitions: R = Rock Core Sample Su = Insitu Field Vane Shear Strength (psf) Su(lab) = Lab Vane Shear Strength (psf)D = Split Spoon Sample SSA = Solid Stem Auger Tv = Pocket Torvane Shear Strength (psf) WC = water content, percentMD = Unsuccessful Split Spoon Sample attempt HSA = Hollow Stem Auger qp = Unconfined Compressive Strength (ksf) LL = Liquid LimitU = Thin Wall Tube Sample RC = Roller Cone N-uncorrected = Raw field SPT N-value PL = Plastic LimitMU = Unsuccessful Thin Wall Tube Sample attempt WOH = weight of 140lb. hammer Hammer Efficiency Factor = Annual Calibration Value PI = Plasticity IndexV = Insitu Vane Shear Test WOR = weight of rods N60 = SPT N-uncorrected corrected for hammer efficiency G = Grain Size AnalysisMV = Unsuccessful Insitu Vane Shear Test attempt WO1P = Weight of one person N60 = (Hammer Efficiency Factor/60%)*N-uncorrected C = Consolidation Test
Remarks:
1. GZA reviewed and updated preliminary logs prepared by Maine DOT based on lab test results and GZA interpretations.
Stratification lines represent approximate boundaries between soil types; transitions may be gradual.* Water level readings have been made at times and under conditions stated. Groundwater fluctuations may occur due to conditions other than those
present at the time measurements were made. Boring No.: BB-NMR-101
Dept
h (f
t.)
Sam
ple
No.
Sample Information
Pen
./Rec.
(in
.)
Sam
ple
Depth
(ft.)
Blo
ws
(/6
in.)
She
ar
Str
ength
(psf
)or
RQ
D (
%)
N-u
nco
rrec
ted
N60
Cas
ing
Blo
ws
Ele
vatio
n(f
t.)
Gra
phi
c Log
Visual Description and Remarks
LaboratoryTesting Results/
AASHTO and
Unified Class.
Page 4 of 5

100
105
110
115
120
125
16D
R1
R2
24/20
60/58
60/59
100.0 - 102.0
103.5 - 108.5
108.5 - 113.5
14/14/18/33
RQD = 25%
RQD = 50%
32 48 80
102
126
b100NQ-2
-92.3
-102.3
Grey, wet, dense, fine to coarse SAND, some gravel,little silt.-GLACIAL TILL- (SM)
b100 blows for 0.5 ft.103.5
Top of Bedrock at Elev. -92.3 ft.R1: Hard, fresh, fine grained, grey, SCHIST. Joints arevery close to closely spaced, low angle, low tomoderately dipping, undulating, rough, fresh todiscolored, tight to partially open.Rock Mass Quality = Very Poor.R1:Core Times (min:sec)103.5-104.5 ft (5:32)104.5-105.5 ft (3:07)105.5-106.5 ft (2:20)106.5-107.5 ft (2:00)107.5-108.5 ft (2:00) 97% RecoveryR2: Hard, fresh, fine grained, grey, SCHIST. Joints arevery close to closely spaced, low angle to moderatelydipping, undulating, rough, fresh, tight to partially open.Rock Mass Quality = Poor.R2:Core Times (min:sec)108.5-109.5 ft (2:02)109.5-110.5 ft (2:02)110.5-111.5 ft (2:09)111.5-112.5 ft (2:09)112.5-113.5 ft (2:15) 98% Recovery
113.5Bottom of Exploration at 113.50 feet below ground
surface.
G#264782A-1-b, SMWC=10.1%
Maine Department of Transportation Project: New Meadows No. 2 Bridge #2604 carriesOld Brunswick/Bath Road over the New
Boring No.: BB-NMR-101Soil/Rock Exploration Log
Location: Bath-Brunswick, MaineUS CUSTOMARY UNITS PIN: 20478.00
Driller: MaineDOT Elevation (ft.) 11.2 Auger ID/OD: 5" Solid Stem
Operator: Giles/Daggett Datum: NAVD88 Sampler: Standard Split
Logged By: B. Wilder Rig Type: CME 45C Hammer Wt./Fall: 140#/30"
Date Start/Finish: 3/19/2015, 3/25,26/2015 Drilling Method: Cased Wash Boring Core Barrel: NQ-2"
Boring Location: 1+60.1, 6.1 ft Lt. Casing ID/OD: HW & NW Water Level*: 15.0 ft bgs.
Hammer Efficiency Factor: 0.908 Hammer Type: Automatic Hydraulic Rope & Cathead Definitions: R = Rock Core Sample Su = Insitu Field Vane Shear Strength (psf) Su(lab) = Lab Vane Shear Strength (psf)D = Split Spoon Sample SSA = Solid Stem Auger Tv = Pocket Torvane Shear Strength (psf) WC = water content, percentMD = Unsuccessful Split Spoon Sample attempt HSA = Hollow Stem Auger qp = Unconfined Compressive Strength (ksf) LL = Liquid LimitU = Thin Wall Tube Sample RC = Roller Cone N-uncorrected = Raw field SPT N-value PL = Plastic LimitMU = Unsuccessful Thin Wall Tube Sample attempt WOH = weight of 140lb. hammer Hammer Efficiency Factor = Annual Calibration Value PI = Plasticity IndexV = Insitu Vane Shear Test WOR = weight of rods N60 = SPT N-uncorrected corrected for hammer efficiency G = Grain Size AnalysisMV = Unsuccessful Insitu Vane Shear Test attempt WO1P = Weight of one person N60 = (Hammer Efficiency Factor/60%)*N-uncorrected C = Consolidation Test
Remarks:
1. GZA reviewed and updated preliminary logs prepared by Maine DOT based on lab test results and GZA interpretations.
Stratification lines represent approximate boundaries between soil types; transitions may be gradual.* Water level readings have been made at times and under conditions stated. Groundwater fluctuations may occur due to conditions other than those
present at the time measurements were made. Boring No.: BB-NMR-101
Dept
h (f
t.)
Sam
ple
No.
Sample Information
Pen
./Rec.
(in
.)
Sam
ple
Depth
(ft.)
Blo
ws
(/6
in.)
She
ar
Str
ength
(psf
)or
RQ
D (
%)
N-u
nco
rrec
ted
N60
Cas
ing
Blo
ws
Ele
vatio
n(f
t.)
Gra
phi
c Log
Visual Description and Remarks
LaboratoryTesting Results/
AASHTO and
Unified Class.
Page 5 of 5

0
5
10
15
20
25
1D
2D
3D
4D
5D
4.8/3
24/16
24/18
24/13
24/20
2.0 - 2.4
5.0 - 7.0
10.0 - 12.0
15.0 - 17.0
20.0 - 22.0
50(4.8")
4/5/6/6
2/2/1/1
8/9/11/17
4/6/8/9
---
11
3
20
14
16
4
29
21
HSA
47
55
68
53
75
46
51
60
63
60
OPENHOLE
10.2
2.3
-2.2
-7.2
7" Pavement0.6
Brown, damp, fine to coarse SAND, some silt, littlegravel, old pavement.-FILL- (SM)
Brown, damp, medium dense, fine to coarse SAND,some silt, little gravel.-FILL- (SM)
8.5
Olive-brown, moist, soft, SILT, some clay, little sand,trace gravel.Set in HW casing at 10.0 ft bgs.-SILT- (ML)
13.0
Grey, wet, medium dense, GRAVEL, some sand, littlesilt, little clay.-GRAVEL- (GC-GM)
18.0
Olive-grey, moist, very stiff, Silty CLAY, trace finesand.-MARINE CLAY- (CL)Roller Coned ahead to 25.0 ft bgs.
G#263388A-2-4, SMWC=2.2%
G#263389A-2-4, SMWC=8.7%
G#263390A-4, ML
WC=29.2%
G#263391A-2-4, GC-GM
WC=35.3%
G#263392A-6, CL
WC=30.1%LL=36PL=22PI=14
Maine Department of Transportation Project: New Meadows No. 2 Bridge #2604 carriesOld Brunswick/Bath Road over the New
Boring No.: BB-NMR-102Soil/Rock Exploration Log
Location: Bath-Brunswick, MaineUS CUSTOMARY UNITS PIN: 20478.00
Driller: Northern Test Boring Elevation (ft.) 10.8 Auger ID/OD: HSA 2.75-
Operator: Mike/Adam Datum: NAVD88 Sampler: Standard Split
Logged By: B. Wilder Rig Type: Diedrich D-50 Hammer Wt./Fall: 140#/30"
Date Start/Finish: 3/11/2015-3/12/2015 Drilling Method: Cased Wash Boring Core Barrel: NQ-2"
Boring Location: 2+38, 6.6 ft Rt. Casing ID/OD: NW & HW Water Level*: None Observed
Hammer Efficiency Factor: 0.879 Hammer Type: Automatic Hydraulic Rope & Cathead Definitions: R = Rock Core Sample Su = Insitu Field Vane Shear Strength (psf) Su(lab) = Lab Vane Shear Strength (psf)D = Split Spoon Sample SSA = Solid Stem Auger Tv = Pocket Torvane Shear Strength (psf) WC = water content, percentMD = Unsuccessful Split Spoon Sample attempt HSA = Hollow Stem Auger qp = Unconfined Compressive Strength (ksf) LL = Liquid LimitU = Thin Wall Tube Sample RC = Roller Cone N-uncorrected = Raw field SPT N-value PL = Plastic LimitMU = Unsuccessful Thin Wall Tube Sample attempt WOH = weight of 140lb. hammer Hammer Efficiency Factor = Annual Calibration Value PI = Plasticity IndexV = Insitu Vane Shear Test WOR = weight of rods N60 = SPT N-uncorrected corrected for hammer efficiency G = Grain Size AnalysisMV = Unsuccessful Insitu Vane Shear Test attempt WO1P = Weight of one person N60 = (Hammer Efficiency Factor/60%)*N-uncorrected C = Consolidation Test
Remarks:
1. GZA reviewed and updated preliminary logs prepared by Maine DOT based on lab test results and GZA interpretations.2. Auto Hammer #283
Stratification lines represent approximate boundaries between soil types; transitions may be gradual.* Water level readings have been made at times and under conditions stated. Groundwater fluctuations may occur due to conditions other than those
present at the time measurements were made. Boring No.: BB-NMR-102
Dept
h (f
t.)
Sam
ple
No.
Sample Information
Pen
./Rec.
(in
.)
Sam
ple
Dept
h(f
t.)
Blo
ws
(/6
in.)
She
ar
Str
ength
(psf
)or
RQ
D (
%)
N-u
nco
rrec
ted
N60
Cas
ing
Blo
ws
Ele
vatio
n(f
t.)
Gra
phi
c Log
Visual Description and Remarks
LaboratoryTesting Results/
AASHTO and
Unified Class.
Page 1 of 4

25
30
35
40
45
50
6D
MU
V1
V2
1U
V3
V4
7DV5
V6
2U
V7
V8
24/24
24/5
24/24
24/24
24/24
25.0 - 27.0
30.0 - 32.0
32.6 - 33.0
33.6 - 34.0
35.0 - 37.0
37.6 - 38.0
38.6 - 39.0
40.0 - 42.040.6 - 41.0
41.6 - 42.0
45.0 - 47.0
47.6 - 48.0
48.6 - 49.0
2/2/2/3
Piston Sampler
Su=467/110 psf
Su=522/124 psf
Piston Sampler
Su=494/110 psf
Su=439/82 psf
WOR/WOR/WOR/WOR
Su=494/110 psfSu=439/96 psf
Piston Sampler
Su=618/82 psf
Su=590/96 psf
4
---
6Olive-grey, moist, medium stiff, Silty CLAY, trace finesand.-MARINE CLAY- (CL)Roller Coned ahead to 30.0 ft bgs.
Failed Tube attempt, 5" of tube sample fell out of tube,put sample in cup.Grey, wet, soft to medium stiff, CLAY, some silt, tracefine sand.-MARINE CLAY- (CL)
65x130 mm vane raw torque readings:V1: 17.0/4.0 ft-lbs.V2: 19.0/4.5 ft-lbs.
Roller Coned ahead after vanes taken, from 30.0-75.0 ftbgs.Grey, wet, soft, CLAY, some silt, trace fine sand.-MARINE CLAY- (CL)
65x130 mm vane raw torque readings:V3: 18.0/4.0 ft-lbs.V4: 16.0/3.0 ft-lbs.
Similar to 1U.
65x130 mm vane raw torque readings:V5: 18.0/4.0 ft-lbs.V6: 16.0/3.5 ft-lbs.
Grey, wet, medium stiff, Silty CLAY, trace fine sand.-MARINE CLAY- (CL)
65x130 mm vane raw torque readings:V7: 22.0/3.0 ft-lbs.V8: 21.5/3.5 ft-lbs.
Combined w/5D
G#263393A-6, CL
WC=38.0%LL=39PL=22PI=17
G#263394A-6, CL
WC=37.2%LL=34PL=23PI=11
Maine Department of Transportation Project: New Meadows No. 2 Bridge #2604 carriesOld Brunswick/Bath Road over the New
Boring No.: BB-NMR-102Soil/Rock Exploration Log
Location: Bath-Brunswick, MaineUS CUSTOMARY UNITS PIN: 20478.00
Driller: Northern Test Boring Elevation (ft.) 10.8 Auger ID/OD: HSA 2.75-
Operator: Mike/Adam Datum: NAVD88 Sampler: Standard Split
Logged By: B. Wilder Rig Type: Diedrich D-50 Hammer Wt./Fall: 140#/30"
Date Start/Finish: 3/11/2015-3/12/2015 Drilling Method: Cased Wash Boring Core Barrel: NQ-2"
Boring Location: 2+38, 6.6 ft Rt. Casing ID/OD: NW & HW Water Level*: None Observed
Hammer Efficiency Factor: 0.879 Hammer Type: Automatic Hydraulic Rope & Cathead Definitions: R = Rock Core Sample Su = Insitu Field Vane Shear Strength (psf) Su(lab) = Lab Vane Shear Strength (psf)D = Split Spoon Sample SSA = Solid Stem Auger Tv = Pocket Torvane Shear Strength (psf) WC = water content, percentMD = Unsuccessful Split Spoon Sample attempt HSA = Hollow Stem Auger qp = Unconfined Compressive Strength (ksf) LL = Liquid LimitU = Thin Wall Tube Sample RC = Roller Cone N-uncorrected = Raw field SPT N-value PL = Plastic LimitMU = Unsuccessful Thin Wall Tube Sample attempt WOH = weight of 140lb. hammer Hammer Efficiency Factor = Annual Calibration Value PI = Plasticity IndexV = Insitu Vane Shear Test WOR = weight of rods N60 = SPT N-uncorrected corrected for hammer efficiency G = Grain Size AnalysisMV = Unsuccessful Insitu Vane Shear Test attempt WO1P = Weight of one person N60 = (Hammer Efficiency Factor/60%)*N-uncorrected C = Consolidation Test
Remarks:
1. GZA reviewed and updated preliminary logs prepared by Maine DOT based on lab test results and GZA interpretations.2. Auto Hammer #283
Stratification lines represent approximate boundaries between soil types; transitions may be gradual.* Water level readings have been made at times and under conditions stated. Groundwater fluctuations may occur due to conditions other than those
present at the time measurements were made. Boring No.: BB-NMR-102
Dept
h (f
t.)
Sam
ple
No.
Sample Information
Pen
./Rec.
(in
.)
Sam
ple
Depth
(ft.)
Blo
ws
(/6
in.)
She
ar
Str
ength
(psf
)or
RQ
D (
%)
N-u
nco
rrec
ted
N60
Cas
ing
Blo
ws
Ele
vatio
n(f
t.)
Gra
phi
c Log
Visual Description and Remarks
LaboratoryTesting Results/
AASHTO and
Unified Class.
Page 2 of 4
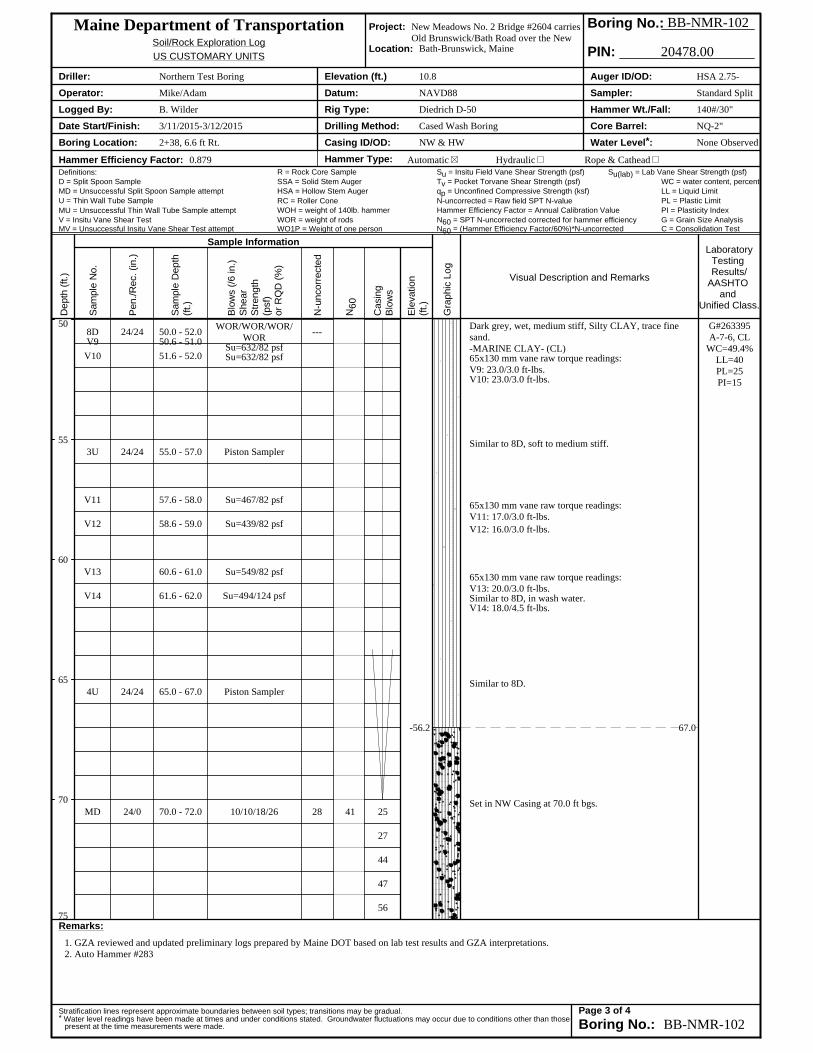
50
55
60
65
70
75
8DV9
V10
3U
V11
V12
V13
V14
4U
MD
24/24
24/24
24/24
24/0
50.0 - 52.050.6 - 51.0
51.6 - 52.0
55.0 - 57.0
57.6 - 58.0
58.6 - 59.0
60.6 - 61.0
61.6 - 62.0
65.0 - 67.0
70.0 - 72.0
WOR/WOR/WOR/WOR
Su=632/82 psfSu=632/82 psf
Piston Sampler
Su=467/82 psf
Su=439/82 psf
Su=549/82 psf
Su=494/124 psf
Piston Sampler
10/10/18/26
---
28 41 25
27
44
47
56
-56.2
Dark grey, wet, medium stiff, Silty CLAY, trace finesand.-MARINE CLAY- (CL)65x130 mm vane raw torque readings:V9: 23.0/3.0 ft-lbs.V10: 23.0/3.0 ft-lbs.
Similar to 8D, soft to medium stiff.
65x130 mm vane raw torque readings:V11: 17.0/3.0 ft-lbs.V12: 16.0/3.0 ft-lbs.
65x130 mm vane raw torque readings:V13: 20.0/3.0 ft-lbs.Similar to 8D, in wash water.V14: 18.0/4.5 ft-lbs.
Similar to 8D.
67.0
Set in NW Casing at 70.0 ft bgs.
G#263395A-7-6, CL
WC=49.4%LL=40PL=25PI=15
Maine Department of Transportation Project: New Meadows No. 2 Bridge #2604 carriesOld Brunswick/Bath Road over the New
Boring No.: BB-NMR-102Soil/Rock Exploration Log
Location: Bath-Brunswick, MaineUS CUSTOMARY UNITS PIN: 20478.00
Driller: Northern Test Boring Elevation (ft.) 10.8 Auger ID/OD: HSA 2.75-
Operator: Mike/Adam Datum: NAVD88 Sampler: Standard Split
Logged By: B. Wilder Rig Type: Diedrich D-50 Hammer Wt./Fall: 140#/30"
Date Start/Finish: 3/11/2015-3/12/2015 Drilling Method: Cased Wash Boring Core Barrel: NQ-2"
Boring Location: 2+38, 6.6 ft Rt. Casing ID/OD: NW & HW Water Level*: None Observed
Hammer Efficiency Factor: 0.879 Hammer Type: Automatic Hydraulic Rope & Cathead Definitions: R = Rock Core Sample Su = Insitu Field Vane Shear Strength (psf) Su(lab) = Lab Vane Shear Strength (psf)D = Split Spoon Sample SSA = Solid Stem Auger Tv = Pocket Torvane Shear Strength (psf) WC = water content, percentMD = Unsuccessful Split Spoon Sample attempt HSA = Hollow Stem Auger qp = Unconfined Compressive Strength (ksf) LL = Liquid LimitU = Thin Wall Tube Sample RC = Roller Cone N-uncorrected = Raw field SPT N-value PL = Plastic LimitMU = Unsuccessful Thin Wall Tube Sample attempt WOH = weight of 140lb. hammer Hammer Efficiency Factor = Annual Calibration Value PI = Plasticity IndexV = Insitu Vane Shear Test WOR = weight of rods N60 = SPT N-uncorrected corrected for hammer efficiency G = Grain Size AnalysisMV = Unsuccessful Insitu Vane Shear Test attempt WO1P = Weight of one person N60 = (Hammer Efficiency Factor/60%)*N-uncorrected C = Consolidation Test
Remarks:
1. GZA reviewed and updated preliminary logs prepared by Maine DOT based on lab test results and GZA interpretations.2. Auto Hammer #283
Stratification lines represent approximate boundaries between soil types; transitions may be gradual.* Water level readings have been made at times and under conditions stated. Groundwater fluctuations may occur due to conditions other than those
present at the time measurements were made. Boring No.: BB-NMR-102
Dept
h (f
t.)
Sam
ple
No.
Sample Information
Pen
./Rec.
(in
.)
Sam
ple
Depth
(ft.)
Blo
ws
(/6
in.)
She
ar
Str
ength
(psf
)or
RQ
D (
%)
N-u
nco
rrec
ted
N60
Cas
ing
Blo
ws
Ele
vatio
n(f
t.)
Gra
phi
c Log
Visual Description and Remarks
LaboratoryTesting Results/
AASHTO and
Unified Class.
Page 3 of 4

75
80
85
90
95
100
9D
R1
R2
22.8/11
12/9
60/58
75.0 - 76.9
76.9 - 77.9
77.9 - 82.9
34/39/36/50(4.8)
RQD = 0%
RQD = 55%
75 110 71
a100NQ-2 -66.1
-72.1
Grey, wet, very dense, Sandy GRAVEL, little silt, traceclay.-GLACIAL TILL- (GC-GM)a100 blows for 0.9 ft.
76.9Top of Bedrock at Elev. -66.1 ft.R1: Very hard to hard, fresh, fine grained, white,METAVOLCANIC ROCK. Joints are extremely close toclosely spaced, low angle, undulating, rough, fresh todiscolored, open.Rock Mass Quality = Very PoorR1:Core Times (min:sec)76.9-77.9 ft (5:00) 75% RecoveryCore BlockedR2: Very hard to hard, fresh, fine grained, white,METAVOLCANIC ROCK. Primary joints are very closeto moderately spaced, low angle, undulating, rough, freshto discolored, tight to partially open. Secondary joints arevery close to closely spaced, high angle, undulating,rough, fresh to discolored, tight.Rock Mass Quality = FairR2:Core Times (min:sec)77.9-78.9 ft (2:45)78.9-79.9 ft (3:00)79.9-80.9 ft (3:10)80.9-81.9 ft (2:50)81.9-82.9 ft (3:20) 97% Recovery
82.9Bottom of Exploration at 82.90 feet below ground
surface.
G#263396A-1-b, GC-GM
WC=20.0%
Maine Department of Transportation Project: New Meadows No. 2 Bridge #2604 carriesOld Brunswick/Bath Road over the New
Boring No.: BB-NMR-102Soil/Rock Exploration Log
Location: Bath-Brunswick, MaineUS CUSTOMARY UNITS PIN: 20478.00
Driller: Northern Test Boring Elevation (ft.) 10.8 Auger ID/OD: HSA 2.75-
Operator: Mike/Adam Datum: NAVD88 Sampler: Standard Split
Logged By: B. Wilder Rig Type: Diedrich D-50 Hammer Wt./Fall: 140#/30"
Date Start/Finish: 3/11/2015-3/12/2015 Drilling Method: Cased Wash Boring Core Barrel: NQ-2"
Boring Location: 2+38, 6.6 ft Rt. Casing ID/OD: NW & HW Water Level*: None Observed
Hammer Efficiency Factor: 0.879 Hammer Type: Automatic Hydraulic Rope & Cathead Definitions: R = Rock Core Sample Su = Insitu Field Vane Shear Strength (psf) Su(lab) = Lab Vane Shear Strength (psf)D = Split Spoon Sample SSA = Solid Stem Auger Tv = Pocket Torvane Shear Strength (psf) WC = water content, percentMD = Unsuccessful Split Spoon Sample attempt HSA = Hollow Stem Auger qp = Unconfined Compressive Strength (ksf) LL = Liquid LimitU = Thin Wall Tube Sample RC = Roller Cone N-uncorrected = Raw field SPT N-value PL = Plastic LimitMU = Unsuccessful Thin Wall Tube Sample attempt WOH = weight of 140lb. hammer Hammer Efficiency Factor = Annual Calibration Value PI = Plasticity IndexV = Insitu Vane Shear Test WOR = weight of rods N60 = SPT N-uncorrected corrected for hammer efficiency G = Grain Size AnalysisMV = Unsuccessful Insitu Vane Shear Test attempt WO1P = Weight of one person N60 = (Hammer Efficiency Factor/60%)*N-uncorrected C = Consolidation Test
Remarks:
1. GZA reviewed and updated preliminary logs prepared by Maine DOT based on lab test results and GZA interpretations.2. Auto Hammer #283
Stratification lines represent approximate boundaries between soil types; transitions may be gradual.* Water level readings have been made at times and under conditions stated. Groundwater fluctuations may occur due to conditions other than those
present at the time measurements were made. Boring No.: BB-NMR-102
Dept
h (f
t.)
Sam
ple
No.
Sample Information
Pen
./Rec.
(in
.)
Sam
ple
Depth
(ft.)
Blo
ws
(/6
in.)
She
ar
Str
ength
(psf
)or
RQ
D (
%)
N-u
nco
rrec
ted
N60
Cas
ing
Blo
ws
Ele
vatio
n(f
t.)
Gra
phi
c Log
Visual Description and Remarks
LaboratoryTesting Results/
AASHTO and
Unified Class.
Page 4 of 4

02/25/2016
NEW MEADOWS BRIDGE NO.2 REPLACEMENT 09.0025900.00
APPENDIX C
LABORATORY TESTING RESULTS

Station Offset Depth Reference G.S.D.C. W.C. L.L. P.I.
(Feet) (Feet) (Feet) Number Sheet % Unified AASHTO Frost
1+60.1 6.1 Lt. 2.5-4.0 263381 1 3.7 SW-SM A-1-b 01+60.1 6.1 Lt. 5.0-7.0 263382 1 6.9 SM A-2-4 II1+60.1 6.1 Lt. 10.0-12.0 263383 1 46.1 CL A-4 IV1+60.1 6.1 Lt. 15.0-17.0 263384 1 47.0 -N P- CL A-4 IV1+60.1 6.1 Lt. 20.5-22.5 263385 2 67.1 CL A-4 IV1+60.1 6.1 Lt. 25.0-27.0 263386 2 32.8 32 13 CL A-6 III1+60.1 6.1 Lt. 30.0-32.0 263387 2 41.8 38 16 CL A-6 III1+60.1 6.1 Lt. 40.0-42.0 264776 3 34.4 CL A-6 III1+60.1 6.1 Lt. 46.6-48.6 264777 3 40.0 39 15 CL A-6 III1+60.1 6.1 Lt. 50.0-52.0 with 8D ---1+60.1 6.1 Lt. 60.0-62.0 264778 3 37.7 CL A-6 III1+60.1 6.1 Lt. 80.0-82.0 264779 3 12.5 SC-SM A-2-4 II1+60.1 6.1 Lt. 85.0-87.0 264780 4 15.3 SM A-2-4 II1+60.1 6.1 Lt. 90.0-92.0 264781 4 10.7 CL-ML A-4 IV1+60.1 6.1 Lt. 100.0-102.0 264782 4 10.1 SM A-1-b II2+38 6.6 Rt. 2.0-2.4 263388 5 2.2 SM A-2-4 II2+38 6.6 Rt. 5.0-7.0 263389 5 8.7 SM A-2-4 II2+38 6.6 Rt. 10.0-12.0 263390 5 29.2 CL A-4 IV2+38 6.6 Rt. 15.0-17.0 263391 5 35.3 SC-SM A-2-4 III2+38 6.6 Rt. 20.0-22.0 263392 5 30.1 36 14 CL A-6 III2+38 6.6 Rt. 25.0-27.0 with 5D ---2+38 6.6 Rt. 30.0-32.0 263393 6 38.0 39 17 CL A-6 III2+38 6.6 Rt. 40.0-42.0 263394 6 37.2 34 11 CL A-6 IV2+38 6.6 Rt. 50.0-52.0 263395 6 49.4 40 15 CL A-7-6 III2+38 6.6 Rt. 75.0-76.9 263396 6 20.0 SC-SM A-1-b II
Classification of these soil samples is in accordance with AASHTO Classification System M-145-40. This classification
is followed by the "Frost Susceptibility Rating" from zero (non-frost susceptible) to Class IV (highly frost susceptible).
The "Frost Susceptibility Rating" is based upon the MaineDOT and Corps of Engineers Classification Systems.
GSDC = Grain Size Distribution Curve as determined by AASHTO T 88-93 (1996) and/or ASTM D 422-63 (Reapproved 1998)
WC = water content as determined by AASHTO T 265-93 and/or ASTM D 2216-98
LL = Liquid limit as determined by AASHTO T 89-96 and/or ASTM D 4318-98
PI = Plasticity Index as determined by AASHTO 90-96 and/or ASTM D4318-98
NP = Non Plastic
For Geotech personnel only "Sheets 3 and 4 are 5 and 6 xls".
BB-NMR-102, MUBB-NMR-102, 7DBB-NMR-102, 8DBB-NMR-102, 9D
BB-NMR-102, 1DBB-NMR-102, 2DBB-NMR-102, 3DBB-NMR-102, 4DBB-NMR-102, 5DBB-NMR-102, 6D
BB-NMR-101, 8D
BB-NMR-101, 10DBB-NMR-101, 13DBB-NMR-101, 14DBB-NMR-101, 15DBB-NMR-101, 16D
BB-NMR-101, 9D
BB-NMR-101, 5D
Identification Number
BB-NMR-101, S1
Work Number: 20478.00
BB-NMR-101, 1D
BB-NMR-101, 7DBB-NMR-101, 6D
Classification
BB-NMR-101, 3DBB-NMR-101, 4D
State of Maine - Department of TransportationLaboratory Testing Summary Sheet
Town(s): Bath-BrunswickBoring & Sample
BB-NMR-101, 2D
1 of 1

3" 2" 1-1/2" 1" 3/4" 1/2" 3/8" 1/4" #4 #8 #10 #16 #20 #40 #60 #100 #200 0.05 0.03 0.010 0.005 0.001
76.2 50.8 38.1 25.4 19.05 12.7 9.53 6.35 4.75 2.36 2.00 1.18 0.85 0.426 0.25 0.15 0.075 0.05 0.03 0.005
GRAVEL SAND SILT
SIEVE ANALYSISUS Standard Sieve Numbers
HYDROMETER ANALYSISGrain Diameter, mm
State of Maine Department of TransportationGRAIN SIZE DISTRIBUTION CURVE
100 10 1 0.1 0.01 0.001Grain Diameter, mm
0
10
20
30
40
50
60
70
80
90
100
Per
cen
t Fin
er b
y W
eigh
t
100
90
80
70
60
50
40
30
20
10
0
Per
cen
t Ret
ain
ed b
y W
eigh
t
CLAY
SHEET NO.
UNIFIED CLASSIFICATION
Gravelly SAND, trace silt.
SILT, some clay, trace sand, trace gravel.
Clayey SILT, trace sand, trace gravel.
SAND, little silt, little gravel.
3.7
6.9
46.1
47.0 NP
BB-NMR-101/S1
BB-NMR-101/1D
BB-NMR-101/2D
BB-NMR-101/3D
2.5-4.0
5.0-7.0
10.0-12.0
15.0-17.0
Depth, ftBoring/Sample No. Description W, % LL PL PI
����
����
����
����
��������
SHEET 1
Bath, Brunswick
020478.00
WHITE, TERRY A 4/27/2015
WIN
Town
Reported by/Date
6.1 LT
6.1 LT
6.1 LT
6.1 LT
Offset, ft1+60.1
1+60.1
1+60.1
1+60.1
Station
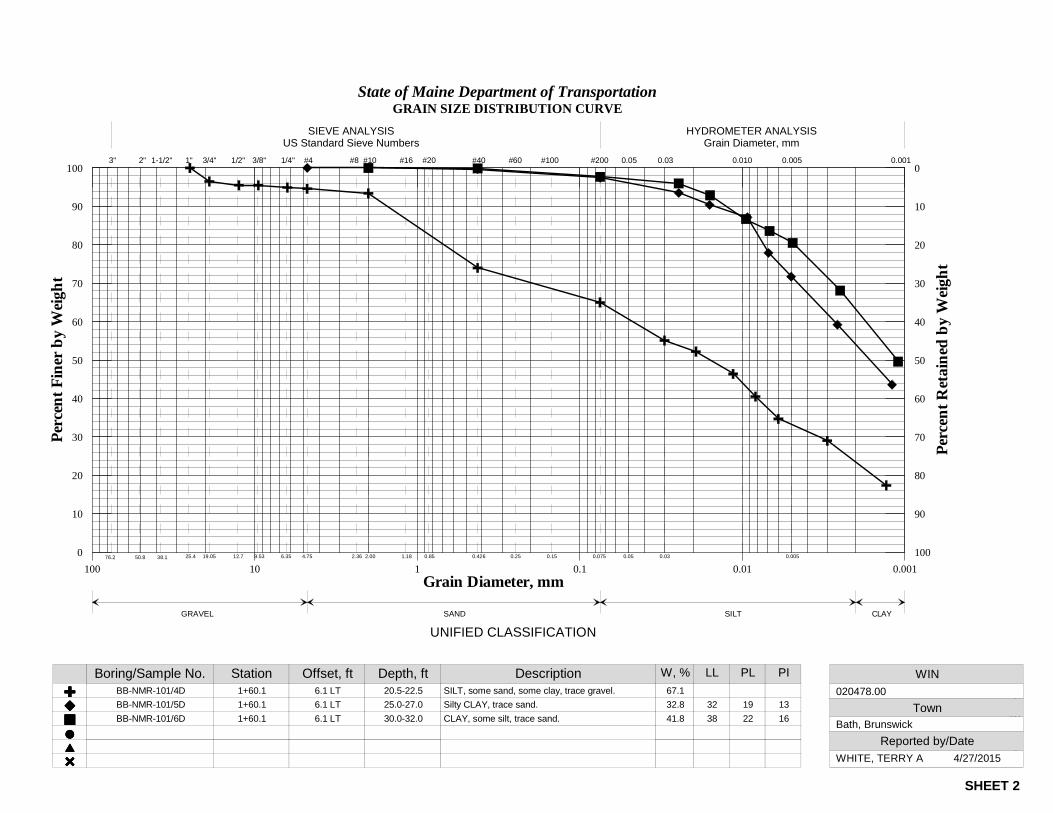
3" 2" 1-1/2" 1" 3/4" 1/2" 3/8" 1/4" #4 #8 #10 #16 #20 #40 #60 #100 #200 0.05 0.03 0.010 0.005 0.001
76.2 50.8 38.1 25.4 19.05 12.7 9.53 6.35 4.75 2.36 2.00 1.18 0.85 0.426 0.25 0.15 0.075 0.05 0.03 0.005
GRAVEL SAND SILT
SIEVE ANALYSISUS Standard Sieve Numbers
HYDROMETER ANALYSISGrain Diameter, mm
State of Maine Department of TransportationGRAIN SIZE DISTRIBUTION CURVE
100 10 1 0.1 0.01 0.001Grain Diameter, mm
0
10
20
30
40
50
60
70
80
90
100
Per
cen
t Fin
er b
y W
eigh
t
100
90
80
70
60
50
40
30
20
10
0
Per
cen
t Ret
ain
ed b
y W
eigh
t
CLAY
SHEET NO.
UNIFIED CLASSIFICATION
SILT, some sand, some clay, trace gravel.
CLAY, some silt, trace sand.
Silty CLAY, trace sand.
67.1
32.8
41.8
32
38
19
22
13
16
BB-NMR-101/4D
BB-NMR-101/5D
BB-NMR-101/6D
20.5-22.5
25.0-27.0
30.0-32.0
Depth, ftBoring/Sample No. Description W, % LL PL PI
����
����
����
����
��������
SHEET 2
Bath, Brunswick
020478.00
WHITE, TERRY A 4/27/2015
WIN
Town
Reported by/Date
6.1 LT
6.1 LT
6.1 LT
Offset, ft1+60.1
1+60.1
1+60.1
Station
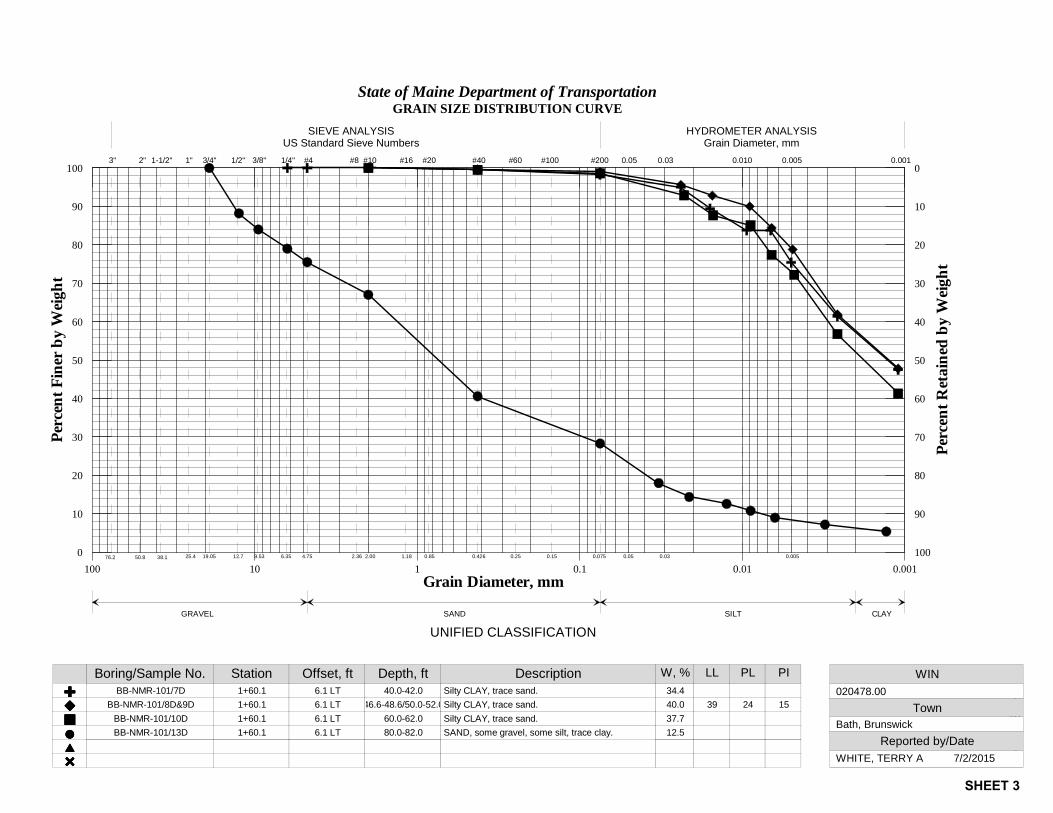
3" 2" 1-1/2" 1" 3/4" 1/2" 3/8" 1/4" #4 #8 #10 #16 #20 #40 #60 #100 #200 0.05 0.03 0.010 0.005 0.001
76.2 50.8 38.1 25.4 19.05 12.7 9.53 6.35 4.75 2.36 2.00 1.18 0.85 0.426 0.25 0.15 0.075 0.05 0.03 0.005
GRAVEL SAND SILT
SIEVE ANALYSISUS Standard Sieve Numbers
HYDROMETER ANALYSISGrain Diameter, mm
State of Maine Department of TransportationGRAIN SIZE DISTRIBUTION CURVE
100 10 1 0.1 0.01 0.001Grain Diameter, mm
0
10
20
30
40
50
60
70
80
90
100
Per
cen
t Fin
er b
y W
eigh
t
100
90
80
70
60
50
40
30
20
10
0
Per
cen
t Ret
ain
ed b
y W
eigh
t
CLAY
SHEET NO.
UNIFIED CLASSIFICATION
Silty CLAY, trace sand.
SAND, some gravel, some silt, trace clay.
Silty CLAY, trace sand.
Silty CLAY, trace sand.
34.4
40.0
37.7
12.5
39 24 15
BB-NMR-101/7D
BB-NMR-101/8D&9D
BB-NMR-101/10D
BB-NMR-101/13D
40.0-42.0
46.6-48.6/50.0-52.0
60.0-62.0
80.0-82.0
Depth, ftBoring/Sample No. Description W, % LL PL PI
����
����
����
����
��������
SHEET 3
Bath, Brunswick
020478.00
WHITE, TERRY A 7/2/2015
WIN
Town
Reported by/Date
6.1 LT
6.1 LT
6.1 LT
6.1 LT
Offset, ft1+60.1
1+60.1
1+60.1
1+60.1
Station

3" 2" 1-1/2" 1" 3/4" 1/2" 3/8" 1/4" #4 #8 #10 #16 #20 #40 #60 #100 #200 0.05 0.03 0.010 0.005 0.001
76.2 50.8 38.1 25.4 19.05 12.7 9.53 6.35 4.75 2.36 2.00 1.18 0.85 0.426 0.25 0.15 0.075 0.05 0.03 0.005
GRAVEL SAND SILT
SIEVE ANALYSISUS Standard Sieve Numbers
HYDROMETER ANALYSISGrain Diameter, mm
State of Maine Department of TransportationGRAIN SIZE DISTRIBUTION CURVE
100 10 1 0.1 0.01 0.001Grain Diameter, mm
0
10
20
30
40
50
60
70
80
90
100
Per
cen
t Fin
er b
y W
eigh
t
100
90
80
70
60
50
40
30
20
10
0
Per
cen
t Ret
ain
ed b
y W
eigh
t
CLAY
SHEET NO.
UNIFIED CLASSIFICATION
SAND, little silt, trace gravel.
SAND, some gravel, little silt.
SILT, some sand, little gravel, trace silt.
15.3
10.7
10.1
BB-NMR-101/14D
BB-NMR-101/15D
BB-NMR-101/16D
85.0-87.0
90.0-92.0
100.0-102.0
Depth, ftBoring/Sample No. Description W, % LL PL PI
����
����
����
����
��������
SHEET 4
Bath, Brunswick
020478.00
WHITE, TERRY A 7/2/2015
WIN
Town
Reported by/Date
6.1 LT
6.1 LT
6.1 LT
Offset, ft1+60.1
1+60.1
1+60.1
Station

3" 2" 1-1/2" 1" 3/4" 1/2" 3/8" 1/4" #4 #8 #10 #16 #20 #40 #60 #100 #200 0.05 0.03 0.010 0.005 0.001
76.2 50.8 38.1 25.4 19.05 12.7 9.53 6.35 4.75 2.36 2.00 1.18 0.85 0.426 0.25 0.15 0.075 0.05 0.03 0.005
GRAVEL SAND SILT
SIEVE ANALYSISUS Standard Sieve Numbers
HYDROMETER ANALYSISGrain Diameter, mm
State of Maine Department of TransportationGRAIN SIZE DISTRIBUTION CURVE
100 10 1 0.1 0.01 0.001Grain Diameter, mm
0
10
20
30
40
50
60
70
80
90
100
Per
cen
t Fin
er b
y W
eigh
t
100
90
80
70
60
50
40
30
20
10
0
Per
cen
t Ret
ain
ed b
y W
eigh
t
CLAY
SHEET NO.
UNIFIED CLASSIFICATION
SAND, some silt, little gravel.
GRAVEL, some sand, little silt, little clay.
SILT, some clay, little sand, trace gravel.
SAND, some silt, trace gravel.
2.2
30.1Silty CLAY, trace sand.
8.7
29.2
35.3
36 22 14
BB-NMR-102/1D
BB-NMR-102/5D&6D
BB-NMR-102/2D
BB-NMR-102/3D
BB-NMR-102/4D
2.0-2.4
20-22/25-27
5.0-7.0
10.0-12.0
15.0-17.0
Depth, ftBoring/Sample No. Description W, % LL PL PI
����
����
����
����
��������
SHEET 5
Bath, Brunswick
020478.00
WHITE, TERRY A 4/27/2015
WIN
Town
Reported by/Date
6.6 RT
6.6 RT
6.6 RT
6.6 RT
6.6 RT
Offset, ft2+38
2.38
2+38
2+38
2+38
Station

3" 2" 1-1/2" 1" 3/4" 1/2" 3/8" 1/4" #4 #8 #10 #16 #20 #40 #60 #100 #200 0.05 0.03 0.010 0.005 0.001
76.2 50.8 38.1 25.4 19.05 12.7 9.53 6.35 4.75 2.36 2.00 1.18 0.85 0.426 0.25 0.15 0.075 0.05 0.03 0.005
GRAVEL SAND SILT
SIEVE ANALYSISUS Standard Sieve Numbers
HYDROMETER ANALYSISGrain Diameter, mm
State of Maine Department of TransportationGRAIN SIZE DISTRIBUTION CURVE
100 10 1 0.1 0.01 0.001Grain Diameter, mm
0
10
20
30
40
50
60
70
80
90
100
Per
cen
t Fin
er b
y W
eigh
t
100
90
80
70
60
50
40
30
20
10
0
Per
cen
t Ret
ain
ed b
y W
eigh
t
CLAY
SHEET NO.
UNIFIED CLASSIFICATION
CLAY, some silt, trace sand.
Sandy GRAVEL, little silt, trace clay.
Silty CLAY, trace sand.
Silty CLAY, trace sand.
38.0
37.2
49.4
20.0
39
34
40
22
23
25
17
11
15
BB-NMR-102/MU
BB-NMR-102/7D
BB-NMR-102/8D
BB-NMR-102/9D
30.0-32.0
40.0-42.0
50.0-52.0
75.0-76.9
Depth, ftBoring/Sample No. Description W, % LL PL PI
����
����
����
����
��������
SHEET 6
Bath, Brunswick
020478.00
WHITE, TERRY A 4/27/2015
WIN
Town
Reported by/Date
6.6 RT
6.6 RT
6.6 RT
6.6 RT
Offset, ft2+38
2+38
2+38
2+38
Station

Reference No.
263381
1 2 D e s e r t R d , F r e e p o r t M a i n e D O T T E S T I N G L A B O R A T O R I E S 2 1 9 H o g a n R d , B a n g o r
Sample Description
GEOTECHNICAL (DISTURBED)
Sampler: BRUCE WILDER
Location: OTHER
Sampled
3/19/2015
Received
3/24/2015
Miscellaneous Tests
Comments:
Station: 1+60.1 Offset, ft: 6.1 LT Dbfg, ft: 2.5-4.0
Boring No./Sample No.
BB-NMR-101/S1Sample Type: GEOTECHNICAL
Depth taken in tube, ft tons/ft² tons/ft²
3 In.
tons/ft² tons/ft²
6 In. Water Content,
%
Description of Material Sampled at the Various Tube Depths
Vane Shear Test on Shelby Tubes (Maine DOT)
Paper Copy: Lab File; Project File; Geotech File
Reported by: BRIAN FOGG Date Reported: 4/7/2015
S A M P L E I N F O R M A T I O N
A U T H O R I Z A T I O N A N D D I S T R I B U T I O N
T E S T R E S U L T S
U. Shear Remold U. Shear Remold
Sieve Analysis (T 27, T 11)
3 in. [75.0 mm]
⅜ in. [9.5 mm] 75.7
¾ in. [19.0 mm] 92.8½ in. [12.5 mm] 81.1
SIEVE SIZEU.S. [SI]
% Passing
¼ in. [6.3 mm] 67.2No. 4 [4.75 mm] 63.9No. 10 [2.00 mm] 52.9
1 in. [25.0 mm] 100.0
No. 20 [0.850 mm] 40.9No. 40 [0.425 mm] 30.2
No. 200 [0.075 mm] 7.5
No. 60 [0.250 mm] 21.2No. 100 [0.150 mm] 13.1
Wash MethodProcedure A
GEOTECHNICAL TEST REPORTCentral Laboratory
Consolidation (T 216)Trimmings, Water Content, %
Initial FinalVoidRatio
%Strain
Water Content, %
Dry Density, lbs/ft³
Void Ratio
Saturation, %
Pmin
Pp
Pmax
Cc/C'c
WIN/Town 020478.00 - BATH, BRUNSWICK
Loss on Ignition (T 267)
Loss, %
H2O, %
Specific Gravity, Corrected to 20°C (T 100)
Liquid Limit @ 25 blows (T 89), %
Plastic Limit (T 90), %
Plasticity Index (T 90), %
Water Content (T 265), % 3.7

Reference No.
263382
1 2 D e s e r t R d , F r e e p o r t M a i n e D O T T E S T I N G L A B O R A T O R I E S 2 1 9 H o g a n R d , B a n g o r
Sample Description
GEOTECHNICAL (DISTURBED)
Sampler: BRUCE WILDER
Location: OTHER
Sampled
3/19/2015
Received
3/24/2015
Miscellaneous Tests
Comments:
Station: 1+60.1 Offset, ft: 6.1 LT Dbfg, ft: 5.0-7.0
Boring No./Sample No.
BB-NMR-101/1DSample Type: GEOTECHNICAL
Depth taken in tube, ft tons/ft² tons/ft²
3 In.
tons/ft² tons/ft²
6 In. Water Content,
%
Description of Material Sampled at the Various Tube Depths
Vane Shear Test on Shelby Tubes (Maine DOT)
Paper Copy: Lab File; Project File; Geotech File
Reported by: BRIAN FOGG Date Reported: 4/7/2015
S A M P L E I N F O R M A T I O N
A U T H O R I Z A T I O N A N D D I S T R I B U T I O N
T E S T R E S U L T S
U. Shear Remold U. Shear Remold
Sieve Analysis (T 27, T 11)
3 in. [75.0 mm]
⅜ in. [9.5 mm] 91.8
¾ in. [19.0 mm] 96.1½ in. [12.5 mm] 93.6
SIEVE SIZEU.S. [SI]
% Passing
¼ in. [6.3 mm] 90.4No. 4 [4.75 mm] 89.4No. 10 [2.00 mm] 85.9
1 in. [25.0 mm] 100.0
No. 20 [0.850 mm] 80.3No. 40 [0.425 mm] 70.4
No. 200 [0.075 mm] 18.7
No. 60 [0.250 mm] 51.4No. 100 [0.150 mm] 32.9
Wash MethodProcedure A
GEOTECHNICAL TEST REPORTCentral Laboratory
Consolidation (T 216)Trimmings, Water Content, %
Initial FinalVoidRatio
%Strain
Water Content, %
Dry Density, lbs/ft³
Void Ratio
Saturation, %
Pmin
Pp
Pmax
Cc/C'c
WIN/Town 020478.00 - BATH, BRUNSWICK
Loss on Ignition (T 267)
Loss, %
H2O, %
Specific Gravity, Corrected to 20°C (T 100)
Liquid Limit @ 25 blows (T 89), %
Plastic Limit (T 90), %
Plasticity Index (T 90), %
Water Content (T 265), % 6.9

Reference No.
263383
1 2 D e s e r t R d , F r e e p o r t M a i n e D O T T E S T I N G L A B O R A T O R I E S 2 1 9 H o g a n R d , B a n g o r
Sample Description
GEOTECHNICAL (DISTURBED)
Sampler: BRUCE WILDER
Location: OTHER
Sampled
3/19/2015
Received
3/24/2015
Miscellaneous Tests
Comments:
Station: 1+60.1 Offset, ft: 6.1 LT Dbfg, ft: 10.0-12.0
Boring No./Sample No.
BB-NMR-101/2DSample Type: GEOTECHNICAL
Depth taken in tube, ft tons/ft² tons/ft²
3 In.
tons/ft² tons/ft²
6 In. Water Content,
%
Description of Material Sampled at the Various Tube Depths
Vane Shear Test on Shelby Tubes (Maine DOT)
Paper Copy: Lab File; Project File; Geotech File
Reported by: BRIAN FOGG Date Reported: 4/9/2015
S A M P L E I N F O R M A T I O N
A U T H O R I Z A T I O N A N D D I S T R I B U T I O N
T E S T R E S U L T S
U. Shear Remold U. Shear Remold
Sieve Analysis (T 88)
3 in. [75.0 mm]
⅜ in. [9.5 mm] 100.0
¾ in. [19.0 mm]½ in. [12.5 mm]
SIEVE SIZEU.S. [SI]
% Passing
¼ in. [6.3 mm] 99.8No. 4 [4.75 mm] 99.7No. 10 [2.00 mm] 99.4
1 in. [25.0 mm]
No. 20 [0.850 mm]No. 40 [0.425 mm] 98.6
No. 200 [0.075 mm] 96.7
No. 60 [0.250 mm]No. 100 [0.150 mm]
Wash Method
GEOTECHNICAL TEST REPORTCentral Laboratory
Consolidation (T 216)Trimmings, Water Content, %
Initial FinalVoidRatio
%Strain
Water Content, %
Dry Density, lbs/ft³
Void Ratio
Saturation, %
Pmin
Pp
Pmax
Cc/C'c
WIN/Town 020478.00 - BATH, BRUNSWICK
Loss on Ignition (T 267)
Loss, %
H2O, %
Specific Gravity, Corrected to 20°C (T 100) 2.67
Liquid Limit @ 25 blows (T 89), %
Plastic Limit (T 90), %
Plasticity Index (T 90), %
Water Content (T 265), % 46.1
[0.0267 mm] 86.2[0.0174 mm] 80.0[0.0109 mm] 61.5[0.0079 mm] 55.4[0.0058 mm] 49.2[0.0029 mm] 43.0[0.0012 mm] 30.8

Reference No.
263384
1 2 D e s e r t R d , F r e e p o r t M a i n e D O T T E S T I N G L A B O R A T O R I E S 2 1 9 H o g a n R d , B a n g o r
Sample Description
GEOTECHNICAL (DISTURBED)
Sampler: BRUCE WILDER
Location: OTHER
Sampled
3/19/2015
Received
3/24/2015
Miscellaneous Tests
Comments:
Station: 1+60.1 Offset, ft: 6.1 LT Dbfg, ft: 15.0-17.0
Boring No./Sample No.
BB-NMR-101/3DSample Type: GEOTECHNICAL
Depth taken in tube, ft tons/ft² tons/ft²
3 In.
tons/ft² tons/ft²
6 In. Water Content,
%
Description of Material Sampled at the Various Tube Depths
Vane Shear Test on Shelby Tubes (Maine DOT)
Paper Copy: Lab File; Project File; Geotech File
Reported by: BRIAN FOGG Date Reported: 4/24/2015
S A M P L E I N F O R M A T I O N
A U T H O R I Z A T I O N A N D D I S T R I B U T I O N
T E S T R E S U L T S
U. Shear Remold U. Shear Remold
Sieve Analysis (T 88)
3 in. [75.0 mm]
⅜ in. [9.5 mm] 99.1
¾ in. [19.0 mm]½ in. [12.5 mm] 100.0
SIEVE SIZEU.S. [SI]
% Passing
¼ in. [6.3 mm] 98.0No. 4 [4.75 mm] 97.6No. 10 [2.00 mm] 96.7
1 in. [25.0 mm]
No. 20 [0.850 mm]No. 40 [0.425 mm] 95.9
No. 200 [0.075 mm] 94.1
No. 60 [0.250 mm]No. 100 [0.150 mm]
Wash Method
GEOTECHNICAL TEST REPORTCentral Laboratory
Consolidation (T 216)Trimmings, Water Content, %
Initial FinalVoidRatio
%Strain
Water Content, %
Dry Density, lbs/ft³
Void Ratio
Saturation, %
Pmin
Pp
Pmax
Cc/C'c
WIN/Town 020478.00 - BATH, BRUNSWICK
Loss on Ignition (T 267)
Loss, %
H2O, %
Specific Gravity, Corrected to 20°C (T 100) 2.70
Liquid Limit @ 25 blows (T 89), %
Plastic Limit (T 90), %
Plasticity Index (T 90), % NP
Water Content (T 265), % 47.0
[0.0258 mm] 68.9[0.0176 mm] 57.0[0.0107 mm] 47.5[0.0078 mm] 42.7[0.0056 mm] 38.0[0.0028 mm] 33.3[0.0012 mm] 23.7

Reference No.
263385
1 2 D e s e r t R d , F r e e p o r t M a i n e D O T T E S T I N G L A B O R A T O R I E S 2 1 9 H o g a n R d , B a n g o r
Sample Description
GEOTECHNICAL (DISTURBED)
Sampler: BRUCE WILDER
Location: OTHER
Sampled
3/20/2015
Received
3/24/2015
Miscellaneous Tests
Comments:
Station: 1+60.1 Offset, ft: 6.1 LT Dbfg, ft: 20.5-22.5
Boring No./Sample No.
BB-NMR-101/4DSample Type: GEOTECHNICAL
Depth taken in tube, ft tons/ft² tons/ft²
3 In.
tons/ft² tons/ft²
6 In. Water Content,
%
Description of Material Sampled at the Various Tube Depths
Vane Shear Test on Shelby Tubes (Maine DOT)
Paper Copy: Lab File; Project File; Geotech File
Reported by: BRIAN FOGG Date Reported: 4/9/2015
S A M P L E I N F O R M A T I O N
A U T H O R I Z A T I O N A N D D I S T R I B U T I O N
T E S T R E S U L T S
U. Shear Remold U. Shear Remold
Sieve Analysis (T 88)
3 in. [75.0 mm]
⅜ in. [9.5 mm] 95.5
¾ in. [19.0 mm] 96.5½ in. [12.5 mm] 95.5
SIEVE SIZEU.S. [SI]
% Passing
¼ in. [6.3 mm] 94.9No. 4 [4.75 mm] 94.6No. 10 [2.00 mm] 93.4
1 in. [25.0 mm] 100.0
No. 20 [0.850 mm]No. 40 [0.425 mm] 74.0
No. 200 [0.075 mm] 65.0
No. 60 [0.250 mm]No. 100 [0.150 mm]
Wash Method
GEOTECHNICAL TEST REPORTCentral Laboratory
Consolidation (T 216)Trimmings, Water Content, %
Initial FinalVoidRatio
%Strain
Water Content, %
Dry Density, lbs/ft³
Void Ratio
Saturation, %
Pmin
Pp
Pmax
Cc/C'c
WIN/Town 020478.00 - BATH, BRUNSWICK
Loss on Ignition (T 267)
Loss, %
H2O, %
Specific Gravity, Corrected to 20°C (T 100) 2.66
Liquid Limit @ 25 blows (T 89), %
Plastic Limit (T 90), %
Plasticity Index (T 90), %
Water Content (T 265), % 67.1
[0.0301 mm] 55.1[0.0193 mm] 52.2[0.0114 mm] 46.4[0.0083 mm] 40.5[0.0060 mm] 34.7[0.0030 mm] 29.0[0.0013 mm] 17.4

Reference No.
263386
1 2 D e s e r t R d , F r e e p o r t M a i n e D O T T E S T I N G L A B O R A T O R I E S 2 1 9 H o g a n R d , B a n g o r
Sample Description
GEOTECHNICAL (DISTURBED)
Sampler: BRUCE WILDER
Location: OTHER
Sampled
3/20/2015
Received
3/24/2015
Miscellaneous Tests
Comments:
Station: 1+60.1 Offset, ft: 6.1 LT Dbfg, ft: 25.0-27.0
Boring No./Sample No.
BB-NMR-101/5DSample Type: GEOTECHNICAL
Depth taken in tube, ft tons/ft² tons/ft²
3 In.
tons/ft² tons/ft²
6 In. Water Content,
%
Description of Material Sampled at the Various Tube Depths
Vane Shear Test on Shelby Tubes (Maine DOT)
Paper Copy: Lab File; Project File; Geotech File
Reported by: BRIAN FOGG Date Reported: 4/27/2015
S A M P L E I N F O R M A T I O N
A U T H O R I Z A T I O N A N D D I S T R I B U T I O N
T E S T R E S U L T S
U. Shear Remold U. Shear Remold
Sieve Analysis (T 88)
3 in. [75.0 mm]
⅜ in. [9.5 mm]
¾ in. [19.0 mm]½ in. [12.5 mm]
SIEVE SIZEU.S. [SI]
% Passing
¼ in. [6.3 mm]No. 4 [4.75 mm] 100.0No. 10 [2.00 mm] 100.0
1 in. [25.0 mm]
No. 20 [0.850 mm]No. 40 [0.425 mm] 99.7
No. 200 [0.075 mm] 97.4
No. 60 [0.250 mm]No. 100 [0.150 mm]
Wash Method
GEOTECHNICAL TEST REPORTCentral Laboratory
Consolidation (T 216)Trimmings, Water Content, %
Initial FinalVoidRatio
%Strain
Water Content, %
Dry Density, lbs/ft³
Void Ratio
Saturation, %
Pmin
Pp
Pmax
Cc/C'c
WIN/Town 020478.00 - BATH, BRUNSWICK
Loss on Ignition (T 267)
Loss, %
H2O, %
Specific Gravity, Corrected to 20°C (T 100) 2.78
Liquid Limit @ 25 blows (T 89), % 32Plastic Limit (T 90), % 19Plasticity Index (T 90), % 13
Water Content (T 265), % 32.8
[0.0246 mm] 93.5[0.0159 mm] 90.4[0.0093 mm] 87.2[0.0069 mm] 77.9[0.0050 mm] 71.7[0.0026 mm] 59.2[0.0012 mm] 43.6

0 10 20 30 40 50 60 70 80 90 100 110Liquid Limit, LL
0
10
20
30
40
50
60
Pla
stic
ity In
dex,
PI
A-Line
U-Line
CH or O
H
CL or O
LMH or OH
ML or OL
CL-ML
PLASTICITY CHART
10 20 30 40 5098765Number of Blows
30.8
31.2
31.6
32
32.4
32.8
33.2
Wat
er C
onte
nt, %
31.8
15
24
35
FLOW CURVE
25
Reference No. 263386
WIN 020478.00
Station 1+60.1
Boring No./Sample No. BB-NMR-101/5D
TOWN Bath, Brunswick
Sampled 3/20/2015
Water Content, % 32.8
Tested By BBURRDepth 25.0-27.0
Plastic Limit (T 90), % 19
Liquid Limit @ 25 blows (T 89), % 32
Plasticity Index (T 90), % 13

Reference No.
263387
1 2 D e s e r t R d , F r e e p o r t M a i n e D O T T E S T I N G L A B O R A T O R I E S 2 1 9 H o g a n R d , B a n g o r
Sample Description
GEOTECHNICAL (DISTURBED)
Sampler: BRUCE WILDER
Location: OTHER
Sampled
3/20/2015
Received
3/24/2015
Miscellaneous Tests
Comments:
Station: 1+60.1 Offset, ft: 6.1 LT Dbfg, ft: 30.0-32.0
Boring No./Sample No.
BB-NMR-101/6DSample Type: GEOTECHNICAL
Depth taken in tube, ft tons/ft² tons/ft²
3 In.
tons/ft² tons/ft²
6 In. Water Content,
%
Description of Material Sampled at the Various Tube Depths
Vane Shear Test on Shelby Tubes (Maine DOT)
Paper Copy: Lab File; Project File; Geotech File
Reported by: BRIAN FOGG Date Reported: 4/27/2015
S A M P L E I N F O R M A T I O N
A U T H O R I Z A T I O N A N D D I S T R I B U T I O N
T E S T R E S U L T S
U. Shear Remold U. Shear Remold
Sieve Analysis (T 88)
3 in. [75.0 mm]
⅜ in. [9.5 mm]
¾ in. [19.0 mm]½ in. [12.5 mm]
SIEVE SIZEU.S. [SI]
% Passing
¼ in. [6.3 mm]No. 4 [4.75 mm]No. 10 [2.00 mm] 100.0
1 in. [25.0 mm]
No. 20 [0.850 mm]No. 40 [0.425 mm] 99.9
No. 200 [0.075 mm] 97.7
No. 60 [0.250 mm]No. 100 [0.150 mm]
Wash Method
GEOTECHNICAL TEST REPORTCentral Laboratory
Consolidation (T 216)Trimmings, Water Content, %
Initial FinalVoidRatio
%Strain
Water Content, %
Dry Density, lbs/ft³
Void Ratio
Saturation, %
Pmin
Pp
Pmax
Cc/C'c
WIN/Town 020478.00 - BATH, BRUNSWICK
Loss on Ignition (T 267)
Loss, %
H2O, %
Specific Gravity, Corrected to 20°C (T 100) 2.77
Liquid Limit @ 25 blows (T 89), % 38Plastic Limit (T 90), % 22Plasticity Index (T 90), % 16
Water Content (T 265), % 41.8
[0.0246 mm] 96.0[0.0158 mm] 92.9[0.0095 mm] 86.7[0.0068 mm] 83.6[0.0049 mm] 80.5[0.0025 mm] 68.1[0.0011 mm] 49.6

0 10 20 30 40 50 60 70 80 90 100 110Liquid Limit, LL
0
10
20
30
40
50
60
Pla
stic
ity In
dex,
PI
A-Line
U-Line
CH or O
H
CL or O
LMH or OH
ML or OL
CL-ML
PLASTICITY CHART
10 20 30 40 5098765Number of Blows
37
38
39
40
Wat
er C
onte
nt, %
38.2
16
26
35
FLOW CURVE
25
Reference No. 263387
WIN 020478.00
Station 1+60.1
Boring No./Sample No. BB-NMR-101/6D
TOWN Bath, Brunswick
Sampled 3/20/2015
Water Content, % 41.8
Tested By BBURRDepth 30.0-32.0
Plastic Limit (T 90), % 22
Liquid Limit @ 25 blows (T 89), % 38
Plasticity Index (T 90), % 16

Reference No.
264776
1 2 D e s e r t R d , F r e e p o r t M a i n e D O T T E S T I N G L A B O R A T O R I E S 2 1 9 H o g a n R d , B a n g o r
Sample Description
GEOTECHNICAL (DISTURBED)
Sampler: BRUCE WILDER
Location:
Sampled
3/24/2015
Received
6/16/2015
Miscellaneous Tests
Comments:
Station: 1+60.1 Offset, ft: 6.1 LT Dbfg, ft: 40.0-42.0
Boring No./Sample No.
BB-NMR-101/7DSample Type: GEOTECHNICAL
Depth taken in tube, ft tons/ft² tons/ft²
3 In.
tons/ft² tons/ft²
6 In. Water Content,
%
Description of Material Sampled at the Various Tube Depths
Vane Shear Test on Shelby Tubes (Maine DOT)
Paper Copy: Lab File; Project File; Geotech File
Reported by: GREGORY LIDSTONE Date Reported: 6/30/2015
S A M P L E I N F O R M A T I O N
A U T H O R I Z A T I O N A N D D I S T R I B U T I O N
T E S T R E S U L T S
U. Shear Remold U. Shear Remold
Sieve Analysis (T 88)
3 in. [75.0 mm]
⅜ in. [9.5 mm]
¾ in. [19.0 mm]½ in. [12.5 mm]
SIEVE SIZEU.S. [SI]
% Passing
¼ in. [6.3 mm] 100.0No. 4 [4.75 mm] 100.0No. 10 [2.00 mm] 100.0
1 in. [25.0 mm]
No. 20 [0.850 mm]No. 40 [0.425 mm] 99.5
No. 200 [0.075 mm] 98.3
No. 60 [0.250 mm]No. 100 [0.150 mm]
Wash Method
GEOTECHNICAL TEST REPORTCentral Laboratory
Consolidation (T 216)Trimmings, Water Content, %
Initial FinalVoidRatio
%Strain
Water Content, %
Dry Density, lbs/ft³
Void Ratio
Saturation, %
Pmin
Pp
Pmax
Cc/C'c
WIN/Town 020478.00 - BATH, BRUNSWICK
Loss on Ignition (T 267)
Loss, %
H2O, %
Specific Gravity, Corrected to 20°C (T 100) 2.74
Liquid Limit @ 25 blows (T 89), %
Plastic Limit (T 90), %
Plasticity Index (T 90), %
Water Content (T 265), % 34.4
[0.0239 mm] 95.0[0.0158 mm] 89.4[0.0094 mm] 83.8[0.0067 mm] 83.8[0.0050 mm] 75.4[0.0026 mm] 61.4[0.0011 mm] 47.5

Reference No.
264777
1 2 D e s e r t R d , F r e e p o r t M a i n e D O T T E S T I N G L A B O R A T O R I E S 2 1 9 H o g a n R d , B a n g o r
Sample Description
GEOTECHNICAL (DISTURBED)
Sampler: BRUCE WILDER
Location:
Sampled
3/24/2015
Received
6/16/2015
Miscellaneous Tests
Comments:
Combine 8D and 9D.
Station: 1+60.1 Offset, ft: 6.1 LT Dbfg, ft: 46.6-48.6/50
Boring No./Sample No.
BB-NMR-101/8D&9DSample Type: GEOTECHNICAL
Depth taken in tube, ft tons/ft² tons/ft²
3 In.
tons/ft² tons/ft²
6 In. Water Content,
%
Description of Material Sampled at the Various Tube Depths
Vane Shear Test on Shelby Tubes (Maine DOT)
Paper Copy: Lab File; Project File; Geotech File
Reported by: GREGORY LIDSTONE Date Reported: 7/1/2015
S A M P L E I N F O R M A T I O N
A U T H O R I Z A T I O N A N D D I S T R I B U T I O N
T E S T R E S U L T S
U. Shear Remold U. Shear Remold
Sieve Analysis (T 88)
3 in. [75.0 mm]
⅜ in. [9.5 mm]
¾ in. [19.0 mm]½ in. [12.5 mm]
SIEVE SIZEU.S. [SI]
% Passing
¼ in. [6.3 mm]No. 4 [4.75 mm]No. 10 [2.00 mm] 100.0
1 in. [25.0 mm]
No. 20 [0.850 mm]No. 40 [0.425 mm] 99.7
No. 200 [0.075 mm] 99.0
No. 60 [0.250 mm]No. 100 [0.150 mm]
Wash Method
GEOTECHNICAL TEST REPORTCentral Laboratory
Consolidation (T 216)Trimmings, Water Content, %
Initial FinalVoidRatio
%Strain
Water Content, %
Dry Density, lbs/ft³
Void Ratio
Saturation, %
Pmin
Pp
Pmax
Cc/C'c
WIN/Town 020478.00 - BATH, BRUNSWICK
Loss on Ignition (T 267)
Loss, %
H2O, %
Specific Gravity, Corrected to 20°C (T 100) 2.75
Liquid Limit @ 25 blows (T 89), % 39Plastic Limit (T 90), % 24Plasticity Index (T 90), % 15
Water Content (T 265), % 40.0
[0.0239 mm] 95.6[0.0153 mm] 92.8[0.0090 mm] 90.0[0.0066 mm] 84.4[0.0049 mm] 78.8[0.0026 mm] 61.9[0.0011 mm] 47.8

0 10 20 30 40 50 60 70 80 90 100 110Liquid Limit, LL
0
10
20
30
40
50
60
Pla
stic
ity In
dex,
PI
A-Line
U-Line
CH or O
H
CL or O
LMH or OH
ML or OL
CL-ML
PLASTICITY CHART
10 20 30 40 5098765Number of Blows
38
39
40
41
42
Wat
er C
onte
nt, %
39.4
16
26
32
FLOW CURVE
25
Reference No. 264777
WIN 020478.00
Station 1+60.1
Boring No./Sample No. BB-NMR-101/8D&9D
TOWN Bath, Brunswick
Sampled 3/24/2015
Water Content, % 40
Tested By BBURRDepth 46.6-48.6/50.0-52.0
Plastic Limit (T 90), % 24
Liquid Limit @ 25 blows (T 89), % 39
Plasticity Index (T 90), % 15

Reference No.
264778
1 2 D e s e r t R d , F r e e p o r t M a i n e D O T T E S T I N G L A B O R A T O R I E S 2 1 9 H o g a n R d , B a n g o r
Sample Description
GEOTECHNICAL (DISTURBED)
Sampler: BRUCE WILDER
Location:
Sampled
3/24/2015
Received
6/16/2015
Miscellaneous Tests
Comments:
Station: 1+60.1 Offset, ft: 6.1 LT Dbfg, ft: 60.0-62.0
Boring No./Sample No.
BB-NMR-101/10DSample Type: GEOTECHNICAL
Depth taken in tube, ft tons/ft² tons/ft²
3 In.
tons/ft² tons/ft²
6 In. Water Content,
%
Description of Material Sampled at the Various Tube Depths
Vane Shear Test on Shelby Tubes (Maine DOT)
Paper Copy: Lab File; Project File; Geotech File
Reported by: GREGORY LIDSTONE Date Reported: 7/1/2015
S A M P L E I N F O R M A T I O N
A U T H O R I Z A T I O N A N D D I S T R I B U T I O N
T E S T R E S U L T S
U. Shear Remold U. Shear Remold
Sieve Analysis (T 88)
3 in. [75.0 mm]
⅜ in. [9.5 mm]
¾ in. [19.0 mm]½ in. [12.5 mm]
SIEVE SIZEU.S. [SI]
% Passing
¼ in. [6.3 mm]No. 4 [4.75 mm]No. 10 [2.00 mm] 100.0
1 in. [25.0 mm]
No. 20 [0.850 mm]No. 40 [0.425 mm] 99.5
No. 200 [0.075 mm] 98.6
No. 60 [0.250 mm]No. 100 [0.150 mm]
Wash Method
GEOTECHNICAL TEST REPORTCentral Laboratory
Consolidation (T 216)Trimmings, Water Content, %
Initial FinalVoidRatio
%Strain
Water Content, %
Dry Density, lbs/ft³
Void Ratio
Saturation, %
Pmin
Pp
Pmax
Cc/C'c
WIN/Town 020478.00 - BATH, BRUNSWICK
Loss on Ignition (T 267)
Loss, %
H2O, %
Specific Gravity, Corrected to 20°C (T 100) 2.77
Liquid Limit @ 25 blows (T 89), %
Plastic Limit (T 90), %
Plasticity Index (T 90), %
Water Content (T 265), % 37.7
[0.0228 mm] 92.9[0.0151 mm] 87.7[0.0089 mm] 85.1[0.0066 mm] 77.4[0.0048 mm] 72.2[0.0026 mm] 56.8[0.0011 mm] 41.3
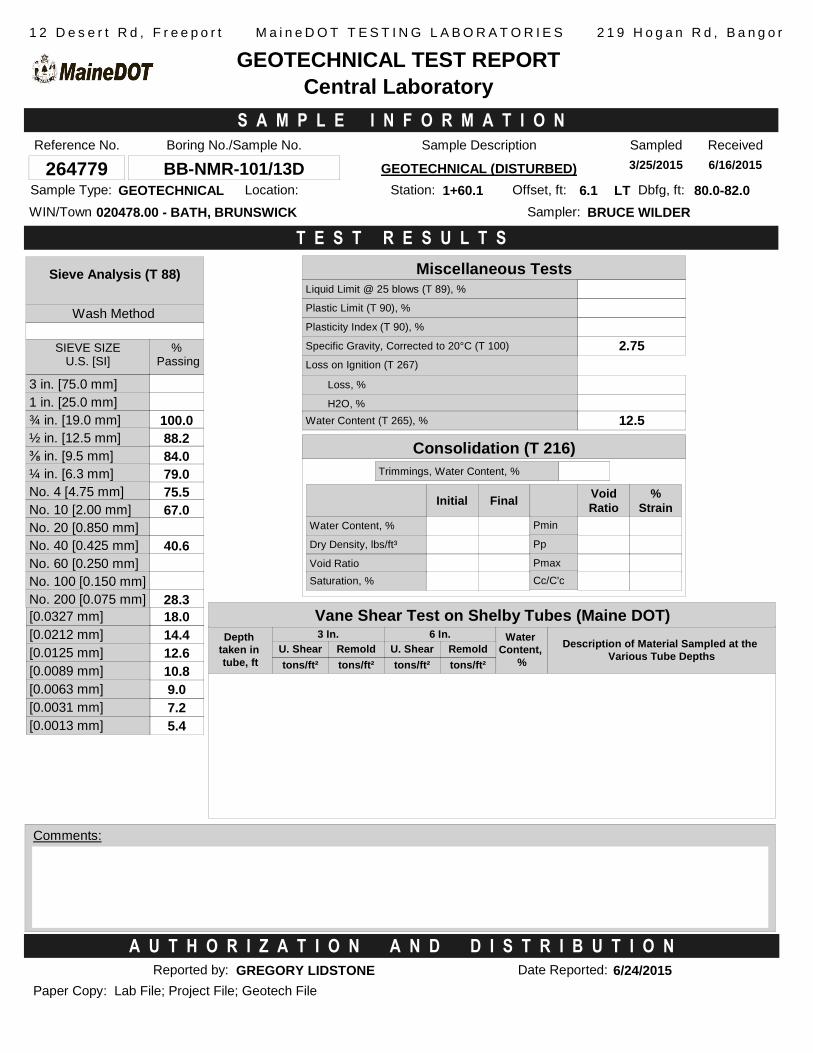
Reference No.
264779
1 2 D e s e r t R d , F r e e p o r t M a i n e D O T T E S T I N G L A B O R A T O R I E S 2 1 9 H o g a n R d , B a n g o r
Sample Description
GEOTECHNICAL (DISTURBED)
Sampler: BRUCE WILDER
Location:
Sampled
3/25/2015
Received
6/16/2015
Miscellaneous Tests
Comments:
Station: 1+60.1 Offset, ft: 6.1 LT Dbfg, ft: 80.0-82.0
Boring No./Sample No.
BB-NMR-101/13DSample Type: GEOTECHNICAL
Depth taken in tube, ft tons/ft² tons/ft²
3 In.
tons/ft² tons/ft²
6 In. Water Content,
%
Description of Material Sampled at the Various Tube Depths
Vane Shear Test on Shelby Tubes (Maine DOT)
Paper Copy: Lab File; Project File; Geotech File
Reported by: GREGORY LIDSTONE Date Reported: 6/24/2015
S A M P L E I N F O R M A T I O N
A U T H O R I Z A T I O N A N D D I S T R I B U T I O N
T E S T R E S U L T S
U. Shear Remold U. Shear Remold
Sieve Analysis (T 88)
3 in. [75.0 mm]
⅜ in. [9.5 mm] 84.0
¾ in. [19.0 mm] 100.0½ in. [12.5 mm] 88.2
SIEVE SIZEU.S. [SI]
% Passing
¼ in. [6.3 mm] 79.0No. 4 [4.75 mm] 75.5No. 10 [2.00 mm] 67.0
1 in. [25.0 mm]
No. 20 [0.850 mm]No. 40 [0.425 mm] 40.6
No. 200 [0.075 mm] 28.3
No. 60 [0.250 mm]No. 100 [0.150 mm]
Wash Method
GEOTECHNICAL TEST REPORTCentral Laboratory
Consolidation (T 216)Trimmings, Water Content, %
Initial FinalVoidRatio
%Strain
Water Content, %
Dry Density, lbs/ft³
Void Ratio
Saturation, %
Pmin
Pp
Pmax
Cc/C'c
WIN/Town 020478.00 - BATH, BRUNSWICK
Loss on Ignition (T 267)
Loss, %
H2O, %
Specific Gravity, Corrected to 20°C (T 100) 2.75
Liquid Limit @ 25 blows (T 89), %
Plastic Limit (T 90), %
Plasticity Index (T 90), %
Water Content (T 265), % 12.5
[0.0327 mm] 18.0[0.0212 mm] 14.4[0.0125 mm] 12.6[0.0089 mm] 10.8[0.0063 mm] 9.0[0.0031 mm] 7.2[0.0013 mm] 5.4

Reference No.
264780
1 2 D e s e r t R d , F r e e p o r t M a i n e D O T T E S T I N G L A B O R A T O R I E S 2 1 9 H o g a n R d , B a n g o r
Sample Description
GEOTECHNICAL (DISTURBED)
Sampler: BRUCE WILDER
Location:
Sampled
3/25/2015
Received
6/16/2015
Miscellaneous Tests
Comments:
Station: 1+60.1 Offset, ft: 6.1 LT Dbfg, ft: 85.0-87.0
Boring No./Sample No.
BB-NMR-101/14DSample Type: GEOTECHNICAL
Depth taken in tube, ft tons/ft² tons/ft²
3 In.
tons/ft² tons/ft²
6 In. Water Content,
%
Description of Material Sampled at the Various Tube Depths
Vane Shear Test on Shelby Tubes (Maine DOT)
Paper Copy: Lab File; Project File; Geotech File
Reported by: GREGORY LIDSTONE Date Reported: 6/23/2015
S A M P L E I N F O R M A T I O N
A U T H O R I Z A T I O N A N D D I S T R I B U T I O N
T E S T R E S U L T S
U. Shear Remold U. Shear Remold
Sieve Analysis (T 27, T 11)
3 in. [75.0 mm]
⅜ in. [9.5 mm] 95.1
¾ in. [19.0 mm] 97.4½ in. [12.5 mm] 95.4
SIEVE SIZEU.S. [SI]
% Passing
¼ in. [6.3 mm] 93.8No. 4 [4.75 mm] 93.5No. 10 [2.00 mm] 91.2
1 in. [25.0 mm] 100.0
No. 20 [0.850 mm] 88.7No. 40 [0.425 mm] 83.0
No. 200 [0.075 mm] 15.2
No. 60 [0.250 mm] 68.1No. 100 [0.150 mm] 37.6
Wash MethodProcedure A
GEOTECHNICAL TEST REPORTCentral Laboratory
Consolidation (T 216)Trimmings, Water Content, %
Initial FinalVoidRatio
%Strain
Water Content, %
Dry Density, lbs/ft³
Void Ratio
Saturation, %
Pmin
Pp
Pmax
Cc/C'c
WIN/Town 020478.00 - BATH, BRUNSWICK
Loss on Ignition (T 267)
Loss, %
H2O, %
Specific Gravity, Corrected to 20°C (T 100)
Liquid Limit @ 25 blows (T 89), %
Plastic Limit (T 90), %
Plasticity Index (T 90), %
Water Content (T 265), % 15.3

Reference No.
264781
1 2 D e s e r t R d , F r e e p o r t M a i n e D O T T E S T I N G L A B O R A T O R I E S 2 1 9 H o g a n R d , B a n g o r
Sample Description
GEOTECHNICAL (DISTURBED)
Sampler: BRUCE WILDER
Location:
Sampled
3/25/2015
Received
6/16/2015
Miscellaneous Tests
Comments:
Station: 1+60.1 Offset, ft: 6.1 LT Dbfg, ft: 90.0-92.0
Boring No./Sample No.
BB-NMR-101/15DSample Type: GEOTECHNICAL
Depth taken in tube, ft tons/ft² tons/ft²
3 In.
tons/ft² tons/ft²
6 In. Water Content,
%
Description of Material Sampled at the Various Tube Depths
Vane Shear Test on Shelby Tubes (Maine DOT)
Paper Copy: Lab File; Project File; Geotech File
Reported by: GREGORY LIDSTONE Date Reported: 6/24/2015
S A M P L E I N F O R M A T I O N
A U T H O R I Z A T I O N A N D D I S T R I B U T I O N
T E S T R E S U L T S
U. Shear Remold U. Shear Remold
Sieve Analysis (T 88)
3 in. [75.0 mm]
⅜ in. [9.5 mm] 90.6
¾ in. [19.0 mm] 100.0½ in. [12.5 mm] 94.9
SIEVE SIZEU.S. [SI]
% Passing
¼ in. [6.3 mm] 86.7No. 4 [4.75 mm] 84.2No. 10 [2.00 mm] 76.2
1 in. [25.0 mm]
No. 20 [0.850 mm]No. 40 [0.425 mm] 69.7
No. 200 [0.075 mm] 62.7
No. 60 [0.250 mm]No. 100 [0.150 mm]
Wash Method
GEOTECHNICAL TEST REPORTCentral Laboratory
Consolidation (T 216)Trimmings, Water Content, %
Initial FinalVoidRatio
%Strain
Water Content, %
Dry Density, lbs/ft³
Void Ratio
Saturation, %
Pmin
Pp
Pmax
Cc/C'c
WIN/Town 020478.00 - BATH, BRUNSWICK
Loss on Ignition (T 267)
Loss, %
H2O, %
Specific Gravity, Corrected to 20°C (T 100) 2.72
Liquid Limit @ 25 blows (T 89), %
Plastic Limit (T 90), %
Plasticity Index (T 90), %
Water Content (T 265), % 10.7
[0.0332 mm] 20.2[0.0212 mm] 18.2[0.0125 mm] 16.2[0.0090 mm] 12.1[0.0064 mm] 10.1[0.0031 mm] 8.1[0.0013 mm] 6.1

Reference No.
264782
1 2 D e s e r t R d , F r e e p o r t M a i n e D O T T E S T I N G L A B O R A T O R I E S 2 1 9 H o g a n R d , B a n g o r
Sample Description
GEOTECHNICAL (DISTURBED)
Sampler: BRUCE WILDER
Location:
Sampled
3/26/2015
Received
6/16/2015
Miscellaneous Tests
Comments:
Station: 1+60.1 Offset, ft: 6.1 LT Dbfg, ft: 100.0-102.0
Boring No./Sample No.
BB-NMR-101/16DSample Type: GEOTECHNICAL
Depth taken in tube, ft tons/ft² tons/ft²
3 In.
tons/ft² tons/ft²
6 In. Water Content,
%
Description of Material Sampled at the Various Tube Depths
Vane Shear Test on Shelby Tubes (Maine DOT)
Paper Copy: Lab File; Project File; Geotech File
Reported by: GREGORY LIDSTONE Date Reported: 6/23/2015
S A M P L E I N F O R M A T I O N
A U T H O R I Z A T I O N A N D D I S T R I B U T I O N
T E S T R E S U L T S
U. Shear Remold U. Shear Remold
Sieve Analysis (T 27, T 11)
3 in. [75.0 mm] 100.0
⅜ in. [9.5 mm] 81.5
¾ in. [19.0 mm] 83.7½ in. [12.5 mm] 82.6
SIEVE SIZEU.S. [SI]
% Passing
¼ in. [6.3 mm] 76.5No. 4 [4.75 mm] 72.8No. 10 [2.00 mm] 59.0
1 in. [25.0 mm] 93.4
No. 20 [0.850 mm] 47.8No. 40 [0.425 mm] 40.2
No. 200 [0.075 mm] 19.1
No. 60 [0.250 mm] 34.5No. 100 [0.150 mm] 27.3
Wash MethodProcedure A
GEOTECHNICAL TEST REPORTCentral Laboratory
Consolidation (T 216)Trimmings, Water Content, %
Initial FinalVoidRatio
%Strain
Water Content, %
Dry Density, lbs/ft³
Void Ratio
Saturation, %
Pmin
Pp
Pmax
Cc/C'c
WIN/Town 020478.00 - BATH, BRUNSWICK
Loss on Ignition (T 267)
Loss, %
H2O, %
Specific Gravity, Corrected to 20°C (T 100)
Liquid Limit @ 25 blows (T 89), %
Plastic Limit (T 90), %
Plasticity Index (T 90), %
Water Content (T 265), % 10.1

Reference No.
263388
1 2 D e s e r t R d , F r e e p o r t M a i n e D O T T E S T I N G L A B O R A T O R I E S 2 1 9 H o g a n R d , B a n g o r
Sample Description
GEOTECHNICAL (DISTURBED)
Sampler: BRUCE WILDER
Location: OTHER
Sampled
3/11/2015
Received
3/24/2015
Miscellaneous Tests
Comments:
Station: 2+38 Offset, ft: 6.6 RT Dbfg, ft: 2.0-2.4
Boring No./Sample No.
BB-NMR-102/1DSample Type: GEOTECHNICAL
Depth taken in tube, ft tons/ft² tons/ft²
3 In.
tons/ft² tons/ft²
6 In. Water Content,
%
Description of Material Sampled at the Various Tube Depths
Vane Shear Test on Shelby Tubes (Maine DOT)
Paper Copy: Lab File; Project File; Geotech File
Reported by: BRIAN FOGG Date Reported: 4/7/2015
S A M P L E I N F O R M A T I O N
A U T H O R I Z A T I O N A N D D I S T R I B U T I O N
T E S T R E S U L T S
U. Shear Remold U. Shear Remold
Sieve Analysis (T 27, T 11)
3 in. [75.0 mm]
⅜ in. [9.5 mm] 87.1
¾ in. [19.0 mm] 92.3½ in. [12.5 mm] 89.7
SIEVE SIZEU.S. [SI]
% Passing
¼ in. [6.3 mm] 86.3No. 4 [4.75 mm] 85.2No. 10 [2.00 mm] 75.0
1 in. [25.0 mm] 100.0
No. 20 [0.850 mm] 61.9No. 40 [0.425 mm] 50.2
No. 200 [0.075 mm] 24.7
No. 60 [0.250 mm] 42.0No. 100 [0.150 mm] 33.2
Wash MethodProcedure A
GEOTECHNICAL TEST REPORTCentral Laboratory
Consolidation (T 216)Trimmings, Water Content, %
Initial FinalVoidRatio
%Strain
Water Content, %
Dry Density, lbs/ft³
Void Ratio
Saturation, %
Pmin
Pp
Pmax
Cc/C'c
WIN/Town 020478.00 - BATH, BRUNSWICK
Loss on Ignition (T 267)
Loss, %
H2O, %
Specific Gravity, Corrected to 20°C (T 100)
Liquid Limit @ 25 blows (T 89), %
Plastic Limit (T 90), %
Plasticity Index (T 90), %
Water Content (T 265), % 2.2

Reference No.
263389
1 2 D e s e r t R d , F r e e p o r t M a i n e D O T T E S T I N G L A B O R A T O R I E S 2 1 9 H o g a n R d , B a n g o r
Sample Description
GEOTECHNICAL (DISTURBED)
Sampler: BRUCE WILDER
Location: OTHER
Sampled
3/11/2015
Received
3/24/2015
Miscellaneous Tests
Comments:
Station: 2+38 Offset, ft: 6.6 RT Dbfg, ft: 5.0-7.0
Boring No./Sample No.
BB-NMR-102/2DSample Type: GEOTECHNICAL
Depth taken in tube, ft tons/ft² tons/ft²
3 In.
tons/ft² tons/ft²
6 In. Water Content,
%
Description of Material Sampled at the Various Tube Depths
Vane Shear Test on Shelby Tubes (Maine DOT)
Paper Copy: Lab File; Project File; Geotech File
Reported by: BRIAN FOGG Date Reported: 4/7/2015
S A M P L E I N F O R M A T I O N
A U T H O R I Z A T I O N A N D D I S T R I B U T I O N
T E S T R E S U L T S
U. Shear Remold U. Shear Remold
Sieve Analysis (T 27, T 11)
3 in. [75.0 mm]
⅜ in. [9.5 mm] 94.7
¾ in. [19.0 mm] 97.2½ in. [12.5 mm] 94.7
SIEVE SIZEU.S. [SI]
% Passing
¼ in. [6.3 mm] 92.9No. 4 [4.75 mm] 91.3No. 10 [2.00 mm] 85.6
1 in. [25.0 mm] 100.0
No. 20 [0.850 mm] 77.9No. 40 [0.425 mm] 62.4
No. 200 [0.075 mm] 25.1
No. 60 [0.250 mm] 44.4No. 100 [0.150 mm] 33.5
Wash MethodProcedure A
GEOTECHNICAL TEST REPORTCentral Laboratory
Consolidation (T 216)Trimmings, Water Content, %
Initial FinalVoidRatio
%Strain
Water Content, %
Dry Density, lbs/ft³
Void Ratio
Saturation, %
Pmin
Pp
Pmax
Cc/C'c
WIN/Town 020478.00 - BATH, BRUNSWICK
Loss on Ignition (T 267)
Loss, %
H2O, %
Specific Gravity, Corrected to 20°C (T 100)
Liquid Limit @ 25 blows (T 89), %
Plastic Limit (T 90), %
Plasticity Index (T 90), %
Water Content (T 265), % 8.7

Reference No.
263390
1 2 D e s e r t R d , F r e e p o r t M a i n e D O T T E S T I N G L A B O R A T O R I E S 2 1 9 H o g a n R d , B a n g o r
Sample Description
GEOTECHNICAL (DISTURBED)
Sampler: BRUCE WILDER
Location: OTHER
Sampled
3/11/2015
Received
3/24/2015
Miscellaneous Tests
Comments:
Station: 2+38 Offset, ft: 6.6 RT Dbfg, ft: 10.0-12.0
Boring No./Sample No.
BB-NMR-102/3DSample Type: GEOTECHNICAL
Depth taken in tube, ft tons/ft² tons/ft²
3 In.
tons/ft² tons/ft²
6 In. Water Content,
%
Description of Material Sampled at the Various Tube Depths
Vane Shear Test on Shelby Tubes (Maine DOT)
Paper Copy: Lab File; Project File; Geotech File
Reported by: BRIAN FOGG Date Reported: 4/7/2015
S A M P L E I N F O R M A T I O N
A U T H O R I Z A T I O N A N D D I S T R I B U T I O N
T E S T R E S U L T S
U. Shear Remold U. Shear Remold
Sieve Analysis (T 88)
3 in. [75.0 mm]
⅜ in. [9.5 mm] 98.4
¾ in. [19.0 mm] 100.0½ in. [12.5 mm] 98.9
SIEVE SIZEU.S. [SI]
% Passing
¼ in. [6.3 mm] 97.2No. 4 [4.75 mm] 97.0No. 10 [2.00 mm] 94.7
1 in. [25.0 mm]
No. 20 [0.850 mm]No. 40 [0.425 mm] 90.6
No. 200 [0.075 mm] 79.5
No. 60 [0.250 mm]No. 100 [0.150 mm]
Wash Method
GEOTECHNICAL TEST REPORTCentral Laboratory
Consolidation (T 216)Trimmings, Water Content, %
Initial FinalVoidRatio
%Strain
Water Content, %
Dry Density, lbs/ft³
Void Ratio
Saturation, %
Pmin
Pp
Pmax
Cc/C'c
WIN/Town 020478.00 - BATH, BRUNSWICK
Loss on Ignition (T 267)
Loss, %
H2O, %
Specific Gravity, Corrected to 20°C (T 100) 2.72
Liquid Limit @ 25 blows (T 89), %
Plastic Limit (T 90), %
Plasticity Index (T 90), %
Water Content (T 265), % 29.2
[0.0281 mm] 69.8[0.0183 mm] 64.0[0.0109 mm] 58.2[0.0079 mm] 52.4[0.0056 mm] 49.4[0.0029 mm] 37.8[0.0013 mm] 23.3

Reference No.
263391
1 2 D e s e r t R d , F r e e p o r t M a i n e D O T T E S T I N G L A B O R A T O R I E S 2 1 9 H o g a n R d , B a n g o r
Sample Description
GEOTECHNICAL (DISTURBED)
Sampler: BRUCE WILDER
Location: OTHER
Sampled
3/11/2015
Received
3/24/2015
Miscellaneous Tests
Comments:
Station: 2+38 Offset, ft: 6.6 RT Dbfg, ft: 15.0-17.0
Boring No./Sample No.
BB-NMR-102/4DSample Type: GEOTECHNICAL
Depth taken in tube, ft tons/ft² tons/ft²
3 In.
tons/ft² tons/ft²
6 In. Water Content,
%
Description of Material Sampled at the Various Tube Depths
Vane Shear Test on Shelby Tubes (Maine DOT)
Paper Copy: Lab File; Project File; Geotech File
Reported by: BRIAN FOGG Date Reported: 4/2/2015
S A M P L E I N F O R M A T I O N
A U T H O R I Z A T I O N A N D D I S T R I B U T I O N
T E S T R E S U L T S
U. Shear Remold U. Shear Remold
Sieve Analysis (T 88)
3 in. [75.0 mm] 100.0
⅜ in. [9.5 mm] 59.7
¾ in. [19.0 mm] 69.2½ in. [12.5 mm] 65.3
SIEVE SIZEU.S. [SI]
% Passing
¼ in. [6.3 mm] 57.7No. 4 [4.75 mm] 54.5No. 10 [2.00 mm] 45.4
1 in. [25.0 mm] 69.2
No. 20 [0.850 mm]No. 40 [0.425 mm] 39.0
No. 200 [0.075 mm] 32.0
No. 60 [0.250 mm]No. 100 [0.150 mm]
Wash Method
GEOTECHNICAL TEST REPORTCentral Laboratory
Consolidation (T 216)Trimmings, Water Content, %
Initial FinalVoidRatio
%Strain
Water Content, %
Dry Density, lbs/ft³
Void Ratio
Saturation, %
Pmin
Pp
Pmax
Cc/C'c
WIN/Town 020478.00 - BATH, BRUNSWICK
Loss on Ignition (T 267)
Loss, %
H2O, %
Specific Gravity, Corrected to 20°C (T 100) 2.74
Liquid Limit @ 25 blows (T 89), %
Plastic Limit (T 90), %
Plasticity Index (T 90), %
Water Content (T 265), % 35.3
[0.0292 mm] 27.4[0.0187 mm] 26.0[0.0111 mm] 23.1[0.0079 mm] 21.7[0.0057 mm] 20.2[0.0029 mm] 14.4[0.0013 mm] 11.5

Reference No.
263392
1 2 D e s e r t R d , F r e e p o r t M a i n e D O T T E S T I N G L A B O R A T O R I E S 2 1 9 H o g a n R d , B a n g o r
Sample Description
GEOTECHNICAL (DISTURBED)
Sampler: BRUCE WILDER
Location: OTHER
Sampled
3/11/2015
Received
3/24/2015
Miscellaneous Tests
Comments:
Station: 2.38 Offset, ft: 6.6 RT Dbfg, ft: 20-22/25-27
Boring No./Sample No.
BB-NMR-102/5D&6DSample Type: GEOTECHNICAL
Depth taken in tube, ft tons/ft² tons/ft²
3 In.
tons/ft² tons/ft²
6 In. Water Content,
%
Description of Material Sampled at the Various Tube Depths
Vane Shear Test on Shelby Tubes (Maine DOT)
Paper Copy: Lab File; Project File; Geotech File
Reported by: BRIAN FOGG Date Reported: 4/17/2015
S A M P L E I N F O R M A T I O N
A U T H O R I Z A T I O N A N D D I S T R I B U T I O N
T E S T R E S U L T S
U. Shear Remold U. Shear Remold
Sieve Analysis (T 88)
3 in. [75.0 mm]
⅜ in. [9.5 mm]
¾ in. [19.0 mm]½ in. [12.5 mm]
SIEVE SIZEU.S. [SI]
% Passing
¼ in. [6.3 mm]No. 4 [4.75 mm] 100.0No. 10 [2.00 mm] 100.0
1 in. [25.0 mm]
No. 20 [0.850 mm]No. 40 [0.425 mm] 99.8
No. 200 [0.075 mm] 98.3
No. 60 [0.250 mm]No. 100 [0.150 mm]
Wash Method
GEOTECHNICAL TEST REPORTCentral Laboratory
Consolidation (T 216)Trimmings, Water Content, %
Initial FinalVoidRatio
%Strain
Water Content, %
Dry Density, lbs/ft³
Void Ratio
Saturation, %
Pmin
Pp
Pmax
Cc/C'c
WIN/Town 020478.00 - BATH, BRUNSWICK
Loss on Ignition (T 267)
Loss, %
H2O, %
Specific Gravity, Corrected to 20°C (T 100) 2.79
Liquid Limit @ 25 blows (T 89), % 36Plastic Limit (T 90), % 22Plasticity Index (T 90), % 14
Water Content (T 265), % 30.1
[0.0243 mm] 94.8[0.0156 mm] 91.7[0.0094 mm] 82.6[0.0070 mm] 73.4[0.0051 mm] 67.3[0.0026 mm] 58.1[0.0012 mm] 42.8

0 10 20 30 40 50 60 70 80 90 100 110Liquid Limit, LL
0
10
20
30
40
50
60
Pla
stic
ity In
dex,
PI
A-Line
U-Line
CH or O
H
CL or O
LMH or OH
ML or OL
CL-ML
PLASTICITY CHART
10 20 30 40 5098765Number of Blows
35
36
37
38
Wat
er C
onte
nt, %
36.2
16
26
34
FLOW CURVE
25
Reference No. 263392
WIN 020478.00
Station 2.38
Boring No./Sample No. BB-NMR-102/5D&6D
TOWN Bath, Brunswick
Sampled 3/11/2015
Water Content, % 30.1
Tested By BBURRDepth 20-22/25-27
Plastic Limit (T 90), % 22
Liquid Limit @ 25 blows (T 89), % 36
Plasticity Index (T 90), % 14

Reference No.
263394
1 2 D e s e r t R d , F r e e p o r t M a i n e D O T T E S T I N G L A B O R A T O R I E S 2 1 9 H o g a n R d , B a n g o r
Sample Description
GEOTECHNICAL (DISTURBED)
Sampler: BRUCE WILDER
Location: OTHER
Sampled
3/11/2015
Received
3/24/2015
Miscellaneous Tests
Comments:
Station: 2+38 Offset, ft: 6.6 RT Dbfg, ft: 40.0-42.0
Boring No./Sample No.
BB-NMR-102/7DSample Type: GEOTECHNICAL
Depth taken in tube, ft tons/ft² tons/ft²
3 In.
tons/ft² tons/ft²
6 In. Water Content,
%
Description of Material Sampled at the Various Tube Depths
Vane Shear Test on Shelby Tubes (Maine DOT)
Paper Copy: Lab File; Project File; Geotech File
Reported by: BRIAN FOGG Date Reported: 4/17/2015
S A M P L E I N F O R M A T I O N
A U T H O R I Z A T I O N A N D D I S T R I B U T I O N
T E S T R E S U L T S
U. Shear Remold U. Shear Remold
Sieve Analysis (T 88)
3 in. [75.0 mm]
⅜ in. [9.5 mm]
¾ in. [19.0 mm]½ in. [12.5 mm]
SIEVE SIZEU.S. [SI]
% Passing
¼ in. [6.3 mm]No. 4 [4.75 mm] 100.0No. 10 [2.00 mm] 100.0
1 in. [25.0 mm]
No. 20 [0.850 mm]No. 40 [0.425 mm] 99.9
No. 200 [0.075 mm] 98.8
No. 60 [0.250 mm]No. 100 [0.150 mm]
Wash Method
GEOTECHNICAL TEST REPORTCentral Laboratory
Consolidation (T 216)Trimmings, Water Content, %
Initial FinalVoidRatio
%Strain
Water Content, %
Dry Density, lbs/ft³
Void Ratio
Saturation, %
Pmin
Pp
Pmax
Cc/C'c
WIN/Town 020478.00 - BATH, BRUNSWICK
Loss on Ignition (T 267)
Loss, %
H2O, %
Specific Gravity, Corrected to 20°C (T 100) 2.79
Liquid Limit @ 25 blows (T 89), % 34Plastic Limit (T 90), % 23Plasticity Index (T 90), % 11
Water Content (T 265), % 37.2
[0.0241 mm] 94.8[0.0158 mm] 88.9[0.0094 mm] 82.9[0.0069 mm] 77.0[0.0050 mm] 71.1[0.0026 mm] 59.2[0.0011 mm] 41.5

0 10 20 30 40 50 60 70 80 90 100 110Liquid Limit, LL
0
10
20
30
40
50
60
Pla
stic
ity In
dex,
PI
A-Line
U-Line
CH or O
H
CL or O
LMH or OH
ML or OL
CL-ML
PLASTICITY CHART
10 20 30 40 5098765Number of Blows
32.8
33.2
33.6
34
34.4
34.8
35.2
Wat
er C
onte
nt, %
34.3
20
28
35
FLOW CURVE
25
Reference No. 263394
WIN 020478.00
Station 2+38
Boring No./Sample No. BB-NMR-102/7D
TOWN Bath, Brunswick
Sampled 3/11/2015
Water Content, % 37.2
Tested By BBURRDepth 40.0-42.0
Plastic Limit (T 90), % 23
Liquid Limit @ 25 blows (T 89), % 34
Plasticity Index (T 90), % 11

Reference No.
263395
1 2 D e s e r t R d , F r e e p o r t M a i n e D O T T E S T I N G L A B O R A T O R I E S 2 1 9 H o g a n R d , B a n g o r
Sample Description
GEOTECHNICAL (DISTURBED)
Sampler: BRUCE WILDER
Location: OTHER
Sampled
3/12/2015
Received
3/24/2015
Miscellaneous Tests
Comments:
Station: 2+38 Offset, ft: 6.6 RT Dbfg, ft: 50.0-52.0
Boring No./Sample No.
BB-NMR-102/8DSample Type: GEOTECHNICAL
Depth taken in tube, ft tons/ft² tons/ft²
3 In.
tons/ft² tons/ft²
6 In. Water Content,
%
Description of Material Sampled at the Various Tube Depths
Vane Shear Test on Shelby Tubes (Maine DOT)
Paper Copy: Lab File; Project File; Geotech File
Reported by: BRIAN FOGG Date Reported: 4/17/2015
S A M P L E I N F O R M A T I O N
A U T H O R I Z A T I O N A N D D I S T R I B U T I O N
T E S T R E S U L T S
U. Shear Remold U. Shear Remold
Sieve Analysis (T 88)
3 in. [75.0 mm]
⅜ in. [9.5 mm]
¾ in. [19.0 mm]½ in. [12.5 mm]
SIEVE SIZEU.S. [SI]
% Passing
¼ in. [6.3 mm]No. 4 [4.75 mm] 100.0No. 10 [2.00 mm] 100.0
1 in. [25.0 mm]
No. 20 [0.850 mm]No. 40 [0.425 mm] 99.8
No. 200 [0.075 mm] 98.7
No. 60 [0.250 mm]No. 100 [0.150 mm]
Wash Method
GEOTECHNICAL TEST REPORTCentral Laboratory
Consolidation (T 216)Trimmings, Water Content, %
Initial FinalVoidRatio
%Strain
Water Content, %
Dry Density, lbs/ft³
Void Ratio
Saturation, %
Pmin
Pp
Pmax
Cc/C'c
WIN/Town 020478.00 - BATH, BRUNSWICK
Loss on Ignition (T 267)
Loss, %
H2O, %
Specific Gravity, Corrected to 20°C (T 100) 2.74
Liquid Limit @ 25 blows (T 89), % 40Plastic Limit (T 90), % 25Plasticity Index (T 90), % 15
Water Content (T 265), % 49.4
[0.0250 mm] 92.3[0.0164 mm] 86.2[0.0097 mm] 80.0[0.0071 mm] 73.9[0.0052 mm] 67.7[0.0027 mm] 55.4[0.0012 mm] 43.1

0 10 20 30 40 50 60 70 80 90 100 110Liquid Limit, LL
0
10
20
30
40
50
60
Pla
stic
ity In
dex,
PI
A-Line
U-Line
CH or O
H
CL or O
LMH or OH
ML or OL
CL-ML
PLASTICITY CHART
10 20 30 40 5098765Number of Blows
38.8
39.2
39.6
40
40.4
40.8
41.2
Wat
er C
onte
nt, %
39.7
15.4
23
31
FLOW CURVE
25
Reference No. 263395
WIN 020478.00
Station 2+38
Boring No./Sample No. BB-NMR-102/8D
TOWN Bath, Brunswick
Sampled 3/12/2015
Water Content, % 49.4
Tested By BBURRDepth 50.0-52.0
Plastic Limit (T 90), % 25
Liquid Limit @ 25 blows (T 89), % 40
Plasticity Index (T 90), % 15

Reference No.
263396
1 2 D e s e r t R d , F r e e p o r t M a i n e D O T T E S T I N G L A B O R A T O R I E S 2 1 9 H o g a n R d , B a n g o r
Sample Description
GEOTECHNICAL (DISTURBED)
Sampler: BRUCE WILDER
Location: OTHER
Sampled
3/12/2015
Received
3/24/2015
Miscellaneous Tests
Comments:
Station: 2+38 Offset, ft: 6.6 RT Dbfg, ft: 75.0-76.9
Boring No./Sample No.
BB-NMR-102/9DSample Type: GEOTECHNICAL
Depth taken in tube, ft tons/ft² tons/ft²
3 In.
tons/ft² tons/ft²
6 In. Water Content,
%
Description of Material Sampled at the Various Tube Depths
Vane Shear Test on Shelby Tubes (Maine DOT)
Paper Copy: Lab File; Project File; Geotech File
Reported by: BRIAN FOGG Date Reported: 4/7/2015
S A M P L E I N F O R M A T I O N
A U T H O R I Z A T I O N A N D D I S T R I B U T I O N
T E S T R E S U L T S
U. Shear Remold U. Shear Remold
Sieve Analysis (T 88)
3 in. [75.0 mm] 100.0
⅜ in. [9.5 mm] 63.0
¾ in. [19.0 mm] 84.5½ in. [12.5 mm] 72.0
SIEVE SIZEU.S. [SI]
% Passing
¼ in. [6.3 mm] 57.0No. 4 [4.75 mm] 53.6No. 10 [2.00 mm] 44.0
1 in. [25.0 mm] 90.2
No. 20 [0.850 mm]No. 40 [0.425 mm] 32.9
No. 200 [0.075 mm] 14.9
No. 60 [0.250 mm]No. 100 [0.150 mm]
Wash Method
GEOTECHNICAL TEST REPORTCentral Laboratory
Consolidation (T 216)Trimmings, Water Content, %
Initial FinalVoidRatio
%Strain
Water Content, %
Dry Density, lbs/ft³
Void Ratio
Saturation, %
Pmin
Pp
Pmax
Cc/C'c
WIN/Town 020478.00 - BATH, BRUNSWICK
Loss on Ignition (T 267)
Loss, %
H2O, %
Specific Gravity, Corrected to 20°C (T 100) 2.77
Liquid Limit @ 25 blows (T 89), %
Plastic Limit (T 90), %
Plasticity Index (T 90), %
Water Content (T 265), % 20.0
[0.0331 mm] 10.9[0.0211 mm] 9.5[0.0123 mm] 8.1[0.0088 mm] 6.8[0.0063 mm] 5.4[0.0031 mm] 4.1[0.0013 mm] 2.7

Reference No.
263393
1 2 D e s e r t R d , F r e e p o r t M a i n e D O T T E S T I N G L A B O R A T O R I E S 2 1 9 H o g a n R d , B a n g o r
Sample Description
GEOTECHNICAL (DISTURBED)
Sampler: BRUCE WILDER
Location: OTHER
Sampled
3/11/2015
Received
3/24/2015
Miscellaneous Tests
Comments:
Station: 2+38 Offset, ft: 6.6 RT Dbfg, ft: 30.0-32.0
Boring No./Sample No.
BB-NMR-102/MUSample Type: GEOTECHNICAL
Depth taken in tube, ft tons/ft² tons/ft²
3 In.
tons/ft² tons/ft²
6 In. Water Content,
%
Description of Material Sampled at the Various Tube Depths
Vane Shear Test on Shelby Tubes (Maine DOT)
Paper Copy: Lab File; Project File; Geotech File
Reported by: BRIAN FOGG Date Reported: 4/17/2015
S A M P L E I N F O R M A T I O N
A U T H O R I Z A T I O N A N D D I S T R I B U T I O N
T E S T R E S U L T S
U. Shear Remold U. Shear Remold
Sieve Analysis (T 88)
3 in. [75.0 mm]
⅜ in. [9.5 mm]
¾ in. [19.0 mm]½ in. [12.5 mm]
SIEVE SIZEU.S. [SI]
% Passing
¼ in. [6.3 mm]No. 4 [4.75 mm] 100.0No. 10 [2.00 mm] 100.0
1 in. [25.0 mm]
No. 20 [0.850 mm]No. 40 [0.425 mm] 100.0
No. 200 [0.075 mm] 98.6
No. 60 [0.250 mm]No. 100 [0.150 mm]
Wash Method
GEOTECHNICAL TEST REPORTCentral Laboratory
Consolidation (T 216)Trimmings, Water Content, %
Initial FinalVoidRatio
%Strain
Water Content, %
Dry Density, lbs/ft³
Void Ratio
Saturation, %
Pmin
Pp
Pmax
Cc/C'c
WIN/Town 020478.00 - BATH, BRUNSWICK
Loss on Ignition (T 267)
Loss, %
H2O, %
Specific Gravity, Corrected to 20°C (T 100) 2.79
Liquid Limit @ 25 blows (T 89), % 39Plastic Limit (T 90), % 22Plasticity Index (T 90), % 17
Water Content (T 265), % 38.0
[0.0238 mm] 96.2[0.0154 mm] 93.2[0.0090 mm] 90.2[0.0066 mm] 84.2[0.0048 mm] 78.2[0.0025 mm] 69.2[0.0011 mm] 54.1

0 10 20 30 40 50 60 70 80 90 100 110Liquid Limit, LL
0
10
20
30
40
50
60
Pla
stic
ity In
dex,
PI
A-Line
U-Line
CH or O
H
CL or O
LMH or OH
ML or OL
CL-ML
PLASTICITY CHART
10 20 30 40 5098765Number of Blows
38
38.4
38.8
39.2
39.6
40
Wat
er C
onte
nt, %
38.8
15
23
34
FLOW CURVE
25
Reference No. 263393
WIN 020478.00
Station 2+38
Boring No./Sample No. BB-NMR-102/MU
TOWN Bath, Brunswick
Sampled 3/11/2015
Water Content, % 38
Tested By BBURRDepth 30.0-32.0
Plastic Limit (T 90), % 22
Liquid Limit @ 25 blows (T 89), % 39
Plasticity Index (T 90), % 17

02/25/2016
NEW MEADOWS BRIDGE NO.2 REPLACEMENT 09.0025900.00
APPENDIX D
GEOTECHNICAL ENGINEERING CALCULATIONS

GZA New Meadows #2 Bridge
09.0025900.00SUBJECT: Downdrag, Abutments 1 and 2
Suite 700 SHEET: 1CALCULATED BY: A. Blaisdell, 2/17/16
207-879-9190 CHECKED BY: C. Snow, 2/17/16
Fax 207-879-0099
OBJECTIVE: Evaluate downdrag on HP14x89 piles supporting abutments.
EVALUATION: The settlement evaluation indicates that up to 5 inches of total settlement may occur adjacent to theupstream corner of Abutment 1 under the stress increase imposed by new fill. Based on the silty natureof the soils, we anticipate that some of the settlement will occur during fill placement, but morethan half inch of settlement is expected to occur after piles are installed for at least the outer piles.Therefore, the piles must be designed to resist downdrag loading above and in the Silt. The stressincrease in underlying medium stiff clay is less than 300 psf; therefore, settlement will be insufficient to cause downdrag. Abutment 1 is considered for loading at both abutments since it has the thicker Silt.
LRFD Section C3.11.8 indicates that downdrag loading should be calculated using either the alpha, lambda,or beta method for clay and an effective stress method for sand. Based on historical Maine practice, thebeta method was used for sand and clay. Beta values were selected for fill and silt equal to 0.35 and 0.23,respectively. It was assumed that the entire thickness of each layer will contribute to downdrag.Downdrag load was calculated using stress increase calculated using Bousinesq theory.
A load factor of 1.0 was applied to the nominal downdrag load in accordance with past practice onMaineDOT projects.
CONCLUSION: The nominal and factored downdrag load is estimated at 25 kips which will be assumed at both abutments. Factored pile loads and required driving resistance are summarized below.
Maximum factored pile load (kips)Factored Downdrag Load (kips) (Load factor=1.0)
Required Factored Driving Resistance (kips)Required Nominal Driving Resistance (kips) (Resistance factor=0.65)
Abutment 1
22925
254391
Portland, Maine 04101
http://www.gza.com
Engineers and
GeoEnvironmental, Inc. Scientists JOB:477 Congress Street
Abut 1 Approach Settlement.xlsx 1 of 1
Downdrag Evaluation, Page 1 of 7

Calculation of Settlement based on the Hough Method (AASHTO LRFD Eq. 10.6.2.4.2‐2 and ‐3) and
Downdrag based on the Beta Method (AASHTO LRFD Eq. 10.7.3.8.6c‐1)
New Meadows No. 2 Bridge Replacement, WIN 20478.00, File No. 25900.00
Calc by ARB 2/17/2016
Review by CLS 2/17/2016
Location: West Approach (Abutment 1), upstream side of abutment ‐ MAX DOWNDRAG
Hough Method Equations
(10.6.2.4.2‐2) (10.6.2.4.2‐3)
Hc ' vo' D to midpt v midpt Assumed N / C'
Hi sublayer Hi total Beta vf'
Maximum
Downdrag
Calculated
Downdrag
Layer (ft) pcf psf ft psf USCS dim. in in psf kips kips
Fill 2 135 607.5 8 607.5 ‐‐ ‐‐ 0 5.0 0.35 1215 4 4
Silt 15 47.6 965 16 450 0‐9 bpf / ML 6 5.0 5.0 0.23 1415 23 21 **
Se (in) 5.0
Downdrag
(kips) 25
Basis of Assumptions and Evaluation
1. 9' high (avg.) triangular embankment widening, all above water (q=1,215 psf) with tall side of triangle at outer pile.
2. The soil layering is based on the soil types, strata thicknesses and average N‐values in borings BB‐NMR‐101
3. Stress increase at the midpoint of each layer was calculated using Bousinesq elastic theory.
4. The new fill will not settle, but it will move down and impose downdrag loading.
5. Total settlement, rather than post‐construction settlement, is used for downdrag load calculation, due to lack of information on rate of settlement.
6. Beta values were selected based on historical Maine practice.
7. C' for Silt selected to approximate larger settlement scenario.
8. Check reasonableness of estimated Silt settlement by calculating corresponding equivalent Coefficient of Consolidation. Should at least be equal to RR.
**Check equivalent consolidation coefficient for Clay/Silt layer:
S=H*C*log((vo'+v)/vo')
C=S/(H*log((vo'+v)/vo') C= 0.167 ‐‐‐For silt, corresponds to a moderate CR value (normally consolidated to lightly overconsolidated), OK.
Settlement Evaluation Downdrag Evaluation
∆ ∆ 1 ′ ∆
′
Downdrag Evaluation, Page 2 of 7

Calculation of Settlement based on the Hough Method (AASHTO LRFD Eq. 10.6.2.4.2‐2 and ‐3)
New Meadows No. 2 Bridge Replacement, WIN 20478.00, File No. 25900.00
Calc by ARB 2/17/2016
Review by CLS 2/17/2016
Location: East Approach (Abutment 2), upstream side of abutment
Hough Method Equations
(10.6.2.4.2‐2) (10.6.2.4.2‐3)
Hc ' vo' D to midpt v midpt Assumed N / C'
Hi sublayer
Layer (ft) pcf psf ft psf USCS dim. in
Fill 2 135 607.5 1 607.5 ‐‐ ‐‐ 0
Silt 5 47.6 727 3.5 560 0‐9 bpf / ML 6 2.5 **
Se (in) 2.5
Basis of Assumptions and Evaluation
1. 9' high (avg.) triangular embankment widening, all above water (q=1,215 psf) with tall side of triangle at outer pile.
2. The soil layering is based on the soil types, strata thicknesses and average N‐values in borings BB‐NMR‐102
3. Stress increase at the midpoint of each layer was calculated using Bousinesq elastic theory.
4. C' for Silt selected to approximate larger settlement scenario.
5. Check reasonableness of estimated Silt settlement by calculating corresponding equivalent Coefficient of Consolidation. Should at least be equal to RR.
**Check equivalent consolidation coefficient for Clay/Silt layer:
S=H*C*log((vo'+v)/vo')
C=S/(H*log((vo'+v)/vo') C= 0.167 ‐‐‐For silt, corresponds to a moderate CR value (normally consolidated to lightly overconsolidated), OK.
Settlement Evaluation
∆ ∆ 1 ′ ∆
′
Downdrag Evaluation, Page 3 of 7

Note:A value was selected below the range (C'=6) tobe more representative of likely consolidationproperties.
Downdrag Evaluation, Page 4 of 7

Downdrag Evaluation, Page 5 of 7

Downdrag Evaluation, Page 6 of 7

Downdrag Evaluation, Page 7 of 7

GZA GeoEnvironmental, Inc 477 Congress Street, Suite 700 Portland, Maine 04101 207‐879‐9190 Fax 207‐879‐0099 http://www.gza.com
Engineers andScientists
JOB: 09.0025900.00 New Meadows No. 2 Bridge SUBJECT: Axial Pile Resistance SHEET: 1 OF 10 CALCULATED BY B. Cardali, 2/14/16 REVIEWED BY A. Blaisdell, 2/15/16
Objec ve
Evaluate the axial geotechnical resistance of the abutment piles for the New Meadows No. 2 BridgeReplacement in Brunswick‐Bath, ME
Methodology
Evaluate proposed pile sec on for governing factored axial compression resistance as follows.
1. Nominal Compressive Resistance
2. Factored Structural Compressive Resistance ‐ Strength Limit State
3. Factored Structural Compressive Resistance ‐ Extreme/Service Limit State
4. Geotechnical Resistance (Sta c Analysis)
5. Geotechnical Resistance (Drivability Analysis)
6. Factored Geotechnical Resistance ‐ Strength Limit State
7. Factored Geotechnical Resistance ‐ Extreme/Service Limit State
References American Associa on of State Highway and Transporta on Officials, AASHTO LRFD Bridge Design Specifica ons:1.Customary U.S. Units, 7th edi on, 2014 with interims. (AASHTO LRFD)
Soil Proper esConsider New Meadows No. 2 Bridge Interpre ve Subsurface Profile (see Figure 2), subsurface layering and proper esrela ve to pile design are presented on the a ached side fric on hand calcula on (Sheets 5‐6).
Structural Proper esHP14x89
Yield Strength of Steel Fy 50ksi
Area of sec on As 26.1in2
Young's Modulus of Steel Es 30000 ksi
Bruns‐Bath14x89 02‐15‐16.xmcd 1 OF 4

GZA GeoEnvironmental, Inc 477 Congress Street, Suite 700 Portland, Maine 04101 207‐879‐9190 Fax 207‐879‐0099 http://www.gza.com
Engineers andScientists
JOB: 09.0025900.00 New Meadows No. 2 Bridge SUBJECT: Axial Pile Resistance SHEET: 2 OF 10 CALCULATED BY B. Cardali, 2/14/16 REVIEWED BY A. Blaisdell, 2/15/16
1. Nominal Structural Compressive Resistance Pn
Nominal Compressive Resistance: Pn 0.66λ
Fy Asλ
AASHTO Eq. 6.9.5.1‐1
Determine normalized column slenderness factor
λK l
rs π
2 Fy
E
rsAASHTO Eq. 6.9.4.1‐3 pg. 6‐74
λ 0 Where the pile is fully embedded, AASHTO 10.7.3.13.1.NOTE: Assump on may not be applicable for integral abutment pile, to be assessed by bridge designer.
Giving: Pn 0.66λ
Fy AsPn 1305 kip
2. Factored Structural Compressive Resistance ‐ Strength Limit State:
Factor for piles in compression under hard drivingcondi ons:
From Ar cle 6.5.4.2 ϕc 0.5
Factored Compressive Resistance for Strength Limit State:
Pr ϕc Pn AASHTO Eq. 6.9.2.1‐1 pg. 6‐71
Pr 653 kip
3. Factored Structural Compressive Resistance ‐ Service/Extreme Limit State:
Resistance Factors for Extreme LimitStates:
From Ar cle 10.5.5.1 and 10.5.5.3 ϕ 1
Factored Compressive Resistance for Service/Extreme Limit State:
Pr ϕ Pn AASHTO Eq. 6.9.2.1‐1 pg. 6‐71
Pr 1305 kip
4. Geotechnical Axial Resistance ‐ Sta c Analysis
AASHTO Ar cle 10.7.3.2.3 states that the nominal resistance of piles driven to point bearing on hard rock is controlled by thestructural limit state.
Used a hand calcula on to es mate side fric on resistance during driving using the Meyerhof method for sand and the alphamethod for silt and clay. The es mated side fric on is 167 kips for Abutment 1 piles and 131 kips for Abutment 2 piles. Hand‐calcfric on es mates are a ached.
Bruns‐Bath14x89 02‐15‐16.xmcd 2 OF 4

GZA GeoEnvironmental, Inc 477 Congress Street, Suite 700 Portland, Maine 04101 207‐879‐9190 Fax 207‐879‐0099 http://www.gza.com
Engineers andScientists
JOB: 09.0025900.00 New Meadows No. 2 Bridge SUBJECT: Axial Pile Resistance SHEET: 3 OF 10 CALCULATED BY B. Cardali, 2/14/16 REVIEWED BY A. Blaisdell, 2/15/16
Required nominal resistance of 391 kips for design of Abutments 1 and 2 based on a maximum factored pile load of 229 kips plusa downdrag load of 25 kips and a 0.65 resistance factor.
The es mated % skin fric on resistance is about 30 to 40% at the required nominal pile resistance.
5. Geotechnical Axial Resistance ‐ Drivability Analysis
σdr 0.9 ϕda fy AASHTO Eq. 10.7.8.1
fy 50ksi yield Strength of steel
ϕda 1.0 AASHTO Table 10.5.5.2.3‐1 Refers to Ar cle 6.5.4.2, Pg. 6‐28
σdr 0.9 ϕda fy σdr 45 ksi Driving Stress in pile cannot exceed 45 ksi
Abutment 1 ‐ Drive pile through 97 feet of soil to rock with toe quake representa ve of moderate driving condi ons (0.1in). Modelpile length as 102 feet (5 foot s ckup at end of drive).
Abutment 2 ‐ Drive pile through 71 feet of soil to rock with toe quake representa ve of moderate driving condi ons (0.1 in).Model pile length as 76 feet (5 foot s ckup at end of drive).
Drive piles with a Delmag D16‐32 open‐ended diesel hammer with a rated energy of 40,200 ‐lb. The proposed hammer is sizedto achieve the required nominal pile resistance; not the maximum driveability resistance for the pile sec on and profile.
Allowable stress in piles during driving is 0.9 fy=45 ksi
GRLWEAP Output is a ached on Sheets 7 through 10.
Abutment 1: Rndr1 391kip Required nominal geotechnical resistance, pile driving stress=27 ksi, final penetra onresistance=11 bpi.
Abutment 2: Rndr2 391kip Required nominal geotechnical resistance, pile driving stress=27 ksi, final penetra onresistance=10 bpi.
6. Factored Drivability Resistance ‐ Strength Limit State:
Strength Limit State Factored Drivability Resistance:
PDA, WEAP and CAPWAP used to establishing drivingcriteria
ϕdyn 0.65 AASHTO Table 10.5.5.2.3‐1
Rndr1_factored Rndr1 ϕdyn Abutment 1:
Rndr1_factored 254 kip
Abutment 2: Rndr2_factored Rndr2 ϕdyn
Rndr2_factored 254 kip
Bruns‐Bath14x89 02‐15‐16.xmcd 3 OF 4

GZA GeoEnvironmental, Inc 477 Congress Street, Suite 700 Portland, Maine 04101 207‐879‐9190 Fax 207‐879‐0099 http://www.gza.com
Engineers andScientists
JOB: 09.0025900.00 New Meadows No. 2 Bridge SUBJECT: Axial Pile Resistance SHEET: 4 OF 10 CALCULATED BY B. Cardali, 2/14/16 REVIEWED BY A. Blaisdell, 2/15/16
7. Factored Drivability Resistance ‐ Service/Extreme Limit States:
Service and Extreme Limit State Factored Drivability Resistance:
Resistance Factors for Extreme Limit States: ϕserv_ext 1
From Ar cle 10.5.5.1 and 10.5.5.3
Rndr1_serv_ext Rndr1 ϕserv_ext
Rndr1_serv_ext 391 kip
Rndr2_serv_ext Rndr2 ϕserv_ext
Rndr2_serv_ext 391 kip
Summary of Results ‐ Axial Loading:
ASTM A572, HP 14x89Structural
Resistance
(kips)
Geotechnical
Static
Resistance
(kips)
Required
Geotechnical
Resistance
(kips)
Governing
Resistance
(kips)
Abutment 1: Strength Limit State, Design 653 n/a 254 254
Abutment 1: Service/Extreme Limit State, Design 1305 n/a 391 391
Abutment 2: Strength Limit State, Design 653 n/a 254 254
Abutment 2: Service/Extreme Limit State, Design 1305 n/a 391 391
Results indicate the selected hammer is suitable to meet the required nominal pile resistance.
Bruns‐Bath14x89 02‐15‐16.xmcd 4 OF 4

Bruns-Bath Axial Pile Resistance Sheet 5 of 10

Bruns-Bath Axial Pile Resistance Sheet 6 of 10

GZA Geo Environmental, Inc. 17-Feb-2016New Meadows No. 2 Bridge #2604 GRLWEAP Version 2010
Maximum Maximum Ultimate Compression Tension Blow Capacity Stress Stress Count Stroke Energy
kips ksi ksi blows/in ft kips-ft
100.0 22.42 4.43 1.1 6.98 15.82 150.0 23.72 1.49 2.0 7.43 15.30 200.0 24.56 1.64 3.0 7.72 15.03 250.0 25.34 1.46 4.3 8.02 15.32 300.0 25.81 1.48 6.1 8.20 15.46 350.0 26.34 1.68 8.5 8.41 15.82 375.0 26.58 1.77 10.1 8.50 15.92 391.0 26.72 1.82 11.3 8.55 16.04 425.0 26.95 1.80 15.0 8.65 16.14 450.0 27.16 1.74 18.3 8.73 16.29
Bruns-Bath Axial Pile Resistance Sheet 7 of 10

17-Feb-2016GZA Geo Environmental, Inc. GRLWEAP Version 2010New Meadows No. 2 Bridge #2604
17-Feb-2016GZA Geo Environmental, Inc. GRLWEAP Version 2010New Meadows No. 2 Bridge #2604
Com
pres
sive
Str
ess
(ksi
)
0
10
20
30
40
50
Ten
sion
Str
ess
(ksi
)
0
10
20
30
40
50
Blow Count (blows/in)
Ulti
mat
e C
apac
ity (
kips
)
0.00 3.33 6.67 10.00 13.33 16.67 20.000
100
200
300
400
500
Blow Count (blows/in)
Str
oke
(ft)
0.00 3.33 6.67 10.00 13.33 16.67 20.000
2
4
6
8
10
DELMAG D 16-32
Ram Weight 3.52 kipsEfficiency 0.800Pressure 1425 (100%) psi
Helmet Weight 1.90 kipsHammer Cushion 60155 kips/inCOR of H.C. 0.800
Skin Quake 0.100 inToe Quake 0.100 inSkin Damping 0.200 sec/ftToe Damping 0.150 sec/ft
Pile LengthPile PenetrationPile Top Area
102.30 97.30 26.10
ft ft in2
Pile ModelSkin FrictionDistribution
Res. Shaft = 40 %(Proportional)
Bruns-Bath Axial Pile Resistance Sheet 8 of 10

GZA Geo Environmental, Inc. 17-Feb-2016New Meadows No. 2 Bridge #2604 GRLWEAP Version 2010
Maximum Maximum Ultimate Compression Tension Blow Capacity Stress Stress Count Stroke Energy
kips ksi ksi blows/in ft kips-ft
100.0 21.87 3.54 1.1 6.90 15.94 150.0 23.28 1.75 1.9 7.41 15.32 200.0 24.42 1.04 3.0 7.84 15.20 250.0 25.16 0.96 4.2 8.13 15.18 300.0 25.61 1.44 5.8 8.31 15.32 350.0 26.20 1.63 7.8 8.55 15.65 375.0 26.43 1.63 9.1 8.67 15.77 391.0 26.59 1.66 10.1 8.73 15.86 425.0 26.89 1.65 12.7 8.86 16.07 450.0 27.08 1.66 15.1 8.94 16.23
Bruns-Bath Axial Pile Resistance Sheet 9 of 10

17-Feb-2016GZA Geo Environmental, Inc. GRLWEAP Version 2010New Meadows No. 2 Bridge #2604
17-Feb-2016GZA Geo Environmental, Inc. GRLWEAP Version 2010New Meadows No. 2 Bridge #2604
Com
pres
sive
Str
ess
(ksi
)
0
10
20
30
40
50
Ten
sion
Str
ess
(ksi
)
0
10
20
30
40
50
Blow Count (blows/in)
Ulti
mat
e C
apac
ity (
kips
)
0.00 3.33 6.67 10.00 13.33 16.67 20.000
100
200
300
400
500
Blow Count (blows/in)
Str
oke
(ft)
0.00 3.33 6.67 10.00 13.33 16.67 20.000
2
4
6
8
10
DELMAG D 16-32
Ram Weight 3.52 kipsEfficiency 0.800Pressure 1425 (100%) psi
Helmet Weight 1.90 kipsHammer Cushion 60155 kips/inCOR of H.C. 0.800
Skin Quake 0.100 inToe Quake 0.100 inSkin Damping 0.200 sec/ftToe Damping 0.150 sec/ft
Pile LengthPile PenetrationPile Top Area
76.10 71.10 26.10
ft ft in2
Pile ModelSkin FrictionDistribution
Res. Shaft = 30 %(Proportional)
Bruns-Bath Axial Pile Resistance Sheet 10 of 10

An Equal Opportunity Employer M/F/VIH
477 Congress Street
Suite 700
Portland, ME 04101
207.879.9190
www.gza.com
Geotechnical
Environmental
Ecological
Water
Construction Management
Proactive by Design
MEMORANDUM
TO: Laura Krusinski and Devon Eaton, Maine Department of Transportation
FROM: Andrew Blaisdell, Christopher Snow, Blaine Cardali DATE: December 22, 2015 FILE NO.: 09.0025900.00 SUBJECT: Results of Preliminary LPile Evaluations
New Meadows No. 2 Bridge #2604, MaineDOT WIN 20478.00 Brunswick‐Bath, Maine
Attached are the results of LPile evaluations completed by GZA for the proposed integral abutment bridge for the subject project. Our evaluations have been conducted in accordance with the design inputs provided by MaineDOT, summarized herein. We understand you will use these results to calculate the plastic moment for the proposed piles, and if necessary, you will calculate new loads for us to re‐run these analyses. Please call Andy Blaisdell at (207) 358‐5117 for additional information or with any questions. Attachment: LPile Evaluation Package (29 pages)

Table 1 - LPile Output Summary GZA FILE NO. 09.0025900.00New Meadows No. 2 Bridge #2604 Over New Meadows River, Bath/Brunswick, ME CALCULATED BY B.CardaliGZA GeoEnvironmental, Inc. CHECKED BY A. Blaisdell
LocationPile Head Soil
ConditionsAxial Load (kips)
Shear Force for Lateral deflection of 0.394 in. (kips)
Moment at Pile Head (ft-kips)
Total Stress at Pile Head (ksi)
Bending Stress at Pile
Head (ksi)
Axial Stress at Pile Head (ksi)
Abutment 1 All Clay 478.9 10.8 -62.2 34.1 15.8 18.3Abutment 2 Mixed 478.9 17.6 -89.5 41.1 22.8 18.3Abutment 2 All Sand 478.9 24.4 -111.4 46.7 28.4 18.3
Notes:
Lpile Summary Table
1. Pile head soil conditions refer to strata present within upper approximately 18 feet of the pile. Layering and properties of sand and siltassumed for each pile head condition are presented in Table 2.2. The axial load is the maximum Factored Axial Load, Strength Case, Exterior pile.3. The evaluated pile section is HP14x89, weak axis bending.
Page 1

Table 2 - LPile Input Parameters GZA FILE NO. 09.0025900.00New Meadows No. 2 Bridge #2604 Over New Meadows River, Bath/Brunswick, ME CALCULATED BY B.CardaliGZA GeoEnvironmental, Inc. CHECKED BY A. Blaisdell
Stratum Soil ModelTop of Layer Elevation (ft)
Layer Thickness (ft)
k (pci) / E50φ' (deg)/ Su (psf)
γe (pcf)
Clayey Silt Matlock Clay 5 18 E50 = 0.02 375 psf 48Silty Clay Matlock Clay -13 4 E50 = 0.008 1000 psf 56Silty Clay Matlock Clay -17 48 E50 = 0.008 465 psf 56
Sand (Possible Till) Reese Sand -65 27 100 38 67
Note: sand in upper few feet of pile, to represent softest anticipated profile.2. su for Silty Clay for El. -17 to -65 was determined as the average of field vane results, from BB-NMR-101.
Stratum Soil ModelTop of Layer Elevation (ft)
Layer Thickness (ft)
k (pci) / E50φ' (deg)/ Su (psf)
γe (pcf)
Sand (Possible Fill) Reese Sand 5 3 60 35 62Silt Matlock Clay 2 4 E50 = 0.02 375 psf 48
Gravel Reese Sand -2 5 100 38 67Silty Clay Matlock Clay -7 11 E50 = 0.008 1000 psf 56Silty Clay Matlock Clay -18 38 E50 = 0.008 520 psf 56
Gravel (Possible Till) Reese Sand -56 10 100 38 67
Note: 2. su for Silty Clay for El. -18 to -56 was determined as the average of field vane results, fromBB-NMR-102.
Stratum Soil ModelTop of Layer Elevation (ft)
Layer Thickness (ft)
k (pci) / E50φ' (deg)/ Su (psf)
γe (pcf)
Sand (Possible Fill) Reese Sand 5 12 60 35 62Silty Clay Matlock Clay -7 11 E50 = 0.008 1000 psf 56Silty Clay Matlock Clay -18 38 E50 = 0.008 520 psf 56
Gravel (Possible Till) Reese Sand -56 10 100 38 67
Note: between 3 and 7 feet below top of pile, to represent stiffest anticipated profile.2. su for Silty Clay for El. -18 to -56 was determined as the average of field vane results, fromBB-NMR-102.
1. Abutment 2 layering is based on stratification of boring BB-NMR-102, neglecting the silt stratum
Abutment 1, Pile length = 97', All Clay Head Condition (Boring: BB-NMR-101)
Abutment 2, Pile Length = 71', Mixed Head Condition (Borings: BB-NMR-102 )
1. Abutment 1 layering is based on stratification of boring BB-NMR-101, excluding potential
1. Abutment 2 layering is based on stratification of boring BB-NMR-102.
Abutment 2, Pile Length = 71', All Sand Head Condition (Borings: BB-NMR-102 )
Page 2

Lateral Pile Deflection (inches)D
epth
(ft
)
-0.1 -0.05 0 0.05 0.1 0.15 0.2 0.25 0.3 0.35 0.40
510
1520
2530
3540
4550
5560
6570
7580
8590
9510
0
Load Case 1
Soft Clay
Soft Clay
Soft Clay
Sand
Lateral Pile Deflection (inches)D
epth
(ft
)
-0.1 -0.05 0 0.05 0.1 0.15 0.2 0.25 0.3 0.35 0.40
510
1520
2530
3540
4550
5560
6570
7580
8590
9500
Load Case 1
Soft Clay
Soft Clay
Soft Clay
Sand
Abutment 1, All Clay - LPile Output
Page 3

Bending Moment (in-kips)D
epth
(ft
)
-800 -700 -600 -500 -400 -300 -200 -100 0 100 200 3000
510
1520
2530
3540
4550
5560
6570
7580
8590
9510
0
Load Case 1
Soft Clay
Soft Clay
Soft Clay
Sand
Bending Moment (in-kips)D
epth
(ft
)
-800 -700 -600 -500 -400 -300 -200 -100 0 100 200 3000
510
1520
2530
3540
4550
5560
6570
7580
8590
9500
Load Case 1
Soft Clay
Soft Clay
Soft Clay
Sand
Abutment 1, All Clay - LPile Output
Page 4
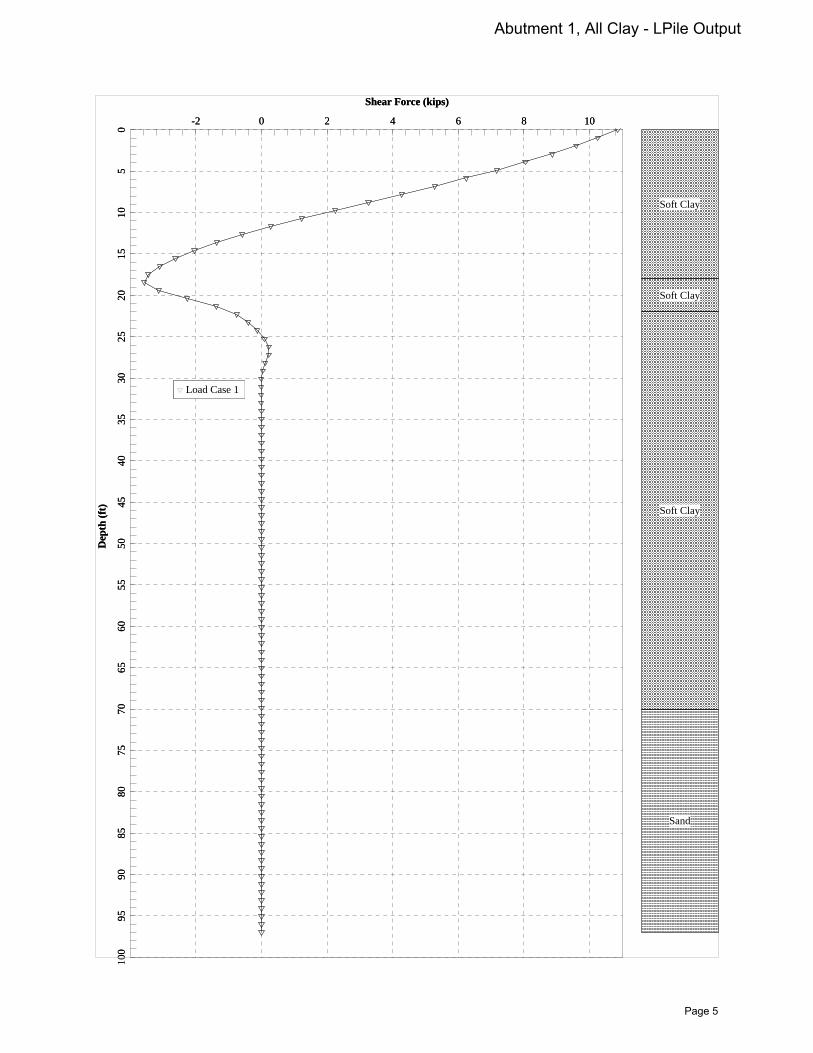
Shear Force (kips)D
epth
(ft
)
-2 0 2 4 6 8 100
510
1520
2530
3540
4550
5560
6570
7580
8590
9510
0
Load Case 1
Soft Clay
Soft Clay
Soft Clay
Sand
Shear Force (kips)D
epth
(ft
)
-2 0 2 4 6 8 100
510
1520
2530
3540
4550
5560
6570
7580
8590
9500
Load Case 1
Soft Clay
Soft Clay
Soft Clay
Sand
Abutment 1, All Clay - LPile Output
Page 5

Mobilized Soil Reaction (lb/in)D
epth
(ft
)
-80 -60 -40 -20 0 20 40 60 800
510
1520
2530
3540
4550
5560
6570
7580
8590
9510
0
Load Case 1
Soft Clay
Soft Clay
Soft Clay
Sand
Mobilized Soil Reaction (lb/in)D
epth
(ft
)
-80 -60 -40 -20 0 20 40 60 800
510
1520
2530
3540
4550
5560
6570
7580
8590
9500
Load Case 1
Soft Clay
Soft Clay
Soft Clay
Sand
Abutment 1, All Clay - LPile Output
Page 6

Lpile Bath brunswick Abutment 1 all clay.lp8o================================================================================
LPile for Windows, Version 2015-08.003
Analysis of Individual Piles and Drilled Shafts Subjected to Lateral Loading Using the p-y Method © 1985-2015 by Ensoft, Inc. All Rights Reserved
================================================================================
This copy of LPile is being used by:
Blaine CardaliGZA
Serial Number of Security Device: 161635470
This copy of LPile is licensed for exclusive use by:
GZA GeoEnvironmental, Inc., Port
Use of this program by any entity other than GZA GeoEnvironmental, Inc., Portis a violation of the software license agreement.
-------------------------------------------------------------------------------- Files Used for Analysis--------------------------------------------------------------------------------
Path to file locations:\09 Jobs\0025900s\09.0025900.00 - MDOT Brunswick-Bath\Work\Calcs\Lpile\
Name of input data file: Lpile Bath brunswick Abutment 1 all clay.lp8d
Name of output report file: Lpile Bath brunswick Abutment 1 all clay.lp8o
Name of plot output file: Lpile Bath brunswick Abutment 1 all clay.lp8p
Name of runtime message file: Lpile Bath brunswick Abutment 1 all clay.lp8r
-------------------------------------------------------------------------------- Date and Time of Analysis--------------------------------------------------------------------------------
Date: December 22, 2015 Time: 9:51:23
Page 1
Lpile Bath brunswick Abutment 1 all clay.lp8o
-------------------------------------------------------------------------------- Problem Title--------------------------------------------------------------------------------
New Meadows Bridge Bath/Brunswick 09.0025900.00 Maine Department of Transportation Blaine Cardali Abutment 1 (BB-NMR-101)
-------------------------------------------------------------------------------- Program Options and Settings--------------------------------------------------------------------------------
Computational Options: - Use unfactored loads in computations (conventional analysis)Engineering Units Used for Data Input and Computations: - US Customary System Units (pounds, feet, inches)
Analysis Control Options: - Maximum number of iterations allowed = 500 - Deflection tolerance for convergence = 1.0000E-05 in - Maximum allowable deflection = 100.0000 in - Number of pile increments = 100
Loading Type and Number of Cycles of Loading: - Static loading specified
- Use of p-y modification factors for p-y curves not selected - No distributed lateral loads are entered - Loading by lateral soil movements acting on pile not selected - Input of shear resistance at the pile tip not selected - Computation of pile-head foundation stiffness matrix not selected - Push-over analysis of pile not selected - Buckling analysis of pile not selected
Output Options:Page 2
Abutment 1, All Clay - LPile Output
Page 7

Lpile Bath brunswick Abutment 1 all clay.lp8o - Output files use decimal points to denote decimal symbols. - Values of pile-head deflection, bending moment, shear force, and soil reaction are printed for full length of pile. - Printing Increment (nodal spacing of output points) = 1 - No p-y curves to be computed and reported for user-specified depths - Print using wide report formats
-------------------------------------------------------------------------------- Pile Structural Properties and Geometry--------------------------------------------------------------------------------
Total number of pile sections = 1
Total length of pile = 97.00 ft
Depth of ground surface below top of pile = 0.00 ft
Pile diameters used for p-y curve computations are defined using 2 points.
p-y curves are computed using pile diameter values interpolated with depth over the length of the pile.
Point Depth Pile X Diameter ft in----- --------- ----------- 1 0.00000 13.80000000 2 97.0000000 13.80000000
Input Structural Properties:----------------------------
Pile Section No. 1:
Section Type = Elastic Pile Cross-sectional Shape = Weak H-Pile Section Length = 97.000000 ft Flange Width = 14.700000 in Section Depth = 13.800000 in Flange Thickness = 0.615000 in Web Thickness = 0.615000 in Section Area = 26.100000 sq. in Moment of Inertia = 325.837265 in^4 Elastic Modulus = 29000000. lbs/in^2
Page 3
Lpile Bath brunswick Abutment 1 all clay.lp8o-------------------------------------------------------------------------------- Ground Slope and Pile Batter Angles--------------------------------------------------------------------------------
Ground Slope Angle = 0.000 degrees = 0.000 radians
Pile Batter Angle = 0.000 degrees = 0.000 radians
-------------------------------------------------------------------------------- Soil and Rock Layering Information--------------------------------------------------------------------------------
The soil profile is modelled using 4 layers
Layer 1 is soft clay, p-y criteria by Matlock, 1970
Distance from top of pile to top of layer = 0.0000 ft Distance from top of pile to bottom of layer = 18.000000 ft Effective unit weight at top of layer = 48.000000 pcf Effective unit weight at bottom of layer = 48.000000 pcf Undrained cohesion at top of layer = 375.000000 psf Undrained cohesion at bottom of layer = 375.000000 psf Epsilon-50 at top of layer = 0.020000 Epsilon-50 at bottom of layer = 0.020000
Layer 2 is soft clay, p-y criteria by Matlock, 1970
Distance from top of pile to top of layer = 18.000000 ft Distance from top of pile to bottom of layer = 22.000000 ft Effective unit weight at top of layer = 56.000000 pcf Effective unit weight at bottom of layer = 56.000000 pcf Undrained cohesion at top of layer = 1000.000000 psf Undrained cohesion at bottom of layer = 1000.000000 psf Epsilon-50 at top of layer = 0.008000 Epsilon-50 at bottom of layer = 0.008000
Layer 3 is soft clay, p-y criteria by Matlock, 1970
Distance from top of pile to top of layer = 22.000000 ft Distance from top of pile to bottom of layer = 70.000000 ft Effective unit weight at top of layer = 56.000000 pcf Effective unit weight at bottom of layer = 56.000000 pcf Undrained cohesion at top of layer = 465.000000 psf Undrained cohesion at bottom of layer = 465.000000 psf Epsilon-50 at top of layer = 0.008000 Epsilon-50 at bottom of layer = 0.008000
Page 4
Abutment 1, All Clay - LPile Output
Page 8

Lpile Bath brunswick Abutment 1 all clay.lp8o
Layer 4 is sand, p-y criteria by Reese et al., 1974
Distance from top of pile to top of layer = 70.000000 ft Distance from top of pile to bottom of layer = 97.000000 ft Effective unit weight at top of layer = 67.000000 pcf Effective unit weight at bottom of layer = 67.000000 pcf Friction angle at top of layer = 38.000000 deg. Friction angle at bottom of layer = 38.000000 deg. Subgrade k at top of layer = 100.000000 pci Subgrade k at bottom of layer = 100.000000 pci
(Depth of lowest soil layer extends 0.00 ft below pile tip)
-------------------------------------------------------------------------------- Summary of Input Soil Properties--------------------------------------------------------------------------------
Layer Soil Type Layer Effective Undrained Angle of E50 Layer Name Depth Unit Wt. Cohesion Friction or kpy Num. (p-y Curve Type) ft pcf psf deg. krm pci ----- ------------------- ---------- ---------- ---------- ---------- ---------- ---------- 1 Soft 0.00 48.0000 375.0000 -- 0.02000 -- Clay 18.0000 48.0000 375.0000 -- 0.02000 -- 2 Soft 18.0000 56.0000 1000.0000 -- 0.00800 -- Clay 22.0000 56.0000 1000.0000 -- 0.00800 -- 3 Soft 22.0000 56.0000 465.0000 -- 0.00800 -- Clay 70.0000 56.0000 465.0000 -- 0.00800 -- 4 Sand 70.0000 67.0000 -- 38.0000 -- 100.0000 (Reese, et al.) 97.0000 67.0000 -- 38.0000 -- 100.0000
-------------------------------------------------------------------------------- Static Loading Type--------------------------------------------------------------------------------
Static loading criteria were used when computing p-y curves for all analyses.
-------------------------------------------------------------------------------- Pile-head Loading and Pile-head Fixity Conditions--------------------------------------------------------------------------------
Number of loads specified = 1
Load Load Condition Condition Axial Thrust Compute Top y No. Type 1 2 Force, lbs vs. Pile Length----- ---- -------------------- ----------------------- ---------------- --------------- 1 5 y = 0.394000 in S = 0.0000 in/in 478900. N.A.
Page 5
Lpile Bath brunswick Abutment 1 all clay.lp8o
V = perpendicular shear force applied to pile headM = bending moment applied to pile heady = lateral deflection relative to pile axisS = pile slope relative to original pile batter angleR = rotational stiffness applied to pile headValues of top y vs. pile lengths can be computed only for load types withspecified shear loading.Axial thrust is assumed to be acting axially for all pile batter angles.
-------------------------------------------------------------------------------- Computations of Nominal Moment Capacity and Nonlinear Bending Stiffness--------------------------------------------------------------------------------
Axial thrust force values were determined from pile-head loading conditions
Number of Pile Sections Analyzed = 1
Pile Section No. 1:-------------------Moment-curvature properties were derived from elastic section properties
-------------------------------------------------------------------------------- Computed Values of Pile Loading and Deflection for Lateral Loading for Load Case Number 1--------------------------------------------------------------------------------
Pile-head conditions are Displacement and Pile-head Rotation (Loading Type 5)Displacement of pile head = 0.394000 inchesRotation of pile head = 0.000E+00 radiansAxial load on pile head = 478900.0 lbs
Depth Deflect. Bending Shear Slope Total Bending Soil Res. Soil Spr. Distrib. X y Moment Force S Stress Stiffness p Es*h Lat. Load feet inches in-lbs lbs radians psi* in-lb^2 lb/inch lb/inch lb/inch ---------- ---------- ---------- ---------- ---------- ---------- ---------- ---------- ---------- ---------- 0.00 0.3940 -745853. 10861. 0.00 34143. 9.45E+09 -44.7220 660.6147 0.00 0.9700 0.3887 -620439. 10248. -8.42E-04 31487. 9.45E+09 -52.6197 1576. 0.00 1.9400 0.3744 -497894. 9593. -0.00153 28892. 9.45E+09 -59.9697 1864. 0.00 2.9100 0.3530 -380055. 8856. -0.00207 26397. 9.45E+09 -66.6511 2198. 0.00 3.8800 0.3262 -268636. 8046. -0.00247 24037. 9.45E+09 -72.5593 2589. 0.00 4.8500 0.2955 -165204. 7172. -0.00274 21847. 9.45E+09 -77.6029 3057. 0.00 5.8200 0.2625 -71153. 6245. -0.00288 19855. 9.45E+09 -81.7020 3623. 0.00 6.7900 0.2284 12318. 5276. -0.00292 18610. 9.45E+09 -84.7870 4321. 0.00 7.7600 0.1945 84217. 4277. -0.00286 20132. 9.45E+09 -86.7978 5195. 0.00 8.7300 0.1618 143776. 3262. -0.00272 21393. 9.45E+09 -87.6834 6308. 0.00 9.7000 0.1312 190469. 2243. -0.00251 22382. 9.45E+09 -87.4007 7756. 0.00
Page 6
Abutment 1, All Clay - LPile Output
Page 9
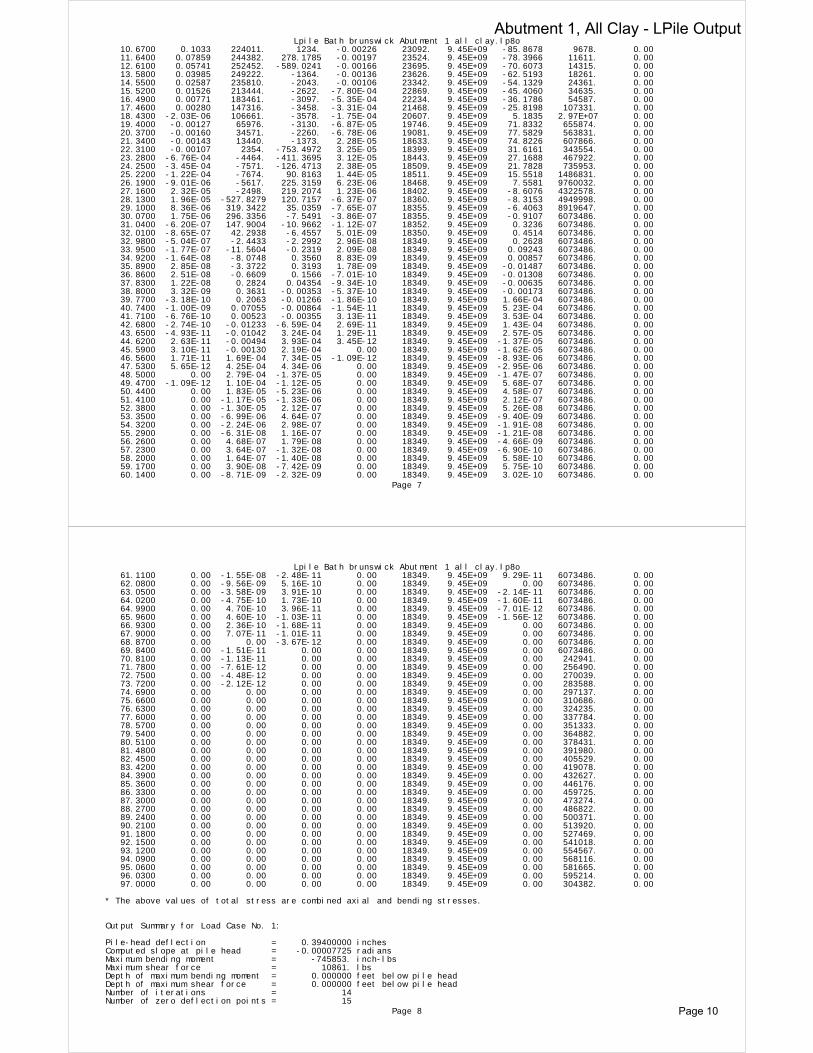
Lpile Bath brunswick Abutment 1 all clay.lp8o 10.6700 0.1033 224011. 1234. -0.00226 23092. 9.45E+09 -85.8678 9678. 0.00 11.6400 0.07859 244382. 278.1785 -0.00197 23524. 9.45E+09 -78.3966 11611. 0.00 12.6100 0.05741 252452. -589.0241 -0.00166 23695. 9.45E+09 -70.6073 14315. 0.00 13.5800 0.03985 249222. -1364. -0.00136 23626. 9.45E+09 -62.5193 18261. 0.00 14.5500 0.02587 235810. -2043. -0.00106 23342. 9.45E+09 -54.1329 24361. 0.00 15.5200 0.01526 213444. -2622. -7.80E-04 22869. 9.45E+09 -45.4060 34635. 0.00 16.4900 0.00771 183461. -3097. -5.35E-04 22234. 9.45E+09 -36.1786 54587. 0.00 17.4600 0.00280 147316. -3458. -3.31E-04 21468. 9.45E+09 -25.8198 107331. 0.00 18.4300 -2.03E-06 106661. -3578. -1.75E-04 20607. 9.45E+09 5.1835 2.97E+07 0.00 19.4000 -0.00127 65976. -3130. -6.87E-05 19746. 9.45E+09 71.8332 655874. 0.00 20.3700 -0.00160 34571. -2260. -6.78E-06 19081. 9.45E+09 77.5829 563831. 0.00 21.3400 -0.00143 13440. -1373. 2.28E-05 18633. 9.45E+09 74.8226 607866. 0.00 22.3100 -0.00107 2354. -753.4972 3.25E-05 18399. 9.45E+09 31.6161 343554. 0.00 23.2800 -6.76E-04 -4464. -411.3695 3.12E-05 18443. 9.45E+09 27.1688 467922. 0.00 24.2500 -3.45E-04 -7571. -126.4713 2.38E-05 18509. 9.45E+09 21.7828 735953. 0.00 25.2200 -1.22E-04 -7674. 90.8163 1.44E-05 18511. 9.45E+09 15.5518 1486831. 0.00 26.1900 -9.01E-06 -5617. 225.3159 6.23E-06 18468. 9.45E+09 7.5581 9760032. 0.00 27.1600 2.32E-05 -2498. 219.2074 1.23E-06 18402. 9.45E+09 -8.6076 4322578. 0.00 28.1300 1.96E-05 -527.8279 120.7157 -6.37E-07 18360. 9.45E+09 -8.3153 4949998. 0.00 29.1000 8.36E-06 319.3422 35.0359 -7.65E-07 18355. 9.45E+09 -6.4063 8919647. 0.00 30.0700 1.75E-06 296.3356 -7.5491 -3.86E-07 18355. 9.45E+09 -0.9107 6073486. 0.00 31.0400 -6.20E-07 147.9004 -10.9662 -1.12E-07 18352. 9.45E+09 0.3236 6073486. 0.00 32.0100 -8.65E-07 42.2938 -6.4557 5.01E-09 18350. 9.45E+09 0.4514 6073486. 0.00 32.9800 -5.04E-07 -2.4433 -2.2992 2.96E-08 18349. 9.45E+09 0.2628 6073486. 0.00 33.9500 -1.77E-07 -11.5604 -0.2319 2.09E-08 18349. 9.45E+09 0.09243 6073486. 0.00 34.9200 -1.64E-08 -8.0748 0.3560 8.83E-09 18349. 9.45E+09 0.00857 6073486. 0.00 35.8900 2.85E-08 -3.3722 0.3193 1.78E-09 18349. 9.45E+09 -0.01487 6073486. 0.00 36.8600 2.51E-08 -0.6609 0.1566 -7.01E-10 18349. 9.45E+09 -0.01308 6073486. 0.00 37.8300 1.22E-08 0.2824 0.04354 -9.34E-10 18349. 9.45E+09 -0.00635 6073486. 0.00 38.8000 3.32E-09 0.3631 -0.00353 -5.37E-10 18349. 9.45E+09 -0.00173 6073486. 0.00 39.7700 -3.18E-10 0.2063 -0.01266 -1.86E-10 18349. 9.45E+09 1.66E-04 6073486. 0.00 40.7400 -1.00E-09 0.07055 -0.00864 -1.54E-11 18349. 9.45E+09 5.23E-04 6073486. 0.00 41.7100 -6.76E-10 0.00523 -0.00355 3.13E-11 18349. 9.45E+09 3.53E-04 6073486. 0.00 42.6800 -2.74E-10 -0.01233 -6.59E-04 2.69E-11 18349. 9.45E+09 1.43E-04 6073486. 0.00 43.6500 -4.93E-11 -0.01042 3.24E-04 1.29E-11 18349. 9.45E+09 2.57E-05 6073486. 0.00 44.6200 2.63E-11 -0.00494 3.93E-04 3.45E-12 18349. 9.45E+09 -1.37E-05 6073486. 0.00 45.5900 3.10E-11 -0.00130 2.19E-04 0.00 18349. 9.45E+09 -1.62E-05 6073486. 0.00 46.5600 1.71E-11 1.69E-04 7.34E-05 -1.09E-12 18349. 9.45E+09 -8.93E-06 6073486. 0.00 47.5300 5.65E-12 4.25E-04 4.34E-06 0.00 18349. 9.45E+09 -2.95E-06 6073486. 0.00 48.5000 0.00 2.79E-04 -1.37E-05 0.00 18349. 9.45E+09 -1.47E-07 6073486. 0.00 49.4700 -1.09E-12 1.10E-04 -1.12E-05 0.00 18349. 9.45E+09 5.68E-07 6073486. 0.00 50.4400 0.00 1.83E-05 -5.23E-06 0.00 18349. 9.45E+09 4.58E-07 6073486. 0.00 51.4100 0.00 -1.17E-05 -1.33E-06 0.00 18349. 9.45E+09 2.12E-07 6073486. 0.00 52.3800 0.00 -1.30E-05 2.12E-07 0.00 18349. 9.45E+09 5.26E-08 6073486. 0.00 53.3500 0.00 -6.99E-06 4.64E-07 0.00 18349. 9.45E+09 -9.40E-09 6073486. 0.00 54.3200 0.00 -2.24E-06 2.98E-07 0.00 18349. 9.45E+09 -1.91E-08 6073486. 0.00 55.2900 0.00 -6.31E-08 1.16E-07 0.00 18349. 9.45E+09 -1.21E-08 6073486. 0.00 56.2600 0.00 4.68E-07 1.79E-08 0.00 18349. 9.45E+09 -4.66E-09 6073486. 0.00 57.2300 0.00 3.64E-07 -1.32E-08 0.00 18349. 9.45E+09 -6.90E-10 6073486. 0.00 58.2000 0.00 1.64E-07 -1.40E-08 0.00 18349. 9.45E+09 5.58E-10 6073486. 0.00 59.1700 0.00 3.90E-08 -7.42E-09 0.00 18349. 9.45E+09 5.75E-10 6073486. 0.00 60.1400 0.00 -8.71E-09 -2.32E-09 0.00 18349. 9.45E+09 3.02E-10 6073486. 0.00
Page 7
Lpile Bath brunswick Abutment 1 all clay.lp8o 61.1100 0.00 -1.55E-08 -2.48E-11 0.00 18349. 9.45E+09 9.29E-11 6073486. 0.00 62.0800 0.00 -9.56E-09 5.16E-10 0.00 18349. 9.45E+09 0.00 6073486. 0.00 63.0500 0.00 -3.58E-09 3.91E-10 0.00 18349. 9.45E+09 -2.14E-11 6073486. 0.00 64.0200 0.00 -4.75E-10 1.73E-10 0.00 18349. 9.45E+09 -1.60E-11 6073486. 0.00 64.9900 0.00 4.70E-10 3.96E-11 0.00 18349. 9.45E+09 -7.01E-12 6073486. 0.00 65.9600 0.00 4.60E-10 -1.03E-11 0.00 18349. 9.45E+09 -1.56E-12 6073486. 0.00 66.9300 0.00 2.36E-10 -1.68E-11 0.00 18349. 9.45E+09 0.00 6073486. 0.00 67.9000 0.00 7.07E-11 -1.01E-11 0.00 18349. 9.45E+09 0.00 6073486. 0.00 68.8700 0.00 0.00 -3.67E-12 0.00 18349. 9.45E+09 0.00 6073486. 0.00 69.8400 0.00 -1.51E-11 0.00 0.00 18349. 9.45E+09 0.00 6073486. 0.00 70.8100 0.00 -1.13E-11 0.00 0.00 18349. 9.45E+09 0.00 242941. 0.00 71.7800 0.00 -7.61E-12 0.00 0.00 18349. 9.45E+09 0.00 256490. 0.00 72.7500 0.00 -4.48E-12 0.00 0.00 18349. 9.45E+09 0.00 270039. 0.00 73.7200 0.00 -2.12E-12 0.00 0.00 18349. 9.45E+09 0.00 283588. 0.00 74.6900 0.00 0.00 0.00 0.00 18349. 9.45E+09 0.00 297137. 0.00 75.6600 0.00 0.00 0.00 0.00 18349. 9.45E+09 0.00 310686. 0.00 76.6300 0.00 0.00 0.00 0.00 18349. 9.45E+09 0.00 324235. 0.00 77.6000 0.00 0.00 0.00 0.00 18349. 9.45E+09 0.00 337784. 0.00 78.5700 0.00 0.00 0.00 0.00 18349. 9.45E+09 0.00 351333. 0.00 79.5400 0.00 0.00 0.00 0.00 18349. 9.45E+09 0.00 364882. 0.00 80.5100 0.00 0.00 0.00 0.00 18349. 9.45E+09 0.00 378431. 0.00 81.4800 0.00 0.00 0.00 0.00 18349. 9.45E+09 0.00 391980. 0.00 82.4500 0.00 0.00 0.00 0.00 18349. 9.45E+09 0.00 405529. 0.00 83.4200 0.00 0.00 0.00 0.00 18349. 9.45E+09 0.00 419078. 0.00 84.3900 0.00 0.00 0.00 0.00 18349. 9.45E+09 0.00 432627. 0.00 85.3600 0.00 0.00 0.00 0.00 18349. 9.45E+09 0.00 446176. 0.00 86.3300 0.00 0.00 0.00 0.00 18349. 9.45E+09 0.00 459725. 0.00 87.3000 0.00 0.00 0.00 0.00 18349. 9.45E+09 0.00 473274. 0.00 88.2700 0.00 0.00 0.00 0.00 18349. 9.45E+09 0.00 486822. 0.00 89.2400 0.00 0.00 0.00 0.00 18349. 9.45E+09 0.00 500371. 0.00 90.2100 0.00 0.00 0.00 0.00 18349. 9.45E+09 0.00 513920. 0.00 91.1800 0.00 0.00 0.00 0.00 18349. 9.45E+09 0.00 527469. 0.00 92.1500 0.00 0.00 0.00 0.00 18349. 9.45E+09 0.00 541018. 0.00 93.1200 0.00 0.00 0.00 0.00 18349. 9.45E+09 0.00 554567. 0.00 94.0900 0.00 0.00 0.00 0.00 18349. 9.45E+09 0.00 568116. 0.00 95.0600 0.00 0.00 0.00 0.00 18349. 9.45E+09 0.00 581665. 0.00 96.0300 0.00 0.00 0.00 0.00 18349. 9.45E+09 0.00 595214. 0.00 97.0000 0.00 0.00 0.00 0.00 18349. 9.45E+09 0.00 304382. 0.00
* The above values of total stress are combined axial and bending stresses.
Output Summary for Load Case No. 1:
Pile-head deflection = 0.39400000 inchesComputed slope at pile head = -0.00007725 radiansMaximum bending moment = -745853. inch-lbsMaximum shear force = 10861. lbsDepth of maximum bending moment = 0.000000 feet below pile headDepth of maximum shear force = 0.000000 feet below pile headNumber of iterations = 14Number of zero deflection points = 15
Page 8
Abutment 1, All Clay - LPile Output
Page 10

Lpile Bath brunswick Abutment 1 all clay.lp8o
-------------------------------------------------------------------------------- Summary of Pile-head Responses for Conventional Analyses--------------------------------------------------------------------------------
Definitions of Pile-head Loading Conditions:
Load Type 1: Load 1 = Shear, V, lbs, and Load 2 = Moment, M, in-lbsLoad Type 2: Load 1 = Shear, V, lbs, and Load 2 = Slope, S, radiansLoad Type 3: Load 1 = Shear, V, lbs, and Load 2 = Rot. Stiffness, R, in-lbs/rad.Load Type 4: Load 1 = Top Deflection, y, inches, and Load 2 = Moment, M, in-lbsLoad Type 5: Load 1 = Top Deflection, y, inches, and Load 2 = Slope, S, radians
Load Load Load Axial Pile-head Pile-head Max Shear Max MomentCase Type Pile-head Type Pile-head Loading Deflection Rotation in Pile in Pile No. 1 Load 1 2 Load 2 lbs inches radians lbs in-lbs ---- ----- ---------- ---------- ---------- ---------- ---------- ---------- ---------- ---------- 1 y, in 0.3940 S, rad 0.00 478900. 0.3940 -7.72E-05 10861. -745853.
Maximum pile-head deflection = 0.394000000 inchesMaximum pile-head rotation = -0.000077245 radians
The analysis ended normally.
Page 9
Abutment 1, All Clay - LPile Output
Page 11

Lateral Pile Deflection (inches)D
epth
(ft
)
-0.1 -0.05 0 0.05 0.1 0.15 0.2 0.25 0.3 0.35 0.40
510
1520
2530
3540
4550
5560
6570
7580
Load Case 1
Sand
Soft Clay
Sand
Soft Clay
Soft Clay
Sand
Lateral Pile Deflection (inches)D
epth
(ft
)
-0.1 -0.05 0 0.05 0.1 0.15 0.2 0.25 0.3 0.35 0.40
510
1520
2530
3540
4550
5560
6570
750
Load Case 1
Sand
Soft Clay
Sand
Soft Clay
Soft Clay
Sand
Abutment 2, Mixed - LPile Output
Page 12

Bending Moment (in-kips)D
epth
(ft
)
-1000 -800 -600 -400 -200 0 200 4000
510
1520
2530
3540
4550
5560
6570
7580
Load Case 1
Sand
Soft Clay
Sand
Soft Clay
Soft Clay
Sand
Bending Moment (in-kips)D
epth
(ft
)
-1000 -800 -600 -400 -200 0 200 4000
510
1520
2530
3540
4550
5560
6570
750
Load Case 1
Sand
Soft Clay
Sand
Soft Clay
Soft Clay
Sand
Abutment 2, Mixed - LPile Output
Page 13

Shear Force (kips)D
epth
(ft
)
-6 -4 -2 0 2 4 6 8 10 12 14 16 180
510
1520
2530
3540
4550
5560
6570
7580
Load Case 1
Sand
Soft Clay
Sand
Soft Clay
Soft Clay
Sand
Shear Force (kips)D
epth
(ft
)
-6 -4 -2 0 2 4 6 8 10 12 14 16 180
510
1520
2530
3540
4550
5560
6570
750
Load Case 1
Sand
Soft Clay
Sand
Soft Clay
Soft Clay
Sand
Abutment 2, Mixed - LPile Output
Page 14

Mobilized Soil Reaction (lb/in)D
epth
(ft
)
-300 -250 -200 -150 -100 -50 0 50 100 150 2000
510
1520
2530
3540
4550
5560
6570
7580
Load Case 1
Sand
Soft Clay
Sand
Soft Clay
Soft Clay
Sand
Mobilized Soil Reaction (lb/in)D
epth
(ft
)
-300 -250 -200 -150 -100 -50 0 50 100 150 2000
510
1520
2530
3540
4550
5560
6570
750
Load Case 1
Sand
Soft Clay
Sand
Soft Clay
Soft Clay
Sand
Abutment 2, Mixed - LPile Output
Page 15

Lpile Bath brunswick Abutment 2 mixed.lp8o================================================================================
LPile for Windows, Version 2015-08.003
Analysis of Individual Piles and Drilled Shafts Subjected to Lateral Loading Using the p-y Method © 1985-2015 by Ensoft, Inc. All Rights Reserved
================================================================================
This copy of LPile is being used by:
Blaine CardaliGZA
Serial Number of Security Device: 161635470
This copy of LPile is licensed for exclusive use by:
GZA GeoEnvironmental, Inc., Port
Use of this program by any entity other than GZA GeoEnvironmental, Inc., Portis a violation of the software license agreement.
-------------------------------------------------------------------------------- Files Used for Analysis--------------------------------------------------------------------------------
Path to file locations:\09 Jobs\0025900s\09.0025900.00 - MDOT Brunswick-Bath\Work\Calcs\Lpile\
Name of input data file: Lpile Bath brunswick Abutment 2 mixed.lp8d
Name of output report file: Lpile Bath brunswick Abutment 2 mixed.lp8o
Name of plot output file: Lpile Bath brunswick Abutment 2 mixed.lp8p
Name of runtime message file: Lpile Bath brunswick Abutment 2 mixed.lp8r
-------------------------------------------------------------------------------- Date and Time of Analysis--------------------------------------------------------------------------------
Date: December 22, 2015 Time: 10:26:16
Page 1
Lpile Bath brunswick Abutment 2 mixed.lp8o
-------------------------------------------------------------------------------- Problem Title--------------------------------------------------------------------------------
New Meadows Bridge Bath/Brunswick 09.0025900.00 Maine Department of Transportation Blaine Cardali Abutment 1 (BB-NMR-101)
-------------------------------------------------------------------------------- Program Options and Settings--------------------------------------------------------------------------------
Computational Options: - Use unfactored loads in computations (conventional analysis)Engineering Units Used for Data Input and Computations: - US Customary System Units (pounds, feet, inches)
Analysis Control Options: - Maximum number of iterations allowed = 500 - Deflection tolerance for convergence = 1.0000E-05 in - Maximum allowable deflection = 100.0000 in - Number of pile increments = 100
Loading Type and Number of Cycles of Loading: - Static loading specified
- Use of p-y modification factors for p-y curves not selected - No distributed lateral loads are entered - Loading by lateral soil movements acting on pile not selected - Input of shear resistance at the pile tip not selected - Computation of pile-head foundation stiffness matrix not selected - Push-over analysis of pile not selected - Buckling analysis of pile not selected
Output Options:Page 2
Abutment 2, Mixed - LPile Output
Page 16

Lpile Bath brunswick Abutment 2 mixed.lp8o - Output files use decimal points to denote decimal symbols. - Values of pile-head deflection, bending moment, shear force, and soil reaction are printed for full length of pile. - Printing Increment (nodal spacing of output points) = 1 - No p-y curves to be computed and reported for user-specified depths - Print using wide report formats
-------------------------------------------------------------------------------- Pile Structural Properties and Geometry--------------------------------------------------------------------------------
Total number of pile sections = 1
Total length of pile = 71.00 ft
Depth of ground surface below top of pile = 0.00 ft
Pile diameters used for p-y curve computations are defined using 2 points.
p-y curves are computed using pile diameter values interpolated with depth over the length of the pile.
Point Depth Pile X Diameter ft in----- --------- ----------- 1 0.00000 13.80000000 2 71.0000000 13.80000000
Input Structural Properties:----------------------------
Pile Section No. 1:
Section Type = Elastic Pile Cross-sectional Shape = Weak H-Pile Section Length = 71.000000 ft Flange Width = 14.700000 in Section Depth = 13.800000 in Flange Thickness = 0.615000 in Web Thickness = 0.615000 in Section Area = 26.100000 sq. in Moment of Inertia = 325.837265 in^4 Elastic Modulus = 29000000. lbs/in^2
Page 3
Lpile Bath brunswick Abutment 2 mixed.lp8o-------------------------------------------------------------------------------- Ground Slope and Pile Batter Angles--------------------------------------------------------------------------------
Ground Slope Angle = 0.000 degrees = 0.000 radians
Pile Batter Angle = 0.000 degrees = 0.000 radians
-------------------------------------------------------------------------------- Soil and Rock Layering Information--------------------------------------------------------------------------------
The soil profile is modelled using 6 layers
Layer 1 is sand, p-y criteria by Reese et al., 1974
Distance from top of pile to top of layer = 0.0000 ft Distance from top of pile to bottom of layer = 3.000000 ft Effective unit weight at top of layer = 62.000000 pcf Effective unit weight at bottom of layer = 62.000000 pcf Friction angle at top of layer = 35.000000 deg. Friction angle at bottom of layer = 35.000000 deg. Subgrade k at top of layer = 60.000000 pci Subgrade k at bottom of layer = 60.000000 pci
Layer 2 is soft clay, p-y criteria by Matlock, 1970
Distance from top of pile to top of layer = 3.000000 ft Distance from top of pile to bottom of layer = 7.000000 ft Effective unit weight at top of layer = 48.000000 pcf Effective unit weight at bottom of layer = 48.000000 pcf Undrained cohesion at top of layer = 375.000000 psf Undrained cohesion at bottom of layer = 375.000000 psf Epsilon-50 at top of layer = 0.020000 Epsilon-50 at bottom of layer = 0.020000
Layer 3 is sand, p-y criteria by Reese et al., 1974
Distance from top of pile to top of layer = 7.000000 ft Distance from top of pile to bottom of layer = 12.000000 ft Effective unit weight at top of layer = 67.000000 pcf Effective unit weight at bottom of layer = 67.000000 pcf Friction angle at top of layer = 38.000000 deg. Friction angle at bottom of layer = 38.000000 deg. Subgrade k at top of layer = 100.000000 pci Subgrade k at bottom of layer = 100.000000 pci
Page 4
Abutment 2, Mixed - LPile Output
Page 17

Lpile Bath brunswick Abutment 2 mixed.lp8o
Layer 4 is soft clay, p-y criteria by Matlock, 1970
Distance from top of pile to top of layer = 12.000000 ft Distance from top of pile to bottom of layer = 23.000000 ft Effective unit weight at top of layer = 56.000000 pcf Effective unit weight at bottom of layer = 56.000000 pcf Undrained cohesion at top of layer = 1000.000000 psf Undrained cohesion at bottom of layer = 1000.000000 psf Epsilon-50 at top of layer = 0.008000 Epsilon-50 at bottom of layer = 0.008000
Layer 5 is soft clay, p-y criteria by Matlock, 1970
Distance from top of pile to top of layer = 23.000000 ft Distance from top of pile to bottom of layer = 61.000000 ft Effective unit weight at top of layer = 56.000000 pcf Effective unit weight at bottom of layer = 56.000000 pcf Undrained cohesion at top of layer = 520.000000 psf Undrained cohesion at bottom of layer = 520.000000 psf Epsilon-50 at top of layer = 0.008000 Epsilon-50 at bottom of layer = 0.008000
Layer 6 is sand, p-y criteria by Reese et al., 1974
Distance from top of pile to top of layer = 61.000000 ft Distance from top of pile to bottom of layer = 71.000000 ft Effective unit weight at top of layer = 67.000000 pcf Effective unit weight at bottom of layer = 67.000000 pcf Friction angle at top of layer = 38.000000 deg. Friction angle at bottom of layer = 38.000000 deg. Subgrade k at top of layer = 100.000000 pci Subgrade k at bottom of layer = 100.000000 pci
(Depth of lowest soil layer extends 0.00 ft below pile tip)
-------------------------------------------------------------------------------- Summary of Input Soil Properties--------------------------------------------------------------------------------
Layer Soil Type Layer Effective Undrained Angle of E50 Layer Name Depth Unit Wt. Cohesion Friction or kpy Num. (p-y Curve Type) ft pcf psf deg. krm pci ----- ------------------- ---------- ---------- ---------- ---------- ---------- ---------- 1 Sand 0.00 62.0000 -- 35.0000 -- 60.0000 (Reese, et al.) 3.0000 62.0000 -- 35.0000 -- 60.0000 2 Soft 3.0000 48.0000 375.0000 -- 0.02000 --
Page 5
Lpile Bath brunswick Abutment 2 mixed.lp8o Clay 7.0000 48.0000 375.0000 -- 0.02000 -- 3 Sand 7.0000 67.0000 -- 38.0000 -- 100.0000 (Reese, et al.) 12.0000 67.0000 -- 38.0000 -- 100.0000 4 Soft 12.0000 56.0000 1000.0000 -- 0.00800 -- Clay 23.0000 56.0000 1000.0000 -- 0.00800 -- 5 Soft 23.0000 56.0000 520.0000 -- 0.00800 -- Clay 61.0000 56.0000 520.0000 -- 0.00800 -- 6 Sand 61.0000 67.0000 -- 38.0000 -- 100.0000 (Reese, et al.) 71.0000 67.0000 -- 38.0000 -- 100.0000
-------------------------------------------------------------------------------- Static Loading Type--------------------------------------------------------------------------------
Static loading criteria were used when computing p-y curves for all analyses.
-------------------------------------------------------------------------------- Pile-head Loading and Pile-head Fixity Conditions--------------------------------------------------------------------------------
Number of loads specified = 1
Load Load Condition Condition Axial Thrust Compute Top y No. Type 1 2 Force, lbs vs. Pile Length----- ---- -------------------- ----------------------- ---------------- --------------- 1 5 y = 0.394000 in S = 0.0000 in/in 478900. N.A.
V = perpendicular shear force applied to pile headM = bending moment applied to pile heady = lateral deflection relative to pile axisS = pile slope relative to original pile batter angleR = rotational stiffness applied to pile headValues of top y vs. pile lengths can be computed only for load types withspecified shear loading.Axial thrust is assumed to be acting axially for all pile batter angles.
-------------------------------------------------------------------------------- Computations of Nominal Moment Capacity and Nonlinear Bending Stiffness--------------------------------------------------------------------------------
Axial thrust force values were determined from pile-head loading conditions
Number of Pile Sections Analyzed = 1
Pile Section No. 1:-------------------Moment-curvature properties were derived from elastic section properties
Page 6
Abutment 2, Mixed - LPile Output
Page 18

Lpile Bath brunswick Abutment 2 mixed.lp8o
-------------------------------------------------------------------------------- Computed Values of Pile Loading and Deflection for Lateral Loading for Load Case Number 1--------------------------------------------------------------------------------
Pile-head conditions are Displacement and Pile-head Rotation (Loading Type 5)Displacement of pile head = 0.394000 inchesRotation of pile head = 0.000E+00 radiansAxial load on pile head = 478900.0 lbs
Depth Deflect. Bending Shear Slope Total Bending Soil Res. Soil Spr. Distrib. X y Moment Force S Stress Stiffness p Es*h Lat. Load feet inches in-lbs lbs radians psi* in-lb^2 lb/inch lb/inch lb/inch ---------- ---------- ---------- ---------- ---------- ---------- ---------- ---------- ---------- ---------- 0.00 0.3940 -1074394. 17621. 0.00 41100. 9.45E+09 0.00 0.00 0.00 0.7100 0.3899 -923990. 17222. -9.01E-04 37915. 9.45E+09 -46.8238 1023. 0.00 1.4200 0.3786 -773584. 16592. -0.00167 34730. 9.45E+09 -100.9634 2272. 0.00 2.1300 0.3615 -627662. 15527. -0.00230 31640. 9.45E+09 -149.0080 3512. 0.00 2.8400 0.3395 -490247. 14109. -0.00280 28730. 9.45E+09 -183.9980 4618. 0.00 3.5500 0.3137 -364385. 13036. -0.00319 26065. 9.45E+09 -67.7907 1841. 0.00 4.2600 0.2852 -242103. 12445. -0.00346 23475. 9.45E+09 -71.0406 2122. 0.00 4.9700 0.2548 -124088. 11829. -0.00363 20976. 9.45E+09 -73.5869 2461. 0.00 5.6800 0.2234 -10958. 11194. -0.00369 18581. 9.45E+09 -75.3755 2875. 0.00 6.3900 0.1919 96742. 10548. -0.00365 20397. 9.45E+09 -76.3534 3389. 0.00 7.1000 0.1612 198542. 9325. -0.00351 22553. 9.45E+09 -210.5886 11128. 0.00 7.8100 0.1321 284326. 7427. -0.00330 24370. 9.45E+09 -234.9249 15157. 0.00 8.5200 0.1051 352010. 5343. -0.00301 25803. 9.45E+09 -254.2803 20623. 0.00 9.2300 0.08076 399941. 3114. -0.00267 26818. 9.45E+09 -268.9959 28379. 0.00 9.9400 0.05953 426874. 810.8264 -0.00230 27388. 9.45E+09 -271.6888 38881. 0.00 10.6500 0.04159 432514. -1459. -0.00191 27508. 9.45E+09 -261.0517 53477. 0.00 11.3600 0.02697 417613. -3577. -0.00153 27192. 9.45E+09 -236.2868 74645. 0.00 12.0700 0.01556 384024. -5239. -0.00117 26481. 9.45E+09 -153.7929 84227. 0.00 12.7800 0.00709 337859. -6436. -8.41E-04 25503. 9.45E+09 -127.1881 152753. 0.00 13.4900 0.00123 281217. -7279. -5.62E-04 24304. 9.45E+09 -70.6258 490524. 0.00 14.2000 -0.00248 218414. -7197. -3.37E-04 22974. 9.45E+09 89.8426 308615. 0.00 14.9100 -0.00451 161330. -6347. -1.65E-04 21765. 9.45E+09 109.5550 206990. 0.00 15.6200 -0.00530 111604. -5388. -4.24E-05 20712. 9.45E+09 115.5899 185843. 0.00 16.3300 -0.00523 69859. -4406. 3.94E-05 19828. 9.45E+09 115.0944 187437. 0.00 17.0400 -0.00463 36211. -3445. 8.72E-05 19115. 9.45E+09 110.4870 203429. 0.00 17.7500 -0.00374 10451. -2535. 1.08E-04 18570. 9.45E+09 102.9744 234271. 0.00 18.4600 -0.00278 -7873. -1699. 1.09E-04 18515. 9.45E+09 93.2780 285639. 0.00 19.1700 -0.00188 -19397. -953.1048 9.72E-05 18759. 9.45E+09 81.8682 371009. 0.00 19.8800 -0.00113 -24907. -310.2509 7.72E-05 18876. 9.45E+09 69.0364 521981. 0.00 20.5900 -5.65E-04 -25313. 217.4445 5.45E-05 18885. 9.45E+09 54.8357 826958. 0.00 21.3000 -1.98E-04 -21647. 615.2702 3.34E-05 18807. 9.45E+09 38.5506 1662674. 0.00 22.0100 3.58E-06 -15102. 762.3630 1.68E-05 18668. 9.45E+09 -4.0217 9560303. 0.00 22.7200 8.87E-05 -8793. 617.9718 6.03E-06 18535. 9.45E+09 -29.8729 2869400. 0.00 23.4300 1.06E-04 -4620. 420.6161 -2.10E-08 18447. 9.45E+09 -16.4547 1319241. 0.00 24.1400 8.83E-05 -1625. 284.6220 -2.84E-06 18383. 9.45E+09 -15.4688 1491862. 0.00
Page 7
Lpile Bath brunswick Abutment 2 mixed.lp8o 24.8500 5.79E-05 252.6526 161.4309 -3.46E-06 18354. 9.45E+09 -13.4493 1978093. 0.00 25.5600 2.95E-05 1154. 58.3992 -2.82E-06 18373. 9.45E+09 -10.7365 3105495. 0.00 26.2700 9.84E-06 1271. -18.5703 -1.73E-06 18376. 9.45E+09 -7.3314 6344756. 0.00 26.9800 -3.67E-09 851.2038 -49.7931 -7.72E-07 18367. 9.45E+09 0.00214 4971358. 0.00 27.6900 -3.31E-06 428.6296 -41.5483 -1.95E-07 18358. 9.45E+09 1.9332 4971358. 0.00 28.4000 -3.33E-06 144.8132 -25.0354 6.33E-08 18352. 9.45E+09 1.9430 4971358. 0.00 29.1100 -2.23E-06 1.5094 -11.2043 1.29E-07 18349. 9.45E+09 1.3037 4971358. 0.00 29.8200 -1.13E-06 -47.1637 -2.8492 1.09E-07 18350. 9.45E+09 0.6576 4971358. 0.00 30.5300 -3.82E-07 -47.9275 0.9019 6.58E-08 18350. 9.45E+09 0.2229 4971358. 0.00 31.2400 -5.25E-09 -32.3332 1.8646 2.96E-08 18349. 9.45E+09 0.00307 4971358. 0.00 31.9500 1.23E-07 -16.3973 1.5715 7.68E-09 18349. 9.45E+09 -0.07186 4971358. 0.00 32.6600 1.26E-07 -5.6171 0.9533 -2.25E-09 18349. 9.45E+09 -0.07328 4971358. 0.00 33.3700 8.49E-08 -0.1354 0.4301 -4.84E-09 18349. 9.45E+09 -0.04952 4971358. 0.00 34.0800 4.31E-08 1.7521 0.1120 -4.11E-09 18349. 9.45E+09 -0.02516 4971358. 0.00 34.7900 1.48E-08 1.8072 -0.03196 -2.51E-09 18349. 9.45E+09 -0.00865 4971358. 0.00 35.5000 4.05E-10 1.2280 -0.06980 -1.14E-09 18349. 9.45E+09 -2.36E-04 4971358. 0.00 36.2100 -4.57E-09 0.6272 -0.05943 -3.02E-10 18349. 9.45E+09 0.00267 4971358. 0.00 36.9200 -4.74E-09 0.2178 -0.03629 7.93E-11 18349. 9.45E+09 0.00276 4971358. 0.00 37.6300 -3.22E-09 0.00811 -0.01651 1.81E-10 18349. 9.45E+09 0.00188 4971358. 0.00 38.3400 -1.65E-09 -0.06505 -0.00440 1.55E-10 18349. 9.45E+09 9.62E-04 4971358. 0.00 39.0500 -5.74E-10 -0.06813 0.00113 9.54E-11 18349. 9.45E+09 3.35E-04 4971358. 0.00 39.7600 -2.31E-11 -0.04663 0.00261 4.37E-11 18349. 9.45E+09 1.35E-05 4971358. 0.00 40.4700 1.70E-10 -0.02398 0.00225 1.18E-11 18349. 9.45E+09 -9.91E-05 4971358. 0.00 41.1800 1.78E-10 -0.00844 0.00138 -2.78E-12 18349. 9.45E+09 -1.04E-04 4971358. 0.00 41.8900 1.22E-10 -4.21E-04 6.33E-04 -6.78E-12 18349. 9.45E+09 -7.14E-05 4971358. 0.00 42.6000 6.30E-11 0.00241 1.73E-04 -5.88E-12 18349. 9.45E+09 -3.68E-05 4971358. 0.00 43.3100 2.22E-11 0.00257 -3.95E-05 -3.63E-12 18349. 9.45E+09 -1.30E-05 4971358. 0.00 44.0200 1.17E-12 0.00177 -9.77E-05 -1.68E-12 18349. 9.45E+09 -6.86E-07 4971358. 0.00 44.7300 -6.30E-12 9.17E-04 -8.50E-05 0.00 18349. 9.45E+09 3.67E-06 4971358. 0.00 45.4400 -6.73E-12 3.27E-04 -5.26E-05 0.00 18349. 9.45E+09 3.93E-06 4971358. 0.00 46.1500 -4.65E-12 2.03E-05 -2.43E-05 0.00 18349. 9.45E+09 2.71E-06 4971358. 0.00 46.8600 -2.41E-12 -8.95E-05 -6.76E-06 0.00 18349. 9.45E+09 1.41E-06 4971358. 0.00 47.5700 0.00 -9.68E-05 1.37E-06 0.00 18349. 9.45E+09 5.03E-07 4971358. 0.00 48.2800 0.00 -6.72E-05 3.65E-06 0.00 18349. 9.45E+09 3.26E-08 4971358. 0.00 48.9900 0.00 -3.50E-05 3.21E-06 0.00 18349. 9.45E+09 -1.36E-07 4971358. 0.00 49.7000 0.00 -1.26E-05 2.00E-06 0.00 18349. 9.45E+09 -1.48E-07 4971358. 0.00 50.4100 0.00 -9.32E-07 9.32E-07 0.00 18349. 9.45E+09 -1.03E-07 4971358. 0.00 51.1200 0.00 3.31E-06 2.65E-07 0.00 18349. 9.45E+09 -5.38E-08 4971358. 0.00 51.8300 0.00 3.65E-06 -4.73E-08 0.00 18349. 9.45E+09 -1.95E-08 4971358. 0.00 52.5400 0.00 2.55E-06 -1.37E-07 0.00 18349. 9.45E+09 -1.49E-09 4971358. 0.00 53.2500 0.00 1.34E-06 -1.21E-07 0.00 18349. 9.45E+09 5.04E-09 4971358. 0.00 53.9600 0.00 4.89E-07 -7.61E-08 0.00 18349. 9.45E+09 5.57E-09 4971358. 0.00 54.6700 0.00 4.16E-08 -3.57E-08 0.00 18349. 9.45E+09 3.91E-09 4971358. 0.00 55.3800 0.00 -1.23E-07 -1.03E-08 0.00 18349. 9.45E+09 2.05E-09 4971358. 0.00 56.0900 0.00 -1.37E-07 1.61E-09 0.00 18349. 9.45E+09 7.52E-10 4971358. 0.00 56.8000 0.00 -9.68E-08 5.09E-09 0.00 18349. 9.45E+09 6.52E-11 4971358. 0.00 57.5100 0.00 -5.13E-08 4.57E-09 0.00 18349. 9.45E+09 -1.88E-10 4971358. 0.00 58.2200 0.00 -1.91E-08 2.87E-09 0.00 18349. 9.45E+09 -2.11E-10 4971358. 0.00 58.9300 0.00 -2.30E-09 1.34E-09 0.00 18349. 9.45E+09 -1.49E-10 4971358. 0.00 59.6400 0.00 3.77E-09 3.83E-10 0.00 18349. 9.45E+09 -7.58E-11 4971358. 0.00 60.3500 0.00 4.33E-09 -2.45E-11 0.00 18349. 9.45E+09 -1.98E-11 4971358. 0.00 61.0600 0.00 3.43E-09 -1.06E-10 0.00 18349. 9.45E+09 0.00 178931. 0.00
Page 8
Abutment 2, Mixed - LPile Output
Page 19

Lpile Bath brunswick Abutment 2 mixed.lp8o 61.7700 0.00 2.56E-09 -9.78E-11 0.00 18349. 9.45E+09 1.42E-12 186190. 0.00 62.4800 0.00 1.79E-09 -8.39E-11 0.00 18349. 9.45E+09 1.85E-12 193449. 0.00 63.1900 0.00 1.14E-09 -6.76E-11 0.00 18349. 9.45E+09 1.98E-12 200708. 0.00 63.9000 0.00 6.37E-10 -5.11E-11 0.00 18349. 9.45E+09 1.90E-12 207967. 0.00 64.6100 0.00 2.66E-10 -3.57E-11 0.00 18349. 9.45E+09 1.69E-12 215226. 0.00 65.3200 0.00 1.63E-11 -2.25E-11 0.00 18349. 9.45E+09 1.41E-12 222485. 0.00 66.0300 0.00 -1.31E-10 -1.18E-11 0.00 18349. 9.45E+09 1.11E-12 229744. 0.00 66.7400 0.00 -1.97E-10 -3.65E-12 0.00 18349. 9.45E+09 0.00 237003. 0.00 67.4500 0.00 -2.04E-10 2.01E-12 0.00 18349. 9.45E+09 0.00 244262. 0.00 68.1600 0.00 -1.72E-10 5.42E-12 0.00 18349. 9.45E+09 0.00 251521. 0.00 68.8700 0.00 -1.19E-10 6.79E-12 0.00 18349. 9.45E+09 0.00 258780. 0.00 69.5800 0.00 -6.30E-11 6.31E-12 0.00 18349. 9.45E+09 0.00 266039. 0.00 70.2900 0.00 -1.81E-11 4.05E-12 0.00 18349. 9.45E+09 0.00 273298. 0.00 71.0000 0.00 0.00 0.00 0.00 18349. 9.45E+09 0.00 140279. 0.00
* The above values of total stress are combined axial and bending stresses.
Output Summary for Load Case No. 1:
Pile-head deflection = 0.39400000 inchesComputed slope at pile head = -0.00006781 radiansMaximum bending moment = -1074394. inch-lbsMaximum shear force = 17621. lbsDepth of maximum bending moment = 0.000000 feet below pile headDepth of maximum shear force = 0.000000 feet below pile headNumber of iterations = 15Number of zero deflection points = 12
-------------------------------------------------------------------------------- Summary of Pile-head Responses for Conventional Analyses--------------------------------------------------------------------------------
Definitions of Pile-head Loading Conditions:
Load Type 1: Load 1 = Shear, V, lbs, and Load 2 = Moment, M, in-lbsLoad Type 2: Load 1 = Shear, V, lbs, and Load 2 = Slope, S, radiansLoad Type 3: Load 1 = Shear, V, lbs, and Load 2 = Rot. Stiffness, R, in-lbs/rad.Load Type 4: Load 1 = Top Deflection, y, inches, and Load 2 = Moment, M, in-lbsLoad Type 5: Load 1 = Top Deflection, y, inches, and Load 2 = Slope, S, radians
Load Load Load Axial Pile-head Pile-head Max Shear Max MomentCase Type Pile-head Type Pile-head Loading Deflection Rotation in Pile in Pile No. 1 Load 1 2 Load 2 lbs inches radians lbs in-lbs ---- ----- ---------- ---------- ---------- ---------- ---------- ---------- ---------- ---------- 1 y, in 0.3940 S, rad 0.00 478900. 0.3940 -6.78E-05 17621. -1074394.
Maximum pile-head deflection = 0.394000000 inchesMaximum pile-head rotation = -0.000067807 radians
Page 9
Lpile Bath brunswick Abutment 2 mixed.lp8o
The analysis ended normally.
Page 10
Abutment 2, Mixed - LPile Output
Page 20

Lateral Pile Deflection (inches)D
epth
(ft
)
-0.1 -0.05 0 0.05 0.1 0.15 0.2 0.25 0.3 0.35 0.40
510
1520
2530
3540
4550
5560
6570
7580
Load Case 1
Sand
Soft Clay
Soft Clay
Sand
Lateral Pile Deflection (inches)D
epth
(ft
)
-0.1 -0.05 0 0.05 0.1 0.15 0.2 0.25 0.3 0.35 0.40
510
1520
2530
3540
4550
5560
6570
750
Load Case 1
Sand
Soft Clay
Soft Clay
Sand
Abutment 2, All Sand - LPile Output
Page 21

Bending Moment (in-kips)D
epth
(ft
)
-1400 -1200 -1000 -800 -600 -400 -200 0 200 4000
510
1520
2530
3540
4550
5560
6570
7580
Load Case 1
Sand
Soft Clay
Soft Clay
Sand
Bending Moment (in-kips)D
epth
(ft
)
-1400 -1200 -1000 -800 -600 -400 -200 0 200 4000
510
1520
2530
3540
4550
5560
6570
750
Load Case 1
Sand
Soft Clay
Soft Clay
Sand
Abutment 2, All Sand - LPile Output
Page 22
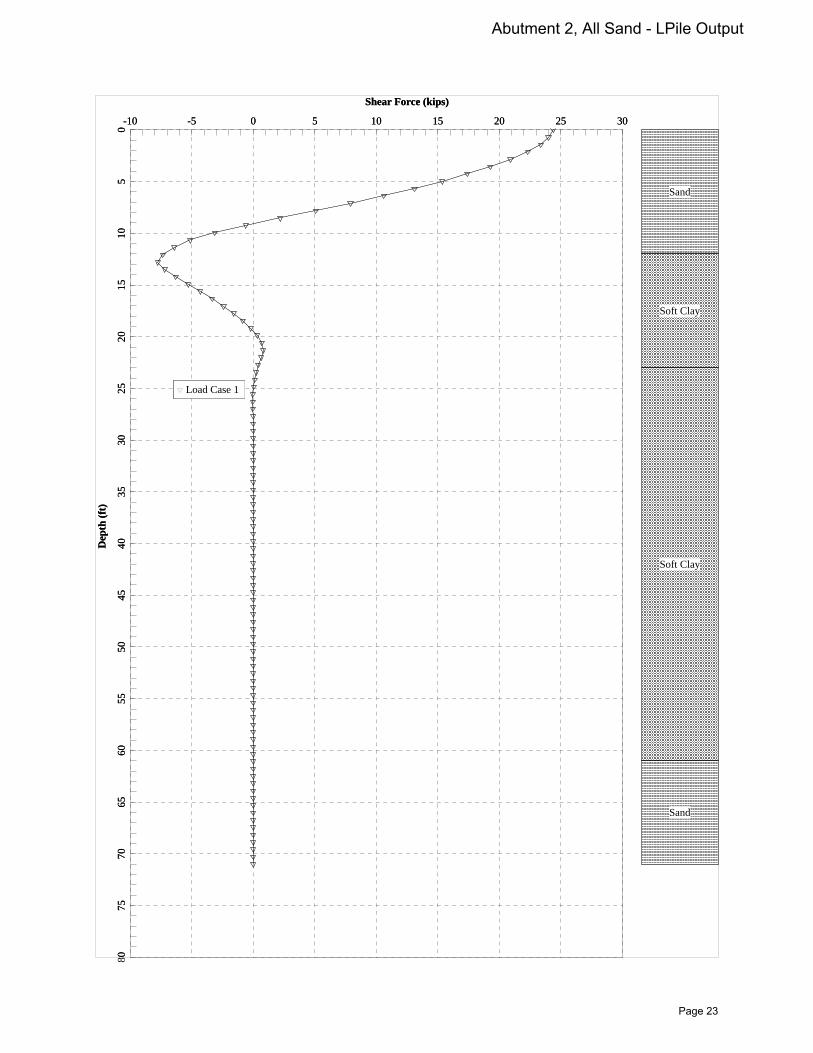
Shear Force (kips)D
epth
(ft
)
-10 -5 0 5 10 15 20 25 300
510
1520
2530
3540
4550
5560
6570
7580
Load Case 1
Sand
Soft Clay
Soft Clay
Sand
Shear Force (kips)D
epth
(ft
)
-10 -5 0 5 10 15 20 25 300
510
1520
2530
3540
4550
5560
6570
750
Load Case 1
Sand
Soft Clay
Soft Clay
Sand
Abutment 2, All Sand - LPile Output
Page 23

Mobilized Soil Reaction (lb/in)D
epth
(ft
)
-400 -350 -300 -250 -200 -150 -100 -50 0 50 100 150 2000
510
1520
2530
3540
4550
5560
6570
7580
Load Case 1
Sand
Soft Clay
Soft Clay
Sand
Mobilized Soil Reaction (lb/in)D
epth
(ft
)
-400 -350 -300 -250 -200 -150 -100 -50 0 50 100 150 2000
510
1520
2530
3540
4550
5560
6570
750
Load Case 1
Sand
Soft Clay
Soft Clay
Sand
Abutment 2, All Sand - LPile Output
Page 24

Lpile Bath brunswick Abutment 2 all sand.lp8o================================================================================
LPile for Windows, Version 2015-08.003
Analysis of Individual Piles and Drilled Shafts Subjected to Lateral Loading Using the p-y Method © 1985-2015 by Ensoft, Inc. All Rights Reserved
================================================================================
This copy of LPile is being used by:
Blaine CardaliGZA
Serial Number of Security Device: 161635470
This copy of LPile is licensed for exclusive use by:
GZA GeoEnvironmental, Inc., Port
Use of this program by any entity other than GZA GeoEnvironmental, Inc., Portis a violation of the software license agreement.
-------------------------------------------------------------------------------- Files Used for Analysis--------------------------------------------------------------------------------
Path to file locations:\09 Jobs\0025900s\09.0025900.00 - MDOT Brunswick-Bath\Work\Calcs\Lpile\
Name of input data file: Lpile Bath brunswick Abutment 2 all sand.lp8d
Name of output report file: Lpile Bath brunswick Abutment 2 all sand.lp8o
Name of plot output file: Lpile Bath brunswick Abutment 2 all sand.lp8p
Name of runtime message file: Lpile Bath brunswick Abutment 2 all sand.lp8r
-------------------------------------------------------------------------------- Date and Time of Analysis--------------------------------------------------------------------------------
Date: December 22, 2015 Time: 12:00:46
Page 1
Lpile Bath brunswick Abutment 2 all sand.lp8o
-------------------------------------------------------------------------------- Problem Title--------------------------------------------------------------------------------
New Meadows Bridge Bath/Brunswick 09.0025900.00 Maine Department of Transportation Blaine Cardali Abutment 1 (BB-NMR-101)
-------------------------------------------------------------------------------- Program Options and Settings--------------------------------------------------------------------------------
Computational Options: - Use unfactored loads in computations (conventional analysis)Engineering Units Used for Data Input and Computations: - US Customary System Units (pounds, feet, inches)
Analysis Control Options: - Maximum number of iterations allowed = 500 - Deflection tolerance for convergence = 1.0000E-05 in - Maximum allowable deflection = 100.0000 in - Number of pile increments = 100
Loading Type and Number of Cycles of Loading: - Static loading specified
- Use of p-y modification factors for p-y curves not selected - No distributed lateral loads are entered - Loading by lateral soil movements acting on pile not selected - Input of shear resistance at the pile tip not selected - Computation of pile-head foundation stiffness matrix not selected - Push-over analysis of pile not selected - Buckling analysis of pile not selected
Output Options:Page 2
Abutment 2, All Sand - LPile Output
Page 25

Lpile Bath brunswick Abutment 2 all sand.lp8o - Output files use decimal points to denote decimal symbols. - Values of pile-head deflection, bending moment, shear force, and soil reaction are printed for full length of pile. - Printing Increment (nodal spacing of output points) = 1 - No p-y curves to be computed and reported for user-specified depths - Print using wide report formats
-------------------------------------------------------------------------------- Pile Structural Properties and Geometry--------------------------------------------------------------------------------
Total number of pile sections = 1
Total length of pile = 71.00 ft
Depth of ground surface below top of pile = 0.00 ft
Pile diameters used for p-y curve computations are defined using 2 points.
p-y curves are computed using pile diameter values interpolated with depth over the length of the pile.
Point Depth Pile X Diameter ft in----- --------- ----------- 1 0.00000 13.80000000 2 71.0000000 13.80000000
Input Structural Properties:----------------------------
Pile Section No. 1:
Section Type = Elastic Pile Cross-sectional Shape = Weak H-Pile Section Length = 71.000000 ft Flange Width = 14.700000 in Section Depth = 13.800000 in Flange Thickness = 0.615000 in Web Thickness = 0.615000 in Section Area = 26.100000 sq. in Moment of Inertia = 325.837265 in^4 Elastic Modulus = 29000000. lbs/in^2
Page 3
Lpile Bath brunswick Abutment 2 all sand.lp8o-------------------------------------------------------------------------------- Ground Slope and Pile Batter Angles--------------------------------------------------------------------------------
Ground Slope Angle = 0.000 degrees = 0.000 radians
Pile Batter Angle = 0.000 degrees = 0.000 radians
-------------------------------------------------------------------------------- Soil and Rock Layering Information--------------------------------------------------------------------------------
The soil profile is modelled using 4 layers
Layer 1 is sand, p-y criteria by Reese et al., 1974
Distance from top of pile to top of layer = 0.0000 ft Distance from top of pile to bottom of layer = 12.000000 ft Effective unit weight at top of layer = 62.000000 pcf Effective unit weight at bottom of layer = 62.000000 pcf Friction angle at top of layer = 35.000000 deg. Friction angle at bottom of layer = 35.000000 deg. Subgrade k at top of layer = 60.000000 pci Subgrade k at bottom of layer = 60.000000 pci
Layer 2 is soft clay, p-y criteria by Matlock, 1970
Distance from top of pile to top of layer = 12.000000 ft Distance from top of pile to bottom of layer = 23.000000 ft Effective unit weight at top of layer = 56.000000 pcf Effective unit weight at bottom of layer = 56.000000 pcf Undrained cohesion at top of layer = 1000.000000 psf Undrained cohesion at bottom of layer = 1000.000000 psf Epsilon-50 at top of layer = 0.008000 Epsilon-50 at bottom of layer = 0.008000
Layer 3 is soft clay, p-y criteria by Matlock, 1970
Distance from top of pile to top of layer = 23.000000 ft Distance from top of pile to bottom of layer = 61.000000 ft Effective unit weight at top of layer = 56.000000 pcf Effective unit weight at bottom of layer = 56.000000 pcf Undrained cohesion at top of layer = 520.000000 psf Undrained cohesion at bottom of layer = 520.000000 psf Epsilon-50 at top of layer = 0.008000 Epsilon-50 at bottom of layer = 0.008000
Page 4
Abutment 2, All Sand - LPile Output
Page 26

Lpile Bath brunswick Abutment 2 all sand.lp8o
Layer 4 is sand, p-y criteria by Reese et al., 1974
Distance from top of pile to top of layer = 61.000000 ft Distance from top of pile to bottom of layer = 71.000000 ft Effective unit weight at top of layer = 67.000000 pcf Effective unit weight at bottom of layer = 67.000000 pcf Friction angle at top of layer = 38.000000 deg. Friction angle at bottom of layer = 38.000000 deg. Subgrade k at top of layer = 100.000000 pci Subgrade k at bottom of layer = 100.000000 pci
(Depth of lowest soil layer extends 0.00 ft below pile tip)
-------------------------------------------------------------------------------- Summary of Input Soil Properties--------------------------------------------------------------------------------
Layer Soil Type Layer Effective Undrained Angle of E50 Layer Name Depth Unit Wt. Cohesion Friction or kpy Num. (p-y Curve Type) ft pcf psf deg. krm pci ----- ------------------- ---------- ---------- ---------- ---------- ---------- ---------- 1 Sand 0.00 62.0000 -- 35.0000 -- 60.0000 (Reese, et al.) 12.0000 62.0000 -- 35.0000 -- 60.0000 2 Soft 12.0000 56.0000 1000.0000 -- 0.00800 -- Clay 23.0000 56.0000 1000.0000 -- 0.00800 -- 3 Soft 23.0000 56.0000 520.0000 -- 0.00800 -- Clay 61.0000 56.0000 520.0000 -- 0.00800 -- 4 Sand 61.0000 67.0000 -- 38.0000 -- 100.0000 (Reese, et al.) 71.0000 67.0000 -- 38.0000 -- 100.0000
-------------------------------------------------------------------------------- Static Loading Type--------------------------------------------------------------------------------
Static loading criteria were used when computing p-y curves for all analyses.
-------------------------------------------------------------------------------- Pile-head Loading and Pile-head Fixity Conditions--------------------------------------------------------------------------------
Number of loads specified = 1
Load Load Condition Condition Axial Thrust Compute Top y No. Type 1 2 Force, lbs vs. Pile Length----- ---- -------------------- ----------------------- ---------------- --------------- 1 5 y = 0.394000 in S = 0.0000 in/in 478900. N.A.
Page 5
Lpile Bath brunswick Abutment 2 all sand.lp8o
V = perpendicular shear force applied to pile headM = bending moment applied to pile heady = lateral deflection relative to pile axisS = pile slope relative to original pile batter angleR = rotational stiffness applied to pile headValues of top y vs. pile lengths can be computed only for load types withspecified shear loading.Axial thrust is assumed to be acting axially for all pile batter angles.
-------------------------------------------------------------------------------- Computations of Nominal Moment Capacity and Nonlinear Bending Stiffness--------------------------------------------------------------------------------
Axial thrust force values were determined from pile-head loading conditions
Number of Pile Sections Analyzed = 1
Pile Section No. 1:-------------------Moment-curvature properties were derived from elastic section properties
-------------------------------------------------------------------------------- Computed Values of Pile Loading and Deflection for Lateral Loading for Load Case Number 1--------------------------------------------------------------------------------
Pile-head conditions are Displacement and Pile-head Rotation (Loading Type 5)Displacement of pile head = 0.394000 inchesRotation of pile head = 0.000E+00 radiansAxial load on pile head = 478900.0 lbs
Depth Deflect. Bending Shear Slope Total Bending Soil Res. Soil Spr. Distrib. X y Moment Force S Stress Stiffness p Es*h Lat. Load feet inches in-lbs lbs radians psi* in-lb^2 lb/inch lb/inch lb/inch ---------- ---------- ---------- ---------- ---------- ---------- ---------- ---------- ---------- ---------- 0.00 0.3940 -1337013. 24386. 0.00 46662. 9.45E+09 0.00 0.00 0.00 0.7100 0.3889 -1128480. 23988. -0.00111 42246. 9.45E+09 -46.7747 1025. 0.00 1.4200 0.3751 -919192. 23360. -0.00203 37814. 9.45E+09 -100.5661 2284. 0.00 2.1300 0.3542 -713822. 22302. -0.00277 33465. 9.45E+09 -147.7268 3554. 0.00 2.8400 0.3278 -516549. 20901. -0.00333 29287. 9.45E+09 -181.2511 4710. 0.00 3.5500 0.2975 -330533. 19250. -0.00371 25348. 9.45E+09 -206.3107 5908. 0.00 4.2600 0.2647 -158277. 17396. -0.00393 21700. 9.45E+09 -228.9383 7370. 0.00 4.9700 0.2306 -2058. 15355. -0.00400 18392. 9.45E+09 -250.1705 9243. 0.00 5.6800 0.1965 136009. 13102. -0.00394 21229. 9.45E+09 -278.5640 12078. 0.00 6.3900 0.1635 253355. 10606. -0.00376 23714. 9.45E+09 -307.3245 16018. 0.00 7.1000 0.1324 347460. 7900. -0.00349 25707. 9.45E+09 -328.0006 21112. 0.00
Page 6
Abutment 2, All Sand - LPile Output
Page 27
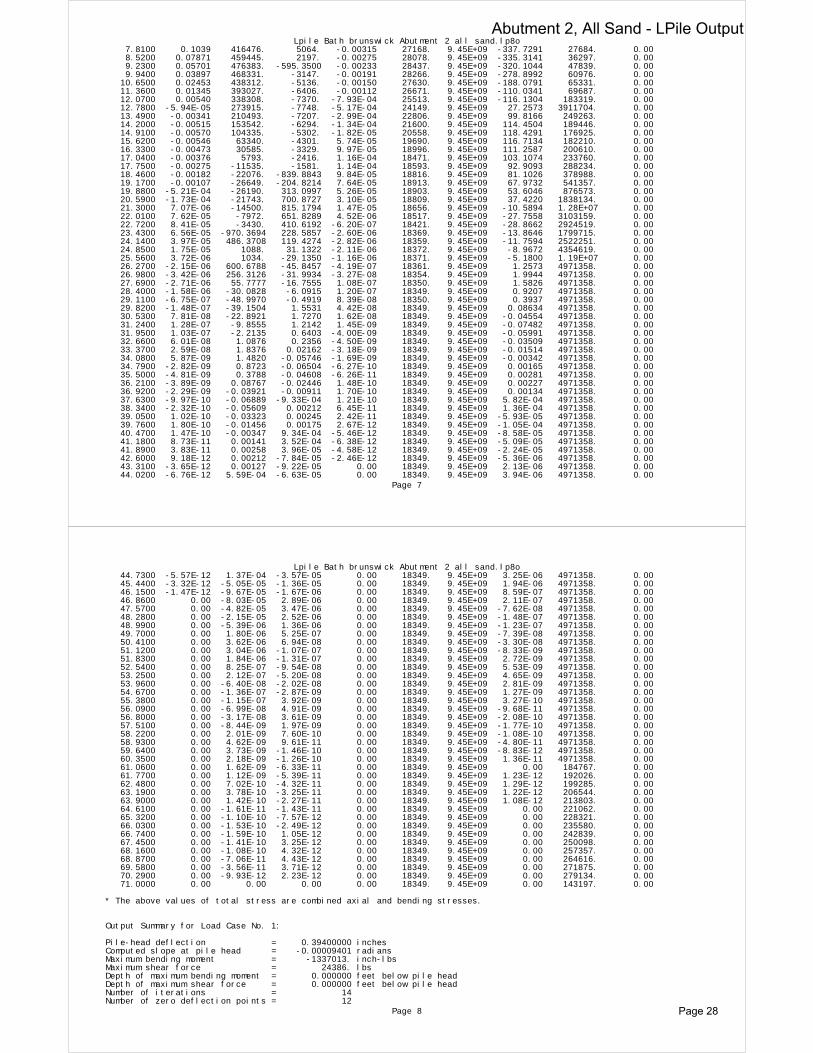
Lpile Bath brunswick Abutment 2 all sand.lp8o 7.8100 0.1039 416476. 5064. -0.00315 27168. 9.45E+09 -337.7291 27684. 0.00 8.5200 0.07871 459445. 2197. -0.00275 28078. 9.45E+09 -335.3141 36297. 0.00 9.2300 0.05701 476383. -595.3500 -0.00233 28437. 9.45E+09 -320.1044 47839. 0.00 9.9400 0.03897 468331. -3147. -0.00191 28266. 9.45E+09 -278.8992 60976. 0.00 10.6500 0.02453 438312. -5136. -0.00150 27630. 9.45E+09 -188.0791 65331. 0.00 11.3600 0.01345 393027. -6406. -0.00112 26671. 9.45E+09 -110.0341 69687. 0.00 12.0700 0.00540 338308. -7370. -7.93E-04 25513. 9.45E+09 -116.1304 183319. 0.00 12.7800 -5.94E-05 273915. -7748. -5.17E-04 24149. 9.45E+09 27.2573 3911704. 0.00 13.4900 -0.00341 210493. -7207. -2.99E-04 22806. 9.45E+09 99.8166 249263. 0.00 14.2000 -0.00515 153542. -6294. -1.34E-04 21600. 9.45E+09 114.4504 189446. 0.00 14.9100 -0.00570 104335. -5302. -1.82E-05 20558. 9.45E+09 118.4291 176925. 0.00 15.6200 -0.00546 63340. -4301. 5.74E-05 19690. 9.45E+09 116.7134 182210. 0.00 16.3300 -0.00473 30585. -3329. 9.97E-05 18996. 9.45E+09 111.2587 200610. 0.00 17.0400 -0.00376 5793. -2416. 1.16E-04 18471. 9.45E+09 103.1074 233760. 0.00 17.7500 -0.00275 -11535. -1581. 1.14E-04 18593. 9.45E+09 92.9093 288234. 0.00 18.4600 -0.00182 -22076. -839.8843 9.84E-05 18816. 9.45E+09 81.1026 378988. 0.00 19.1700 -0.00107 -26649. -204.8214 7.64E-05 18913. 9.45E+09 67.9732 541357. 0.00 19.8800 -5.21E-04 -26190. 313.0997 5.26E-05 18903. 9.45E+09 53.6046 876573. 0.00 20.5900 -1.73E-04 -21743. 700.8727 3.10E-05 18809. 9.45E+09 37.4220 1838134. 0.00 21.3000 7.07E-06 -14500. 815.1794 1.47E-05 18656. 9.45E+09 -10.5894 1.28E+07 0.00 22.0100 7.62E-05 -7972. 651.8289 4.52E-06 18517. 9.45E+09 -27.7558 3103159. 0.00 22.7200 8.41E-05 -3430. 410.6192 -6.20E-07 18421. 9.45E+09 -28.8662 2924519. 0.00 23.4300 6.56E-05 -970.3694 228.5857 -2.60E-06 18369. 9.45E+09 -13.8646 1799715. 0.00 24.1400 3.97E-05 486.3708 119.4274 -2.82E-06 18359. 9.45E+09 -11.7594 2522251. 0.00 24.8500 1.75E-05 1088. 31.1322 -2.11E-06 18372. 9.45E+09 -8.9672 4354619. 0.00 25.5600 3.72E-06 1034. -29.1350 -1.16E-06 18371. 9.45E+09 -5.1800 1.19E+07 0.00 26.2700 -2.15E-06 600.6788 -45.8457 -4.19E-07 18361. 9.45E+09 1.2573 4971358. 0.00 26.9800 -3.42E-06 256.3126 -31.9934 -3.27E-08 18354. 9.45E+09 1.9944 4971358. 0.00 27.6900 -2.71E-06 55.7777 -16.7555 1.08E-07 18350. 9.45E+09 1.5826 4971358. 0.00 28.4000 -1.58E-06 -30.0828 -6.0915 1.20E-07 18349. 9.45E+09 0.9207 4971358. 0.00 29.1100 -6.75E-07 -48.9970 -0.4919 8.39E-08 18350. 9.45E+09 0.3937 4971358. 0.00 29.8200 -1.48E-07 -39.1504 1.5531 4.42E-08 18349. 9.45E+09 0.08634 4971358. 0.00 30.5300 7.81E-08 -22.8921 1.7270 1.62E-08 18349. 9.45E+09 -0.04554 4971358. 0.00 31.2400 1.28E-07 -9.8555 1.2142 1.45E-09 18349. 9.45E+09 -0.07482 4971358. 0.00 31.9500 1.03E-07 -2.2135 0.6403 -4.00E-09 18349. 9.45E+09 -0.05991 4971358. 0.00 32.6600 6.01E-08 1.0876 0.2356 -4.50E-09 18349. 9.45E+09 -0.03509 4971358. 0.00 33.3700 2.59E-08 1.8376 0.02162 -3.18E-09 18349. 9.45E+09 -0.01514 4971358. 0.00 34.0800 5.87E-09 1.4820 -0.05746 -1.69E-09 18349. 9.45E+09 -0.00342 4971358. 0.00 34.7900 -2.82E-09 0.8723 -0.06504 -6.27E-10 18349. 9.45E+09 0.00165 4971358. 0.00 35.5000 -4.81E-09 0.3788 -0.04608 -6.26E-11 18349. 9.45E+09 0.00281 4971358. 0.00 36.2100 -3.89E-09 0.08767 -0.02446 1.48E-10 18349. 9.45E+09 0.00227 4971358. 0.00 36.9200 -2.29E-09 -0.03921 -0.00911 1.70E-10 18349. 9.45E+09 0.00134 4971358. 0.00 37.6300 -9.97E-10 -0.06889 -9.33E-04 1.21E-10 18349. 9.45E+09 5.82E-04 4971358. 0.00 38.3400 -2.32E-10 -0.05609 0.00212 6.45E-11 18349. 9.45E+09 1.36E-04 4971358. 0.00 39.0500 1.02E-10 -0.03323 0.00245 2.42E-11 18349. 9.45E+09 -5.93E-05 4971358. 0.00 39.7600 1.80E-10 -0.01456 0.00175 2.67E-12 18349. 9.45E+09 -1.05E-04 4971358. 0.00 40.4700 1.47E-10 -0.00347 9.34E-04 -5.46E-12 18349. 9.45E+09 -8.58E-05 4971358. 0.00 41.1800 8.73E-11 0.00141 3.52E-04 -6.38E-12 18349. 9.45E+09 -5.09E-05 4971358. 0.00 41.8900 3.83E-11 0.00258 3.96E-05 -4.58E-12 18349. 9.45E+09 -2.24E-05 4971358. 0.00 42.6000 9.18E-12 0.00212 -7.84E-05 -2.46E-12 18349. 9.45E+09 -5.36E-06 4971358. 0.00 43.3100 -3.65E-12 0.00127 -9.22E-05 0.00 18349. 9.45E+09 2.13E-06 4971358. 0.00 44.0200 -6.76E-12 5.59E-04 -6.63E-05 0.00 18349. 9.45E+09 3.94E-06 4971358. 0.00
Page 7
Lpile Bath brunswick Abutment 2 all sand.lp8o 44.7300 -5.57E-12 1.37E-04 -3.57E-05 0.00 18349. 9.45E+09 3.25E-06 4971358. 0.00 45.4400 -3.32E-12 -5.05E-05 -1.36E-05 0.00 18349. 9.45E+09 1.94E-06 4971358. 0.00 46.1500 -1.47E-12 -9.67E-05 -1.67E-06 0.00 18349. 9.45E+09 8.59E-07 4971358. 0.00 46.8600 0.00 -8.03E-05 2.89E-06 0.00 18349. 9.45E+09 2.11E-07 4971358. 0.00 47.5700 0.00 -4.82E-05 3.47E-06 0.00 18349. 9.45E+09 -7.62E-08 4971358. 0.00 48.2800 0.00 -2.15E-05 2.52E-06 0.00 18349. 9.45E+09 -1.48E-07 4971358. 0.00 48.9900 0.00 -5.39E-06 1.36E-06 0.00 18349. 9.45E+09 -1.23E-07 4971358. 0.00 49.7000 0.00 1.80E-06 5.25E-07 0.00 18349. 9.45E+09 -7.39E-08 4971358. 0.00 50.4100 0.00 3.62E-06 6.94E-08 0.00 18349. 9.45E+09 -3.30E-08 4971358. 0.00 51.1200 0.00 3.04E-06 -1.07E-07 0.00 18349. 9.45E+09 -8.33E-09 4971358. 0.00 51.8300 0.00 1.84E-06 -1.31E-07 0.00 18349. 9.45E+09 2.72E-09 4971358. 0.00 52.5400 0.00 8.25E-07 -9.54E-08 0.00 18349. 9.45E+09 5.53E-09 4971358. 0.00 53.2500 0.00 2.12E-07 -5.20E-08 0.00 18349. 9.45E+09 4.65E-09 4971358. 0.00 53.9600 0.00 -6.40E-08 -2.02E-08 0.00 18349. 9.45E+09 2.81E-09 4971358. 0.00 54.6700 0.00 -1.36E-07 -2.87E-09 0.00 18349. 9.45E+09 1.27E-09 4971358. 0.00 55.3800 0.00 -1.15E-07 3.92E-09 0.00 18349. 9.45E+09 3.27E-10 4971358. 0.00 56.0900 0.00 -6.99E-08 4.91E-09 0.00 18349. 9.45E+09 -9.68E-11 4971358. 0.00 56.8000 0.00 -3.17E-08 3.61E-09 0.00 18349. 9.45E+09 -2.08E-10 4971358. 0.00 57.5100 0.00 -8.44E-09 1.97E-09 0.00 18349. 9.45E+09 -1.77E-10 4971358. 0.00 58.2200 0.00 2.01E-09 7.60E-10 0.00 18349. 9.45E+09 -1.08E-10 4971358. 0.00 58.9300 0.00 4.62E-09 9.61E-11 0.00 18349. 9.45E+09 -4.80E-11 4971358. 0.00 59.6400 0.00 3.73E-09 -1.46E-10 0.00 18349. 9.45E+09 -8.83E-12 4971358. 0.00 60.3500 0.00 2.18E-09 -1.26E-10 0.00 18349. 9.45E+09 1.36E-11 4971358. 0.00 61.0600 0.00 1.62E-09 -6.33E-11 0.00 18349. 9.45E+09 0.00 184767. 0.00 61.7700 0.00 1.12E-09 -5.39E-11 0.00 18349. 9.45E+09 1.23E-12 192026. 0.00 62.4800 0.00 7.02E-10 -4.32E-11 0.00 18349. 9.45E+09 1.29E-12 199285. 0.00 63.1900 0.00 3.78E-10 -3.25E-11 0.00 18349. 9.45E+09 1.22E-12 206544. 0.00 63.9000 0.00 1.42E-10 -2.27E-11 0.00 18349. 9.45E+09 1.08E-12 213803. 0.00 64.6100 0.00 -1.61E-11 -1.43E-11 0.00 18349. 9.45E+09 0.00 221062. 0.00 65.3200 0.00 -1.10E-10 -7.57E-12 0.00 18349. 9.45E+09 0.00 228321. 0.00 66.0300 0.00 -1.53E-10 -2.49E-12 0.00 18349. 9.45E+09 0.00 235580. 0.00 66.7400 0.00 -1.59E-10 1.05E-12 0.00 18349. 9.45E+09 0.00 242839. 0.00 67.4500 0.00 -1.41E-10 3.25E-12 0.00 18349. 9.45E+09 0.00 250098. 0.00 68.1600 0.00 -1.08E-10 4.32E-12 0.00 18349. 9.45E+09 0.00 257357. 0.00 68.8700 0.00 -7.06E-11 4.43E-12 0.00 18349. 9.45E+09 0.00 264616. 0.00 69.5800 0.00 -3.56E-11 3.71E-12 0.00 18349. 9.45E+09 0.00 271875. 0.00 70.2900 0.00 -9.93E-12 2.23E-12 0.00 18349. 9.45E+09 0.00 279134. 0.00 71.0000 0.00 0.00 0.00 0.00 18349. 9.45E+09 0.00 143197. 0.00
* The above values of total stress are combined axial and bending stresses.
Output Summary for Load Case No. 1:
Pile-head deflection = 0.39400000 inchesComputed slope at pile head = -0.00009401 radiansMaximum bending moment = -1337013. inch-lbsMaximum shear force = 24386. lbsDepth of maximum bending moment = 0.000000 feet below pile headDepth of maximum shear force = 0.000000 feet below pile headNumber of iterations = 14Number of zero deflection points = 12
Page 8
Abutment 2, All Sand - LPile Output
Page 28

Lpile Bath brunswick Abutment 2 all sand.lp8o
-------------------------------------------------------------------------------- Summary of Pile-head Responses for Conventional Analyses--------------------------------------------------------------------------------
Definitions of Pile-head Loading Conditions:
Load Type 1: Load 1 = Shear, V, lbs, and Load 2 = Moment, M, in-lbsLoad Type 2: Load 1 = Shear, V, lbs, and Load 2 = Slope, S, radiansLoad Type 3: Load 1 = Shear, V, lbs, and Load 2 = Rot. Stiffness, R, in-lbs/rad.Load Type 4: Load 1 = Top Deflection, y, inches, and Load 2 = Moment, M, in-lbsLoad Type 5: Load 1 = Top Deflection, y, inches, and Load 2 = Slope, S, radians
Load Load Load Axial Pile-head Pile-head Max Shear Max MomentCase Type Pile-head Type Pile-head Loading Deflection Rotation in Pile in Pile No. 1 Load 1 2 Load 2 lbs inches radians lbs in-lbs ---- ----- ---------- ---------- ---------- ---------- ---------- ---------- ---------- ---------- 1 y, in 0.3940 S, rad 0.00 478900. 0.3940 -9.40E-05 24386. -1337013.
Maximum pile-head deflection = 0.394000000 inchesMaximum pile-head rotation = -0.000094012 radians
The analysis ended normally.
Page 9
Abutment 2, All Sand - LPile Output
Page 29

Design Maps Detailed Report
From Figure 3.4.1-2 [1]
From Figure 3.4.1-3 [2]
From Figure 3.4.1-4 [3]
2009 AASHTO Guide Specifications for LRFD Seismic Bridge Design (43.93124°N, 69.86142°W)
Site Class E – “Soft Clay Soil”
Article 3.4.1 — Design Spectra Based on General Procedure
Note: Maps in the 2009 AASHTO Specifications are provided by AASHTO for Site Class B. Adjustments for other Site Classes are made, as needed, in Article 3.4.2.3.
PGA = 0.076 g
SS = 0.157 g
S1 = 0.044 g
Page 1 of 6Design Maps Detailed Report
1/5/2016http://ehp2-earthquake.wr.usgs.gov/designmaps/us/report.php?template=minimal&latitude=...

Article 3.4.2.1 — Site Class Definitions
The authority having jurisdiction (not the USGS), site-specific geotechnical data, and/or the default has classified the site as Site Class E, based on the site soil properties in accordance with Article 3.4.2.
Table 3.4.2.1–1 Site Class Definitions
SITE CLASS
SOIL PROFILE NAME
Soil shear wave velocity, vS, (ft/s)
Standard penetration resistance, N
Soil undrained shear strength, su, (psf)
A Hard rock vS > 5,000 N/A N/A
B Rock 2,500 < vS ≤ 5,000 N/A N/A
C Very dense soil and soft rock
1,200 < vS ≤ 2,500 N > 50 >2,000 psf
D Stiff soil profile 600 ≤ vS < 1,200 15 ≤ N ≤ 50 1,000 to 2,000 psf
E Stiff soil profile vS < 600 N < 15 <1,000 psf
E — Any profile with more than 10 ft of soil having the characteristics:
1. Plasticity index PI > 20,2. Moisture content w ≥ 40%, and3. Undrained shear strength su < 500 psf
F — Any profile containing soils having one or more of the following characteristics:
1. Soils vulnerable to potential failure or collapse under seismic loading such as liquefiable soils, quick and highly sensitive clays, collapsible weakly cemented soils.
2. Peats and/or highly organic clays (H > 10 feet of peat and/or highly organic clay where H = thickness of soil)
3. Very high plasticity clays (H > 25 feet with plasticity index PI > 75) 4. Very thick soft/medium stiff clays (H > 120 feet)
For SI: 1ft/s = 0.3048 m/s 1lb/ft² = 0.0479 kN/m²
Page 2 of 6Design Maps Detailed Report
1/5/2016http://ehp2-earthquake.wr.usgs.gov/designmaps/us/report.php?template=minimal&latitude=...

Article 3.4.2.3 — Site Coefficients
Table 3.4.2.3-1 (for Fpga)—Values of Fpga as a Function of Site Class and Mapped Peak Ground Acceleration Coefficient
Site Class
Mapped Peak Ground Acceleration
PGA ≤ 0.10
PGA = 0.20
PGA = 0.30
PGA = 0.40
PGA ≥ 0.50
A 0.8 0.8 0.8 0.8 0.8
B 1.0 1.0 1.0 1.0 1.0
C 1.2 1.2 1.1 1.0 1.0
D 1.6 1.4 1.2 1.1 1.0
E 2.5 1.7 1.2 0.9 0.9
F See AASHTO Article 3.4.3
Note: Use straight–line interpolation for intermediate values of PGA
For Site Class = E and PGA = 0.076 g, FPGA = 2.500
Table 3.4.2.3-1 (for Fa)—Values of Fa as a Function of Site Class and Mapped Short-Period Spectral Acceleration Coefficient
Site Class Spectral Response Acceleration Parameter at Short Periods
SS ≤ 0.25 SS = 0.50 SS = 0.75 SS = 1.00 SS ≥ 1.25
A 0.8 0.8 0.8 0.8 0.8
B 1.0 1.0 1.0 1.0 1.0
C 1.2 1.2 1.1 1.0 1.0
D 1.6 1.4 1.2 1.1 1.0
E 2.5 1.7 1.2 0.9 0.9
F See AASHTO Article 3.4.3
Note: Use straight–line interpolation for intermediate values of SS
For Site Class = E and SS = 0.157 g, Fa = 2.500
Page 3 of 6Design Maps Detailed Report
1/5/2016http://ehp2-earthquake.wr.usgs.gov/designmaps/us/report.php?template=minimal&latitude=...

Equation (3.4.1-1):
Equation (3.4.1-2):
Equation (3.4.1-3):
Table 3.4.2.3-2—Values of Fv as a Function of Site Class and Mapped 1-sec Period Spectral Acceleration Coefficient
Site Class Mapped Spectral Response Acceleration Coefficient at 1-sec Periods
S1 ≤ 0.10 S1 = 0.20 S1 = 0.30 S1 = 0.40 S1 ≥ 0.50
A 0.8 0.8 0.8 0.8 0.8
B 1.0 1.0 1.0 1.0 1.0
C 1.7 1.6 1.5 1.4 1.3
D 2.4 2.0 1.8 1.6 1.5
E 3.5 3.2 2.8 2.4 2.4
F See AASHTO Article 3.4.3
Note: Use straight–line interpolation for intermediate values of S1
For Site Class = E and S1 = 0.044 g, Fv = 3.500
AS = FPGA PGA = 2.500 x 0.076 = 0.190 g
SDS = Fa SS = 2.500 x 0.157 = 0.393 g
SD1 = Fv S1 = 3.500 x 0.044 = 0.153 g
Figure 3.4.1-1: Design Response Spectrum
Page 4 of 6Design Maps Detailed Report
1/5/2016http://ehp2-earthquake.wr.usgs.gov/designmaps/us/report.php?template=minimal&latitude=...

Article 3.5 - Selection of Seismic Design Category (SDC)
Table 3.5-1—Partitions for Seismic Design Categories A, B, C, and D
VALUE OF SD1 SDC
SD1 < 0.15g A
0.15g ≤ SD1 < 0.30g B
0.30g ≤ SD1 < 0.50g C
0.50g ≤ SD1 D
For SD1 = 0.153 g, Seismic Design Category = B
Seismic Design Category ≡ “the design category in accordance with Table 3.5-1” = B
Page 5 of 6Design Maps Detailed Report
1/5/2016http://ehp2-earthquake.wr.usgs.gov/designmaps/us/report.php?template=minimal&latitude=...

References
1. Figure 3.4.1-2: http://earthquake.usgs.gov/hazards/designmaps/downloads/pdfs/AASHTO-2009-Figure-3.4.1-2.pdf
2. Figure 3.4.1-3: http://earthquake.usgs.gov/hazards/designmaps/downloads/pdfs/AASHTO-2009-Figure-3.4.1-3.pdf
3. Figure 3.4.1-4: http://earthquake.usgs.gov/hazards/designmaps/downloads/pdfs/AASHTO-2009-Figure-3.4.1-4.pdf
Page 6 of 6Design Maps Detailed Report
1/5/2016http://ehp2-earthquake.wr.usgs.gov/designmaps/us/report.php?template=minimal&latitude=...