Embed Size (px)
Citation preview

1
Geotechnical assessment of subgrade and sub-base quality for the design
and construction of road pavement in parts of the coastal section of
Akwa Ibom State, Eastern Niger Delta, Nigeria.
Fidelis Ankwo Abija
1. Centre for Geomechanics, Energy and Environmental Sustainability, Port Harcourt, Nigeria. 2. Mcfaas Int'l Projects Ltd, Km 20 Airport Road, Igwuruta, Port Harcourt, Nigeria. *Corresponding author: +234-8038962622, Email:[email protected],
ABSTRACT Pre-design and construction geotechnical assessment of subgrade and sub-base materials was carried out for optimal performance and pavement sustainability. Method involved boring of 59holes and trial pits, sampling and geotechnical testing. Soil profile indicates a top inorganic clay layer (CL) from surface to an average depth of 0.55m, a silty sand layer (ML and MH) to 1.1m and a poorly graded sand layer (SP) to 2.0m. Subgrades classify as USCS CL – CI clays, AASHTO A3, A-2-4, A-2-6, A-2-7, A-7-6, A-7-5 with 58.85% of the subgrades rated as poor to fair and 41.15% good to excellent. Subgrades clay activity varies from 0.8 to 41.25 and expansivity from 4.83 to 68.90 indicating presence of extra - sensitivity and quick and expansive clays, 48hours soaked CBR from 7% to 38% and surface modulus (Es) from 61.5 MPa to 168.14 MPa. Subbase fills have moisture content, liquid limit, plastic limit and plasticity index of 15 – 20%, 24 – 34%, 13 – 22% and 9 – 15 respectively, composed of 29.8% fines (clay and silt classes) and 70.2% sands; AASHTO classified as A-2-6 and rated excellent to good; 48hours soaked CBR of 17.0 – 39.0% and un-soaked CBR of 30 – 58 depicting a 10.0% – 62.0% reduction in strength. The resilient modulus vary from 206.84 – 537.78 (MN/m
2), grading modulus from 0.67 – 1.04, and plasticity modulus
from 603.0(MPa) – 1395.0(MPa). Pavement thickness has been recommended to be 300 – 350mm based on CBR and group index and coarse granular subbbases of sand and gravely materials for egress of moisture to improve road bed effective stress.
KEYWORDS: Subgrades, sub-bases, geotechnical properties, pavement, Eastern Niger Delta.
I. INTRODUCTION
Road pavements are a key means of transportation forming the fabric of modern day urbanization. It represent significant infrastructure that is critical to the development and economic growth rate of any geographic location [1-2] Road pavements whether rigid or flexible,
are built on the in situ subgrades which provide good support, limit pavement deflections to acceptable standards, minimize differential movement due to frost and shrinkage and or swelling
soils, and promote uniformity of support for good long term performance [3]. Soils are also used as sub-base layer fill materials and these heterogeneous and often anisotropic aggregates of mineral grains vary markedly in composition and gradation making the predictability of their
engineering behaviour and performance in response to imposed loads under natural consistency in time and space impossible. The stability of any structure depend on the material composition
and for roads, subgrade strength, degree of saturation and expected behaviour under saturated conditions control the stability, performance and longevity of the pavement infrastructure. [4] has recognized the dependence of subgrade strength on the geology of the site which imparts on
the pavement among other factors such as traffic stress, earthwork adequacy, protection from floods and wave erosion, surface and subsurface drainage systems, cross drainage etc.
The geotechnical properties of in situ soils directly affect not only the pavement structure design but dictate the type of pavement most suited to a location.
International Journal of Scientific & Engineering Research Volume 10, Issue 7, July-2019 ISSN 2229-5518
1864
IJSER © 2019 http://www.ijser.org
IJSER

2
[5] noted that the suitability of a soil for road design requires adequate knowledge of its properties and the factors affecting their behavior and response of the soils.
A subgrades response load is controlled by its composition and environmental factors such as rainfall and temperatures which are climatic factors because these control the amount of moisture,
shear strength, pore water pressure and effective stress.
Subgrade strength and traffic load have been reported by [7] to be the most important factors in
the structural design of pavements whether rigid or flexible. Subgrades provide foundation for the pavement and serves the main purpose of the distributing the applied vehicle loads without causing
distress in the foundation layers or in the overlying layers during construction where the stresses will be applied by delivery vehicles, pavers and other construction plant.
The strength and material thickness of the foundation subgrade and subbase layers must be sufficiently high enough to withstand load without damage. A designer cannot change the subgrade and is constrained to design to in situ soil conditions but choice of the subbase fill
materials must be such that it possesses sufficient strength to sustain traffic loads and be of uniform and constant quality to spread and compact easily.
Subgrades layers also have to be either protected from, or to be of sufficient durability to withstand environmental effects from rain, frost, high temperature etc. without sustaining
damage which may be caused by rutting or other uneven deformation, cracking in hydraulically bound mixtures or other forms of material specific degradation. Pavement foundations must possess sufficient stiffness to carry the stress from the overlying pavement layers to be placed
and adequately compacted. It must be capable of absorbing large numbers of repeated loads from traffic during its service life; and deterioration due to water ingress especially if the upper pavement layers begin to crack. It is also essential that excessive deformation does not
accumulate within the foundation under repeated traffic loading, since this is a potential source of wheel path rutting at the pavement surface [8].
Pavement's performance is thus fundamentally linked with its constituent material layers among other factors such as construction methods, environment, maintenance and rehabilitation.
The design of road pavement seeks to address the problem of construction cost, road quality and cost of maintenance. In addressing the aforesaid, traffic loading, subgrade strength, character of construction materials, drainage, performance and safety reliability are the key factors.
Consequently, the designer of a road pavement infrastructure has no choice of the subgrade and has to choose his design based on the in-situ subgrade characteristics. This stresses the
importance of adequate geotechnical investigation and correct interpretation o f results for design applications [9] and sadly this has been neglected in Nigeria and most designs are based on predictions and insufficient information leading to partial or total difference between the design
and site specific conditions. This necessitates quality assessment of subgrade soils as a pre-design and construction requirement to determine inter alia, the design criteria, life, and
minimum acceptable serviceability level of the infrastructure. It helps to guide the method of construction, selection of suitable materials for use as sub-base and base courses as well as the thickness of the bituminous layer. A detailed geotechnical investigation and correctly interpreted
results determine design strength of the subgrade under soaked conditions, specifies compaction density at the optimum moisture content, effective modulus of subgrade, elastic and resilient
moduli, drainage conditions and stabilization requirements. It also identifies the most suitable material for use as subbase layer suitable for the specific in situ road bed foundation. All of these parameters are factored into the design [3].
International Journal of Scientific & Engineering Research Volume 10, Issue 7, July-2019 ISSN 2229-5518
1865
IJSER © 2019 http://www.ijser.org
IJSER

3
Investigations have shown that most premature road failures in Nigeria especially in the coastal Niger Delta are attributed to weak subgrades, its susceptibility to perennial flooding and
pavement deterioration due to excessive surface and groundwater, subgrade compression, settlement, wet land swamps, marshes and bogs of low bearing capacity, poor drainage
characteristics [10]. Several researchers amongst who are [11 - 15] have reported on the weak bearing soils that form the foundation materials of the Niger Delta region. The use of lateritic materials as subbase fills
has been the common construction practice but [16] has reported that the so called laterites which become soft when wet and significantly hard when air-dried could not be called laterite
soils because of the high silica-sesquioxide ratios. [17] also observed that there is a paucity of data on surficial Niger Delta soils relative to the deeper subsurface due to exploration and production activities of International Oil Companies.
The area of study is on the Eastern flank of the Niger Delta with an estimated traffic volume >1000 vehicles per day rated as high and corresponding to >500,000 equivalent standard axial
loads owing to the exploration and production activities of major International Oil Companies, service companies and high population density. This traffic volume has impacted heavily on the road infrastructure resulting to frequent failures. This geotechnical characterization of the
materials underlying the area was a commissioned study to ensure quality in design and construction for optimal stability and performance of the pavement infrastructure.
II. STUDY LOCATION
The Niger Delta falls under the three geomorphic zones including the coastal or lower delta zone,
Transition or Mangrove zone and the Upper deltaic plain or freshwater zone. The freshwater zone consists of dry flatlands and plains with abundant fresh water swamps, meander belts, and
alluvial swamps, salts and mangrove swamps, and active/abandoned coastal ridges [11, 18]. It is a tropical rainforest area with wet season (April - October) and dry (November - March) with occasional rains during the dry season. The mean ra infall varies from 2000mm to over
4000mm at the coastal with about 85% occurring in wet season. It falls under zone 4 of Nigeria's climatological zones with the highest rainfall of 1,185 – 2,788mm under warm and humid
climate (Fig. 1) [4]. The climate of Nigeria coast is tropical equatorial with rainfall intensity being highest (≥3500mm) between April and October, the values being 5 - 7 times higher than in November to
March (500mm). Temperatures range on average, between 26 and 270C during the dry months of February to March and about 240C during wet months of June and September. Daily
temperatures oscillate between 310C and 230C in the dry season. Highest average values of humidity reach 90% in August as against an average minimum of 74% in February [19]. Geologically, it is a sedimentary structure of clastic fills . The basin, one of the largest regressive
deltas is estimated to cover an area of 300,000 km2 with a sediment volume of 500,000 km3 [20]
and a sediment thickness of over 10 km in the basin depocenter [21].
The lithostratigraphic sequences are the basal Akata shale Formation, middle intercalated
sandstone/shale Agbada Formation and Benin sands and sandstone Formation each of
which range from Tertiary to Recent [22]. Most civil engineering structures are found within deltaic alluvium of the coastal plains sands made up of sands and clay of the quaternary deposits of the basin.
The study area is located between latitude 4°331 and 4°451 and longitude 7°521 and 8°021 within Eket and Esit Eket areas, on the Eastern flank of the Niger Delta has not received
International Journal of Scientific & Engineering Research Volume 10, Issue 7, July-2019 ISSN 2229-5518
1866
IJSER © 2019 http://www.ijser.org
IJSER

4
adequate geotechnical studies attention. The site’s subsoil conditions reveal general average top soil strata ranging from 0 - 300mm depth underlain by predominantly fine to medium density
clays deposited from coastal influence. This deposit continues as homogenous mixture of loose fine to medium silt with occasional clay content to a depth of 2m.
III. METHODS OF STUDY
3.1 Field and laboratory methods
Field sampling was achieved through the boring of 63 holes using hand auger and trial pits. Soil samples were taken at 1.0m, 1.2, 1.5 and 2.0m depths based on change in soil profile and the
specification of 2.0 – 3.0m depth for roads [23]. All samples were roughly examined, described and prepared for laboratory analysis. Geotechnical laboratory tests carried out were in accordance with standard geotechnical engineering practice and the [24] specifications. Soil's
index properties tests include particle size distribution, Atterberg limits, moisture content, density, and specific gravity. Moisture - density relationship was tested by the standard proctor
compaction method, while the soaked California Bearing Ratio was determined for subgrades and for sub-base materials. Sample soaking aimed at simulating field conditions during the wet periods, was carried out for 48hours in accordance with BS 1377 (1990). S ubgrade samples for
Particle size distribution test were first washed in ASTM sieve number 200 before being mechanically sieved. All materials passing sieve number 200 were subjected to hydrometer test
to determine the clay fractions as most problems caused by road failures are due to clay. Soil compaction test was done using the West African Standard (WASC) Proctor test to predict the moisture density behavior.
3.2 Methods of Data Analysis
3.2.1 Evaluation of subgrade Quality
Subgrade quality assessment was evaluated based on the Group Index (G.I.) (eqn. 1), California bearing ratio (CBR), elastic modulus (eqn. 2), subgrade surface modulus (eqn. 3) [3], and
resilient modulus (eqn. 4) and specific gravity. The compaction behavior of both subgrade and sub-base materials were also evaluated using the AASHTO WASC compaction and moisture
density relationships. G. I. = (F200 – 35)[0.2 +0.05(LL-50)] + 0.01(F200 – 15)(Ip – 10) ……………… (1)
Subgrade surface modulus
Es = 17.6(CBR)0.64 .. …….………….. (2)
Elastic modulus (E)
E = 10(CBR) in MPa ……..…. (3)
Resilient modulus (MR) = 10.342(CBR) in MN/m2 ………….……… (4)
International Journal of Scientific & Engineering Research Volume 10, Issue 7, July-2019 ISSN 2229-5518
1867
IJSER © 2019 http://www.ijser.org
IJSER

5
Fig. 1: Map of Nigeria showing study location and the climatological zones
Clay Activity and Expansivity
The activity and or expansivity of clayey soils largely influence their volume change behavior. Active and expansive soils are found extensively in tropical areas and their
presence greatly affects construction activities and the performance of the structure
during its service life. Expansive soils are characterized by the presence of large amounts
of high activity montmorillinitic clay minerals which are causes of pronounced volume
changes. [25] noted that the activity of a soil depend on its clay content and the plasticity
index and expansivity have been reported to be control by plasticity and amount of
medium sand composition in the soil [26] thus determination of these properties of soils
is fundamental in because of the preponderance of such soils in the tropics and the high
rainfall is very essential.
Many criteria are available to identify and characterize active and expansive soils most of
which are based on the soils consistency characteristics such as liquid limit, plasticity
index, shrinkage limit, and shrinkage index. In this studies, subgrade activity and
expansivity were determined using equation (5) [25] and equation (6) [26]. A = plasticity Index …… (5) % clay PIw = Ip x F0.425 …………. (6)
100
International Journal of Scientific & Engineering Research Volume 10, Issue 7, July-2019 ISSN 2229-5518
1868
IJSER © 2019 http://www.ijser.org
IJSER

6
Where
F0.425 = % medium sand, Ip = plasticity index,
3.2.2 Evaluation of Subbase Quality
The road base layers form backbone of the road pavement and its per formance dictates the performance and longevity of the roadway. Generally, the subbase and base course are required
to have sufficient strength to sustain the imposed traffic stresses without failure, uniform and consistent quality so that they can be spread and compacted without difficulty and to provide a
road surface that will not be impaired by the compacting effort of traffic. Recommended materials for bases and subbases include pitrun gravels, volcanic gravels such as tiff and tarish, marl, trap rock, quarry spoils, crushed slag and crushed rock [27].
Subbase course materials’ quality was assessed using particle-size grading, plasticity of the fine aggregate, elastic, resilient, grading and plasticity moduli; and the strength based on California
bearing ratio (CBR). Particle size distribution and plasticity index provides the basis for determination of the grading and plasticity moduli (eqns. 5 and 6 respectively) [27] while the moduli parameters were derived from the soaked CBR (%).
Mg = 300 – (F2 + F0.425 + F0.075) . ..…… (7)
100 Mp = Ip x F0.424 ………….. (8)
Where F2 = % passing sieve number 2mm
F0.425 = % passing sieve number 0.425mm F0.075 = % passing sieve number 0.075mm Ip = plasticity index
IV. RESULTS AND DISCUSSION
4.1 Soil Profile and Geotechnical Characterization
A typical soil profile characterizing the site’s subsurface stratigraphy for the top 2.0m depicts a soft black humus top soil varying in depth from ground surface to approximately 0.8m, a firm
light brown silty clay from 0.8 – 2.0m. These subgrade materials classify as low to intermediate plasticity clays (CL - CI) under the unified soils classification scheme, A3, A-2-4, A-2-6, A-2-7,
A-7-6, A-7-5 AASHTO materials (figure 2a), with 58.85% of the subgrade materials rated as poor to fair and 41.15% rated as good to excellent. On the basis of the specific gravity (ASTEM D854-92), subgrade materials classify as high porosity organic to inorganic soils in different locations
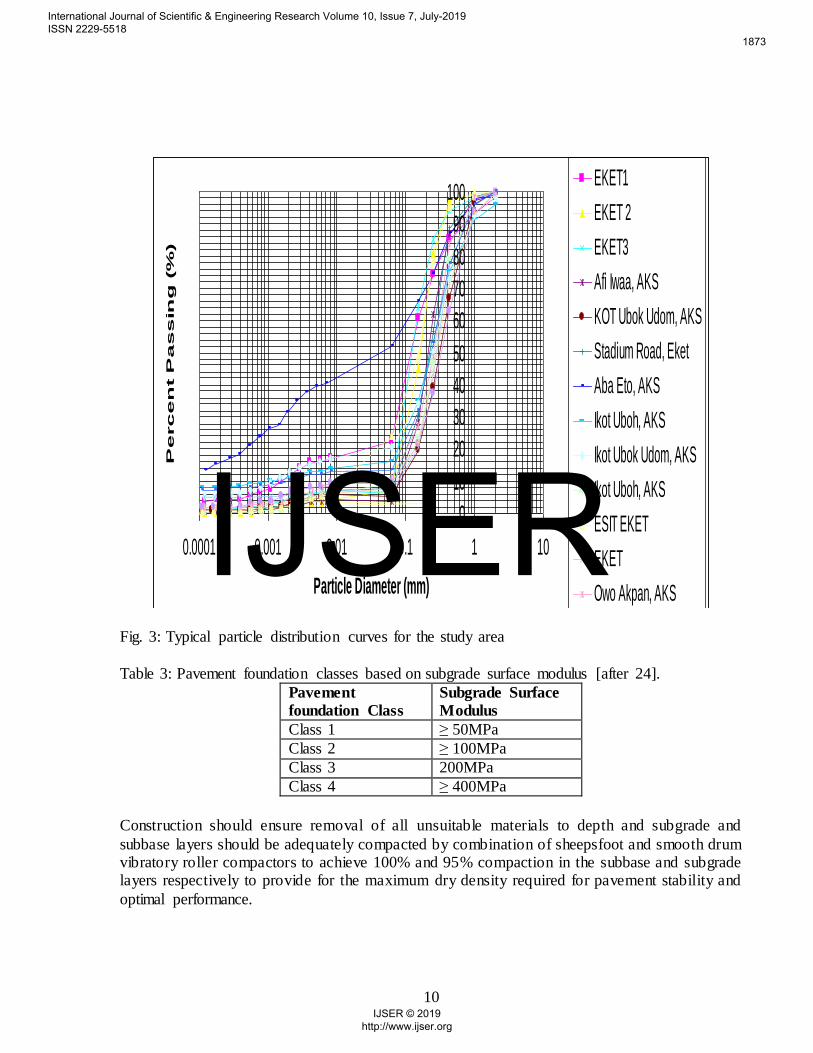
across the study area. These materials have a % clay content ranging from 0.4% t0 8.0%, silt % from 1.6 to 13.5%, together taken as % fines with a range of 3.5% to 19.5% while the remaining
soils particles falls within the sand class and a 7.32% gravelly materials (figure 3). The clay activity of the subgrades ranges from 0.8 to 41.25 with a mean value of 11.79 depicting normal to active clays ranging in sensitivity from low to extra-sensitivity and even quick clays in places.
Subgrade’s expansivity varies from 4.83 to 68.90 with an average value of 19.45. This range of expansivity indicates that most of the soils are expansive (expansivity > 20) [26].
International Journal of Scientific & Engineering Research Volume 10, Issue 7, July-2019 ISSN 2229-5518
1869
IJSER © 2019 http://www.ijser.org
IJSER

7
Geotechnical index properties show that the specific gravity varies from 2.44 to 2.60 with an average of 2.53 while the moisture content of the subgrade materials varies from 11.78 – 35.30%
with an average of 29.75. [29] has that specified a moisture content range of 5 – 15% for engineering construction in the
country and in this coastal microclimatic terrain with high porosity organic soils, pavement sustainability is suspect. The bulk density varies from 1.541(g/cm3) to 2.61(g/cm3) with an average of 2.61 (g/cm3) while the dry density ranges from 1.253(g/cm3) to 1.665 (g/cm3) with
averaging 1.40 (g/cm3). The bulk unit weight varies from 15.12 (KN/m2) to 25.5 (KN/m2) averaging 16.87 (KN/m2)
while the dry unit weight ranges from 12.292 (KN/m2) to 16.334 (KN/m2) with a mean of 13.734 (KN/m2). The consistency and rheological properties of the subgrades depict that 30.51% of the subgrades
are non-plastic with a liquid limit range of 25.70% to 54.1% with a mean of 27.32%, plastic limit varying from 8% to 37% and averaging 16.05% and index of plasticity of 5 – 28.4 range and a
mean of 14.79. Subgrade strength properties shows the 48hours soaked California bearing ratio (CBR) to vary from 7% to 38% with a mean value of 9.9% indicating most subgrades to fall into the medium
hard ground class [27] while its derived moduli depicts the subgrade surface modulus (Es) to range from 61.5 MPa to 168.14 MPa with a man value of 68.82Mpa across the study area and
classifying as classes 2 and 3 of pavement foundation classes (table 3) [29]. The modulus of resilience (MR) also range from 72.394(MN/m2) to 392.996(MN/m2) with an average value of 114.88(MN/m2) while the elastic modulus range from 70(MN/m2) to 380(MN/m2) with a mean
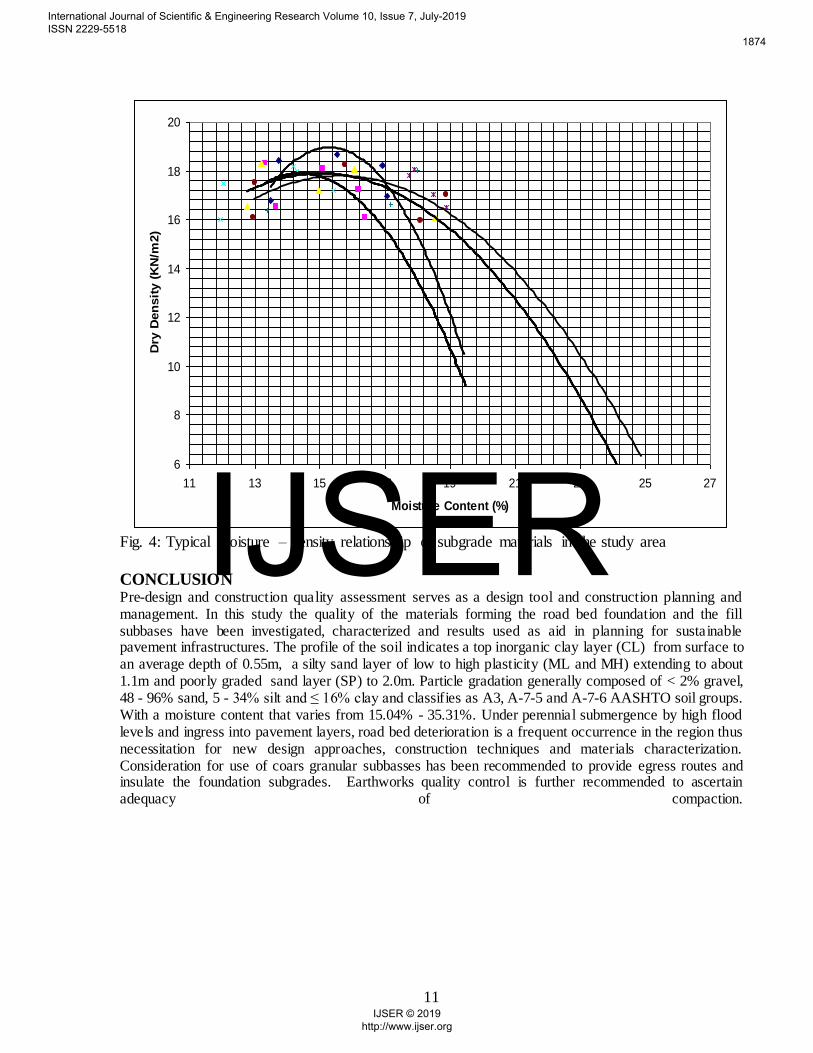
of 105.2(MN/m2). These soils indicate materials of average to good quality subgrade. Moisture –density relationships indicates that the Optimum moisture content (OMC) of the
subgrade materials varies from 10.5% to 19.40% with an average of 16.06% while the maximum dry density (MDD) range from 16.75 (KN/m3) to 19.55(KN/m3) averaging 18.18(KN/m3) (figure 4). Most of the weak strength materials occurring in some parts of the area are those described by
[30] as transition zone soils. The [10] has specified that for effective/efficient design of durable pavement, the % passing BS
sieve number 200 should not exceed 35%,liquid limit should be less than or equal to 50%, while plasticity index should not exceed 30%. The subgrade materials’ simulation of field conditions during wet seasons especially for coastal parts of the country should be soaked for 96 hours and
a minimum subgrade;s soaked California Bearing Ratio of 15% should be design of road pavement without modification. All subgrades which have a 96hour soaked CBR less than 15%
must receive treatment to improve its strength and durability. Subbases
The engineering characteristics of the subbase materials indicates the moisture content, liquid limit, plastic limit and plasticity index to range from 15 – 20%, 24 – 34%, 13 – 22% and 9 – 15
respectively with mean values of 17.0%, 28.9%, 16.8% and 12.1 respectively. Particle size distribution depicts the subbase fill materials to be characteristically composed of 29.8% fines (clay and silt classes) and 70.2% sands. These materials classify as A-2-6 AASHTO materials
rated as Excellent to Good (figure 2b). A 48hours soaked CBR range of 17.0 – 39.0% with an average 28.2% and un-soaked CBR range of 30 – 58 with a mean value of 45.7% characterize
the subbase fill materials with a percent reduction in strength of 10.0 – 62.0%.
International Journal of Scientific & Engineering Research Volume 10, Issue 7, July-2019 ISSN 2229-5518
1870
IJSER © 2019 http://www.ijser.org
IJSER

8
The elastic modulus range from 170(MN/m3) – 350(MN/m3) with a mean value of 273 (MN/m3), resilient modulus varies from 206.84 – 537.78 (MPa) with an average value of 353.696 (MPA).
The grading modulus ranges from 0.67 – 1.04 with an average of 0.849 while the plasticity modulus varies from 603.0(MPa) – 1395.0(MPa) averaging 906.8(MPa). A group index of 0 –
0.8 with an average of 0.17 characterize the quality of these subbase fill soils (tables 4a and 4b). The compaction results show the optimum moisture content (OMC) to vary from 11.3% – 23.6% with mean of13. 322% while the maximum dry density ranges from 12.3 – 19.2 (KN/m3)
averaging 18.234 (KN/m3). For materials to qualify for use as subbase fills, [24] recommends a liquid limit not exceeding 30%, plasticity index less than or equal to 12%, 24 hours soaked CBR
at OMC and MDD WASC not less than 30% and a relative compaction of 100%. Specification further recommendation a minimum 15 random samples be tested for a borrow area over 1hectares and the specifications may be modified based on peculiar site specific conditions.
Table 1.0: Summary of subgrade’s engineering properties of subgrades Engineering Property Sampling Depth (m) Results of Geotechnical Analysis
Minimum Maximum Minimum Maximum Average
Natural Moisture Content % 1.0 2.0 11.78 35.30 29.75
Specific Gravity 1.0 2.0 2.44 2.60 2.53
Bulk Density (g/cm3) 1.0 2.0 1.541 2.61 1.72
Bulk Unit Weight (KN/m2) 1.0 2.0 15.12 25.60 16.87
Dry Density (g/cm3) 1.0 2.0 1.253 1.665 1.40
Dry Unit Weight (KN/m2) 1.0 2.0 12.292 16.334 13.734
Liquid Limit % 1.0 2.0 25.70 54.1 27.31
Plastic Limit % 1.0 2.0 8 37 16.05
Plasticity Index 1.0 2.0 5 28.4 14.79
% of Non-plastic subgrades 30.51
Optimum Moisture content % 1.0 2.0 10.5 19.40 16.06
Maximum Dry Density (KN/m3) 1.0 2.0 16.75 19.55 18.18
CBR % (48 hours Soaked) 1.0 2.0 7 38 9.9
Elastic modulus (MN/m2) 1.0 2.0 70 380 105.2
Subgrade surface modulus Es (MPa) 1.0 2.0 61.5 168.14 68.82
Resilient Modulus (MN/m2) 1.0 2.0 72.394 392.996 114.88
% Clay 1.0 2.0 0.4 8.0 2.89
% Silt 1.0 2.0 1.6 13.5 5.71
% Fines 1.0 2.0 3.5 19.5 8.68
% Sand 1.0 2.0 8.0 96.4 84.02
% Gravel 1.0 2.0 0.1 87.5 7.32
Clay activity 1.0 2.0 0.8 41.25 11.79
Expansivity 1.0 2.0 4.83 68.90 19.45
Table 2: Subgrade classification CLASSIFICATION SUBGRADE CLASS RATING % Good % Poor
USCS Classification CL CI
41.15
58.85
AASHTO Classification % of samples classified as A-2-4 8.93 Excellent to Good
% of samples classified as A-2-5 1.8 Excellent to Good
% of samples classified as A-2-6 28.57 Excellent to Poor
% of samples classified as A-2-7 1.8 Excellent to Poor
% of samples classified as A-7-5 3.57 Fair to Poor
% of samples classified as A-7-6 35.71 Fair to Poor
% of samples classified as A-3 16.1 Fair to Poor
% of samples classified as A-6 3.57 Fair to Poor
Group Index 0 2.9
International Journal of Scientific & Engineering Research Volume 10, Issue 7, July-2019 ISSN 2229-5518
1871
IJSER © 2019 http://www.ijser.org
IJSER

9
4.4 Considerations for Design and Construction
Conservative design of pavement infrastructure is based on classification of subgrade surface modulus which is an estimation of foundation stiffness based on subgrade CBR used for
foundation design. The fundamental objective of the pavement foundation is to distribute vehicular loads to the
underlying soil formation without causing distress in both the foundation layer and the overlying pavement layers during construction and service life. The fundamental objective of the pavement foundation is to distribute vehicular loads to the underlying soil formation without causing
distress in both the foundation layer and the overlying pavement layers during construction and service life. The soaked CBR in the study depicts spatial variations ranging from 7 to 38%
depicting medium hard to hard ground condition and subgrade effective modulus of 61.15 – 168.14MPa under class 2-3 of surface modulus classification of pavement foundation [24] and provides average to good subgrade conditions.
The thickness of a road pavement depend on the expected traffic volume, strength indexed by the California Bearing Ration (CBR), subgrade modulus, elasticity and resilient moduli of the
natural subgrade. The design subgrade strength is the lowest representative value of CBR and subgrade modulus likely to be encountered during the lifespan of the pavement. The pavement thickness should be based on the subgrade’s group index and CBR. Consequently,
on the basis of group index and using [31] charts, pavement thickness varies from 300 – 350mm plotting in curve D. On the basis of CBR and using design charts provided under road note 29, a
thickness of 250 – 300 is recommended. In consideration of the low lying topography and ground elevation which is below or at par with the sea level in places and the zone being the recipient of the maximum rainfall amount of 2600
– 2800mm annually, pavement infrastructure is perennially submerged and under constant ingress thus increasing the pore water pressure, reducing the effective stress and the shear
strength of the subgrades, and the bases, granular subbbases of river sharp sand and gravely materials are recommended.
Figure 2a: AASHTO Classification of the subgrades
Figure 2b: AASHTO Classification
of the subbases
International Journal of Scientific & Engineering Research Volume 10, Issue 7, July-2019 ISSN 2229-5518
1872
IJSER © 2019 http://www.ijser.org
IJSER
10
0
10
20
30
40
50
60
70
80
90
100
0.0001 0.001 0.01 0.1 1 10
Particle Diameter (mm)
Pe
rc
en
t P
as
sin
g (%
)EKET1
EKET 2
EKET3
Afi Iwaa, AKS
KOT Ubok Udom, AKS
Stadium Road, Eket
Aba Eto, AKS
Ikot Uboh, AKS
Ikot Ubok Udom, AKS
Ikot Uboh, AKS
ESIT EKET
EKET
Owo Akpan, AKS
EKET RD
IKOT ABASI
Fig. 3: Typical particle distribution curves for the study area
Table 3: Pavement foundation classes based on subgrade surface modulus [after 24].
Pavement
foundation Class
Subgrade Surface
Modulus
Class 1 ≥ 50MPa
Class 2 ≥ 100MPa
Class 3 200MPa
Class 4 ≥ 400MPa
Construction should ensure removal of all unsuitable materials to depth and subgrade and
subbase layers should be adequately compacted by combination of sheepsfoot and smooth drum vibratory roller compactors to achieve 100% and 95% compaction in the subbase and subgrade layers respectively to provide for the maximum dry density required for pavement stability and
optimal performance.
International Journal of Scientific & Engineering Research Volume 10, Issue 7, July-2019 ISSN 2229-5518
1873
IJSER © 2019 http://www.ijser.org
IJSER
11
6
8
10
12
14
16
18
20
11 13 15 17 19 21 23 25 27
Moisture Content (%)
Dry
Den
sit
y (
KN
/m2)
Fig. 4: Typical moisture – density relationship of subgrade materials in the study area
CONCLUSION Pre-design and construction quality assessment serves as a design tool and construction planning and management. In this study the quality of the materials forming the road bed foundation and the fill subbases have been investigated, characterized and results used as aid in planning for sustainable pavement infrastructures. The profile of the soil indicates a top inorganic clay layer (CL) from surface to an average depth of 0.55m, a silty sand layer of low to high plasticity (ML and MH) extending to about 1.1m and poorly graded sand layer (SP) to 2.0m. Particle gradation generally composed of < 2% gravel, 48 - 96% sand, 5 - 34% silt and ≤ 16% clay and classifies as A3, A-7-5 and A-7-6 AASHTO soil groups. With a moisture content that varies from 15.04% - 35.31%. Under perennial submergence by high flood levels and ingress into pavement layers, road bed deterioration is a frequent occurrence in the region thus necessitation for new design approaches, construction techniques and materials characterization. Consideration for use of coars granular subbasses has been recommended to provide egress routes and insulate the foundation subgrades. Earthworks quality control is further recommended to ascertain adequacy of compaction.
International Journal of Scientific & Engineering Research Volume 10, Issue 7, July-2019 ISSN 2229-5518
1874
IJSER © 2019 http://www.ijser.org
IJSER

12
Table 4a: Classification of approved borrow pit sub-base materials SAMPLE Depth
(m)
Wn
(%)
Atterberg limits Particle Size Analysis AASHTO
Classification
RATING
LL PL Ip % Fines % Sand % Gravel Excellent to Good
IU-BP-1TP1 2.5 17 28 15 13 28 72 0 A-2-6 Excellent to Good IU-BP-1TP2 2.5 16 30 19 11 25 75 0 A-2-6 Excellent to Good IU-BP-1TP3 2.5 16 30 18 12 24 76 0 A-2-6 Excellent to Good IU-BP-1TP4 2.5 18 31 22 09 22 78 0 A-2-6 Excellent to Good IU-BP-3TP1 2.5 17 30 17 13 35 65 0 A-2-6 Excellent to Good IU-BP-3TP2 2.5 16 24 13 11 29 71 0 A-2-6 Excellent to Good IU-BP-3TP3 2.5 19 27 15 12 34 66 0 A-2-6 Excellent to Good IU-BP-3TP4 2.5 20 25 14 11 30 70 0 A-2-6 Excellent to Good IU-BP-4TP1 1.5 15 30 15 15 35 65 0 A-2-6 Excellent to Good IU-BP-3TP2 2.5 16 34 20 14 36 64 0 A-2-6 Excellent to Good
Range 15 –
20
24 – 34 13 – 22 9 - 15 22 – 36 64 - 78 0
Average 17.0 28.9 16.8 12.1 29.8 70.2 0
Table 4b: Compaction and strength characteristics of approved borrow pits for use as sub-base fill materials SAMPLE Depth (m) Compaction CBR (%) Elastic
modulus
MN/m2
Resilient
modulus
(MPa)
Grading
modulus
Plasticity
modulus
(MPa)
Group
index
AASHTO
Soil group
Rating as sub-base
OMC (%)
MDD KN/m3
48 hrs. Soaked
Un-soaked
% Reduction
in strength
IU-BP-1TP1 2.5 11.30 19.00 20 30 33.0 200 206.84 0.84 897 0 A-2-6(0) Excellent to Good
IU-BP-1TP2 2.5 11.50 19.10 30 37 19.0 300 310.26 0.95 671 0 A-2-6(0) Excellent to Good
IU-BP-1TP3 2,5 12.10 18.90 39 56 30.0 300 403.34 0.97 816 0 A-2-6(0) Excellent to Good
IU-BP-1TP4 2.5 12.30 18.95 24 58 59.0 240 248.21 0.88 603 0 A-2-6(0) Excellent to Good
IU-BP-3TP1 2.5 23.60 18.60 36 52 16.0 360 372.31 1.04 715 0.6 A-2-6(0.6) Excellent to Good
IU-BP-3TP2 2.5 12.60 18.85 35 39 10.0 350 403.34 0.76 891 0 A-2-6(0) Excellent to Good
IU-BP-3TP3 2.5 12.40 19.20 29 44 34.0 290 299.92 0.69 1044 0.26 A-2-6(0.26) Excellent to Good
IU-BP-3TP4 2.5 12.20 18.90 32 48 33.0 320 330.94 0.75 902 0 A-2-6(0) Excellent to Good
IU-BP-4TP1 1.5 13.42 18.55 17 41 59.0 170 424.02 0.67 1395 0.8 A-2-6(0) Excellent to Good
IU-BP-3TP2 2.5 11.80 12.30 20 52 62.0 200 537.78 0.94 1134 0 A-2-6(0) Excellent to Good
Range 11.3 –
23.6
12.3 –
19.2
17 – 39 30 -
58
10.0 –
62.0
170 - 350 206.84 –
537.78
0.67 –
1.04
603 -
1395
0-0.8
Mean 13.322 18.235 28.2 45.7 35.50 273 353.696 0.849 906.8 0.17
International Journal of Scientific & Engineering Research Volume 10, Issue 7, July-2019 ISSN 2229-5518
1875
IJSER © 2019 http://www.ijser.org
IJSER

13
REFERENCES
[1] Li, Q, Mills, L. and McNeil, S. (2011). The implications of climate change on
pavement performance and design. A report submitted to the University of Delaware University Transportation Center. UDUTC, Final Report. 54pages
[2] O'Flaherty, C. A. (1997). Evolution of the transport task: C. A. O’Flaherty (ed): Transport planning and traffic engineering. Oxford: Elservier. 544pages.
[3] Kadyali, L. R. and Lal, N. B. (2008). Principles and practices of Highway engineering.
New Delhi:Khanna Publishers. 848 pages. [4] Highway design Manual (2013). Nigeria’s Federal Ministry of Works, Pavement and
Material design, Vol. III., Nigeria, Pp. 1 – 165. [5] Ademila, O. (2018). Geotechnical characterization of subgrade soils in Southwestern
parts of Nigeria. Proceedings of 1st and 2nd International conferences of the Nigerian
Association for Engineering Geology and the Environment. Lagos, Vol. 1, pp. 42 – 48. [7] Nigeria’s Highway design manual 2009.
[8] Interim Advice Note 73/06, Revision 1 (2009): Design guidance for road pavement foundations. (Draft HD25) pp. 1 – 59.
[9] Abam, T. K. S. (2018). Exploring ground conditions for sustainable building foundation
design. Proceedings of 1st and 2nd International conferences of the Nigerian Association for Engineering Geology and the Environment. Lagos, Vol. 1, pp. 32 – 41.
[10] Nigeria’s Ministry of Works (2011). [11] Akpokodje, E. G. (1987). The Engineering Geological characteristics and classification
of major superficial soils of the Niger Delta. Engineering Geology, Vol. 23, pp. 193 –
211. [12] Tse, A. A. and Ogunyemi, A. O. (2016). Geotechnical and chemical evaluation of tropical
red soils in a deltaic environments: Implications for road construction. Int. J. of Geology, Earth and Environmental Sciences, Vol. 6(1). Pp. 19 – 29.
[13] Ugbe, F. C. (2011).Basic engineering geological properties of lateritic soils from Western Niger Delta. Research J. Of Environmental and Earth Sciences, 3(5), 571 – 577.
[14] Teme, S. C., Adu, A., Olise, C. (2015).Dsign considerations in the construction of a basement in a 7-storey hospital complex in the marginal lands of the Niger Delta sub-
region. 51st NMGS Conference book of abstract, Pp. 57. [15] Abija, F. A., Teme, S. C and Oborie, E. (2018). Geotechnical considerations for the
design and construction of foundation in a marshy stream channel of Iwochang-Ibeno,
Eastern Niger Delta, Nigeria. J. of Civil, Construction and Environmental Engineering Vol. 3(6), pp. 154 -170.
[16] Alayaki, F., Al-Tabbaa, A., and Ayotamuno, J. (2015). Defining Niger Delta Soils: Are They Laterites? Civil and Environmental Research, Vol.7, No.5, Pp. 21 – 26.
[17] Tse, A. C. and Akpokodje, E. G. (2014). Geotechnical characteristics of mangrove
swamp soils: Implications as foundation materials in parts of the eastern Niger Delta. J. of Mining and Geology, Vol. 50, No 1. Pp. 61 - 71
[18] Teme, S. C. (2002). Geotechnical considerations on foundation design in the Niger Delta., Paper presented at the special technical session of the 39th Annual international conference of the NMGS in Port Harcourt., pp. 51.
[19] Adefolalu, D. O (1981). The weather and climate of Calabar: a study of coastal microclimatology in equatorial tropics. Senate Research Project, University of. Calabar.
[20] Hospers, J., 1965, Gravity field and structure of the Niger Delta, Nigeria, West Africa: Geological Society of American Bulletin, Vol. 76, p. 407-422.
International Journal of Scientific & Engineering Research Volume 10, Issue 7, July-2019 ISSN 2229-5518
1876
IJSER © 2019 http://www.ijser.org
IJSER

14
[21] Kaplan, A., Lusser, C.U., Norton, I.O. 1994. Tectonic map of the world, panel 10: Tulsa, American Association of Petroleum Geologists, scale 1:10,000,000.
[22] Short, K. C., and Stäuble, A.J., 1965, Outline of geology of Niger Delta: American Association of Petroleum Geologists Bulletin, Vol. 51, Pp. 761-779.
[23] Nigeria’s Federal Ministry Works (1997). Nigerian General Specification for Roads and Bridges, Revised Edition 2. Pp. 137 – 275.
[24] British Standards Institute (1990).Methods for testing of soils for Civil engineering
Purposes, BS 1377, part 4. [25] Skempton, A. W. (1953). The colloidal activity of clays. Proceedings of the third
International Conference of Soil Mechanics and Foundation Engineering, Zurich, 1, 57 – 60.
[26] Sridhara, A. and Prakash, K. (2000). Classification procedures for expansive soils.
Proceedings of the Institution of Civil engineers, Geotechnical Engineering, 143 Oct. Pp. 235 – 240.
[27] Charles, R. (2001). Chapter 3: Design of Coastal Roads: A course in Coastal Defense Systems, II. Professional development programme: coastal infrastructure design, construction and maintenance. Department of Civil Engineering, University of the West
Indies, in conjunction with Old dominion University, Norfolk, VA, USA and Coastal Engineering Research Centre, US Army, Corps of Engineers, Vicksburg, MS, USA..
28] Nigeria’s Federal Ministry of Works and Housing (2000). [29] Fubara, D. M. J., Teme, S. C. Mgbeke, T., Abam, ans T. K. S. (1998). Hydro-
meteorological zones of the Niger Delta. Technical Bulletin No1., Institute of Flood,
Erosion and Transportation, Rivers State University of Science and Technology, Port Harcourt.
[30] Steele, D. J. (1945). Application of classification and group index in estimating desirable subbase and total pavement thickness. Proceedings, Highway Research Board, Pp. 388 – 392.
International Journal of Scientific & Engineering Research Volume 10, Issue 7, July-2019 ISSN 2229-5518
1877
IJSER © 2019 http://www.ijser.org
IJSER


![Geotechnical Engineering Report on Subgrade Strength … · ] Geotechnical Engineering Report on Subgrade Strength of Existing Highway (Balkh ~ Andkhoy) Fore word As a Design Team](https://img.pdfslide.us/doc/110x75/5b80f7ef7f8b9a35788e58b3/geotechnical-engineering-report-on-subgrade-strength-geotechnical-engineering.jpg)