Embed Size (px)
Citation preview

GEOSS Architecture for the Use of Remote Sensing Products in Disaster Management
and Risk Assessment
Edited by John Evans (GST), Karen Moe (NASA ESTO)
December 2013
This document results from the CEOS WGISS GA.4.Disasters project. The editors are grateful to participants and contributors to the project:
Pat Cappelaere Steve Chien Wyn Cudlip Andrew Eddy Stuart Frye
Antje Hecheltjen Li Guoqiing Brenda Jones Frank Lillehagen Dan Mandl
Guy Séguin Serhiy Skakun Shelley Stover Timothy Stryker Shirley Tseng
Special thanks to Kengo Aizawa, Wyn Cudlip, Stuart Frye, Mike Goodman, Brenda Jones, Dengshing Liu, and Dan Mandl for input on practitioner case studies.
GEOSS Architecture for the Use of Remote Sensing Products in Disaster Management and Risk Assessment
3
Table of Contents
1. Executive Summary 5
2. Introduction / Overview / Motivation 5
2.a. Audience and scope 5
2.b. Goals and Requirements 6
2.c. Approach: Reference Model for Open Distributed Processing 6
2.d. Approach: practitioner case studies 6
3. Enterprise Viewpoint 7
3.a. Purpose and scope 7
3.b. Hazard types and disaster lifecycle phases 8
3.c. Activities (Business Processes) 9
3.d. Stakeholders 10
3.e. Principles 11
3.f. Enterprise view: points of comparison 11
4. Information Viewpoint 12
4.a. Overview 12
4.b. Observations and parameters by disaster type 12
4.c. Metadata needs in a disaster management context 14
4.d. Data operations needed in a disaster management context 15
5. Computation viewpoint 16
5.a. Overview 16
5.b. Service types needed for disaster management and risk assessment 16
5.c. Constraints and requirements specific to disaster management 17
6. Engineering and Technology Viewpoints 17
References 18
Appendix 1: Namibia Flood Pilot 19
Appendix 2: China Sichuan / Wenchuan earthquake 21
Appendix 3: Japan Sendai / Tohoku earthquake & tsunami 23
Appendix 4: International Charter – Space and Major Disasters 25
Appendix 5: (Alternative / Future) Case Study Candidates 27
Appendix 6: Case Study Questionnaire 28


GEOSS Architecture for the Use of Remote Sensing Products in Disaster Management and Risk Assessment
5
1. Executive Summary
The Committee on Earth Observation Satellites (CEOS) Working Group on Information Systems and Services (WGISS) has set out to describe and document a high-level reference model for the use of satellites, sensors, models, and associated data products to support disaster manage-ment and risk assessment within the Global Earth Observa-tion System of Systems (GEOSS).
The model describes satellite-based disaster management activities from three viewpoints. The Enterprise viewpoint scopes and structures the activities and sketches stakeholders and operating principles. The Information view-point identifies priority observations and physical para-meters, metadata needs, and common data operations in a disaster management context. The Computation viewpoint depicts service types, and service constraints and require-ments specific to disaster management.
This model is intended to streamline the provision of satellite data and value-added services to decision-making for disaster management. As a logical, conceptual architec-ture, rather than a physical one, this model does not prescribe any specific technologies or implementation choices. Furthermore, it is intended not as a policy, but as a tool to facilitate coordination among organizations and interoperability among technology implementations. It also aims to clarify the relationship of ongoing activities – in particular, pilot studies and proof-of-concept prototypes – to the overall enterprise of supporting disaster management and risk assessment with satellite data. This is to assist planners and decision-makers in prioritizing investments in data infrastructure, based on gaps or redundancies in data, metadata, functions, services, networks, etc. The goal is broader use of earth observations and streamlined access to appropriate data products to improve the effectiveness of disaster management and risk assessment efforts (doing the right things at the right times) and their efficiency (maximizing performance while minimizing costs).
2. Introduction / Overview / Motivation
International efforts in applying satellite data to disaster management and risk assessment involve activities by many players, linked by complex, often ad hoc arrangements. This makes it hard for new suppliers of data or services to participate, or for new would-be users to tap into these data or services. This complexity also limits the efficiency and effectiveness of supporting disaster management and risk assessment with satellite data: simply trying to ascertain what resources are shared (by different entities, different kinds of disasters, or different jurisdictional levels) can require lengthy inquiry. Determining what resources are
missing (i.e., in clear demand but absent or scarce), inter-dependent, or isolated, can be a challenge as well. Efforts to coordinate or collaborate are also hampered by a lack of shared technical standards, common vocabulary, or jointly understood models of disaster management and risk assess-ment processes, and their use of satellite and other observa-tions and related systems and services. In order to address and mitigate disaster events in a timely, streamlined fashion, stakeholders need to establish these kinds of shared “infrastructure” in advance of disaster events.
For these reasons, the Committee on Earth Observation Satellites (CEOS) Working Group on Information Systems and Services (WGISS) has set out to describe and document a high-level reference model for the use of satellites, sensors, models, and associated data products to support disaster management and risk assessment. This effort is based on real-life experience of practitioners in these areas, and draws on results of the Group on Earth Observations (GEO) Task for the Disasters Societal Benefit Area (SBA) and the GEO Global Earth Observation System of Systems (GEOSS) Architecture Implementation Pilot (AIP). Using this model, CEOS-WGISS aims to streamline the efforts of GEOSS and other organizations to give decision-makers access to disaster and risk assessment information from global data and service providers.
The architecture defined here is only a starting point; it will undergo ongoing changes to reflect evolving insights, addi-tional experience, or new technologies.
2.a. Audience and scope
The audience for this architecture consists of the following (overlapping) categories of people:
Providers of satellite and other data relevant to disaster management / risk assessment;
Providers of value-added services that process (inter-pret, transform, summarize, filter, combine) data to produce information products for end users;
Distributors of original or processed data;
Decision-makers who prioritize investments in data sensing, distribution, or use.
This architecture is focused on areas that are peculiar to disaster management and risk assessment and their use of satellite information. Thus it omits topics that are either generic (much broader or more specific), or adequately treated elsewhere – e.g., in GEOSS-wide definitions or tech-nical standards. Where such “outside” topics are relevant to the topic of satellite information support to disaster management or risk assessment, this architecture document references appropriate documents.

GEOSS Architecture for the Use of Remote Sensing Products in Disaster Management and Risk Assessment
6
2.b. Goals and Requirements
This reference model provides a high-level, enterprise per-spective for managing distributed data systems and services for disaster management and risk assessment. In particular, it is intended to provide a common vocabulary to describe the system-of-systems building blocks and how they are composed in mitigating and addressing disasters.
This model describes disaster management and risk assessment concepts and processes as they are conducted today; but it also takes a strategic view, using current experience to envision improved processes and information support.
However, the model is intended not as a set of prescriptions or policies, but as a tool to facilitate coordination among organizations (international, national, regional and local) and interoperability among technology implementations (data archives, processing services, catalogs, portals, and end-user applications). It is also intended to clarify the relationship between ongoing activities – in particular, pilot studies and proof-of-concept prototypes – and the disaster management / risk assessment enterprise as a whole, to assist planners and decision-makers in prioritizing investments in data infrastructure, based on gaps or redundancies in data, metadata, functions, services, networks, etc. The goal is to improve both the effectiveness of disaster management and risk assessment efforts (doing the right things at the right times) and their efficiency (maximizing performance while minimizing costs).
2.c. Approach: Reference Model for Open
Distributed Processing
Several frameworks exist for describing the structure and functions of an enterprise. This document employs the ISO / IEC Reference Model of Open Distributed Processing (RM-ODP) to structure its descriptions of disaster management operations and processes. RM-ODP is especially suited to an information-intensive set of activities that involve many diverse and dispersed data sources, services, providers, and users. RM-ODP structures descriptions of an enterprise according to five “viewpoints”:
The Enterprise viewpoint describes the purpose, scope, and policies for the system. These are often articulated by means of scenarios or use cases.
The Information viewpoint is concerned with the semantics of the information and the information processing performed.
The Computation viewpoint is concerned with the functional decomposition of the system, and models it as objects interacting at interfaces.
The Engineering viewpoint describes the mechanisms and functions required for distributed interaction between objects.
The Technology viewpoint pinpoints technology choices for implementing the system.
(This architecture draws mostly on the Enterprise, Informa-tion, and Computation viewpoints. Future revisions will also include the Engineering and Technology viewpoints.)
RM-ODP is also the basis for numerous other reference models in related areas, including the GEOSS Architecture Implementation Pilot, the European Union's INSPIRE Spatial Data Infrastructure and ORCHESTRA disaster management framework (Douglas et al., 2008), and the OGC Reference Model. This common structure may facilitate comparisons or links with these other communities.
2.d. Approach: practitioner case studies
This document aims to synthesize a general understanding of disaster management and risk assessment processes, and their use of satellite data streams, from real-world experience. Rather than work from abstract / hypothetical use cases, this synthesis relies on documenting and analyzing how practitioners have gone about managing real disaster events or assessing or mitigating risks from actual hazards. Appendices 1 through 4 provide further details, especially on the following cases:
China’s Center for Earth Observation and Digital Earth and the 2008 Sichuan / Wenchuan earthquake;
Japan’s Aerospace Exploration Agency (JAXA) and the 2011 Sendai / Tohoku earthquake and tsunami;
The Namibia flood pilot (2011) and ongoing sensor web collaborations between NASA and the Namibian government;
The International Charter: Space and Major Disasters as seen by members, providers, users, and partners.
Appendices 5 and 6 list additional case-study candidates; and the questionnaire used as a starting point in each case.
This architecture also ties findings and analysis from the use cases to the broader picture of disaster management and risk assessment through ongoing review of conferences, published literature, and activities by international groups such as the United Nations Platform for Space-based Information for Disaster Management and Emergency Response (UN-SPIDER), the World Bank, the European ORCHESTRA and Global Monitoring for Environment and Security (GMES) projects, and Sentinel Asia / Space Applica-tions for Environment (SAFE).
GEOSS Architecture for the Use of Remote Sensing Products in Disaster Management and Risk Assessment
7
3. Enterprise Viewpoint
This first Viewpoint forms the basis for the others: it describes the purpose and scope of the enterprise; its stakeholders, its activities (or business processes), and its guiding principles.
3.a. Purpose and scope
The enterprise of concern here is the use of data from satellites in disaster management and risk assessment processes (decisions, operations, etc.). In keeping with WGISS’ overall objective (from its Terms of Reference) to “facilitate data and information management and services for users and data providers in dealing with global, regional and local issues,” the emphasis is on the systems and services needed to streamline access to earth-observing satellites operated by CEOS members.
This architecture supports the following GEOSS Strategic Target
2:
Enable the global coordination of observing and information systems to support all phases of the risk management cycle associated with hazards (mitigation and preparedness, early warning, response, and recovery) … [as demonstrated by] more effective access to observations and related informa-tion to facilitate warning, response, and recovery.
In particular, the Enterprise described here aims to encom-pass and integrate satellite data support to all aspects of disaster management and risk assessment. These are often treated as distinct sets of activities, but (especially for the purposes of information support) they may be envisioned as a continuum of analysis and decision-making, from risk awareness and preparedness, through forecasting and preparation, to disaster response and recovery.
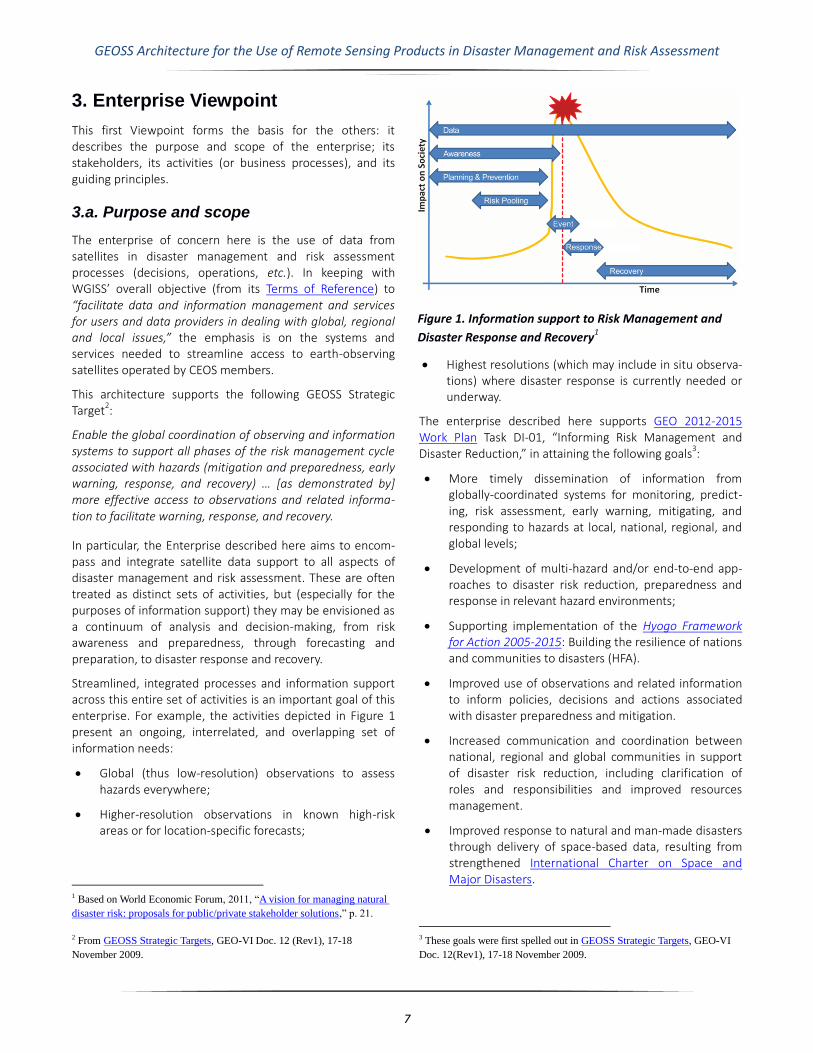
Streamlined, integrated processes and information support across this entire set of activities is an important goal of this enterprise. For example, the activities depicted in Figure 1 present an ongoing, interrelated, and overlapping set of information needs:
Global (thus low-resolution) observations to assess hazards everywhere;
Higher-resolution observations in known high-risk areas or for location-specific forecasts;
1 Based on World Economic Forum, 2011, “A vision for managing natural
disaster risk: proposals for public/private stakeholder solutions,” p. 21.
2 From GEOSS Strategic Targets, GEO-VI Doc. 12 (Rev1), 17-18
November 2009.
Highest resolutions (which may include in situ observa-tions) where disaster response is currently needed or underway.
The enterprise described here supports GEO 2012-2015 Work Plan Task DI-01, “Informing Risk Management and Disaster Reduction,” in attaining the following goals
3:
More timely dissemination of information from globally-coordinated systems for monitoring, predict-ing, risk assessment, early warning, mitigating, and responding to hazards at local, national, regional, and global levels;
Development of multi-hazard and/or end-to-end app-roaches to disaster risk reduction, preparedness and response in relevant hazard environments;
Supporting implementation of the Hyogo Framework for Action 2005-2015: Building the resilience of nations and communities to disasters (HFA).
Improved use of observations and related information to inform policies, decisions and actions associated with disaster preparedness and mitigation.
Increased communication and coordination between national, regional and global communities in support of disaster risk reduction, including clarification of roles and responsibilities and improved resources management.
Improved response to natural and man-made disasters through delivery of space-based data, resulting from strengthened International Charter on Space and Major Disasters.
3 These goals were first spelled out in GEOSS Strategic Targets, GEO-VI
Doc. 12(Rev1), 17-18 November 2009.
Figure 1. Information support to Risk Management and
Disaster Response and Recovery1

GEOSS Architecture for the Use of Remote Sensing Products in Disaster Management and Risk Assessment
8
More specifically, this enterprise shares the following Task DI-01 focus areas:
Provide support to operational systems and conduct gap analyses in order to identify missing data, system gaps, and capacity gaps;
Enable and inform risk and vulnerability analyses;
Conduct regional end-to-end pilots with a focus on building institutional relationships.
It also informs and supports the components of Task DI-01 in the GEO Work Plan:
Disaster Management Systems;
Geohazards Monitoring, Alert, and Risk Assessment;
Regional End-to-End Systems.
Finally, the resources identified in the GEO Work Plan for implementing DI-01 (including the International Charter, GEO Geohazard Supersites, catalog and metadata efforts by JAXA, and technology pilot projects at regional and global scales) serve as points of reference for this enterprise, confirming and validating its scope and structure.
Details on DI-01 and GEO objectives may be found in the GEO 2012-2015 Work Plan, as well as in “GEOSS Strategic Targets” (GEO-VI Plenary Document 12 (Rev 1), 17-18 Nov. 2009), and the 2-, 6-, and 10-year targets for the GEOSS Disasters Societal Benefits Area.
Fulfilling these goals collaboratively requires a precise, shared understanding of the processes involved in disaster-related decision-making, operations, and planning; of the satellite observations used (or usable) by these processes; and of the data access methods employed – either direct (from data suppliers) or indirect (through intermediate value-added services).
This enterprise encompasses communities that differ signif-icantly in their policies, economics, language, etc.; and it accounts for a variety of hazard types. It also builds on and ties to existing GEOSS architectures and semantics, including those of the GEO 2012-2015 Work Plan and GEOSS Arch-itecture Implementation Pilot (AIP).
3.b. Hazard types and disaster lifecycle
phases
The disaster management and risk assessment enterprise is also defined by a set of hazard types and disaster lifecycle phases. Several sources provide useful points of reference in this regard: to streamline comparisons and coordination, this reference model will adopt the structure outlined in the CEOS / GEO DI-06-09 report, “Use of Satellites for Risk
Management” (Nov. 2008), with eight hazard types and four disaster lifecycle phases.
Hazard types:
Windstorms Wildfires
Earthquakes Drought
Landslides Tsunamis
Volcanoes Flooding (slow onset and flashfloods)
These types were selected (both here and in the 2008 report) not because they are exhaustive, but because of their widespread impact and the potential benefit of satellite data and associated applications.
Disaster lifecycle phases:
Disaster Warning refers to all activities in the days and hours immediately before a disaster, once the onset of the disaster is considered likely, that are aimed at saving lives and protecting property through improved information about the likely impact of the disaster, or through steps taken to avoid impacts or to evacuate people.
Disaster Response refers to the period during and immediately after the disaster during which efforts are underway to identify the immediate impact and save lives of those directly affected and improve the material situation of those affected. Typically lasts a few days.
Disaster Recovery refers to the period after the disaster response, which may last for weeks or even months in the case of large scale disasters, during which a detailed assessment of the impact of the disaster is made, and efforts are undertaken to return the disaster zone to “normal” activities. In some severe cases, this recovery period may last years to rebuild infrastructure or to rehabilitate damaged environments.
Figure 2. Disaster lifecycle phases
GEOSS Architecture for the Use of Remote Sensing Products in Disaster Management and Risk Assessment
9
Disaster Mitigation involves all activities between disasters that identify risk or prepare populations and property with a view to reducing the impact of the disaster. In this phase, long-term risk assessment, risk pooling through property insurance, infrastructure invest-ments, policies for improved land management, safer construction, etc., are crucial.
Figure 2, from the CEOS / GEO 2008 report, depicts these phases (including the Disaster Event itself, which may last only a few seconds).
Further definitions of hazard types and disaster lifecycle phases may be found in the United Nations (UN) International Strategy for Disaster Risk Reduction (ISDR) Terminology and the UN-SPIDER Space Applications Matrix.
This document generally follows the structure from the CEOS / GEO 2008 report, but with occasional links to other sources. For example, the GEO report on Critical Earth Observations Priorities (Oct. 2010) bases its analysis on nearly the same hazard types as above – but omits Drought and Tsunamis; and limits windstorms to Tropical Cyclones. The GEOSS 10-Year Implementation Plan Reference Document (Feb. 2005) also omitted Drought, but it distinguished Extreme Weather and Tropical Cyclones in lieu of Windstorms; and added Sea/Lake Ice and Pollution events.
3.c. Activities (Business Processes)
Satellite data support to disaster management and risk assessment is also defined by a set of interrelated activities or business processes, which may be grouped into the following stages:
Initiation, including research to determine an observa-tion strategy and predictive capabilities;
Operational / steady-state event detection and response;
Disaster recovery, risk assessment, and mitigation.
Initiation
Operational activities are often preceded by disaster management initiation, with the following activities:
Evaluate candidate satellite observations for use in disaster related applications (e.g., for predicting volcan-ic eruptions)
Identify inputs for event detection; event triggers
Identify indicators for situational awareness (e.g., flood extent)
Define modeling elements (e.g., regional flood model)
Define workflows and data flows for processing and delivery
Identify automation opportunities (e.g., subscriptions, custom products)
Develop methods for validating products
These initiation activities may be repeated any number of times, e.g., to review and refine the observation strategy, incorporate new inputs, or revalidate predictive methods.
Event detection and response
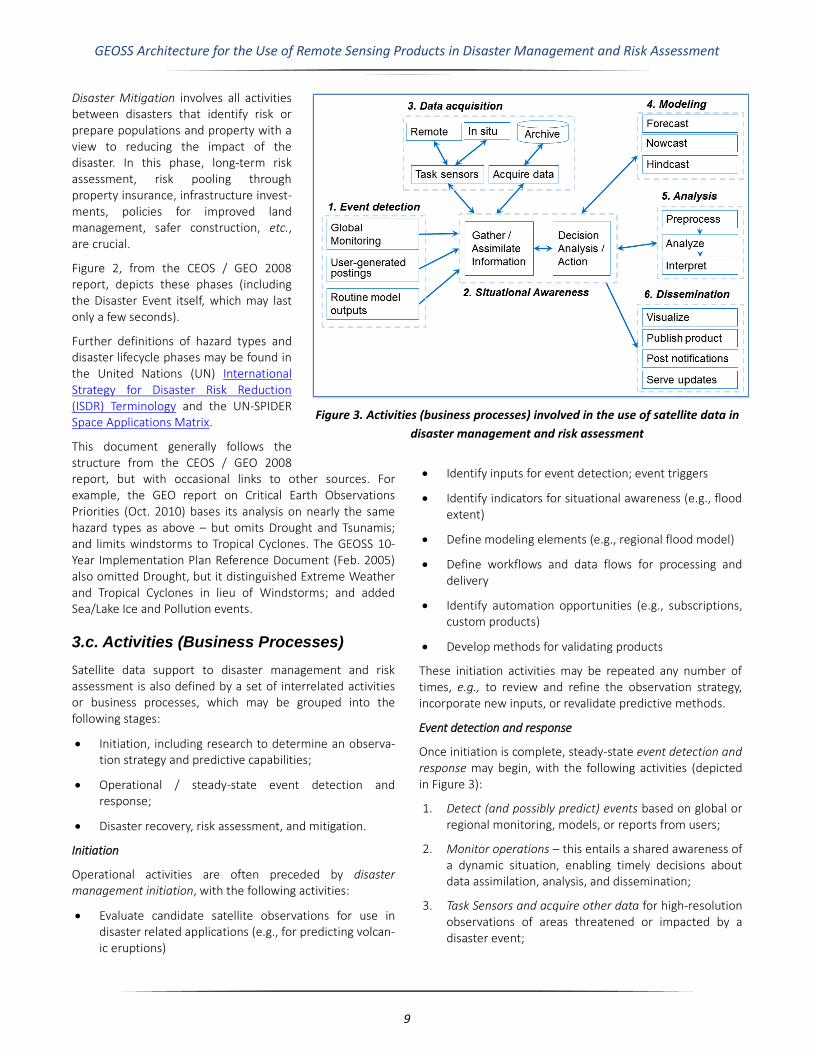
Once initiation is complete, steady-state event detection and response may begin, with the following activities (depicted in Figure 3):
1. Detect (and possibly predict) events based on global or regional monitoring, models, or reports from users;
2. Monitor operations – this entails a shared awareness of a dynamic situation, enabling timely decisions about data assimilation, analysis, and dissemination;
3. Task Sensors and acquire other data for high-resolution observations of areas threatened or impacted by a disaster event;
Figure 3. Activities (business processes) involved in the use of satellite data in
disaster management and risk assessment

GEOSS Architecture for the Use of Remote Sensing Products in Disaster Management and Risk Assessment
10
4. Model and Predict to pinpoint priority times and loca-tions for response and recovery efforts; and to better understand the natural phenomena.
5. Analyze and Interpret data obtained via satellite or in situ sensors or other sources (this includes validating the resulting information products);
6. Disseminate visual or other products to end users, including reports or updates. (In fact, user access is potentially a part of any of the activities depicted here, allowing users to draw upon, or even to shape, the gathering, processing, or production of information.)
Figure 3 shows how these steady-state processes relate to each other: for example, when flood forecasting models detect a flood risk, decisionmakers may task a satellite to observe the affected area, and apply a variety of processing algorithms to interpret it. The resulting data, along with data from in situ rain and stream gauges, feeds another model to determine detailed flood areas.
Recovery and mitigation
Following the detection and response phases, recovery and mitigation activities include the following processes:
Overlay earth observations with data on settlements and infrastructure from many local sources (for damage assessment and recovery planning and prioritization);
Periodic surveys to assess the progress of reconstruc-tion and recovery efforts;
Review historical data (and where appropriate, conduct disaster simulations) to identify risk patterns and trends over time, and to quantify future risk (for budgeting and risk pooling / insurance). These studies also aim to understand the spatial variability of risk (for setting land-use policies or property values) and to characterize key risk factors (for improved environ-mental or development policies; and for infrastructure improvements where appropriate).
Research towards improving disaster prediction, preparedness, or response, from recent experience. This may lead into, or combine with, the initiation activities outlined earlier.
Not every instance of disaster management or risk assess-ment will include all of these processes; however most will fit into some subset of Figure 3, and can thus trace their relationship with other processes.
3.d. Stakeholders
Many documents and plans by CEOS, GEOSS, and others refer to the stakeholders for Disaster Management and Risk
Assessment and the use of satellite data in such activities; but these stakeholders are seldom enumerated or charac-terized. One exception is a 2010 GEOSS Architecture Implementation Pilot report (AIP-3, #2.4.1.1), which calls out several “targeted or supported” communities for disaster management:
National agencies concerned with disaster management, meteorology, hydrology, and emergency response, and their providers of data, services, research, and analysis;
The United Nations Platform for Space-based Informa-tion for Disaster Management and Emergency Response (UN-SPIDER);
CEOS / GEOSS activities involved with the use of satellite data in disaster management and risk assessment.
The GEOSS AIP-3 reference scenario on Disaster Manage-ment abstracts four types of “actors” for disaster response:
Initiators who trigger and coordinate the disaster response – e.g. local or regional public agencies,
Actuators who carry out the disaster response – e.g., regional civil protection, insurance companies, NGOs,
Processors providers of raw data or derived information – such as private or public entities conducting earth observation or environmental monitoring, and
Coordinators who facilitate interactions among the other actors – whether at the local level for emergency management operations, or at the international level, brokering data from many different sources.
The recent VALID report from UN-SPIDER provides a framework and examples for assessing stakeholder impacts from the use of geoinformation in disaster management.
The full disaster management lifecycle (not just the response phase) involves a broad set of stakeholders, ranging from regional and international organizations to local community groups. In addition, the research com-munity is responsible for creating and validating information products from satellite and other observations. Stakeholders may potentially include individual citizens as well – as recipients of information for decisions at a wide range of scales; sources of relevant data (crowdsourcing), or partici-pants in decision-making processes. As mentioned earlier, stakeholders may engage in any of the activities depicted previously; and may influence and benefit from any of them: even though the flow of information is often a one-way dissemination process today, the model depicted here imposes no such restriction. Given such a broad set of stakeholders, characterizing and prioritizing their require-ments will be crucial. For this reason, GEOSS includes a User Requirements Registry (Plag et al., 2010) that allows stake-holders to register their information needs.

GEOSS Architecture for the Use of Remote Sensing Products in Disaster Management and Risk Assessment
11
3.e. Principles
As a voluntary partnership of hundreds of governments and intergovernmental, international, and regional organiza-tions, GEO provides a framework within which these partners can coordinate their strategies and investments towards building GEOSS. The GEOSS 10-Year Implementa-tion Plan provides several principles as the basis for this joint framework:
GEOSS is a System of Systems – not a single integrated system but a set of Earth Observation systems that each member operates autonomously for its own needs, and that interacts with other GEOSS systems to provide more than the sum of the individual systems.
GEOSS Data Sharing Principles – data sharing is encouraged by all GEOSS participants, with full and open exchange of data and metadata with minimum time delay and minimum cost as the goal. Use of data need not imply an endorsement of its original intent. Members are “encouraged” to share these data either free of charge or at reproduction cost in support of research and education.
4
Interoperability Arrangements are also recommended for all GEOSS participants; they enable interaction among GEOSS’ different systems. These arrangements generally consist of software interfaces based on industry standards; they are adopted by the GEOSS Standards and Interoperability Forum and maintained in a Standards Registry.
(These principles are spelled out in the GEOSS Strategic and Tactical Guidance to Contributors.)
3.f. Enterprise view: points of comparison
The enterprise view described here may benefit from a comparison with real-world examples.
One example is the International Charter on Space and Major Disasters, an agreement among Space Agencies and other national bodies around the world to supply space-based data to relief efforts in the aftermath of major disas-ters. Upon “activation” by one of its authorized users, the Charter brokers the delivery of data from its members at no cost in support of emergency response efforts. The Inter-national Charter’s activation process is depicted in Figure 4.
The Enterprise Viewpoint highlights at least two significant differences between the International Charter’s scope and that of CEOS / GEOSS’ support to disaster management and
4 CEOS’ new Data Policy Portal captures the data access policies of CEOS
Mission and Instrument combinations in order to promote improved access
to data and GEO data sharing principles.
risk assessment. First, the International Charter supports only short-term relief activities – not rehabilitation, recon-struction, prevention, preparedness, or scientific research. Furthermore, the Charter is tightly focused on obtaining and distributing its members’ data; it relies on third-party value-added providers to turn these data into maps suitable for end users in the field. By contrast, CEOS / GEOSS are con-cerned with the entire chain of data services and trans-formations that make the data accessible to end users through all the phases of the disaster lifecycle.
GEO’s Geohazard Supersites and Natural Laboratories (GSNL) (Figure 5, next page) are another point of com-parison. These provide access to data for a dozen reference sites around the world, including spaceborne Synthetic Aperture Radar, in situ GPS crustal deformation measure-ments, and earthquake observations.
The data are intended for research and disaster prepared-ness, but may also support operational agencies in disaster response. Supersites have been established in geologically active regions (Istanbul, Tokyo, Los Angeles, Vancouver), near active volcanoes in Italy, Iceland, and Hawaii (USA), and in the aftermath of major earthquake events in Chile, China, Japan, and Haiti. The Supersites bear several similarities to the enterprise described here, with their emphasis on open access to information and their fit to the GEO objectives and work plan. However they limit their focus to seismic risks, leaving floods, storms, and other types of hazards to others; and (as of 2013) they have emphasized research over operational uses.
Figure 4. International Charter activation process

GEOSS Architecture for the Use of Remote Sensing Products in Disaster Management and Risk Assessment
12
Figure 5. GEO Geohazard Supersites concept5
4. Information Viewpoint
4.a. Overview
With the above enterprise definition as a basis, the Infor-mation viewpoint emphasizes the information used or produced by the enterprise. The GEOSS AIP Architecture, Part 3 (“Information Viewpoint: Earth Observations”), pro-vides generic starting points for the Information viewpoint: spatial referencing; observations and features; environ-mental models; maps and alerts, data quality (esp. uncer-tainty and provenance); semantics and ontologies; registries and metadata; and data policy (including rights manage-ment and licensing). It portrays these topics as in Figure 6.
These general-purpose definitions provide a basis for add-itional specifics in the area of Disaster Management and Risk Assessment:
Observations or parameters needed to address different kinds of disasters;
Metadata that facilitate finding and choosing data and maximizing its utility for disaster management;
Vocabulary used by different communities in disaster management (including multilingual data and systems);
5 From Geohazard Supersites and Natural Laboratories Strategic Plan, GEO
Task DI-09-01c (Oct. 2011)
The types of data transformation, image co-registration, interpretation, extraction, synthesis, etc. operating (or needed) between sensors and users.
The Information viewpoint is concerned with the semantic or conceptual aspects of these matters: the syntax, encod-ing, or transport of information appear in the Engineering and Technology viewpoints.
The following subsections provide more detail on each of these topics.
4.b. Observations and parameters by
hazard type
The CEOS / GEO DI-06-09 report, “Use of Satellites for Risk Management” (Nov. 2008) details information needs for each of the eight hazard types outlined previously (flooding, windstorms, earthquakes, landslides, volcanoes, wildfires, drought, and tsunamis) across the four disaster lifecycle phases (mitigation, warning, response, recovery), resulting in eight tables like the one in Figure 7 (next page).
Several additional sources inform the view of information needs and usage for satellite data support to disaster management. For example, the GEO report on Critical Earth Observations Priorities (Oct. 2010) surveyed a range of hazard types and identified the following observation priorities overall:
Elevation / Topography
Flood Properties Wave Properties
Precipitation Stream / River Properties
Surface Deformation Gravity Field
Wind Properties Water Properties
Soil Properties Ice / Snow Properties
Seismicity Magnetic Field
Atmospheric Properties Thermal Properties
Figure 6. AIP-5 Information Viewpoint topics

GEOSS Architecture for the Use of Remote Sensing Products in Disaster Management and Risk Assessment
13
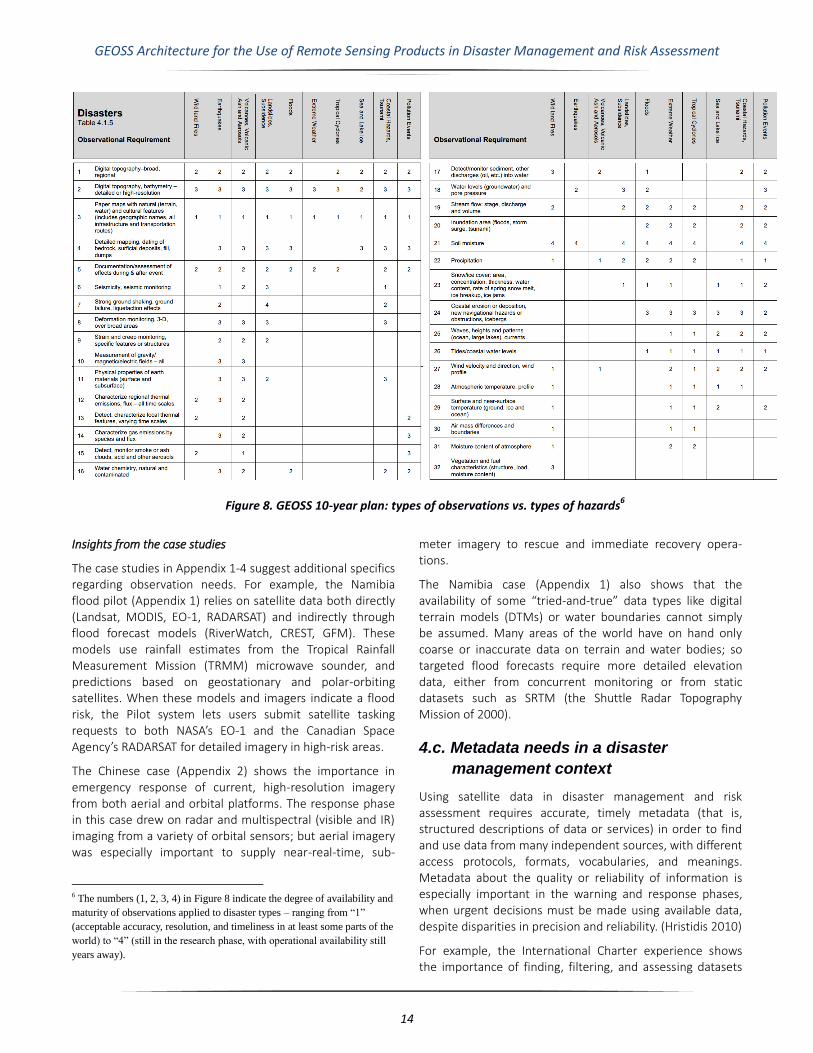
The GEOSS 10-Year Implementation Plan Reference Docu-ment (Feb. 2005) details information needs for each of 10 different kinds of disasters (Figure 8, next page). Of the ob-servations listed in Figure 8, only a few (3-7, 9, 11, 18, 19) rely entirely on non-satellite data sources; most are satellite-based (or can be).
Another useful way to structure the information view for satellite data is by sensor types (microwave soundings (passive and active), optical imaging (visible, near-infrared, thermal), radar, laser / LIDAR, etc.) and orbit types (geo-stationary, polar-orbiting, etc.). CEOS’ Missions, Instruments, and Measurements (MIM) database links over 140 measure-ments (atmospheric, land, ocean, snow & ice, and gravity
and magnetic properties) to the instruments used to sense these properties from orbit; and the missions that carry (or carried, or will carry) these sensors.
To help users navigate the orbital patterns of the hundreds of current and future Earth-observing satellites, CEOS has developed an online tool, the CEOS Visualization Environ-ment (COVE). COVE lets users display the coverage areas of several hundred satellite sensors on an interactive globe, and identify when satellites covered (or will cover) particular geographic areas, or when and where two satellites obser-ved (or will observe) the same region within hours or minutes of each other.
Figure 7. Example - Information needs for wildfires
(From CEOS / GEO DI-06-09 report, “Use of Satellites for Risk Management”, 11/2008)
GEOSS Architecture for the Use of Remote Sensing Products in Disaster Management and Risk Assessment
14
Insights from the case studies
The case studies in Appendix 1-4 suggest additional specifics regarding observation needs. For example, the Namibia flood pilot (Appendix 1) relies on satellite data both directly (Landsat, MODIS, EO-1, RADARSAT) and indirectly through flood forecast models (RiverWatch, CREST, GFM). These models use rainfall estimates from the Tropical Rainfall Measurement Mission (TRMM) microwave sounder, and predictions based on geostationary and polar-orbiting satellites. When these models and imagers indicate a flood risk, the Pilot system lets users submit satellite tasking requests to both NASA’s EO-1 and the Canadian Space Agency’s RADARSAT for detailed imagery in high-risk areas.
The Chinese case (Appendix 2) shows the importance in emergency response of current, high-resolution imagery from both aerial and orbital platforms. The response phase in this case drew on radar and multispectral (visible and IR) imaging from a variety of orbital sensors; but aerial imagery was especially important to supply near-real-time, sub-
6 The numbers (1, 2, 3, 4) in Figure 8 indicate the degree of availability and
maturity of observations applied to disaster types – ranging from “1”
(acceptable accuracy, resolution, and timeliness in at least some parts of the
world) to “4” (still in the research phase, with operational availability still
years away).
meter imagery to rescue and immediate recovery opera-tions.
The Namibia case (Appendix 1) also shows that the availability of some “tried-and-true” data types like digital terrain models (DTMs) or water boundaries cannot simply be assumed. Many areas of the world have on hand only coarse or inaccurate data on terrain and water bodies; so targeted flood forecasts require more detailed elevation data, either from concurrent monitoring or from static datasets such as SRTM (the Shuttle Radar Topography Mission of 2000).
4.c. Metadata needs in a disaster
management context
Using satellite data in disaster management and risk assessment requires accurate, timely metadata (that is, structured descriptions of data or services) in order to find and use data from many independent sources, with different access protocols, formats, vocabularies, and meanings. Metadata about the quality or reliability of information is especially important in the warning and response phases, when urgent decisions must be made using available data, despite disparities in precision and reliability. (Hristidis 2010)
For example, the International Charter experience shows the importance of finding, filtering, and assessing datasets
Figure 8. GEOSS 10-year plan: types of observations vs. types of hazards6

GEOSS Architecture for the Use of Remote Sensing Products in Disaster Management and Risk Assessment
15
from many different providers quickly and accurately for a particular use. The Namibia pilot and Chinese case (Appendices 1, 2) highlight the need for accurate georef-erencing when integrating satellite imagery with aerial and ground-based observations.
Furthermore, effective disaster management requires col-laboration across disciplinary and other boundaries: so it relies on clearly defining and communicating the meaning of various terms. This is the purpose of semantic metadata, collected in dictionaries or taxonomies. For example, CEOS’ Missions, Instruments, and Measurements (MIM) database, mentioned earlier, provides a common vocabulary frame-work to support interagency coordination and planning. Similarly, the University Corporation for Atmospheric Research (UCAR) Climate and Forecast (CF) Conventions include a table of standard names for hundreds of observed and synthetic variables used in atmospheric modeling. CEOS’ International Directory Network (IDN) relies on a taxonomy of Earth Observation and Earth Science topics to provide a set of community-specific search portals into NASA’s Global Change Master Directory. (One of these portals is a “MIM IDN Portal” that lets users search IDN for many of the Measurements listed in the MIM database.)
Beyond simple taxonomies, full-featured ontologies (such as NASA’s Semantic Web for Earth and Environmental Terminology (SWEET)) encode both definitions and type / subtype relationships in a formal, machine-readable form; this enables automated (or semi-automated) methods to interpret and translate semantic information from different communities or information sources. Several such efforts have used standard encodings such as the Resource Description Framework (RDF), Web Ontology Language (OWL), and SPARQL Protocol and RDF Query Language.
4.d. Data operations needed in a disaster
management context
Support to disaster management activities relies on several clusters of satellite data processing operations:
Decoding raw satellite data into grids of sensor measure-ments. The result of this operation is often referred to as a “Level1” data product, or a Sensor Data Record: its grid values consist of signal strengths (i.e., radiance / reflectance / return) at various wavelengths, estimated based on intrinsic sensor characteristics. In the case of Synthetic Aperture Radar (SAR) this may include estimating back-scatter coefficients from complex images, multi-looking, and speckle filtering. Although often considered an intermediate product, the resulting data are often used as-is, without further processing, especially in time-sensitive applications such as disaster warning or response.
Georeferencing. This operation uses satellite orbit charac-teristics (and sometimes a detailed earth terrain model) to compute the earth location of the values shown in satellite data, and is a necessary step in applying satellite data to applications on the ground. Often this is used in georecti-fication of the satellite image, a process that resamples the data grid to one aligned with the axes of a well-known earth coordinate reference system (e.g., longitude and latitude), to facilitate overlaying the image with other geospatial data or images. This latter operation is important in disaster management and risk assessment given the broad variety of users (many unfamiliar with satellite orbit or swath details) who need to put the information to use on their own, in often hard-to-predict ways.
Atmospheric correction is usually needed before using satellite imagery: this process uses meteorological data to cancel out the effect of aerosols or other atmospheric conditions and to estimate true radiance and reflectance values at the earth’s surface.
Image interpretation is an important part of turning satellite data into actionable products for use by decision-makers. Interpretation can be based on a wide variety of algorithms and may draw on many different ancillary data sources. Interpretation may apply a simple threshold (such as ther-mal hotspots indicating likely fires), statistical clustering across several optical wavelengths (image classification), or more complex inferences of physical conditions such as atmospheric chemistry or biomass density. All phases of disaster management draw on image interpretation in myriad ways to estimate physical conditions and trends on the ground and in the atmosphere.
Feature extraction and data reduction detect discrete physical phenomena in the data (such as water / inundation boundaries; topography; storm cells) and output geometric representations of these phenomena.
Pan-sharpening is a process often applied to multi-spectral imagery to maximize its spatial resolution by convolving it with finer-grain panchromatic imagery. This is especially useful in a disaster response setting, given the frequent need for high spatial resolution.
Finally, whenever satellite image products are intended for interactive (multi-resolution) browsing in a graphical user interface, they must be resampled and stored as “image pyramids” at multiple resolutions (often 1/2, 1/4, 1/8 ... of the native resolution). This simple but compute-intensive process allows rapid response to requests for reduced-resolution views of large areas.
GEOSS Architecture for the Use of Remote Sensing Products in Disaster Management and Risk Assessment
16
5. Computation viewpoint
5.a. Overview
The Computation viewpoint describes the kinds of services that comprise the overall system of systems and the kinds of interfaces that allow them to interact. The GEOSS AIP defined a Service Oriented Architecture (SOA) featuring the following service types:
Catalog registration and search services;
Portrayal and display services, including services for map styling and symbology;
Data access and ordering services for files, geographic features, and gridded data;
Services for describing, finding, and running data processing algorithms;
Services for describing, accessing, and tasking environ-mental sensors; and
Services for user management (chiefly authentication and authorization).
These might be described as “infrastructure-level” services. Supporting disaster management and risk assessment with satellite data builds on these service types, with a few additional specifics:
An emphasis on data access, processing (image inter-pretation), portrayal, and sensor tasking. Catalog search and discovery services are also important in the research stages leading towards an operational disas-ters capability.
Although the GEOSS AIP Architecture emphasizes a user-driven Service-Oriented Architecture, many disaster management contexts require data broadcasts or distribution of physical media.
Additional constraints and requirements on these ser-vices and their interfaces (e.g., near-real-time perform-ance, cross-community interoperability, ease of use and maintenance).
The following sections detail each of these topics.
5.b. Service types needed for disaster
management and risk assessment
The classes of services most relevant to supporting disaster management and risk assessment with satellite data are Data Access, Data Processing (especially image interpreta-tion and modeling); Portrayal; and Sensor Tasking. User management (esp. authentication) services are also important when tasking satellite data, or when data are
provided with restrictions on access. These services may be employed in all of the processes defined by the enterprise (see 2.d and Fig. 3 above) – Event Detection, Situational Awareness, Sensor Tasking and Data Acquisition, Modeling and Prediction, Analysis and Interpretation, and Product Dissemination.
The Namibia case (Appendix 1) and others show a limited role for traditional catalog search and discovery in the disaster prediction and response phases: these phases are more likely to rely on near real-time data from well-known sources, or on contributions or referrals. However, the Inter-national Charter experience shows that even for known data sources, choosing the right data for a given purpose (based on cloud cover, spatial / temporal / spectral coverage, or other criteria) can be a challenge with data from multiple sources: effective browsing services have a significant role to play in speeding the selection of appropriate data. Furthermore, services for finding and evaluating data, sensors, and algorithms play important roles in the research and initiation stages (described in 3.c above). In particular, the Geohazard Supersites sketched earlier (3.f) conduct research to develop the products needed for disaster management; they would also contribute these new products to catalogs (often implying new metadata needs).
The Chinese case (Appendix 2) illustrates the use of (and the need to improve) visualization services, especially user-interactive or 3-dimensional display capabilities. It also highlights simulations in the disaster recovery phase (in that case, to assess hydrologic impacts of major earth-moving operations).
Beyond the warning and immediate response phases of the disaster lifecycle, the CEOS ad hoc Disasters Risk Manage-ment Working Group proposed a “Recovery Observatory” intended to broaden access to data collected in the aftermath of a disaster, for subsequent efforts in disaster recovery, mitigation, risk assessment, or scientific research.
Satellite tasking – that is, submitting requests for future data from an earth-orbiting sensor – is still mostly an internal, manual process; but a few providers are beginning to introduce tasking services. These generally apply to the warning and response phases; but as this capability becomes more widely available, it may also support other phases. It may use proprietary / ad hoc protocols (as does NASA’s Virtual Mission Operation Center (VMOC) in requesting DigiGlobe imagery); or industry standards such as the Open Geospatial Consortium (OGC) Sensor Planning Service (SPS) and Sensor Observation Service (SOS).
7
7 The OGC Sensor Observation Service is the basis for the Cam¬paign
Manager used by the Namibia Flood Pilot system (see Appendix 1) to
request data from NASA’s EO-1 satellite.

GEOSS Architecture for the Use of Remote Sensing Products in Disaster Management and Risk Assessment
17
Finally, collaboration services and tools facilitate joint decisions and coordinated activities by independent organiz-ations, as often required in response to disaster event. These are especially important in large-scale response activities such as those depicted in the China and Japan case studies in Appendices 2 and 3.
Service-oriented alternatives
The disaster management context may require services outside the AIP’s emphasis on user-driven (“pull”) services – namely, broadcast or “push” of data or messages to users. For example, Wireless Emergency Alerts send messages to all mobile devices in a given set of cells in a cellular network. GEO’s GEONETCast broadcasts data and products from a variety of sources to a worldwide user community via commercial telecommunication satellites. “Push” services like these speed the dissemination of data to subscribers (only) – whereas user-driven services (e.g., via the Web) facilitate public access and dissemination.
Finally, in a disaster response or recovery setting, one may not have a functioning network available for data dissemina-tion. Therefore the use of physical media must also be part of the generalized service architecture. The Japan earth-quake case (Appendix 3) provides a real-life example: JAXA printed some 50 satellite images and hand-delivered them to disaster response agencies.
5.c. Constraints and requirements specific
to disaster management
One key need for using satellite data in disaster response is near-real-time performance of the necessary services. Traditional satellite ground segments may not be able to deliver data in a timely fashion for rapidly-changing weather or flooding conditions, or for search and rescue operations. Some satellites (such as the Terra, Aqua, and Suomi NPP polar-orbiting satellites; or geostationary satellites such as GOES) offer unencrypted direct broadcast of imagery, making it immediately available to any receiving station in range of their transmitter. However, in the China case (Appendix 2), only aerial imagery offered the rapid access and sub-meter resolution they needed for damage assessment and rescue operations after the Sichuan earth-quake. (This highlights the importance of near-real-time fusion of data from multiple sources.)
Cross-community interoperability and ease of use are also important in disaster management, given the wide variety of end users, few of whom are data specialists and not all of whom can be identified in advance. Interoperability over lengthy timelines and across many data sources is also important for risk assessment and mitigation efforts based on long-term statistical trends.
The Namibia pilot (Appendix 1) highlights the advantages of easy system configuration with limited staff resources. This may be an important consideration in other contexts as well, as people seek to build flexible systems for handling and sharing information in all phases of the disaster lifecycle with a diverse mix of stakeholder knowledge and skills.
6. Engineering and Technology
Viewpoints
The Reference Model of Open Distributed Processing includes two additional viewpoints:
The Engineering viewpoint describes the types of compo-nents (i.e., bundles of services with interfaces) needed to perform the computations and information interchanges described in the previous viewpoints.
The Technology viewpoint deals with specific service instances (e.g., servers available at particular addresses) of the types described in the Engineering viewpoint.
These viewpoints highlight the following aspects of using satellite data in disaster management and risk assessment:
The components needed to provide information products to users. Examples include data access and catalog servers; end-user clients (esp. specialized portals) for catalog search and service invocation, and intermed-iating (“middleware”) services for user authentication, data processing, notification, etc.
The interface standards needed to support interoper-ation among systems supporting diverse stakeholder teams addressing disasters, and for system resilience.
The characteristics of particular satellite sensors and data streams; data catalogs; forecasting facilities, etc. These may involve tailoring resources defined by the GEOSS Common Infrastructure to disaster applications.
The sensor platforms (satellites, aircraft, in situ stations) and their communication links. This infrastructure affects data acquisition lead time, data product latency, and responsiveness to user requests.
The GEOSS AIP Architecture, Parts 5 and 6, provide a useful basis for these viewpoints. Enabling the use of satellite data in disaster management requires tailoring the AIP architec-ture with specific components, clients, and services.
The engineering and technology viewpoints will become more concrete as satellite data system implementers and disaster management stakeholders apply the enterprise, information, and computation viewpoints in their efforts.

GEOSS Architecture for the Use of Remote Sensing Products in Disaster Management and Risk Assessment
18
References
CEOS Data Policy Portal - http://ceos-data.org/
CEOS Disaster SBA Team / GEO DI-06-09 Report, Use of Satellite Data for Risk Management, Volume I – Estab-lishing Global Requirements for Earth Observation Satellite Data to Support Multi-hazard Disaster Manage-ment throughout the Disaster Cycle (Nov. 2008) http://www.ceos.org/images/Global_User_Requirements_For_Disaster_Management_Nov2008_small.pdf
CEOS Missions, Instruments, and Measurements (MIM) database - http://database.eohandbook.com/
CEOS Visualization Environment (COVE) http://www.ceos-cove.org/
CEOS WGISS Terms of Reference, Annex A of WGISS 5-Year Plan (Sept. 2012) http://www.ceos.org/images/WGISS/Documents/WGISS_5yrPlan_V15.0e.doc
Douglas, John; Usländer, Thomas; Schimak, Gerald; Esteban, J. F.; Denzer, Ralf. 2008. "An Open Distributed Architecture for Sensor Networks for Risk Management." Sensors Vol. 8, no. 3: 1755-1773 - http://www.mdpi.com/1424-8220/8/3/1755
GEO 2012-2015 Work Plan (Rev. 2, Dec. 2012) http://www.earthobservations.org/documents/work plan/GEO 2012-2015 Work Plan_Rev2.pdf
GEO report on Critical Earth Observations Priorities (Oct. 2010, rev. April 2011) http://sbageotask.larc.nasa.gov/Final_SBA_Report_US0901a_Apr2011.pdf
GEO Strategic Guidance for Current and Potential Contri-butors to GEOSS (Oct. 2007) http://www.earthobservations.org/documents/portal/25_Strategic%20Guidance%20Document.pdf
GEO Tactical Guidance for Current and Potential Con-tributors to GEOSS, GEO-IV Doc. 24 (Nov. 2007) http://www.earthobservations.org/documents/portal/24_Tactical Guidance for current and potential contributors to GEOSS.pdf
Geohazard Supersites and Natural Laboratories Strategic Plan, GEO Task DI-09-01c (Oct. 2011) http://www.earthobservations.org/documents/gsnl/20111010_GSNL_StrategicPlan_draft_FA1_0.pdf
GEOSS 10-Year Implementation Plan Reference Document (Feb. 2005) http://www.earthobservations.org/documents/10-Year Plan Reference Document.pdf
GEOSS 10-year implementation plan (Feb. 2005) http://www.earthobservations.org/documents/10-Year Implementation Plan.pdf
GEOSS Strategic Targets, GEO-VI Plenary Document 12 (Rev 1) (Nov. 2009) http://www.earthobservations.org/documents/geo_vi/12_GEOSS Strategic Targets Rev1.pdf
GEOSS Architecture Implementation Pilot (AIP), Phase 5 Call for Participation (March 2012) http://earthobservations.org/geoss_call_aip.shtml
GEOSS AIP-5 Architecture (March 2012) http://earthobservations.org/documents/cfp/201202_geoss_cfp_aip5_architecture.pdf
GEOSS Data Sharing Principles http://www.earthobservations.org/geoss_dsp.shtml
GEOSS GEONETCast http://www.eumetsat.int/website/home/Data/DataDelivery/EUMETCast/GEONETCast
GEOSS Standards and Interoperability Forum http://seabass.ieee.org/groups/geoss/index.php?option=com_content&task=view&id=17&Itemid=61
GEOSS Standards Registry - http://seabass.ieee.org/groups/geoss/
Hristidis, Vagelis, Chen, Shu-Ching, Li, Tao, Luis, Steven, and Deng, Yi, 2010. Survey of data management and analysis in disaster situations), The Journal of Systems and Software vol. 83, pp. 1701–1714. http://www.cs.ucr.edu/~vagelis/publications/disaster-survey2010.pdf
INSPIRE Spatial Data Infrastructure http://inspire.jrc.ec.europa.eu/reports/position_papers/inspire_ast_pp_v4_3_en.pdf
International Charter: Space and Major Disasters
http://www.disasterscharter.org/home
OGC Reference Model http://www.opengeospatial.org/standards/orm
ORCHESTRA disaster management framework http://www.eu-orchestra.org/
Plag, Hans-Peter, Kaufman, Justin, and Ondich, Greg, 2010. GEOSS User Requirements Registry http://www.earthobservations.org/documents/committees/uic/201011_UES/16_plag_urr.pdf
United Nations International Strategy for Disaster Risk Reduction (UN-ISDR), Terminology http://www.unisdr.org/we/inform/terminology
UN-SPIDER (United Nations Platform for Space-Based Information for Disaster Management and Emergency Response), Space Applications Matrix http://www.un-spider.org/sam
UN-SPIDER, 2013. The Value of Geoinformation for Disaster and Risk Management (VALID): Benefit Analysis and Stake-holder Assessment http://www.un-spider.org/sites/default/files/VALIDPublication.pdf
World Economic Forum, “A vision for managing natural disaster risk: proposals for public/private stakeholder solutions” (April 2011) http://www3.weforum.org/docs/WEF_VisionManagingNaturalDisaster_Proposal_2011.pdf
GEOSS Architecture for the Use of Remote Sensing Products in Disaster Management and Risk Assessment
19
Appendix 1: Namibia Flood Pilot
Based on personal communications with Dan Mandl (NASA) and Stuart Frye (SGT/NASA)
In the first quarter of 2011, unusually heavy rains in Northern Namibia led to the highest floods in the country’s history. A state of emergency was declared after flood waves peaked in late March and again in early April, leading to severe flooding which claimed 62 lives.
To support response and recovery efforts with satellite data, the International Charter (Space and Major Disasters) was activated; with the following parties leading the effort in the field:
Namibia Dept. of Hydrology (with Guido van Langen-hove as local coordinator)
United Nations (UNDP, UNOOSA)
Int’l Charter (in concert with the Canadian Space Agency and the Pacific Disaster Center)
NASA
Dan Mandl and Stuart Frye were involved in preparing for, and responding to, this and other flood events in the region. They describe their efforts in three phases. First was a rainfall estimate via satellite data, rain gauges, and hydro-logic models – in particular the RiverWatch model (from the University of Colorado) which they validated based on microwave soundings from NASA’s Tropical Rainfall Meas-urement Mission (TRMM). The Coupled Routing and Excess Storage (CREST) water balance model (from Oklahoma Uni-versity and NASA SERVIR) also served to estimate flow rates; and a Global 15km flood model by Robert Adler (of the University of Maryland) provided both a nowcast (using TRMM rainfall estimates) and a forecast (based on GOES / POES based rainfall predictions). Global monitoring imagers (NASA’s MODIS and Landsat in particular) also supplied data to these rainfall estimates.
When these models & data indicated a likely flood, the NASA team worked with local organizations such as the Namibia Hydrology Department to identify areas for acquiring high-resolution data from NASA’s Earth Obser-vation 1 (EO-1) satellite and the Canadian Space Agency’s RADARSAT satellite. All of the above was in advance of the International Charter activation (before disaster was declared).
The process of supplying satellite data to preparation and response efforts began with acquiring data from the EO-1
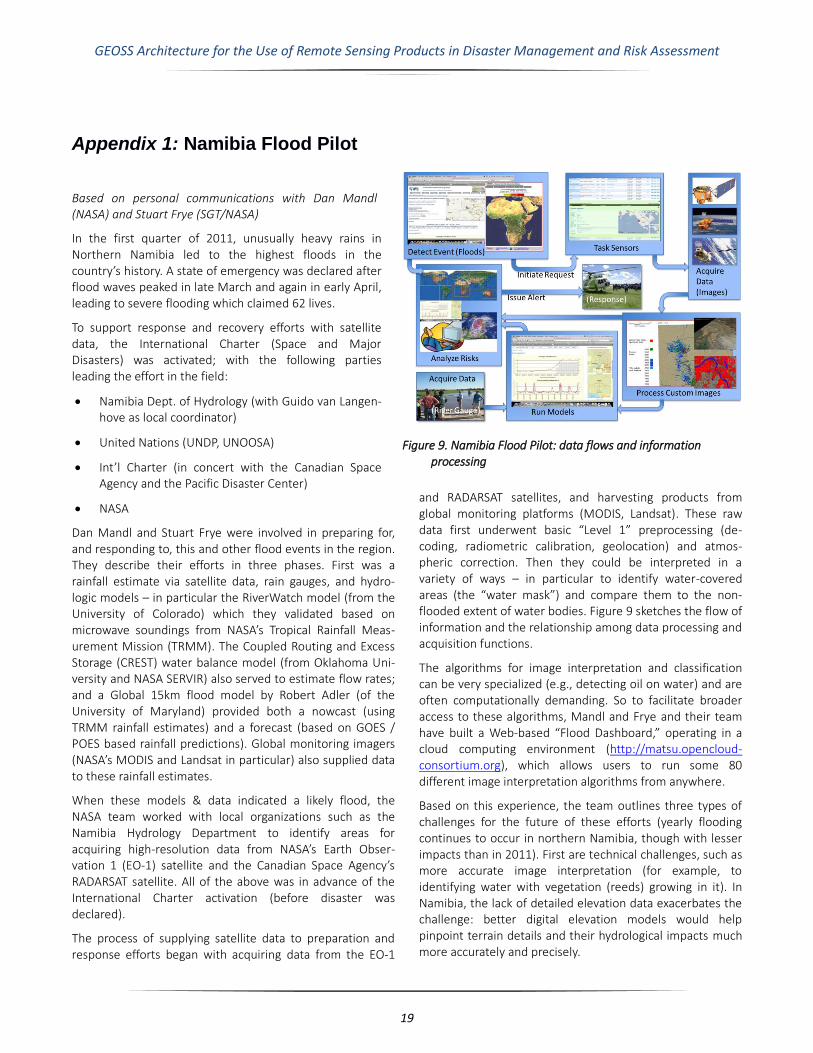
and RADARSAT satellites, and harvesting products from global monitoring platforms (MODIS, Landsat). These raw data first underwent basic “Level 1” preprocessing (de-coding, radiometric calibration, geolocation) and atmos-pheric correction. Then they could be interpreted in a variety of ways – in particular to identify water-covered areas (the “water mask”) and compare them to the non-flooded extent of water bodies. Figure 9 sketches the flow of information and the relationship among data processing and acquisition functions.
The algorithms for image interpretation and classification can be very specialized (e.g., detecting oil on water) and are often computationally demanding. So to facilitate broader access to these algorithms, Mandl and Frye and their team have built a Web-based “Flood Dashboard,” operating in a cloud computing environment (http://matsu.opencloud-consortium.org), which allows users to run some 80 different image interpretation algorithms from anywhere.
Based on this experience, the team outlines three types of challenges for the future of these efforts (yearly flooding continues to occur in northern Namibia, though with lesser impacts than in 2011). First are technical challenges, such as more accurate image interpretation (for example, to identifying water with vegetation (reeds) growing in it). In Namibia, the lack of detailed elevation data exacerbates the challenge: better digital elevation models would help pinpoint terrain details and their hydrological impacts much more accurately and precisely.
Figure 9. Namibia Flood Pilot: data flows and information processing
GEOSS Architecture for the Use of Remote Sensing Products in Disaster Management and Risk Assessment
20
A second set of challenges lies in coordination with the International Charter, to more easily identify areas of interest for data requests; to obtain quantitative data (not just pictures or maps) in a timely fashion, and to allow data sharing among all participants in a disaster response effort.
For future support to disaster preparation and response, the NASA team are establishing additional arrangements for satellite tasking – with Japan’s space agency (JAXA) for the GCOM satellite; with the French firm SPOT Image for the SPOT-5 satellite; and with DigitalGlobe, Inc. for the GeoEye and DigiGlobe satellites.

GEOSS Architecture for the Use of Remote Sensing Products in Disaster Management and Risk Assessment
21
Appendix 2: China Sichuan / Wenchuan earthquake
Based on email exchanges with Dingsheng Liu (Chinese Academy of Sciences) and on published articles by Deren Li (Wuhan University) and Huadong Guo et al. (Center for Earth Observation and Digital Earth, Chinese Academy of Sciences)
On Monday, May 12, 2008 at 14:28:01 local time, an earthquake of magnitude 7.9-8.0 struck the Sichuan Province (Wenchuan County) of China, ultimately claiming 69,170 lives, with over 17,000 more missing, 374,000 injured, and over 48 million severely affected.
To respond to the disaster, the Chinese Ministry of Science and Technology (MOST) and the Chinese Academy set up an earthquake data sharing mechanism involving 13 different government ministries such as the Ministry of Land Resources, Ministry of Water Resources, and others. They established a data sharing “pool” operated by the Center for Earth Observation and Digital Earth (CEODE). (Fig. 10.)
The immediate priority for disaster response (in the first 6 days) was rescuing survivors. This required rapidly identify-ing the worst-hit areas, routing rescue teams and dispatch-ing disaster relief. Timely decision support was paramount, using high-resolution aerial (optical and Synthetic Aperture Radar) and satellite images (to locate collapsed buildings) and data on local population distributions (to plan and
manage rescue efforts). This phase also relied on pre-disaster imagery from IRS-P6, LANDSAT-5, RADARSAT-1, SPOT (2/4, 5), IKONOS, and from these and many others post-disaster (TERRASAR-X, EROS-B, QUICKBIRD, ALOS, inter alia). Activation of the International Charter provided access to several other data products such as NASA’s ASTER, Landsat TM/ETM, IKONOS, WorldView, ALOS, TERRASAR-X, EROS-B, and COSMOS. Data processing operations performed on aerial and satellite imagery included georectification, contrast stretch, joining image scenes, image interpretation, and extracting graphics and digital elevation models. This phase required quite high spatial resolution (<=1m pixels); so airborne remote sensing was clearly the most important data source.
The next phase in the disaster response (from May 19 to June 12) was preventing secondary disasters from landslides and mudslides, which blocked rivers, creating “quake lakes” that could inundate low-lying settlements upstream – or
downstream if trapped water suddenly breached the barriers. Settlements threatened by such lakes had to be identified quickly based on airborne and space-borne optical imagery and radar data. Surveys supporting this phase required 5m to 30m pixels; so airborne optical remote sensing remained crucial; along with airborne synthetic aperture radar (SAR) which offered all-weather data acquisition.
This phase also relied on three-dimensional computing and simulation to assess secondary geological risks, and to facilitate collaboration, auxiliary mitigation, and analysis. Monitoring for secondary threats relied heavily on traditional man-machine interactive visual interpretation technology, given that automated algorithms were still inadequate for high-resolution obser-vations, and 3D interactive analysis technology was immature.
8
8 From Huadong Guo et al. (2012), Earth Observation for Earthquake
Disaster Monitoring and Assessment. In Earthquake Research and Analysis
- Statistical Studies, Observations and Planning, Dr Sebastiano D'Amico
(Ed.). InTech: http://www.intechopen.com/books/earthquake-research-and-
analysis-statistical-studies-observations-and-planning/earth-observation-
Figure 10. Center for Earth Observation and Digital Earth (CEODE) Emergency Data Sharing Service Framework
GEOSS Architecture for the Use of Remote Sensing Products in Disaster Management and Risk Assessment
22
The third phase of responding to this disaster – reconstruction and risk assessment – is still ongoing; it is expected to span five to ten years post-event.
Throughout the response to this event, high-resolution air-borne and space-borne remote sensing data proved timely and effective. However, future efforts would be aided by improved earth observations: Satellite imagery at 0.5-1.0 m resolution; Aerial imagery at 0.1-0.5m; with at least daily revisits over disaster-struck areas and improved geometric and radiometric quality.
Improved processing / interpretation capabilities would also be beneficial: for example, automated, near-real-time methods for data processing and reduction, given that photogrammetry specialists cannot rely on ground control after major earthquakes. Another need is fast, accurate, automated methods for processing multispectral optical and multi-polarization radar data.
The final need is improved data sharing and coordination – e.g., via a network unifying all high-resolution earth observa-tions. This experience also highlighted the importance of international cooperation in geospatial technology; and participation in programs like GEO and GEOSS.
9
for-earthquake-disaster-monitoring-and-assessment
9 Deren Li (2009), Earth Observation for Earthquake Disaster Monitoring
and Assessment, Photogrammetric Engineering & Remote Sensing Vol. 75
No. 5, May 2009, pp. 506-509.
http://www.asprs.org/a/publications/pers/2009journal/may/highlight1.pdf

GEOSS Architecture for the Use of Remote Sensing Products in Disaster Management and Risk Assessment
23
Appendix 3: Japan Sendai / Tohoku earthquake & tsunami
Based on a March 2012 JAXA report, “JAXA’s Response to the Great East Japan Earthquake: assistance using earth observation satellites and communication satellites”
On March 11, 2011, at 14:46 local time, a 9.0-magnitude earthquake occurred in the Pacific Ocean east of Japan, triggering an 11.8-meter tsunami wave that caused wide-spread damage along the Pacific coast from Tohoku to Kanto. These events caused an industrial disaster at the Fukushima Dai-ichi Nuclear Power Station that unfolded throughout the spring. These events, together with numer-ous strong aftershocks, have collectively become known as the Great East Japan Earthquake, claiming 15,783 lives, with nearly 6,000 more injured and over 4,000 missing.
JAXA’s Disaster Management Support Systems Office (DMSSO) oversaw the process of supporting disaster relief efforts with satellite data, working through preexisting relationships with Japan’s Cabinet offices and local govern-ments throughout the country (Fig. 11)
In the immediate aftermath of the earthquake, DMSSO tasked Japan’s Daichi Advanced Land Observation Satellite (ALOS) satellite: it obtained a total of 643 images between March 12 and April 20, 2012 (when the satellite suffered
10 From a presentation by Kengo Aizawa (JAXA) at the CEOS WGISS-33
meeting in Tokyo, Japan, April 2012.
permanent failure and was later decommissioned). JAXA also submitted requests for intensive satellite observations to two international coordinating bodies, the International Charter and Sentinel Asia. In the subsequent weeks, the space agencies of 14 nations supplied approximately 5,700 images from 27 satellites including Landsat-7, the World-view series, RADARSAT, IKONOS, the SPOT series, FORMO-SAT-2, RapidEye, THEOS, GeoEye, TERRASAR-X, KOMPSAT-2, DubaiSat-1, and others. Through the International Charter, the space agencies of Germany, Canada, the European Union, and Italy provided Synthetic Aperture Radar (SAR) data; and the United States, France, Germany, South Korea, China, and the UAE provided optical image data. Meanwhile, Sentinel Asia quickly coordinated data capture by Thailand’s THEOS satellites, India’s CARTOSAT-2, and Taiwan’s FORMO-SAT-2 – the latter providing twice-daily observations for two weeks, with near-real-time data delivery. Adding these data to JAXA’s own greatly increased the frequency of observations.
Daichi’s SAR data was used to detect crustal movement and landslide risks. Interferometric SAR (inSAR) helped to clarify the fault mechanisms of aftershocks in the weeks following March 11. Commercial, high-resolution satellite data were
used to assess damage to infrastructure and buildings, including the Fukushima Dai-ichi nuclear power plant.
To analyze the data, the DMSSO worked with JAXA’s Earth Observation Research Center and with the Asian Institute of Technology in Thailand; and the Inter-national Charter coordinated the creation of image products by groups in the United Nations, the USA, Germany, and France.
JAXA overlaid newly-acquired and ar-chive satellite imagery with geographic data (roads, etc.) to produce topographic maps for widespread distribution among national and local disaster-management agencies. It also produced false-color composites of multi-spectral (incl. infrared) imagery to highlight and assess infrastructure damage, flooding and landslide extents, and other conditions of interest. True- and false-color compos-
ites made from multispectral imagery also helped to detect liquefaction and fires caused by earthquakes.
Figure 11. Data dissemination arrangements for disaster response between JAXA and national and local governments
10
GEOSS Architecture for the Use of Remote Sensing Products in Disaster Management and Risk Assessment
24
In all, JAXA created over 1,700 products from its own Daichi satellite data and from data received from others through the International Charter and Sentinel Asia. These products fell into 5 broad categories: satellite-based maps (usually at reduced resolution, with roads and major landmarks overlaid), damage analyses (including before/after pairs and SAR interferograms), flood damage assessment, assess-ments of the Fukushima Dai-ichi nuclear power plant, and accident analyses (fires, sediment damage, debris).
All of the resulting products were distributed in the form of digital images (in JPEG, GeoTIFF, or PDF format), digital data (shapefiles, spreadsheets) – or even large sheets of printed paper, some of which were hand-carried across Tokyo to Cabinet offices of the Japanese government for use by individual prefectures.
Based on this experience, JAXA outlines several areas for improvement: sharing workloads with external institutions for timely delivery of a wide range of data products; building regional bases across Japan for data handling and interpretation; quickly restoring communication and information services to affected areas; and keeping stakeholders and the media informed of its activities. It has accelerated preparations for the launch of Daichi’s successor satellites, including a Data Relay test Satellite, to be able to image any part of the country on any given day (Daichi observations of the March 11 disaster areas weren’t possible until the next day, March 12). JAXA has also begun to promote research into new sensors for monitoring thermal change and detecting tsunamis, two needs that the March 2011 events made clear.

GEOSS Architecture for the Use of Remote Sensing Products in Disaster Management and Risk Assessment
25
Appendix 4: International Charter – Space and Major Disasters
Based on interviews with Brenda Jones (USGS), Michael Goodman (NASA), and Stuart Frye (SGT / NASA); and reference documents
Charter Overview
The International Charter on Space and Major Disasters facilitates acquiring satellite data and delivering it to disaster response efforts. It acts as a data broker between end users and many of the world’s space agencies, in a process known as a “Charter Activation,” depicted in Figure 12.
(For more on the Charter’s membership, process, and goals, see http://www.disasterscharter.org/.)
Member perspectives
The US Geological Survey (USGS) is a member of the
International Charter: it receives requests for Charter activation from anyone, but especially US entities; and responds with data from USGS, NASA & other agencies, US vendors, and others. Brenda Jones of USGS coordinates this process; she points out that finding, choosing, and requesting data, or tasking sensors to capture data, is a mostly manual process, due in part to license / usage restrictions stipulated by many data providers. (She estimates that satellite owners are unlikely to accept automated requests for 10-15 years). The process does however use a planning / tasking tool based on ESA’s SAVOIR (Space Avionics Open Interface Architecture – see for example http://www.erts2012.org/Site/0P2RUC89/6C-1.pdf).
Ms. Jones’ experience with the International Charter suggests that easing restrictions on data access would be beneficial: for example, granting use of Charter-brokered
Fig. 12. International Charter Activation Process

GEOSS Architecture for the Use of Remote Sensing Products in Disaster Management and Risk Assessment
26
data by entire end user communities (not just the requester); or access to post-event products for recovery and research.
She has also found that it can be a major effort to identify just the right data to meet users’ requests and to avoid data overload (e.g., in March 2011 JAXA got ‘too much data’ for the tsunami and damage assessment). Furthermore, the products are complex; and end users are often under pressure in a crisis situation. This underlines the need to work with end users in advance of the crisis; to deploy tools that can help end users get (only) the information they need; to match products to audiences; and to facilitate the use of these products.
Provider Perspective
NASA is a provider of data to the International Charter; for domestic events, it works under the auspices of the Interagency Remote Sensing Coordination Cell (IRSCC – a group of US Federal agencies chaired by the US Dept. of Homeland Security). As NASA’s Michael Goodman recalls, in the aftermath of Hurricane Irene (2011) NASA provided MODIS flood products and EO-1 and ASTER data; and several NASA specialists formulated ASTER and EO-1 requests (bounding boxes) based on cloud cover, imagery swaths, and other criteria. This experience showed that first responders need both simple images and real data for analysis, and
confirmed that better tools and methods for choosing data would enable faster support.
User Perspectives
The Namibia Flood / Sensor Web Pilot also interacted with the International Charter, as an end user requesting data related to the 2011 floods in Namibia. Working with the Pacific Disaster Center as their Project Manager, Stuart Frye (of SGT, Inc. / NASA) and his team found that the Charter’s policies for data access were difficult to understand, or not well explained. They also found that because the Charter sent data to a Value-Adding Specialist (see diagram above) rather than directly to the requester, the end-users they worked with received only static pictures (in PDF or JPEG format), rather than quantitative observations that they could analyze or interpret for themselves. (Brenda Jones, USGS’ liaison to the Charter, suggests that this may have been a lack of communication, as the Project Manager can also send the data directly to end users, without generating products from the data.) They also found the process for requesting data through the Charter could be improved: for example, even though a Charter activation requires the submission of latitude and longitude coordinates, they were instructed to specify areas of interest by place-names, which tended to reduce the precision and efficiency of their requests.
GEOSS Architecture for the Use of Remote Sensing Products in Disaster Management and Risk Assessment
27
Appendix 5: (Alternative / Future) Case Study Candidates
The following case studies were under consideration for further study, above and beyond the four detailed earlier in this Appendix.
Disaster response scenarios and lessons
Thailand floods of 2011
Technology pilots
NASU / NSAU Wide Area Grid (WAG) Testbed for Flood Monitoring
Caribbean disasters task for CEOS
Thailand wildfire sensor web
Thailand flood sensor web
Global Volcano SensorWeb
Virtual Mission Operation Center (VMOC) support to USGS Hazards Data Distribution System (HDDS)
Experiences with the International Charter
Japan earthquake data for E-DECIDER
Other data brokers
Disaster Management Constellation – Satellites built by Surrey Ltd. SSTL & operated by DMC International Imaging for Spain, Turkey, China, Algeria, United Kingdom, and Nigeria
Sentinel Asia for Environment (SAFE) – Satellite tasking / data requests from Aqua, Terra, MTSAT
GEONETCAST – Radio-frequency broadcast of data from NOAA, WMO, EUMETSAT, and NASA
Value-added services / Decision support
NASA SERVIR – provides satellite data and online applications to address environmental threats and natural disasters in Central America, East Africa, and the Himalayas.
NASA Earthquake Data Enhanced Cyberinfrastructure for Disaster Evaluation and Response (E-DECIDER) – delivers UAVSAR and InSAR interferograms, and optical imagery via the OGC Web Map Service (WMS).
NASA Land Atmosphere Near real-time Capability for EOS (LANCE-MODIS) – disseminates MODIS products rapidly via WMS.
SErvice Régional de Traitement d'Image et de Télédétection (SERTIT) / U. Strasbourg – Rapid Map-ping Service serving Int’l Charter and DMCii
EU Global Monitoring for Environment and Security (GMES) Emergency Response / powered by Seismic eArly warning For EuRope (SAFER)
EU ORCHESTRA project (Open Architecture and Spatial Data Infrastructure for Risk Management)
UN Platform for Space-based Information for Disaster Management and Emergency Response (SPIDER), within UN Office for Outer Space Affairs (UNOOSA)
Geohazard Supersites and Natural Laboratories
NOTE: UN-SPIDER has compiled several more case studies of disaster response involving remote sensing, and indexed the reports through its Space Applications Matrix.

GEOSS Architecture for the Use of Remote Sensing Products in Disaster Management and Risk Assessment
28
Appendix 6: Case Study Questionnaire
The following questions were used in email exchanges or interviews with practitioners in disaster management or risk assessment. They are phrased to pertain to a single event; however with minor adjustments they were applied to a pattern of events or to concrete activities or to capabilities for monitoring, prediction, or analysis.
1. Overview: Please summarize the disaster event in a few sentences, referring if possible to published or online articles (from news media, published articles, Wikipedia, or other sources).
2. Please indicate which organizations or individuals participated in
Responding to the disaster
Forecasting the disaster, or identifying high-risk times or places (if forecasting was possible)
Reducing the risk or impact of the disaster (e.g., evacuating populations, operating alert systems; set-ting building codes; operating sensor networks)
3. How did these organizations or individuals interact or collaborate with each other?
4. Who was involved in supplying satellite information to these activities?
5. What satellite information was used (or needed) to support these activities? In particular:
What types of observations? (e.g., meteorology / atmosphere; hydrology; seismic changes; vegetation...) What other observations might have been useful?
How frequent were the observations? Were they frequent enough?
How much detail did these data show? (pixel size, spectral bands) Was it enough?
6. What processing was performed on the data before users obtained it? (e.g., reformatting files; clipping / joining image scenes; contrast stretching; georectification; interpreting or classifying multispectral pixels, extracting graphics, etc.)
7. How do you think the information support to these activities could have been streamlined? Or, how could these activities have taken better advantage of available information?


![[REMOTE SENSING] 3-PM Remote Sensing](https://img.pdfslide.us/doc/110x75/61f2bbb282fa78206228d9e2/remote-sensing-3-pm-remote-sensing.jpg)


