Embed Size (px)
Citation preview
IJSRST1841295 | Received : 11 Feb 2018 | Accepted : 21 Feb 2018 | January-February-2018 [ (4) 2: 01-03 ]
© 2018 IJSRST | Volume 4 | Issue 2 | Print ISSN: 2395-6011 | Online ISSN: 2395-602X Themed Section: Science and Technology
962
Geospatial Technology Based Groundwater Potential Zone
Mapping In Parts of Noyyal Basin, Tamil Nadu, India Karung Phaisonreng Kom*, B. Gurugnanam, K. Kalaivanan
*Corresponding Author:
e-mail: [email protected]
ABSTRACT
Groundwater is considered as one of the most valuable hidden natural resources in the sub-surface. Generally,
the rapid growth of population, urbanization and agricultural development leads to a major issue for
progressively stresses of water in all over the world. Therefore, groundwater is gaining extensive attention to
meet the demands. This study aims to delineate the groundwater potential zone (GWPZ) in parts of Noyyal
basin, Tamil Nadu, India using remote sensing (RS) and geographical information system (GIS). Fissile
hornblende-biotite gneiss, hornblende-biotite gneiss, fluvial (black cotton soil with gypsum), granite,
charnockite, garnet sillimanite – graphite gneiss are the major rock types and amphibolite, fuchsite, sericite –
quartzite, pyroxene granulite, patches of ultramafic rocks and calc – granulite and limestone are minor rock
types in this region. Usually, the river flow is dependent both on northeast and southwest monsoons. The
downstream portion of the river mostly in Coimbatore city is extensively polluted due to the direct discharge of
domestic sewage and effluent from dyeing and bleaching industries. Consequently, groundwater close to the
river turns into contaminated. Hence, proper management and planning of the aquifer in this region are
mandatory. This planning includes preparation of groundwater prospective map to identify the groundwater
potential of the study area using RS and GIS. Several thematic layers such as geology, geomorphology, drainage,
drainage density, lineament, lineament density, slope, soil type, soil texture, soil depth and land use/land cover
(LU/LC) were built in the GIS environment to generate the groundwater potential zonation map of the study
area. Each individual thematic layer was given appropriate weight and ranking based on their contribution
towards groundwater recharge and storage using spatial analyst tool in ArcGIS 10.2. In this manner, a final map
i.e. groundwater potential zonation map (GWPZM) was produced by compiling all the required themes. The
map indicates that the GWPZ of the study area can be classified into four categories such as very good (32 km2
of the area), good (334 km2 of the area), moderate (727 km2 of the area) and poor (331 km2 of the area). The
region falling in very good groundwater potential category is auspicious for groundwater prospect. This study
validates that RS and GIS provides a pathway to delineate the groundwater possible zones of the study area.
Keywords: Groundwater Potential Zone, Remote Sensing, ArcGIS, Noyyal basin
I. INTRODUCTION
Groundwater is a concealed natural resource which is
found beneath Earth's surface that fills all the pore
spaces of soil and the fractures of rock formations. It is
universally accepted as the largest freshwater resource
available in the world. It is considered as one of the
most important natural resources which support both
human needs and economic development. The
demand for water is increasing drastically in
worldwide due to the rapid growth of population,
urbanization, industrialization, and agriculture and

International Journal of Scientific Research in Science and Technology (www.ijsrst.com)
1244
also become a dependable source of water supplies in
all climatic regions.
To find groundwater occurrence being in the
subsurface is mostly done based on the presence of
surface features like lineament, drainage, lithology,
geomorphology, soil, slope and LU/LC. The
occurrences of groundwater in hard rock terrains are
mainly in the opening or weak zones such as fractures,
joints, fissures and weathered rocks.
Integrated RS and GIS are extensively used for
delineating the groundwater possible zones. Remote
sensing is a powerful technique which is useful for
mapping the earth surface in a large area within a
short period of time with low cost. It provides
significant information about earth surface connected
to groundwater through various features like
lineament, lithology, topography, LU/LC, soil and
landforms which govern the subsurface water
conditions. It plays an effective tool for targeting
groundwater potential zone through the surface
features even though it cannot notice groundwater
directly. GIS offers an exceptional framework for
competently handling large and complex spatial
dataset. It is an important tool in the view of
demarcating groundwater prospective zones and
water resource management by integration and
analysis of multi-thematic layers (Carver 1991; Saraf
and Chaudhuray 1998; Nag 2005; Rokade et al. 2007;
Ganapuram et al. 2009; Magesh et al. 2012; Selvam et
al. 2012, 2014; Ghosh Prasanta Kumar et al. 2016).
The various thematic maps, namely, geology,
geomorphology, drainage and drainage density,
lineament and lineament density, slope, soil type, soil
depth, land use/land cover were generated using RS
and GIS and are compiled together to construct a
prospective groundwater map. In the present study,
the main objective is to identify Ground Water
Potential Zones in parts of Noyyal basin using
integrated RS and GIS techniques.
II. STUDY AREA
Figure 1. Location map of the study area
The Noyyal river is one of the most important
tributaries of the river Cauvery. It originates from the
Vellingiri hills in the Western Ghats in Tamil Nadu
and flows through Coimbatore, Tiruppur, Erode and
Karur districts, finally drains into the Cauvery river.
The study area is a part of the Noyyal basin which lies
between 10° 56′ 20.42″N to 11° 6′ 27.71″N latitude and
76° 39′ 20.98″E to 77° 17′ 36.45″E longitude, covering
an area of 1519.11 km2 (Figure 1). The river traverses
for a distance of 71 km within the study boundary. It
is located in the western part of the Coimbatore
district in Tamil Nadu, India. The water flow in the
river is seasonal and depends both on the northeast
and south-west monsoons which has a good flow
during these seasons. But, the area receives higher
rainfall during the southwest monsoon only.
Sporadically, flash floods occur when there is heavy
rain in the catchment areas. Apart from these periods,
there is an only scanty flow of water throughout the
year. The study area obtains an average annual rainfall
of 3000 mm. Direct discharge of effluent from dyeing
and bleaching industries and untreated domestic
sewage to the river consequences river pollution
extensively, therefore, contaminating the
groundwater adjacent to the river. The extensive
sinking of deep bore wells and scanty rainfall in the
region consequences in lowering the groundwater
table.

International Journal of Scientific Research in Science and Technology (www.ijsrst.com)
1245
III. METHODOLOGY
Integrated RS and GIS techniques were used to
delineate groundwater possible zones in the study area.
Survey of India (SOI) topographic sheets bearing
number 58A/12, 58A/16, 58B/9, 58B/13, 58E/4, 58E/8,
and 58F/1 on 1: 50,000 scale were used to prepare the
base map of the study area. All the toposheets were
geo-referenced into Universal Transverse Mercator
(UTM), World Geodetic System (WGS) 1984 using
ArcGIS 10.2 software. Geology map was prepared
from Geological Survey of India (GSI) map. Soil map
was prepared by digitizing the geo-referenced soil
map obtained from Soil Survey and Land Use
Organization (Department of Agriculture, Tamil Nadu)
and subsequently, it was updated with the help of
satellite imagery. The other thematic maps viz.,
geomorphology, lineament and lineament density,
LU/LC, slope, drainage and drainage density were
generated from satellite imageries and further updated
in GIS. Geomorphology, lineament and lineament
density and LU/LC maps were generated from Landsat
8. Slope and drainage maps were generated from
shuttle radar topography mission (SRTM) digital
elevation model (DEM) data. Drainage density map
was prepared using drainage layer and line density
tool in ArcGIS software. To generate the final
groundwater potentiality map of the study area, all
the different thematic layers were integrated with
weighted overlay in GIS. Weightage for each
individual features of a theme was assigned during
weighted overlay analyses which were mainly based
on the impact towards groundwater movement and
infiltration rate and each of the themes was given
ranked based on suitability for groundwater
occurrence. All the thematic layers were interrelated
to one another which provide significant information
regarding groundwater occurrence, therefore, helpful
for the preparation of groundwater prospective map of
the area. In GIS environment, each theme was
overlapping to one another to identify the
interconnecting polygon. In this manner, a new map
was generated by integrating two thematic maps.
Further, a composite map was overlaid on a third
thematic map, and so on. In this process, the final
composite map was generated. Thus, the groundwater
prospective map was produced. Based on this map, the
study area was categorized into four groundwater
prospective zones namely very good, good, moderate
and poor.
IV. RESULT AND DISCUSSION
Geomorphology
Geomorphology is the study of the nature and genesis
of its landforms shaped by physical, chemical and
biological processes functioning at or near the earth
surface. Geomorphology map was extracted from
Landsat 8. Generally, the map provides an information
about the presence of several geomorphological units
existing on the earth surface and offers room for
occurrences of groundwater in each unit (Pradhan
2009a, Thilgavathi et al. 2015). Geomorphology was
given highest weight among the other thematic layers
due to its unique role play in the movement and
storage of groundwater at any place. The study area
consists of various geomorphic units such as ridge type
structural hills, moderately weathered buried
pediplain, shallow weathered buried pediplain,
pediment/ valley floor, colluvial fan, moderate buried
pediment, shallow floodplain, upper bajada, hilltop
weathered and shallow buried pediment (Figure 2).
These geomorphological units are enormously
supportive for delineating groundwater possible zones.
Among the geographic units, moderately weathered
buried pediplain (226.28 km2) and shallow floodplain
(17.65 km2) are important units which allow widely
for movement and storage of groundwater. Shallow
weathered buried pediplain (799.79 km2) covers the
major portion of the study area. In the present study
area, the presence of geomorphological features such
as fissures, joints, porous zones in the geological
formations plays a vital role in controlling the
movement and storage of groundwater.

International Journal of Scientific Research in Science and Technology (www.ijsrst.com)
1246
Figure 2.Geomorphology map
Geology
Geology plays an important role in the occurrence of
groundwater. The quality and movement of
groundwater depend on both the physical and
chemical properties of the rocks. The geology of the
study area comprises mainly of fissile hornblende-
biotite gneiss, hornblende-biotite gneiss, fluvial (black
cotton soil with gypsum), granite, charnockite, garnet
sillimanite – graphite gneiss and follow by minor
rocks such as amphibolite, ultramafic rock, fuchsite,
sericite – quartzite, pyroxene granulite, calc –
granulite and limestone (Figure 3). Fissile hornblende-
biotite gneiss (Peninsular gneiss – younger phase) of
Bhavani Group is largely found in the central and
northeastern part of the study area. Migmatite
Complex of Hornblende – biotite gneiss occupies the
south and southern regions whereas fuchsite, sericite
– quartzite is seen in the southwestern portion. Fluvial
(black cotton soil with gypsum) of Recent to
Pleistocene Group is found in the west and
southwestern regions. Granite of Alkali Complex
occurs in the west, north and northeastern portions.
Charnockite Group of rock like charnockite is found
in northwestern and also found as patches in the east,
south and southeastern side, and pyroxene granulite is
seen in the southern part of the study area. Garnet
sillimanite – graphite gneiss and calc – granulite and
limestone of Khondalite Group occupy in the
southwestern region. The Satyamangalam Group of
amphibolite is found in the southwestern side and
ultramafic rock is found as patches in the
northwestern regions.
Figure 3. Geology map
Drainage and Drainage Density
Drainage pattern determines the characteristics of
both surface and sub-surface formations. The drainage
network provides pathways for the movement and
storage of groundwater. Areas with higher drainage
density indicate high runoff while the lesser the
drainage density, the lower the runoff and the higher
the possibility of groundwater occurrences (Olutoyin
et al.2013). Figure 4a reveals the drainage pattern of
the study area is originated mainly from the western
part of the study area where high hill slopes are
situated. Generally, the type of drainage pattern is
dendritic. Dense drainage pattern is mostly occupied
in the western part of the region than the rest.
Figure 4a. Drainage map

International Journal of Scientific Research in Science and Technology (www.ijsrst.com)
1247
According to Meijerink (2007), drainage density is a
measurement of the total length of all the streams and
rivers per unit area. It implies that permeability is
associated with low drainage density. Drainage
density of the study area is classified into five classes
as shown in Figure The very high drainage density (>
4000 m/ km2) and high drainage density (3000 - 4000
m/ km2) covers 47.91 km2 and 124.89 km2 of the
regions respectively. The region falls under these
categories indicates low infiltration. The moderate
drainage density (2000 – 3000 m/ km2) covered an
area of 260.78 km2 which suggests moderate
infiltration and recharge rate. The major portion of
the area (625.57 km2) is occupied by the low drainage
density (1000 – 2000 m/ km2) followed by very low
drainage density (1000 – 2000 m/ km2) covering an
area of 459.96 km2 (Figure 4b). These two categories
are found in every direction except in some western
part of the region. Generally, very high and high
drainage densities govern the suitability for recharge
and potential groundwater zone.
Figure 4b. Drainage Density map
Slope
The slope is one of the significant factors which is
interconnected to groundwater recharge. It controls
the rate of infiltration and surface runoff. It gives an
idea about the rate of groundwater recharge based on
the slope angles. The area having steep slope causes
less infiltration due to rapid surface runoff whereas,
flat and gentle slope areas encourages less runoff thus
allowing more time to percolate rainwater and
promotes substantial groundwater recharge. Flat and
gentle slopes are considered as good groundwater
recharge. The slope of the study area was prepared
from SRTM DEM, and was categorized based on the
range of slope into five classes and is illustrated in
Figure 5.
The area having <50 slopes is classed as ―very good‖ for
groundwater recharge because of the flat terrain and
relatively reduced runoff movement to downstream
whereas slope value having >200 represents high slope,
classed as ―very poor‖ for groundwater recharge. The
map clearly shows that majority of the study area falls
under <50 category which indicates flat to a gentle
slope and some in the western part is indicated as high
slope which is mostly hilly region.
Figure 5. Slope map
Lineaments and Lineament Density
The lineaments are linear features on the Earth’s
surface that reflects the underlying geological
structures such as faults, fracture zones, shear zones
and igneous intrusions like dykes. They are
categorized as secondary porosity and permeability
and are good indicators of groundwater. They are
visible on satellite images as tonal differences
compared to other terrain features. Hydrogeologically,
these are considered as the weaker zones of bedrocks
in the earth’s crust, formed due to the earth
movement; the connection between the lineaments
provide room for movement and storage of
groundwater (Rao and Jugran 2003, Thilagavathi et al.
International Journal of Scientific Research in Science and Technology (www.ijsrst.com)
1248
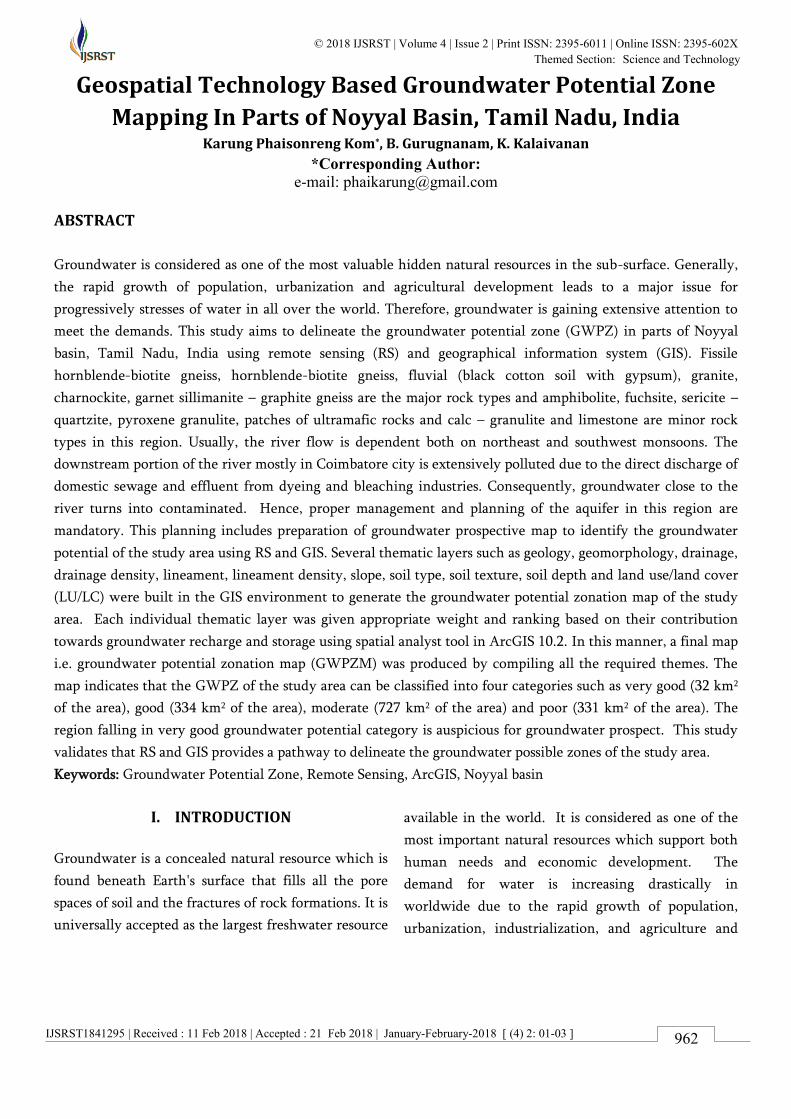
2015). Groundwater recharge can be targeted in the
region having major lineaments than joints because of
their greater widths, greater lengths and acting as
channels and better interconnections with other
fractures (Edet et al. 1998; Fathy Abdalla 2012).
The lineament map was extracted from Landsat 8.
Figure 6a shows that majority of lineaments in the
study area were obtained in NW-SE, NE-SW
directions. The lineament density map was generated
based on the presence of the linear feature in the
study area using GIS. The area having very high and
high lineament densities are considered as very good
groundwater potential zones. Figure 6b reveals that
the lineament density of the study area comprises of
five categories. The very high lineament density
(>10000 m/ km2) is found in the central part of the
area covering a very small area of 8.70 km2 compared
to the others. The region having high lineament
density (8000-10000 m/ km2) is found in the central,
north, south and eastern part of an area of 61.58 km2.
Majority of the area comes under very low lineament
density
Figure 6a. Lineament map
category (< 2000 m/ km2) scattering throughout the
directions for an area of 1116.06 km2.
Figure 6b. Lineament Density map
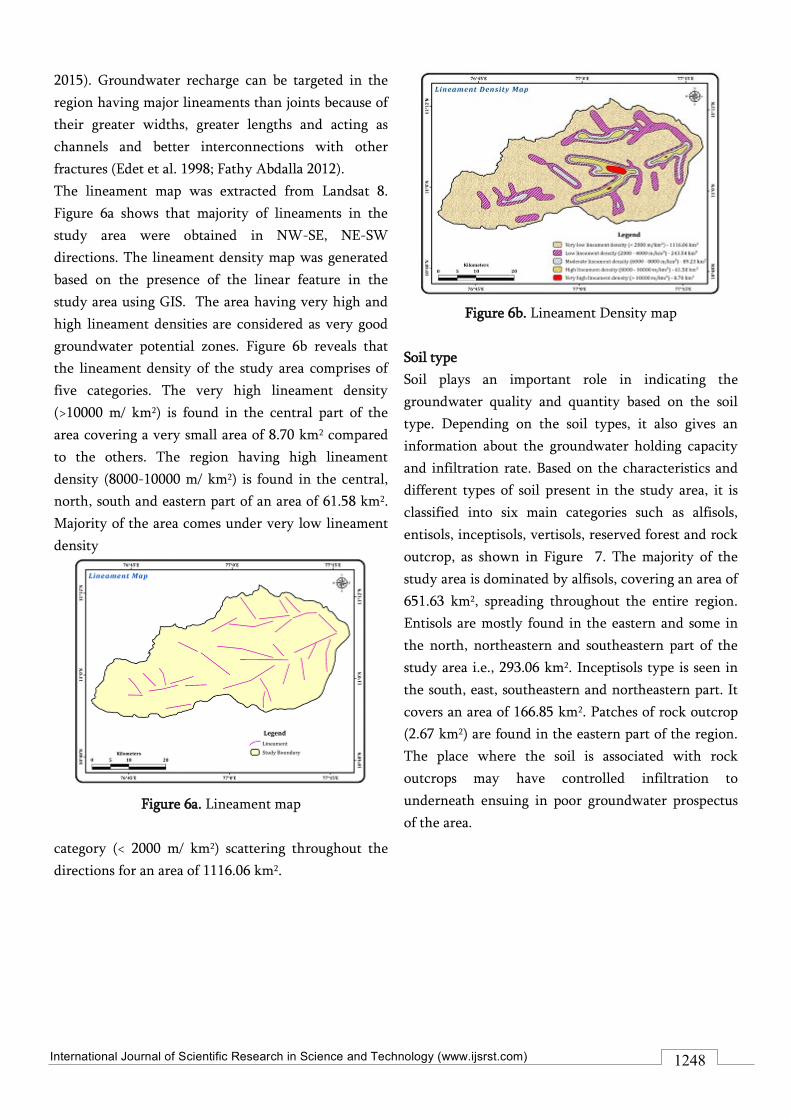
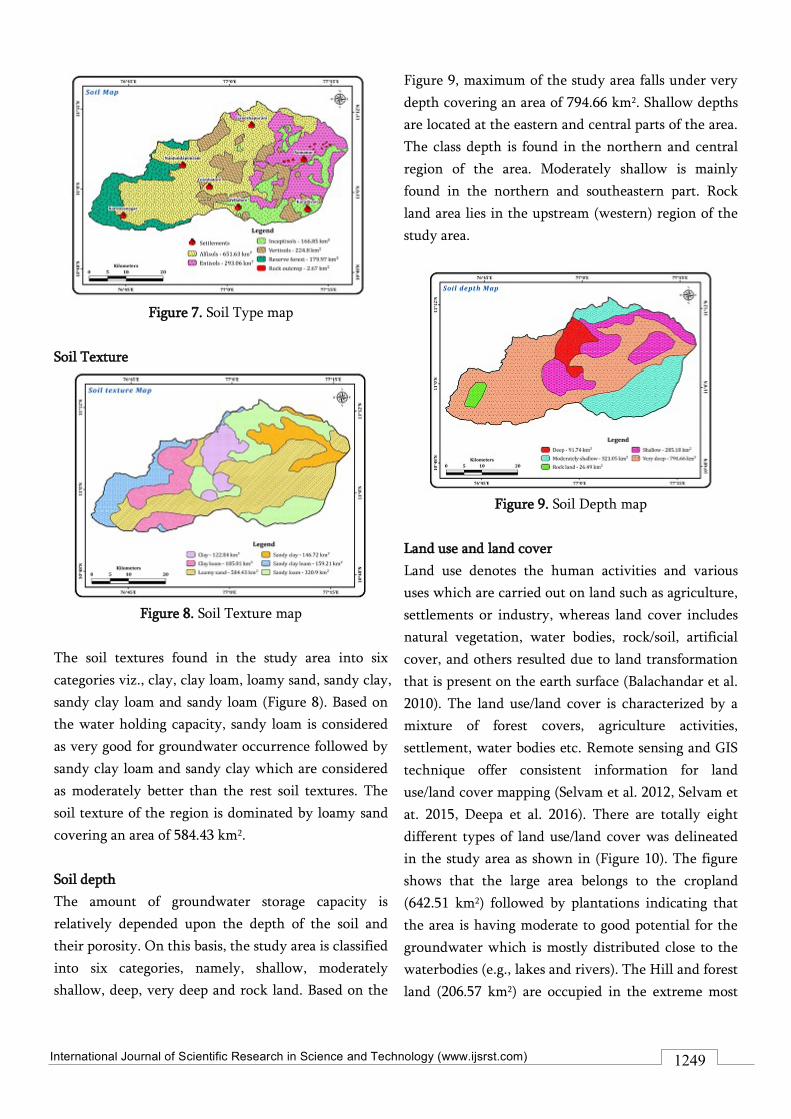
Soil type
Soil plays an important role in indicating the
groundwater quality and quantity based on the soil
type. Depending on the soil types, it also gives an
information about the groundwater holding capacity
and infiltration rate. Based on the characteristics and
different types of soil present in the study area, it is
classified into six main categories such as alfisols,
entisols, inceptisols, vertisols, reserved forest and rock
outcrop, as shown in Figure 7. The majority of the
study area is dominated by alfisols, covering an area of
651.63 km2, spreading throughout the entire region.
Entisols are mostly found in the eastern and some in
the north, northeastern and southeastern part of the
study area i.e., 293.06 km2. Inceptisols type is seen in
the south, east, southeastern and northeastern part. It
covers an area of 166.85 km2. Patches of rock outcrop
(2.67 km2) are found in the eastern part of the region.
The place where the soil is associated with rock
outcrops may have controlled infiltration to
underneath ensuing in poor groundwater prospectus
of the area.
International Journal of Scientific Research in Science and Technology (www.ijsrst.com)
1249
Figure 7. Soil Type map
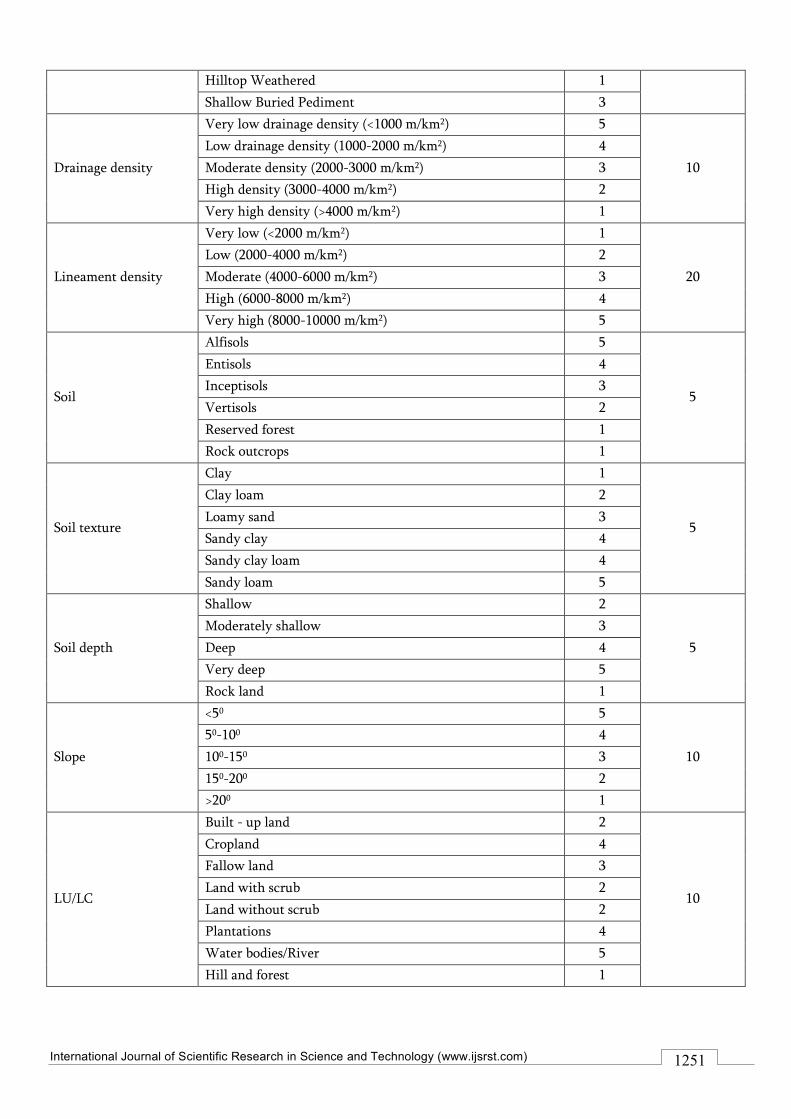
Soil Texture
Figure 8. Soil Texture map
The soil textures found in the study area into six
categories viz., clay, clay loam, loamy sand, sandy clay,
sandy clay loam and sandy loam (Figure 8). Based on
the water holding capacity, sandy loam is considered
as very good for groundwater occurrence followed by
sandy clay loam and sandy clay which are considered
as moderately better than the rest soil textures. The
soil texture of the region is dominated by loamy sand
covering an area of 584.43 km2.
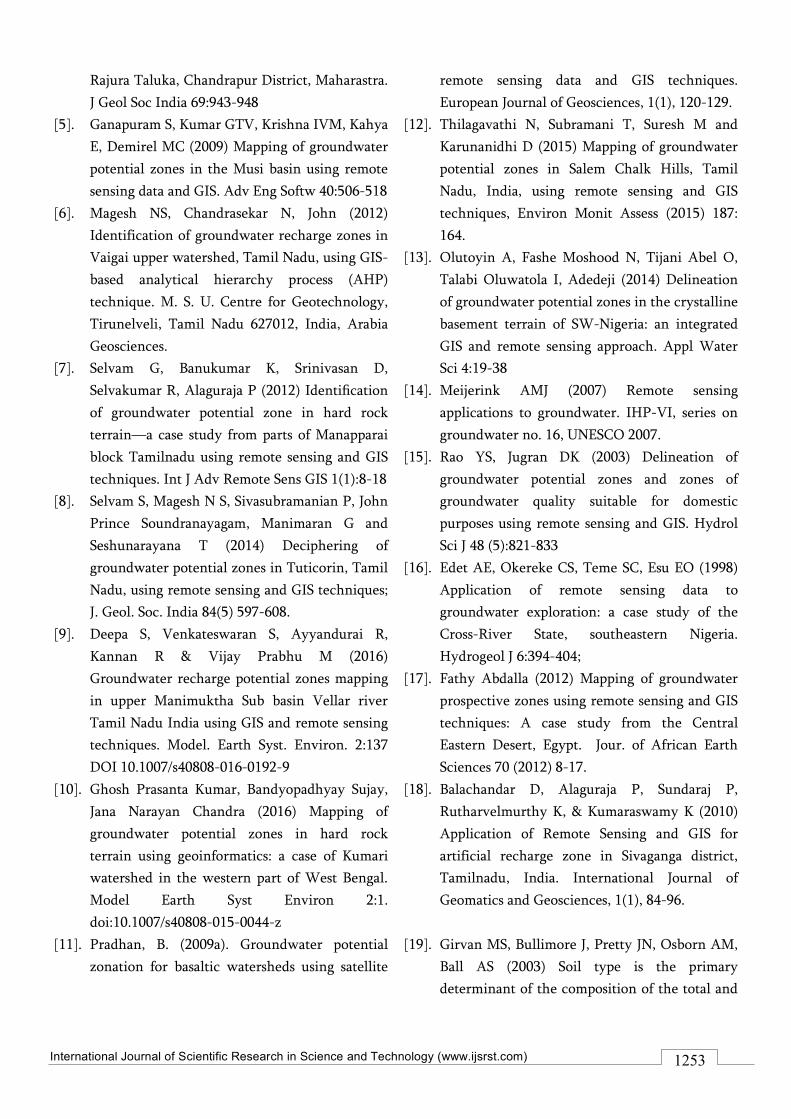
Soil depth
The amount of groundwater storage capacity is
relatively depended upon the depth of the soil and
their porosity. On this basis, the study area is classified
into six categories, namely, shallow, moderately
shallow, deep, very deep and rock land. Based on the
Figure 9, maximum of the study area falls under very
depth covering an area of 794.66 km2. Shallow depths
are located at the eastern and central parts of the area.
The class depth is found in the northern and central
region of the area. Moderately shallow is mainly
found in the northern and southeastern part. Rock
land area lies in the upstream (western) region of the
study area.
Figure 9. Soil Depth map
Land use and land cover
Land use denotes the human activities and various
uses which are carried out on land such as agriculture,
settlements or industry, whereas land cover includes
natural vegetation, water bodies, rock/soil, artificial
cover, and others resulted due to land transformation
that is present on the earth surface (Balachandar et al.
2010). The land use/land cover is characterized by a
mixture of forest covers, agriculture activities,
settlement, water bodies etc. Remote sensing and GIS
technique offer consistent information for land
use/land cover mapping (Selvam et al. 2012, Selvam et
at. 2015, Deepa et al. 2016). There are totally eight
different types of land use/land cover was delineated
in the study area as shown in (Figure 10). The figure
shows that the large area belongs to the cropland
(642.51 km2) followed by plantations indicating that
the area is having moderate to good potential for the
groundwater which is mostly distributed close to the
waterbodies (e.g., lakes and rivers). The Hill and forest
land (206.57 km2) are occupied in the extreme most

International Journal of Scientific Research in Science and Technology (www.ijsrst.com)
1250
western part of the study area boundary. An area of
27.36 km2 is covered by waterbodies which represent
high potential for the occurrences of underneath
groundwater.
Figure 10. Land use/ land cover map
Weighted overlay analysis
The reason behind for usefulness of weighted overlay
analysis is being able to make spatial complexity to
simplicity in suitability analysis and site selection are
mainly based on general measurement of dissimilar
and diverse impacts (Girvan et al. 2003; Kuria et al.
2011, Malay et al. 2016). To delineate groundwater
potential zone, all the thematic layers were given
suitable weight using the procedures of weighted
overlay in Spatial Analyst Tools of ArcGIS 10.2.
Weightage and ranking for each individual feature of
the thematic layers were assigned based on their
impacts towards the groundwater recharge as shown
in Table 1. All the thematic vector layers were
reformed into raster format and overlaid in Arc/Info.
The parameter which has high weight value
represents significant influences in the groundwater
potentiality. Among the thematic layers,
geomorphology was assigned highest weight due to
the significant role play for groundwater occurrence.
To get a final output map of groundwater potential
zone, each individual factors of the thematic layers
were superimposed to one another.
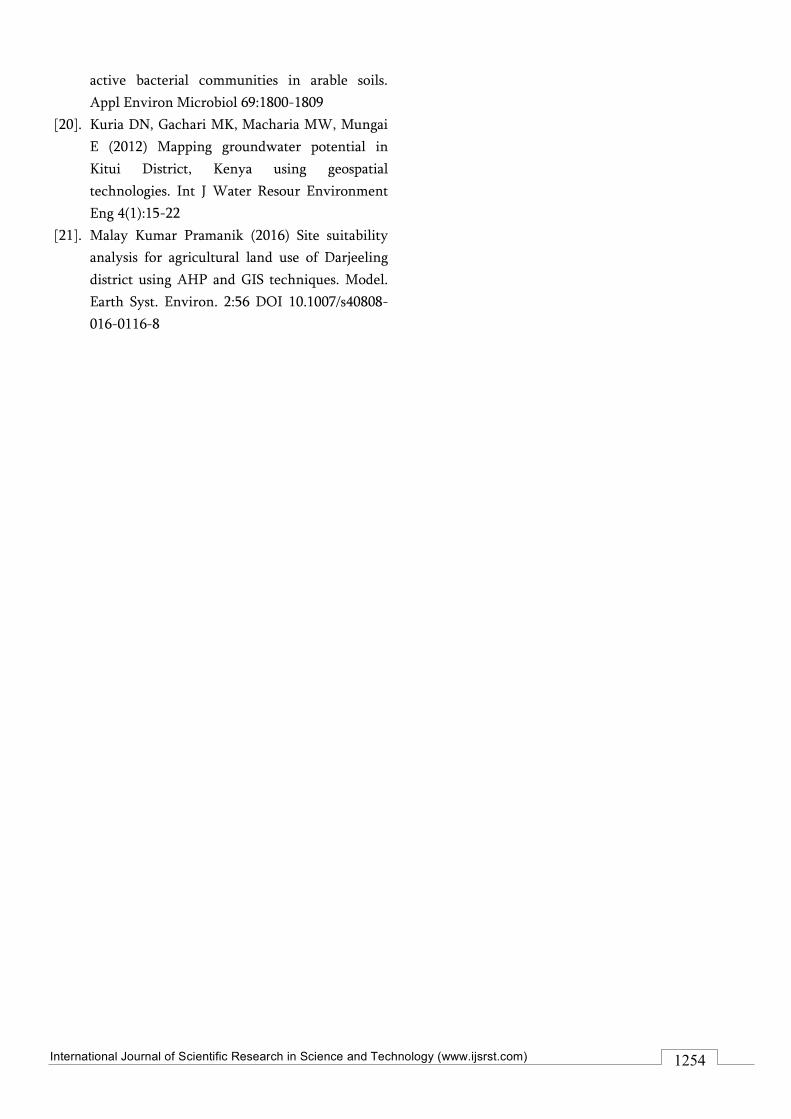
Table 1. Weight and ranking for different thematic layers used for delineation of groundwater potential zones
Theme Feature/class Rank Weightages
Geology
Amphibolite 1
10
Calc – granulite and limestone 3
Charnockite 1
Fissile hornblende-biotite gneiss 2
Fluvial 5
Fuchsite, sericite – quartzite 3
Garnet sillimanite – graphite gneiss 5
Granite 2
Hornblende – biotite gneiss 5
Pyroxene granulite 2
Ultramafic 1
Geomorphology
Ridge type structural hills 1
25
Moderately weathered buried pediplain 5
Shallow weathered buried pediplain 3
Pediment/ Valley floor 4
Colluvial fan 2
Moderate buried pediment 2
Shallow floodplain 5
Upper Bazada 1
International Journal of Scientific Research in Science and Technology (www.ijsrst.com)
1251
Hilltop Weathered 1
Shallow Buried Pediment 3
Drainage density
Very low drainage density (<1000 m/km2) 5
10
Low drainage density (1000-2000 m/km2) 4
Moderate density (2000-3000 m/km2) 3
High density (3000-4000 m/km2) 2
Very high density (>4000 m/km2) 1
Lineament density
Very low (<2000 m/km2) 1
20
Low (2000-4000 m/km2) 2
Moderate (4000-6000 m/km2) 3
High (6000-8000 m/km2) 4
Very high (8000-10000 m/km2) 5
Soil
Alfisols 5
5
Entisols 4
Inceptisols 3
Vertisols 2
Reserved forest 1
Rock outcrops 1
Soil texture
Clay 1
5
Clay loam 2
Loamy sand 3
Sandy clay 4
Sandy clay loam 4
Sandy loam 5
Soil depth
Shallow 2
5
Moderately shallow 3
Deep 4
Very deep 5
Rock land 1
Slope
<50 5
10
50-100 4
100-150 3
150-200 2
>200 1
LU/LC
Built - up land 2
10
Cropland 4
Fallow land 3
Land with scrub 2
Land without scrub 2
Plantations 4
Water bodies/River 5
Hill and forest 1

International Journal of Scientific Research in Science and Technology (www.ijsrst.com)
1252
Figure 11. Groundwater potential zone map
Groundwater potential zone
Figure 11 illustrated the groundwater potential zone
map of the study area was classified into four zones –
very good, good, moderate and poor. The maximum
study area falls under moderate potential zone which
covers 727 km2 area, spreading all over the entire
study area and found largely in the flat terrain. Good
potential zone (334 km2) and very good potential zone
(32 km2) were mainly found close to the waterbodies
(lakes, rivers, etc) where major cultivation is practiced
and also covered by fallow land. Poor potential zone
(331 km2) was found in the hilly terrain of upstream
region and granitic terrain in the downstream region,
indicating high runoff and less infiltration.
V. CONCLUSION
Integrated use of RS and GIS techniques proved to be
a powerful tool for demarcating different groundwater
prospective zones in the study area. Various thematic
maps (i.e., geology, geomorphology, drainage and
drainage density, lineament and lineament density,
soil map, soil texture, soil texture and LU/LC) were
produced from the geospatial environment which
plays a significant role in storing and transmit
groundwater. All the maps are integrated with
weighted to generate a final map, GWPZM. Based on
the GWPZM, the study area was divided into four
zones, viz., very good, good, moderate and poor. The
present study shows that 32 km2 out of the total study
area are identified as ―very good groundwater
potential zones‖. The reason for favorable of
groundwater occurrence in this region is due to the
factors like the occurrence of highly weathered, low
gentle slope resulting in slow surface runoff which
means slow infiltration rate of the region. It also
shows that an appreciable amount of groundwater
occurrence is highly possible due to very low drainage
density and adjacent to the stream channels. The
region having higher lineament length density is very
good for groundwater potential since lineaments are
described as a permeable zone. Geospatial
technologies evidence the major role being taken to
explore and delineate groundwater recourses in any
areas to a large extent with low cost, short time and
low labor. The map obtained by this method provides
information about subsurface water condition of the
area. The study suggested that the GWPZM generated
will serve as useful guidelines for planners, engineers
and decision makers providing quick decision- making
in the management of groundwater resources, site
selection for GW exploration and exploitation.
VI. REFERENCES
[1]. Carver S (1991) Integrating multi-criteria
evaluation with the geographic information
system. Int. J Geogr Inf Sci5 (3):321-339.
[2]. Saraf AK, Chaudhuray PR (1998) Integrated
remote sensing and GIS for groundwater
exploration and identification of artificial
recharge sites. Int J Remote Sens 19(10):1825-
1841
[3]. Nag SK (2005) Application of lineament density
and hydrogeomorphology to delineate
groundwater potential zones of Bagmundi Block
in Purulia District, West Bengal. J Indian Soc
Remote Sens 33(4):521-529
[4]. Rokade VM, Kundal P, Joshi AK (2007)
Groundwater potential modeling through
remote sensing and GIS: a case study from
International Journal of Scientific Research in Science and Technology (www.ijsrst.com)
1253
Rajura Taluka, Chandrapur District, Maharastra.
J Geol Soc India 69:943-948
[5]. Ganapuram S, Kumar GTV, Krishna IVM, Kahya
E, Demirel MC (2009) Mapping of groundwater
potential zones in the Musi basin using remote
sensing data and GIS. Adv Eng Softw 40:506-518
[6]. Magesh NS, Chandrasekar N, John (2012)
Identification of groundwater recharge zones in
Vaigai upper watershed, Tamil Nadu, using GIS-
based analytical hierarchy process (AHP)
technique. M. S. U. Centre for Geotechnology,
Tirunelveli, Tamil Nadu 627012, India, Arabia
Geosciences.
[7]. Selvam G, Banukumar K, Srinivasan D,
Selvakumar R, Alaguraja P (2012) Identification
of groundwater potential zone in hard rock
terrain—a case study from parts of Manapparai
block Tamilnadu using remote sensing and GIS
techniques. Int J Adv Remote Sens GIS 1(1):8-18
[8]. Selvam S, Magesh N S, Sivasubramanian P, John
Prince Soundranayagam, Manimaran G and
Seshunarayana T (2014) Deciphering of
groundwater potential zones in Tuticorin, Tamil
Nadu, using remote sensing and GIS techniques;
J. Geol. Soc. India 84(5) 597-608.
[9]. Deepa S, Venkateswaran S, Ayyandurai R,
Kannan R & Vijay Prabhu M (2016)
Groundwater recharge potential zones mapping
in upper Manimuktha Sub basin Vellar river
Tamil Nadu India using GIS and remote sensing
techniques. Model. Earth Syst. Environ. 2:137
DOI 10.1007/s40808-016-0192-9
[10]. Ghosh Prasanta Kumar, Bandyopadhyay Sujay,
Jana Narayan Chandra (2016) Mapping of
groundwater potential zones in hard rock
terrain using geoinformatics: a case of Kumari
watershed in the western part of West Bengal.
Model Earth Syst Environ 2:1.
doi:10.1007/s40808-015-0044-z
[11]. Pradhan, B. (2009a). Groundwater potential
zonation for basaltic watersheds using satellite
remote sensing data and GIS techniques.
European Journal of Geosciences, 1(1), 120-129.
[12]. Thilagavathi N, Subramani T, Suresh M and
Karunanidhi D (2015) Mapping of groundwater
potential zones in Salem Chalk Hills, Tamil
Nadu, India, using remote sensing and GIS
techniques, Environ Monit Assess (2015) 187:
164.
[13]. Olutoyin A, Fashe Moshood N, Tijani Abel O,
Talabi Oluwatola I, Adedeji (2014) Delineation
of groundwater potential zones in the crystalline
basement terrain of SW-Nigeria: an integrated
GIS and remote sensing approach. Appl Water
Sci 4:19-38
[14]. Meijerink AMJ (2007) Remote sensing
applications to groundwater. IHP-VI, series on
groundwater no. 16, UNESCO 2007.
[15]. Rao YS, Jugran DK (2003) Delineation of
groundwater potential zones and zones of
groundwater quality suitable for domestic
purposes using remote sensing and GIS. Hydrol
Sci J 48 (5):821-833
[16]. Edet AE, Okereke CS, Teme SC, Esu EO (1998)
Application of remote sensing data to
groundwater exploration: a case study of the
Cross-River State, southeastern Nigeria.
Hydrogeol J 6:394-404;
[17]. Fathy Abdalla (2012) Mapping of groundwater
prospective zones using remote sensing and GIS
techniques: A case study from the Central
Eastern Desert, Egypt. Jour. of African Earth
Sciences 70 (2012) 8-17.
[18]. Balachandar D, Alaguraja P, Sundaraj P,
Rutharvelmurthy K, & Kumaraswamy K (2010)
Application of Remote Sensing and GIS for
artificial recharge zone in Sivaganga district,
Tamilnadu, India. International Journal of
Geomatics and Geosciences, 1(1), 84-96.
[19]. Girvan MS, Bullimore J, Pretty JN, Osborn AM,
Ball AS (2003) Soil type is the primary
determinant of the composition of the total and
International Journal of Scientific Research in Science and Technology (www.ijsrst.com)
1254
active bacterial communities in arable soils.
Appl Environ Microbiol 69:1800-1809
[20]. Kuria DN, Gachari MK, Macharia MW, Mungai
E (2012) Mapping groundwater potential in
Kitui District, Kenya using geospatial
technologies. Int J Water Resour Environment
Eng 4(1):15-22
[21]. Malay Kumar Pramanik (2016) Site suitability
analysis for agricultural land use of Darjeeling
district using AHP and GIS techniques. Model.
Earth Syst. Environ. 2:56 DOI 10.1007/s40808-
016-0116-8