Embed Size (px)
Citation preview
Sains Malaysiana 46(3)(2017): 413–420 http://dx.doi.org/10.17576/jsm-2017-4603-08
Geospatial Techniques for Assessment of Bank Erosion and Accretion in the Marala Alexandria Reach of the River Chenab, Pakistan
(Teknik Georeruang bagi Penilaian Hakisan Tebing dan Tokokan di Rantau Marala Alexandria, Sungai Chenab, Pakistan)
M. HAMID CH*, M. ASHRAF, QUDSIA HAMID, SYED MANSOOR SARWAR & ZULFIQAR AHMAD SAQIB
ABSTRACT
Remote Sensing (RS) and Geographical Information Systems (GIS) are widely used for change detection in rivers caused by erosion and accretion. Digital image processing techniques and GIS analysis capabilities are used for detecting temporal variations of erosion and accretion characteristics between the years 1999 and 2011 in a 40 km long Marala Alexandria reach of River Chenab. Landsat satellite images for the years 1999, 2007 and 2011 were processed to analyze the river channel migration, changes in the river width and the rate of erosion and accretion. Analyses showed that the right bank was under erosion in both time spans, however high rate of deposition is exhibited in middle reaches. The maximum erosion was 1569843 m2 and 1486160 m2 along the right bank at a distance of 24-28 km downstream of the Marala barrage in the time span of 1999-2007 and 2007-2011, respectively. Along right bank mainly there is trend of accretion but erosion is much greater between 20 and 28 km reach. Maximum accretion was 5144584 m2 from 1999-2007 and 2950110 m2 from 2007-2011 on the right bank downstream of the Marala Barrage. The derived results of channel migration were validated by comparing with SRTM data to assess the accuracy of image classification. Integration of remote sensing data with GIS is efficient and economical technique to assess land losses and channel changes in large rivers.
Keywords: Accretion; erosion; GIS; image processing; remote sensing
ABSTRAK
Pengesanan Jarak Jauh (RS) dan Sistem Maklumat Geografi (GIS) digunakan secara meluas untuk mengesan perubahan di sungai-sungai yang disebabkan oleh hakisan dan tokokan. Keupayaan teknik pemprosesan imej digital dan analisis GIS digunakan untuk mengesan variasi temporal hakisan dan tokokan antara tahun 1999 dan 2011 di sepanjang 40 km rantau Marala Alexandria di Sungai Chenab. Imej satelit Landsat bagi tahun 1999, 2007 dan 2011 telah diproses untuk analisis migrasi aliran sungai tersebut, perubahan dalam lebar sungai serta kadar hakisan dan tokokan. Analisis menunjukkan tebing di sebelah kanan terhakis pada kedua-dua tempoh masa, walau bagaimanapun kadar pemendapan yang tinggi ditunjukkan pada rantau pertengahan. Hakisan maksimum ialah 1569843 m2 dan 1486160 m2 di sepanjang tebing kanan pada jarak 24-28 km di hilir baraj Marala masing-masing dalam jangka masa 1999-2007 dan 2007-2011. Terdapat trend tokokan terutamanya di sepanjang tebing kanan tetapi hakisan adalah lebih besar antara jarak 20-28 km. Tokokan maksimum ialah 5144584 m2 dari 1999-2007 dan 2950110 m2 2007-2011 di tebing kanan hilir baraj Marala. Keputusan migrasi aliran yang diperoleh telah disahkan dengan membandingkannya dengan data SRTM untuk menilai ketepatan pengelasan imej. Integrasi data pengesanan jarak jauh dengan GIS adalah teknik yang cekap dan ekonomi untuk menilai kehilangan tanah dan perubahan aliran di sungai-sungai besar.
Kata kunci: GIS; hakisan; imej pemprosesan; pengesanan jarak jauh; pertambahan
INTRODUCTION
Rivers and streams are natural watercourses on the surface of earth and are of great geological importance. Rivers are dynamic in nature and show great spatiotemporal variation in their shapes and sizes. Because of erosion and deposition, there are regular changes in the shape and size of a river. A firm understanding of channel migration and associated processes of erosion and deposition will allow for management of river behavior and decision making process (Alam et al. 2007). River channel form and its dynamics over time has long been a major subject of study in geomorphology (Petts 1995). Channel form has been
classified into three basic types: straight, meandering and braided (Leopold & Wolma 1957; Lewin & Brewer 2001; Schumm & Khan 1972). Meandering rivers shift their courses across the valley bottom by depositing sediment on the inside of bends while simultaneously eroding on the concave side of banks of the meander. Meandering is a natural geomorphic feature in rivers which results in gradual migration of the river’s course and erosion of banks. Most rivers in the world are subject to meandering due to natural and human activities (Ayman & Ahmed Fawzi 2011). The monsoon runoff is known to affect the river bank erosion rates (Darby et al. 2013).

414
This study aimed at using satellite imagery to identify spatial trends in the channel migration and erosion and accretion rates in the River Chenab over a time period of 13 years, i.e. from 1999 to 2011. Digital image processing techniques like image rectification, layer stacking, subsetting and classification will be used to quantify the changes over an annual time lapse. By using the RS and GIS technology, river profiles at certain time periods are developed and rate of erosion and accretion is quantified.The use of temporal satellite images can show how the river and its floodplain dynamics move. Also, these images help to predict how the mobility will continue or which kind of measures need to be considered in order to restore the stability. The advantages of using remote sensing techniques are the use of synoptic data covering both spatial and temporal aspects. These advantages could be maximized by using ground information and other geo-graphical data, all of them integrated in a Geographical Information System (Rogan & Miller 2007).
MATERIALS AND METHODS
STUDY AREA
River Chenab is one the major River Industributaries which is fed by the snowmelt and monsoon rainfalls. At Marala Barrage, the discharge in the river has been reported as a wide range of variation able to induce morphological changes in the river reach. The pilot study area selected, as
shown in Figure 1, is a reach length of 40 km from Marala Barrage to Alexandria Bridge, i.e. about few km upstream of the old Khanki Barrage. In the studied river reach, mean channel width is 850 m while the width of flood plain is 6800 m. Slope of the river calculated is 0.42 m/km. Geomorphology of the area is a transition from piedmont plain of the Pir Panjal range to flatter flood plains of Punjab. Marala head works is a very important project as it is at the rim station where river Chenab enters in Pakistan. It is situated at the confluence of the Chenab River and Tawi nala and was constructed in 1968. Total length of Marala weir is 1363 m with a capacity of 31,148 m3/s (Awan 2003). Sediments concentration in the Chenab River becomes very heavy during floods. Keeping in view of these facts, the study was planned to detect the temporal variations and morphological characteristics of Chenab River.
Satellite Images Remote Sensing has been used by scientists for more than thirty years for investigating the surface of the earth (Bato et al. 2011). In order to quantify the changes in channel morphology of River Chenab, satellite images of the study area were acquired and processed. There are a variety of satellite data source such as Landsat, Spot, Ikonos, Orbview and Quickbird. A selection of data mainly relates to its spatial, temporal, spectral characteristic, time availability and most importantly its price (Hussain et al. 2011). For assessment of river channel temporal changes Landsat ETM+8 bit images with 30 m resolution were acquired from USGS
FIGURE 1. Study area
415
(http://landsat.usgs.gov) for November 1999, 2007 and 2011. Images of November were chosen because of minimum discharge in the study area. The acquired images were already geo-rectified with the assigned parameters of projections and coordinate system. Parameters were WGS 84, zone 43N and Transverse Mercator’s projection.
Data Preparation Landsat ETM+ actually consists of 9 bands but only three were required for information to be extracted. Band 2 (Green) with a wavelength of 0.52-0.6 micrometers was used for assessing vegetation. Band 3 (Red) with a wavelength of 0.63-0.69 micrometers was used to discriminate vegetation slope. While band 4 (Near infrared) with a wavelength of 0.77-0.90 micrometer was used to differentiate water and vegetation and for digitizing bank line. To extract required bands, in Erdas Imagine 2013 software, layer stacking was applied to rearrange the combination of band according to study. Layer stacking is used to develop image in form of multi band by different files that given as input. (Lupia 2012). As the original scene captured by Landsat is 185×185 km, whereas the study area was of much smaller extent. To focus on the study area firstly required part of image that was extracted using the subset technique in Erdas Imagine. As the study area was quite complex, therefore sub setting was performed in two stages. During the first stage, the technique adopted was creation of an Area of Interest (AOI) in the viewer as a closed loop by using the rectangular AOI tool. Images of all three study years were processed to extract study area according to similar AOI. At the second stage, the requirement was to extract the flood plain from the images. As the flood plains were varying in their extent over the years, therefore different AOI vectors were prepared for all three images through visual image interpretation. Flood plain boundary from the images was digitized by using Arc Map 10.2 meanwhile the vector layers of flood plain boundaries were produced for year 1999, 2007 and 2011. These complex shape vector layers were used as AOI in Erdas imagine to subset all the images. For extraction of required features and performing analysis subset images of study area were classified. Image classification use pixel base interpretation of remote sensing data. In general, pixel-wise classification algorithms can be divided into two groups: Unsupervised classification and supervised classification. With unsupervised classifiers, a remote sensing image is divided into a number of classes based on the natural groupings of the image values, without the help of training data or prior knowledge of the study area (Lillesand et al. 2004; Puletti et al. 2014). In this application, unsupervised classification technique is used. Unsupervised image classification use input of three band raster image to find spectral clusters and converted into particular raster band with defined number of classes (Engay-Gutierrez 2015). Subset images of all the three time periods were classified in ERDAS IMAGINE which uses the ISODATA (Iterative Self-Organizing Data Analysis Technique) algorithm to perform an unsupervised classification.
ISODATA clustering method uses spectral distance as in the sequential method, but iteratively classifies the pixels, redefines the criteria for each class, and classifies again, so that the spectral distance patterns in the data gradually emerge (Tou & Gonzalez 1974). In image classification process, firstly image was divided into adjoining and homogeneous objects and then these objects are classified into spectral and textual properties. All the three images were classified into five classes on the basis of statistics and then these classes were merged to have an image with three desired classes: Main river channel; sand bars; and cropland (Figure 1. Index map). As classified images were in raster format, they were converted into vector format by using Arc Map technique namely Raster to Polygon conversion. As a result of Vectorization all three classes of an image were converted into three distinct polygon shape files. For analyzing river channel migration over the years, a 9 km wide vector profile (Figure 1. Index map) was produced for the length of the entire study area, with points taken at every 2 km. Width of the vector was determined after analyzing classified images for respective years. In all the three images maximum width of flood plain was in 2011, which was taken as vector width. The vector profile was used to calculate the distance of river channel and flood plain from reference points on both sides of the river in Arc map.
DATA ANALYSIS
Once the classified images, vector profile and reference points were prepared, next important step was calculation of river channel migration, changes in river channel width due to erosion and accretion and identification of erosion and accretion areas. In order to calculate river channel migration, the distance from the reference point to the river banks on both sides was digitized as line features. Then the lengths of these lines were calculated in attribute table by using the calculate geometry options. As a result, distance of right and left bank of river channel and flood plain along the vector profile at a distance of every 2 km were calculated. Then distances of the channel from the reference points of the year 2007 were subtracted from the distances measured for the year 1999 to detect the channel migration from the year 1999 to 2007 on both right and left banks of the river. Similarly, distances taken for 2011 were subtracted from distances taken for year 2007. As the total width of the vector profile was 9159 m, the river width for each time was calculated by adding the left bank measurements to the right bank measurements and the resultant product was subtracted from the actual width of the vector. Similar calculation was performed for year 2007 and 2011. River channel migration in the selected successive years is shown in Figure 2. The river channel location in 2011 was entirely at opposite location as compared with the channel location in 1999 along the entire river reach. This typically indicates the meandering river pattern in this reach. Whereas, in the

416
upstream few kilometers reach length, the river shows the braided pattern due to the presence of islands and sand bars. In order to identify areas of erosion and accretion, overlay analysis techniques were used in Arc Map for flood
FIGURE 2. River channel migration
FIGURE 3. Flow diagram for identification of erosion and accretion areas
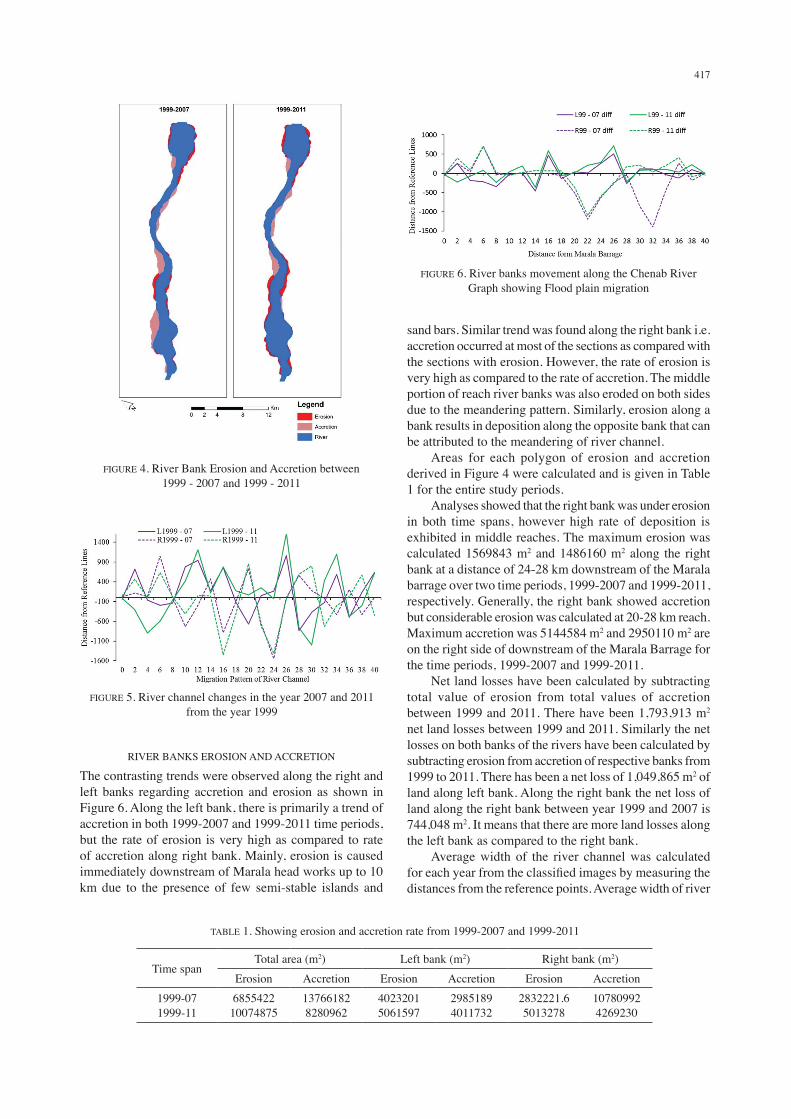
plains extracted from images. The entire process is shown in Figure 3. As a result of using erase and merge tools in Arc map, from flood plain shape files polygons of areas showing deposition and erosion between given time period were retrieved as shown in Figure 4.
RESULTS AND DISCUSSION
BANK LINE AND RIVER CHANNEL SHIFTING
Erosion and accretion variation at different reaches along the river can be shown by analyzing the spatial component of erosion and accretion data set in a form of overlay maps as presented in Figure 4. During 1999-2007, the accretion occurred upstream and downstream parts of the reach along the left and right banks, respectively. The middle part of the reach also experienced the accretion along the right bank during this time period. The upper braided portion experienced erosion along both banks. Similarly, the middle portion also experienced at some of the cross sections along the both banks. During 1999-2011, almost the same pattern of erosion and accretion was found along both the river banks in all parts of the reach. The lower portion of the reach showed the contrasting pattern where the erosion was observed along the right bank regardless of accretion. The shift of river channel is calculated for the selected time periods (Figure 5). Positive values indicate the shift of channel towards inner side of the river which caused accretion as the distance between the vector line and channel bank is increasing. Whereas, the negative values indicate the shift of channel towards outer banks which caused the erosion as the distance between the vector line and channel bank is decreasing.
417
RIVER BANKS EROSION AND ACCRETION
The contrasting trends were observed along the right and left banks regarding accretion and erosion as shown in Figure 6. Along the left bank, there is primarily a trend of accretion in both 1999-2007 and 1999-2011 time periods, but the rate of erosion is very high as compared to rate of accretion along right bank. Mainly, erosion is caused immediately downstream of Marala head works up to 10 km due to the presence of few semi-stable islands and
sand bars. Similar trend was found along the right bank i.e. accretion occurred at most of the sections as compared with the sections with erosion. However, the rate of erosion is very high as compared to the rate of accretion. The middle portion of reach river banks was also eroded on both sides due to the meandering pattern. Similarly, erosion along a bank results in deposition along the opposite bank that can be attributed to the meandering of river channel. Areas for each polygon of erosion and accretion derived in Figure 4 were calculated and is given in Table 1 for the entire study periods. Analyses showed that the right bank was under erosion in both time spans, however high rate of deposition is exhibited in middle reaches. The maximum erosion was calculated 1569843 m2 and 1486160 m2 along the right bank at a distance of 24-28 km downstream of the Marala barrage over two time periods, 1999-2007 and 1999-2011, respectively. Generally, the right bank showed accretion but considerable erosion was calculated at 20-28 km reach. Maximum accretion was 5144584 m2 and 2950110 m2 are on the right side of downstream of the Marala Barrage for the time periods, 1999-2007 and 1999-2011. Net land losses have been calculated by subtracting total value of erosion from total values of accretion between 1999 and 2011. There have been 1,793,913 m2 net land losses between 1999 and 2011. Similarly the net losses on both banks of the rivers have been calculated by subtracting erosion from accretion of respective banks from 1999 to 2011. There has been a net loss of 1,049,865 m2 of land along left bank. Along the right bank the net loss of land along the right bank between year 1999 and 2007 is 744,048 m2. It means that there are more land losses along the left bank as compared to the right bank. Average width of the river channel was calculated for each year from the classified images by measuring the distances from the reference points. Average width of river
TABLE 1. Showing erosion and accretion rate from 1999-2007 and 1999-2011
Time spanTotal area (m2) Left bank (m2) Right bank (m2)
Erosion Accretion Erosion Accretion Erosion Accretion1999-071999-11
685542210074875
137661828280962
40232015061597
29851894011732
2832221.65013278
107809924269230
FIGURE 4. River Bank Erosion and Accretion between 1999 - 2007 and 1999 - 2011
FIGURE 5. River channel changes in the year 2007 and 2011 from the year 1999
FIGURE 6. River banks movement along the Chenab River Graph showing Flood plain migration

418
channel was 976.95, 1037.43 and 999.64 m for the years 1999, 2007 and 2011, respectively. The rate of change in the river width calculated was 7.56 m/year and 1.89 m/year for the time spans 1999 to 2007 and 2007-2011, respectively.Because of the river bank erosion, Chenab’s width has increased at some locations. The maximum erosions were calculated to be 1569843 m² on the right bank of the river at a distance of 24-28 km downstream Marala Barrage during 1999-2007 and 2309960 m² on left side of the river at a distance of 22-28 km downstream Marala Barrage during 1999-2011. The maximum accretions calculated were 5144584 m2 on the right bank of the river at a distance of 30-36 km downstream Marala Barrage during 1999-2007 and 2950110 m2 on left side of the river bank at a distance of 20-24 km downstream Marala Barrage during 1999-2011. The rate of bank erosion was calculated as 856927 m2/year during 1999-2007 and 840000 m2/year during 1999-2011.The rate of bank accretion was calculated to be 1720772 and 690000 m2/year for the time periods 1999-2007 and 1999-2011, respectively. Total area eroded due to erosion estimated was calculated as 6855422 m2 (685.54 ha) and 840000 m2 (84 ha) during the time spans 1999-2007 and 1999-2011, respectively.
DATA VALIDATION
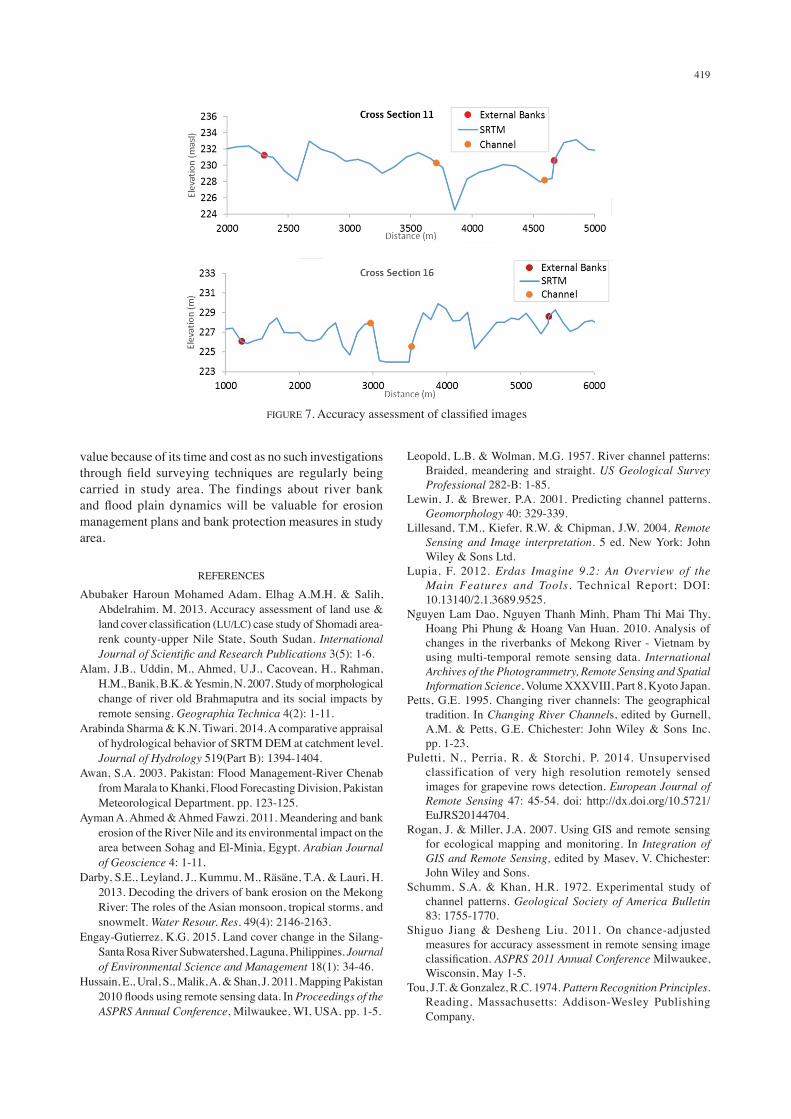
Accuracy assessment plays an important role in remote sensing image classification. It is important to know the quality of the classified maps (Jiang & Liu 2011). The accuracy of spatial data has been defined by the United States Geological Survey USGS, 1990 as: ‘Accuracy assessment or validation is an important step in the processing of remote sensing data. It determines the information value of the resulting data to a user’ (Abubaker Haroun et al. 2013). Most common techniques used for accuracy assessment of classified satellite images are error matrix generation by using ground sample data or any reliable published source data. However in present study, sample data collection from field was not possible due to time slices of study. As far as published data was concerned, only in 2010, plain table surveys were carried out for measurement of river channel in study area by River Survey Unit, Irrigation department of Punjab government, Pakistan. The resultant dataset should not be used for comparison because of non-availability of absolute location of cross sections. Ground truthing was not also an appropriate option for data validation. The only possible option was to compare and validate with other GIS/Digital datasets, e.g. ASTER and SRTM (Shuttle Radar Topography Mission). The only available DEM (Digital Elevation Model) for are required time slice was SRTM for 1999. SRTM provides for the first time a near-global high-resolution DEM with great advantages of being homogeneous in quality and free availability. In the past eight-ten years, scientific communities have seen a large number application of SRTM DEM for various applications
(Arabinda & Tiwari 2014; Yang et al. 2014). River channel delineated through Landsat image classification for 1999 was validated through cross section generated according to similar vector profile of SRTM. By using the similar vector, profile study area was clipped from SRTM. In ArcMap 3D Analyst extension, 3D cross section lines were generated on same locations (at a distance of 2 km) by using interpolate 3D line tool. For each 3D line a profile graph was generated. All profile graphs were saved as a point shape file with distance from reference line and elevation of each point from mean sea level in attribute table. By using this attribute table profile graphs for each cross section was generated in excel as line graph. On each line graph points of river channel and flood plain measured through satellite images were overlaid on profile line. Figure 7(a) and 7(b) presents two cross sections out of 20 to demonstrate relationship between SRTM data and Landsat images measurements. As shown in Figure 7, river channel points and flood plain points follow the same pattern as the profile of SRTM data.
CONCLUSION
Alluvial flood plains are most important areas for agriculture, industry and human settlements. Nowadays supervising and forecasting changes in riverbanks are important and necessary for managing and detecting environment in marine infrastructure (Nguyen et al. 2010). In the present study remote sensing and GIS techniques are used to identify changes in bank line and flood plain of River Chenab for a 41 km reach from Khanki to Alexandria bridge. Low flow time cloud free Land sat satellite images of 1999, 2007 and 2011 are processed to identify changes in river morphology and location of eroded and accredited parts along river channel has been identified. The following conclusions are inferred after analyzing images. Upper few km reach exhibits a braided channel whereas the rest of the channel exhibits meandering pattern. As left bank of Chenab is more subjected to erosion as compared to right bank of Chenab which is more subjected to accretion. However, 20-28 km reach along right bank exhibits considerable erosion; and rate of erosion is mainly high as compared to rate of accretion resulting in net loss of land is 1,793,913 m2 in entire reach from 1999-2011. However, land loss rate is higher along left bank corresponding to high rate of erosion along left bank. Total area eroded from 1999- 2011 is 769.54 ha. Classification of satellite images is validated by comparing the studied cross sections with SRTM DEM. Arc Map 3D extension is used to make accuracy assessment of image classification and it has been identified that 3D profile data supplements the accuracy of image classification technique. The present study is solely based upon image interpretation without incorporating other attributes like flow rate and volume, contributing to river channel migration erosion and accretion. The study is of great
419
value because of its time and cost as no such investigations through field surveying techniques are regularly being carried in study area. The findings about river bank and flood plain dynamics will be valuable for erosion management plans and bank protection measures in study area.
REFERENCES
Abubaker Haroun Mohamed Adam, Elhag A.M.H. & Salih, Abdelrahim. M. 2013. Accuracy assessment of land use & land cover classification (LU/LC) case study of Shomadi area-renk county-upper Nile State, South Sudan. International Journal of Scientific and Research Publications 3(5): 1-6.
Alam, J.B., Uddin, M., Ahmed, U.J., Cacovean, H., Rahman, H.M., Banik, B.K. & Yesmin, N. 2007. Study of morphological change of river old Brahmaputra and its social impacts by remote sensing. Geographia Technica 4(2): 1-11.
Arabinda Sharma & K.N. Tiwari. 2014. A comparative appraisal of hydrological behavior of SRTM DEM at catchment level. Journal of Hydrology 519(Part B): 1394-1404.
Awan, S.A. 2003. Pakistan: Flood Management-River Chenab from Marala to Khanki, Flood Forecasting Division, Pakistan Meteorological Department. pp. 123-125.
Ayman A. Ahmed & Ahmed Fawzi. 2011. Meandering and bank erosion of the River Nile and its environmental impact on the area between Sohag and El-Minia, Egypt. Arabian Journal of Geoscience 4: 1-11.
Darby, S.E., Leyland, J., Kummu, M., Räsäne, T.A. & Lauri, H. 2013. Decoding the drivers of bank erosion on the Mekong River: The roles of the Asian monsoon, tropical storms, and snowmelt. Water Resour. Res. 49(4): 2146-2163.
Engay-Gutierrez, K.G. 2015. Land cover change in the Silang-Santa Rosa River Subwatershed, Laguna, Philippines. Journal of Environmental Science and Management 18(1): 34-46.
Hussain, E., Ural, S., Malik, A. & Shan, J. 2011. Mapping Pakistan 2010 floods using remote sensing data. In Proceedings of the ASPRS Annual Conference, Milwaukee, WI, USA. pp. 1-5.
Leopold, L.B. & Wolman, M.G. 1957. River channel patterns: Braided, meandering and straight. US Geological Survey Professional 282-B: 1-85.
Lewin, J. & Brewer, P.A. 2001. Predicting channel patterns. Geomorphology 40: 329-339.
Lillesand, T.M., Kiefer, R.W. & Chipman, J.W. 2004. Remote Sensing and Image interpretation. 5 ed. New York: John Wiley & Sons Ltd.
Lupia, F. 2012. Erdas Imagine 9.2: An Overview of the Main Features and Tools. Technical Report; DOI: 10.13140/2.1.3689.9525.
Nguyen Lam Dao, Nguyen Thanh Minh, Pham Thi Mai Thy, Hoang Phi Phung & Hoang Van Huan. 2010. Analysis of changes in the riverbanks of Mekong River - Vietnam by using multi-temporal remote sensing data. International Archives of the Photogrammetry, Remote Sensing and Spatial Information Science, Volume XXXVIII, Part 8, Kyoto Japan.
Petts, G.E. 1995. Changing river channels: The geographical tradition. In Changing River Channels, edited by Gurnell, A.M. & Petts, G.E. Chichester: John Wiley & Sons Inc. pp. 1-23.
Puletti, N., Perria, R. & Storchi, P. 2014. Unsupervised classification of very high resolution remotely sensed images for grapevine rows detection. European Journal of Remote Sensing 47: 45-54. doi: http://dx.doi.org/10.5721/EuJRS20144704.
Rogan, J. & Miller, J.A. 2007. Using GIS and remote sensing for ecological mapping and monitoring. In Integration of GIS and Remote Sensing, edited by Masev, V. Chichester: John Wiley and Sons.
Schumm, S.A. & Khan, H.R. 1972. Experimental study of channel patterns. Geological Society of America Bulletin 83: 1755-1770.
Shiguo Jiang & Desheng Liu. 2011. On chance-adjusted measures for accuracy assessment in remote sensing image classification. ASPRS 2011 Annual Conference Milwaukee, Wisconsin, May 1-5.
Tou, J.T. & Gonzalez, R.C. 1974. Pattern Recognition Principles. Reading, Massachusetts: Addison-Wesley Publishing Company.
FIGURE 7. Accuracy assessment of classified images

420
Bato, V.A., Paningbatan Jr. E.P. & Bartolome, B.J. 2011. High resolution satellite data for comprehensive land-use planning. Journal of Environmental Science and Management 14(1): 12-23.
Yang, L., Meng, X. & Zhang, X. 2014. SRTM DEM and its application advances. International Journal of Remote Sensing 32(14): 3875-3896.
M. Hamid Ch* & Qudsia HamidGIS Centre, University of the Punjab, LahorePakistan
M. AshrafCentre of Excellence in Water Resource EngineeringUniversity of Engineering and Technology, LahorePakistan
Syed Mansoor SarwarPunjab University College of Information TechnologyUniversity of the Punjab, LahorePakistan
Zulfiqar Ahmad SaqibInstitute of Soil and Environmental SciencesUniversity of Agriculture, Faisalabad, 38040 Pakistan
*Corresponding author; email: [email protected]
Received: 4 December 2015Accepted: 17 June 2016