Embed Size (px)
Citation preview
GEOSPATIAL MODELLING APPROACH FOR INTERLINKING OF RIVERS: A
CASE STUDY OF VAMSADHARA AND NAGAVALI RIVER SYSTEMS IN
SRIKAKULAM, ANDHRA PRADESH
A. Swathi Lakshmi*, Sameer Saran , S.K. Srivastav , Y.V.N Krishna Murthy
Indian Institute of Remote Sensing, Dehradun
KEYWORDS: Geospatial Modelling, Majority Rule Based (MRB) aggregation, Analytical Hierarchy Process (AHP) based Multi-
Criteria Decision Making (MCDM), Network Routing, and Interlinking of Rivers.
ABSTRACT: India is prone to several natural disasters such as floods, droughts, cyclones, landslides and earthquakes on account of its geo-
climatic conditions. But the most frequent and prominent disasters are floods and droughts. So to reduce the impact of floods and
droughts in India, interlinking of rivers is one of the best solutions to transfer the surplus flood waters to deficit/drought prone areas.
Geospatial modelling provides a holistic approach to generate probable interlinking routes of rivers based on existing geoinformatics
tools and technologies. In the present study, SRTM DEM and AWiFS datasets coupled with land-use/land -cover, geomorphology,
soil and interpolated rainfall surface maps have been used to identify the potential routes in geospatial domain for interlinking of
Vamsadhara and Nagavali River Systems in Srikakulam district, Andhra Pradesh. The first order derivatives are derived from DEM
and road, railway and drainage networks have been delineated using the satellite data. The inundation map has been prepared using
AWiFS derived Normalized Difference Water Index (NDWI). The Drought prone areas were delineated on the satellite image as per
the records declared by Revenue Department, Srikakulam. Majority Rule Based (MRB) aggregation technique is performed to
optimize the resolution of obtained data in order to retain the spatial variability of the classes. Analytical Hierarchy Process (AHP)
based Multi-Criteria Decision Making (MCDM) is implemented to obtain the prioritization of parameters like geomorphology, soil,
DEM, slope, and land use/land-cover. A likelihood grid has been generated and all the thematic layers are overlaid to identify the
potential grids for routing optimization. To give a better routing map, impedance map has been generated and several other
constraints are considered. The implementation of canal construction needs extra cost in some areas. The developed routing map is
published into OGC WMS services using open source GeoServer and proposed routing service can be visualized over Bhuvan portal
(http://www.bhuvan.nrsc.gov.in/).Thus the obtained routing map of proposed canals focuses on transferring the surplus waters to
drought prone areas to solve the problem of water scarcity, to properly utilize the flood waters for irrigational purposes and also help
in recharging of groundwater. Similar methodology can be adopted in other interlinking of river systems.
1. INTRODUCTION
India is blessed with abundant water resources in the form of
lakes, rivers and ground water tables. Though many perennial
rivers which serve the socio-economic purpose of people are
present in India, it still leads to uneven distribution of river
water due to diverse topographic and geological
conditions(Rao et al. 2014). Within the 329 M ha of
geographical area, it experiences extremes of climate with
mean annual rainfall varying from one part of the country to
the other such as 100mm in western Rajasthan to 11000mm at
cherrapunji in Meghalaya (Prakashvel, Dr. M. Krishnaveni,
and Dr. M. Kaarmegam 2003)(Indian Water Resources
Society, 1994). During the peak monsoon seasons, intolerable
situations like - filling of the basins, discharge of surface/river
waters into the oceans and drowning of agriculture and urban
areas etc are observed causing natural hazards like floods.
Floods are a natural phenomenon and have become common
scenario in India. Severe floods occur every year in one part
or the other causing tremendous damage to agriculture, life
and property. Flooding is mainly caused by over-spilling of
river banks and severity increases where there are obstructions
like roads, railway networks, urban areas etc(Khanna et al.
2007).This scenario is most commonly observed during the
monsoon seasons throughout the country. Due to improper
utilization of these waters, most of the water is depleting in to
the seas and oceans. In other words, flood waters are simply
going as a waste in to seas and oceans. So we should ensure
that flood waters are properly managed and used in an
effective way in order to solve the problem of water scarcity
for the other time periods.
To control the floods and utilize the waters for irrigation and
other purposes, Interlinking of rivers can be a substantial
solution to end up the problem of water scarcity. The concept
of interlinking the rivers is not new(Kelli Krueger, Frances
Segovia, and Monique Toubia 2007). Many people have put
forward the proposal of interlinking the Indian rivers for a
better sustainable development of the country(McCornick
2014) (Bharat R. Sharma, and Upali A. Amarasinghe 2008).
Traditional methods were proposed and implemented for
interlinking of rivers which is both cost effective and time
consuming. But in the recent years, geospatial technology, GIS
and its tools play a vital role in providing accurate solutions
for environmental issues(Shahabi et al. 2006). GIS coupled
with hydrological models also plays a key role in obtaining
accurate results for the desired objectives(Chowdary et al.
2012). GIS techniques like overlay analysis, decision support
systems and object oriented models have been proposed for
the interlinking of rivers. Of these techniques Multi Criteria
Analysis has evolved to be an effective way of decision
making because this technique considers various
issues/decisions related to Hydrological, environmental,
geomorphological, agricultural and socio-economical for
producing a more suitable site map. Analytical Hierarchy
Process (AHP) based Multi-Criteria Decision Making
(MCDM) is a decision support tool which can be used to solve
complex decision problems(Triantaphyllou and Mann 1995).
The International Archives of the Photogrammetry, Remote Sensing and Spatial Information Sciences, Volume XL-8, 2014ISPRS Technical Commission VIII Symposium, 09 – 12 December 2014, Hyderabad, India
This contribution has been peer-reviewed.
doi:10.5194/isprsarchives-XL-8-127-2014
127
Geospatial technologies provide a wide range of innovative
and cost effective solutions for interlinking of rivers(Njike
Chigbu and Daniel Onukaogu 2013). The advanced geo-
information technologies are extensively useful in integrating
the large amounts of data from various sources like
topographic maps, satellite images and Digital elevation
Models (DEM) for an easier and accurate decision
making(Sanyal and Lu 2004). In fact, it is only space
technology, which has for the first time provided the basic
information needed in the space, time and frequency domain
(Khanna et al. 2007).
The main objective of this project is to interlink the rivers for
proper utilization of the excess flood waters. To accomplish
the main objective of the present study the following steps has
to be carried out:
I. Normalize the input parameters (DEM, LULC,
Rainfall etc) by performing multi-scale data
integration using aggregation techniques.
II. Parameter prioritization using AHP based Multi
Criteria Decision Making.
III. To generate the likelihood grids for each of the
prioritized parameter.
IV. Final suitable site selection for interlinking of rivers
using routing and aggregation techniques.
V. Publishing the routing map on to the web.
2. STUDY AREA DESCRIPTION
The study area consists of two important east flowing rivers -
Vamsadhara and Nagavali, covering the administrative district
of Srikakulam in Andhra Pradesh, India. The study area is
situated at the extreme north-eastern part of Andhra Pradesh
with the coordinates ranging from 18°-20’ and 19°-10’ N
latitudes to 83°-50’ and 84°-50’ E longitudes. It occupies an
area of 5837 km2 and with a coastline of 193km. The
topography of the study area is highly rising (above 250MSL)
with the elevations varying from north to south. About one-
third of the district is covered with hills. The northern part
comprises a part of devagiri forests and wastelands while the
southern part includes a major town srikakulam along with
several villages. Some parts of the district are plain terrains
with intense agriculture whereas other parts have rocky and
hilly terrain covered with forests. Due to variation in
topography, the region has a tropical climate. The maximum
temperature of thirty seven degrees (37°C) and a minimum
temperature of twenty five degrees (25°C) are experienced
during summer season. The average rainfall of the district is
1162mm. The temperature falls during the post monsoon
months of October and November. This region also experiences
winter with a maximum temperature of twenty degrees (20°C)
and a minimum temperature of fourteen degrees (14°C)(Eadara
and Karanam 2013). As per 2010-2011 census, the forest area
of srikakulam district is 68,641 hectares which constitutes 12%
of the total geographic area(MSME - Development Institute).
The forests in the study area are the South Indian Moist
Deciduous which includes mixed forests, Sal forests, hilly
savannahs and dry ever-green miscellaneous forests.
Agricultural sector plays a vital role in the districts economy.
Agriculture in this area is mostly dependent on rainfall.
Moreover, monsoons and seasonal conditions also influence the
agriculture production. It has both kharif and Rabi type of
vegetation. Crops like Paddy, Jowar, Cotton, Red gram,
Chillies, Sugarcane, Pulses, Groundnut, Sunflower, Maize and
Sesame are grown in this district. Of the total geographic area,
841.66 square kilometres consists of wastelands. Various
categories of wastelands like gullied, salt affected, degraded
pastures/grazing lands, water logged and marshy lands, barren
rocky areas, mining and industrial wastelands etc., are present
in the study area (Wastelands Atlas of India).
Fig 1: Study area- Srikakulam, Andhra Pradesh, India.
The study area is endowed with good rainfall and different
types of soils like laterite and alluvial as it forms a part of stable
peninsula. Besides the above soils it also contains other
categories like sandy, loamy, clayey, clay skeletal and loamy
skeletal. The Srikakulam district is geomorphologically
characterized by rocks of Archean ages comprising of Granites
and Charnockites, which have intruded into the highly folded
and metamorphosed sedimentary rocks, represented by
Khondalites series(Eadara and Karanam 2013).
2.1 Data used
Satellite images of IRS-P6 AWiFS sensor downloaded from
Bhuvan website (http://bhuvan-noeda.nrsc.gov.in) for the
period of pre and post monsoon seasons is used for the present
study. Advanced Wide Field Sensor (AWiFS) camera is an
improved version compared to the WiFS camera of IRS-1C/1D.
It operates in four spectral bands, providing a spatial resolution
of 56 m and covering a swath of 740 Km. The AWiFS camera
is split into two separate electro-optic modules, AWiFS-A and
AWiFS-B tilted by 11.94degrees with respect to nadir. Shuttle
Radar Topography Mission (SRTM) Digital Elevation Model of
90m resolution, downloaded from United States Geological
Survey (USGS) is used in the study. Land Use/Land Cover map
of 1:250000 scale with various classes like urban areas,
agriculture, wastelands, water bodies, forests etc are present in
the study area. The Rainfall data used in this study is from
Indian Meteorological Department (IMD) with a spatial
resolution of ½ degree. Sandy, loamy, clayey, clayey skeletal
and loamy skeletal categories are observed in the soil map of
1:1 million scale taken from National Bureau of Soil Survey
(NBSS).Geomorphology map of 1:2 million scale taken from
Geological Survey of India (GSI) and different geomorphic
features like low-lying flats/plains are present along the river
course, low-lying flats/terraces are present along the coast,
colluvial foot slopes are observed at the bottom of the hilly
terrains, ridges/hills with intervening broad undulation,
ridges/hills with or without valley are present in the northern
regions.
3. METHODOLOGY
Satellite images of IRS-P6 AWiFS acquired for the periods of
pre and post monsoon months is used for the study. AWiFS
Satellite image with green and NIR bands are used to generate
Normalized Difference Water Index which helps in identifying
the inundated areas. The reason for using green and NIR bands
is that these wavelengths will maximize the reflectance
properties of water. Using the image alarm technique, the pixels
River Vamsadhara
River Nagavali River
Vamsadhara
River Nagavali
The International Archives of the Photogrammetry, Remote Sensing and Spatial Information Sciences, Volume XL-8, 2014ISPRS Technical Commission VIII Symposium, 09 – 12 December 2014, Hyderabad, India
This contribution has been peer-reviewed.
doi:10.5194/isprsarchives-XL-8-127-2014
128
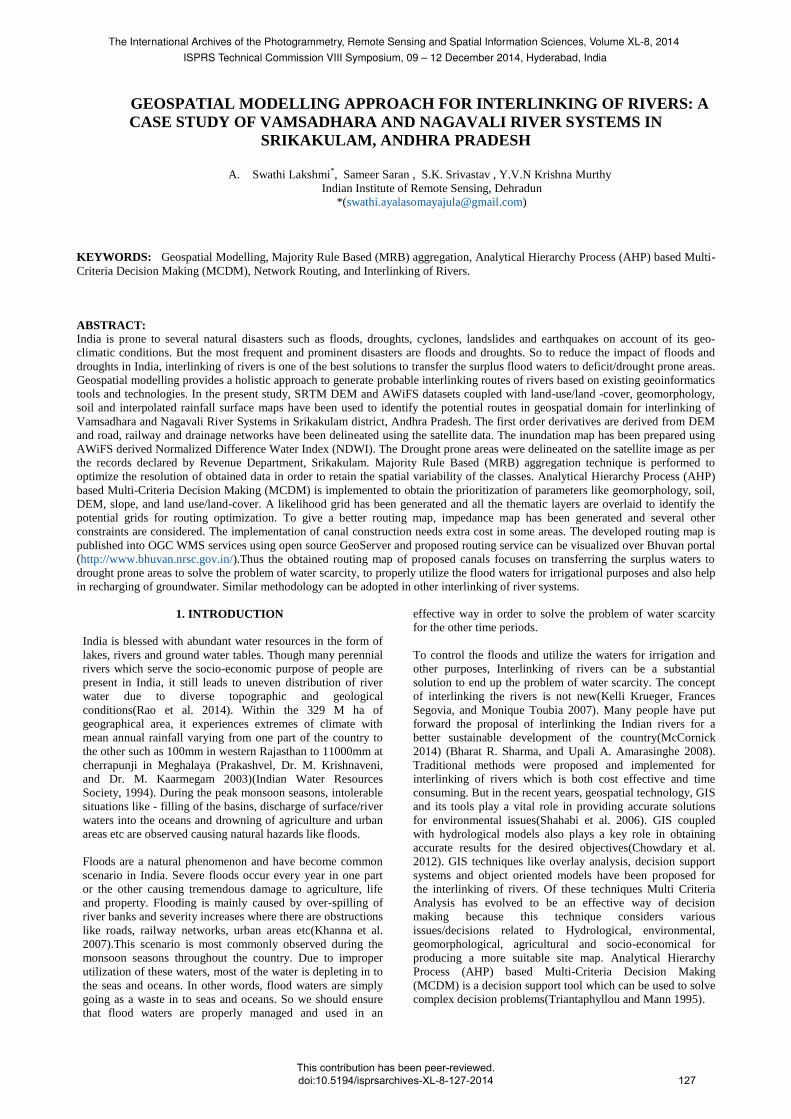
in the View that belong to a particular class are selected
according to the parallelepiped decision rule. Drainage and
inundation map has been prepared using the satellite images.
Fig 2: Maps representing NDWI and INUNDATION
The obtained DEM has voids and in order to fill those voids it
has been corrected. Slope also called as gradient is an important
terrain parameter and first order derivative which can be
defined as “the rate of minimum change in z-value from each
cell” is generated from the corrected DEM. Other derivatives
such as Flow direction and Flow accumulation are also
prepared using the DEM. Topographic Wetness Index map
which is useful in hydrology, agriculture, geomorphology, and
vegetation studies has been prepared using Slope and Flow
accumulation map. This represents the spatial distribution of
soil moisture, surface saturation, ground water recharge and
discharge areas, as well as potential runoff generation. TWI
values will vary by landscape and DEM, but they typically
range from less than 1 (dry cells) to greater than 20 (wet cells).
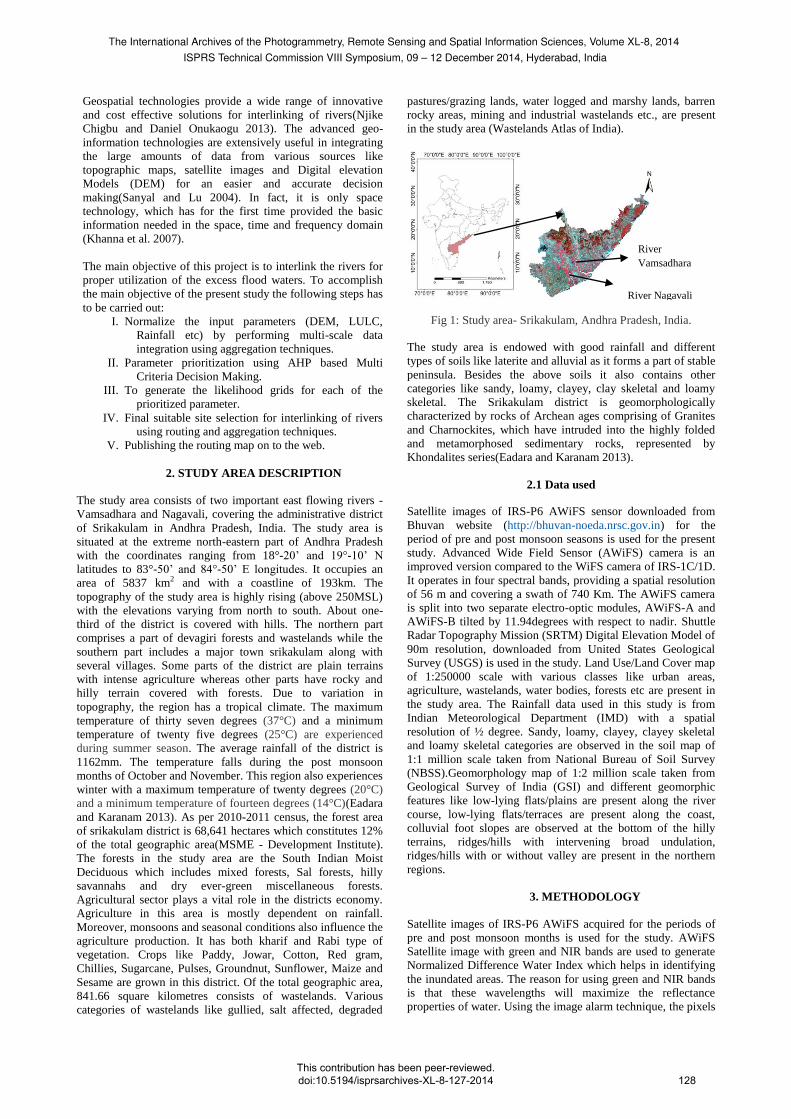
To accomplish the main task of this study, it has been
necessary to undergo certain Geoinformatics approaches. As
the Land Use/Land Cover map, Geomorphology map, Soil map
and Slope map are obtained at various scales and resolutions;
Multi-Scale Integration using Majority Rule Based
Aggregation technique has been applied to optimize the
resolution of each thematic layer. The following figure
represents each thematic layer after performing Multi-Scale
Integration using Majority Rule Based Aggregation technique.
Fig 3: Thematic layers after performing Majority Rule Based
Aggregation
Multi-Criteria Analysis, useful in solving real world problems is
carried out to obtain the prioritization of parameters. Analytical
Hierarchy Process based Multi-Criteria Decision Making
method is applied to each thematic layer to obtain the priority
vectors. AHP is developed by Thomas Saaty with three main
principles: decomposition, comparative judgment and synthesis
of priorities. Each thematic layer is decomposed in to various
factors and certain weights are given to each factor based on the
scale developed by Thomas Saaty. This developed matrix is the
pair-wise judgment matrix and this is normalized to derive the
relative weights for each factor. Consistency Analysis is carried
out and Consistency Measure, Consistency Index, Consistency
Ratio are calculated. Consistency Ratio of <0.1 is acceptable
and it is maintained throughout. Ranking for each factor is
given according to the Consistency Measure obtained. Highest
Consistency Measure is given high rank and the Consistency
Measure with least value is given least rank. Based on these
ranks, each factor is divided into high, medium and low.
The International Archives of the Photogrammetry, Remote Sensing and Spatial Information Sciences, Volume XL-8, 2014ISPRS Technical Commission VIII Symposium, 09 – 12 December 2014, Hyderabad, India
This contribution has been peer-reviewed.
doi:10.5194/isprsarchives-XL-8-127-2014
129
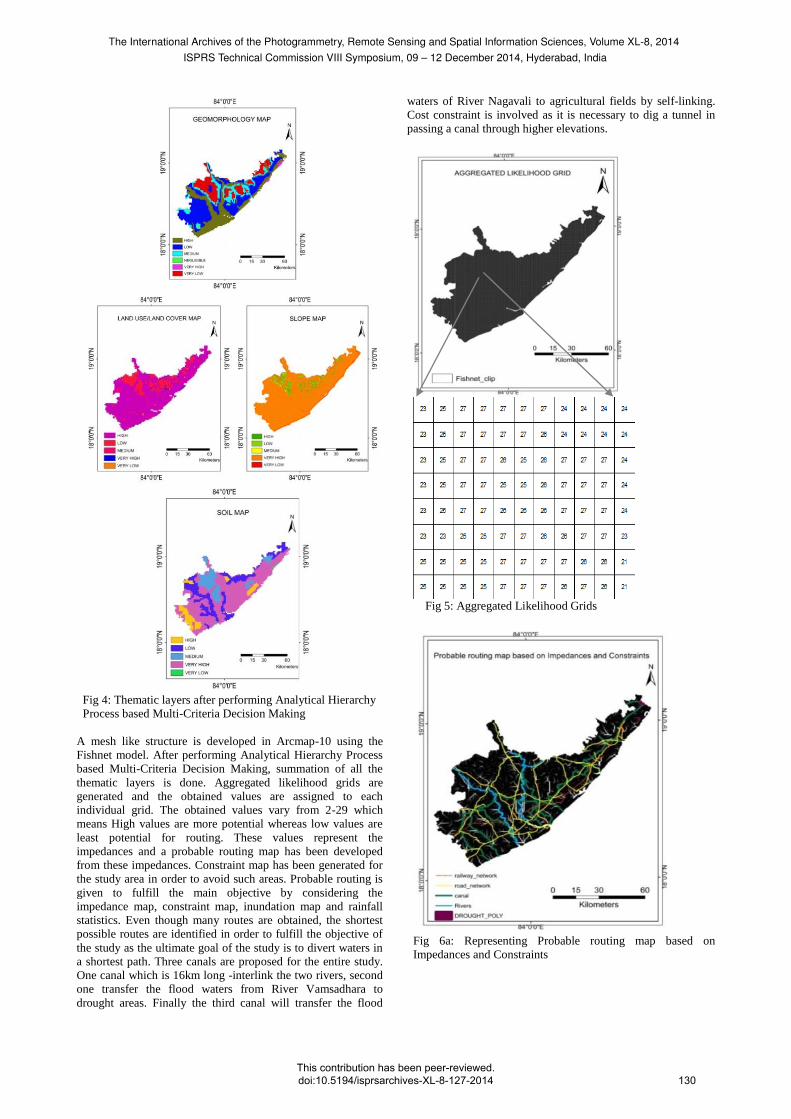
Fig 4: Thematic layers after performing Analytical Hierarchy
Process based Multi-Criteria Decision Making
A mesh like structure is developed in Arcmap-10 using the
Fishnet model. After performing Analytical Hierarchy Process
based Multi-Criteria Decision Making, summation of all the
thematic layers is done. Aggregated likelihood grids are
generated and the obtained values are assigned to each
individual grid. The obtained values vary from 2-29 which
means High values are more potential whereas low values are
least potential for routing. These values represent the
impedances and a probable routing map has been developed
from these impedances. Constraint map has been generated for
the study area in order to avoid such areas. Probable routing is
given to fulfill the main objective by considering the
impedance map, constraint map, inundation map and rainfall
statistics. Even though many routes are obtained, the shortest
possible routes are identified in order to fulfill the objective of
the study as the ultimate goal of the study is to divert waters in
a shortest path. Three canals are proposed for the entire study.
One canal which is 16km long -interlink the two rivers, second
one transfer the flood waters from River Vamsadhara to
drought areas. Finally the third canal will transfer the flood
waters of River Nagavali to agricultural fields by self-linking.
Cost constraint is involved as it is necessary to dig a tunnel in
passing a canal through higher elevations.
Fig 5: Aggregated Likelihood Grids
Fig 6a: Representing Probable routing map based on
Impedances and Constraints
The International Archives of the Photogrammetry, Remote Sensing and Spatial Information Sciences, Volume XL-8, 2014ISPRS Technical Commission VIII Symposium, 09 – 12 December 2014, Hyderabad, India
This contribution has been peer-reviewed.
doi:10.5194/isprsarchives-XL-8-127-2014
130
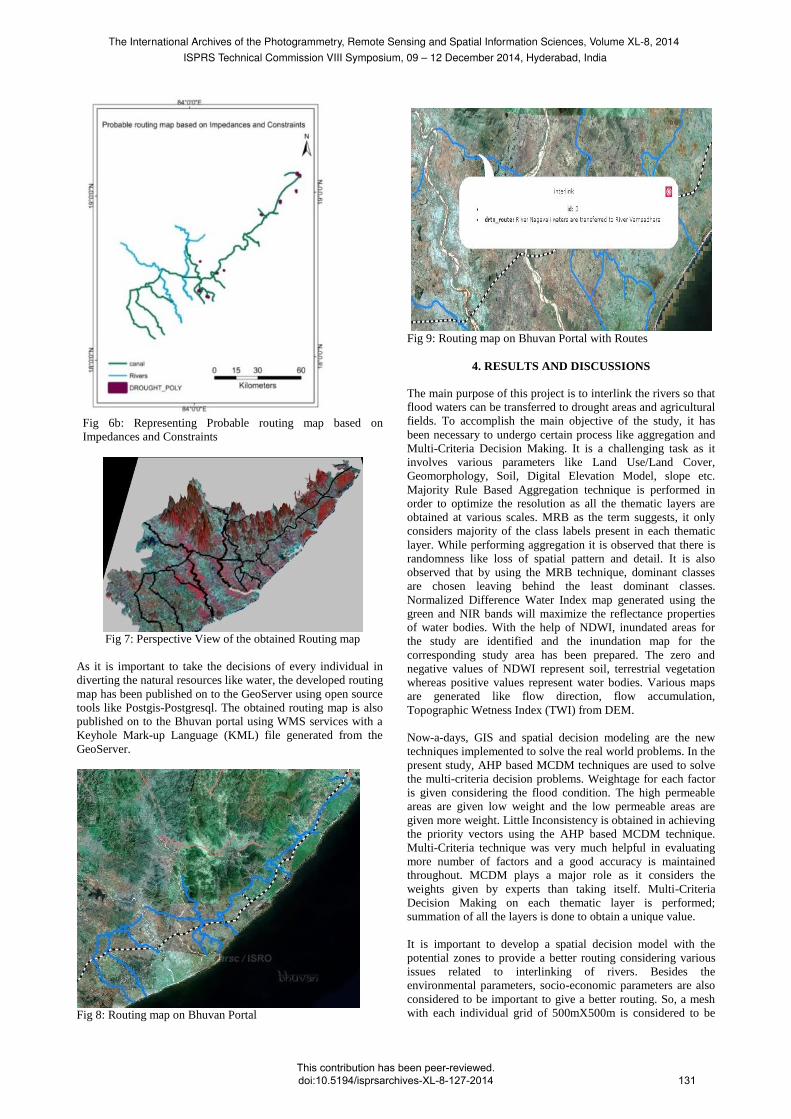
Fig 6b: Representing Probable routing map based on
Impedances and Constraints
Fig 7: Perspective View of the obtained Routing map
As it is important to take the decisions of every individual in
diverting the natural resources like water, the developed routing
map has been published on to the GeoServer using open source
tools like Postgis-Postgresql. The obtained routing map is also
published on to the Bhuvan portal using WMS services with a
Keyhole Mark-up Language (KML) file generated from the
GeoServer.
Fig 8: Routing map on Bhuvan Portal
Fig 9: Routing map on Bhuvan Portal with Routes
4. RESULTS AND DISCUSSIONS
The main purpose of this project is to interlink the rivers so that
flood waters can be transferred to drought areas and agricultural
fields. To accomplish the main objective of the study, it has
been necessary to undergo certain process like aggregation and
Multi-Criteria Decision Making. It is a challenging task as it
involves various parameters like Land Use/Land Cover,
Geomorphology, Soil, Digital Elevation Model, slope etc.
Majority Rule Based Aggregation technique is performed in
order to optimize the resolution as all the thematic layers are
obtained at various scales. MRB as the term suggests, it only
considers majority of the class labels present in each thematic
layer. While performing aggregation it is observed that there is
randomness like loss of spatial pattern and detail. It is also
observed that by using the MRB technique, dominant classes
are chosen leaving behind the least dominant classes.
Normalized Difference Water Index map generated using the
green and NIR bands will maximize the reflectance properties
of water bodies. With the help of NDWI, inundated areas for
the study are identified and the inundation map for the
corresponding study area has been prepared. The zero and
negative values of NDWI represent soil, terrestrial vegetation
whereas positive values represent water bodies. Various maps
are generated like flow direction, flow accumulation,
Topographic Wetness Index (TWI) from DEM.
Now-a-days, GIS and spatial decision modeling are the new
techniques implemented to solve the real world problems. In the
present study, AHP based MCDM techniques are used to solve
the multi-criteria decision problems. Weightage for each factor
is given considering the flood condition. The high permeable
areas are given low weight and the low permeable areas are
given more weight. Little Inconsistency is obtained in achieving
the priority vectors using the AHP based MCDM technique.
Multi-Criteria technique was very much helpful in evaluating
more number of factors and a good accuracy is maintained
throughout. MCDM plays a major role as it considers the
weights given by experts than taking itself. Multi-Criteria
Decision Making on each thematic layer is performed;
summation of all the layers is done to obtain a unique value.
It is important to develop a spatial decision model with the
potential zones to provide a better routing considering various
issues related to interlinking of rivers. Besides the
environmental parameters, socio-economic parameters are also
considered to be important to give a better routing. So, a mesh
with each individual grid of 500mX500m is considered to be
The International Archives of the Photogrammetry, Remote Sensing and Spatial Information Sciences, Volume XL-8, 2014ISPRS Technical Commission VIII Symposium, 09 – 12 December 2014, Hyderabad, India
This contribution has been peer-reviewed.
doi:10.5194/isprsarchives-XL-8-127-2014
131
nominal for the entire study area, as the thematic layers are at
various scales. Each individual grid is now assigned with a
value- high values representing high possibility and low values
represent the least possibility for routing. The routing for the
study is given based on the values generated for each grid. The
direction for routing is followed from high value to low value.
Constraints like roads, railways and settlements are considered.
Rainfall map for the corresponding study has been used to
identify the high and low rainfall areas. In some regions there
are dense forests when a perfect routing is not obtained. In
order to construct a canal factors like slope and elevation plays
a major role. When it comes to geomorphology perspective
there are ridges so the cost constraint is involved in order to
make a tunnel. Considering all these parameters and constraints
a routing map is generated.
Even though many routes are obtained for routing, the most
possible routes are selected, as our motto is to interlink the
rivers in a shortest path. Constructing canal in hilly terrains and
forest areas is avoided as it involves huge expenditures and
damage. Lakes in this area are utilized and also the existing dry
channels are utilized to transfer the flood waters to agriculture
fields and drought areas. However, Interlinking of rivers is a
challenging task in rugged terrains and it is also has limitations
when working with constraints like railways, roads,
settlements, forests and also with some geomorphologic
features.
5. CONCLUSIONS
It is indeed important to consider the decision of every
individual in distributing the waters resources. So, the obtained
routing map from developed spatial decision model is
published on to the GeoServer and the same is added on to the
Bhuvan portal using the generated KML file. This developed
model can provide lots of information to various categories of
people eg. farmers, water managers, engineers, administrators.
The entire project can be browsed by all the people and they
can get certain benefits out of it. The cost for publishing the
developed routing map on to the GeoServer is completely free
as it is open source software. Open source software’s are
becoming more popular now-a-days as they are secure and the
person operating them has more control over it.
The work presented can be further improved by considering the
following:
Use of high resolution data can be of great advantage
in obtaining the accurate results in the case of land
use/land cover, geomorphology, soil etc.
Use of microwave data will be constructive in
delineating the flood areas.
Though transferring the flood waters by constructing
canals is implemented in this study, the flood waters
can also be stored in harvesting pits by which the
wastelands in the particular study area can be
utilized.
6. REFERENCES
Bharat R. Sharma,, and Upali A. Amarasinghe. 2008.
Strategic Analyses of the National River Linking
Project (NRLP) of India. Colombo: International
Water Management Institute.
Chowdary, V. M., V. R. Desai, Mukesh Gupta, A.
Jeyaram, and YVNK Murthy. 2012. “Runoff
Simulation Using Distributed Hydrological Modeling
Approach, Remote Sensing and GIS Techniques: A
Case Study from an Indian Agricultural Watershed.”
ISPRS-International Archives of the Photogrammetry,
Remote Sensing and Spatial Information Sciences 1:
203–7.
Eadara, Amminedu, and Harikrishna Karanam. 2013.
“Slope Studies of Vamsadhara River Basin: A
Quantitative Approach.” Variations 3 (1).
Kelli Krueger, Frances Segovia, and Monique Toubia.
2007. Assessment of the India River linking plan: A
closer look at the Ken-Betwa pilot link. University of
Michigan.
Khanna, R. K., C. K. Agrawal, Pravin Kumar, and
Chief Engineer Director. 2007. “Remote Sensing and
GIS Applications In Flood Management.” Central
Water Commission, 2–10.
M S ME - De v e l o pm e nt I ns t it ut e. Brief
Industrial Profile of Srikakulam District.
Visakhapatnam.
McCornick, Peter. 2014. “India’s River Linking
Project: The State of the Debate1 Tushaar Shah Upali
Amrasinghe” Draft. Accessed November 11.
Njike Chigbu, and Daniel Onukaogu 2013. “Role of
Geospatial Technology in Environmental
Sustainability in Nigeria-An Overview”, May.
Prakashvel, J., Dr. M. Krishnaveni, and Dr. M.
Kaarmegam. 2003. “GIS and Visualisation
Capabilities for Interlinking of Indian Rivers.” Map
Asia Conference.
Rao, N. Bhaskara, N. Srinivas, BS Prakasa Rao, G.
Jai Sankar, V. Venkateswara Rao, E. Amminedu, N.
Venkateswarlu, N. Rajesh, P. Kesava Rao, and M.
Satya Kumar. 2014. “Study on Nagarjunasagar to
Somasila Link Canal Alignment and Its Impact on
Environment Using IRS-P6, AWiFS Data.” J. Ind.
Geophys. Union (April 2011) 15 (2): 113–24.
Sanyal, Joy, and X. X. Lu. 2004. “Application of
Remote Sensing in Flood Management with Special
Reference to Monsoon Asia: A Review.” Natural
Hazards 33 (2): 283–301.
Shahabi, Cyrus, Yao-Yi Chiang, Kelvin Chung, Kai-
Chen Huang, Jeff Khoshgozaran-Haghighi, Craig
Knoblock, Sung Chun Lee, Ulrich Neumann, Ram
Nevatia, and Arjun Rihan. 2006. “Geodec: Enabling
Geospatial Decision Making.” In Multimedia and
Expo, 2006 IEEE International Conference, 93–96.
IEEE.
Triantaphyllou, Evangelos, and Stuart H. Mann. 1995.
“Using the Analytic Hierarchy Process for Decision
Making in Engineering Applications: Some
Challenges.” International Journal of Industrial
Engineering: Applications and Practice 2 (1): 35–44.
The International Archives of the Photogrammetry, Remote Sensing and Spatial Information Sciences, Volume XL-8, 2014ISPRS Technical Commission VIII Symposium, 09 – 12 December 2014, Hyderabad, India
This contribution has been peer-reviewed.
doi:10.5194/isprsarchives-XL-8-127-2014
132

![Study of Interlinking of Rivers by using Geographic ... · Study of Interlinking of Rivers by using Geographic Information System (GIS) With Quantum-GIS [1] Anupriya , [2] Lalit R](https://img.pdfslide.us/doc/110x75/5ebbcd53ab03d3799645346d/study-of-interlinking-of-rivers-by-using-geographic-study-of-interlinking-of.jpg)