Embed Size (px)
Citation preview

GEOSPATIAL DECISION SUPPORT FOR SEED COMPANIES IN THE CORN BELT
Marcus E. Tooze1, S. Hatten2, W.J. Waltman2, S.E. Reichenbach2, A. Wulf3, W. Fithian3, J.S. Peake4
and D.A. Mortensen5
1GIS Workshop Inc., Lincoln, NE2Dept. of Computer Science & Engineering, University of Nebraska--Lincoln
3The J.C. Robinson Seed Company, Waterloo, Nebraska4Dept. of Geography and Geology, University of Nebraska—Omaha
5Dept. of Agronomy and Horticulture, University of Nebraska--Lincoln
ABSTRACT
As bioinformatics applications unfold in the seed industry, new applications emerge for mapping,analysis, and interpretation of cultivar performance across multiple environments in the Corn Belt.Genotype x environment interactions readily translate into matching the traits of corn hybrids with soilproperties and microclimatic parameters of croplands. Using relative maturity days, growing degree-days,and frost-free periods, soil survey information, elevation models, and LandSat TM landcover, a GISmodeling framework was constructed to map agroecological regions where Golden Harvest’s suite of cornhybrids were bested adapted in the western Corn Belt. In addition, a geospatial framework was developedto identify the soil landscapes that had the best soil qualities and root zone water-holding capacities,reducing risks to drought events. A toolkit of ESRI ArcView extensions were developed for on-screendigitizing of seed production fields, acreage calculations relative to soil properties, and documenting fieldsfor growers and isolation distances.
INTRODUCTION
Although seed companies collect extensive information of corn hybrid performance from seedproduction fields and strip trials over broad geographic regions, the integration of imagery, digital soilsurvey and climate databases, agriculture infrastructure data, and genotypic characteristics in a geospatialcontext is still a newly emerging research and application model. Each year in the Corn Belt, seedcompanies contract with growers to produce seed and also develop a network of strip trials to evaluate theperformance of commercial corn hybrids. Similarly, university researchers also conduct strip trials acrossmultiple environments to evaluate commercial hybrids.
Seed corn production fields are managed to maximize yield, while maintaining purity and quality.Apart from applying best management practices, seed corn production can be maximized by simply betterplanning and layout of the production fields. More efficiently planned production fields rely on the abilityto accurately quantify field “elements” (a field element, in this case, referring to whether that particularsegment of the field contains turn rows, male isolation, fertile female, and sterile female). A secondarybenefit of being able to accurately plan and quantify a field’s potential production (all other effects such asweather and management practice, being equal), is the ability to match production needs to marketdemands.
Geographic information systems are needed in the seed industry to provide key company decision-makers with timely geospatial information of field layout (inbred or hybrid location), isolation distances,biophysical constraints of the fields, accurate estimates of the next growing season’s seed production inadvance, and an image-based approach to tracking yields on the landscape. Such resources can also beused to locate trial sites to insure that spatial extrapolation domains for specific hybrids have beenadequately defined. Geospatial information on soils, climate, and hybrid performance therefore providesthe necessary framework for evaluating “genotype x environment” interactions at varying scales, from thefield to local growing regions and multi-state marketing regions.
Previous Mapping Practice
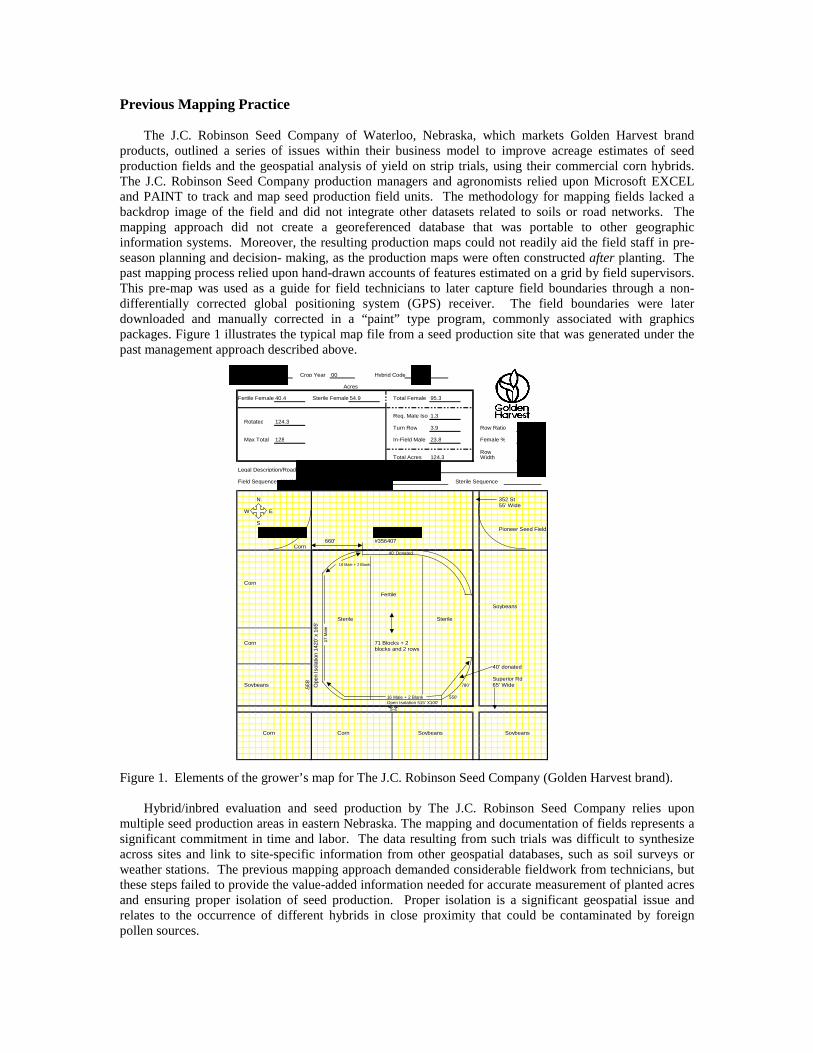
The J.C. Robinson Seed Company of Waterloo, Nebraska, which markets Golden Harvest brandproducts, outlined a series of issues within their business model to improve acreage estimates of seedproduction fields and the geospatial analysis of yield on strip trials, using their commercial corn hybrids.The J.C. Robinson Seed Company production managers and agronomists relied upon Microsoft EXCELand PAINT to track and map seed production field units. The methodology for mapping fields lacked abackdrop image of the field and did not integrate other datasets related to soils or road networks. Themapping approach did not create a georeferenced database that was portable to other geographicinformation systems. Moreover, the resulting production maps could not readily aid the field staff in pre-season planning and decision- making, as the production maps were often constructed after planting. Thepast mapping process relied upon hand-drawn accounts of features estimated on a grid by field supervisors.This pre-map was used as a guide for field technicians to later capture field boundaries through a non-differentially corrected global positioning system (GPS) receiver. The field boundaries were laterdownloaded and manually corrected in a “paint” type program, commonly associated with graphicspackages. Figure 1 illustrates the typical map file from a seed production site that was generated under thepast management approach described above.
Figure 1. Elements of the grower’s map for The J.C. Robinson Seed Company (Golden Harvest brand).
Hybrid/inbred evaluation and seed production by The J.C. Robinson Seed Company relies uponmultiple seed production areas in eastern Nebraska. The mapping and documentation of fields represents asignificant commitment in time and labor. The data resulting from such trials was difficult to synthesizeacross sites and link to site-specific information from other geospatial databases, such as soil surveys orweather stations. The previous mapping approach demanded considerable fieldwork from technicians, butthese steps failed to provide the value-added information needed for accurate measurement of planted acresand ensuring proper isolation of seed production. Proper isolation is a significant geospatial issue andrelates to the occurrence of different hybrids in close proximity that could be contaminated by foreignpollen sources.
Perm # 1324 Crop Year 00 Hybrid Code 388407
Acres
Fertile Female 40.4 Sterile Female 54.9 Total Female 95.3
Req. Male Iso 1.3Rotated 124.3
Turn Row 3.9 Row Ratio 4:1
Max Total 128 In-Field Male 23.8 Female % 76%
RowTotal Acres 124.3 Width 30
Legal Description/Road AddressSE 1/4 of 4-10-2 or 352 St and Superior Rd
Field Sequence W:1M,4F,1M,4F,1M…E:17M,4F,1M,4F,1M Sterile Sequence
N 352 St55' Wide
W E
SMenard Steckly Jim Spahr Pioneer Seed FieldSoybeans Seed Field 1323
660' #356407Corn
Corn
Fertile
Soybeans
Sterile Sterile
Corn 71 Blocks + 2blocks and 2 rows
40' donated
Superior RdSoybeans 780' 65' Wide
16 Male + 2 Blank 550'Open Isolation 515' X100'
Corn Corn Soybeans Soybeans
40' Donated
835' Ope
n Is
olat
ion
1420
' x 1
65'
17 M
ale
16 Male + 2 Blank

A geospatial digitizing tool was needed to map isolation rows and distances, turn spaces, and capturefeatures known to influence seed production.
Objectives
The objectives of our work in this geospatial decision support system were to: 1) develop a series oftools in ArcView that allow on-screen digitizing, attributing, and spatial analysis of seed production andstrip trial fields using digital orthophotography and soil survey geographic databases, 2) develop new soilinterpretations that would guide selection of fields and provide a quantitative approach to explanation ofyield, and 3) develop a framework for the geospatial and temporal analysis of yield for seed production andstrip trial fields.
MATERIALS AND METHODS
Mapping Seed Production Field Elements
ArcView (Version 3.2, ESRI, 2000) was used to as the primary geographic information system for on-screen digitizing and digital capture of seed production and strip trial fields. An accurately mapped seedproduction field provided the basis for field management decisions throughout the growing season.
Data Integration
USGS Digital Orthophoto Quadrangles (DOQ; Nebraska Dept. of Natural Resources, 2001), the PublicLand Survey System (http://dnr.state.ne.us/) and the USDA/NRCS Soil Survey Geographic Database(SSURGO; Soil Survey Staff, 1995) were integrated to evaluate the soil productivity and identifyconstraints to yield, and georeferencing of fields relative to weather stations. These GIS layers provideddecision support through assessment and selection of potential seed production fields and for deriving newparameters for the analysis of yield. The SSURGO database provides seedsmen with more than a hundredsoil properties and interpretations that can relate to agronomic production. Collectively, datasets provideda georeferenced platform upon which various GIS-based analysis tools were constructed. For the fielddigitizing tool, the DOQs provided an excellent backdrop upon which production managers could outlinefields and capture field elements without visiting the field. The PLSS data provided the base data for anautomated zoom tool as part of the field digitizer extension and represented an attribute already commonwithin the seed company databases.
Geographic Setting
For this study, the seed production fields were located in eastern Nebraska (Figure 2), primarilyassociated with Polk, Butler, Seward, and Saunders Counties. These counties occur on the western edge ofthe Corn Belt, along the major ecological boundary defining the rainfed and irrigated regions. All seedproduction fields have irrigation systems, but strip trials commonly occur under rainfed conditions. Thissuite of counties represents part of the East District of Nebraska for agricultural statistics and generallyleads the state in all corn production categories (http:/www.agr.state.us/agstats/index.htm; NebraskaAgricultural Statistics Service, 2000). This seed corn production region is dominantly classified as a TypicUdic soil moisture regime, which suggests that in most years, growing season moisture is adequate forplant growth.
This region varies by only 300 heat units (growing degree-days), but these counties differ by about 100mm (4 in) in mean annual water balance. Between Seward and the David City weather station, there is adistinct difference in soil-climate characteristics, with the David City location having nearly a two-weekadvantage in the cumulative number of days that the soil profile remains moist during the growing season.The differences in biological windows at 5oC can relate to subtle distinctions in late season water supplyduring grain-fill, as well as nitrogen-mineralization and microbial activity from planting to emergence.

Figure 2. Shaded relief of Nebraska illustrating the distribution of irrigation (red) and the location of theseed production fields.
Table 1. Summary of weather stations for the four county growing region, based upon 1961 to 1990normals.____________________________________________________________________
__________________________________________________________________________________*Period of record was 1969-1990.
MAP = Mean Annual Precipitation STR = Soil Temperature RegimePET = Potential Evapotranspiration SMR = Soil Moisture RegimeAWB = Annual Water Balance (MAP – PET) BIO5 = Biological Window at 5 oCMSWB = Mean Summer Water Balance (MAP – PET)jun-jul-aug BIO8 = Biological Window at 8 oCGDD = Growing Degree-Days, base 50 oF FFP = Frost-Free Period, base 32 oF
Note: The Wahoo weather station represents an anomaly in precipitation and growing degree-days withrespect to the other stations in the growing region.
N
Polk
Butler
Seward
Saunders
Station Name MAP PET AWB MSWB GDD FFP STR SMR BIO5 BIO8
-----------(mm)------------ (50oF) (32oF) (d) (d)
Ashland 3N 753 712 41 -137 3346 161 Mesic Typic Udic 218 206
David City 758 703 54 -147 3412 167 Mesic Typic Udic 205 202
Fremont 773 725 48 -145 3506 159 Mesic Typic Udic 216 210
Mead ARDC* 695 704 -9 -159 3468 156 Mesic Typic Udic 215 203
Seward 691 734 -43 -180 3614 173 Mesic Typic Udic 205 212
Wahoo 887 697 190 -101 3286 155 Mesic Typic Udic 214 202
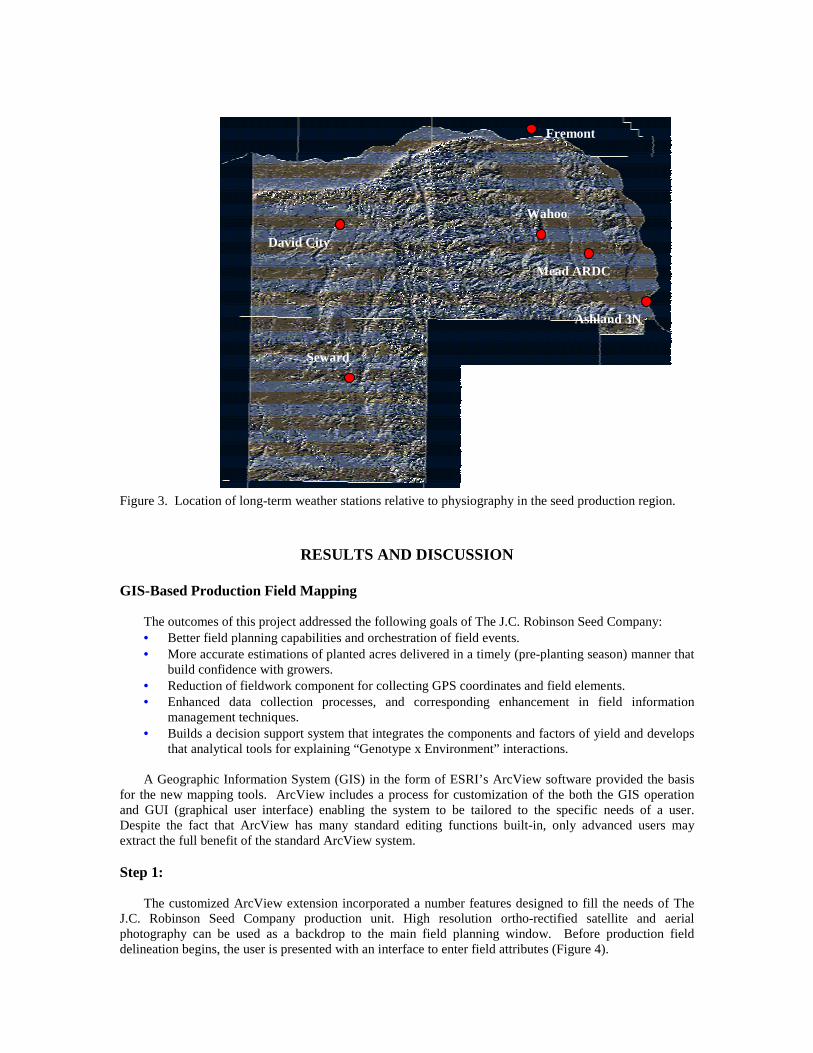
Figure 3. Location of long-term weather stations relative to physiography in the seed production region.
RESULTS AND DISCUSSION
GIS-Based Production Field Mapping
The outcomes of this project addressed the following goals of The J.C. Robinson Seed Company:• Better field planning capabilities and orchestration of field events.• More accurate estimations of planted acres delivered in a timely (pre-planting season) manner that
build confidence with growers.• Reduction of fieldwork component for collecting GPS coordinates and field elements.• Enhanced data collection processes, and corresponding enhancement in field information
management techniques.• Builds a decision support system that integrates the components and factors of yield and develops
that analytical tools for explaining “Genotype x Environment” interactions.
A Geographic Information System (GIS) in the form of ESRI’s ArcView software provided the basisfor the new mapping tools. ArcView includes a process for customization of the both the GIS operationand GUI (graphical user interface) enabling the system to be tailored to the specific needs of a user.Despite the fact that ArcView has many standard editing functions built-in, only advanced users mayextract the full benefit of the standard ArcView system.
Step 1:
The customized ArcView extension incorporated a number features designed to fill the needs of TheJ.C. Robinson Seed Company production unit. High resolution ortho-rectified satellite and aerialphotography can be used as a backdrop to the main field planning window. Before production fielddelineation begins, the user is presented with an interface to enter field attributes (Figure 4).
Fremont
David City
Seward
Wahoo
Mead ARDC
Ashland 3N

Figure 4. Field data entry window in ArcView, illustrating data elements for the grower.
Step 2:
These data are collected for the user, and stored in ArcView for future use in the automated mappingprocedure. Once the user has entered relevant field information (field number, grower’s address) the user ispresented with the standard mapping interface (Figure 5).
Figure 5. Standard interface presented to the production field planner. Note the simplified interfaceutilizing only a few buttons and tools. Also, note the DOQQ as a backdrop and the inferences of soilerosion and organic matter content that can provide context for interpreting yield.

Step 3:
Once the user begins digitizing the field boundary, an information window appears on the screen,which displays field information and element (i.e. turn row, open isolation) acreage information in real-time. That is, as the user adds field elements, or changes the boundary positions of those elements, theinformation concerning calculated acres will be updated on-the-fly (Figure 6). From the DOQQ, thetechnical agronomist can recognize and map eroded areas, saline seeps, small depressions that pond in thespring, weed patches, hail damage, areas of insect infestation, or areas of plant diseases and nutrientdeficiencies. The DOQQ often provides sufficient landscape context for delineating these impacts onfields, without the need to GPS individual spots. Similarly, soil test locations and results can be added tothese fields as ad hoc symbols, following conventions in soil surveys.
Figure 6. The field information form. These forms are updated and calculated on-the-fly as the user entersand manipulates the field element boundaries.
Step 4:
The user begins delineating the field boundary, then filling-in each field element using the customdrafting tools (Figure 7). The user may query metrics for the field elements, such as measuring acres offertile female, isolation distances, and other setbacks. This information is later used to calculate potentialseed yield. This GIS approach removes the necessity for fieldwork, and allows the production managementto spend off-season time to plan production fields for the next growing season and reanalyzing the pastyear’s yield. A final step made available to production staff is the ability to easily print out farm field plansnot only for in-house use, but also for grower’s and custom applicators as well.
Step 5:
The user can create an ArcView layout as a template with this field information on a single 8.5 x 11-inch sheet (Figure 8). Although these maps are generated for field tracking and overall documentation,these maps are also provided to contractors for detasseling and custom application.

Figure 7. The field delineation process captures grower information. Note the on-the-fly calculation offield parameters important to maximizing seed production of the field.
Figure 8: Automatic layout generation for printing hardcopy for the field and grower’s records. The layoutcreation process has been reduced to a single button press, and customized code extracts the informationand positions it on the layout. Hardcopy generation is still an important process for farm record keeping, aswell as documentation for field staff to edit and note localized field problems.

Geospatial Analysis of Growers and Fields
Using the GIS overlays as shown in Figure 8, the root zone water-holding capacity (RZWHC) and soilrating for plant growth (Sinclair et al., 1999) were summarized across the fertile female blocks. Aweighted-average calculation was derived for each SSURGO mapunit, field, and grower, which were laterused as parameters in a simple empirical yield model. The root zone water-holding capacity reflects thetotal “plant available” water storage across an effective rooting depth in soils (Sinclair et al., 1999; SoilSurvey Staff, 2000). For seed production, this soil interpretation identifies the “buffering capacity” of asoil to resist drought events. In general, soils with higher root zone water-holding capacities will requireless supplemental irrigation and offer an inherent mitigation against drought. Additionally, the soils withhigher root zone water-holding capacities will have better nutrient retention characteristics, which are keysoil qualities, given a more uncertain climate.
The Soil Rating for Plant Growth (SRPG) reflects the integration of twenty-five physical, chemical,mineralogical, and landscape properties of soils (Soil Survey Staff, 2000). In this rating scheme, the indexvalues range from 0 to 100, with 100 representing the highest soil productivity or combination of soil,climate, and landscape traits. The SRPG calculations followed the “Storie Index Soil Rating” (Storie andWeir, 1958; Storie, 1978), which was based on soil characteristics that govern the land’s potentialutilization and productive capacity. The underlying assumptions of the SRPG strongly reflect the soil andenvironmental growing conditions for maize. The RZWHC and SRPG represent coupled parameters ormetrics from the SSURGO database that strongly correlate to corn yield (Gadem, 2000).
Figure 9. ArcView layout of J.C. Robinson seed field in Seward County, Nebraska. The MUSYM is theSSURGO map unit symbol, RZWHC is the Root Zone Water-Holding Capacity of each SSURGO mapunit, and SRPG is the Soil Rating for Plant Growth (Soil Survey Staff, 2000). The backdrop is the USGSdigital orthophotograph with the SSURGO vectors superimposed.

Yield Modeling and Interpretation
The digital maps of the seed production fields enable introduction of soil parameters into empiricalcorn yield models. As part of the attribute data collected for each field, the planting date, managementscore, relative maturity of the hybrid or inbred, crop rotation, SRPG, RZWHC, percent green-snap, terrainvariables (elevation, slope, and aspect), and climatic parameters from the nearest weather station to thefield, can be used as predictors of corn yield. Although soil surveys provide a long-term estimate of cornyields by SSURGO mapunit, the SSURGO yield value lacks the temporal variability associated withclimatic events, such as drought.
The linkage between fields, soil properties, landscape characteristics, traits of the hybrid, and thenearest weather station can be used to derive “in-house” empirical relationships that explain a significantportion the yield. Similarly, this framework can be expanded to include other factors such as weedpopulations and insect damage, and scouting information as it becomes available. In addition to the seedproduction yield modeling, there is also the need for simple empirical relationships of yield on a countybasis to project yield behavior and potential climatic or environmental risks. For example, Figure 10presents the corn yield profile for Butler County, Nebraska, under irrigated and non-irrigated conditions(USDA/NASS, 2001). These relationships can be derived for each county and used to map areas of higheryield variation or where regions share similar yield behavior to El Nino/La Nina events through time.Figure 10 illustrates the linear trend of increasing yields through time for both irrigated and non-irrigatedyields and the dampened yield variation under irrigation. The progression in yield is attributed toimprovement of corn hybrid genetics and cultural practices (tillage and pest management; soil fertilitymanagement).
Figure 10. Comparison of irrigated and non-irrigated yields through time for Butler County, Nebraska.The major drops in non-irrigated yields are dominantly associated with major drought events during 1956-1957, 1974-1976, 1980, and 1988-1989. However, not all counties in the conterminous U.S. will show thisprogression of yield through time.
In decision support, geospatial “rules of thumb” can be developed from seed and strip trial yieldhistories to better understand hybrid or inbred behavior and predict potential yields prior to actual harvest.Figure 11 shows a simple empirical relationship between yield and planting date. Similar relationships canbe developed for growing season precipitation and heat units to identify impacts of climatic variability onclosely clustered seed production fields. These relationships will have geospatial constraints to theirapplicability. As Figure 12 illustrates, the field locations or clusters can also be summarized by more
020406080
100120140160180
1940 1950 1960 1970 1980 1990 2000Year
Cor
n Y
ield
s (bu
/acr
e) Genetic Improvement + Management
IrrigatedNon-Irrigated
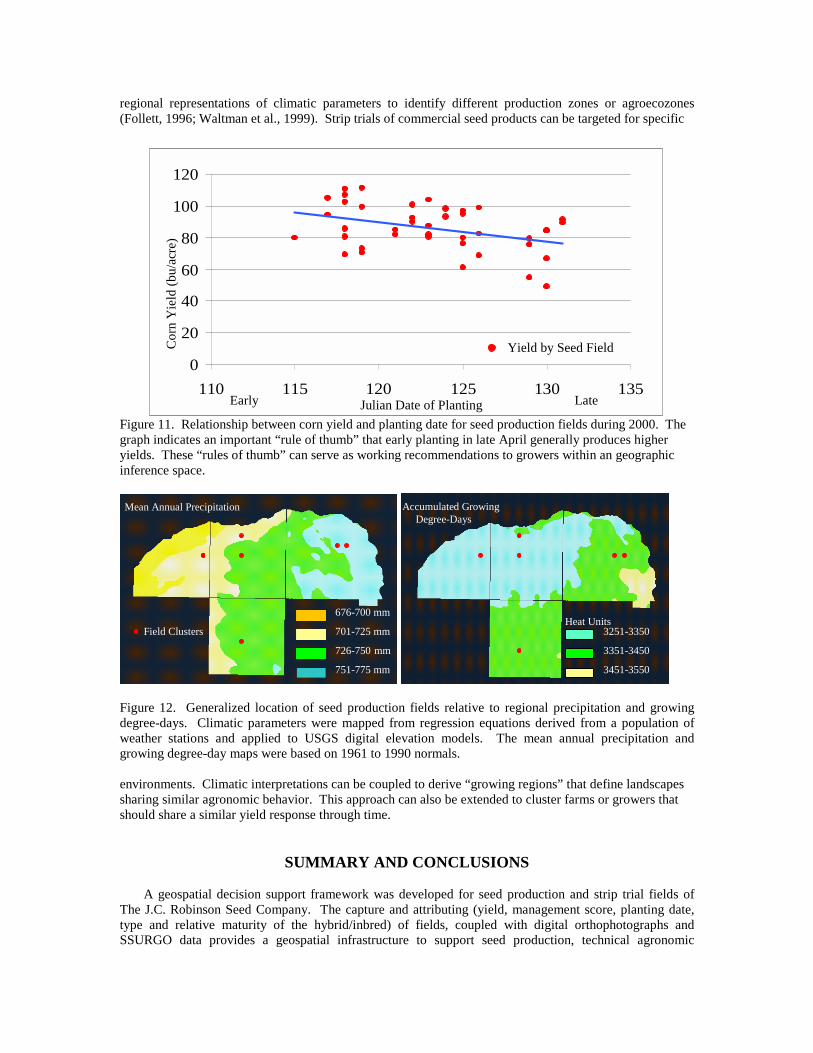
regional representations of climatic parameters to identify different production zones or agroecozones(Follett, 1996; Waltman et al., 1999). Strip trials of commercial seed products can be targeted for specific
Figure 11. Relationship between corn yield and planting date for seed production fields during 2000. Thegraph indicates an important “rule of thumb” that early planting in late April generally produces higheryields. These “rules of thumb” can serve as working recommendations to growers within an geographicinference space.
Figure 12. Generalized location of seed production fields relative to regional pdegree-days. Climatic parameters were mapped from regression equations deriweather stations and applied to USGS digital elevation models. The mean growing degree-day maps were based on 1961 to 1990 normals.
environments. Climatic interpretations can be coupled to derive “growing regionssharing similar agronomic behavior. This approach can also be extended to clusteshould share a similar yield response through time.
SUMMARY AND CONCLUSIONS
A geospatial decision support framework was developed for seed productioThe J.C. Robinson Seed Company. The capture and attributing (yield, managemtype and relative maturity of the hybrid/inbred) of fields, coupled with digitSSURGO data provides a geospatial infrastructure to support seed producti
0
20
40
60
80
100
120
110 115 120 125 130 135Julian Date of Planting
Yield by Seed FieldCor
n Y
ield
(bu/
acre
)
676-700 mm
701-725 mm
726-750 mm
751-775 mm
Mean Annual Precipitation Accumulated Growing Degree-Days
Field Clusters
Early Late
Heat Units
recipitation and growingved from a population ofannual precipitation and
” that define landscapesr farms or growers that
n and strip trial fields ofent score, planting date,
al orthophotographs andon, technical agronomic
3251-3350
3351-3450
3451-3550

support, research and development, as well as marketing and sales of commercial seeds. ArcView 3.2along with developed extensions for on-screen digitizing of fields and collection of grower informationwere constructed and tested within the business model of J.C. Robinson Seed Company. The fielddigitizing tool will enter The J.C. Robinson Seed Company production system in the first quarter of 2001for implementation and testing. Production staff will provide valuable feedback on the tools andoperations, allowing the programming team to make adjustments to the Graphical User Interface (GUI).Future directions will include modules for “Genotype x Environment” (GxE) interactions and expandedanalysis of multi-environment field trials. Our current approach integrates imagery, soils, climate, andterrain data bases across multiple scales and years of yield analysis. Several prototype GxE tools have beencreated and are currently being tested by staff within the research and development departments of majorseed companies. GIS-based GxE tools will provide seed companies with the ability to visualize yield dataand extract meaningful environmental relationships with geospatial databases of soils, terrain, and climate.
REFERENCES
ESRI. (2000). ArcView Version 3.2. Environmental Systems Research Institute, Inc. www.esri.com,Redlands, CA.
Follett, R. F. (1996). Determination of agroecozones in the continental United States. Unpublished ARS report.Colorado State University, Fort Collins, CO. 26p.
Gadem, A.E. (2000). An approach for evaluating soil productivity and riparian ecosystems using remote sensing andGIS. M.A. Thesis. Dept. of Geography, University of Nebraska—Lincoln, Lincoln, NE.
Jindal, G. (2000). Analysis of multi-environment field trials using information theory. M.S. Thesis,Dept.of Computer Science & Engineering, University of Nebraska—Lincoln, Lincoln, NE.
Nebraska Dept. of Natural Resources. (2001). Digital orthophoto quadrangles (DOQ), Lincoln, NE.http://dnr.state.ne.us.
Roth, G.W. (1992). Considerations for selection corn hybrids in Pennsylvania. Agronomy Facts 34, PennState Cooperative Extension, The Pennsylvania State University, PA.
Sinclair, H.R., W.J. Waltman, S.W. Waltman, R.M. Aiken, and R.L. Anderson. (1999). A method forevaluating inherent soil quality for crops across major land resource areas. Precision Agriculture,Proceedings of the 4th International Conference, St. Paul, MN. 429-440p.
Storie, R.E. (1937). An index for rating agricultural value of soils. Bulletin 556, Univ. of California, Berkeley, CA.Storie, R.E. and W. W. Weir. (1948). Manual for identifying and classifying California soil series. Univ. of
California, Berkeley, CA.Thomas, V.L., R.M. Aiken, and W. J, Waltman. (2000). Decision support for farmers. ArcUser Vol. 3,
1:58-61.Soil Survey Staff. (1995). Soil Survey Geographic (SSURGO) Database. USDA/NRCS, Misc. Publ. 1527,
National Soil Survey Center, Lincoln, NE. 110p. http://www.ftw.nrcs.usda.gov/ssur_data.htmlSoil Survey Staff. (2000). Soil Ratings for Plant Growth, A System for Arraying Soils According to Their
Inherent Productivity and Suitability for Crops. Holzhey and Sinclair (eds.), USDA Natural ResourcesConservation Service, National Soil Survey Center, Lincoln, NE.
USDA National Agricultural Statistics Service. (2001). Historical Data—Crops, Livestock, Farms…byCounty. http://www.nass.usda.gov:81/ipedb/.Waltman, W.J., D.A. Mortensen, K.G. Cassman, L.A. Nelson, J.E. Specht, H.R. Sinclair, S.W. Waltman,S.
Narumalani, and J.W. Merchant. (1999). Agroecozones of Nebraska. Agronomy Abstracts, AnnualMeetings, ASA-CSSA-SSSA, Salt Lake City, UT.