Embed Size (px)
Citation preview

More than meets the eye.
2004Geospace Technologies
Geo
spac
e O
ffsh
ore
OYO Instruments
Geo
space Eng
ineerin
g R
esou
rces Intern
ation
al

ONE CORPORATION.
FOUR COMPANIES.
L I M I T L E S S P O S S I B I L I T I E S .
Forward-Looking Statements All statements in this Annual Report, other than statements of historical fact included herein, including statementsregarding potential future products and markets, our potential future revenues, future financial operations, future product lines, growth of productmarkets and other statements are forward-looking statements for purpose of the Securities Act of 1933 and the Securities Exchange Act 1934. Thesestatements are subject to known and unknown risks, uncertainties and other factors that may cause our actual results, performance or achievementsto differ materially from the future results, performance or achievements expressed or implied by such forward-looking statements, including the risksand factors described in the attached Form 10-K. You are cautioned to consider the factors and statements described under the heading “Risk Factors”in the Form 10-K in connection with evaluating any such forward-looking statements.

To Our Shareholders:
We concluded our Fiscal 2003 annual report by stating “We believe … that in Fiscal 2004 OYO Geospace
will return to profitability.”
It gives me great pleasure to report to our shareholders that in Fiscal 2004, through the tireless
efforts, bold initiatives and unflagging loyalty of our employees, our management team and our board
of directors, we have accomplished that goal.
For Fiscal 2004 we recorded net income of $6.0 million, or $1.05 per diluted share, on revenues of
$63.5 million. This compares with a net loss of $2.5 million, or $(0.46) per diluted share, on revenues
of $50.9 million in fiscal year 2003.
Our four companies contributed significantly to our progress in Fiscal 2004 and are well positioned
for growth in Fiscal 2005:
Geospace Technologies (our seismic exploration products company) – Higher oil and gas prices
fueled increased fiscal year 2004 demand for our seismic exploration products. In addition, our
manufacturing facility in Ufa, Bashkortostan, Russia is now fully operational, supplying products for
worldwide distribution. This manufacturing facility is strategically located given the petroleum
industry’s ongoing interest in the region’s hydrocarbon potential.
Geospace Engineering Resources International (GERI, our seismic reservoir products company) –
Our permanent seafloor reservoir monitoring solution at BP’s Valhall Field in the North Sea has now
completed four field seismic surveys. Our solution has, in each case, performed as designed. Most
recently, we deployed a pilot reservoir monitoring solution over a Shell field in the Gulf of Mexico. The
field is located in 1,000 meters of water. By leveraging the knowledge and experience from these projects
we continue to build our significant competitive advantage for future reservoir monitoring projects.
Geospace Offshore (our non-seismic deepwater cable products company) – Is emerging as an
important growth platform for the corporation. Their activities broaden our exposure to, and increase
our penetration of, the offshore oil and gas market. They are defining the rules of engagement for
winning future projects and laying critical groundwork for promising commercial opportunities.

OYO Instruments (our thermal solutions product company) – Is now completing a
transfer of thermal printhead manufacturing assets from Japan to our Houston, Texas
headquarters. Once the transfer is complete we will have manufacturing control over
the entire thermal solutions value chain – thermal imaging equipment, film and the
thermal printheads.
Our Houston area facility consolidation was a significant achievement this past year.
The benefits from this effort contributed significantly to our year and identified additional
ways to further improve our organization. These business realignment and consolidation
efforts are now being realized. We have built a strong, reliable and collaborative organiza-
tional base enabling us to agilely exploit new possibilities that build future profitability. As
our Fiscal 2004 annual report illustrates, OYO Geospace is one corporation, with four
vigorous companies offering limitless possibilities for returning value to our shareholders.
On behalf of OYO Geospace’s employees, our management team and our board of
directors, I want to thank our shareholders for their continuing support.
Sincerely,
Gary D. Owens


OYO Geospace returns value to our shareholders, our customers and our employees through our
unwavering focus on our strategic core competencies:
• Detailed Industry Knowledge • Engineering Expertise • Manufacturing Excellence
Detailed Industry Knowledge
Our teams consist of industry-savvy, technically-astute experts who intimately understand our
customer’s needs. Years of experience and in-depth knowledge allow our teams to anticipate and
actively exploit emerging commercial opportunities in the following industries:
• Oil and Gas Exploration • Oil and Gas Reservoir Monitoring
• Offshore Oil and Gas Cabling • Thermal Imaging
Engineering Expertise
Through years of practical field experience, our
engineers fully understand the harsh operating
demands and hostile environments to which our
product solutions will ultimately be subjected.
Their practical knowledge guides rigorous
engineering design and material specifications.
The resulting specifications deliver superior field
reliability and consistently surpass our customers’
expectations.
• Analog and Digital System Design
• Sensor, Cable and Connector Design
• Software and Microcode Development
• Mechanical Packaging
• Operational Support
Manufacturing Excellence
Controlling our own manufacturing process is critical to delivering high value and satisfaction to our
customers. Our customers’ unique specifications require that our manufacturing facilities are designed
to handle custom and near-custom work in a flexible, timely and cost-effective manner. Much of our
shop floor machinery is proprietary in design, and our plant is unrivaled in the region.
• Sensor, Cable and Umbilical Production • Mechanical and Digital Systems Assembly
• Computer-Controlled Machining • Injection Molding • Testing Procedures • Quality Assurance
Poised for the Future
Combining our firm strategic understanding of markets with the knowledge, domain expertise and best
practices of our employees and our best-in-class manufacturing facilities, OYO Geospace targets value
delivery through four component companies.


Strategic International Capabilities
OYO Geospace now controls a 97% ownership in OYO-GEO ImpulseInternational LLC.
OYO-GEO Impulse, located in Ufa, Bashkortostan, Russia is aregionally significant manufacturer of our sensor solutions for theRussian, European, Middle Eastern and African markets. Recently, theWall Street Journal reported that some petroleum industry experts believeRussia could have two to three times its current proven reserves of 70billion barrels. Should increasing regional scrutiny translate intoincreased exploration activity, the OYO-GEO Impulse manufacturingfacility is strategically located to take advantage of it.
Geospace Technologies
To meet current and future energy demands, oil
and gas companies are vigorously searching out
new oil and gas reserves on a global scale. Collecting
and analyzing subsurface seismic data is one of the
most common and highly trusted technologies used in
this search. Obtaining accurate and reliable seismic
data requires sophisticated, highly sensitive and field-
dependable sensor solutions.
Geospace Technologies is a leading manufacturer
and supplier of recording instrumentation solutions,
precision sensors (geophones, hydrophones, vibration
detectors and seismometers), and custom seismic cable
assemblies and connectors for land and marine oil and
gas exploration.
Our sensor solutions also play integral roles in the
security, industrial sensor and geotechnical engineering
markets, which are gaining importance in an
increasingly security- and safety-conscious world.

Geospace Engineering Resources International (GERI)
In today’s energy economy, reducing the massive capital costs associated with oil and gas field development
while increasing field productivity are vitally important but often conflicting operational goals. Achieving both
demands more and better data, which in turn requires next-generation reservoir monitoring technology.
Geospace Engineering Resources International, known industry-wide as GERI, was formed to develop and
deploy sophisticated reservoir monitoring solutions. Data collected by our sea-floor and wellbore seismic
solutions allow oil and gas engineers to actively monitor critical changes inside the reservoir. By acquiring more
and better data, engineers dramatically enhance their operational and production decisions. Because GERI is
actively involved in seismic monitoring projects and is continuously seeking out new project opportunities, it
has become a significant contributor to our company’s overall financial performance.

GERI successfully designed, manufactured and deployed the world's largestpermanent deepwater seismic recording system for BP in the North Sea ValhallField. That GeoRes system includes 120 km of armored cable, houses 2,504sensor stations, and covers 45 sq. km of seafloor. The system has completed itsfourth reservoir survey, and in each survey it has performed as designed. BPnow believes that this reservoir monitoring project will enable the company torecover an additional 60 million barrels of oil from the Valhall Field.
In the U.S. Gulf of Mexico, we deployed a pilot reservoir monitoringsolution over a Shell field in 1,000 meters of water. Leveraging knowledgeand experience gained from these projects, we continue to build significantcompetitive advantage for ourselves in future reservoir monitoring projects.
Permanent Reservoir Monitoring Capabilities

Critical UmbilicalComponents
Recently Geospace Offshore was
contracted to manufacture 61,000 feet of
quad component for an umbilical
manufacturer. These quad components are
interior elements of the umbilical’s final
design and are critical for supplying
reliable electrical power during
operations. Because of this project, several
manufacturers of offshore umbilicals and
Geospace Offshore are exploring a
potential business relationship where we
would serve as their manufacturing source
for critical umbilical components.
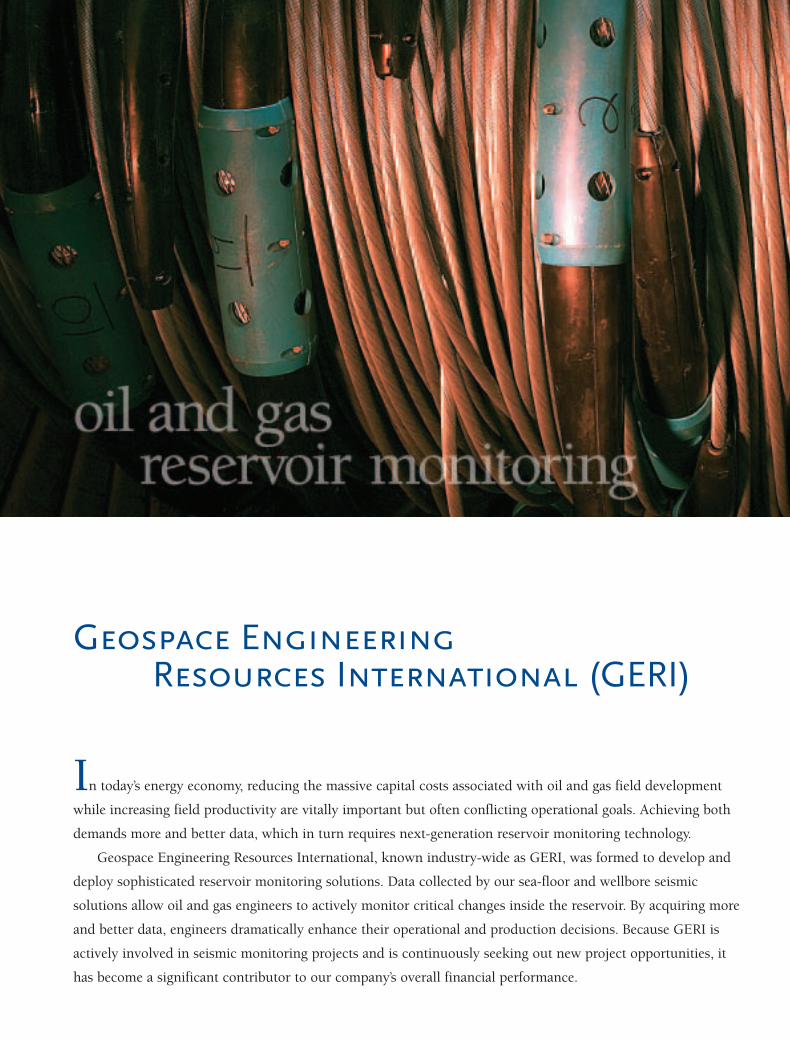
Geospace Offshore
The global offshore oil and gas industry is a high-
risk business conducted in a dangerous and hostile
environment. Because of these harsh operating
parameters, offshore cable and umbilical products
must be fit-for-purpose, best-in-class and suitable for
deployment in mission-critical situations. Offshore
cable and umbilical customers demand products of
superb quality and reliability.
Geospace Offshore designs and manufactures cable
and umbilical products for the oilfield and remote-
operated vehicle (ROV) service industries and for
specialty cable markets. Our manufacturing facilities
in Houston, Texas, produce technically sophisticated
and highly reliable cabling and umbilical solutions for
electrical, fiber optic, electro-mechanical and electro-
hydraulic applications. Our unique manufacturing
facilities are designed to handle custom and near-
custom work in a flexible, timely and cost-effective
manner. The one-of-a-kind layout and custom
machinery in our manufacturing facilities is
unmatched in this part of the country, and our plant is
strategically located just 90 miles from the U.S. Gulf of
Mexico, one of the world’s most active offshore
hydrocarbon regions.


In the graphics industry, professional-quality image
output demands precision equipment and
accessories manufactured under rigorous quality-
controlled conditions.
In response, OYO Instruments has become a
leading manufacturer of professional-quality thermal
imaging equipment and film products. Our products
provide unique, reliable, affordable and chemistry-
free thermal image solutions to an array of graphic
display industries requiring large-format (12 to 54
inch wide) images with image resolutions ranging
from 200 to 1,200 dpi.
OYO Instruments
Controlling Our Value Chain
Precision manufacturing with rigorous quality controls are critical to
customer satisfaction and product sales. With this in mind, OYO
Instruments is moving to control our manufacturing value chain for thermal
imaging solutions. We currently own the manufacturing process links for
imaging devices and film products and are transitioning the manufacture of
thermal printheads (TPH) from Japan to our Houston, Texas plant. In
addition to fundamental quality control, this consolidation ensures that our
TPH manufacturing matches our thermal film characteristics.
OYO Instruments will have the distinction of being the only U.S.
manufacturer of TPHs larger than six inches wide with resolutions beyond
400 dpi. Worldwide, we will be the only manufacturer of single-substrate
TPHs in excess of 14 inches wide with resolutions of up to 1,200 dpi.
Resolution, TPH width and TPH/film match are critical determinants of
final image quality.


ONE CORPORATION.
FOUR COMPANIES.
L I M I T L E S S P O S S I B I L I T I E S .
More than meets the eye.
OYO Geospace was organized in 1994. We have been in the seismic instrument and
equipment business since 1980, marketing our products primarily to the oil and gas
industry worldwide. We also design and manufacture thermal imaging equipment
and distribute dry thermal film products to the commercial graphics industry. We
have been serving the commercial graphics industry since 1995.
OYO Geospace is headquartered in Houston, Texas. Our international sales
locations include Canada, China, Russia, and the United Kingdom with international
manufacturing facilities located in Canada and Russia.

OFFICERS
Gary D. Owens
Chairman of the Board
President & Chief Executive Officer
Michael J. Sheen
Senior Vice President
Chief Technical Officer
Thomas T. McEntire
Chief Financial Officer
DIRECTORS
Gary D. Owens
Chairman of the Board
President & Chief Executive Officer
Thomas L. Davis, Ph.D.
Professor of Geophysics,
Colorado School of Mines
Katsuhiko Kobayashi
Senior Executive Officer
OYO Corporation
William H. Moody
Retired Partner
KPMG
Ryuzo Okuto
Retired Managing Director
Chisso Corporation
Michael J. Sheen
Senior Vice President
Chief Technical Officer
Charles H. Still
Partner
Fulbright & Jaworski L.L.P.
O f f i c e r s a n d D i r e c t o r s

Corporate Headquartersand Operating Facility
OYO Geospace Corporation
7007 Pinemont Drive
Houston, Texas 77040
(713) 986-4444
Geospace Technologies
(713) 939-7093
Geospace Offshore
(713) 939-7093
OYO Instruments
(713) 937-5800
Geospace EngineeringResources International
(713) 986-4444
OYO-GEO Impulse International LLC
Kirovogradskaya, 36,
Ufa, Bashkortostan, Russia
450001
(7) 3472 25 3973
OYO Geo Space Canada, Inc.
2735-37 Avenue, N.E.
Calgary, Alberta, Canada T1Y 5R8
(403) 250-9600
OYO Geospace China
Room 700, 7th Floor, Lido Office Tower
Lido Place
Jichang Road
Beijing 100004, P. R. China
86 10 64378768
OYO Instruments, Europe Ltd.
F3 Bramingham Business Park
Enterprise Way, Luton,
Bedfordshire LU3 4BU,
England
44 (0) 1582 573 980
w w w . o y o g e o s p a c e . c o m

UNITED STATESSECURITIES AND EXCHANGE COMMISSION
Washington, D.C. 20549
FORM 10-K
È Annual Report Pursuant to Section 13 or 15(d) of the Securities Exchange Act of1934for the Fiscal Year Ended September 30, 2004
OR
‘ Transition Report Pursuant to Section 13 or 15(d) of the Securities Exchange Act of1934
Commission file number 001-13601
OYO GEOSPACE CORPORATION(Exact Name of Registrant as Specified in Its Charter)
Delaware 76-0447780(State or Other Jurisdiction ofIncorporation or Organization)
(I.R.S. EmployerIdentification No.)
7007 Pinemont DriveHouston, Texas 77040-6601
(Address of Principal Executive Offices)
(713) 986-4444(Registrant’s telephone number, including area code)
Securities Registered pursuant to Section 12(b) of the Act:Title of Each Class Name of Each Exchange on Which Registered
Common Stock NASDAQ National Market
Securities Registered pursuant to Section 12(g) of the Act: NONE
Indicate by check mark whether the Registrant (1) has filed all reports required to be filed by Section 13 or15(d) of the Securities Exchange Act of 1934 during the preceding 12 months (or for such shorter period that theRegistrant was required to file such reports), and (2) has been subject to such filing requirements for the past 90days. Yes È No ‘
Indicate by check mark if disclosure of delinquent filers pursuant to Item 405 of Regulation S-K is notcontained herein, and will not be contained, to the best of the Registrant’s knowledge, in definitive proxy orinformation statements incorporated by reference in Part III of this Form 10-K or any amendment to thisForm 10-K. È
Indicate by check mark whether the Registrant is an accelerated filer (as defined in Exchange ActRule 12b-2). Yes ‘ No È
There were 5,590,710 shares of the Registrant’s Common Stock outstanding as of the close of business onDecember 1, 2004. As of March 31, 2004, the aggregate market value of the Registrant’s Common Stock held bynon-affiliates was approximately $42 million (based upon the closing price of $17.32 on March 31, 2004, asreported by the NASDAQ Stock Market, Inc.)
DOCUMENTS INCORPORATED BY REFERENCE
Portions of the definitive proxy statement for the Registrant’s 2005 Annual Meeting of Stockholders areincorporated by reference into Part III of this report.
PART I
Item 1. Business
Company Overview
OYO Geospace was organized in 1994. We design and manufacture instruments and equipment used in theacquisition and processing of seismic data. We have been in the seismic instrument and equipment business since1980, marketing our products primarily to the oil and gas industry worldwide. We also design and manufacturethermal imaging equipment and distribute dry thermal film products to the commercial graphics industry. Wehave been serving the commercial graphics industry since 1995.
Seismic Industry
Geoscientists use seismic data to map potential or existing oil and gas bearing formations and the geologicstructures that surround them. Seismic data is used primarily in connection with the exploration, developmentand production of oil and gas.
Seismic data acquisition is conducted on land by combining a seismic energy source and a data recordingsystem. The energy source imparts seismic waves into the earth, reflections of which are received and measuredby geophones and hydrophones. Electrical signals generated by the geophones and hydrophones aresimultaneously transmitted through leader wire, geophone and hydrophone string connectors and telemetric cableto data collection units, which store information for processing and analysis. Seismic thermal imaging outputdevices are used in the field or office to create a graphic representation of the seismic data after it has beenacquired.
Marine seismic data acquisition is conducted primarily by large ocean-going vessels that tow long seismiccables known as “streamers”. Usually, the energy source in marine seismic data acquisition is an airgun, and thereflected seismic waves are received and measured by hydrophones, which are an integral part of the streamers.The streamers simultaneously transmit the electrical impulses back to the vessel via telemetric cable includedwithin the streamers, and the seismic data is recorded and processed in much the same manner as it is for seismicdata acquisition on land.
Our high definition reservoir characterization products are designed and configured for customizedmonitoring applications for producing oil and gas fields. Utilizing these systems, producers can better identifyand enhance the recovery of oil and gas deposits over the life of the reservoir. Reservoir characterization andmanagement programs, in which the reservoir is carefully imaged and monitored throughout its economic life byseismic instruments and equipment, are now seen as vital tools for improving production recovery rates. Seismicsurveys repeated over selected time intervals show dynamic changes within the reservoir and can be used tomonitor the effects of production. Demand for our products depends primarily on the level of worldwide oil andgas exploration activity. That activity, in turn, depends primarily on prevailing oil and gas prices and availabilityof seismic data.
We expect to incur significant future research and development expenditures aimed at the development ofadditional seismic acquisition products used for high definition reservoir characterization in both land and marineenvironments.
While orders for our products can vary substantially from quarter to quarter, reservoir characterizationprojects, especially large-scale deepwater projects, require the use of more equipment over a longer period oftime than is required by conventional surface seismic systems. Revenue recognition in accordance with generallyaccepted accounting principles for these large-scale projects has the potential to result in substantial fluctuationsin our quarterly performance. These variations may impact our operating results and cash flow, manufacturingcapability and expense levels in any given quarter. Furthermore, because of the scale and nature of reservoircharacterization projects, there may be delays in their implementation and uncertainties about their final course.
2

During our fiscal year ended September 30, 2002, we delivered a reservoir characterization and monitoringsystem to a major oil company, for installation in one of its fields in the North Sea. In accordance with the termsof the contract, we recognized $15.8 million of revenues in our fiscal year ended September 30, 2002 and $2.5million of revenues in our fiscal year ended September 30, 2003. Due to the system’s successful performancethrough December 31, 2003, we earned an additional $3.6 million performance bonus, which we recognized asrevenue in fiscal year 2004. Our product warranty obligation extends to 2006 for certain components of thesystem.
We believe that our reservoir characterization systems, including the system referenced above, are importantnew technologies in our industry and our ability to develop and market them will be a key determinant of oursuccess in the future.
Commercial Graphics Industry
We entered into the commercial graphics business in 1995 as we leveraged our thermal imaging producttechnology, originally designed for seismic data processing applications, into new markets. With minor productmodifications, we were successful in adapting these products for use in the commercial graphics industry.
Our commercial graphics business segment manufactures and sells thermal imaging equipment and drythermal film primarily to the screen print, point of sale, signage and textile market sectors. Our thermal imagingequipment is capable of producing data images ranging in size from 12 to 54 inches wide, with resolution rangingfrom 400 to 1,200 dpi (dots per inch). This business segment has some sales to customers in the seismic industry.
In April 2002, we purchased for $2.3 million certain intellectual property rights from our then primarysupplier of dry thermal film (the “Former Primary Film Supplier”). Such purchase gave us exclusive ownershipof all technology used by the Former Primary Film Supplier to manufacture dry thermal film used in the thermalimaging equipment we manufacture. Such purchase included technology then existing and any dry thermal filmtechnology thereafter developed by the Former Primary Film Supplier for use in our equipment. We also enteredinto an amended supply agreement pursuant to which the Former Primary Film Supplier agreed to provide uswith the dry thermal film. In connection with the purchase, we agreed to license the technology to the FormerPrimary Film Supplier on a perpetual basis so long as it could meet predefined quality and delivery requirements.If the Former Primary Film Supplier could not meet such requirements, the agreement provided us with the rightto use the technology ourselves or to license the technology to any third party to manufacture dry thermal film.
On July 3, 2002, the Former Primary Film Supplier filed a Chapter 11 reorganization petition in FederalBankruptcy Court for the Western District of New York. At the date of such bankruptcy filing, we had $3.4million of long-term assets carried on our balance sheet as a result of the prior transactions with the FormerPrimary Film Supplier (including the $2.3 million investment in intellectual property acquired from the FormerPrimary Film Supplier described above).
Shortly thereafter, the Former Primary Film Supplier ceased providing us with dry thermal film. As a result,we are currently purchasing a large quantity of dry thermal film from an alternative film supplier (the “OtherFilm Supplier”), and we are using the technology we purchased from the Former Primary Film Supplier tomanufacture dry thermal film internally.
As a result of the bankruptcy filing by the Former Primary Film Supplier, we recorded a $1.2 million chargein our third quarter of fiscal year 2002 due to the ultimate uncertainty of realization of value on certain assets,particularly certain prepaid purchase benefits and other benefits under the amended supply contract with theFormer Primary Film Supplier. We do not believe there has been any impairment in the value of the intellectualproperty we acquired from the Former Primary Film Supplier because we are utilizing such property tomanufacture dry thermal film.
On December 10, 2002, we received a notice of claim, in connection with the Former Primary FilmSupplier’s bankruptcy, for alleged preferential payments made by the Former Primary Film Supplier to us in the
3

period before the bankruptcy proceeding in the approximate amount of $259,000. On July 7, 2004, an amendedclaim was filed against us and the amount of the alleged preferential payments made by the Former Primary FilmSupplier was increased to approximately $895,000. We intend to vigorously defend against such claim under theoverall circumstances of our relationship with the Former Primary Film Supplier. At present we do not knowwhether we will make any claims against the Former Primary Film Supplier and we are unable to predict whetherany additional claims will be made against us in connection with the Former Primary Film Supplier’s bankruptcyproceeding as to any aspect of our relationship with the Former Primary Film Supplier. We are unable at thistime to predict the outcome and effects of this situation. We had, nevertheless, made a provision for the initialclaim made by the Former Primary Film Supplier and we believe that such provision is adequate at this time,although we are unable to make such predictions with any certainty.
Acquisitions
Graphtec’s Thermal Printhead Production Assets
On September 30, 2004, we acquired the thermal printhead production assets of Graphtec Corporation, acompany with headquarters in Yokohama, Japan (“Graphtec”) for approximately $1.8 million which was paid incash on October 1, 2004. Prior to that date, Graphtec was the only supplier of wide format thermal printheadsthat we use to manufacture our wide format thermal imaging equipment. We expect to manufacture printheads inJapan during the first fiscal quarter of 2005 using the assets we acquired from Graphtec and then relocate theassets to Houston, Texas. We are unable to determine at this time the associated cost of relocating the assets. Ifprinthead sales exceed certain established levels we may owe a royalty to Graphtec annually. We are unable todetermine at this date the amount of those royalties and if those royalties will be payable.
OYO-GEO Impulse International, LLC
Effective November 8, 2001, we increased our equity ownership from 44% to 85% in OYO-GEO ImpulseInternational, LLC (“OYO-GEO Impulse”), a Russian joint venture we formed in 1990 with Geophyspribor UfaProduction Association (“Geophyspribor”), Bank Vostock and Chori Co., Ltd (“Chori”). Since this transaction,the financial results of OYO-GEO Impulse have been consolidated with those of OYO Geospace. At that time,Geophyspribor and Chori continued as minority shareholders of OYO-GEO Impulse.
In exchange for the additional equity ownership, we forgave a debt of $1.2 million owed to us by OYO-GEOImpulse. This debt and a related equity investment had been written-off in 1994 due to prior concerns regardingrealization of those assets and, therefore, such debt and investment had no carrying value in our financialstatements. In connection with this acquisition in fiscal year 2002, we recorded an extraordinary gain of $686,000,net of income taxes of $85,000. This extraordinary gain represents the negative goodwill that resulted from theacquisition of the additional equity interest of OYO-GEO Impulse.
On September 12, 2003, we purchased for $164,000 an additional 12% ownership interest in OYO-GEOImpulse from Geophyspribor, thereby increasing our ownership interest to 97%. Chori continues as a 3%minority shareholder of OYO-GEO Impulse.
Based in Ufa, Bashkortostan, Russia, OYO-GEO Impulse has been in operation since 1990, manufacturinggeophone sensors for the Russian seismic marketplace. At September 30, 2004, OYO-GEO Impulse operated in a120,000 square foot facility in Ufa and employed approximately 374 people. Our seismic equipmentmanufacturing subsidiary in Houston is managing the expansion of OYO-GEO Impulse’s operations to produceand sell international-standard sensors and additional seismic-related products.
Products and Product Development
Seismic Products
Our seismic product lines currently consist of high definition reservoir characterization products andservices, geophones and hydrophones, including multi-component geophones and hydrophones, seismic leader
4

wire, geophone and hydrophone string connectors, seismic telemetry cable, marine seismic cable retrievaldevices and small data acquisition systems targeted at niche markets. Our seismic products are compatible withmost major seismic data acquisition systems currently in use. We believe that our seismic products are among themost technologically advanced instruments and equipment available for seismic data acquisition.
Our products used in marine seismic data acquisition include our patented marine seismic streamer retrievaldevices (“SRDs”). Occasionally, streamers are severed and become disconnected from the vessel as a result ofinclement weather, vessel traffic or human or technological error. Our SRDs, which are attached to the streamers,contain air bags that are designed to inflate automatically at a given depth, bringing the severed streamer to thesurface. These SRDs save the seismic contractor significant time and money compared to the alternative oflosing and replacing the streamer. We also produce seismic streamer steering devises, or “birds”, which arefinlike devices that attach to the streamer and help maintain it at a certain desired depth as it is towed through thewater.
Other product developments include the HDSeis™ product line and a suite of borehole and reservoircharacterization products and services. Our HDSeis™ System is a high definition seismic data acquisition systemwith flexible architecture that allows it to be configured as a borehole seismic system or as a subsurface systemfor both land and marine reservoir-monitoring projects.
The scalable architecture of the HDSeis™ System enables custom designed system configuration forapplications ranging from low-channel engineering and environmental-scale surveys requiring a minimumnumber of recording channels to high-channel surveys required to efficiently conduct permanent deepwaterreservoir imaging and monitoring. Modular architecture allows virtually unlimited channel expansion with globalpositioning systems and fiber-optic synchronization. In addition, multi-system synchronization features make theHDSeis™ System well suited for multi-well or multi-site acquisition, simultaneous surface and downholeacquisition and continuous reservoir monitoring projects.
Reservoir characterization requires special purpose or custom designed systems in which portabilitybecomes less critical and functional reliability assumes greater importance. This reliability factor helps assuresuccessful operations in inaccessible locations over a considerable period of time. Additionally, reservoirslocated in deepwater or hostile environments require special instrumentation and new techniques for life-of-fieldperformance.
Reservoir characterization also requires high-bandwidth, high-resolution seismic data for engineeringproject planning and management. Seismic data acquired at reservoir level, through seismic sources and acousticreceivers within a wellbore, has a bandwidth of several kilohertz, which is capable of yielding the requisite high-resolution images.
We believe our HDSeis™ System and tools, designed for cost-effective deployment and lifetimeperformance, will make borehole and seabed seismic acquisition a cost-effective, reliable process for thechallenges of reservoir characterization and monitoring.
Other recent 3-D seismic product developments include an omni-directional geophone for use in reservoirmonitoring; a compact marine three-component or four-component gimbaled sensor and special-purposeconnectors, connector arrays and cases.
In order to leverage our cable manufacturing facilities and capabilities, we are designing and selling cableproducts to the offshore oil and gas and offshore construction industries. The production of marine cablesrequires specialized design capabilities and manufacturing equipment, which we also utilize for deepwaterreservoir characterization products.
We are also working to diversify our existing seismic product lines and adapt our manufacturing capabilitiesfor uses in industries other than the seismic industry.
5

We face certain risks associated with our foreign operations. For a discussion of these risks, refer to Item 7,under the heading “Forward Looking Statements and Risks” under the subheading “Our Foreign Subsidiaries andForeign Marketing Efforts Face Additional Risks and Difficulties” contained in this Report on Form 10-K.
Commercial Graphics Products
We have adapted our thermal imaging technology, which we originally developed for the seismic industry,for commercial applications in the screen print, point of sale, signage and textile market sectors. Our thermalimaging equipment is capable of producing data images ranging in size from 12 to 54 inches wide, withresolution ranging from 400 to 1,200 dpi (dots per inch). We believe that our wide format thermal printers, whichuse dry thermal film technology, are a cost-effective alternative to conventional equipment and imagingsolutions.
On September 30, 2004, we acquired the thermal printhead production assets of Graphtec for approximately$1.8 million which was paid in cash on October 1, 2004. Prior to that date, Graphtec was the only supplier ofwide format thermal printheads that we use to manufacture our wide format thermal imager equipment. Weexpect to manufacture printheads in Japan during the first fiscal quarter of 2005 using the assets we acquiredfrom Graphtec and then relocate those assets to Houston, Texas.
We expect to continue our research and development activities to expand the markets for our thermalimaging products and increase the image clarity of our thermal imaging equipment and dry thermal film.
Competition
We believe that we are one of the world’s largest manufacturers and distributors of seismic related products.The principal competitors in our seismic business segment for geophones, hydrophones, geophone stringconnectors, leader wire and telemetry cable are Input/Output, Sercel and Steward Cable. Furthermore, entities inChina manufacture an older model geophone having the same design and specifications as our GS-20 DXgeophone. In addition to these competitors, certain manufacturers of marine streamers also manufacturehydrophones for their own use.
We believe that the principal competitive factors in the seismic instruments and equipment market aretechnological superiority, product durability and reliability and customer service and support. Since price andproduct delivery are also important considerations for customers, pricing terms may become more significantduring an industry downturn. These factors can be offset by a customer’s preference for standardization. Ingeneral, particular customers prefer to standardize geophones and hydrophones, particularly if they are used by asingle seismic crew or multiple crews that can support each other. Customer directed standardization makes itmore difficult for a geophone or hydrophone manufacturer to gain market share from other such manufacturers.
As mentioned above, a key competitive factor for seismic instruments and equipment is durability underharsh field conditions. Instruments and equipment must not only meet rigorous technical specifications regardingsignal integrity and sensitivity, but must also be extremely rugged and durable to withstand the rigors of fielduse, often in harsh environments.
With respect to our marine seismic data products, we are not aware of any competing companies thatmanufacture a product functionally similar to our patented seismic streamer retrieval device. Our primarycompetitor in the manufacture of our streamer depth positioning device (“Birds”) is Input/Output.
Our primary competitors for our deepwater reservoir characterization systems may be some traditionalseismic equipment manufacturers such as Western/Geco (Schlumberger), Input/Output, Sercel, and some newlyformed alliances involving these companies.
Our primary competitors for downhole high definition seismic data acquisition systems are Avalon andCGG.
6

We believe that the primary competitors in our commercial graphics and plotter business segments areRicoh, Xante, Gerber Scientific, iSys Group, Cypress Tech. and Atlantek, as well as manufacturers of alternativetechnologies such as inkjet printing. Also, as we advance the resolution capabilities of direct thermal technology,we expose ourselves to additional competition in the more traditional wet-film imagesetting marketplace. A keycompetitive factor in this market is producing equipment that is technologically advanced yet cost effective.
Suppliers
On September 30, 2004, we acquired the thermal printhead production assets of Graphtec for $1.8 millionwhich was paid in cash on October 1, 2004. Prior to that date, Graphtec was the only supplier of wide formatthermal printheads that we use to manufacture our wide format thermal imaging equipment. We nowmanufacture printheads internally using assets acquired from Graphtec.
Our Former Primary Film Supplier had been the primary manufacturer of the dry thermal film used by ourcustomers in the thermal imaging equipment we sell. On July 3, 2002, the Former Primary Film Supplier filed aChapter 11 reorganization petition in Federal Bankruptcy Court for the Western District of New York. As a resultof the bankruptcy filing, we began to produce dry thermal film internally using the intellectual propertypurchased from the Former Primary Film Supplier. We also purchase a substantial quantity of film from ourOther Film Supplier.
In fiscal year 2004 we did not and currently do not experience any difficulties in obtaining raw materialsfrom our suppliers for the production of seismic products or thermal imaging equipment products.
Product Manufacturing
Our manufacturing and product assembly operations consist of machining or molding the necessarycomponent parts, configuring these parts along with components received from various vendors and assembling afinal product. We manufacture seismic equipment to the specifications of our customers. For example, we canarmor cables for applications such as deep water uses. We assemble geophone strings and seismic telemetrycables based on a number of customer choices such as length, gauge, tolerance and color of molded parts. Withregard to dry thermal film, we mix and react various chemicals to formulate a reactive layer that is then coatedonto a clear polyester film. The film is then coated with a protective topcoat that produces the final product.Upon completion, we test our final products to the functional and in the case of seismic equipment,environmental extremes of product specifications and inspect the products for quality assurance. We normallymanufacture and ship our products based on customer orders and, therefore, typically do not maintain significantinventories of finished goods.
Markets and Customers
Our principal seismic customers are contractors and major independent and government-owned oil and gascompanies that either operate their own seismic crews or specify seismic instrument and equipment preferencesto contractors. For our deepwater reservoir characterization products, our customers are generally largeinternational oil and gas companies which operate long-term offshore oil and gas producing properties. Ourcommercial graphics customers primarily consist of direct users of our equipment as well as specialized resellersthat focus on the newsprint, silkscreen and corrugated box printing industries. For a further discussion of keycustomers see Note 17 to the Consolidated Financial Statements contained in this Report on Form 10-K.
Intellectual Property
We seek to protect our intellectual property by means of patents, trademarks, trade secrets and othermeasures. Although we do not consider any single patent essential to our success, we consider our patentregarding our marine seismic cable retrieval devices to be of particular value to us. This patent is scheduled toexpire in 2012. We have dry thermal film technology patents that expire at varying dates beginning in 2013.
7
Research and Development
We expect to incur significant future research and development expenditures aimed at the development ofadditional seismic data acquisition products used for high definition reservoir characterization in both land andmarine environments and thermal imaging technologies. We have incurred research and development expensesof $4.8 million, $5.2 million and $5.3 million during the fiscal years ended September 30, 2004, 2003 and 2002,respectively. For a summary of our research and development expenditures over the past five years, see Item 6,“Selected Consolidated Financial Data”, contained in Part II to this Report on Form 10-K.
Employees
As of September 30, 2004 we employed approximately 748 people on a full-time basis, of whichapproximately 329 were employed in the United States and approximately 374 in Russia. We have neverexperienced a work stoppage and consider our relationship with our employees to be satisfactory. Our employeesare not unionized.
Financial Information by Geographic Area
For a discussion of financial information by segment and geographic area, see Note 17 to the ConsolidatedFinancial Statements contained in this Report on Form 10-K.
Item 2. Properties
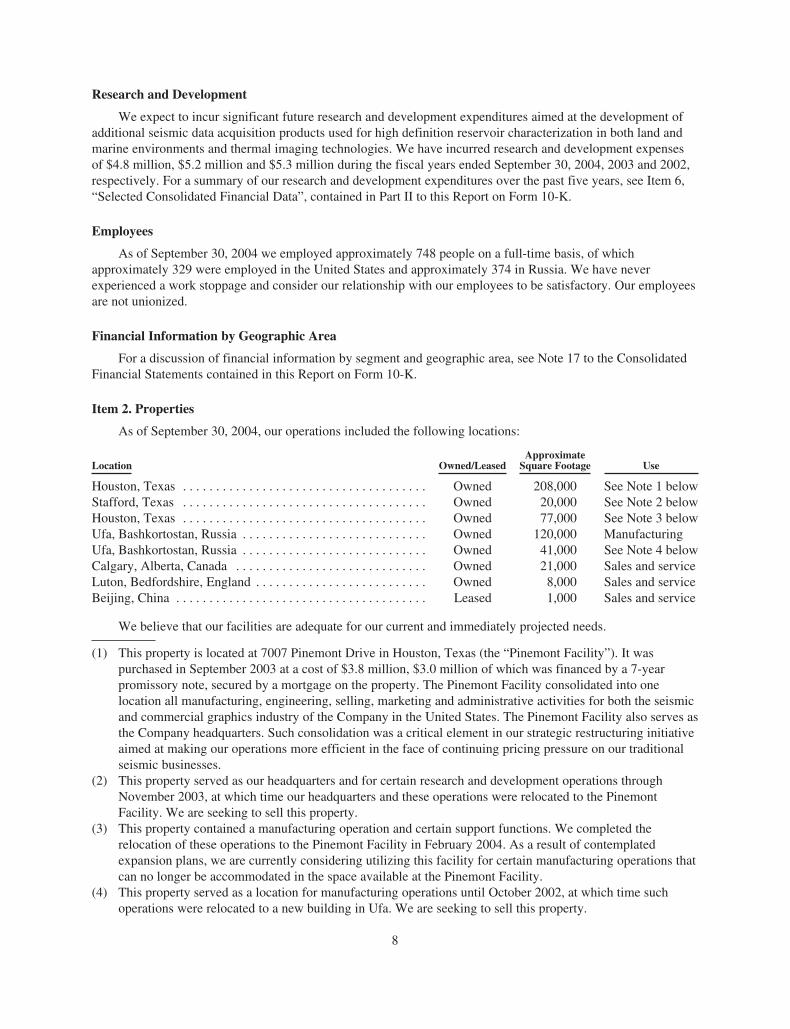
As of September 30, 2004, our operations included the following locations:
Location Owned/LeasedApproximate
Square Footage Use
Houston, Texas . . . . . . . . . . . . . . . . . . . . . . . . . . . . . . . . . . . . . Owned 208,000 See Note 1 belowStafford, Texas . . . . . . . . . . . . . . . . . . . . . . . . . . . . . . . . . . . . . Owned 20,000 See Note 2 belowHouston, Texas . . . . . . . . . . . . . . . . . . . . . . . . . . . . . . . . . . . . . Owned 77,000 See Note 3 belowUfa, Bashkortostan, Russia . . . . . . . . . . . . . . . . . . . . . . . . . . . . Owned 120,000 ManufacturingUfa, Bashkortostan, Russia . . . . . . . . . . . . . . . . . . . . . . . . . . . . Owned 41,000 See Note 4 belowCalgary, Alberta, Canada . . . . . . . . . . . . . . . . . . . . . . . . . . . . . Owned 21,000 Sales and serviceLuton, Bedfordshire, England . . . . . . . . . . . . . . . . . . . . . . . . . . Owned 8,000 Sales and serviceBeijing, China . . . . . . . . . . . . . . . . . . . . . . . . . . . . . . . . . . . . . . Leased 1,000 Sales and service
We believe that our facilities are adequate for our current and immediately projected needs.
(1) This property is located at 7007 Pinemont Drive in Houston, Texas (the “Pinemont Facility”). It waspurchased in September 2003 at a cost of $3.8 million, $3.0 million of which was financed by a 7-yearpromissory note, secured by a mortgage on the property. The Pinemont Facility consolidated into onelocation all manufacturing, engineering, selling, marketing and administrative activities for both the seismicand commercial graphics industry of the Company in the United States. The Pinemont Facility also serves asthe Company headquarters. Such consolidation was a critical element in our strategic restructuring initiativeaimed at making our operations more efficient in the face of continuing pricing pressure on our traditionalseismic businesses.
(2) This property served as our headquarters and for certain research and development operations throughNovember 2003, at which time our headquarters and these operations were relocated to the PinemontFacility. We are seeking to sell this property.
(3) This property contained a manufacturing operation and certain support functions. We completed therelocation of these operations to the Pinemont Facility in February 2004. As a result of contemplatedexpansion plans, we are currently considering utilizing this facility for certain manufacturing operations thatcan no longer be accommodated in the space available at the Pinemont Facility.
(4) This property served as a location for manufacturing operations until October 2002, at which time suchoperations were relocated to a new building in Ufa. We are seeking to sell this property.
8

Item 3. Legal Proceedings
From time to time we are a party to what we believe is routine litigation and proceedings that may beconsidered as part of the ordinary course of our business. We are not aware of any current or pending litigation orproceedings that could have a material adverse effect on our results of operations, cash flows or financialcondition, although we continue to monitor developments in the bankruptcy proceeding by our Former PrimaryFilm Supplier and its existing claim against us as is described in the section entitled “Business—CompanyOverview—Commercial Graphics Industry” contained in this Report on Form 10-K.
Item 4. Submission of Matters to Vote of Security Holders
None.
9

PART II
Item 5. Market for Registrant’s Common Equity and Related Stockholder Matters
Our common stock is traded on the NASDAQ National Market under the symbol “OYOG”. On November29, 2004, there were approximately 48 holders of record of our common stock, and the closing price per share onsuch date was $16.24 as quoted by The NASDAQ Stock Market, Inc.
The following table presents the range of high and low bid quotations for our common stock during the twofiscal years ended September 30, 2004 and September 30, 2003, as reported by The NASDAQ Stock Market, Inc.
Low High
Year Ended September 30, 2004:Fourth Quarter . . . . . . . . . . . . . . . . . . . . . . . . . . . . . . . . . . . . . . . . . . . . . . . . . . . . . . . . . . . . . . . . $14.67 $18.99Third Quarter . . . . . . . . . . . . . . . . . . . . . . . . . . . . . . . . . . . . . . . . . . . . . . . . . . . . . . . . . . . . . . . . . 16.66 19.15Second Quarter . . . . . . . . . . . . . . . . . . . . . . . . . . . . . . . . . . . . . . . . . . . . . . . . . . . . . . . . . . . . . . . 16.06 17.88First Quarter . . . . . . . . . . . . . . . . . . . . . . . . . . . . . . . . . . . . . . . . . . . . . . . . . . . . . . . . . . . . . . . . . 11.72 16.09
Year Ended September 30, 2003:Fourth Quarter . . . . . . . . . . . . . . . . . . . . . . . . . . . . . . . . . . . . . . . . . . . . . . . . . . . . . . . . . . . . . . . . $10.06 $13.75Third Quarter . . . . . . . . . . . . . . . . . . . . . . . . . . . . . . . . . . . . . . . . . . . . . . . . . . . . . . . . . . . . . . . . . 9.50 14.00Second Quarter . . . . . . . . . . . . . . . . . . . . . . . . . . . . . . . . . . . . . . . . . . . . . . . . . . . . . . . . . . . . . . . 6.72 9.50First Quarter . . . . . . . . . . . . . . . . . . . . . . . . . . . . . . . . . . . . . . . . . . . . . . . . . . . . . . . . . . . . . . . . . 7.60 12.95
Historically, we have not paid dividends, and we do not intend to pay cash dividends on our common stockin the foreseeable future. We presently intend to retain our earnings for use in our business, with any futuredecision to pay cash dividends dependent upon our growth, profitability, financial condition and other factors theBoard of Directors may deem relevant. Our existing credit agreement also has covenants which materially limitour ability to pay dividends. For a more complete discussion of our credit agreement, see the section entitled“Management’s Discussion and Analysis of Financial Condition and Results of Operation—Liquidity andCapital Resources” contained in this Report on Form 10-K.
We did not sell any securities within the past three years that were not registered under the Securities Act of1933.
The following equity plan information is provided as of September 30, 2004:
Equity Compensation Plan Information
Plan Category
Number of Securities to beIssued upon Exercise ofOutstanding Options,Warrants and Rights
(a)
Weighted-average ExercisePrice of Outstanding Options,
Warrants and Rights(b)
Number of SecuritiesRemaining Available forFuture Issuances Under
Equity Compensation Plans(Excluding Securities
Reflected in Column (a))(c)
Equity CompensationPlans Approved bySecurity Holders . . . . . . . . 686,660 $12.97 55,709
Equity CompensationPlans Not Approved bySecurity Holders . . . . . . . . 17,100 13.45 17,400
10

Item 6. Selected Consolidated Financial Data
The following table sets forth certain selected historical financial data on a consolidated basis. The selectedconsolidated financial data was derived from our consolidated financial statements. The selected consolidatedfinancial data should be read in conjunction with our consolidated financial statements appearing elsewhere inthis Form 10-K. When reviewing the table below, please also note the acquisitions and accountingpronouncements described in the section entitled “Management’s Discussion and Analysis of FinancialCondition and Results of Operations” contained in this Report on Form 10-K.
Year Ended September 30,
2004 2003 2002 2001 2000
(in thousands, except share and per share amounts)Statement of Operations Data:Sales . . . . . . . . . . . . . . . . . . . . . . . . . . . . . . . . . . . . . . . . . $ 63,538 $ 50,854 $ 65,049 $ 63,618 $ 53,474Cost of sales . . . . . . . . . . . . . . . . . . . . . . . . . . . . . . . . . . . 40,787 38,337 46,484 42,957 39,042
Gross profit . . . . . . . . . . . . . . . . . . . . . . . . . . . . . . . . . . . 22,751 12,517 18,565 20,661 14,432Operating expenses:
Selling, general and administrative . . . . . . . . . . . . . 12,086 11,273 11,538 12,528 10,090Research and development . . . . . . . . . . . . . . . . . . . 4,794 5,226 5,347 6,277 6,146Impairment of assets . . . . . . . . . . . . . . . . . . . . . . . . — — 1,246 — —
Total operating expenses . . . . . . . . . . . . . . . . . . . . . . . . . 16,880 16,499 18,131 18,805 16,236
Income (loss) from operations . . . . . . . . . . . . . . . . . . . . . 5,871 (3,982) 434 1,856 (1,804)Other income (expense), net . . . . . . . . . . . . . . . . . . . . . . 61 69 (770) (226) 41
Income (loss) before income taxes, minority interest andextraordinary gain . . . . . . . . . . . . . . . . . . . . . . . . . . . . 5,932 (3,913) (336) 1,630 (1,763)
Income tax expense (benefit) . . . . . . . . . . . . . . . . . . . . . (47) (1,399) (857) 292 (572)
Income (loss) before minority interest, andextraordinary gain . . . . . . . . . . . . . . . . . . . . . . . . . . . . 5,979 (2,514) 521 1,338 (1,191)
Minority interest . . . . . . . . . . . . . . . . . . . . . . . . . . . . . . . (26) (19) (88) — —
Income (loss) before extraordinary gain . . . . . . . . . . . . . 5,953 (2,533) 433 1,338 (1,191)Extraordinary gain, net of tax of $85 . . . . . . . . . . . . . . . — — 686 — —
Net income (loss) . . . . . . . . . . . . . . . . . . . . . . . . . . . . . . . $ 5,953 $ (2,533) $ 1,119 $ 1,338 $ (1,191)
Basic earnings (loss) per share:Income (loss) before extraordinary gain . . . . . . . . . . . . . $ 1.07 $ (0.46) $ 0.08 $ 0.24 $ (0.22)Extraordinary gain . . . . . . . . . . . . . . . . . . . . . . . . . . . . . . — — 0.12 — —
Net income (loss) per share . . . . . . . . . . . . . . . . . . . . . . . $ 1.07 $ (0.46) $ 0.20 $ 0.24 $ (0.22)
Diluted earnings (loss) per share:Income (loss) before extraordinary gain . . . . . . . . . . . . . $ 1.05 $ (0.46) $ 0.08 $ 0.24 $ (0.22)Extraordinary gain . . . . . . . . . . . . . . . . . . . . . . . . . . . . . . — — 0.12 — —
Net income (loss) per share . . . . . . . . . . . . . . . . . . . . . . . $ 1.05 $ (0.46) $ 0.20 $ 0.24 $ (0.22)
Weighted average shares outstanding—Basic . . . . . . . . 5,573,611 5,550,216 5,535,979 5,489,251 5,431,901Weighted average share outstanding—Diluted . . . . . . . . 5,684,853 5,550,216 5,547,774 5,598,597 5,431,901
Other Financial Data:Depreciation, amortization and stock-based
compensation . . . . . . . . . . . . . . . . . . . . . . . . . . . . . . . . $ 4,966 $ 4,724 $ 4,852 $ 4,444 $ 4,014Capital expenditures . . . . . . . . . . . . . . . . . . . . . . . . . . . . 2,506 6,045 4,729 4,909 6,004
As of September 30,
2004 2003 2002 2001 2000
(in thousands)Balance Sheet Data:Working capital . . . . . . . . . . . . . . . . . . . . . . . . . . . . . . . . $ 32,789 $ 24,937 $ 28,130 $ 27,891 $ 28,505Total assets . . . . . . . . . . . . . . . . . . . . . . . . . . . . . . . . . . . 77,794 71,435 68,126 73,000 65,108Short-term debt . . . . . . . . . . . . . . . . . . . . . . . . . . . . . . . . 1,029 5,889 714 1,033 198Long-term debt . . . . . . . . . . . . . . . . . . . . . . . . . . . . . . . . 5,805 6,232 3,544 3,772 3,984Stockholders’ equity . . . . . . . . . . . . . . . . . . . . . . . . . . . . 59,200 52,471 54,129 52,791 50,709
11

Item 7. Management’s Discussion and Analysis of Financial Condition and Results of Operations
The following is management’s discussion and analysis of the major elements of our consolidated financialstatements. You should read this discussion and analysis together with our consolidated financial statements andaccompanying notes and other detailed information appearing elsewhere in this Form 10-K. The discussion ofour financial condition and results of operations includes various forward-looking statements about our markets,the demand for our products and services and our future plans and results. These statements are based onassumptions that we consider to be reasonable, but that could prove to be incorrect. For more informationregarding our assumptions, you should refer to the section entitled “Forward-Looking Statements and Risks”contained in this Item 7 on this Report on Form 10-K.
Industry Overview
We design and manufacture instruments and equipment used in the acquisition and processing of seismicdata. We have been in the seismic instrument and equipment business since 1980, marketing our productsprimarily to the oil and gas industry worldwide. We also design and manufacture thermal imaging equipment anddistribute dry thermal film products to the commercial graphics industry. We have been serving the commercialgraphics industry since 1995.
Seismic
Geoscientists use seismic data to map potential or existing oil and gas bearing formations and the geologicstructures that surround them. Seismic data is used primarily in connection with the exploration, developmentand production of oil and gas.
Seismic data acquisition is conducted on land by combining a seismic energy source and a data recordingsystem. The energy source imparts seismic waves into the earth, reflections of which are received and measuredby geophones and hydrophones. Electrical signals generated by the geophones and hydrophones aresimultaneously transmitted through leader wire, geophone and hydrophone string connectors and telemetric cableto data collection units, which store information for processing and analysis. Seismic thermal imaging outputdevices are used in the field or office to create a graphic representation of the seismic data after it has beenacquired.
Marine seismic data acquisition is conducted primarily by large ocean-going vessels that tow long seismiccables known as “streamers”. Usually, the energy source in marine seismic data acquisition is an airgun, and thereflected seismic waves are received and measured by hydrophones, which are an integral part of the streamers.The streamers simultaneously transmit the electrical impulses back to the vessel via telemetric cable includedwithin the streamers, and the seismic data is recorded and processed in much the same manner as it is for seismicdata collection on land.
Our high definition reservoir characterization products are designed and configured for customizedmonitoring applications for producing oil and gas fields. Utilizing these systems, producers can better identifyand enhance the recovery of oil and gas deposits over the life of the reservoir. Reservoir characterization andmanagement programs, in which the reservoir is carefully imaged and monitored throughout its economic life byseismic instruments and equipment, are now seen as vital tools for improving production recovery rates. Seismicsurveys repeated over selected time intervals show dynamic changes within the reservoir and can be used tomonitor the effects of production. Demand for our products depends primarily on the level of worldwide oil andgas exploration activity. That activity, in turn, depends primarily on prevailing oil and gas prices and availabilityof seismic data.
We expect to incur significant future research and development expenditures aimed at the development ofadditional seismic acquisition products and services used for high definition reservoir characterization for use inboth land and marine environments.
12

While orders for our products can vary substantially from quarter to quarter, reservoir characterizationprojects, especially large-scale deepwater projects, require the use of more equipment over a longer period oftime than is required by conventional surface seismic systems. Revenue recognition in accordance with generallyaccepted accounting principles for these large-scale projects has the potential to result in substantial fluctuationsin our quarterly performance. These variations may impact our operating results and cash flow, manufacturingcapability and expense levels in any given quarter. Furthermore, because of the scale and nature of reservoircharacterization projects, there may be delays in their implementation and uncertainties about their final course.
During our fiscal year ended September 30, 2002, we delivered a reservoir characterization and monitoringsystem to a major oil company for installation in one of its fields in the North Sea. In accordance with the termsof the contract, we recognized $15.8 million of revenues in our fiscal year ended September 30, 2002 and $2.5million of revenues in our fiscal year ended September 30, 2003. Due to the system’s successful performancethrough December 31, 2003, we earned an additional $3.6 million performance bonus, which we recognized asrevenue in fiscal year 2004. Our product warranty obligation extends to 2006 for certain components of thesystem.
We believe that our reservoir characterization systems, including the system referenced above, are importantnew technologies in our industry and our ability to develop and market them will be a key determinant of oursuccess in the future.
Commercial Graphics
We entered into the commercial graphics business in 1995 as we leveraged our thermal imaging producttechnology, originally designed for seismic data processing applications, into new markets. With minor productmodifications, we were successful in adapting these products for use in the commercial graphics industry.
Our commercial graphics business segment manufactures and sells thermal imaging equipment and drythermal film primarily to the screen print, point of sale, signage and textile market sectors. Our thermal imagingequipment is capable of producing data images ranging in size from 12 to 54 inches wide, with resolution rangingfrom 400 to 1,200 dpi. This business segment has some sales to customers in the seismic industry.
On September 30, 2004, we acquired the thermal printhead production assets of Graphtec for approximately$1.8 million which was paid in cash on October 1, 2004. Prior to that date, Graphtec was the only supplier ofwide format thermal printheads that we use to manufacture our wide format thermal imager equipment. Weexpect to manufacture printheads in Japan using the assets we acquired from Graphtec during the first fiscalquarter of 2005 and then relocate the assets to Houston, Texas.
Results of Operations
We report and evaluate financial information for two segments: Seismic and Commercial Graphics. Certainsummary financial data for our business segments which was previously presented in prior periods has now beenreclassified to conform to the current year presentation.
13

Summary financial data by business segment follows (in thousands):
Years Ended
September 30,2004
September 30,2003
September 30,2002
SeismicNet sales . . . . . . . . . . . . . . . . . . . . . . . . . . . . . . . . . . . . . . . . . . . . $50,651 $37,619 $51,800Operating income . . . . . . . . . . . . . . . . . . . . . . . . . . . . . . . . . . . . . 10,860 780 6,395
Commercial GraphicsNet sales . . . . . . . . . . . . . . . . . . . . . . . . . . . . . . . . . . . . . . . . . . . . 12,991 13,333 13,490Operating income . . . . . . . . . . . . . . . . . . . . . . . . . . . . . . . . . . . . . 1,118 1,130 477
CorporateOperating loss . . . . . . . . . . . . . . . . . . . . . . . . . . . . . . . . . . . . . . . . (6,107) (5,892) (6,296)
EliminationsNet sales . . . . . . . . . . . . . . . . . . . . . . . . . . . . . . . . . . . . . . . . . . . . (104) (98) (241)Operating loss . . . . . . . . . . . . . . . . . . . . . . . . . . . . . . . . . . . . . . . . — — (142)
Consolidated TotalsNet sales . . . . . . . . . . . . . . . . . . . . . . . . . . . . . . . . . . . . . . . . . . . . 63,538 50,854 65,049Operating income (loss) . . . . . . . . . . . . . . . . . . . . . . . . . . . . . . . . 5,871 (3,982) 434
Overview
As discussed under Item 2, “Properties”, in this Part I, in September 2003, we purchased the PinemontFacility, a 208,000 square foot facility housing our headquarters and all U.S. manufacturing, engineering, selling,marketing, and administrative activities. The purchase price for the Pinemont Facility was $3.8 million, of which$3.0 million was financed by a 7-year promissory note and secured by a mortgage on the property. During fiscalyear 2004, we incurred $1.4 million of capitalized costs to remodel the Pinemont Facility and incurred charges of$0.5 million to relocate our operations into the Pinemont Facility. We sold one of our former U.S. facilities inDecember 2003, and allowed a lease to expire on December 31, 2003 on another facility. We are seeking to sell afacility in Stafford, Texas having a carrying value of $1.1 million. We expect to sell this property during fiscalyear 2005 and use those proceeds to pay the debt related to this facility. We own another vacant facility locatedin Houston, Texas having a net book value of $4.7 million. As a result of our contemplated expansion plans, weare currently considering utilizing this vacant facility for certain manufacturing operations that can no longer beaccommodated in the space available at the Pinemont Facility. We expect the end result of this move andrestructuring to be the elimination of substantial manufacturing and operating expenses in future periods, whichwe expect will offset the one-time costs of the move and justify the capital expenditures made with respect to thePinemont Facility.
Fiscal Year 2004 Compared to Fiscal Year 2003
Consolidated net sales for the year ended September 30, 2004 increased $12.7 million, or 24.9%, from fiscalyear 2003. The increase in net sales resulted from our deep water reservoir characterization and boreholereservoir products showing strong increases in sales, both from pre-existing sales contracts and from newcustomers, as a result of the continued growth and acceptance of these new products. In addition, the increasedworldwide demand for our traditional seismic exploration products increased as a result of higher oil and gascommodity prices.
Consolidated gross profits for the year ended September 30, 2004 increased by $10.2 million, or 81.8%,from fiscal year 2003. The higher gross profits in fiscal year 2004 are the result of increased seismic productsales, primarily from our deep water reservoir characterization and borehole reservoir imaging products. Thefiscal year 2004 gross profits include a $3.6 million performance bonus payment we received for the continuedsuccessful performance of a deepwater reservoir characterization system sold to a customer in fiscal year 2002.
14

Consolidated operating expenses for the year ended September 30, 2004 increased $0.4 million, or 2.3%,from fiscal year 2003. Such increase is the result of higher incentive compensation expenses in the amount of$0.5 million and facility relocation expenses of $0.5 million. These cost increases were partially offset by adecrease in operating expenses associated with our facilities consolidation and reorganization.
The United States statutory rate applicable to us for the period reported was 34.0%. The effective tax rate forthe year ended September 30, 2004 was (0.8)% compared to an effective tax rate of 35.8% in fiscal year 2003. Werealized several significant tax benefits in fiscal year 2004, including (i) tax credits and a special tax deductionallowed to U.S. export manufacturers totaling $0.9 million, (ii) the reversal of an $0.8 million deferred tax valuationallowance due to the realization of deferred tax assets, and (iii) a $0.4 million benefit resulting from the taxing ratesin certain foreign taxing jurisdictions being lower than the U.S. statutory tax rate. Recently announced changes inU.S. tax legislation are expected to result in the phasing out of the special deduction allowed to U.S. exportmanufacturers. Consequently, we expect our effective tax rate to increase in fiscal year 2005.
Fiscal Year 2003 Compared to Fiscal Year 2002.
Consolidated net sales for the year ended September 30, 2003 decreased $14.2 million, or 21.8%, fromfiscal year 2002. The decrease in net sales resulted primarily from the fiscal year 2002 containing a $15.8 millionsale of a reservoir characterization and monitoring system compared to $2.5 million of similar sales in fiscal year2003. In addition, sales of our marine-based seismic products also declined significantly during fiscal year 2003,which was partially offset by increased sales of our new offshore cable products and certain land-based seismicproducts.
Consolidated gross profits for the year ended September 30, 2003 decreased by $6.0 million, or 32.6%, fromfiscal year 2002. The lower gross profits in fiscal year 2003 were primarily the result of the sale of a reservoircharacterization and monitoring system in fiscal year 2002, which yielded a higher than average gross profitmargin. In addition, we recorded charges of $0.7 million in fiscal year 2003 to write-off defective dry thermalfilm inventories and obsolete borehole seismic assets.
Consolidated operating expenses for the year ended September 30, 2003 decreased $1.6 million, or 9.0%,from fiscal year 2002. The fiscal year 2002 consolidated operating expenses included a $1.2 million assetimpairment charge relating to the bankruptcy of the Former Primary Film Supplier. Excluding the assetimpairment charge, our operating expenses for fiscal year 2003 decreased $0.4 million, or 2.5%, from fiscal year2002, primarily due to the lower level of sales and actions taken to reduce operating costs in response to thenexisting market conditions.
Our United States statutory tax rate for fiscal year 2003 was 34.0%. Our effective tax rate for the year endedSeptember 30, 2003 was 35.8% compared to an effective tax rate of a benefit of 255.1% in fiscal year 2002. Thefiscal year 2002 benefit primarily resulted from the resolution of contingent tax matters and extraterritorialincome deductions. During the fiscal year 2003, we filed amended tax returns for certain prior year periods andalso completed our fiscal 2002 federal tax filing. Upon completion of such filings, we identified $0.8 million ofadditional tax benefits that in fiscal year 2003 were available for possible use in future periods. These additionalbenefits were related to foreign tax credits. Based upon the then current seismic industry environment and ourprojections of future taxable income, we reviewed our deferred tax assets and recorded a valuation allowance ofapproximately $0.8 million against the foreign tax credits. Including the valuation allowance, we had net deferredtax assets of $3.1 million at September 30, 2003.
Seismic
Our seismic product lines currently consist of high definition reservoir characterization products andservices, geophones and hydrophones, including multi-component geophones and hydrophones, seismic leaderwire, geophone string connectors, seismic telemetry cable, marine seismic cable retrieval devices and small dataacquisition systems targeted at niche markets.
15

Fiscal Year 2004 Compared to Fiscal Year 2003.
Net Sales
Sales of our seismic products for fiscal year 2004 increased $13.0 million, or 34.6%, from fiscal year 2003.The increase in sales principally resulted from a $7.8 million increase in sales of our deepwater reservoircharacterization and borehole reservoir imaging systems, including a $3.6 million performance bonus paymentresulting from the continued successful performance of a deepwater reservoir characterization system sold infiscal year 2002. Our traditional seismic product sales increased by $3.7 million primarily as a result of increasedsales by our Canadian and Russian subsidiaries. Other products having industrial applications generatedincreased revenues of $1.5 million during fiscal year 2004.
Operating Income
Operating income for fiscal year 2004 increased $10.1 million from fiscal year 2003. The increase isprimarily attributable to the increase in sales and gross profits of our deepwater reservoir characterizationsystems, including the $3.6 million performance bonus payment referred to above.
Fiscal Year 2003 Compared to Fiscal Year 2002.
Net Sales
Sales of our seismic products for fiscal year 2003 decreased $14.2 million, or 27.4%, from fiscal year 2002.The decrease in sales principally resulted from fiscal year 2002 containing a $15.8 million sale of a largedeepwater reservoir characterization and monitoring system compared to only $2.5 million of similar sales infiscal year 2003. In addition, sales of our marine-based seismic products also declined significantly during fiscalyear 2003, partially offset by increased sales of our new offshore cable products and certain land-based seismicproducts.
Operating Income (Loss)
Operating income (loss) for fiscal year 2003 decreased $5.6 million, or 87.8%, from fiscal year 2002. Thedecrease is primarily attributable to the gross profit associated with the $15.8 million sale of the deepwaterreservoir characterization and monitoring system in fiscal year 2002. In addition, the decline in sales and grossprofits from our higher profit margin marine-based seismic products unfavorably impacted our operating income(loss) in fiscal year 2003.
Commercial Graphics
Our commercial graphics business segment manufactures and sells thermal imaging equipment and drythermal film primarily to the screen print, point of sale, signage and textile market sectors. This business segmenthas some sales to customers in the seismic industry.
Fiscal Year 2004 Compared to Fiscal Year 2003.
Net Sales
Sales of our commercial graphics products for fiscal year 2004 decreased $0.3 million, or 2.6%, from fiscalyear 2003. The decrease in sales primarily resulted from a decline in equipment sales, partially offset byincreased sales of dry thermal film. Competing imaging technologies are the primary reason for the reduction ofequipment sales. The addition of new dry thermal film accounts, previously serviced by competitors, was asignificant factor for the increase in dry thermal film sales.
16

Operating Income
Our operating income for fiscal year 2004 decreased $12,000, or 1.1%, from fiscal year 2003. Thisreduction in operating income primarily resulted from a decline in sales, partially offset by a decline in operatingcosts due to our facilities consolidation and reorganization.
Fiscal Year 2003 Compared to Fiscal Year 2002.
Net Sales
Sales of our commercial graphics products for fiscal year 2003 decreased $0.2 million, or 1.2%, from fiscalyear 2002. The decrease in sales primarily resulted from a decline in sales of equipment and accessories, partiallyoffset by increased sales of dry thermal film.
Operating Income
Our operating income for fiscal year 2003 increased $0.7 million, or 136.9%, from fiscal year 2002. Fiscalyear 2002 included a $1.2 million asset impairment charge relating to the bankruptcy of the Former Primary FilmSupplier. Excluding the $1.2 million asset impairment charge in fiscal 2002, our operating income in fiscal 2003decreased $0.6 million. This decrease in operating income primarily resulted from increased manufacturing andoperating costs associated with the self-manufacture of dry thermal film, including the write-off of $0.6 millionof defective dry thermal film inventories, and increased research and development expenses associated with anewly introduced 1200 dpi thermal imaging device.
Acquisitions
Graphtec’s Thermal Printhead Production Assets
On September 30, 2004, we acquired the thermal printhead production assets of Graphtec for approximately$1.8 million which was paid in cash on October 1, 2004. Prior to that date, Graphtec was the only supplier ofwide format thermal printheads that we use to manufacture our wide format thermal imaging equipment. Weexpect to manufacture printheads in Japan during the first fiscal quarter of 2005 using the assets we acquiredfrom Graphtec and then relocate the assets to Houston, Texas. We are unable to determine at this time theassociated cost of relocating the assets. If printhead sales exceed certain established levels we may owe a royaltyto Graphtec annually. We are unable to determine at this date the amount of those royalties and if those royaltieswill be payable.
OYO-GEO Impulse International, LLC
Effective November 8, 2001, we increased our equity ownership from 44% to 85% in OYO-GEO Impulse, aRussian joint venture we formed in 1990 with Geophyspribor, Bank Vostock and Chori. Since this transaction,the financial results of OYO-GEO Impulse have been consolidated with those of OYO Geospace. At that time,Geophyspribor and Chori continued as minority shareholders of OYO-GEO Impulse.
In exchange for the additional equity ownership, we forgave a debt of $1.2 million owed to us by OYO-GEO Impulse. This debt and a related equity investment had been written-off in 1994 due to prior concernsregarding realization of those assets and, therefore, such debt and investment had no carrying value in ourfinancial statements. In connection with this acquisition in fiscal year 2002, we recorded an extraordinary gain of$686,000, net of income taxes of $85,000. This extraordinary gain represents the negative goodwill that resultedfrom the acquisition of the additional equity interest of OYO-GEO Impulse.
On September 12, 2003, we purchased for $164,000 an additional 12% ownership interest in OYO-GEOImpulse from Geophyspribor thereby increasing our ownership interest to 97%. Chori continues as a 3% minorityshareholder of OYO-GEO Impulse.
17

Based in Ufa, Bashkortostan, Russia, OYO-GEO Impulse has been in operation since 1990, manufacturinggeophone sensors for the Russian seismic marketplace. At September 30, 2004, OYO-GEO Impulse operated in a120,000 square foot facility in Ufa and employed approximately 374 people. Our seismic equipmentmanufacturing operation in Houston is managing the expansion of OYO-GEO Impulse’s operations to produceand sell international-standard sensors and additional seismic-related products.
Liquidity and Capital Resources
At September 30, 2004, we had $3.1 million in cash and cash equivalents. For the fiscal year endedSeptember 30, 2004, we generated approximately $8.4 million of cash from operating activities. The cashgenerated by operating activities was derived from a combination of our net income of $6.0 million and $5.0million of non-cash depreciation and amortization charges. This cash flow was offset by a $1.0 million non-cashdeferred tax benefit. Other operating cash flows included increases in accrued expenses in the amount of $1.9million primarily reflecting fiscal year 2004 accrued incentive compensation expenses. Income taxes payableincreased by $0.6 million, reflecting current taxes owed on the profits of our foreign subsidiaries. Such sources ofcash were offset by a $2.7 million increase in accounts and notes receivable resulting from increased sales, and a$2.5 million increase in inventories also as a result of increased sales.
For the year ended September 30, 2004, we used approximately $1.3 million of cash in investing activities.We received $1.2 million of cash proceeds from the sale of a surplus building and a vacant parcel of land. Thesale of these surplus properties is an integral part of our plan to consolidate facilities and reduce operating costs.We used $2.5 million of cash for capital expenditures of which approximately $1.4 million representedimprovements to our new Pinemont Facility. We estimate that our capital expenditures in fiscal year 2005 willrange from $5.0 to $6.0 million, which we expect to fund through operating cash flows and borrowings under ournew credit facility as needed.
For the year ended September 30, 2004, we used approximately $4.9 million of cash from financingactivities, primarily for the repayment of borrowings under our prior credit facility.
At September 30, 2003, we had $0.7 million in cash and cash equivalents. For the fiscal year endedSeptember 30, 2003, we used approximately $2.6 million of cash in operating activities principally resulting fromour net loss of $2.5 million, which included a $1.0 million deferred tax benefit. In addition, we increased ourinventories by $1.1 million principally for completed orders awaiting shipment and to build ample stocks of drythermal film. We increased our prepaid expenses by $1.5 million, primarily reflecting an outstanding insuranceclaim for goods damaged in transit to a customer. We decreased our accounts payable by $1.2 million as a resultof a decline in purchases of raw material inventories. Finally, we reduced our income taxes payable by $1.1million primarily related to the payment of foreign income taxes. Such uses of cash were offset by a $4.3 millioncharge for depreciation and amortization, a $2.4 million decrease in accounts and notes receivable due to adecline in sales, and a $1.0 million decrease in accrued expenses and other items.
For the year ended September 30, 2003, we used approximately $6.2 million of cash in investing activities,principally consisting of $6.0 million of capital expenditures and a $0.2 million investment in OYO-GEOImpulse. Included in the capital expenditures is a $3.8 million investment in the new Pinemont Facility inSeptember 2003.
For the year ended September 30, 2003, cash from financing activities increased approximately $7.9million, consisting of $4.9 million of borrowings under our prior credit facility and $3.0 million of borrowings topurchase the Pinemont Facility.
At September 30, 2002, we had $1.5 million in cash and cash equivalents. For the fiscal year endedSeptember 30, 2002, we generated approximately $6.5 million of cash in operating activities principally resultingfrom our net income of $1.1 million and adjustments of $6.0 million of net non-cash charges for depreciation,amortization and impairment charges. In addition, our inventories decreased $7.6 million principally as a result
18

of the sale of a reservoir characterization and monitoring system to a major oil company. Such cash flows wereoffset by a $6.7 million increase in other working capital accounts, including an increase in accounts receivableand decreases in accounts payable, accrued expenses and deferred revenue. Approximately $3.8 million of ouraccounts receivable at September 30, 2002 resulted from the sale of a reservoir characterization and monitoringsystem to a major oil company. Such receivable was collected in monthly installments through June 2003.Accounts payable decreased $1.0 million primarily due to decreased purchases of raw materials, resulting fromlower activity in our land-based seismic equipment business. The decrease in deferred revenues primarilyresulted from the recognition of $4.9 million of deferred revenues in connection with the sale of the reservoircharacterization and monitoring system.
For the fiscal year ended September 30, 2002, we used $5.5 million of cash and cash equivalents ininvesting activities, consisting of $4.7 million of capital expenditures, and a $2.3 million purchase of intellectualproperty from the Former Primary Film Supplier, offset by proceeds of $0.6 million from the sale of fixed assetsand $0.9 million of cash we consolidated into our balance sheet in connection with the acquisition of anadditional equity interest in OYO-GEO Impulse.
We used $0.5 million of cash for financing activities for the fiscal year ended September 30, 2002,reflecting net borrowings of $0.3 million under our prior credit facility, and $0.2 million for the repayment oflong-term debt.
On November 22, 2004 several of our subsidiaries entered into a new credit agreement (the “New CreditAgreement”) with a bank. Under the New Credit Agreement, our borrower subsidiaries can borrow up to $15.0million principally secured by their accounts and notes receivable and inventories. The New Credit Agreementexpires on November 21, 2007. Borrowings under the New Credit Agreement are subject to borrowing baserestrictions based on levels of eligible accounts receivable, notes receivable and inventories. The New CreditAgreement limits the incurrence of additional indebtedness, requires the maintenance of certain financialamounts, restricts our and the borrower subsidiaries’ ability to pay dividends and contains other covenantscustomary in agreements of this type. At December 6, 2004 there were borrowings of $1.9 million under the NewCredit Agreement, and additional borrowings of $13.1 million available. The interest rate for borrowings underthe New Credit Agreement is, at our option, a discounted prime rate or a LIBOR based rate.
Prior to entering into the New Credit Agreement, several of our subsidiaries were a party to a creditagreement (the “Previous Credit Agreement”) with a bank, and could borrow up to $10.0 million principallysecured by their accounts receivable and inventories. The Previous Credit Agreement, as amended, wasscheduled to expire on February 27, 2005, however this agreement was terminated on November 22, 2004 andreplaced by the New Credit Agreement. Borrowings under the Previous Credit Agreement were subject toborrowing base restrictions based on levels of eligible accounts receivable and inventories. The Previous CreditAgreement limited the incurrence of additional indebtedness, required the maintenance of certain financialamounts, restricted our and the borrower subsidiaries’ ability to pay dividends and contained other covenantscustomary in agreements of that type. As of September 30, 2004, there were borrowings of $0.6 millionoutstanding under the Previous Credit Agreement, and additional borrowings available under the Previous CreditAgreement of $9.2 million. The borrowing interest rate was, at our option, the bank’s prime rate or a LIBORbased rate.
19

A summary of future payments owed for contractual obligations and commercial commitments as ofSeptember 30, 2004 are shown in the table below (in thousands):
TotalLess Than
1 Year1 – 3Years
4 – 5Years
After 5Years
Contractual Obligations:Long-term debt . . . . . . . . . . . . . . . . . . . . . . . . $6,225 $ 420 $917 $1,032 $3,856Operating leases . . . . . . . . . . . . . . . . . . . . . . . 12 9 3 — —
Total contractual obligations . . . . . . . . . . . . . 6,237 429 920 1,032 3,856
Commercial Commitments:Lines of Credit . . . . . . . . . . . . . . . . . . . . . . . . 609 609 — — —
Total Contractual Obligations and CommercialCommitments . . . . . . . . . . . . . . . . . . . . . . . . . . $6,846 $1,038 $920 $1,032 $3,856
We believe that the combination of existing cash reserves, cash flows from operations and borrowingavailability under the New Credit Agreement should provide us sufficient capital resources and liquidity to fundour planned operations through fiscal year 2005. However, there can be no assurance that such sources of capitalwill be sufficient to support our capital requirements in the long-term, and we may be required to issue additionaldebt or equity securities in the future to meet our capital requirements. There can be no assurance we would beable to issue additional equity or debt securities in the future on terms that are acceptable to us or at all.
Off-Balance Sheet Arrangements
We do not have any obligations which meet the definition of an off-balance sheet arrangement and whichhave or are reasonably likely to have a current or future effect on our financial statements or the items containedtherein that is material to investors.
Critical Accounting Policies
The preparation of financial statements in conformity with accounting principles generally accepted in theUnited States of America requires the use of estimates and assumptions that affect the amounts reported in thefinancial statements and accompanying notes. We consider many factors in selecting appropriate operational andfinancial accounting policies and controls, and in developing the estimates and assumptions that are used in thepreparation of these financial statements. We continually evaluate our estimates, including those related to baddebt reserves, inventory obsolescence reserves, self-insurance reserves, product warranty reserves, intangibleassets and deferred income tax assets. We base our estimates on historical experience and various other factorsthat are believed to be reasonable under the circumstances. Actual results may differ from these estimates underdifferent conditions or assumptions.
Revenue is primarily derived from the sale, and short-term rental under operating leases, of seismicinstruments and equipment and commercial graphics products. Sales revenues are generally recognized when ourproducts are shipped and title and risk of loss have passed to the customer. Rental revenues are recognized asearned over the rental period. Rentals of our equipment generally range from daily rentals to rental periods of upto six months or longer. Except for certain of our reservoir characterization products, our products are generallysold without any customer acceptance provisions and our standard terms of sale do not allow customers to returnproducts for credit. In circumstances where acceptance provisions are significant, the revenue and related profitare deferred until such time as customer acceptance occurs. Most of our products do not require installationassistance or sophisticated instruction. We offer a standard product warranty obligating us to repair or replaceequipment with manufacturing defects. We maintain a reserve for future warranty costs based on historicalexperience or, in absence of historical experience, management estimates. We record a write-down of inventorywhen the cost basis of any item (including any estimated future costs to complete the manufacturing process)exceeds its net realizable value.
20

New Accounting Pronouncements
On November 25, 2002, the FASB issued FASB interpretation No. 45 (“FIN 45”), “Guarantor’s Accountingand Disclosure Requirements for Guarantees, Including Indirect Guarantees of Indebtedness of Others”, aninterpretation of FASB Statements No. 5, 57 and 107 and Rescission of FASB interpretation No. 34. FIN 45clarifies the requirements of FASB Statement No. 5, Accounting for Contingencies (FAS 5), relating to aguarantor’s accounting for, and disclosure of, the issuance of certain types of guarantees. We have implementedthe disclosure requirements of this standard in our fiscal year 2004 and this disclosure has been included in Note1 to the Consolidated Financial Statements in this Report on Form 10-K.
In December 2002, the FASB issued SFAS No. 148, “Accounting for Stock-Based Compensation andDisclosure—an amendment of FASB Statement No. 123”. This statement amends FASB Statement No. 123,Accounting for Stock-Based Compensation, to provide alternative transition methods for a voluntary change tothe fair value of accounting for stock-based employee compensation. In addition, this statement amends thedisclosure requirements of FASB Statement No. 123 to require more prominent disclosures in both annual andinterim financial statements about the method of accounting for stock-based employee compensation and theeffect of the method used on reported results. At September 30, 2004, we had two stock-based employeecompensation plans. We account for the plans under the recognition and measurement principles of APB OpinionNo. 25, “Accounting for Stock Issued to Employees”, and related interpretations. No stock-based employeecompensation cost has been reflected in our net income, as all options granted under those plans had an exerciseprice equal to the market value of the underlying common stock on the date of grant. In March 2004, the FASBissued an exposure draft, “Share-Based Payments, an Amendment of FASB Statements No. 123 and 95,” whichmay eliminate the ability to account for share-based compensation transactions using APB No. 25. In October2004, the FASB delayed the effective date of this proposed pronouncement until June 2005. We will continue tomonitor the rules and statements released by the FASB in regard to how we account for stock-based employeecompensation and related disclosure.
In April 2003, the FASB issued SFAS No. 149, “Amendment of Statement 133 on Derivative Instrumentsand Hedging Activities”. Statement 149 amends and clarifies financial accounting and reporting of derivativeinstruments, including certain derivative instruments embedded in other contracts (collectively referred to asderivatives) and for hedging activities under SFAS 133, “Accounting for Derivative Instruments and HedgingActivities”. This statement is effective for contracts entered into or modified after June 30, 2003, except forcertain hedging relationships designated after June 30, 2003. The adoption of SFAS No. 149 did not have amaterial effect on our financial position or results of operations.
In May 2003, the FASB issued SFAS No. 150, “Accounting for Certain Financial Instruments withCharacteristics of both Liabilities and Equity”. This statement establishes standards for how an issuer classifiesand measures certain financial instruments with characteristics of both liabilities and equity. It requires afinancial instrument within its scope to be classified as a liability. It is effective for financial instruments enteredinto or modified after May 31, 2003, and otherwise is effective at the beginning of the first interim periodbeginning after June 15, 2003. These effective dates are not applicable to the provisions of paragraphs 9 and 10of SFAS 150 as they apply to mandatorily redeemable noncontrolling interests, as the FASB has delayed theseprovisions indefinitely. Our adoption of this statement had no initial impact on our results of operations orfinancial position.
In December 2003, the SEC issued Staff Accounting Bulletin No. 104, “Revenue Recognition” (“SAB104”), which supercedes SAB 101, “Revenue Recognition in Financial Statements”. SAB 104’s primary purposeis to rescind accounting guidance contained within SAB 101 related to multiple element revenue arrangements,which was superceded as a result of the issuance of EITF 00-21, “Accounting for Revenue Arrangements withMultiple Deliverables”. While the wording of SAB 104 has changed to reflect the issuance of EITF 00-21, therevenue recognition principles of SAB 101 remain largely unchanged by the issuance of SAB 104. The adoptionof SAB 104 did not have a material effect on our financial position or our results of operations.
21

In November 2004, the FASB issued SFAS No. 151, “Inventory Costs—an amendment of ARB 43, Chapter4”. This Statement amends the guidance in ARB No. 43, Chapter 4, “Inventory Pricing”, to clarify the accountingfor abnormal amounts of idle facility expense, freight, handling costs and wasted material. This statementrequires that those items be recognized as current-period charges. In addition, this statement requires thatallocation of fixed production overheads to the costs of conversion be based on the normal capacity of theproduction facilities. We will adopt this statement effective October 1, 2005. We are currently evaluating theeffect of the adoption of this statement on our results of operations or financial position.
Forward-Looking Statements and Risks
Certain of the statements we make in this document and in documents incorporated by reference herein,including those made under the caption “Business”, “Management’s Discussion and Analysis of FinancialCondition and Results of Operations”, and in “Management’s Current Outlook”, are, or may be, forward-lookingstatements for purposes of the Securities Act of 1933 and the Securities Exchange Act of 1934. Such statementsinclude projections of our expectations regarding our future capital expenditures, research and developmentexpenses, expansion of product lines, growth of product markets and other statements that relate to future eventsor circumstances. These statements are subject to known and unknown risks, uncertainties and other factors thatmay cause our actual results, performance or achievements to differ materially from the future results,performance or achievements expressed or implied by such forward-looking statements, including the risks andfactors described below. You are cautioned to consider the following factors and risks in connection withevaluating any such forward-looking statements or otherwise evaluating an investment in our company.
Management’s Current Outlook.
Our estimates as to future results and industry trends, to the extent described in this document, are generallybased on assumptions regarding the future level of seismic exploration activity, seismic reservoir monitoringprojects and demand for thermal imaging technologies, and in turn, their effect on the demand and pricing of ourproducts and services. Our analysis of the market and its impact on us is based upon the following outlook forfiscal year 2005:
• The impact of political conditions and hostilities around the world, including those of the Middle East,which may have a significant impact on the oil and gas commodity prices, will not cause a significantincrease or significant decrease in demand for our seismic products during fiscal year 2005.
• Political conditions and hostilities around the world, which have a significant impact on the oil and gasindustry, will remain and present serious economic risks for our seismic business.
• While we expect demand for our traditional seismic land and marine products to increase in 2005 due tohigher oil and gas commodity prices, sales of equipment into the traditional seismic contracting industrywill remain constrained because:
• in many international markets, the supply of land and marine contract seismic services currentlyexceeds the international demand for such services;
• past customer consolidations have resulted in a surplus in the availability of certain seismicequipment;
• the supply of seismic data stored in libraries is sufficient for many of the oil and gas producingregions around the world;
• pricing for many of our land based seismic products will continue to be subject to competitivepressures due to industry wide manufacturing over-capacity and the emergence of new suppliers inChina and elsewhere; and
• competition among seismic equipment manufacturers could further intensify as large internationalseismic contractors expand their internal manufacturing capabilities or form alliances withcompetitors.
22

• In the absence of any new large-scale deepwater reservoir characterization projects, revenues from ourreservoir characterization products in fiscal year 2005 are expected to remain near fiscal year 2004levels.
• Demand for our products used in the commercial graphics industry is expected to increase marginally infiscal year 2005.
Our New Products May Not Achieve Market Acceptance.
Our outlook is based on various macro-economic factors and our internal assessments, and actual marketconditions could vary materially from those assumed.
In recent years we have incurred significant expenditures to fund our research and development efforts andwe intend to continue those expenditures in the future. However, research and development is by its naturespeculative, and we cannot assure you that these expenditures will result in the development of new products orservices or that any new products and services we have developed recently or may develop in the future will becommercially marketable or profitable to us.
In particular, we have incurred substantial expenditures to develop seismic products for reservoircharacterization applications. For a discussion of particular factors and risks relating to projects in the reservoircharacterization area, see the section entitled “Management’s Discussion and Analysis of Financial Conditionand Results of Operations—Industry Overview” in this Report on Form 10-K. We cannot assure you that we willrealize our expectations regarding market acceptance and revenues from these products and services.
A Decline in Industry Conditions Could Affect our Results.
Any unexpected material changes in oil and gas prices or other market trends that would impact seismicexploration activity would likely affect the forward-looking information contained in this document. In addition,the oil and gas industry is extremely volatile and subject to change based on political and economic factorsoutside our control. For instance, our results for fiscal year 2003 and results from our traditional seismic productsin particular, were adversely affected by the downturn in the industry, particularly as the industry continued tolimit exploration activities and to be cautious in spending notwithstanding some recent improvements in, or somerelative stabilization of, oil and gas commodity prices during such period.
We May Experience Fluctuations in Quarterly Results of Operations.
Historically, the rate of new orders for our products has varied substantially from quarter to quarter.Moreover, we typically operate, and expect to continue to operate, on the basis of orders in hand for our productsbefore we commence substantial manufacturing “runs”. Thus completion of orders, particularly large orders fordeepwater reservoir characterization projects, can significantly impact the operating results and cash flow for anyquarter, and results of operations for any one quarter may not be indicative of results of operations for futurequarters.
Our Credit Risks Could Increase as our Customers Continue to Face Difficult Economic Circumstances.
We believe, and have assumed, that our allowance for bad debts at September 30, 2004 is adequate in lightof known circumstances. However, we cannot assure you that additional amounts attributable to uncollectiblereceivables and bad debt write-offs will not have a material adverse effect on our future results of operations.Many of our customers, particularly seismic contractors, have suffered in past years from lower revenues andexperienced liquidity challenges resulting from the economic difficulties throughout our industry. We have in thepast incurred significant write-offs in our accounts receivable due to customer credit problems. We have found itnecessary from time to time to extend trade credit and promissory notes to long-term customers and others wheresome risks of non-payment exist. Although industry conditions have improved, some of our customers continueto experience liquidity difficulties, which increases those credit risks.
23

Demand for Our Products is Volatile.
Demand for our products depends primarily on the level of worldwide oil and gas exploration activity. Thatactivity, in turn, depends primarily on prevailing oil and gas prices and availability of seismic data. Historically,the markets for oil and gas have been volatile, and those markets are likely to continue to be volatile. Oil and gasprices are subject to wide fluctuation in response to relatively minor changes in the supply of and demand for oiland gas, market uncertainty and a variety of additional factors that are beyond our control. These factors includethe level of consumer demand, weather conditions, domestic and foreign governmental regulations, price andavailability of alternative fuels, political conditions and hostilities in the Middle East and other significant oil-producing regions, foreign supply of oil and gas, prices of foreign imports and overall economic conditions. Adecline in the demand for our products could materially and adversely affect our results of operations andliquidity. For a further discussion on this, see “Management’s Discussion and Analysis of Financial Conditionand Results of Operations—Industry Overview”.
We Have a Relatively Small Public Float, and Our Stock Price May be Volatile.
We have approximately 2.4 million shares outstanding held by non-affiliates. This small float results in arelatively illiquid market for our common stock. Our daily trading volume during fiscal year 2004 has averagedapproximately 6,700 shares. Our small float and daily trading volumes have in the past caused, and may in thefuture result in, greater volatility of our stock price.
Our Industry is Characterized by Rapid Technological Development and Product Obsolescence.
Our instruments and equipment are constantly undergoing rapid technological improvement. Our futuresuccess depends on our ability to continue to:
• improve our existing product lines,
• address the increasingly sophisticated needs of our customers,
• maintain a reputation for technological leadership,
• maintain market acceptance,
• anticipate changes in technology and industry standards, and
• respond to technological developments on a timely basis.
Current competitors or new market entrants may develop new technologies, products or standards that couldrender our products obsolete. We cannot assure you that we will be successful in developing and marketing, on atimely and cost effective basis, product enhancements or new products that respond to technologicaldevelopments, that are accepted in the marketplace or that comply with new industry standards.
We Operate in Highly Competitive Markets.
The markets for our products are highly competitive. Many of our existing and potential competitors havesubstantially greater marketing, financial and technical resources than we do. Additionally, two competitors inour seismic business segment currently offer a broader range of instruments and equipment for sale than we doand market this equipment as “packaged” data acquisition systems. We do not currently offer for sale such acomplete “packaged” data acquisition system. Further, certain of our competitors offer financing arrangements tocustomers on terms that we may not be able to match. In addition, new competitors may enter the market andcompetition could intensify.
We cannot assure you that sales of our products will continue at current volumes or prices if currentcompetitors or new market entrants introduce new products with better features, performance, price or othercharacteristics than our products. Competitive pressures or other factors also may result in significant pricecompetition that could have a material adverse effect on our results of operations.
24

We Have a Limited Market.
In our seismic business segment, we market our traditional products to contractors and large, independentand government-owned oil and gas companies. We estimate that, based on published industry sources, fewer than30 seismic contracting companies are currently operating worldwide (excluding those operating in Russia and theformer Soviet Union, India, the People’s Republic of China and certain Eastern European countries, whereseismic data acquisition activity is difficult to verify). We estimate that fewer than ten seismic contractors areengaged in marine seismic exploration. Due to these market factors, a relatively small number of customers,some of whom are experiencing financial difficulties, have accounted for most of our sales. From time to timethese seismic contractors have sought to vertically integrate and acquire our competitors, which has influencedtheir supplier decisions before and after such transactions. The loss of a small number of these customers couldmaterially and adversely impact our sales.
We Cannot Be Certain of Patent Protection of Our Products.
We hold and from time to time we apply for certain patents relating to our seismic data acquisition and otherproducts. We also acquired several patents which relate to the development of dry thermal film from our FormerPrimary Film Supplier. We cannot assure you that our patents will prove enforceable, that any patents will beissued for which we have applied or that competitors will not develop functionally similar technology outside theprotection of any patents we have or may obtain.
Our Foreign Subsidiaries and Foreign Marketing Efforts Face Additional Risks and Difficulties.
Net sales outside the United States accounted for approximately 61.0% of our net sales during fiscal year2004 and are again expected to represent a substantial portion of our net sales for fiscal year 2005 and subsequentyears. See Note 17 to the Consolidated Financial Statements contained in this Report on Form 10-K for furtherinformation on our sales outside of the United States. Substantially all of our sales from the United States aremade in U.S. dollars, but from time to time we make sales in foreign currencies and may, therefore, be subject toforeign currency fluctuations on our sales. In addition, net assets reflected on the balance sheets of our Russian,Canadian and United Kingdom subsidiaries are subject to currency fluctuations. Significant foreign currencyfluctuations could adversely impact our results of operations. For further discussion on this risk see Item 7A,“Quantitive and Qualitative Disclosures about Market Risk” contained in this Report on Form 10-K.
Foreign sales are subject to special risks inherent in doing business outside of the United States, includingthe risk of war, terrorist activities, civil disturbances, embargo and government activities and foreign attitudesabout conducting business activities with the United States or, all of which may disrupt markets. Foreign salesare also generally subject to the risk of compliance with additional laws, including tariff regulations and importand export restrictions. Sales in certain foreign countries require prior United States government approval in theform of an export license. We cannot assure you that we will not experience difficulties in connection with futureforeign sales. Also, should we experience substantial growth in certain foreign markets, for example in Russia,we may not be able to transfer cash balances to the United States to assist with debt servicing or otherobligations.
Our subsidiary in Russia currently does not maintain property and casualty insurance coverage for certainplant, equipment and personal property. We are evaluating the cost of obtaining minimum levels of insurancecoverage for such assets.
We Rely on Key Suppliers for Significant Product Components.
On September 30, 2004, we purchased the thermal printhead production assets from Graphtec. Prior to thatdate, Graphtec was the only supplier of wide format thermal printheads use to manufacture our wide formatthermal imaging equipment.
25

We currently manufacture dry thermal film which is used by our customers in the thermal imagingequipment we manufacture using the assets we acquired from Graphtec. We also purchase a large quantity of drythermal film from our Other Film Supplier. Except for our Other Film Supplier, we know of no other source fordry thermal film that performs well in our thermal imaging equipment.
If we are unable to economically manufacture dry thermal film internally or if our Other Film Supplier wereto discontinue supplying dry thermal film or were unable to supply dry thermal film in sufficient quantities tomeet our requirements, our ability to compete in the thermal imaging marketplace could be severely damaged,adversely affecting our financial performance.
It may be Difficult to Integrate the Assets Purchased from Graphtec and May Result in a Failure to Realize Someof the Anticipated Potential Benefits of the Asset Purchase.
We may not be able to integrate or manage the assets purchased from Graphtec to produce the returns thatwe have anticipated from the manufacture of thermal printheads. Any difficulty in successfully integratingbusiness operations resulting from the purchase of such assets could lead to a failure to realize the anticipatedsynergies. Our management also will be required to dedicate substantial time and effort to the integration of theseassets and relocation of these assets to Houston, Texas. These efforts could divert management’s focus andresources from other strategic opportunities and operational matters.
We Are Subject to Control by a Principal Stockholder.
OYO Corporation, a Japanese corporation, owns indirectly in the aggregate approximately 51.0% of ourcommon stock. Accordingly, OYO Corporation, through its wholly owned subsidiary OYO Corporation U.S.A.,is able to elect all of our directors and to control our management, operations and affairs. We currently have, andmay continue to have, a variety of contractual relationships with OYO Corporation and its affiliates.
Our Success Depends Upon A Limited Number of Key Personnel.
Our success depends on attracting and retaining highly skilled professionals. A number of our employeesare highly skilled engineers and other professionals. If we fail to continue to attract and retain such professionals,our ability to compete in the industry could be adversely affected. In addition, our success depends to asignificant extent upon the abilities and efforts of the members of our senior management.
A General Downturn in the U.S. Economy in Fiscal 2005 May Adversely Affect our Business.
A general downturn in the U.S. economy in future periods could adversely affect our business in ways thatwe cannot identify. Any economic downturn may adversely affect the demand for oil and gas generally or causevolatility in oil and gas prices and, therefore, adversely affect the demand for our services to the oil and gasindustry and related service industry. It could also adversely affect the demand for consumer products, whichcould in turn adversely affect our commercial graphics business. To the extent these factors adversely affectother seismic companies in the industry, we could see an oversupply of products and services and downwardpressure on pricing for seismic products and services that would also adversely affect us.
Sarbanes-Oxley Act of 2002.
In response to several high profile cases of accounting irregularities, the Sarbanes-Oxley Act of 2002 (“theAct”) was enacted into law on July 30, 2002. We are required to begin to comply with the annual requirements ofSection 404 of the Act with respect to our internal controls over financial reporting effective with our fiscal yearbeginning October 1, 2004. The Act, and rules promulgated thereunder, as well as new NASDAQ listingstandards addressing corporate governance issues, endeavor to provide greater accountability and promoteinvestor confidence by imposing specific corporate governance requirements, by requiring more stringentcontrols and certifications by corporate management and by utimately imposing new auditor attestations. The Act
26

and new NASDAQ rules affect how audit committees, corporate management and auditors of publicly tradedcompanies carry out their respective responsibilities and interact with each other and mandate composition ofaudit committees by independent directors. The Act will result in higher expenses for publicly traded companiesas a result of higher audit and review fees, higher legal fees, higher director fees, and higher internal costs todocument, test and potentially remediate internal controls. The Act, together with the financial scandals anddifficult economic environment of recent years has also led to substantially increased premiums for director andofficer liability insurance. These increased expenses will affect smaller public companies, like us,disproportionately from their effects on companies with larger revenue and operating income bases with which toabsorb such increased costs.
With respect to the internal controls requirement flowing from the Act, we will devote substantial effortsand incur significant expenses in fiscal year 2005 in documenting, testing and potentially remediating ourinternal controls system. We have hired outside experts to help us with respect to these matters. Notwithstandingour substantial efforts, the requirements of the Act as to internal controls are new and significant and, to someextent, quite burdensome, and there exists a risk that we will not be able to meet all the requirements of the Actin such regard by the end of fiscal year 2005, when we are required to report on our internal controls and provideour auditor’s opinion thereon.
We May Not Enjoy the Expected Benefits of Our Move to a New Facility and Other Internal Restructurings.
While we purchased the Pinemont Facility in 2003 to house all our existing U.S. operations and activitieswith the expectation of improving our efficiency and margins, we cannot assure you that our efforts will besuccessful or that we will enjoy the full benefit of capital and operating expenditures incurred in connection withsuch measures.
One of our vacant facilities, a 77,000 square foot manufacturing building in northwest Houston, is beingconsidered for re-utilization due to our inability to further expand our manufacturing operations at the PinemontFacility. This facility has a net book value of $4.7 million and is reflected in the accompanying balance sheetunder property, plant and equipment. If we are unable to either utilize this facility or lease it to a third party, wemay be required to record an impairment charge in fiscal 2005.
We have another vacant facility, a 20,000 square foot office building located in Stafford, Texas, which isbeing marketed for sale. We expect to sell this building in fiscal year 2005.
Item 7A. Quantitative and Qualitative Disclosures about Market Risk
The following discussion of our exposure to various market risks contains “forward looking statements” thatinvolve risks and uncertainties. These projected results have been prepared utilizing certain assumptionsconsidered reasonable in light of information currently available to us. Nevertheless, because of the inherentunpredictability of foreign currency rates, as well as other factors, actual results could differ materially fromthose projected in this forward looking information. For a description of our significant accounting policiesassociated with these activities, see Note 1 to the Consolidated Financial Statements.
We do not have any market risk as to market risk sensitive instruments entered into for trading purposes andhave only very limited risk as to arrangements entered into other than for trading purposes. Further, we do notengage in commodity or commodity derivative instrument purchasing or selling transactions.
Foreign Currency Exchange Rate Risk
Until September 30, 2004, we purchased printheads from OYO Corporation, which purchased them fromGraphtec, pursuant to terms under which such purchases were denominated in Japanese yen. We routinelyattempted to hedge our currency exposure on these purchases by entering into foreign currency forward contractswith a bank. The purpose of entering into these forward hedge contracts was to eliminate variability of cash flowsassociated with foreign currency exchanges on amounts payable in Japanese yen. Our forward contracts with
27

banks were considered derivatives. Accounting principles generally accepted in the United States require that werecord these foreign currency forward contracts on the balance sheet and mark them to fair value at eachreporting date. Our aggregate dollar exposure to forward yen contracts usually did not exceed $0.5 million andsuch contracts ordinarily were settled within 10 months. Resulting gains and losses are reflected in income andwere not material for our fiscal year ended September 30, 2004. As a result of our recent acquisition ofGraphtec’s thermal printhead production assets, at September 30, 2004, there were no yen denominated foreigncurrency forward contracts or yen-denominated accounts payable.
Foreign Currency and Operations Risk
We have a subsidiary located in Russia. Therefore, our financial results may be affected by factors such aschanges in foreign currency exchange rates, weak economic conditions in Russia or changes in Russia’s politicalclimate. Our consolidated balance sheet at September 30, 2004 reflected approximately $2.3 million of networking capital related to our Russian subsidiary. This subsidiary both receives its income and pays its expensesprimarily in rubles. To the extent that transactions of this subsidiary are settled in rubles, a devaluation of theruble versus the U.S. dollar could reduce any contribution from our Russian subsidiary to our consolidated resultsof operations as reported in U.S. dollars. We do not hedge the market risk with respect to our operations inRussia; therefore, such risk is a general and unpredictable risk of future disruptions in the valuation of Russianrubles versus U.S. dollars to the extent such disruptions result in any reduced valuation of the Russiansubsidiary’s net working capital or future contributions to our consolidated results of operations. Under recentlypassed tax legislation, we may be able to repatriate foreign earnings from Russia and elsewhere at a moreattractive tax rate than had been applicable.
Foreign Currency Intercompany Accounts and Notes Receivable
From time to time, we provide access to capital to our foreign subsidiaries through U.S. dollar denominatedinterest bearing promissory notes. Such funds are generally used by our foreign subsidiaries to purchase capitalassets and for general working capital needs. In addition, we sell products to our foreign subsidiaries in U.S.dollars on trade credit terms. Because these U.S. dollar denominated intercompany debts are accounted for in thelocal currency of our foreign subsidiaries, any appreciation or devaluation of such foreign currencies against theU.S. dollar will result in a gain or loss, respectively, to our consolidated statement of operations. At September30, 2004, we had outstanding accounts and notes receivable of $1.6 million and $4,000 from our subsidiaries inRussia and Canada, respectively. There were no accounts or notes receivable due from our subsidiary in theUnited Kingdom.
Floating Interest Rate Risk
Our New Credit Agreement and one of our real estate mortgage agreements contains floating interest rates.These floating interest rates subject us to the risk of increased interest costs associated with any upwardmovements in bank market interest rates. Under the New Credit Agreement, our borrowing interest rate is adiscounted prime lending rate or a LIBOR based rate, whichever we select. Similarly, under our Previous CreditAgreement, our interest rate was either the bank’s prime rate or a LIBOR based rate. Under the real estatemortgage agreement, our borrowing rate is a LIBOR based rate plus 250 basis points with a minimum rate of4.0%. As of September 30, 2004, we had borrowed $0.6 million under our Previous Credit Agreement at a rate of4.8% and we had borrowed $2.9 million under our real estate mortgage agreement at a rate of 4.0%. Due to theamount of borrowings outstanding under these facilities, including potential borrowings available under the NewCredit Agreement, any increased interest costs associated with movements in market interest rates could bematerial to our financial condition, results of operation or cash flow. At September 30, 2004 based on our currentlevel of borrowings, a 1.0% increase in interest rates would increase interest expense annually by approximately$35,000.
28

Item 8. Financial Statements and Supplementary Data
Our consolidated financial statements, including the reports thereon, the notes thereto and supplementarydata begin at page F-1 of this Form 10-K and are incorporated herein by reference.
Item 9. Changes in and Disagreements With Accountants on Accounting and Financial Disclosure
Our independent public accountant has not resigned, declined to stand for reelection or been dismissed inour last two fiscal years, and we have not engaged any other independent public accountants to audit us or any ofour subsidiaries during that time.
Item 9A. Controls and Procedures
As of the end of the period covered by this report, our management, including the Chief Executive Officerand Chief Financial Officer, have conducted an evaluation of the effectiveness of disclosure controls andprocedures pursuant to Rule 13a-15 under the Securities Exchange Act of 1934. Based on that evaluation, theChief Executive Officer and Chief Financial Officer concluded that our disclosure controls and procedures areeffective in ensuring that all material information required to be filed in this annual report has been made knownto them in a timely fashion. There have been no significant changes in internal controls, or in factors that couldmaterially affect or that are reasonably likely to materially affect, internal controls over financial reporting,subsequent to the date the Chief Executive Officer and Chief Financial Officer completed their evaluation.
Item 9B. Other Information
None.
29

PART III
Item 10. Directors and Executive Officers of the Registrant
The information required by this Item is contained in our definitive Proxy Statement to be distributed inconnection with our 2005 Annual Meeting of Stockholders under the captions “Election of Directors”,“Executive Officers and Compensation” and “Compliance With Section 16(a) of The Securities Exchange Act of1934” and is incorporated herein by reference.
Item 11. Executive Compensation
The information required by this Item is contained in our definitive Proxy Statement to be distributed inconnection with our 2005 Annual Meeting of Stockholders under the caption “Executive Officers andCompensation” and is incorporated herein by reference.
Item 12. Security Ownership of Certain Beneficial Owners and Management and Related StockholderMatters
The information required by this Item is contained in our definitive Proxy Statement to be distributed inconnection with our 2005 Annual Meeting of Stockholders under the caption “Security Ownership of CertainBeneficial Owners and Management” and is incorporated herein by reference as well as in Item 5, “Market forRegistrants Common Equity and Related Stockholder Matters”, contained in Part II hereof.
Item 13. Certain Relationships and Related Transactions
The information required by this Item is contained in our definitive Proxy Statement to be distributed inconnection with our 2005 Annual Meeting of Stockholders under the caption “Certain Relationships andTransactions” and is incorporated herein by reference.
Item 14. Principal Accountant Fees and Services
The information required by this Item is contained in our definitive Proxy Statement to be distributed inconnection with our 2005 Annual Meeting of Stockholders under the caption “Relationship with IndependentAuditors” and is incorporated herein by reference.
30

PART IV
Item 15. Exhibits, Financial Statement Schedules and Reports on Form 8-K
(a) Financial Statements and Financial Statement Schedules
The financial statements and financial statement schedules listed on the accompanying Index to FinancialStatements (see page F-1) are filed as part of this Form 10-K.
(b) Reports on Form 8-K
On July 28, 2003, the Company filed a current report on Form 8-K pursuant to Item 12 of Form 8-Kreporting the Company earnings for the third quarter.
(c) Exhibits
ExhibitNumber Description of Documents
3.1 (a) Restated Certificate of Incorporation of the Registrant.
3.2 (a) Restated Bylaws of the Registrant.
10.1 (a) Employment Agreement dated as of August 1, 1997 between the Company and Gary D. Owens.
10.2 (a) Employment Agreement dated as of August 1, 1997 between the Company and Michael J. Sheen.
10.3 (c) OYO Geospace Corporation 1997 Key Employee Stock Option Plan.
10.4 (d) Amendment No. 1 to OYO Geospace Corporation 1997 Key Employee Stock Option Plan, datedFebruary 2, 1998.
10.5 (d) Amendment No. 2 to OYO Geospace Corporation 1997 Key Employee Stock Option Plan, datedNovember 16, 1998.
10.6 (c) OYO Geospace Corporation 1997 Non-Employee Director Plan.
10.7 (a) Printhead Purchase Agreement dated November 10, 1995 between the Company and OYOCorporation.
10.8 (a) Master Sales Agreement dated November 10, 1995 between the Company and OYO Corporation.
10.9 (e) Form of Director Indemnification Agreement.
10.10(b) Promissory Note, dated as of June 23, 1998, made by the Company payable to Ameritas LifeInsurance Corp.
10.11 Business Loan Agreement dated November 22, 2004, made by and between Union Planters Bank,N.A., and Concord Technologies, LP, Geospace Technologies, LP, OYO Instruments, LP, GeospaceEngineering Resources International, LP and OYOG Operations, LP.
10.12 Promissory Note dated November 22, 2004, made by Concord Technologies, LP, GeospaceTechnologies, LP, OYO Instruments, LP, Geospace Engineering Resources International, LP andOYOG Operations, LP for the benefit of Union Planters Bank, NA.
10.13 Guaranty Agreement dated November 22, 2004, made by and between the Company and UnionPlanters Bank, NA.
10.14 Guaranty Agreement dated November 22, 2004, made by and between OYOG, LLC and UnionPlanters Bank, NA.
10.15 Guaranty Agreement dated November 22, 2004, made by and between OYOG Limited Partner, LLCand Union Planters Bank, NA.
31
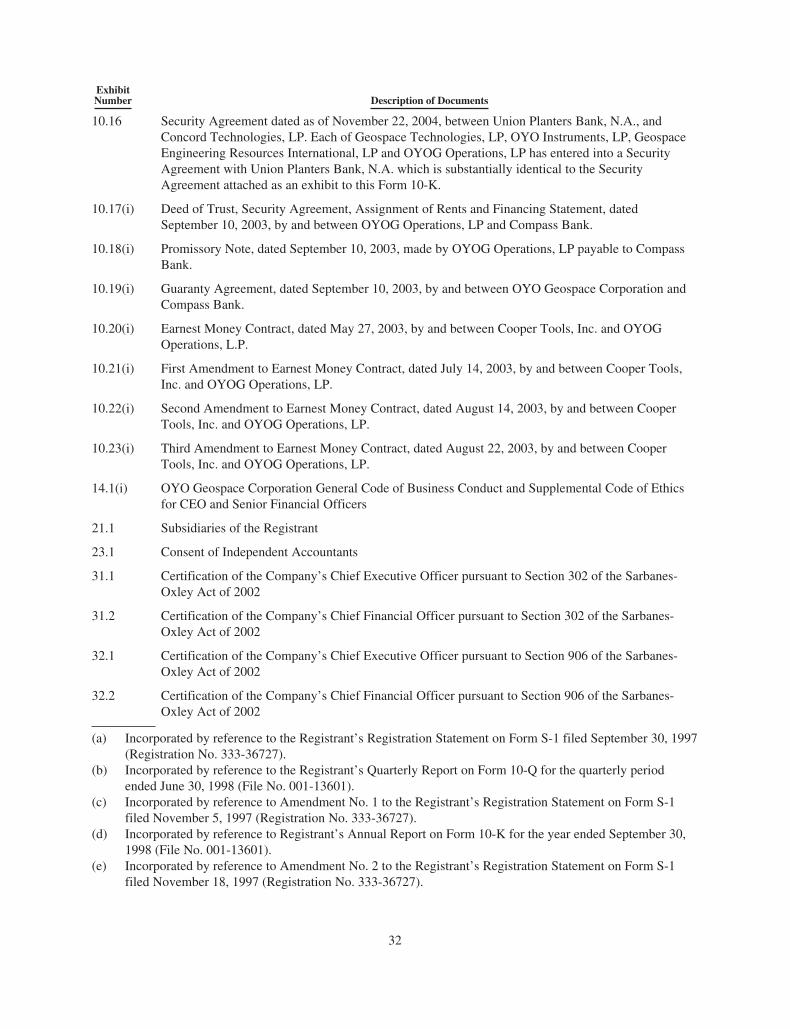
ExhibitNumber Description of Documents
10.16 Security Agreement dated as of November 22, 2004, between Union Planters Bank, N.A., andConcord Technologies, LP. Each of Geospace Technologies, LP, OYO Instruments, LP, GeospaceEngineering Resources International, LP and OYOG Operations, LP has entered into a SecurityAgreement with Union Planters Bank, N.A. which is substantially identical to the SecurityAgreement attached as an exhibit to this Form 10-K.
10.17(i) Deed of Trust, Security Agreement, Assignment of Rents and Financing Statement, datedSeptember 10, 2003, by and between OYOG Operations, LP and Compass Bank.
10.18(i) Promissory Note, dated September 10, 2003, made by OYOG Operations, LP payable to CompassBank.
10.19(i) Guaranty Agreement, dated September 10, 2003, by and between OYO Geospace Corporation andCompass Bank.
10.20(i) Earnest Money Contract, dated May 27, 2003, by and between Cooper Tools, Inc. and OYOGOperations, L.P.
10.21(i) First Amendment to Earnest Money Contract, dated July 14, 2003, by and between Cooper Tools,Inc. and OYOG Operations, LP.
10.22(i) Second Amendment to Earnest Money Contract, dated August 14, 2003, by and between CooperTools, Inc. and OYOG Operations, LP.
10.23(i) Third Amendment to Earnest Money Contract, dated August 22, 2003, by and between CooperTools, Inc. and OYOG Operations, LP.
14.1(i) OYO Geospace Corporation General Code of Business Conduct and Supplemental Code of Ethicsfor CEO and Senior Financial Officers
21.1 Subsidiaries of the Registrant
23.1 Consent of Independent Accountants
31.1 Certification of the Company’s Chief Executive Officer pursuant to Section 302 of the Sarbanes-Oxley Act of 2002
31.2 Certification of the Company’s Chief Financial Officer pursuant to Section 302 of the Sarbanes-Oxley Act of 2002
32.1 Certification of the Company’s Chief Executive Officer pursuant to Section 906 of the Sarbanes-Oxley Act of 2002
32.2 Certification of the Company’s Chief Financial Officer pursuant to Section 906 of the Sarbanes-Oxley Act of 2002
(a) Incorporated by reference to the Registrant’s Registration Statement on Form S-1 filed September 30, 1997(Registration No. 333-36727).
(b) Incorporated by reference to the Registrant’s Quarterly Report on Form 10-Q for the quarterly periodended June 30, 1998 (File No. 001-13601).
(c) Incorporated by reference to Amendment No. 1 to the Registrant’s Registration Statement on Form S-1filed November 5, 1997 (Registration No. 333-36727).
(d) Incorporated by reference to Registrant’s Annual Report on Form 10-K for the year ended September 30,1998 (File No. 001-13601).
(e) Incorporated by reference to Amendment No. 2 to the Registrant’s Registration Statement on Form S-1filed November 18, 1997 (Registration No. 333-36727).
32

(f) Incorporated by reference to the Registrant’s Quarterly Report on Form 10-Q for the quarterly periodended March 31, 2001 (File No. 001-13601).
(g) Incorporated by reference to the Registrant’s Quarterly Report on Form 10-Q for the quarterly periodended December 31, 2001 (File No. 001-13601).
(h) Incorporated by reference to the Registrant’s Quarterly Report on Form 10-Q for the quarterly periodended December 31, 2002 (File No. 333-36767).
(i) Incorporated by reference to the registrants Annual Report on Form 10-K for the year ended September 30,2003 (File No. 333-36727)
33

SIGNATURES
Pursuant to the requirements of the Securities Exchange Act of 1934, the Registrant has duly caused thisreport to be signed on its behalf by the undersigned thereunto duly authorized.
OYO GEOSPACE CORPORATION
By: /s/ GARY D. OWENS
Gary D. Owens, Chairman of the BoardPresident and Chief Executive Officer
December 3, 2004
Pursuant to the requirements of the Securities Exchange Act, this Annual Report on Form 10-K has beensigned below by the following persons on behalf of the Registrant and in the capacities and on the datesindicated.
Signature Title Date
/s/ GARY D. OWENS
Gary D. Owens
Chairman of the Board President andChief Executive Officer (PrincipalExecutive Officer)
December 3, 2004
/s/ THOMAS T. MCENTIRE
Thomas T. McEntire
Chief Financial Officer (PrincipalFinancial and Accounting Officer)
December 3, 2004
/s/ WILLIAM H. MOODY
William H. Moody
Director December 3, 2004
/s/ KATSUHIKO KOBAYASHI
Katsuhiko Kobayashi
Director December 3, 2004
/s/ RYUOZO OKUTO
Ryuzo Okuto
Director December 3, 2004
/s/ MICHAEL J. SHEEN
Michael J. Sheen
Director December 3, 2004
/s/ THOMAS L. DAVIS
Thomas L. Davis
Director December 3, 2004
/s/ CHARLES H. STILL
Charles H. Still
Director December 3, 2004
34

OYO GEOSPACE CORPORATION AND SUBSIDIARIES
INDEX TO FINANCIAL STATEMENTS
Report of Independent Registered Public Accounting Firm . . . . . . . . . . . . . . . . . . . . . . . . . . . . . . . . . . . . . F-2
Consolidated Balance Sheets as of September 30, 2004 and 2003 . . . . . . . . . . . . . . . . . . . . . . . . . . . . . . . . . F-3
Consolidated Statements of Operations for the Years Ended September 30, 2004, 2003 and 2002 . . . . . . . . F-4
Consolidated Statement of Stockholders’ Equity for the Years Ended September 30, 2004, 2003 and2002 . . . . . . . . . . . . . . . . . . . . . . . . . . . . . . . . . . . . . . . . . . . . . . . . . . . . . . . . . . . . . . . . . . . . . . . . . . . . . . . F-5
Consolidated Statements of Cash Flows for the Years Ended September 30, 2004, 2003 and 2002 . . . . . . . F-6
Notes to Consolidated Financial Statements . . . . . . . . . . . . . . . . . . . . . . . . . . . . . . . . . . . . . . . . . . . . . . . . . . F-7
Schedule II—Valuation and Qualifying Accounts . . . . . . . . . . . . . . . . . . . . . . . . . . . . . . . . . . . . . . . . . . . . . F-30
F-1

REPORT OF INDEPENDENT REGISTERED PUBLIC ACCOUNTING FIRM
To the Board of Directors and Stockholdersof OYO Geospace Corporation:
In our opinion, the consolidated financial statements listed in the accompanying index present fairly, in allmaterial respects, the financial position of OYO Geospace Corporation and its subsidiaries at September 30, 2004and 2003, and the results of their operations and their cash flows for each of the three years in the period endedSeptember 30, 2004, in conformity with accounting principles generally accepted in the United States ofAmerica. In addition, in our opinion, the financial statement schedules listed in the accompanying index presentfairly, in all material respects, the information set forth therein when read in conjunction with the relatedconsolidated financial statements. These financial statements and financial statement schedules are theresponsibility of the Company’s management. Our responsibility is to express an opinion on these financialstatements and financial statement schedules based on our audits. We conducted our audits of these statements inaccordance with the standards of the Public Company Accounting Oversight Board (United States). Thosestandards require that we plan and perform the audit to obtain reasonable assurance about whether the financialstatements are free of material misstatement. An audit includes examining, on a test basis, evidence supportingthe amounts and disclosures in the financial statements, assessing the accounting principles used and significantestimates made by management, and evaluating the overall financial statement presentation. We believe that ouraudits provide a reasonable basis for our opinion.
/s/ PRICEWATERHOUSECOOPERS LLP
Houston, TexasDecember 3, 2004
F-2

OYO Geospace Corporation and Subsidiaries
Consolidated Balance Sheets(In thousands, except share amounts)
AS OFSEPTEMBER 30,
2004 2003
ASSETSCurrent assets:
Cash and cash equivalents . . . . . . . . . . . . . . . . . . . . . . . . . . . . . . . . . . . . . . . . . . . . . . . . . $ 3,139 $ 671Trade accounts receivable, net of allowance of $689 and $478 . . . . . . . . . . . . . . . . . . . . 10,849 7,849Notes receivable, net of allowance of $0 . . . . . . . . . . . . . . . . . . . . . . . . . . . . . . . . . . . . . 1,978 2,129Inventories, net . . . . . . . . . . . . . . . . . . . . . . . . . . . . . . . . . . . . . . . . . . . . . . . . . . . . . . . . . 25,406 22,929Deferred income tax . . . . . . . . . . . . . . . . . . . . . . . . . . . . . . . . . . . . . . . . . . . . . . . . . . . . . 1,567 1,233Prepaid expenses and other . . . . . . . . . . . . . . . . . . . . . . . . . . . . . . . . . . . . . . . . . . . . . . . . 2,494 2,739
Total current assets . . . . . . . . . . . . . . . . . . . . . . . . . . . . . . . . . . . . . . . . . . . . . . . . . . 45,433 37,550
Rental equipment, net . . . . . . . . . . . . . . . . . . . . . . . . . . . . . . . . . . . . . . . . . . . . . . . . . . . . . . . . 1,916 2,175Property, plant and equipment, net . . . . . . . . . . . . . . . . . . . . . . . . . . . . . . . . . . . . . . . . . . . . . . 21,421 22,379Patents, net of accumulated amortization of $2,727 and $2,153 . . . . . . . . . . . . . . . . . . . . . . . 3,127 3,861Goodwill, net of accumulated amortization of $921 . . . . . . . . . . . . . . . . . . . . . . . . . . . . . . . . . 1,843 1,843Deferred income tax . . . . . . . . . . . . . . . . . . . . . . . . . . . . . . . . . . . . . . . . . . . . . . . . . . . . . . . . . 2,700 1,869Other assets . . . . . . . . . . . . . . . . . . . . . . . . . . . . . . . . . . . . . . . . . . . . . . . . . . . . . . . . . . . . . . . . 1,354 1,758
Total assets . . . . . . . . . . . . . . . . . . . . . . . . . . . . . . . . . . . . . . . . . . . . . . . . . . . . . . . . $77,794 $71,435
LIABILITIES AND STOCKHOLDERS’ EQUITYCurrent liabilities:
Notes payable and current maturities of long-term debt . . . . . . . . . . . . . . . . . . . . . . . . . . $ 1,029 $ 5,889Accounts payable:
Trade . . . . . . . . . . . . . . . . . . . . . . . . . . . . . . . . . . . . . . . . . . . . . . . . . . . . . . . . . . . . . 4,876 2,418Related parties . . . . . . . . . . . . . . . . . . . . . . . . . . . . . . . . . . . . . . . . . . . . . . . . . . . . . . — 383
Accrued expenses and other . . . . . . . . . . . . . . . . . . . . . . . . . . . . . . . . . . . . . . . . . . . . . . . 5,838 3,758Deferred revenue . . . . . . . . . . . . . . . . . . . . . . . . . . . . . . . . . . . . . . . . . . . . . . . . . . . . . . . . 316 138Income tax payable . . . . . . . . . . . . . . . . . . . . . . . . . . . . . . . . . . . . . . . . . . . . . . . . . . . . . . 585 27
Total current liabilities . . . . . . . . . . . . . . . . . . . . . . . . . . . . . . . . . . . . . . . . . . . . . . . 12,644 12,613Long-term debt . . . . . . . . . . . . . . . . . . . . . . . . . . . . . . . . . . . . . . . . . . . . . . . . . . . . . . . . . . . . . 5,805 6,232
Total liabilities . . . . . . . . . . . . . . . . . . . . . . . . . . . . . . . . . . . . . . . . . . . . . . . . . . . . . 18,449 18,845
Minority interest in consolidated subsidiary . . . . . . . . . . . . . . . . . . . . . . . . . . . . . . . . . . . . . . . 145 119
Stockholders’ equity:Preferred stock, 1,000,000 shares authorized, no shares issued and outstanding . . . . . . . — —Common stock, $.01 par value, 20,000,000 shares authorized, 5,588,160 and 5,554,874
shares issued and outstanding . . . . . . . . . . . . . . . . . . . . . . . . . . . . . . . . . . . . . . . . . . . . 56 56Additional paid-in capital . . . . . . . . . . . . . . . . . . . . . . . . . . . . . . . . . . . . . . . . . . . . . . . . . 31,115 30,636Retained earnings . . . . . . . . . . . . . . . . . . . . . . . . . . . . . . . . . . . . . . . . . . . . . . . . . . . . . . . 27,752 21,799Accumulated other comprehensive income (loss) . . . . . . . . . . . . . . . . . . . . . . . . . . . . . . 277 (16)Unearned compensation-restricted stock awards . . . . . . . . . . . . . . . . . . . . . . . . . . . . . . . — (4)
Total stockholders’ equity . . . . . . . . . . . . . . . . . . . . . . . . . . . . . . . . . . . . . . . . . . . . . 59,200 52,471
Total liabilities and stockholders’ equity . . . . . . . . . . . . . . . . . . . . . . . . . . . . . . . . . $77,794 $71,435
The accompanying notes are an integral part of the consolidated financial statements.
F-3

OYO Geospace Corporation and Subsidiaries
Consolidated Statements of Operations(In thousands, except share and per share amounts)
YEAR ENDED SEPTEMBER 30,
2004 2003 2002
Net sales . . . . . . . . . . . . . . . . . . . . . . . . . . . . . . . . . . . . . . . . . . . . . . . . . . $ 63,538 $ 50,854 $ 65,049Cost of sales . . . . . . . . . . . . . . . . . . . . . . . . . . . . . . . . . . . . . . . . . . . . . . . 40,787 38,337 46,484
Gross profit . . . . . . . . . . . . . . . . . . . . . . . . . . . . . . . . . . . . . . . . . . . . . . . . 22,751 12,517 18,565
Operating expenses:Selling, general and administrative expenses . . . . . . . . . . . . . . . . . . 12,086 11,273 11,538Research and development expenses . . . . . . . . . . . . . . . . . . . . . . . . 4,794 5,226 5,347Impairment of assets . . . . . . . . . . . . . . . . . . . . . . . . . . . . . . . . . . . . . — — 1,246
Total operating expenses . . . . . . . . . . . . . . . . . . . . . . . . . . . . . . 16,880 16,499 18,131
Income (loss) from operations . . . . . . . . . . . . . . . . . . . . . . . . . . . . . . . . . 5,871 (3,982) 434
Other income (expense):Interest expense . . . . . . . . . . . . . . . . . . . . . . . . . . . . . . . . . . . . . . . . . (419) (464) (666)Interest income . . . . . . . . . . . . . . . . . . . . . . . . . . . . . . . . . . . . . . . . . 268 329 177Other, net . . . . . . . . . . . . . . . . . . . . . . . . . . . . . . . . . . . . . . . . . . . . . . 212 204 (281)
Total other income (expense), net . . . . . . . . . . . . . . . . . . . . . . . 61 69 (770)
Income (loss) before income taxes, minority interest and extraordinarygain . . . . . . . . . . . . . . . . . . . . . . . . . . . . . . . . . . . . . . . . . . . . . . . . . . . . 5,932 (3,913) (336)
Income tax benefit . . . . . . . . . . . . . . . . . . . . . . . . . . . . . . . . . . . . . . . . . . . (47) (1,399) (857)
Income (loss) before minority interest, and extraordinary gain . . . . . . . . 5,979 (2,514) 521Minority interest . . . . . . . . . . . . . . . . . . . . . . . . . . . . . . . . . . . . . . . . . . . . (26) (19) (88)
Income (loss) before extraordinary gain . . . . . . . . . . . . . . . . . . . . . . . . . . 5,953 (2,533) 433Extraordinary gain, net of tax of $85 . . . . . . . . . . . . . . . . . . . . . . . . . . . . — — 686
Net income (loss) . . . . . . . . . . . . . . . . . . . . . . . . . . . . . . . . . . . . . . . . . . . $ 5,953 $ (2,533) $ 1,119
Basic earnings (loss) per share:Income (loss) before extraordinary gain . . . . . . . . . . . . . . . . . . . . . . . . . . $ 1.07 $ (0.46) $ 0.08Extraordinary gain . . . . . . . . . . . . . . . . . . . . . . . . . . . . . . . . . . . . . . . . . . . — — 0.12
Net income (loss) . . . . . . . . . . . . . . . . . . . . . . . . . . . . . . . . . . . . . . . . . . . $ 1.07 $ (0.46) $ 0.20
Diluted earnings (loss) per share:Income (loss) before extraordinary gain . . . . . . . . . . . . . . . . . . . . . . . . . . $ 1.05 $ (0.46) $ 0.08Extraordinary gain . . . . . . . . . . . . . . . . . . . . . . . . . . . . . . . . . . . . . . . . . . . — — 0.12
Net income (loss) . . . . . . . . . . . . . . . . . . . . . . . . . . . . . . . . . . . . . . . . . . . $ 1.05 $ (0.46) $ 0.20
Weighted average shares outstanding:Basic . . . . . . . . . . . . . . . . . . . . . . . . . . . . . . . . . . . . . . . . . . . . . . . . . 5,573,611 5,550,216 5,535,979
Diluted . . . . . . . . . . . . . . . . . . . . . . . . . . . . . . . . . . . . . . . . . . . . . . . . 5,684,853 5,550,216 5,547,774
The accompanying notes are an integral part of the consolidated financial statements.
F-4
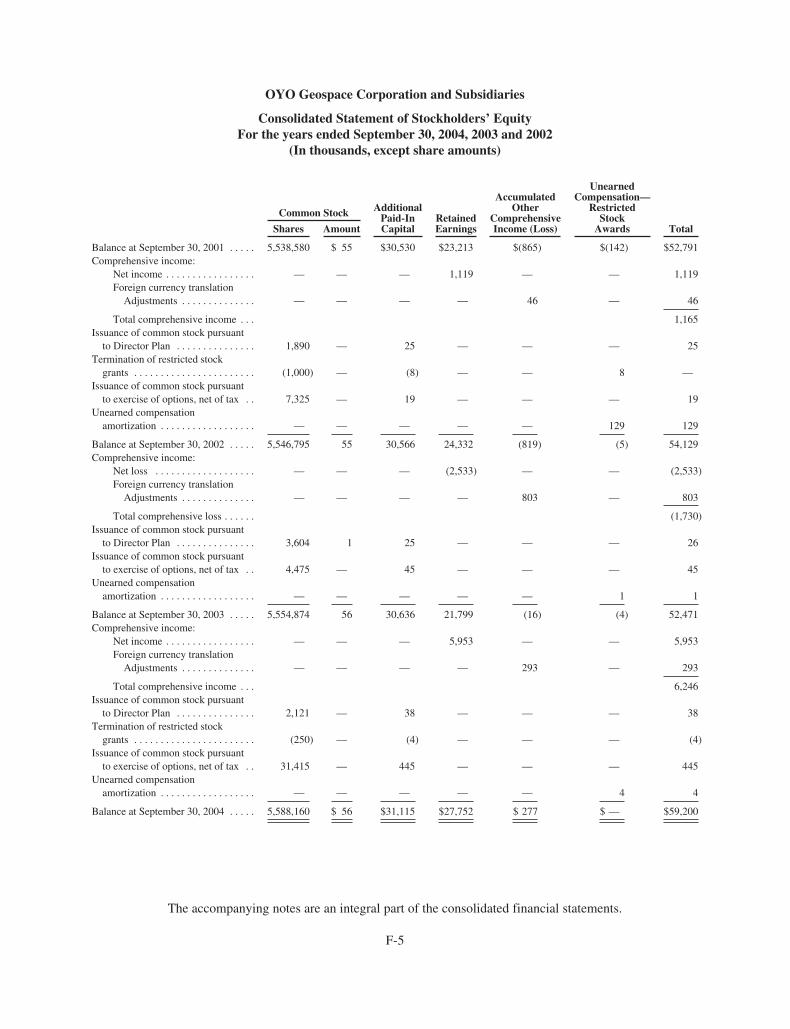
OYO Geospace Corporation and Subsidiaries
Consolidated Statement of Stockholders’ EquityFor the years ended September 30, 2004, 2003 and 2002
(In thousands, except share amounts)
Common Stock AdditionalPaid-InCapital
RetainedEarnings
AccumulatedOther
ComprehensiveIncome (Loss)
UnearnedCompensation—
RestrictedStock
Awards TotalShares Amount
Balance at September 30, 2001 . . . . . 5,538,580 $ 55 $30,530 $23,213 $(865) $(142) $52,791Comprehensive income:
Net income . . . . . . . . . . . . . . . . . — — — 1,119 — — 1,119Foreign currency translation
Adjustments . . . . . . . . . . . . . . — — — — 46 — 46
Total comprehensive income . . . 1,165Issuance of common stock pursuant
to Director Plan . . . . . . . . . . . . . . . 1,890 — 25 — — — 25Termination of restricted stock
grants . . . . . . . . . . . . . . . . . . . . . . . (1,000) — (8) — — 8 —Issuance of common stock pursuant
to exercise of options, net of tax . . 7,325 — 19 — — — 19Unearned compensation
amortization . . . . . . . . . . . . . . . . . . — — — — — 129 129
Balance at September 30, 2002 . . . . . 5,546,795 55 30,566 24,332 (819) (5) 54,129Comprehensive income:
Net loss . . . . . . . . . . . . . . . . . . . — — — (2,533) — — (2,533)Foreign currency translation
Adjustments . . . . . . . . . . . . . . — — — — 803 — 803
Total comprehensive loss . . . . . . (1,730)Issuance of common stock pursuant
to Director Plan . . . . . . . . . . . . . . . 3,604 1 25 — — — 26Issuance of common stock pursuant
to exercise of options, net of tax . . 4,475 — 45 — — — 45Unearned compensation
amortization . . . . . . . . . . . . . . . . . . — — — — — 1 1
Balance at September 30, 2003 . . . . . 5,554,874 56 30,636 21,799 (16) (4) 52,471Comprehensive income:
Net income . . . . . . . . . . . . . . . . . — — — 5,953 — — 5,953Foreign currency translation
Adjustments . . . . . . . . . . . . . . — — — — 293 — 293
Total comprehensive income . . . 6,246Issuance of common stock pursuant
to Director Plan . . . . . . . . . . . . . . . 2,121 — 38 — — — 38Termination of restricted stock
grants . . . . . . . . . . . . . . . . . . . . . . . (250) — (4) — — — (4)Issuance of common stock pursuant
to exercise of options, net of tax . . 31,415 — 445 — — — 445Unearned compensation
amortization . . . . . . . . . . . . . . . . . . — — — — — 4 4
Balance at September 30, 2004 . . . . . 5,588,160 $ 56 $31,115 $27,752 $ 277 $ — $59,200
The accompanying notes are an integral part of the consolidated financial statements.
F-5

OYO Geospace Corporation and Subsidiaries
Consolidated Statements of Cash Flows(In thousands)
YEAR ENDED SEPTEMBER 30,
2004 2003 2002
Cash flows from operating activities:Net income (loss) . . . . . . . . . . . . . . . . . . . . . . . . . . . . . . . . . . . . . . . . . . . . . $ 5,953 $ (2,533) $ 1,119Adjustments to reconcile net income (loss) to net cash provided by
operating activities:Deferred income tax benefit . . . . . . . . . . . . . . . . . . . . . . . . . . . . . . . . . (1,013) (1,036) (1,381)Depreciation . . . . . . . . . . . . . . . . . . . . . . . . . . . . . . . . . . . . . . . . . . . . . 4,223 3,565 3,938Amortization . . . . . . . . . . . . . . . . . . . . . . . . . . . . . . . . . . . . . . . . . . . . . 739 702 649Stock-based compensation . . . . . . . . . . . . . . . . . . . . . . . . . . . . . . . . . . 4 1 137Impairment of assets . . . . . . . . . . . . . . . . . . . . . . . . . . . . . . . . . . . . . . — — 1,246Extraordinary gain, net of tax . . . . . . . . . . . . . . . . . . . . . . . . . . . . . . . . — — (686)Minority interest . . . . . . . . . . . . . . . . . . . . . . . . . . . . . . . . . . . . . . . . . . 26 20 88(Gain) loss on disposal of property, plant and equipment . . . . . . . . . . (156) 22 192Bad debt expense . . . . . . . . . . . . . . . . . . . . . . . . . . . . . . . . . . . . . . . . . 145 229 146Effects of changes in operating assets and liabilities:
Trade accounts and notes receivable . . . . . . . . . . . . . . . . . . . . . . (2,691) 2,377 (626)Inventories . . . . . . . . . . . . . . . . . . . . . . . . . . . . . . . . . . . . . . . . . . (2,525) (1,128) 7,622Prepaid expenses and other assets . . . . . . . . . . . . . . . . . . . . . . . . 377 (1,478) 262Accounts payable . . . . . . . . . . . . . . . . . . . . . . . . . . . . . . . . . . . . . 636 (1,246) (1,030)Accrued expenses and other . . . . . . . . . . . . . . . . . . . . . . . . . . . . . 1,923 (995) (658)Deferred revenue . . . . . . . . . . . . . . . . . . . . . . . . . . . . . . . . . . . . . 178 (8) (4,713)Income tax payable . . . . . . . . . . . . . . . . . . . . . . . . . . . . . . . . . . . . 559 (1,094) 241
Net cash provided by (used in) operating activities . . . . . . . 8,378 (2,602) 6,546
Cash flows from investing activities:Proceeds from the sale of property, plant and equipment . . . . . . . . . . . . . . 1,241 33 616Capital expenditures . . . . . . . . . . . . . . . . . . . . . . . . . . . . . . . . . . . . . . . . . . . (2,506) (6,045) (4,729)Purchase of intangible assets . . . . . . . . . . . . . . . . . . . . . . . . . . . . . . . . . . . . — — (2,267)Business acquisitions, net of cash acquired . . . . . . . . . . . . . . . . . . . . . . . . . — (164) 913
Net cash used in investing activities . . . . . . . . . . . . . . . . . . (1,265) (6,176) (5,467)
Cash flows from financing activities:Increase in notes payable to banks . . . . . . . . . . . . . . . . . . . . . . . . . . . . . . . . 14,163 32,570 29,266Principal payments on notes payable to banks . . . . . . . . . . . . . . . . . . . . . . . (19,449) (24,706) (29,812)Proceeds from exercise of stock options . . . . . . . . . . . . . . . . . . . . . . . . . . . 400 39 77
Net cash provided by (used in) financing activities . . . . . . . (4,886) 7,903 (469)
Effect of exchange rate changes on cash . . . . . . . . . . . . . . . . . . . . . . . . . . . . . . . 241 8 46
Increase (decrease) in cash and cash equivalents . . . . . . . . . . . . . . . . . . . . . . . . . 2,468 (867) 656Cash and cash equivalents, beginning of period . . . . . . . . . . . . . . . . . . . . . . . . . 671 1,538 882
Cash and cash equivalents, end of period . . . . . . . . . . . . . . . . . . . . . . . . . . . . . . $ 3,139 $ 671 $ 1,538
The accompanying notes are an integral part of the consolidated financial statements.
F-6

OYO Geospace Corporation and Subsidiaries
Notes to Consolidated Financial Statements
1. Summary of Significant Accounting Policies:
The Company
OYO Geospace Corporation (“OYO”) designs, manufactures and distributes instruments and equipmentused primarily in the acquisition and processing of seismic data for the oil and gas industry. OYO alsomanufactures and distributes thermal imaging equipment and dry thermal film products to the commercialgraphics industry. As of September 30, 2004, OYO Corporation U.S.A. (“OYO USA”) owned approximately51.0% of OYO’s common stock. OYO USA is a wholly owned subsidiary of OYO Corporation, a Japanesecorporation (“OYO Japan”).
OYO and its subsidiaries are referred to collectively as the “Company”. The significant accounting policiesfollowed by the Company are summarized below.
Basis of Presentation
The accompanying financial statements present the consolidated financial position, results of operations andcash flows of the Company in accordance with generally accepted accounting principles. All intercompanybalances and transactions have been eliminated.
Use of Estimates
The preparation of financial statements in conformity with accounting principles generally accepted in theUnited States of America requires the use of estimates and assumptions that affect the amounts reported in thefinancial statements and accompanying notes. The Company considers many factors in selecting appropriateoperational and financial accounting policies and controls, and in developing the estimates and assumptions thatare used in the preparation of these financial statements. The Company continually evaluates its estimates,including those related to bad debt reserves, inventory obsolescence reserves, self-insurance reserves, productwarranty reserves, long-lived assets, intangible assets and deferred income tax assets. The Company bases itsestimates on historical experience and various other factors that are believed to be reasonable under thecircumstances. Actual results may differ from these estimates under different conditions or assumptions.
Cash and Cash Equivalents
The Company considers all highly liquid debt securities purchased with an original or remaining maturity atthe time of purchase of three months or less to be cash equivalents. As of September 30, 2004 and 2003, theCompany included bank overdrafts of $0.5 million and $0.1 million, respectively in accounts payable.
Concentrations of Credit Risk
The Company maintains its cash in bank deposit accounts that, at times, exceed federally insured limits.Management believes that the financial strength of the financial institutions holding such deposits minimizes thecredit risk of such deposits. The Company anticipates that the existing cash balance as of September 30, 2004,cash flows from operations and borrowing availability under a new credit facility will provide adequate cashflows and liquidity for fiscal year 2005. Management expects that the liquidity from such amounts and cashflows from operations in fiscal year 2005 will satisfy the capital expenditures, scheduled debt payments, andoperational budgets of the Company for the upcoming year.
F-7

OYO Geospace Corporation and Subsidiaries
Notes to Consolidated Financial Statements—(Continued)
The Company sells products to customers throughout the United States and various foreign countries. TheCompany’s normal credit terms for trade receivables are 30 days. In certain situations, credit terms may beextended to 60 days or longer. The Company performs ongoing credit evaluations of its customers and generallydoes not require collateral for its trade receivables. Additionally, the Company provides long-term financing inthe form of promissory notes when competitive conditions require such financing. In such cases, the Companymay require collateral. Allowances are recognized for potential credit losses.
The Company has a subsidiary located in Russia. Therefore, the Company’s financial results may beaffected by factors such as changes in foreign currency exchange rates, weak economic conditions in Russia orchanges in Russia’s political climate. The Company’s consolidated balance sheet at September 30, 2004 reflectedapproximately $2.3 million of net working capital related to its Russian subsidiary. This subsidiary both receivesits income and pays its expenses primarily in rubles. To the extent that transactions of this subsidiary are settledin rubles, a devaluation of the ruble versus the U.S. dollar could reduce any contribution from the Company’sRussian subsidiary to its consolidated results of operations as reported in U.S. dollars. The Company does nothedge the market risk with respect to its operations in Russia; therefore, such risk is a general and unpredictablerisk of future disruptions in the valuation of Russian rubles versus U.S. dollars to the extent such disruptionsresult in any reduced valuation of the Russian subsidiary’s net working capital or future contributions to itsconsolidated results of operations.
Inventories
The Company records a write-down of its inventory when the cost basis of any manufactured product,including any estimated future costs to complete the manufacturing process, exceeds its net realizable value.Inventories are stated at the lower of cost (as determined by the first-in, first-out method) or market value.
Prepaid Expenses and Other Assets
Prepaid expenses and other current assets includes prepayments for insurance and inventory purchases,assets held for sale, manufacturing supplies and other current assets. At September 30, 2004 the Company hadsurplus land and building held for sale with a net book value of $1.1 million.
Property, Plant and Equipment and Rental Equipment
Property, plant and equipment and rental equipment are stated at cost. Depreciation expense is calculatedusing the straight-line method over the following estimated useful lives:
Years
Rental equipment . . . . . . . . . . . . . . . . . . . . . . . . . . . . . . . . . . . . . . . . . . . . . . . . . . . . . 3-5Property, plant and equipment:
Machinery and equipment . . . . . . . . . . . . . . . . . . . . . . . . . . . . . . . . . . . . . . . . . . 3-15Buildings . . . . . . . . . . . . . . . . . . . . . . . . . . . . . . . . . . . . . . . . . . . . . . . . . . . . . . . 25-40Other . . . . . . . . . . . . . . . . . . . . . . . . . . . . . . . . . . . . . . . . . . . . . . . . . . . . . . . . . . 5-10
Expenditures for renewals and betterments are capitalized. Repairs and maintenance are charged to expenseas incurred. The cost and accumulated depreciation of assets sold or otherwise disposed of are removed from theaccounts and any gain or loss thereon is reflected in the statement of operations.
F-8

OYO Geospace Corporation and Subsidiaries
Notes to Consolidated Financial Statements—(Continued)
Patents
Patents are amortized over the life of the patent or the estimated life of the patent, whichever is shorter.Intellectual property is being amortized using the straight-line method over five years. Patent amortizationexpense was approximately $0.2 million during fiscal years 2004, 2003 and 2002. Intellectual propertyamortization expense was approximately $0.5 million, $0.4 million, and $0.2 million during fiscal years 2004,2003 and 2002, respectively. The estimated amortization for the five succeeding years is approximately $0.7million, $ 0.7 million, $0.5 million, $0.2 million and $0.2 million for the years ended September 30, 2005, 2006,2007, 2008, and 2009, respectively.
Impairment of Long-lived Assets
Property, plant and equipment and goodwill are reviewed for impairment whenever an event or change incircumstances indicates the carrying amount of an asset or group of assets may not be recoverable. Theimpairment review includes comparison of future cash flows expected to be generated by the asset or group ofassets with the associated assets’ carrying value. If the carrying value of the asset or group of assets exceeds theexpected future cash flows (undiscounted and without interest changes), an impairment loss is recognized to theextent that the carrying amount of the asset exceeds its fair value.
Goodwill
Goodwill represents the excess of the purchase price of purchased businesses over the estimated fair valueof the acquired business’ net assets. Under SFAS 142, goodwill and intangible assets with indefinite lives are nolonger amortized but are reviewed for impairment. Intangible assets that are not deemed to have indefinite liveswill continue to be amortized over their useful lives; however, no maximum life applies. The Company adoptedthe provisions of SFAS 142 effective October 1, 2002. In accordance with the provisions of SFAS 142, theCompany no longer records goodwill amortization expense. Adoption of SFAS 142 resulted in a $165,000reduction of amortization expense for the fiscal years ended September 30, 2004 and September 30, 2003. TheCompany will continue to review the carrying value of goodwill and other long-lived assets to determine whetherthere has been an impairment since the date of acquisition. There was no impairment recognized upon theadoption of SFAS 142. The Company’s goodwill is related to prior acquisitions of manufacturers of seismicconnector products.
Other Assets
Other assets includes $1.0 million of long-term notes receivable. Monthly payments are scheduled to bereceived by the Company over the next two years.
Revenue Recognition
Revenue is primarily derived from the sale, and short-term rental under operating leases, of seismicinstruments and equipment and commercial graphics products. Sales revenues are generally recognized when theCompany’s products are shipped and title and risk of loss have passed to the customer. Rental revenues arerecognized as earned over the rental period. Rentals of the Company’s equipment generally range from dailyrentals to rental periods of up to six months or longer. Except for certain reservoir characterization products, theCompany’s products are generally sold without any customer acceptance provisions and the Company’s standardterms of sale do not allow customers to return products for credit. In circumstances where acceptance provisionsare significant, the revenue and related profit are deferred until such time as customer acceptance occurs. Most ofthe Company’s products do not require installation assistance from the Company or sophisticated instruction.
F-9

OYO Geospace Corporation and Subsidiaries
Notes to Consolidated Financial Statements—(Continued)
Research and Development Costs
The Company expenses research and development costs as incurred. Research and development costsinclude salaries, employee benefit costs, department supplies, and other related costs.
Product Warranties
The Company offers a standard product warranty obligating it to repair or replace equipment withmanufacturing defects. The Company maintains a reserve for future warranty costs based on historicalexperience or, in the absence of historical product experience, management’s estimates. Changes in the warrantyreserve are contained in the following table (in thousands):
Balance at the beginning of the period (October 1, 2003) . . . . . . . . . . . . . . . . . . . . . . $ 877Accruals for warranties issued during the period . . . . . . . . . . . . . . . . . . . . . . . . . . . . 484Accruals related to pre-existing warranties (including changes in estimates) . . . . . . . (476)Settlements made (in cash or in kind) during the period . . . . . . . . . . . . . . . . . . . . . . . 24
Balance at the end of the period (September 30, 2004) . . . . . . . . . . . . . . . . . . . . . . . . $ 909
Stock-Based Compensation
Employee stock plans are accounted for under the intrinsic value method of recognition and measurementprinciples as discussed in the provisions of APB Opinion No. 25, Accounting for Stock Issued to Employees, andrelated interpretations. The Company utilizes the Black-Scholes option valuation model to value stock optionsfor pro forma presentation of income and per share data as if the fair value based method in Statement ofFinancial Accounting Standards (“SFAS”) No. 123, “Accounting for Stock-Based Compensation”, had been usedto account for stock-based compensation.
Financial Instruments
Fair value estimates are made at discrete points in time based on relevant market information. Theseestimates may be subjective in nature and involve uncertainties and matters of significant judgment and,therefore, cannot be determined with precision. The Company believes that the carrying amounts of its financialinstruments, consisting of cash and cash equivalents, accounts and notes receivable, accounts payable and long-term debt, approximate the fair values of such items.
Foreign Currency Gains and Losses
The assets and liabilities of OYO’s foreign subsidiaries have been translated into U.S. dollars using theexchange rates in effect at the balance sheet date. Results of operations have been translated using the averageexchange rates during the year. Resulting translation adjustments have been recorded as a component ofaccumulated other comprehensive income (loss) in stockholders’ equity. Foreign currency transaction gains andlosses are included in the results of operations as they occur.
Derivatives
The Company records all derivatives on the balance sheet at fair value. Changes in derivative fair valueswill either be recognized in earnings as offsets to the changes in fair value of related hedged assets, liabilities andfirm commitments or for forecasted transactions, deferred and recorded as a component of accumulated other
F-10

OYO Geospace Corporation and Subsidiaries
Notes to Consolidated Financial Statements—(Continued)
comprehensive income until the hedged transactions occur and are recognized in earnings. Until September 30,2004, the Company purchased printheads from OYO Japan whereby such purchases were denominated inJapanese yen. The Company routinely attempted to hedge its currency exposure on these purchases by enteringinto foreign currency forward contracts with a bank. The purpose of entering into these forward hedge contractswas to eliminate variability of cash flows associated with foreign currency exchange rates on amounts payable inJapanese yen. The Company’s forward contracts with the bank were considered derivatives. The Company hasrecorded these foreign currency forward contracts on the balance sheet and marked them to fair value at eachreporting date. Resulting gains and losses are reflected in other income and deductions within the accompanyingconsolidated financials and were not material for the fiscal years ended September 30, 2004, 2003 and 2002. AtSeptember 30, 2004, the Company had no yen-denominated foreign currency forward contracts or yen-denominated accounts payable.
Shipping and Handling Costs
Amounts billed to a customer in a sales transaction related to reimbursable shipping and handling costs areincluded in revenues and the associated costs incurred by the Company for reimbursable shipping and handlingcosts are reported as an expense in cost of sales.
Income Taxes
The Company follows the liability method of accounting for income taxes whereby deferred tax assets andliabilities are determined based on the differences between the financial reporting and tax basis of assets andliabilities and are measured using the enacted tax rates and laws that will be in effect when the differences areexpected to reverse. The Company provides a valuation allowance, if necessary, to reduce deferred tax assets totheir estimated realizable value.
Recent Accounting Pronouncements
On November 25, 2002, the FASB issued FASB interpretation No. 45 (“FIN 45”), “Guarantor’s Accountingand Disclosure Requirements for Guarantees, Including Indirect Guarantees of Indebtedness of Others”, aninterpretation of FASB Statements No. 5, 57 and 107 and Rescission of FASB interpretation No. 34. FIN 45clarifies the requirements of FASB Statement No. 5, Accounting for Contingencies (FAS 5), relating to theguarantor’s accounting for, and disclosure of, the issuance of certain types of guarantees. The Company isimplementing the disclosure requirements of this standard the Company’s fiscal year 2004.
F-11

OYO Geospace Corporation and Subsidiaries
Notes to Consolidated Financial Statements—(Continued)
In December 2002, the FASB issued SFAS No. 148, “Accounting for Stock-Based Compensation andDisclosure—an amendment of FASB Statement No. 123”. This statement amends FASB Statement No. 123,Accounting for Stock-Based Compensation, to provide alternative transition methods for a voluntary change tothe fair value of accounting for stock-based employee compensation. In addition, this Statement amends thedisclosure requirements of FASB Statement No. 123 to require more prominent disclosures in both annual andinterim financial statements about the method of accounting for stock-based employee compensation and theeffect of the method used on reported results. At September 30, 2004, the Company had two stock-basedemployee compensation plans. The Company accounts for the plans under the recognition and measurementprinciples of APB Opinion No. 25, “Accounting for Stock Issued to Employees”, and related interpretations. Nostock-based employee compensation cost has been reflected in net income, as all options granted under thoseplans had an exercise price equal to the market value of the underlying common stock on the date of grant. Thefollowing table illustrates the effect on net income and earnings per share if the Company had applied the fairvalue recognition provisions of FASB Statement No. 123, Accounting for Stock-Based Compensation, to stock-based employee compensation.
Year Ended
September 30,2004
September 30,2003
September 30,2002
Net income (loss), as reported . . . . . . . . . . . . . . . . . . . . . . . . . . . . . . . $5,953 $(2,533) $1,119Deduct: Total stock-based employee compensation expense
determined under fair value method for all awards, net of relatedtax effects . . . . . . . . . . . . . . . . . . . . . . . . . . . . . . . . . . . . . . . . . . . . . (466) (443) (428)
Pro forma income (loss) . . . . . . . . . . . . . . . . . . . . . . . . . . . . . . . . . . . . $5,487 $(2,976) $ 691
Earnings (loss) per share:Basic-as reported . . . . . . . . . . . . . . . . . . . . . . . . . . . . . . . . . . . . . $ 1.07 $ (0.46) $ 0.20Basic-pro forma . . . . . . . . . . . . . . . . . . . . . . . . . . . . . . . . . . . . . . $ 0.98 $ (0.54) $ 0.12
Diluted-as reported . . . . . . . . . . . . . . . . . . . . . . . . . . . . . . . . . . . . $ 1.05 $ (0.46) $ 0.20Diluted-pro forma . . . . . . . . . . . . . . . . . . . . . . . . . . . . . . . . . . . . . $ 0.97 $ (0.54) $ 0.12
In March 2004, the FASB issued an exposure draft, “Share-Based Payments, an Amendment of FASBStatements No. 123 and 95”, which may eliminate the ability to account for share-based compensationtransactions using APB No. 25. In October 2004, the FASB delayed the effective date of this proposedpronouncement until June 2005. The Company will continue to monitor the rules and statements released by theFASB in regard to how the Company accounts for stock-based employee compensation and related disclosure.
For a further discussion of the Company’s stock-based employee compensation plans, see Note 11 to theConsolidated Financial Statements.
In April 2003, the FASB issued SFAS No. 149, “Amendment of Statement 133 on Derivative Instrumentsand Hedging Activities”. Statement 149 amends and clarifies financial accounting and reporting of derivativeinstruments, including certain derivative instruments embedded in other contracts (collectively referred to asderivatives) and for hedging activities under SFAS 133, “Accounting for Derivative Instruments and HedgingActivities”. This statement is effective for contracts entered into or modified after June 30, 2003, except forcertain hedging relationships designated after June 30, 2003. The adoption of SFAS No. 149 did not have amaterial effect on the Company’s financial position or results of operations.
In May 2003, the FASB issued SFAS No. 150, “Accounting for Certain Financial Instruments withCharacteristics of both Liabilities and Equity” This statement establishes standards for how an issuer classifies
F-12

OYO Geospace Corporation and Subsidiaries
Notes to Consolidated Financial Statements—(Continued)
and measures certain financial instruments with characteristics of both liabilities and equity. It requires afinancial instrument within its scope to be classified as a liability. It is effective for financial instruments enteredinto or modified after May 31, 2003, and otherwise is effective at the beginning of the first interim periodbeginning after June 15, 2003. These effective dates are not applicable to the provisions of paragraphs 9 and 10of SFAS 150 as they apply to mandatorily redeemable noncontrolling interests, as the FASB has delayed theseprovisions indefinitely. The adoption of this statement had no initial impact on the Company’s results ofoperations or financial position.
In December 2003, the SEC issued Staff Accounting Bulletin No. 104, “Revenue Recognition” (“SAB104”), which supercedes SAB 101, “Revenue Recognition in Financial Statements”. SAB 104’s primary purposeis to rescind accounting guidance contained within SAB 101 related to multiple element revenue arrangements,which was superceded as a result of the issuance of EITF 00-21, “Accounting for Revenue Arrangements withMultiple Deliverables”. While the wording of SAB 104 has changed to reflect the issuance of EITF 00-21, therevenue recognition principles of SAB 101 remain largely unchanged by the issuance of SAB 104. The adoptionof SAB 104 did not have a material effect on the Company’s financial position or the Company’s results ofoperations.
In November 2004, the FASB issued SFAS No. 151, “Inventory Costs—an amendment of ARB 43, Chapter4”. This statement amends the guidance in ARB No. 43, Chapter 4, “Inventory Pricing”, to clarify the accountingfor abnormal amounts of idle facility expense, freight, handling costs, and wasted material. This statementrequires that those items be recognized as current-period charges. In addition, this statement requires thatallocation of fixed production overheads to the costs of conversion be based on the normal capacity of theproduction facilities. The Company will adopt this statement, effective October 1, 2005. The Company iscurrently evaluating the effect of the adoption of this statement on the Company’s results of operations orfinancial position.
2. Acquisitions:
Effective November 8, 2001, the Company increased its equity ownership from 44% to 85% in OYO-GEOImpulse International, LLC (“OYO-GEO Impulse”), a Russian joint venture formed in 1990 with GeophyspriborUfa Production Association (“Geophyspribor”), Bank Vostock and Chori Co., Ltd. (“Chori”). Since thistransaction, the financial results of OYO-GEO Impulse have been consolidated with those of OYO Geospace. Atthat time, Geophyspribor and Chori Co., Ltd. continued as minority shareholders of OYO-GEO Impulse.
In exchange for the additional equity ownership, the Company forgave a debt of $1.2 million owed to it byOYO-GEO Impulse. This debt and a related equity investment had been written-off in 1994 due to prior concernsregarding realization of those assets and, therefore, such debt and investment had no carrying value in theCompany’s financial statements. In connection with this acquisition, in fiscal year 2002, the Company recordedan extraordinary gain of $686,000, net of income taxes of $85,000. This extraordinary gain represents thenegative goodwill that resulted from the acquisition of the additional equity interest of OYO-GEO Impulse.
On September 12, 2003, the Company purchased for $164,000 an additional 12% ownership interest inOYO-GEO Impulse from Geophyspribor, thereby increasing its ownership interest to 97%. Chori continues as a3% minority shareholder of OYO-GEO Impulse.
Based in Ufa, Bashkortostan, Russia, OYO-GEO Impulse has been in operation since 1990, manufacturinggeophone sensors for the Russian seismic marketplace. At September 30, 2004, OYO-GEO Impulse operated in a120,000 square foot facility in Ufa and employed approximately 374 people. The Company’s seismic equipmentmanufacturing subsidiary in Houston is managing the expansion of OYO-GEO Impulse’s operations to produceand sell international-standard sensors and additional seismic related products.
F-13

OYO Geospace Corporation and Subsidiaries
Notes to Consolidated Financial Statements—(Continued)
The allocation of the purchase price of the fiscal year 2002 acquisition of OYO-GEO Impulse, includingrelated direct costs, and a reconciliation of the purchase price to the cash used for the acquisition is as follows (inthousands):
Fair values of assets and liabilities:Net current assets, excluding cash acquired . . . . . . . . . . . . . . . . . . . . . . . . . . . $ 1,134Net current liabilities . . . . . . . . . . . . . . . . . . . . . . . . . . . . . . . . . . . . . . . . . . . . (1,186)Minority interest . . . . . . . . . . . . . . . . . . . . . . . . . . . . . . . . . . . . . . . . . . . . . . . . (175)Negative goodwill . . . . . . . . . . . . . . . . . . . . . . . . . . . . . . . . . . . . . . . . . . . . . . . (686)
Cash provided by business acquisition . . . . . . . . . . . . . . . . . . . . . . . . . . . . . . . . . . . $ (913)
On September 30, 2004, the Company acquired the thermal printhead production assets of GraphtecCorporation located in Yokohama, Japan, (“Graphtec”) for approximately $1.8 million which was paid in cash onOctober 1, 2004. Prior to that date, Graphtec was the only supplier of wide format thermal printheads that theCompany used to manufacture its wide format thermal imaging equipment. If printhead sales exceed certainestablished levels the Company may owe a royalty to Graphtec annually. The Company is unable to determine atthis date the amount of those royalties and if those royalties will be payable.
The consolidated results of operations of the Company include the results of OYO-GEO Impulse from thedate of acquisition. The revenues and net income of OYO-GEO Impulse prior to the acquisition date was notmaterial to the Company’s consolidated results of operations and, therefore, no proforma consolidated results ofoperations as if the acquisition had occurred at the beginning of the year has been presented.
3. Inventories:
Inventories consisted of the following (in thousands):
AS OFSEPTEMBER 30,
2004 2003
Finished goods . . . . . . . . . . . . . . . . . . . . . . . . . . . . . . . . . . . . . . . . . . . . $ 5,471 $ 4,900Work in progress . . . . . . . . . . . . . . . . . . . . . . . . . . . . . . . . . . . . . . . . . . 3,940 3,241Raw materials . . . . . . . . . . . . . . . . . . . . . . . . . . . . . . . . . . . . . . . . . . . . 17,627 15,841Obsolescence reserve . . . . . . . . . . . . . . . . . . . . . . . . . . . . . . . . . . . . . . (1,632) (1,053)
$25,406 $22,929
Inventory obsolescence expense was approximately $0.7 million, $0.2 million and $1.0 million during fiscalyears 2004, 2003 and 2002, respectively.
4. Notes Receivable:
At September 30, 2004 and 2003, the Company had outstanding notes receivable from customers in theamount of $2.9 million (including $1.0 million classified as long-term) and $3.4 million (including $1.3 millionclassified as long-term), respectively. The notes receivable outstanding at September 30, 2004 bear interest atrates up to 10.0% and are collectible in monthly installments through September 2006. At September 30, 2004and 2003, there was no allowance for doubtful accounts deemed necessary for the Company’s notes receivable.The Company’s annual maturities of notes receivable will be approximately $2.0 million, $0.9 million and $0.1million in fiscal years ended September 30, 2005, 2006, and 2007, respectively.
F-14

OYO Geospace Corporation and Subsidiaries
Notes to Consolidated Financial Statements—(Continued)
5. Rental Equipment:
Rental equipment consisted of the following (in thousands):
AS OFSEPTEMBER 30,
2004 2003
Rental equipment, primarily geophones and related products . . . . . . . . $10,073 $ 8,198Less accumulated depreciation . . . . . . . . . . . . . . . . . . . . . . . . . . . . . . . (8,157) (6,023)
$ 1,916 $ 2,175
Rental equipment depreciation expense was $2.1 million, $0.8 million and $1.0 million in fiscal years 2004,2003 and 2002, respectively.
6. Property, Plant and Equipment:
Property, plant and equipment consisted of the following (in thousands):
AS OFSEPTEMBER 30,
2004 2003
Land . . . . . . . . . . . . . . . . . . . . . . . . . . . . . . . . . . . . . . . . . . . . . . . . . . $ 3,209 $ 3,366Buildings . . . . . . . . . . . . . . . . . . . . . . . . . . . . . . . . . . . . . . . . . . . . . . . 11,519 12,205Machinery and equipment . . . . . . . . . . . . . . . . . . . . . . . . . . . . . . . . . 18,849 17,872Furniture and fixtures . . . . . . . . . . . . . . . . . . . . . . . . . . . . . . . . . . . . . 1,352 1,580Transportation equipment . . . . . . . . . . . . . . . . . . . . . . . . . . . . . . . . . . 152 212Tools and molds . . . . . . . . . . . . . . . . . . . . . . . . . . . . . . . . . . . . . . . . . 1,665 1,679Leasehold improvements . . . . . . . . . . . . . . . . . . . . . . . . . . . . . . . . . . 4 943Construction in progress . . . . . . . . . . . . . . . . . . . . . . . . . . . . . . . . . . . 46 418
36,796 38,275Accumulated depreciation . . . . . . . . . . . . . . . . . . . . . . . . . . . . . . . . . (15,375) (15,896)
$ 21,421 $ 22,379
Property, plant and equipment depreciation expense was $2.1 million, $2.8 million and $3.0 million in fiscalyears 2004, 2003 and 2002, respectively. The Company had fully depreciated assets of $7.6 million and $7.7million in use at September 30, 2004 and 2003, respectively. On September 30, 2004, the Company purchasedfor $1.4 million certain thermal printhead production fixed assets from Graphtec with an estimated useful life of5 years.
In September 2003, the Company purchased a facility located at 7007 Pinemont Drive in Houston, Texas(the “Pinemont Facility”) having 208,000 square feet, which houses the Company’s headquarters and all U.S.manufacturing, engineering, selling, marketing, and administrative activities. The Pinemont Facility waspurchased at a cost of $3.8 million, $3.0 million of which was financed by a 7-year promissory note and securedby a mortgage on the property. The Pinemont Facility consolidated into one location all manufacturing,engineering, selling, marketing and administrative activities for the Company in the United States. The PinemontFacility also serves as the Company’s headquarters. This consolidation was a critical element in the Company’sstrategic restructuring initiative aimed at making its operations more efficient in the face of continuing pricingpressure on the Company’s traditional seismic businesses. At September 30, 2004, the Company was seeking tosell a facility in Stafford, Texas having a carrying value of $1.1 million. The Company
F-15

OYO Geospace Corporation and Subsidiaries
Notes to Consolidated Financial Statements—(Continued)
has another vacant facility located in Houston, Texas having a net book value of $4.7 million which theCompany expects to use in its operations. If the Company does not use this property, it may need to record animpairment charge if it is unable to lease the property to a third party.
7. Other Assets:
In April 2002, the Company purchased for $2.3 million certain intellectual property rights from theCompany’s then primary supplier of dry thermal film (the “Former Primary Film Supplier”). Such purchase gavethe Company exclusive ownership of all technology used by the Former Primary Film Supplier to manufacturedry thermal film used in the thermal imaging equipment the Company manufactures. Such purchase includedtechnology then existing and any dry thermal film technology thereafter developed by the Former Primary FilmSupplier for use in the Company’s equipment. The Company also entered into an amended supply agreementpursuant to which the Former Primary Film Supplier agreed to provide the Company with the dry thermal film.In connection with the purchase, the Company agreed to license the technology to the Former Primary FilmSupplier on a perpetual basis so long as it could meet predefined quality and delivery requirements. If the FormerPrimary Film Supplier could not meet such requirements, the agreement provided the Company with the right touse the technology itself or to license the technology to any third party to manufacture dry thermal film.
On July 3, 2002, the Former Primary Film Supplier filed a Chapter 11 reorganization petition in FederalBankruptcy Court for the Western District of New York. At the date of such bankruptcy filing, the Company had$3.4 million of long-term assets carried on its balance sheet as a result of the prior transactions with the FormerPrimary Film Supplier (including the $2.3 million investment in intellectual property acquired from the FormerPrimary Film Supplier described above).
Shortly thereafter, the Former Primary Film Supplier ceased providing the Company with dry thermal film.As a result, the Company is currently purchasing a large quantity of dry thermal film from an alternative filmsupplier (the “Other Film Supplier”), and the Company is using the technology it purchased from the FormerPrimary Film Supplier to manufacture dry thermal film internally.
As a result of the bankruptcy filing by the Former Primary Film Supplier, the Company recorded a $1.2million charge in its third quarter of fiscal year 2002 due to the ultimate uncertainty of realization of value oncertain assets, particularly certain prepaid purchase benefits and other benefits under the amended supplycontract with the Former Primary Film Supplier. The Company does not believe there has been any impairmentin the value of the intellectual property it acquired from the Former Primary Film Supplier because of theCompany’s ability to utilize the intellectual property to have thermal film manufactured either internally orelsewhere.
On December 10, 2002, the Company received a notice of claim, in connection with the Former PrimaryFilm Supplier’s bankruptcy, for alleged preferential payments made by the Former Primary Film Supplier to it inthe period before filing of the bankruptcy proceeding in the approximate amount of $259,000. On July 7, 2004,an amended claim was filed against the Company and the amount of the alleged preferential payments made bythe Former Primary Film Supplier was increased to approximately $895,000. The Company intends to vigorouslydefend against such claim under the overall circumstances of its relationship with the Former Primary FilmSupplier. At present the Company does not know whether it will make any claims against the Former PrimaryFilm Supplier and the Company is unable to predict whether any additional claims will be made against it inconnection with the Former Primary Film Supplier’s bankruptcy proceeding as to any aspect of the Company’srelationship with such Former Primary Film Supplier. The Company is unable at this time to predict the outcomeand effects of this situation. The Company had, nevertheless, made a provision for the initial claim made by theFormer Primary Film Supplier and the Company believes that such provision is adequate at this time, althoughthe Company is unable to make such predictions with any certainty.
F-16

OYO Geospace Corporation and Subsidiaries
Notes to Consolidated Financial Statements—(Continued)
8. Notes Payable and Long-Term Debt:
Notes payable and long-term debt consisted of the following (in thousands):
AS OFSEPTEMBER 30,
2004 2003
Mortgage note payable, due in monthly installments of $31 with interest at7.0% through January 2014, collateralized by certain land and buildinghaving a net book value of $4.7 million . . . . . . . . . . . . . . . . . . . . . . . . . . . . . . $ 2,582 $ 2,771
Mortgage note payable, due in monthly installments of $9 with interest at 7.6%through July 2013, collateralized by certain land and building having a netbook value of $1.1 million . . . . . . . . . . . . . . . . . . . . . . . . . . . . . . . . . . . . . . . . . 718 773
Mortgage note payable, due in monthly installments of $10 with interest at4.0% through September 2010, with remaining principal and interest dueSeptember 2010, collateralized by certain land and building having a netbook value of $5.0 million . . . . . . . . . . . . . . . . . . . . . . . . . . . . . . . . . . . . . . . . . 2,925 3,040
OYO-GEO Impulse note payable, with interest at 18.0%, due December2003 . . . . . . . . . . . . . . . . . . . . . . . . . . . . . . . . . . . . . . . . . . . . . . . . . . . . . . . . . . — 113
Working capital line of credit . . . . . . . . . . . . . . . . . . . . . . . . . . . . . . . . . . . . . . . . 609 5,424
6,834 12,121Less current portion . . . . . . . . . . . . . . . . . . . . . . . . . . . . . . . . . . . . . . . . . . . . . . . . (1,029) (5,889)
$ 5,805 $ 6,232
On November 22, 2004, several of the Company’s subsidiaries entered into a new credit agreement (the“New Credit Agreement”) with a bank. Under the New Credit Agreement, the Company’s borrower subsidiariescan borrow up to $15.0 million secured principally by their accounts and notes receivable and inventories. TheNew Credit Agreement expires on November 21, 2007. Borrowings under the New Credit Agreement are subjectto borrowing base restrictions based on levels of eligible accounts receivable, notes receivable and inventories.The New Credit Agreement limits the incurrence of additional indebtedness, requires the maintenance of certainfinancial amounts, restricts the Company’s and the borrower subsidiaries’ ability to pay dividends and containsother covenants customary in agreements of this type. At December 6, 2004 there were borrowings of $1.9million under the New Credit Agreement, and additional borrowings available of $13.1 million. The interest ratefor borrowing under the New Credit Agreement is, at the Company’s option, a discounted prime rate or a LIBORbased rate.
Prior to entering in to the New Credit Agreement, several of the Company’s subsidiaries were a party to acredit agreement (the “Previous Credit Agreement”) with a bank, and could borrow up to $10.0 million securedprincipally by the subsidiaries’ accounts receivable and inventories. The Previous Credit Agreement, asamended, was scheduled to expire on February 27, 2005, however this agreement was terminated on November22, 2004 and replaced by the New Credit Agreement. Borrowings under the Previous Credit Agreement weresubject to borrowing base restrictions based on levels of eligible accounts receivable and inventories. ThePrevious Credit Agreement limited the incurrence of additional indebtedness, required the maintenance of certainfinancial amounts, restricted the Company’s and the borrower subsidiaries’ ability to pay dividends andcontained other covenants customary in agreements of this type. As of September 30, 2004, there wereborrowings of $0.6 million outstanding under the Previous Credit Agreement, and additional borrowingsavailable under the Previous Credit Agreement of $9.2 million. The Company’s borrowing interest rate was, at itsoption, the bank’s prime rate or a LIBOR based rate.
F-17

OYO Geospace Corporation and Subsidiaries
Notes to Consolidated Financial Statements—(Continued)
The Company anticipates that the existing cash balance as of September 30, 2004, cash flows fromoperations and borrowing availability under its New Credit Agreement will satisfy the capital expenditures,scheduled debt payments, and operational budgets of the Company for the upcoming fiscal year.
The Company’s long-term debt will mature as follows (in thousands):
YEAR ENDING SEPTEMBER 30,
2005 . . . . . . . . . . . . . . . . . . . . . . . . . . . . . . . . . . . . . . . . . . . . . . . . . . . . . . . . . . . . . . $1,0292006 . . . . . . . . . . . . . . . . . . . . . . . . . . . . . . . . . . . . . . . . . . . . . . . . . . . . . . . . . . . . . . 4452007 . . . . . . . . . . . . . . . . . . . . . . . . . . . . . . . . . . . . . . . . . . . . . . . . . . . . . . . . . . . . . . 4722008 . . . . . . . . . . . . . . . . . . . . . . . . . . . . . . . . . . . . . . . . . . . . . . . . . . . . . . . . . . . . . . 5002009 . . . . . . . . . . . . . . . . . . . . . . . . . . . . . . . . . . . . . . . . . . . . . . . . . . . . . . . . . . . . . . 531Thereafter . . . . . . . . . . . . . . . . . . . . . . . . . . . . . . . . . . . . . . . . . . . . . . . . . . . . . . . . . . 3,857
$6,834
9. Accrued Expenses and Other:
Accrued expenses consisted of the following (in thousands):
AS OFSEPTEMBER 30,
2004 2003
Employee bonuses . . . . . . . . . . . . . . . . . . . . . . . . . . . . . . . . . . . . . . . . . . . $1,180 $ 17Product warranty . . . . . . . . . . . . . . . . . . . . . . . . . . . . . . . . . . . . . . . . . . . . 909 877Compensated absences . . . . . . . . . . . . . . . . . . . . . . . . . . . . . . . . . . . . . . . 585 544Legal and professional fees . . . . . . . . . . . . . . . . . . . . . . . . . . . . . . . . . . . . 248 308Payroll . . . . . . . . . . . . . . . . . . . . . . . . . . . . . . . . . . . . . . . . . . . . . . . . . . . . 468 312Property taxes . . . . . . . . . . . . . . . . . . . . . . . . . . . . . . . . . . . . . . . . . . . . . . 749 723Medical claims . . . . . . . . . . . . . . . . . . . . . . . . . . . . . . . . . . . . . . . . . . . . . 200 225Other . . . . . . . . . . . . . . . . . . . . . . . . . . . . . . . . . . . . . . . . . . . . . . . . . . . . . 1,499 752
Accrued expenses and other . . . . . . . . . . . . . . . . . . . . . . . . . . . . . . . . . . . $5,838 $3,758
The Company is self-insured for certain losses related to employee medical claims. The Company haspurchased stop-loss coverage for individual claims in excess of $75,000 per claimant per year in order to limit itsexposure to any significant levels of employee medical claims. Self-insured losses are accrued based on theCompany’s historical experience and on estimates of aggregate liability for uninsured claims incurred usingcertain actuarial assumptions followed in the insurance industry.
10. Employee Benefits:
The Company’s employees are participants in the OYO Geospace Corporation Employee’s 401(k)Retirement Plan (the “Plan”), which covers substantially all eligible employees in the United States. The Plan is aqualified salary reduction plan in which all eligible participants may elect to have a percentage of theircompensation contributed to the Plan, subject to certain guidelines issued by the Internal Revenue Service. TheCompany’s share of discretionary matching contributions was approximately $0.3 million in each of fiscal years2004, 2003 and 2002.
The Company’s stock incentive plans in which employees may participate are discussed in Note 11 in theseConsolidated Financial Statements.
F-18

OYO Geospace Corporation and Subsidiaries
Notes to Consolidated Financial Statements—(Continued)
11. Stockholders’ Equity:
In September 1997, the board of directors and stockholders approved the 1997 Key Employee Stock OptionPlan (the “Employee Plan”), and, following an amendment thereto, reserved an aggregate of 875,000 shares ofcommon stock for issuance thereunder. In November 1997, the board of directors and stockholders approved theCompany’s 1997 Non-Employee Director Plan (the “Director Plan”) and reserved an aggregate of 75,000 sharesof common stock for issuance thereunder. At September 30, 2004, the shares of common stock available forgrant under the Employee Plan and Director Plan were 55,400 and 309, respectively.
Under the Employee Plan, the Company is authorized to issue nonqualified and incentive stock options topurchase common stock and restricted stock awards of common stock to key employees of the Company.Options have a term not to exceed ten years, with the exception of incentive stock options granted to employeesowning ten percent or more of the outstanding shares of common stock, which have a term not to exceed fiveyears. The exercise price of any option may not be less than the fair market value of the common stock on thedate of grant. In the case of incentive stock options granted to an employee owning ten percent or more of theoutstanding shares of common stock, the exercise price of such option may not be less than 110% of the fairmarket value of the common stock on the date of grant. Options vest over a four-year period commencing on thedate of grant in 25% annual increments. Under the Employee Plan, the Company may issue shares of restrictedstock to employees for no payment by the employee or for a payment below the fair market value on the date ofgrant. The restricted stock is subject to certain restrictions described in the Employee Plan, with no restrictionscontinuing for more than ten years from the date of the award.
The Company established the Director Plan pursuant to which options to purchase shares of common stockare granted annually to non-employee directors and pursuant to which one-half of the annual fees paid for theservices of such non-employee directors is paid in shares of common stock based on the fair market value thereofat the date of grant. Options granted under the Director Plan have a term of ten years. The exercise price of eachoption granted is the fair market value of the common stock on the date of grant. Options vest over a one-yearperiod commencing on the date of grant.
Effective November 5, 1999, the board of directors approved the OYO Geospace Corporation 1999 Broad-Based Option Plan (the “Broad-Based Plan”) and reserved an aggregate of 50,000 shares for issuance thereunder. Under the Broad-Based Plan, the Company is authorized to issue to all employees (except executiveofficers and employee directors) nonqualified stock options to purchase common stock of the Company. Theseoptions have a term not to exceed ten years. The exercise price of any broad-based option may not be less thanthe fair market value of the common stock on the date of grant. These options vest over a one-year periodcommencing on the date of grant. There were 17,400 shares available for grant under this plan at September 30,2004.
F-19

OYO Geospace Corporation and Subsidiaries
Notes to Consolidated Financial Statements—(Continued)
A summary of the activity with respect to stock options is as follows:
Shares
WeightedAverageExercise
Price
Outstanding at October 1, 2001 . . . . . . . . . . . . . . . . . . . . . . . . . . . . . . 558,525 15.43Granted . . . . . . . . . . . . . . . . . . . . . . . . . . . . . . . . . . . . . . . . . . . . . 34,000 12.73Exercised . . . . . . . . . . . . . . . . . . . . . . . . . . . . . . . . . . . . . . . . . . . . (7,425) 10.61Forfeited . . . . . . . . . . . . . . . . . . . . . . . . . . . . . . . . . . . . . . . . . . . . (28,125) 15.66Expired . . . . . . . . . . . . . . . . . . . . . . . . . . . . . . . . . . . . . . . . . . . . . — —
Outstanding at September 30, 2002 . . . . . . . . . . . . . . . . . . . . . . . . . . . 556,975 15.32Granted . . . . . . . . . . . . . . . . . . . . . . . . . . . . . . . . . . . . . . . . . . . . . 227,500 7.54Exercised . . . . . . . . . . . . . . . . . . . . . . . . . . . . . . . . . . . . . . . . . . . . (4,475) 8.87Forfeited . . . . . . . . . . . . . . . . . . . . . . . . . . . . . . . . . . . . . . . . . . . . (50,700) 15.89Expired . . . . . . . . . . . . . . . . . . . . . . . . . . . . . . . . . . . . . . . . . . . . . — —
Outstanding at September 30, 2003 . . . . . . . . . . . . . . . . . . . . . . . . . . . 729,300 12.89Granted . . . . . . . . . . . . . . . . . . . . . . . . . . . . . . . . . . . . . . . . . . . . . 15,450 16.93Exercised . . . . . . . . . . . . . . . . . . . . . . . . . . . . . . . . . . . . . . . . . . . . (31,415) 12.74Forfeited . . . . . . . . . . . . . . . . . . . . . . . . . . . . . . . . . . . . . . . . . . . . (9,575) 12.35Expired . . . . . . . . . . . . . . . . . . . . . . . . . . . . . . . . . . . . . . . . . . . . . — —
Outstanding at September 30, 2004 . . . . . . . . . . . . . . . . . . . . . . . . . . . 703,760 12.98
The following table summarizes information about stock options outstanding and exercisable at September30, 2004:
Options Outstanding Options Exercisable
Range of Exercise Prices Shares
WeightedAverage
RemainingTerm
(in years)
WeightedAverageExercise
Price Shares
WeightedAverageExercise
Price
$ 6.81 to $13.49 . . . . . . . . . . . . . 284,160 7.8 $ 8.04 117,256 $ 8.55$13.50 to $19.99 . . . . . . . . . . . . . 394,700 4.8 15.72 379,563 15.66$20.00 to $27.63 . . . . . . . . . . . . . 24,900 4.9 25.86 24,150 25.98
703,760 6.0 12.98 520,969 14.54
As partial compensation for services of its outside directors, the Company issued 2,121 shares, 3,604 sharesand 1,890 shares of common stock to directors during fiscal years 2004, 2003 and 2002, respectively.
The amortization of unearned compensation related to stock-based employee compensation included in theconsolidated results of operations was $4,000, $1,000 and $0.1 million for each of fiscal years 2004, 2003 and2002, respectively, pursuant to the provisions of APB 25. Unearned compensation included in stockholders’equity related to unlapsed restrictions on grants of restricted stock was approximately $0, $4,000 and $5,000 asof September 30, 2004, 2003, and 2002 respectively.
Statement of Financial Accounting Standards No. 123 “Accounting for Stock-Based Compensation”(“SFAS 123”) requires that stock-based awards be measured and recognized at fair value. Adoption of the costrecognition provisions of SFAS 123 with respect to stock-based awards to employees is optional and theCompany decided not to elect those provisions. As a result, the Company continues to apply APB 25 and related
F-20

OYO Geospace Corporation and Subsidiaries
Notes to Consolidated Financial Statements—(Continued)
interpretations in accounting for the measurement and recognition of its employee stock-based awards. However,the Company is required to provide pro forma disclosure as if the cost recognition provisions under the fair valuemethod of SFAS 123 had been adopted. Under SFAS 123, compensation cost is measured at the grant date basedon the fair value of the awards and is recognized over the service period, which is usually the vesting period. Thefair value of options granted during the fiscal years ended September 30, 2004, 2003 and 2002 were estimatedusing the Black-Scholes option-pricing model with a dividend yield of zero for each of the three years. Thisestimation assumed risk-free interest rates of 4.5%, 4.2% and 3.8%; and expected volatility of 65%, 65% and54%; with an expected option term of 5 years for 2004, 2003 and 2002, respectively.
The weighted average fair values per share of stock-based award grants were as follows:
YEAR ENDEDSEPTEMBER 30,
2004 2003 2002
Options . . . . . . . . . . . . . . . . . . . . . . . . . . . . . . . . . . . . . . . . . . . . $17.19 $7.54 $ 6.44Director’s common stock . . . . . . . . . . . . . . . . . . . . . . . . . . . . . . 17.68 6.94 13.73
The pro forma disclosures as if the Company had adopted the cost recognition requirements of SFAS 123are presented below (in thousands, except per share amounts):
YEAR ENDED SEPTEMBER 30,
2004 2003 2002
Net income (loss):As reported . . . . . . . . . . . . . . . . . . . . . . . . . . . . . . . . . . . $5,953 $(2,533) $1,119Pro forma . . . . . . . . . . . . . . . . . . . . . . . . . . . . . . . . . . . . 5,487 (2,976) 691
Basic earnings (loss) per common share:As reported . . . . . . . . . . . . . . . . . . . . . . . . . . . . . . . . . . . $ 1.07 $ (0.46) $ 0.20Pro forma . . . . . . . . . . . . . . . . . . . . . . . . . . . . . . . . . . . . 0.98 (0.54) 0.12
Diluted earnings (loss) per common share:As reported . . . . . . . . . . . . . . . . . . . . . . . . . . . . . . . . . . . $ 1.05 $ (0.46) $ 0.20Pro forma . . . . . . . . . . . . . . . . . . . . . . . . . . . . . . . . . . . . 0.97 (0.54) 0.12
The effects of applying SFAS 123 in the above pro forma disclosure are not indicative of future amountssince the Company anticipates making awards in the future under the Employee Plan and Director Plan.
12. Income Taxes:
Components of income (loss) before income taxes, minority interest and extraordinary gain were as follows(in thousands):
YEAR ENDED SEPTEMBER 30,
2004 2003 2002
United States . . . . . . . . . . . . . . . . . . . . . . . . . . . . . . . . . . . . . $2,622 $(4,334) $(1,642)Foreign . . . . . . . . . . . . . . . . . . . . . . . . . . . . . . . . . . . . . . . . . . 3,310 421 1,306
$5,932 $(3,913) $ (336)
F-21

OYO Geospace Corporation and Subsidiaries
Notes to Consolidated Financial Statements—(Continued)
The provision (benefit) for income taxes consisted of the following (in thousands):
YEAR ENDED SEPTEMBER 30,
2004 2003 2002
Current:Federal . . . . . . . . . . . . . . . . . . . . . . . . . . . . . . . . . . . . . $ 82 $ (345) $ (169)Foreign . . . . . . . . . . . . . . . . . . . . . . . . . . . . . . . . . . . . . 879 (28) 769State . . . . . . . . . . . . . . . . . . . . . . . . . . . . . . . . . . . . . . . 5 10 (76)
966 (363) 524
Deferred:Federal . . . . . . . . . . . . . . . . . . . . . . . . . . . . . . . . . . . . . (890) (1,198) (1,430)Foreign . . . . . . . . . . . . . . . . . . . . . . . . . . . . . . . . . . . . . (123) 162 49State . . . . . . . . . . . . . . . . . . . . . . . . . . . . . . . . . . . . . . . — — —
(1,013) (1,036) (1,381)
$ (47) $(1,399) $ (857)
The differences between the effective tax rate reflected in the total provision (benefit) for income taxes andthe statutory federal tax rate of 34% were as follows (in thousands):
YEAR ENDED SEPTEMBER 30,
2004 2003 2002
Provision for U.S. federal income tax at statutory rate . . . . . $2,017 $(1,330) $ (114)Effect of foreign income taxes . . . . . . . . . . . . . . . . . . . . . . . (369) (10) (10)Tax benefit from export sales and other items . . . . . . . . . . . (907) (11) (410)State income taxes, net of federal income tax benefit . . . . . . 3 7 2Nondeductible expenses . . . . . . . . . . . . . . . . . . . . . . . . . . . . 33 28 104Resolution of prior years’ tax matters . . . . . . . . . . . . . . . . . . (24) (83) (429)Change in valuation allowance . . . . . . . . . . . . . . . . . . . . . . . (800) — —
$ (47) $(1,399) $ (857)
(0.8)% (35.8)% (255.1)%
F-22

OYO Geospace Corporation and Subsidiaries
Notes to Consolidated Financial Statements—(Continued)
Deferred income taxes under the liability method reflect the net tax effects of temporary differences betweenthe carrying amounts of assets and liabilities for financial reporting purposes and the amounts used for income taxpurposes. Significant components of the Company’s net deferred income tax asset were as follows (in thousands):
AS OFSEPTEMBER 30,
2004 2003
Deferred income tax assets:Allowance for doubtful accounts . . . . . . . . . . . . . . . . . . . . . . . . . . $ 168 $ 132Inventories . . . . . . . . . . . . . . . . . . . . . . . . . . . . . . . . . . . . . . . . . . . 826 617Capitalized research and development costs . . . . . . . . . . . . . . . . . 2,735 1,426Intangible assets . . . . . . . . . . . . . . . . . . . . . . . . . . . . . . . . . . . . . . . 145 —AMT carryforward . . . . . . . . . . . . . . . . . . . . . . . . . . . . . . . . . . . . . 291 272NOL carryforwards, tax credits and deferrals . . . . . . . . . . . . . . . . 688 2,255Accrued product warranty . . . . . . . . . . . . . . . . . . . . . . . . . . . . . . . 309 298Accrued compensated absences . . . . . . . . . . . . . . . . . . . . . . . . . . . 199 185Insurance and other reserves . . . . . . . . . . . . . . . . . . . . . . . . . . . . . 65 —
5,426 5,185Deferred income tax liabilities:
Property, plant and equipment and other . . . . . . . . . . . . . . . . . . . . (1,159) (1,283)
Net deferred income tax asset before valuation allowance . . . . . . . . . . 4,267 3,902Valuation allowance . . . . . . . . . . . . . . . . . . . . . . . . . . . . . . . . . . . . — (800)
Net deferred income tax asset . . . . . . . . . . . . . . . . . . . . . . . . . . . . . . . . . $ 4,267 $ 3,102
Deferred income taxes are reported as follows in the accompanying consolidated balance sheet (inthousands):
AS OFSEPTEMBER 30,
2004 2003
Current deferred income tax asset . . . . . . . . . . . . . . . . . . . . . . . . . . . . . . . . . . . . . . . $1,567 $1,233Noncurrent deferred income tax asset . . . . . . . . . . . . . . . . . . . . . . . . . . . . . . . . . . . . 2,700 1,869
$4,267 $3,102
During the fiscal year 2003, the Company filed amended tax returns for certain prior year periods and alsocompleted its fiscal 2002 federal tax filing. Upon completion of such filings, the Company identified $0.8 millionof foreign tax credits that were available for potential use in future periods. Based upon the industry environmentat that time, and considering the Company’s projections of future taxable income, the Company recorded avaluation allowance of approximately $0.8 million against the foreign tax credits.
In fiscal year 2004, the Company (i) realized a $3.6 million award received as a result of the successfulperformance of a reservoir characterization system it sold in fiscal year 2002, and (ii) increased its projections offuture domestic and foreign source taxable income due to improving market conditions. As a result, the Companyreversed the $0.8 million valuation allowance established in fiscal year 2003.
Under the liability method, a valuation allowance is provided when it is more likely than not that someportion or all of the deferred tax assets will not be realized. Based on the Company’s historical taxable incomerecord, and the expectation that the deductible temporary differences will reverse during periods in which theCompany generates net taxable income or during periods in which losses can be carried back to offset prior yeartaxes, management believes that the Company will realize the benefit of the net deferred income tax asset afterconsideration of the valuation allowance, if any.
F-23

OYO Geospace Corporation and Subsidiaries
Notes to Consolidated Financial Statements—(Continued)
The financial reporting bases of investments in foreign subsidiaries exceed their tax basis. A deferred taxliability is not recorded for this temporary difference because the investment is essentially permanent. A reversalof the Company’s plans to permanently invest in these foreign operations would cause the excess to becometaxable. At September 30, 2004 and 2003, the temporary difference related to undistributed earnings for which nodeferred taxes have been provided was approximately $4.8 million and $2.8 million, respectively.
From time to time the Company is the subject of audits by various tax authorities that can result in claimsand assessments and additional tax payments, penalties and interest. At present, there are no pending audits of theCompany’s past tax returns.
As of September 30, 2004, the Company had $0.5 million in foreign tax credit carryforwards available tooffset future federal income taxes payable. Such tax credits can be carried forward for up to nine years and beginto expire in fiscal year 2012. The Company has general business credits of $46,000 which begin to expire infiscal year 2013. The Company has alternative minimum tax carryforwards of $0.3 million that have noexpiration date.
13. Earnings Per Common Share:
Basic earnings per share are computed by dividing net earnings available to common stockholders by theweighted average number of common shares outstanding during the period. Diluted earnings per share isdetermined on the assumption that outstanding dilutive stock options have been exercised and the aggregateproceeds as defined were used to reacquire common stock using the average price of such common stock for theperiod.
The following table summarizes the calculation of net earnings and weighted average common shares andcommon equivalent shares outstanding for purposes of basic and diluted earnings per share (in thousands, exceptshare and per share amounts):
YEAR ENDED SEPTEMBER 30,
2004 2003 2002
Income (loss) before extraordinary item . . . . . . . . . . . . . . . $ 5,953 $ (2,533) $ 433Extraordinary gain, net of tax of $85 . . . . . . . . . . . . . . . . . — — 686
Net earnings (loss) available to common stockholders . . . . $ 5,953 $ (2,533) $ 1,119
Weighted average common shares and common shareequivalents:
Common shares . . . . . . . . . . . . . . . . . . . . . . . . . . . . . . 5,573,611 5,550,216 5,535,979Common share equivalents . . . . . . . . . . . . . . . . . . . . . 111,242 — 11,795
Total weighted average common shares and commonshare equivalents . . . . . . . . . . . . . . . . . . . . . . . . . . . . . . . 5,684,853 5,550,216 5,547,774
Basic earnings (loss) per share:Income (loss) before extraordinary gain . . . . . . . . . . . $ 1.07 $ (0.46) $ 0.08Extraordinary gain . . . . . . . . . . . . . . . . . . . . . . . . . . . . — — 0.12
Net income (loss) . . . . . . . . . . . . . . . . . . . . . . . . . . . . . . . . $ 1.07 $ (0.46) $ 0.20
Diluted earnings (loss) per share:Income (loss) before extraordinary gain . . . . . . . . . . . $ 1.05 $ (0.46) $ 0.08Extraordinary gain . . . . . . . . . . . . . . . . . . . . . . . . . . . . — — 0.12
Net income (loss) . . . . . . . . . . . . . . . . . . . . . . . . . . . . . . . . $ 1.05 $ (0.46) $ 0.20
F-24

OYO Geospace Corporation and Subsidiaries
Notes to Consolidated Financial Statements—(Continued)
Options totaling 19,260, 729,300 and 474,800 shares of common stock in fiscal years 2004, 2003 and 2002respectively, were not included in the calculation of weighted average shares for diluted earnings per sharebecause their effects were antidilutive.
14. Related Party Transactions:
Sales to OYO Japan and other affiliated companies were approximately $0.5 million, $0.3 million and $0.1million during fiscal years 2004, 2003 and 2002, respectively. Purchases of inventory and equipment from OYOJapan were approximately $0.8 million, $1.8 million and $0.6 million during fiscal years 2004, 2003 and 2002,respectively.
15. Commitments and Contingencies:
Operating Leases
The Company leases certain office equipment under noncancelable operating leases. In addition, throughDecember 31, 2003 the Company leased certain manufacturing facilities. The approximate future minimumrental commitments under noncancelable operating leases are as follows (in thousands):
YEAR ENDING SEPTEMBER 30,
2005 . . . . . . . . . . . . . . . . . . . . . . . . . . . . . . . . . . . . . . . . . . . . . . . . . . . . . . . . . . . . . . . . $ 92006 . . . . . . . . . . . . . . . . . . . . . . . . . . . . . . . . . . . . . . . . . . . . . . . . . . . . . . . . . . . . . . . . 32007 . . . . . . . . . . . . . . . . . . . . . . . . . . . . . . . . . . . . . . . . . . . . . . . . . . . . . . . . . . . . . . . . —
$ 12
Rent expense was approximately $0.2 million, $0.6 million, and $0.7 million for fiscal years 2004, 2003 and2002, respectively.
Legal Proceedings
From time to time the Company is a party to what it believes is routine litigation and proceedings that maybe considered as part of the ordinary course of its business. Legal expenses related to such matters are expensedas incurred. The Company is not aware of any current or pending litigation or proceedings that could have amaterial adverse effect on the Company’s results of operations, cash flows or financial condition, although theCompany continues to monitor developments in the bankruptcy proceeding by its Former Primary Film Supplierand the Former Primary Film Supplier’s existing claim against the Company described in Note 18.
16. Supplemental Cash Flow Information:
Supplemental cash flow information is as follows (in thousands):
YEAR ENDEDSEPTEMBER 30,
2004 2003 2002
Cash paid (refund received) for:Interest . . . . . . . . . . . . . . . . . . . . . . . . . . . . . . . . . . . . . . . . . . $ 215 $116 $ 585Income taxes . . . . . . . . . . . . . . . . . . . . . . . . . . . . . . . . . . . . . 309 199 (153)
Noncash investing and financing activities:Purchase of Graphtec assets and inventory . . . . . . . . . . . . . . . . . . 1,818 — —
Common stock issued pursuant to Employee and DirectorPlan . . . . . . . . . . . . . . . . . . . . . . . . . . . . . . . . . . . . . . . . . . 38 25 25
F-25

OYO Geospace Corporation and Subsidiaries
Notes to Consolidated Financial Statements—(Continued)
17. Segment and Geographic Information:
The Company reports two business segments: Seismic and Commercial Graphics. Certain summaryfinancial data for the Company’s business segments which was previously presented in prior periods has nowbeen reclassified to conform to the current year presentation. The Commercial Graphics business segmentprimarily sells products into the commercial graphics industry; however, it also has some minor sales into theseismic industry.
The Company’s seismic product lines currently consist of high definition reservoir characterization productsand services, geophones and hydrophones, including multi-component geophones and hydrophones, seismicleader wire, geophone and hydrophone string connectors, seismic telemetry cable, marine seismic cable retrievaldevices and small data acquisition systems targeted at niche markets. Commercial graphics products includethermal imaging equipment and dry thermal film. The following tables summarize the Company’s segmentinformation:
YEAR ENDED SEPTEMBER 30,
2004 2003 2002
Net sales:Seismic . . . . . . . . . . . . . . . . . . . . . . . . . . . . . . . . . . . . $50,651 $37,619 $51,800Commercial Graphics . . . . . . . . . . . . . . . . . . . . . . . . . 12,991 13,333 13,490Eliminations . . . . . . . . . . . . . . . . . . . . . . . . . . . . . . . . (104) (98) (241)
Total . . . . . . . . . . . . . . . . . . . . . . . . . . . . . . . . . . . . . . 63,538 50,854 65,049
Income (loss) from operations:Seismic . . . . . . . . . . . . . . . . . . . . . . . . . . . . . . . . . . . . 10,861 780 6,395Commercial Graphics . . . . . . . . . . . . . . . . . . . . . . . . . 1,117 1,130 477Corporate . . . . . . . . . . . . . . . . . . . . . . . . . . . . . . . . . . (6,107) (5,892) (6,296)Eliminations . . . . . . . . . . . . . . . . . . . . . . . . . . . . . . . . — — (142)
Total . . . . . . . . . . . . . . . . . . . . . . . . . . . . . . . . . . . . . . 5,871 (3,982) 434
Total assets:Seismic . . . . . . . . . . . . . . . . . . . . . . . . . . . . . . . . . . . . 49,667 47,391Commercial Graphics . . . . . . . . . . . . . . . . . . . . . . . . . 15,979 14,256Corporate . . . . . . . . . . . . . . . . . . . . . . . . . . . . . . . . . . 12,148 9,788
Total . . . . . . . . . . . . . . . . . . . . . . . . . . . . . . . . . . . . . . $77,794 $71,435
“Corporate” consists primarily of overhead expenses and unallocated assets. Unallocated corporate assetsprimarily consist of the Company’s building, office equipment, deferred tax assets and other general assets.
F-26

OYO Geospace Corporation and Subsidiaries
Notes to Consolidated Financial Statements—(Continued)
The Company has operations in the United States, Canada, Russia and the United Kingdom. Summaries ofnet sales by geographic area for fiscal years 2004, 2003 and 2002 are as follows (in thousands):
YEAR ENDED SEPTEMBER 30,
2004 2003 2002
Asia (excluding Japan and Middle East) . . . . . . . . . . . . . . $ 8,903 $ 9,778 $ 7,386Canada . . . . . . . . . . . . . . . . . . . . . . . . . . . . . . . . . . . . . . . . 8,356 6,503 9,058Europe . . . . . . . . . . . . . . . . . . . . . . . . . . . . . . . . . . . . . . . . 19,404 11,501 16,094Japan . . . . . . . . . . . . . . . . . . . . . . . . . . . . . . . . . . . . . . . . . . 689 618 436Middle East . . . . . . . . . . . . . . . . . . . . . . . . . . . . . . . . . . . . 581 1,255 918United States . . . . . . . . . . . . . . . . . . . . . . . . . . . . . . . . . . . 24,754 20,221 30,137Other . . . . . . . . . . . . . . . . . . . . . . . . . . . . . . . . . . . . . . . . . . 851 978 1,020
$63,538 $50,854 $65,049
Net sales are attributed to countries based on the ultimate destination of the product sold, if known. If theultimate destination is not known, net sales are attributed to countries based on the geographic location of theinitial shipment.
Sales information for the Company is as follows (in thousands):
YEAR ENDED SEPTEMBER 30,
2004 2003 2002
United States . . . . . . . . . . . . . . . . . . . . . . . . . . . . . . . . . . . $51,473 $41,335 $ 61,238Canada . . . . . . . . . . . . . . . . . . . . . . . . . . . . . . . . . . . . . . . . 7,295 5,608 4,492Russia . . . . . . . . . . . . . . . . . . . . . . . . . . . . . . . . . . . . . . . . 6,214 4,836 4,061United Kingdom . . . . . . . . . . . . . . . . . . . . . . . . . . . . . . . . 3,149 3,105 6,526Eliminations . . . . . . . . . . . . . . . . . . . . . . . . . . . . . . . . . . . (4,593) (4,030) (11,268)
$63,538 $50,854 $ 65,049
Long-lived assets were as follows (in thousands):
AS OF SEPTEMBER 30,
2004 2003
United States . . . . . . . . . . . . . . . . . . . . . . . . . . . . . . . . . . . . . . . . . . . . $22,386 $25,646Canada . . . . . . . . . . . . . . . . . . . . . . . . . . . . . . . . . . . . . . . . . . . . . . . . . 3,155 3,800Russia . . . . . . . . . . . . . . . . . . . . . . . . . . . . . . . . . . . . . . . . . . . . . . . . . 2,144 2,053United Kingdom . . . . . . . . . . . . . . . . . . . . . . . . . . . . . . . . . . . . . . . . . 521 517China . . . . . . . . . . . . . . . . . . . . . . . . . . . . . . . . . . . . . . . . . . . . . . . . . . 15 —Japan . . . . . . . . . . . . . . . . . . . . . . . . . . . . . . . . . . . . . . . . . . . . . . . . . . 1,440 —
$29,661 $32,016
The Company had no customers comprising more than 10% of sales for the fiscal year 2004 or 2003. TheCompany had one customer comprising 24.5% of annual sales for the fiscal year 2002.
During the fiscal year ended September 30, 2002, the Company delivered a reservoir characterization andmonitoring system to a major oil company, for installation in one of its fields in the North Sea. In accordancewith the terms of the contract, the Company recognized $15.8 million of revenues in its fiscal year ended
F-27

OYO Geospace Corporation and Subsidiaries
Notes to Consolidated Financial Statements—(Continued)
September 30, 2002 and $2.5 million of revenues in its fiscal year ended September 30, 2003. Due to thesystem’s continued successful performance through December 31, 2003, the Company earned a $3.6 millionperformance bonus payment, which was recognized as revenue in fiscal year 2004. The Company has agreed toextend its standard product warranty for certain components of the system until 2006.
18. Film Supplier Developments:
On July 3, 2002, the Former Primary Film Supplier filed a Chapter 11 reorganization petition in FederalBankruptcy Court for the Western District of New York. At the date of such bankruptcy filing, the Company had$3.4 million of long-term assets carried on its balance sheet as a result of the prior transactions with the FormerPrimary Film Supplier (including the $2.3 million investment in intellectual property acquired from the FormerPrimary Film Supplier).
Shortly thereafter, the Former Primary Film Supplier ceased providing the Company with dry thermal film.As a result, the Company is currently purchasing a large quantity of dry thermal film from an alternative filmsupplier (the “Other Film Supplier”), and it is using the technology it purchased from the Former Primary FilmSupplier to manufacture dry thermal film internally.
As a result of the bankruptcy filing by the Former Primary Film Supplier, the Company recorded a $1.2million charge in its third quarter of fiscal year 2002 due to the ultimate uncertainty of realization of value oncertain assets, particularly certain prepaid purchase benefits and other benefits under the amended supplycontract with the Former Primary Film Supplier. The Company does not believe there has been any impairmentin the value of the intellectual property it acquired from the Former Primary Film Supplier because of its abilityto utilize the intellectual property to have thermal film manufactured either internally or elsewhere.
On December 10, 2002, the Company received a notice of claim, in connection with the Former PrimaryFilm Supplier’s bankruptcy, for alleged preferential payments made by the Former Primary Film Supplier to it inthe period before filing of the bankruptcy proceeding in the approximate amount of $259,000. On July 7, 2004,an amended claim was filed against the Company and the amount of the alleged preferential payments made bythe Former Primary Film Supplier was increased to approximately $895,000. The Company intends to vigorouslydefend against such claim under the overall circumstances of its relationship with the Former Primary FilmSupplier. At present the Company does not know whether it will make any claims against the Former PrimaryFilm Supplier and it is unable to predict whether any additional claims will be made against it in connection withthe Former Primary Film Supplier’s bankruptcy proceeding as to any aspect of its relationship with the FormerPrimary Film Supplier. The Company is unable at this time to predict the outcome and effects of this situation.The Company has, nevertheless, made a provision for the initial claim made by the Former Primary FilmSupplier and it believes that such provision is adequate at this time, although it is unable to make suchpredictions with any certainty.
F-28

OYO Geospace Corporation and Subsidiaries
Notes to Consolidated Financial Statements—(Continued)
19. Selected Quarterly Information (Unaudited):
The following table represents summarized data for each of the quarters in fiscal years 2004 and 2003 (inthousands, except per share amounts).
2004
FourthQuarter
ThirdQuarter
SecondQuarter
FirstQuarter
Net sales . . . . . . . . . . . . . . . . . . . . . . . . . . . . . . . . . . . . . $15,915 $13,945 $16,320 $17,358Gross profit . . . . . . . . . . . . . . . . . . . . . . . . . . . . . . . . . . . 4,466 4,548 5,594 8,143Income from operations . . . . . . . . . . . . . . . . . . . . . . . . . 222 801 1,352 3,496Other income (expense), net . . . . . . . . . . . . . . . . . . . . . . 104 (111) 71 (3)Net income . . . . . . . . . . . . . . . . . . . . . . . . . . . . . . . . . . . 510 1,084 1,191 3,168
Basic earnings per share . . . . . . . . . . . . . . . . . . . . . . . . . $ 0.09 $ 0.19 $ 0.21 $ 0.57
Diluted earnings per share . . . . . . . . . . . . . . . . . . . . . . . . $ 0.09 $ 0.19 $ 0.21 $ 0.56
2003
FourthQuarter
ThirdQuarter
SecondQuarter
FirstQuarter
Net sales . . . . . . . . . . . . . . . . . . . . . . . . . . . . . . . . . . . . . $11,421 $12,855 $16,517 $10,061Gross profit . . . . . . . . . . . . . . . . . . . . . . . . . . . . . . . . . . . 2,908 2,704 4,596 2,309Income (loss) from operations . . . . . . . . . . . . . . . . . . . . (823) (1,402) 149 (1,906)Other income (expense), net . . . . . . . . . . . . . . . . . . . . . . 57 88 (72) (4)Net income (loss) . . . . . . . . . . . . . . . . . . . . . . . . . . . . . . (494) (759) 38 (1,318)
Basic earnings (loss) per share . . . . . . . . . . . . . . . . . . . . $ (0.09) $ (0.14) $ 0.01 $ (0.24)
Diluted earnings (loss) per share . . . . . . . . . . . . . . . . . . . $ (0.09) $ (0.14) $ 0.01 $ (0.24)
F-29

Schedule II
OYO Geospace Corporation and SubsidiariesValuation and Qualifying Accounts
(In Thousands)
Balance atBeginningof Period
Chargedto Costs
AndExpenses
Chargedto OtherAssets
(Deductions)And
Additions
Balance atEnd
of Period
Year ended September 30, 2004Allowance for doubtful accounts on accounts and notes
receivable . . . . . . . . . . . . . . . . . . . . . . . . . . . . . . . . . . . $478 $145 $— $ 66 $689
Year ended September 30, 2003Allowance for doubtful accounts on accounts and notes
receivable . . . . . . . . . . . . . . . . . . . . . . . . . . . . . . . . . . . 474 229 $— $(225) 478
Year ended September 30, 2002Allowance for doubtful accounts on accounts and notes
receivable . . . . . . . . . . . . . . . . . . . . . . . . . . . . . . . . . . . 470 146 — (142) 474
Balance atBeginningof Period
Chargedto Costs
AndExpenses
Chargedto OtherAssets (Deductions)
Balance atEnd
Of Period
Year ended September 30, 2004Inventory obsolescence reserve . . . . . . . . . . . . . . . . . . . . $1,053 $663 $— $ (84) $1,632
Year ended September 30, 2003Inventory obsolescence reserve . . . . . . . . . . . . . . . . . . . . 931 234 — (112) 1,053
Year ended September 30, 2002Inventory obsolescence reserve . . . . . . . . . . . . . . . . . . . . 1,089 970 — (1,128) 931
F-30


w w w . o y o g e o s p a c e . c o m