Embed Size (px)
Citation preview
2018
Georgia 2020
Educational Opportunity for All K-12 Students
Benjamin Scafidi
Kennesaw State University

1
Acknowledgments
This research was funded by a generous gift from the Charles Koch Foundation (CKF) to
Kennesaw State University. At the time of press, no one from the CKF has seen this report, and
no one from the CKF ever made suggestions as to the contents of this report. The views
expressed in this report are the author’s alone and do not necessarily represent the views of
Kennesaw State University or the Charles Koch Foundation.
The author appreciates the invaluable insight and support of the Georgia Public Policy
Foundation in the completion and distribution of this study.
The author has benefitted tremendously over the past 20 years from the insights of many
researchers, educators, policymakers, and policy actors – too numerous to list for fear of
leaving out names. All errors in this report are the author’s alone.
Given the likelihood that the primary audience for this report will be a policy audience, the
references are done in the most simple format in order to ease retrieval of primary studies,
books, data and other materials.
Finally, in the interest of full disclosure, the author has received financial compensation in
exchange for research and/or technical assistance in the past from the State of Georgia,
traditional public school districts in Georgia, a student scholarship organization in Georgia, a
national cyber charter school provider, and organizations that support charter schools and
private school choice. None of these entities has provided input as to the contents of this
report or have seen it prior to publication.

2
Executive Summary
This report, “Georgia 2020: Educational Opportunity for All K-12 Students,” offers a logic, research and experience-based array of recommendations to provide educational opportunity for all Georgia students, by allowing a universal choice system of K-12 education in Georgia. With Georgia 2020, families will be free to use their own and the taxpayer funds devoted to their children’s education to choose the schools and non-school education services they deem best for their children, and educators will not have to ask permission to offer their best versions of school and other educational services to the public. These Georgia 2020 recommendations are tailored to the specific education policy landscape in Georgia and can and should be implemented by fall 2020. Universal Education Savings Accounts
Provide each school-aged child who currently attends a public school or is entering grades K
or 1 with an Education Savings Account (ESA) equal to 90 percent of state taxpayer spending
per student. This would include all Quality Basic Education (QBE) and non-QBE state funds for
K-12 education. For FY 2016, this would have amounted to $4,512 per student. For fall 2020,
it will be significantly higher, given the generous recent increases in state taxpayer funding
that Governor Deal and the General Assembly have given to Georgia public schools.
Education Savings Accounts are tailored accounts given to parents that enable them to use
taxpayer funds devoted to their children’s educations at the private schools of their choice or
on any approved non-school educational service. Unused funds may be saved for future years,
moved to siblings, or potentially saved for college expense. This latter feature gives parents an
incentive to be cost conscious, while the flexibility to choose non-school educational services
opens the education system to greater possibilities for customization and innovation.1
Tax Credit Scholarships
Increase the cap on statewide donations to scholarship organizations to $150 million, with a
perpetual 20 percent escalator clause whenever the cap is hit. This program is extremely
popular with taxpayers.
Georgia Special Needs Scholarship Program
Add these scholarship awards to the Education Savings Accounts (ESAs) mentioned above.
This change would more than double the size of ESAs for these students with additional
needs. That said, these students would still receive less taxpayer support than would students
in traditional public schools.
1 For a longer discussion of ESAs and their merits and implementation, please see https://www.edchoice.org/research/the-education-debit-card-ii/.
3
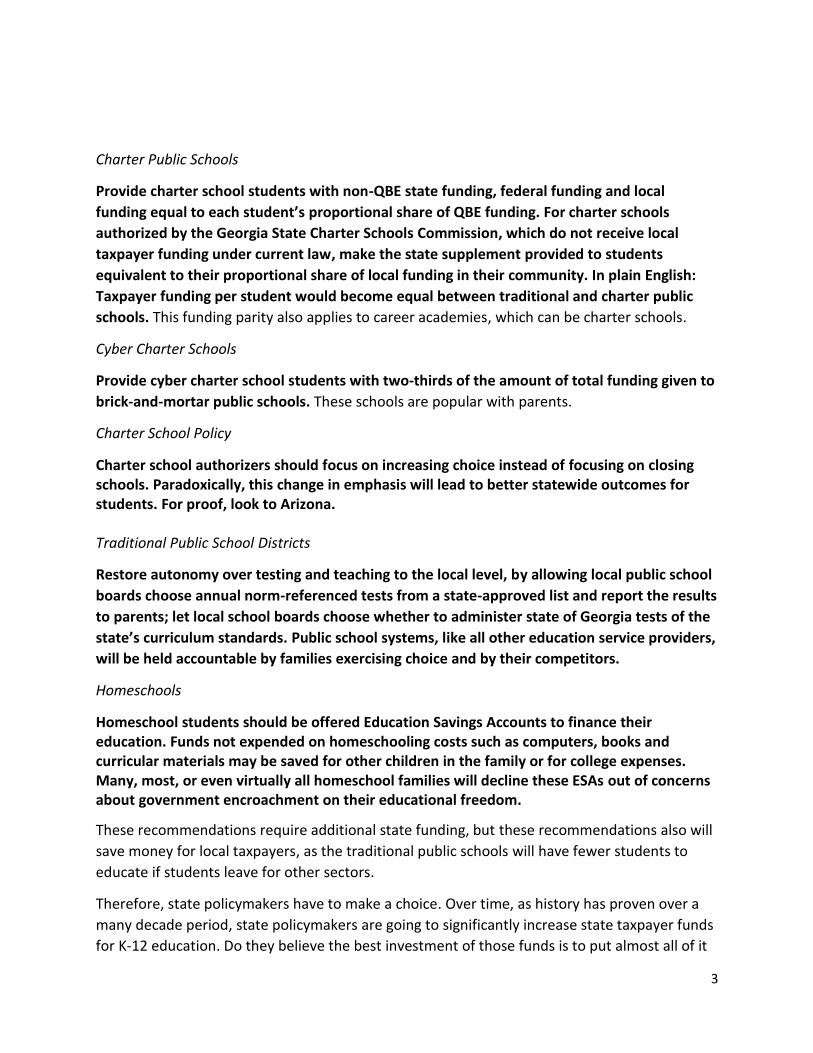
Charter Public Schools
Provide charter school students with non-QBE state funding, federal funding and local
funding equal to each student’s proportional share of QBE funding. For charter schools
authorized by the Georgia State Charter Schools Commission, which do not receive local
taxpayer funding under current law, make the state supplement provided to students
equivalent to their proportional share of local funding in their community. In plain English:
Taxpayer funding per student would become equal between traditional and charter public
schools. This funding parity also applies to career academies, which can be charter schools.
Cyber Charter Schools
Provide cyber charter school students with two-thirds of the amount of total funding given to
brick-and-mortar public schools. These schools are popular with parents.
Charter School Policy
Charter school authorizers should focus on increasing choice instead of focusing on closing schools. Paradoxically, this change in emphasis will lead to better statewide outcomes for students. For proof, look to Arizona. Traditional Public School Districts
Restore autonomy over testing and teaching to the local level, by allowing local public school
boards choose annual norm-referenced tests from a state-approved list and report the results
to parents; let local school boards choose whether to administer state of Georgia tests of the
state’s curriculum standards. Public school systems, like all other education service providers,
will be held accountable by families exercising choice and by their competitors.
Homeschools
Homeschool students should be offered Education Savings Accounts to finance their education. Funds not expended on homeschooling costs such as computers, books and curricular materials may be saved for other children in the family or for college expenses. Many, most, or even virtually all homeschool families will decline these ESAs out of concerns about government encroachment on their educational freedom.
These recommendations require additional state funding, but these recommendations also will
save money for local taxpayers, as the traditional public schools will have fewer students to
educate if students leave for other sectors.
Therefore, state policymakers have to make a choice. Over time, as history has proven over a
many decade period, state policymakers are going to significantly increase state taxpayer funds
for K-12 education. Do they believe the best investment of those funds is to put almost all of it

4
into traditional public schools? Or do they believe that allowing parents to redirect some of
those funds to start-up charter schools, career academies, private schools and other
educational settings are the best use of those funds? The case of Arizona, coupled with the
early returns on choice programs from around the nation, indicates that the answer is that a
choice system would be the better investment.
To measure success or failure of this new education system, state policymakers, civic groups,
researchers and interested individuals should look to statewide NAEP (National Assessment of
Educational Progress) test scores, statewide post-secondary outcomes, statewide labor market
outcomes, and statewide surveys of parents, economic development officials and business
leaders to gauge whether the new universal choice system has improved outcomes for students
overall and for specific subgroups of students. Policymakers can then use this information to
make any needed mid-course corrections.
By looking at statewide data, and not tying outcome data to specific teachers, schools, sectors,
or education service providers, educators will not be tempted to narrow offerings and ignore
potential innovations by “teaching to the test” and other harmful behaviors that are typically
no fault of their own, but incentivized by accountability systems designed to “protect” students.
Parents will receive norm-referenced test scores for their own children under Georgia 2020,
tests that are not tied to any centralized or government standards. Further, parents are in a
position to better measure valuable non-cognitive and social outcomes experienced by their
children – outcomes that inherently cannot be monitored by central observers including
governments. Armed with this information and with a large array of alternatives, parents will
be empowered to choose the educational settings they deem best for their children.
That said, the biggest benefits to students and their families from universal educational choice
as proposed by Georgia 2020 is likely to come from bourgeois innovation, where individual
schools, individual educators and individual parents are empowered to ask for and implement
student-specific accommodations and changes that they deem best.
Finally, when reading this report, it is important to note the difference between “educational”
choice and “school” choice. Educational choice allows families to choose to use the taxpayer
funds devoted to their children’s educations for school and non-school services, where the
latter may include therapies, tutoring, etc. Most longstanding K-12 choice programs are school
choice programs, and consequently most of the research is on school choice programs.
Nevertheless, the Education Savings Account program recommended in this report would
create educational choice for Georgia families and educators.

5
Table of Contents
Page
Introduction 6
The K-12 Education Policy Landscape in Georgia 11
A Case for Universal Educational Choice 20
Specific Recommendations for Georgia in Fall 2020 38
Metrics for Measuring Success in a Universal Choice K-12 Education System 46
Concluding Remarks 52
About the Education Economics Center at Kennesaw State University 58
About the Author 58

6
I. Introduction
This report addresses the following question:
What K-12 education system would be best for all students in Georgia? An “education system” is a set of rules, policies and mores that govern K-12 education. We have a K-12 education system in Georgia that is currently – and historically has been – dominated by the traditional public education sector, with some limited taxpayer-funded choice opportunities for families that are outside of this sector and have been enacted in recent years. The choice in today’s K-12 education system in Georgia mostly comes from families making residential location decisions to choose the traditional public schools they deem best for their children and from families choosing to use their own funds to pay tuition for their children to attend a private school.2 Thus, families of means have significantly more choice available to them relative to families with less means. To be clear, this enhanced choice only for families of means is a feature of the current education system and not a bug as the traditional public education sector fights heavily against expanding opportunities for families to choose options outside of their sector. This lack of educational choice for Georgia families necessarily leads to a lack of educational choice for Georgia educators, as almost all Georgia students are enrolled in the traditional public education sector, which means almost all jobs for educators will be in this sector. The traditional public education sector is governed by rules and policies from multiple policy actors each at each of three levels of government. Specifically,
- The federal government has policy actors that govern the traditional public school sector. These actors include the President, Congress and the U.S. Department of Education.
- The Georgia state government also has policy actors that govern the traditional public school sector. These actors include the Governor, the General Assembly, the Georgia Department of Education, the Georgia Professional Standards Commission, the Governor’s Office of Student Achievement and, to a small degree, the University System of Georgia.
- At the local level are “local public school systems,” as they are called in Georgia, which also govern the traditional public school sector. The policy actors in local public school systems include local school boards, local superintendents, school
2 In addition, some traditional public school districts offer magnet schools or other limited district-based choice opportunities. Homeschooling is also an option in Georgia.

7
principals and assistant principals. (In most other states, these local public school systems are called local public school districts.)
Schematically, the policy actors who govern traditional public school classrooms include the:
President
Congress
U.S. Department of Education
Governor
General Assembly
Georgia Department of Education
Georgia Professional Standards Commission
Governor’s Office of Student Achievement
University System of Georgia
Local Board of Education
Local Superintendent
Principal
Assistant Principals
The above list does not include myriad government agencies at all three levels of government
for which every enterprise in the United States must be concerned, such as fire marshals,
county zoning boards and planning commissions, the EEOC, tax assessors, etc.
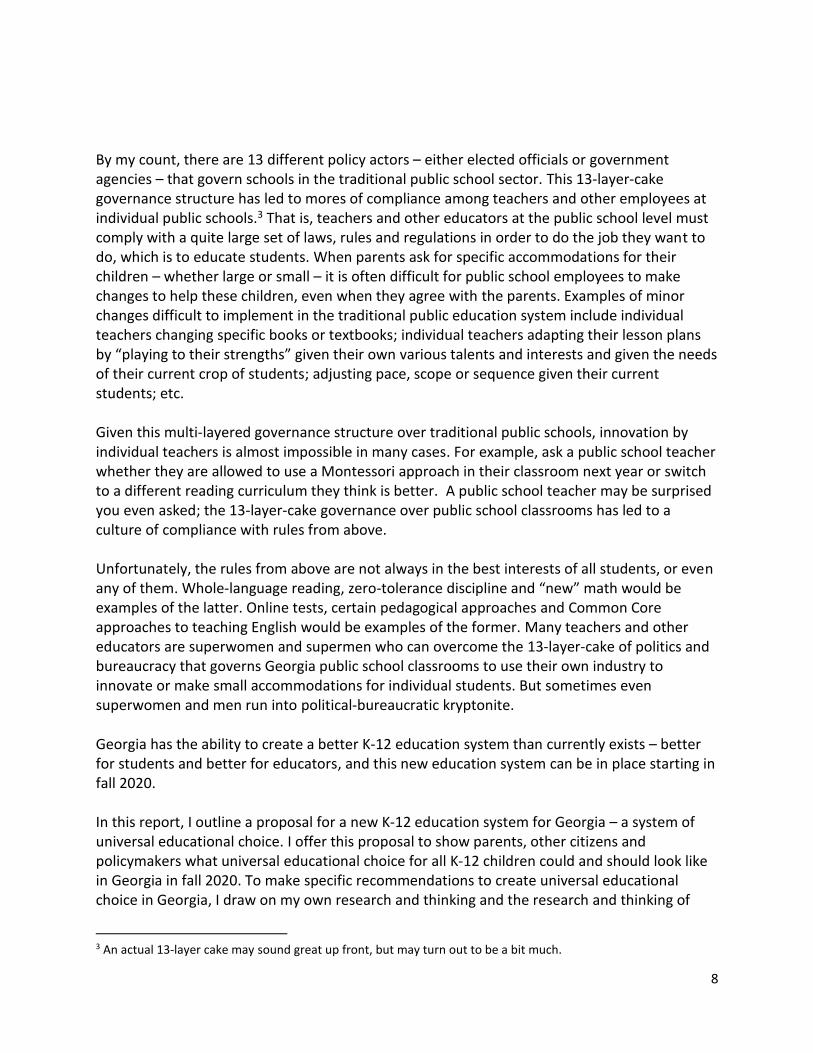
8
By my count, there are 13 different policy actors – either elected officials or government agencies – that govern schools in the traditional public school sector. This 13-layer-cake governance structure has led to mores of compliance among teachers and other employees at individual public schools.3 That is, teachers and other educators at the public school level must comply with a quite large set of laws, rules and regulations in order to do the job they want to do, which is to educate students. When parents ask for specific accommodations for their children – whether large or small – it is often difficult for public school employees to make changes to help these children, even when they agree with the parents. Examples of minor changes difficult to implement in the traditional public education system include individual teachers changing specific books or textbooks; individual teachers adapting their lesson plans by “playing to their strengths” given their own various talents and interests and given the needs of their current crop of students; adjusting pace, scope or sequence given their current students; etc. Given this multi-layered governance structure over traditional public schools, innovation by individual teachers is almost impossible in many cases. For example, ask a public school teacher whether they are allowed to use a Montessori approach in their classroom next year or switch to a different reading curriculum they think is better. A public school teacher may be surprised you even asked; the 13-layer-cake governance over public school classrooms has led to a culture of compliance with rules from above. Unfortunately, the rules from above are not always in the best interests of all students, or even any of them. Whole-language reading, zero-tolerance discipline and “new” math would be examples of the latter. Online tests, certain pedagogical approaches and Common Core approaches to teaching English would be examples of the former. Many teachers and other educators are superwomen and supermen who can overcome the 13-layer-cake of politics and bureaucracy that governs Georgia public school classrooms to use their own industry to innovate or make small accommodations for individual students. But sometimes even superwomen and men run into political-bureaucratic kryptonite. Georgia has the ability to create a better K-12 education system than currently exists – better for students and better for educators, and this new education system can be in place starting in fall 2020. In this report, I outline a proposal for a new K-12 education system for Georgia – a system of universal educational choice. I offer this proposal to show parents, other citizens and policymakers what universal educational choice for all K-12 children could and should look like in Georgia in fall 2020. To make specific recommendations to create universal educational choice in Georgia, I draw on my own research and thinking and the research and thinking of
3 An actual 13-layer cake may sound great up front, but may turn out to be a bit much.

9
many others, as well as two decades of education policy experience in Georgia and nationally. I believe a system of universal educational choice would vastly increase educational opportunities and outcomes for all Georgia children. Why universal educational choice? Free systems, also known as choice systems – where families can choose from whom to buy goods and services and where sellers and potential sellers do not have to ask permission to offer their goods and services to the public – have led to tremendous increases in human well-being over the past three centuries. As late as the 18th century, almost all of humanity had a standard of living just above subsistence. Economic historian Deirdre McCloskey has written a deeply researched trilogy documenting how allowing the bourgeoisie – the poorest of humanity – to have dignity and equality in terms of their autonomy is what led to the great enrichment of the human race since the 1700s. In McCloskey’s characterization, this dignity and equality means that all humans, rich and poor and from every background, are able to make decisions for themselves and their families. That is, history suggests that it was not more capital, or big ideas – even though they have been valuable – or better institutions that led to the dramatic increase in human well-being. The tremendous increase in living standards came from letting regular people, even the bourgeoisie, make decisions with dignity and equality. In his 2013 post-Nobel paean, Mass Flourishing, economist Edmund Phelps agreed.4 Phelps wrote,
Prosperity on a national scale – mass flourishing – comes from broad involvement of people in the processes of innovation: the conception, development, and the spread of new methods and products – indigenous innovation down to the grassroots.5
McCloskey and Phelps report that allowing all humans, including the least of our brothers and sisters, to make decisions for themselves led to new ideas – both large ideas, but mostly billions of small ones – that caused the tremendous increase in material goods and services available to even the poorest in society.6 That is, countless and small bourgeois innovations are largely what are responsible for the amazing standard of living we have today.
4 Bourgeois Equality: How Ideas, Not Capital or Institutions, Enriched the World by Deirdre N. McCloskey; Bourgeois Dignity: Why Economics Can't Explain the Modern World by Deirdre N. McCloskey; The Bourgeois Virtues: Ethics for an Age of Commerce by Deirdre N. McCloskey; and Mass Flourishing by Edmund S. Phelps. 5 Edmund Phelps, Mass Flourishing, page vii. https://www.amazon.com/Mass-Flourishing-Grassroots-Innovation-Challenge/dp/0691165793/ref=sr_1_1?ie=UTF8&qid=1516557165&sr=8-1&keywords=mass+flourishing. 6 Recent examples of tiny changes that have vastly improved human well-being include smaller paper towels, no more cardboard packaging for deodorant, allowing non-drowsy allergy medications to be sold without a doctor’s prescription, etc. There have been literally billions of these tiny innovations since the 1700s and, taken together, McCloskey and Phelps have separately concluded that the collection of these tiny innovations have been the prime reason human well-being has skyrocketed over the past 300 years, which came after millennia of economic and social stagnation. In addition, my terse description of McCloskey’s and Phelps’ histories barely scratch the surface

10
Universal choice across education sectors for families, coupled with permissionless entry for educators, would allow for a “free” and universal system of K-12 education that is analogous to the free systems for many goods and services that have enriched humanity. Universal systems have more political resilience as all people, rich and poor and from all racial, ethnic and religious backgrounds, would be in the same educational choice education system. At a practical level, universal systems let all benefit from the innovations of everyone else and offer more incentives for providers to meet the needs of customers. This report – “Georgia 2020: Educational Opportunity for All K-12 Students” – offers a logic-, research- and experience-based array of recommendations to provide educational opportunity for all Georgia students, by allowing a “free” and universal system of K-12 education in Georgia, with families free to use their own and the taxpayer funds devoted to their children’s educations to choose the schools and non-school education services they deem best for their children and where educators do not have to ask permission to offer their best versions of school and other educational services to the public. This “free” system would truly allow universal educational choice for all Georgians. Finally, these recommendations are tailored to the specific education policy landscape in Georgia. The rest of this report is organized as follows:
Section II briefly describes the education policy landscape in Georgia, including some basic facts about Georgia’s public school system and existing and modest educational choice programs.
Section III provides the rationale for a universal K-12 education choice system.
Section IV contains detailed policy recommendations to create universal choice in K-12 education in Georgia, including policies to maximize the benefits to students, their families and taxpayers from allowing universal choice among traditional public, charter, virtual, career, micro, home, hybrid and private schooling as well as educational choices outside formal school settings. Of course, dual enrollment programs to universities and technical colleges would continue to operate and should be made as accessible as possible. These specific policy recommendations are comprehensive in that they endeavor to cover the entire panoply of educational choice, and these recommendations are tailored to the education policy landscape in Georgia.
Section V suggests specific metrics to measure the success or failure of a K-12 education system, including the one proposed here. Care is taken to avoid metrics that “sound good,” but actually would narrow educational offerings and even harm the educations of Georgia students.
Section VI presents concluding remarks.
of their historical contributions to our understanding of the dramatic and large expansion of human well-being that began about 300 years ago.

11
II. The K-12 Education Policy Landscape in Georgia
In 2007 and 2008, the state of Georgia created three cutting-edge programs (at the time) to promote educational choice: vouchers for students with special needs, an authorizer for charter schools that was independent of local public school districts, and a $50 million tax credit scholarship program, where donors could redirect their state income tax liability to nonprofits that give scholarships to students to offset tuition at private schools. The creation of these three programs pushed Georgia close to the forefront of the movement to expand educational choice for families, circa 2008. However, since that time, as discussed below, Georgia’s special needs vouchers and charter school program have been slightly weakened, and the tax credit scholarship program has expanded to only $58 million, a tiny fraction of the approximately $20 billion currently spent annually on Georgia public schools. An educational choice leader in 2008, Georgia is now a laggard in 2018: Several states have moved to significantly expand access to educational choice programs in recent years.7 For further context on where Georgia stands with regard to choice, education historians have reported that the United States as a whole has much less educational choice than virtually all the developed world. For example, Charles Glenn noted “governments in most Western democracies provide partial or full funding for nongovernment schools chosen by parents; the United States (apart from a few scattered and small-scale programs) is the great exception, along with Greece.” In addition, in 2001 Diane Ravitch wrote, “The proportion of students in government-funded private schools is sizable in countries such as Australia (25 percent), Belgium (58 percent), Denmark (11 percent), France (16.8 percent), South Korea (21 percent), the Netherlands (76 percent), Spain (24 percent), and the United Kingdom (30 percent).”8 In 2015 – the most recent year for complete data for all sectors – the vast majority of Georgia K-12 students who received taxpayer subsidies for their education attended a traditional public school.9 As shown in the chart below, 95 percent of all taxpayer-funded students in Georgia attended a traditional public school in 2015. That percentage may be slightly higher in 2018, but only very slightly higher. In 2000, Georgia Governor Roy Barnes set a goal of 100 start-up charter schools in Georgia by 2005.10 We are almost there – in 2018. According to the Georgia Department of Education, there are 97 start-up charter schools currently operating in Georgia.11 7 https://www.edchoice.org/school-choice/school-choice-in-america/ 8 https://www.edchoice.org/school_choice_faqs/how-does-school-choice-work-in-other-countries/ 9 Here and throughout this report, the most recent data available are used. 10 http://onlineathens.com/stories/112500/new_1125000008.shtml#.WmE0Gq6nGM8 11 http://www.gadoe.org/External-Affairs-and-Policy/Charter-Schools/Pages/General-Frequently-Asked-Questions.aspx

12
A) Taxpayer-Funded Georgia K-12 Enrollment by Sector, 2015
Sources: https://dor.georgia.gov/sites/dor.georgia.gov/files/related_files/document/LATP/Publication/2015%20SSO%20report%204-12-17.pdf; www.gosa.georgia.gov; https://gosa.georgia.gov/sites/gosa.georgia.gov/files/related_files/document/Special%20Needs%20Scholarship%20End%20of%20Year%20Report%202015-2016-FINAL.pdf; and https://nces.ed.gov/programs/coe/indicator_cgb.asp
Taxpayer subsidies for education vary dramatically across sectors. As shown in Chart B, average tax credit scholarships in Georgia are about one-third the size of average per-student spending in traditional public schools. Georgia Special Needs Scholarships – for students who are said to have additional needs relative to other students – are funded at about half the amount of average spending per student in traditional public schools.12
12 Public school leaders routinely state that they need and occasionally sue in the courts for extra resources (http://www.casfg.org/ ) for students with special needs, yet students who enter into the Georgia Special Needs Scholarship Program receive only half of the funding given to all students in traditional public schools.
1,629,964
67,915 13,555 3,643
Traditional PublicSchools
Start-Up CharterSchools
Tax CreditScholarships
Special NeedsVouchers

13
B) Taxpayer Expenditures Per Student, 2016
Sources: www.gosa.georgia.gov; https://gosa.georgia.gov/sites/gosa.georgia.gov/files/related_files/document/Special%20Needs%20Scholarship%20End%20of%20Year%20Report%202015-2016-FINAL.pdf; and https://dor.georgia.gov/sites/dor.georgia.gov/files/related_files/document/LATP/Publication/2015%20SSO%20report%204-12-17.pdf
C) Change in Expenditures Per Student, 2011 to 2016
Sources: http://www.gadoe.org/External-Affairs-and-Policy/Policy/Documents/SB10%20Gen%20Asmbly%20Rpt%2010-11.pdf; www.gosa.georgia.gov; https://nces.ed.gov/programs/digest/d14/tables/dt14_236.80.asp; and https://gosa.georgia.gov/sites/gosa.georgia.gov/files/related_files/document/Special%20Needs%20Scholarship%20End%20of%20Year%20Report%202015-2016-FINAL.pdf
$11,213
$3,777
$5,656
Traditional Public Tax Credit Scholarship Special NeedsScholarship
$10,227
$3,494
$6,860
$11,213
$3,777
$5,656
TraditionalPublic Schools
Tax CreditScholarships
Special NeedsScholarships
2011
2016
14
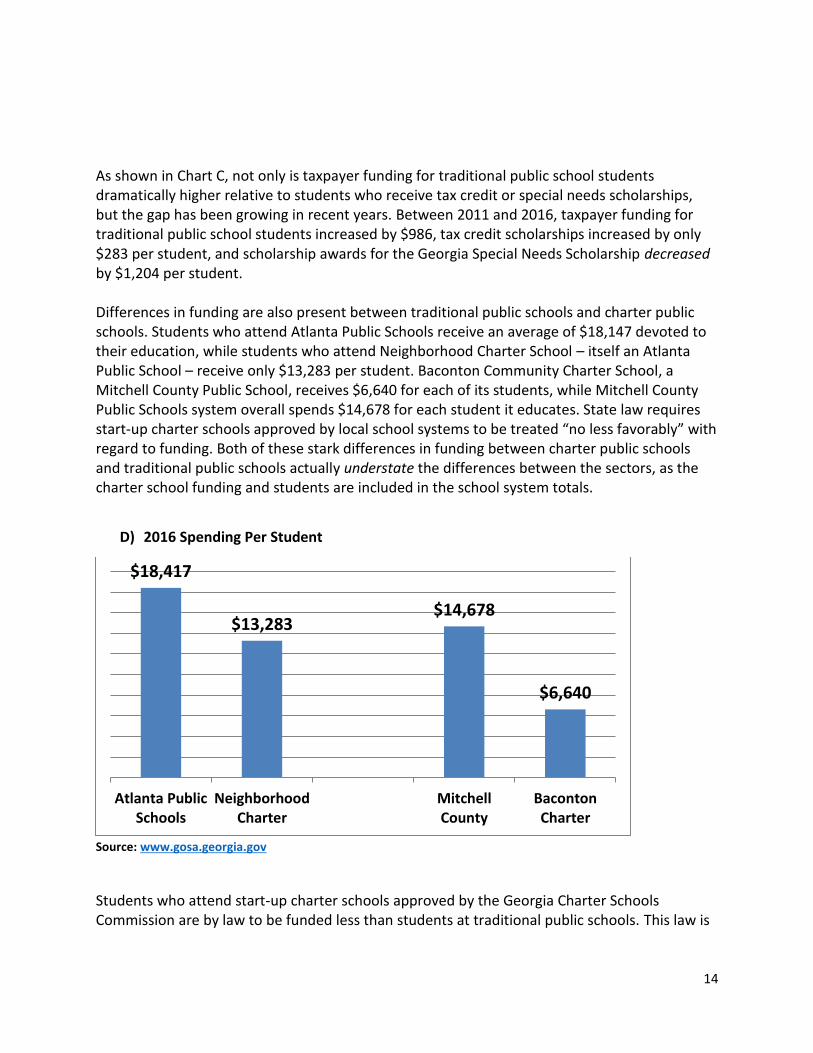
As shown in Chart C, not only is taxpayer funding for traditional public school students dramatically higher relative to students who receive tax credit or special needs scholarships, but the gap has been growing in recent years. Between 2011 and 2016, taxpayer funding for traditional public school students increased by $986, tax credit scholarships increased by only $283 per student, and scholarship awards for the Georgia Special Needs Scholarship decreased by $1,204 per student. Differences in funding are also present between traditional public schools and charter public schools. Students who attend Atlanta Public Schools receive an average of $18,147 devoted to their education, while students who attend Neighborhood Charter School – itself an Atlanta Public School – receive only $13,283 per student. Baconton Community Charter School, a Mitchell County Public School, receives $6,640 for each of its students, while Mitchell County Public Schools system overall spends $14,678 for each student it educates. State law requires start-up charter schools approved by local school systems to be treated “no less favorably” with regard to funding. Both of these stark differences in funding between charter public schools and traditional public schools actually understate the differences between the sectors, as the charter school funding and students are included in the school system totals.
D) 2016 Spending Per Student
Source: www.gosa.georgia.gov
Students who attend start-up charter schools approved by the Georgia Charter Schools Commission are by law to be funded less than students at traditional public schools. This law is
$18,417
$13,283$14,678
$6,640
Atlanta PublicSchools
NeighborhoodCharter
MitchellCounty
BacontonCharter
15
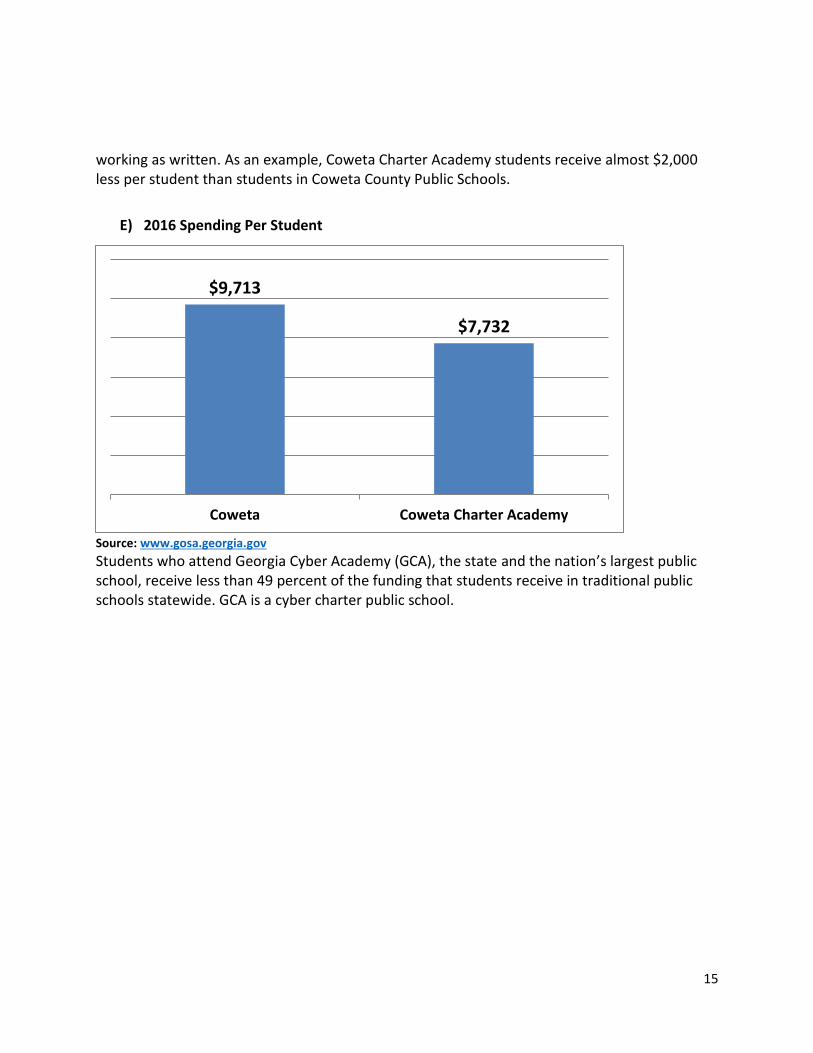
working as written. As an example, Coweta Charter Academy students receive almost $2,000 less per student than students in Coweta County Public Schools.
E) 2016 Spending Per Student
Source: www.gosa.georgia.gov
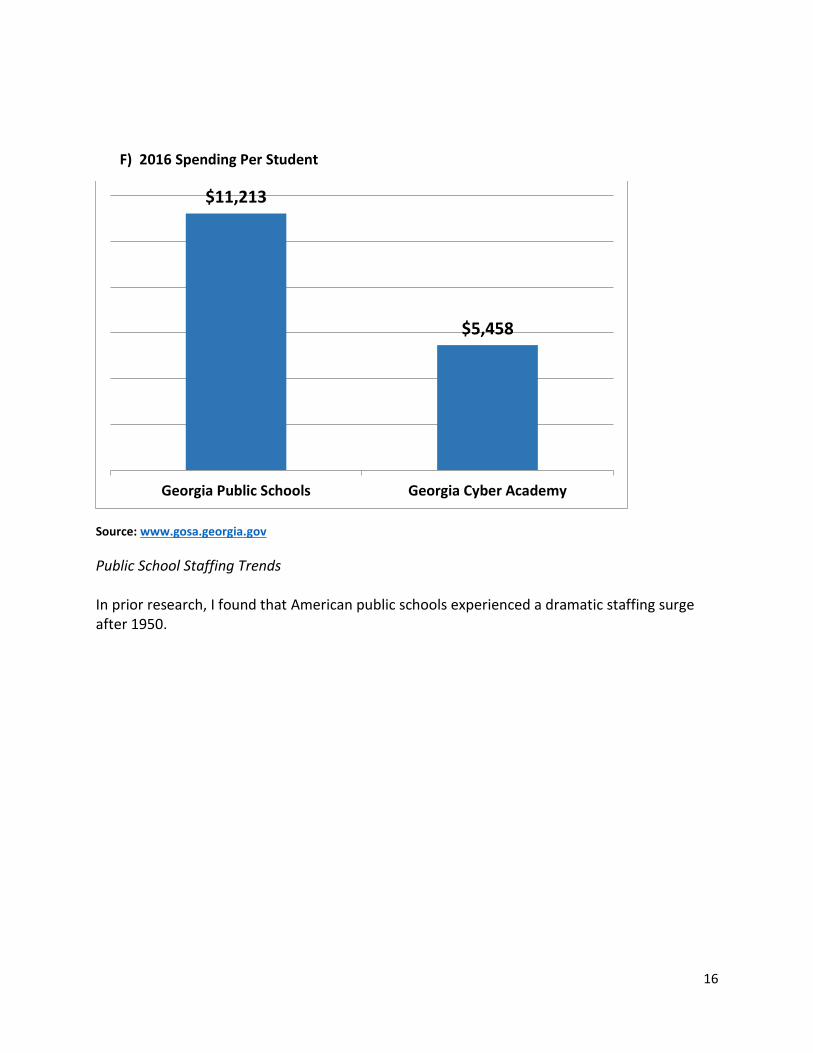
Students who attend Georgia Cyber Academy (GCA), the state and the nation’s largest public school, receive less than 49 percent of the funding that students receive in traditional public schools statewide. GCA is a cyber charter public school.
$9,713
$7,732
Coweta Coweta Charter Academy
16
F) 2016 Spending Per Student
Source: www.gosa.georgia.gov
Public School Staffing Trends In prior research, I found that American public schools experienced a dramatic staffing surge after 1950.
$11,213
$5,458
Georgia Public Schools Georgia Cyber Academy

17
G) Growth in Students and Public School Personnel, U.S. Public Schools, FY 1950-2015
Source: https://www.edchoice.org/research/back-staffing-surge/. These data on staffing here and elsewhere are reported by state departments of Education to the U.S. Department of Education.
It could be argued that this staffing surge was worth it in the 1950s, the 1960s, the 1970s, the 1980s and early 1990s because during those decades public schools began welcoming students with special needs and were allowed to integrate by race or were actively integrated by government policies. Nevertheless, the staffing surge has continued even after its first 42-year period that ended in 1992. The modern staffing surge, which began in 1992, has been expensive for taxpayers and has posed a tremendous opportunity cost on teachers and parents. For example, in Georgia, taxpayer support for public schools increased by 28 percent on an inflation-adjusted and per-student basis between 1992 and 2014. Thus, Georgia public school students have 28 percent more resources allocated to their education relative to Georgia public students of 1992. As shown in Chart H, this increase in resources translated to only a 6 percent increase in average teacher salaries during this period. That begs the question: Where did these significant additional resources go?13
13 The inflation adjustment used here is the CPI-U. It is typical for interest groups to suggest that the actual cost of providing their good or service has increased at a rate greater than the CPI-U, and advocates for public schools make this claim as well. The CPI-U is a reasonable measure to use for inflation for the purposes of the analysis here for several reasons, including: (a) the CPI-U overstates actual inflation (For a good layperson’s description of this issue, read http://www.forbes.com/sites/scottwinship/2015/06/15/debunking-disagreement-over-cost-of-living-adjustment/#203f4e1170fc ), so if actual inflation is truly higher than average in some situation the CPI-U will be a
100%
381%
243%
709%
Students Total SchoolPersonnel
Teachers All OtherStaff

18
H) Real (Inflation-Adjusted) Increases in Spending Per Student and Average Teacher Salaries in Georgia Public Schools, FY 1992 to 2014
Source: https://www.edchoice.org/research/back-staffing-surge/
I) Staffing Surge in Georgia Public Schools, FY 1992 to 2014
Source: https://www.edchoice.org/research/back-staffing-surge/
more accurate representation of inflation in that situation; ( b) most public school expenditures are for wages and salaries – and people who receive wages and salaries experience increases in their standard of living when their incomes increase faster than true increases in prices – and the CPI-U overstates those true increases in prices; and (c) regarding other items that public schools purchase, some have increased at rates faster than the CPI-U (construction materials, health insurance), while others have increased at rates slower than the CPI-U or even decreased over time (energy, food, technology). For each of these reasons, it is reasonable to use the CPI-U for the purposes of this report.
28%
6%
Real Spending Per Student Real Teacher Salaries
48%
67%75%
60%
Students Total Staff Teachers All Other Staff

19
Chart I demonstrates that one place the additional funds allocated to public schools went was to additional staffing, over and above what was needed to accommodate student enrollment growth. In my report, “Back to the Staffing Surge” and in my earlier “Staffing Surge” reports, I showed how Georgia public schools have actually experienced one of the smaller staffing surges, and that nationally the very costly staffing surge has not been associated with measurable gains in academic outcomes for students.14 The preceding exposition is a brief description of the education policy landscape in Georgia circa 2018 National School Choice Week. So where does that leave Georgia? K-12 education policy is at a crossroads in Georgia. In November 2018, there will be no incumbent running for Governor or Lt. Governor, and all seats in the General Assembly will also be on the 2018 ballot. National School Choice Week in January 2018 is an ideal time to discuss specific educational choice recommendations – tailored to the policy landscape in Georgia – with the goal of earning the highest possible return from the $12,000 (and growing) per student that taxpayers annually spend on the current public K-12 education system. (When the data are in for the current school year, spending per student in Georgia public schools will be about $12,000.)
14 https://www.edchoice.org/research/back-staffing-surge/

20
III. A Case for Universal Educational Choice
In a short chapter, “The Role of Government in Education,” published in an edited volume in
1955, Milton Friedman ignited the modern push for allowing families and educators to have
educational choice.15 Friedman’s idea was that the government would continue to finance the
education of youth, but that the provision of schooling would be done by private entities.
Friedman suggested that the separation of the provision of education from the financing of
education would create
- More choice for families as schools would be allowed to be different
- More competition between schools as schools would no longer be guaranteed taxpayer financing
- More innovation as educators would no longer be subject to government making
operating and pedagogical decisions, and - The largest benefits would accrue to the most disadvantaged students.
Friedman saw that by ending government provision of education, consumers would perhaps benefit the most from increases in innovation. In the introduction to his 1962 book, “Capitalism and Freedom,” he wrote:
Government can never duplicate the variety and diversity of individual action. At any moment in time, by imposing uniform standards in housing, or nutrition, or clothing, government could undoubtedly improve the level of living of many individuals; by imposing uniform standards in schooling, road construction, or sanitation, central government could undoubtedly improve the level of performance in many local areas and perhaps even on average in all communities. But in the process, government would replace progress by stagnation, it would substitute uniform mediocrity for the variety essential for that experimentation which can bring tomorrow’s laggards above today’s mean.16
This experimentation that leads to useful innovation has brought “tomorrow’s laggards above
today’s mean” in almost all walks of life. Low-income Americans today often carry small devices
in their pockets that allow them to make phone calls and have more computing power on their
person than $3.5 million NASA supercomputers from my diaper years. Adjusted for inflation,
15 http://la.utexas.edu/users/hcleaver/330T/350kPEEFriedmanRoleOfGovttable.pdf 16 Milton Friedman (1962), “Capitalism and Freedom,” page 4

21
those $3.5 million supercomputers of 1969, which had less computing power than basic
smartphones of today, would cost well over $10 million today.17
An education choice skeptic may note the role of government in funding basic research that
aided the creation of smart phones or the direct government research and development that
created the internet. Clearly, the government played a positive role in these areas. That said,
the government does not own or operate Apple, Inc. The educational system analogous to the
system we have for smart phones would be for private ownership and operation of schools
with a government-funded and managed Institute for Education Sciences and a National
Science Foundation. The latter two government agencies exist, and private ownership and
operation of schools would be widespread under a system of universal educational choice.
Analogous to the open internet system of today would be a free enterprise education system
where educators are free to open schools and other educational organizations and design them
in the ways they think are best and families would be free to purchase their educational
services, or not. If such an educational system led to one one-thousandth of the innovation and
improvement that smart phones achieved over rotary phones, then students would experience
dramatic increases in outcomes.
Low-income Americans of today have a higher standard of living in many respects –
automobiles, television, internet, smartphones, air conditioning, vaccines, medicines (even if
they do not have insurance), etc. – than John D. Rockefeller, the wealthiest person on earth a
mere 100 years ago.18 As discussed previously, based on the historical research of Deirdre
McCloskey and Edmund Phelps, these advances that allowed the poor to be so wealthy in
historical terms were made possible by the free enterprise system – where a free enterprise
system consists of individuals freely allowed to enter occupations and freely allowed to start
new business enterprises. What is proposed here is to allow those same freedoms in the K-12
education system – freedom for consumers (families) and freedom for producers (educators).
However, I add one twist to Friedman’s original idea. There are more than 2,000 public schools
in Georgia. In historical terms, these public schools are extremely well-staffed with veteran
educators, many of whom are excellent at their craft. Thus, under the universal education
choice system proposed here, these public schools would become free of state government
mandates over standards, testing and No Child Left Behind-style accountability, to the fullest
extent allowed by federal law and regulation. Additionally, these public schools would continue
17 http://www.phonearena.com/news/A-modern-smartphone-or-a-vintage-supercomputer-which-is-more-powerful_id57149 18 Recent research has found very large increases in consumption by low- and middle-income Americans from 1960 to 2015. http://www.dartmouth.edu/~bsacerdo/Sacerdote%2050%20Years%20of%20Growth%20in%20American%20Wages%20Income%20and%20Consumption%20May%202017.pdf

22
to receive the federal and local taxpayer funding they receive today. And, as is the case today,
the vast majority of their state funding would depend on how many students they serve.
However, all students they currently serve would have more educational alternatives available
to them beginning in fall 2020 than they have today.
I am agnostic as to whether technology or other “large” or “disruptive” educational innovations
will lead to much better educational offerings for students in the future. If such innovations do
exist, they will be discovered and implemented much more quickly if educators do not have to
staff their schools according to government-proscribed staffing ratios, teach to government-
defined standards, and worry mostly about student performance on government-created
standardized tests.
Large and disruptive innovations that benefit all students or certain types of students may
come, or they may not, even under a universal choice system. However, under the current K-12
education system that is controlled by elected officials and agencies at each of three levels of
government, large and disruptive changes are the norm – and these large and disruptive
changes come and go based on the whims of at least one of these policy actors. These large and
disruptive changes are not market-tested in that educators are not easily free to exit schools
that engage in operating or pedagogical practices they believe are bad for children; every public
school in the district, state or nation is routinely engaged in the new fad imposed from elected
officials or agencies from above. Most families cannot get their children out of these large and
disruptive changes if they deem them bad for their children for the same reason; these changes
were imposed from above on all public schools in the district, state or nation. Some examples
of large and disruptive changes imposed by politicians or agencies on public schools include:
Common Core, high-stakes standardized testing, New Math, Whole Language Reading, open
classrooms, zero tolerance, and tying teacher pay to test score gains. I am not suggesting that
all large and disruptive changes are necessarily bad for students. But I am suggesting that
educators and families should be able to easily escape large and disruptive changes – or escape
even small changes or escape the status quo – if they believe that there is some other
alternative that exists that is better for their students.
I am unsure if beneficial large and disruptive changes to the ways we educate youth exist. That
said, I am very sure that myriad minor student-specific, classroom-specific and school-specific
accommodations and tweaks exist. Further, these bourgeois innovations would benefit
individual students – and these minor innovations surely vary across children. A system of
universal educational choice would enable families to ask for and receive those tweaks and for
educators to be able to implement those tweaks – as both would no longer have the 13-layer-
cake of elected officials and agencies having a say in many of their decisions.

23
Universal Educational Choice and the Disadvantaged
Under an educational choice system, billionaires who have collectively given hundreds of
millions of dollars to public schools or to public school reform efforts would have an additional
way to improve education. They could provide seed money to individuals or organizations to
start excellent schools, where the students’ tuition would largely be financed by taxpayer-
funded Education Savings Accounts, tax-credit scholarships, or through redirection of taxpayer
funds to charter schools. This altruism would be a form of funding “social entrepreneurship,”
where donors seek to fund private individuals and groups to solve complex social problems.
Social entrepreneurship is common in many realms outside of K–12 education. Educational
choice would permit a dramatically greater scope for social entrepreneurship in K–12
education. That they are contributing their own money suggests they would target their
generosity to the most disadvantaged students and communities.
In addition, as stated previously, universal choice would allow a wider array of educational
opportunities for all families, but a much wider array for low-income families – as middle- and
higher-income families have some modicum of choice today via their residential location
decisions and by paying full tuition at private schools.
As discussed in the next subsection, the early returns on educational choice indicate that
disadvantaged students appear to benefit the most.
The Research on Educational Choice to Private Schools
The early research on increased parental choice to private schools has shown generally positive results. Scholar Greg Forster’s 2016 review of the research on private school choice program outcomes and recent application of his method on more recent studies generate the following thumbnail summaries:19
Twenty empirical studies have examined test score outcomes for school choice participants using random assignment of students, where some students randomly receive the school choice opportunity and others do not, among those who sought a school choice opportunity. Of these, 14 find that choice improves student outcomes: Six find that all students benefit and eight find that some benefit and some are not visibly affected. Three studies find no visible impact. Three studies, including two in Louisiana’s program – where most of the eligible private schools were scared away
19 Forster’s review of the evidence can be found at https://www.edchoice.org/wp-content/uploads/2016/05/2016-5-
Win-Win-Solution-WEB.pdf. A running tally of random assignment and quasi-experimental studies of educational
choice programs is found here and is updated periodically: https://www.edchoice.org/school-choice/empirical-
research-literature-on-the-effects-of-school-choice/.

24
by dictates and intimidation from federal and state agencies – had a negative impact. Thus, the score in favor of educational choice, from just counting studies, is 14–3–3. The claim that “no studies say that choice benefits students” is false.20
Thirty-four empirical studies (including all methods) have examined educational choice’s impact on academic outcomes for students who remain in public schools. Of these, 32 find that choice improved public schools, one finds no visible impact and one finds a negative impact. The score by counting studies, 32–1–1.
Twenty-eight empirical studies have examined choice’s fiscal impact on taxpayers and public schools. Of these, 25 find that school choice programs save money, and three find that the programs they study are revenue-neutral. No empirical study has found a negative fiscal impact.
Ten empirical studies have examined private school choice and racial segregation in schools. Of these, nine find that school choice decreases racial segregation. One finds no net effect on segregation from school choice. No empirical study has found that choice increases racial segregation.
Eleven empirical studies have examined private school choice’s impact on civic values and practices such as respect for the rights of others and civic knowledge. Of these, eight find that school choice improves civic values and practices and three find no visible impact from school choice. No empirical study has found that school choice has a negative impact on civic values and practices.
Another summary describes the national and international evidence to date. The discussion above includes only evidence from the United States. This second review of the evidence, by Dennis Epple, Richard E. Romano and Miguel Urquiola, reports:
“In this substantial body of work, many studies find insignificant effects of vouchers on educational outcomes; however, multiple positive findings support continued exploration. Specifically, the empirical research on small scale programs does not
20 One reason for the poor performance of vouchers in Louisiana was that private schools who accepted voucher students had to administer the state’s tests tied to the state’s curriculum standards. Before the voucher program existed, these private schools did not teach to the state’s standards. About 70 percent of Louisiana private schools refused to accept voucher students – which would have required them to completely revamp their curricula. Interestingly, the most recent data on the Louisiana voucher program shows that students who are attending private schools with vouchers have made great gains in learning, after the first couple of years in the program. Further, these students appear to be more likely to have post-secondary success. Studies with these findings are to be released later in 2018. Opponents of educational choice like to point to the Louisiana evidence from only the first two years of the program as indicating that educational choice does not work – but they ignore the later evidence, the flaw in the policy design of the Louisiana program, and the post-secondary evidence.
25
suggest that awarding students a voucher is a systematically reliable way to improve educational outcomes. Nevertheless, in some settings, or for some subgroups or outcomes, vouchers can have a substantial positive effect on those who use them.” 21
Those “other outcomes” where vouchers have a “substantial positive effect on those who use them” are the likelihood of graduating high school, attending college immediately after high school, and success in college (more on that follows). These authors also find that:
Studies of large-scale voucher programs find student sorting as a result of their implementation, although of varying magnitude. Moreover, research is making progress on understanding how vouchers may be designed to limit adverse effects from sorting while preserving positive effects related to competition.22
In “The Integration Anomaly,” I have written a long treatment on what we have learned from the experiences with school choice in America and around the world with respect to designing universal choice programs that promote economic and racial integration.23 Interestingly, as American society is becoming more racially integrated on many dimensions, it is the public education system that is the anomaly: American public schools have become more segregated by race in recent decades – or their integration has lagged behind – as American neighborhoods have become more racially integrated.24 As discussed in “The Integration Anomaly” and as reviewed by Forster and mentioned above, giving bigger scholarships to disadvantaged students promotes integration by race and class, contra trends in the traditional American public education system in recent decades. Another thought shared from Epple, Romano and Uruqiola’s summary of the literature on school choice is their conclusion that, “Evidence on both small scale and large scale programs suggests that competition induced by vouchers leads public schools to improve.”25 Thus, the
21 This quote comes from the abstract of Dennis Epple, Richard E. Romano, Miguel Urquiola (2015) “School Vouchers: A Survey of the Economics Literature” NBER Working Paper No. 21523 Cambridge, MA. 22 Ibid. 23 https://www.edchoice.org/research/the-integration-anomaly/. Critics of this report would not even acknowledge that empirical research even existed that found that allowing choice to private schools in America had promoted integration, https://www.edchoice.org/blog/the-integration-anomaly-author-responds-to-critics/. 24 Ibid. Also see, Kori J. Stroub and Meredith P. Richards, “From Resegregation to Reintegration: Trends in Racial/Ethnic Segregation of Metropolitan Public Schools, 1993-2009,” American Educational Research Journal 50, no. 3 (June 2013), pp. 497-531. 25 From the abstract of Epple, Romano and Urquiola. The authors note that it is difficult in practice to isolate the effects of school choice programs on the achievement of students who remain in public schools from other factors that may impact their achievement. Nevertheless, the one study they suggest does the best job of isolating the competitive effects of choice, a study of Florida’s tax credit scholarship program, finds modest benefits of this

26
only outstanding potential “concern” as Epple et al. see it, based on a large academic literature, is that students who choose to leave public schools may experience slightly lower test scores. There are two responses to this potential concern. First, Jim Kelly, founder and general counsel of the GOAL Scholarship Program, and I surveyed the parents of GOAL Scholarship recipients in Georgia.26 We found that these low- and middle-income parents had very good reasons for making the educational decisions that they did, and that they valued many other important items more than test scores – such as getting their children to college, values and school safety. That survey – as well as all the other studies we review that found similar results – reinforces that these bourgeois parents deserve dignity and equality, given the good choices they have made for their children. Again, the empirical research literature is very clear – expansions of educational choice are associated with slight improvements in outcomes for students who remain in traditional public schools. Thus, the only potential concern is for students whose families actively made a change in educational settings because they believe the new setting is better for their children. Almost unanimously, in study after study, parents who leave public schools for private schools via a taxpayer-funded choice program believe their children are much better off.27 Technocrats scoff at such evidence. Is their derision warranted? Kelly and Scafidi and other studies surveyed these choosers and they appear to have very good reasons for their choices. But are they right? Are their choices really good choices? It seems that, in very recent analyses, the research has finally caught up with what parents seemed to have known all along. Jim Kelly and I titled our study, “More than Scores:” Parents had very good reasons for moving their children to new schools using GOAL Scholarships, but higher standardized test scores were extremely low on their priority list. This very recent evidence suggests why these parents appear to have their priorities in order. Non-cognitive outcomes such as patience, persistence, grit and values appear to be very important for post-secondary outcomes and later life outcomes, but undue focus on standardized testing may in fact harm those valuable non-cognitive outcomes. For a summary of this evidence as it relates to non-cognitive outcomes, please see, “School Choice and Non-Cognitive Skills: The Implications of Recent Evidence for Policy and Practice,” by Martin West of the Harvard Graduate School of Education. West wisely cautions that research on non-cognitive outcomes is in its infancy, but the early returns explain how
program on the achievement of students who remain in Florida public schools. This study is: David Figlio and Cassandra Hart, “Competitive Effects of Means-Tested School Vouchers,” American Economic Journal: Applied Economics,6(1): 133-156, 2014. See, also: Patrick J. Wolf and Anna J. Egalite (2016), “Pursuing Innovation: How Can Educational Choice Transform K-12 Education in the U.S?” http://www.edchoice.org/wp-content/uploads/2016/05/2016-4-Pursuing-Innovation-WEB-1.pdf 26 https://www.edchoice.org/research/more-than-scores/ 27 http://www.tandfonline.com/doi/abs/10.1080/15582159.2017.1395639?af=R&journalCode=wjsc20

27
educational choice programs (and Catholic schools, in earlier research) seem to have small positive or null effects on student test scores, but large and positive benefits in terms of post-secondary outcomes and parent satisfaction. This evidence summarized by West is also consistent with the notion that parents can observe important things about educational quality that central observers and governments cannot, as suggested by surveys of parents who exercise choice (including the survey by Kelly and Scafidi), further evidence that the bourgeoisie deserve equality and dignity with respect to their autonomy to make decisions for themselves. Finally, three recent studies – two not publicly available yet – have found that choice programs
in Louisiana, Florida and Milwaukee have led to gains in college attendance and attainment,
especially for disadvantaged students. The studies for Louisiana and Milwaukee are expected to
be released later in 2018; the study for Florida can be found here:
https://www.urban.org/research/publication/effects-statewide-private-school-choice-college-
enrollment-and-graduation/view/full_report.
Epple, Romano and Urquiola note that systemic benefits of educational choice and benefits to
students who actually choose may be difficult to detect in the studies they review, because
greater choice may force all schools to improve.
In the next subsection, I present the systemic evidence from the state that has had the most
educational choice in the United States – Arizona.
Evidence from the State with the Most Educational Choice - Arizona
The state that has undertaken the most K-12 educational choice to date is the state of Arizona.
Arizona families have the choice to:
- Attend traditional public schools
- Attend private schools using taxpayer-funded scholarships
- Attend charter schools that receive 92.3 percent of the per-student funding that
traditional public schools receive.28
- Receive educational services outside of school settings with Education Savings
Account dollars.
28 https://www.azleg.gov/jlbc/districtvscharterfunding.pdf

28
To be clear, while these opportunities began in the 1990s, they were initially very limited in
terms of who could access the middle two alternatives listed just above. It is only in recent
years that opportunities to attend private schools using taxpayer-funded scholarships and to
attend charter schools became more ubiquitous. And, access to Education Savings Accounts
(ESA) is being expanded at the time of writing this report – in 2017 an ESA program was signed
into law that would cover almost all Arizona students. However, this law has not been
implemented due to litigation. All of that said, Arizona has allowed more total choice – among
private schools, charter schools and non-school education alternatives than any state. For
example, Arizona has more than 600,000 fewer public school students than Georgia, but 459
more start-up charter public schools.29 Arizona also has five separate private school and
educational choice programs. 30 Once Arizona’s 2017 ESA program becomes active, Arizona will
have achieved a system of universal choice highly similar to what is proposed in this report.
Given all of this choice for families in Arizona – among traditional public, private, charter, cyber,
homeschool and non-school education options and given all of these opportunities for
educators outside the traditional public school system to pursue innovation and what their
expertise thinks is best – what have been the results?
The best available test score evidence comes from the National Assessment for Education
Progress.31 NAEP tests are administered by an independent governing board that is attached to
the U.S. Department of Education and are given to a sample of traditional public, charter and
private school students in each state. Thus, not all students take the NAEP, just students who
are in the sample. The “Main NAEP” results allow for state-by-state comparisons.32
Below are changes in Main NAEP results for grades 4 and 8 in Reading and Mathematics tests
for both Arizona and Georgia. The results shown below are for students from all education
sectors in each state, not just traditional public schools, so traditional public, charter public and
private school students are included in the results below. The changes in average test scores
29 https://nces.ed.gov/programs/digest/d16/tables/dt16_203.20.asp?current=yes. As stated previously, Georgia
has 97 start-up charter schools, and Arizona has 556 – https://azcharters.org/about-charter-schools/ . 30 Descriptions of the educational choice available in Arizona can be found at the following links:
https://www.edchoice.org/school-choice/state/arizona/ ; scroll down at this link –
https://www.edchoice.org/school-choice/school-choice-in-america/#map-overlay; and https://azcharters.org/about-charter-schools/. 31 https://nces.ed.gov/nationsreportcard/about/ 32 NAEP Long-Term Trend tests are designed to allow for national comparisons over time. Long-Term Trend results are not available for individual states, so they cannot be used here. The Main NAEP tests are updated periodically to reflect changes in what schools are teaching. Researchers sometimes mistakenly use Main NAEP results to analyze long term trends. For more information on this issue, please see: https://nces.ed.gov/nationsreportcard/about/ltt_main_diff.aspx.

29
are between 2007 and 2015. By 2007 educational choice had become a significant option in
Arizona; 2015 is the most recent year available.
As shown in the next four charts, students in both Arizona and Georgia experienced learning
gains between 2007 and 2015, as both states expanded choice, but the gains were larger in
Arizona, where choice was expanded significantly more.
J) Change in Main NAEP Grade 4 Reading Scores, 2007 to 2015
Source: https://nces.ed.gov/nationsreportcard/naepdata/
K) Change in Main NAEP Grade 4 Math Scores, 2007 to 2015
Source: https://nces.ed.gov/nationsreportcard/naepdata/
2
5
3
US Arizona Georgia
0
6
1
US Arizona Georgia
30
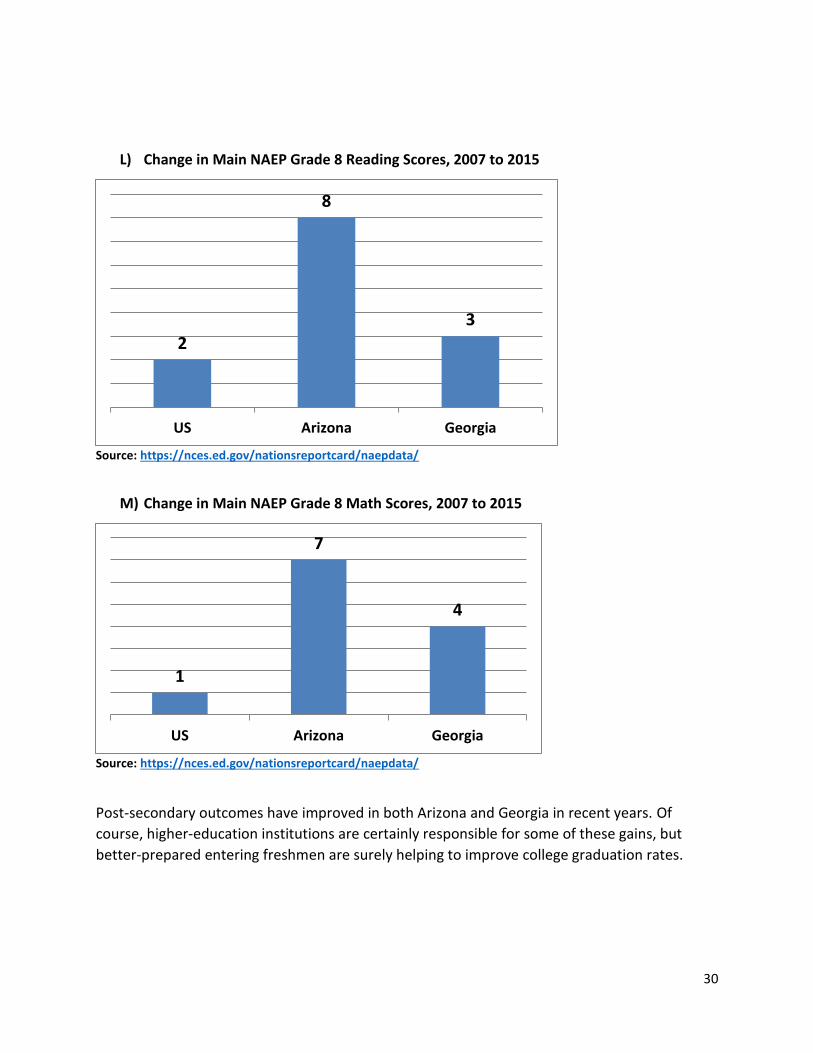
L) Change in Main NAEP Grade 8 Reading Scores, 2007 to 2015
Source: https://nces.ed.gov/nationsreportcard/naepdata/
M) Change in Main NAEP Grade 8 Math Scores, 2007 to 2015
Source: https://nces.ed.gov/nationsreportcard/naepdata/
Post-secondary outcomes have improved in both Arizona and Georgia in recent years. Of
course, higher-education institutions are certainly responsible for some of these gains, but
better-prepared entering freshmen are surely helping to improve college graduation rates.
2
8
3
US Arizona Georgia
1
7
4
US Arizona Georgia
31
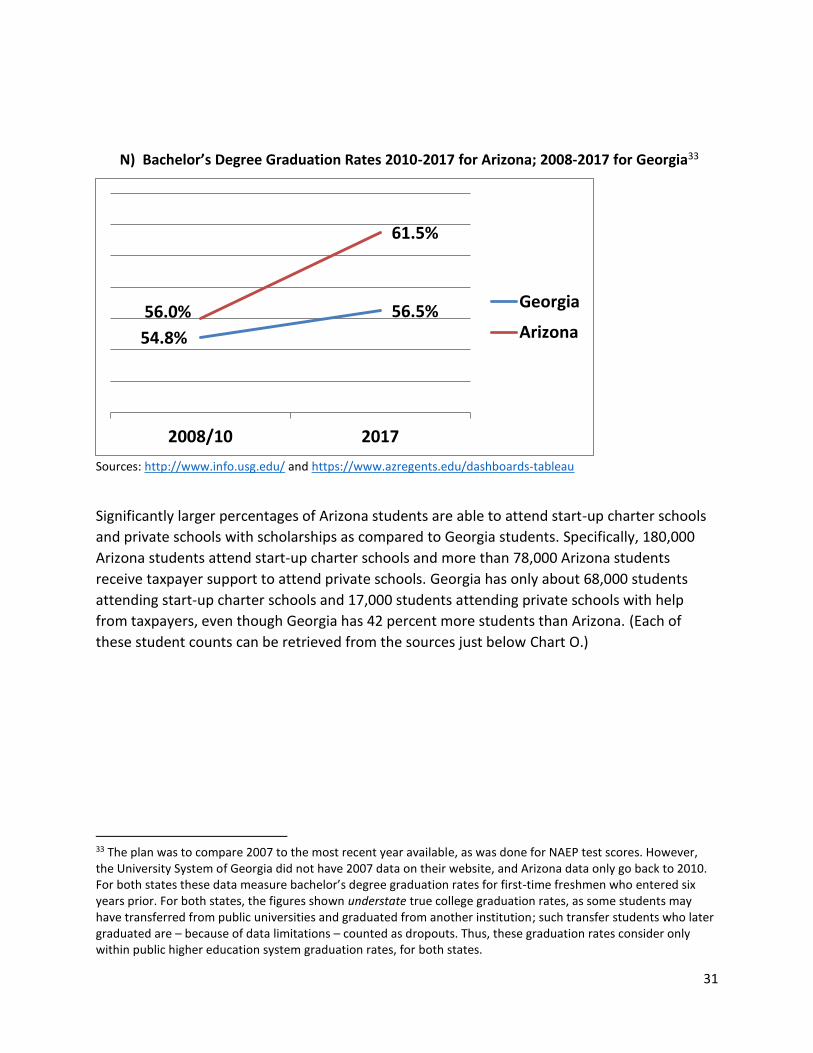
N) Bachelor’s Degree Graduation Rates 2010-2017 for Arizona; 2008-2017 for Georgia33
Sources: http://www.info.usg.edu/ and https://www.azregents.edu/dashboards-tableau
Significantly larger percentages of Arizona students are able to attend start-up charter schools
and private schools with scholarships as compared to Georgia students. Specifically, 180,000
Arizona students attend start-up charter schools and more than 78,000 Arizona students
receive taxpayer support to attend private schools. Georgia has only about 68,000 students
attending start-up charter schools and 17,000 students attending private schools with help
from taxpayers, even though Georgia has 42 percent more students than Arizona. (Each of
these student counts can be retrieved from the sources just below Chart O.)
33 The plan was to compare 2007 to the most recent year available, as was done for NAEP test scores. However, the University System of Georgia did not have 2007 data on their website, and Arizona data only go back to 2010. For both states these data measure bachelor’s degree graduation rates for first-time freshmen who entered six years prior. For both states, the figures shown understate true college graduation rates, as some students may have transferred from public universities and graduated from another institution; such transfer students who later graduated are – because of data limitations – counted as dropouts. Thus, these graduation rates consider only within public higher education system graduation rates, for both states.
54.8%
56.5%56.0%
61.5%
2008/10 2017
Georgia
Arizona
32
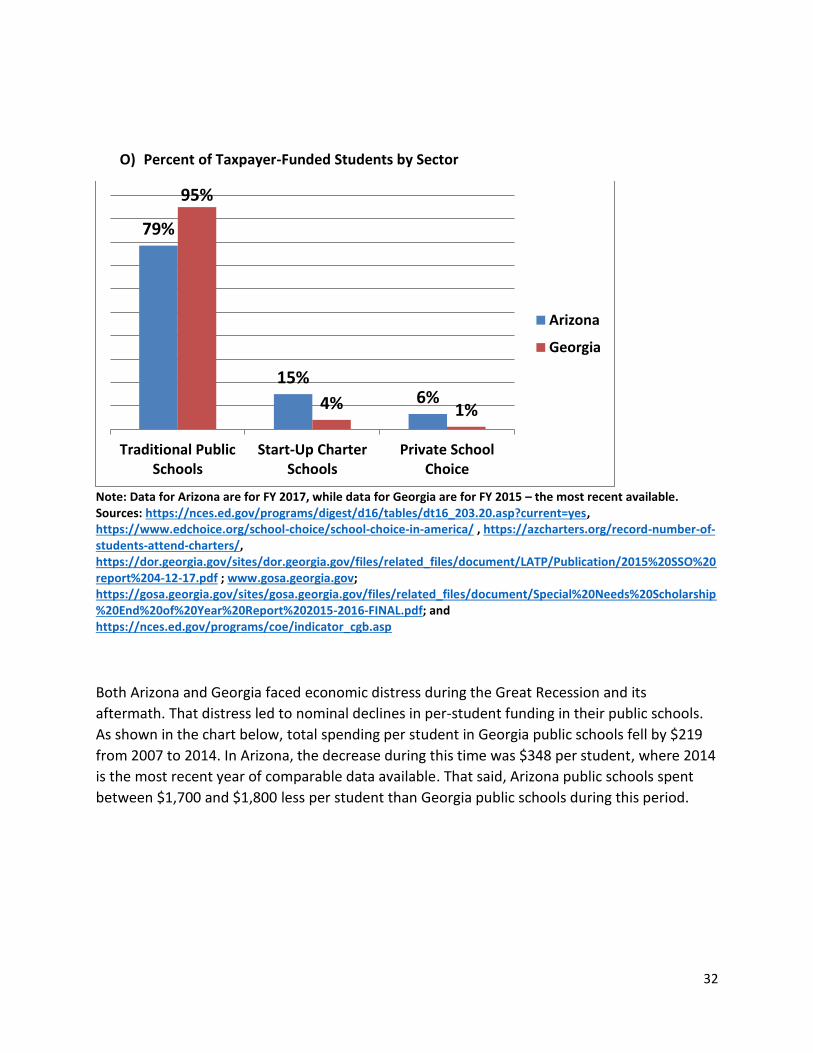
O) Percent of Taxpayer-Funded Students by Sector
Note: Data for Arizona are for FY 2017, while data for Georgia are for FY 2015 – the most recent available. Sources: https://nces.ed.gov/programs/digest/d16/tables/dt16_203.20.asp?current=yes, https://www.edchoice.org/school-choice/school-choice-in-america/ , https://azcharters.org/record-number-of-students-attend-charters/, https://dor.georgia.gov/sites/dor.georgia.gov/files/related_files/document/LATP/Publication/2015%20SSO%20report%204-12-17.pdf ; www.gosa.georgia.gov; https://gosa.georgia.gov/sites/gosa.georgia.gov/files/related_files/document/Special%20Needs%20Scholarship%20End%20of%20Year%20Report%202015-2016-FINAL.pdf; and https://nces.ed.gov/programs/coe/indicator_cgb.asp
Both Arizona and Georgia faced economic distress during the Great Recession and its
aftermath. That distress led to nominal declines in per-student funding in their public schools.
As shown in the chart below, total spending per student in Georgia public schools fell by $219
from 2007 to 2014. In Arizona, the decrease during this time was $348 per student, where 2014
is the most recent year of comparable data available. That said, Arizona public schools spent
between $1,700 and $1,800 less per student than Georgia public schools during this period.
79%
15%6%
95%
4% 1%
Traditional PublicSchools
Start-Up CharterSchools
Private SchoolChoice
Arizona
Georgia

33
P) Nominal Per-Student Funding in Public Schools
Sources: https://nces.ed.gov/programs/digest/d10/tables/dt10_192.asp and https://nces.ed.gov/programs/digest/d16/tables/dt16_236.75.asp?current=yes
Arizona public school students had 15.7 percent less in taxpayer funds spent on their education
than Georgia public school students in 2007. By 2014, Arizona students received 17.3 percent
less than Georgia students. It is worth noting that the statewide cost of living in Arizona is 5.1
percent higher than the cost of living in Georgia.34,35
To summarize: As Arizona allowed significantly more educational choice than Georgia, spent
significantly less on their public schools than Georgia, had larger funding decreases during the
Great Recession and its aftermath than Georgia, Arizona also had higher test score gains
during the 2007 to 2015 period than Georgia and larger gains in college graduation rates.
Educational Choice is Also Increasing in Several Other States
Examples of states with significant K-12 educational choice programs include Indiana, Florida,
Nevada and Wisconsin. A brief description of each is presented below.
34 https://www.missourieconomy.org/indicators/cost_of_living/ 35 Further, NAEP test scores are slightly higher in Arizona relative to Georgia, and the increases in the percent of students from historically disadvantaged racial and ethnic groups and the percent of children living in poverty in Arizona and Georgia between 2007 and 2015 were virtually identical. See, for example, https://nces.ed.gov/nationsreportcard/naepdata/dataset.aspx and http://datacenter.kidscount.org/locations.
$8,878$8,530
$10,537 $10,318
2007 2014
Arizona
Georgia

34
Indiana36
Indiana has two private school choice programs in addition to charter schools and a vibrant
public-to-public school transfer program. In 2016, Indiana had 91 charter schools serving 40,300
students.37 The two private choice programs – the School Scholarship Tax Credit and Choice
Scholarship Program – now account for over 3 percent of all K-12 students in Indiana.
Additionally, more than half the school-age children in the state are eligible to participate in the
programs. Indiana’s program was the fastest-growing voucher program ever and is now the
nation’s largest single voucher program. Moreover, even though the program is statewide and
broadly available to middle-income families, as the chart below shows, 68.3 percent of the
families in the program qualify for the federal free and reduced-price lunch program.
Q) Indiana K-12 Education by School Type
Source: Indiana Department of Education
36 https://www.edchoice.org/school-choice/state/indiana/ 37 https://ballotpedia.org/Charter_schools_in_Indiana

35
Nevada38
Nevada burst on to the educational choice scene in 2015 when it passed both a scholarship tax
credit program and the nation’s first nearly universal education savings account program. The
ESA program allows every student in Nevada who has attended public school for the prior 100
days to receive and use an ESA to customize their child’s education. The program was
immediately sued; the state’s Supreme Court ruled it was constitutional. The court also ruled,
however, that the funding source for the program needed to be changed. Efforts to fund the
program have come up short in subsequent years – so the state has on the books the broadest
educational choice program in the country that is entirely unfunded. (Arizona also has a
virtually identical and broad ESA program that has not begun – due to litigation in Arizona. In
both Nevada and Arizona virtually all traditional public school students and all students in the
very early grades are eligible for ESAs roughly equivalent to state funding per student in
traditional public schools, and the hope is these programs will begin operation soon.)
Florida39 Florida was an early adopter of educational options. The state has a robust charter school program. As of 2017, Florida had 654 charter schools serving 283,000 students.40 In addition, Florida operates three private school choice programs: a voucher program for special needs children, an ESA program for special needs children, and a tax credit scholarship program for low-income children. Through the great work of Step Up for Students, the tax credit scholarship program is by far the largest of its kind, with almost 100,000 children benefiting from the program. As a result, one-fifth of all American children participating in a private school choice program reside in Florida.
Wisconsin41 In Wisconsin, there were 244 charter schools in 2016 serving 44,800 students.42 Wisconsin is the home to the first modern voucher program, enacted in 1990 to serve low-income children in the city of Milwaukee. In the first eight years, due to a lawsuit against the program, religious schools were excluded. In 1998, the Wisconsin Supreme Court ruled in favor of the program, including allowing children to attend religious schools, and participation took off. The program remained contained in Milwaukee and only available to low-income families for more than 20
38 https://www.edchoice.org/school-choice/state/nevada/ 39 https://www.edchoice.org/school-choice/state/florida/ 40 http://www.fldoe.org/schools/school-choice/charter-schools/ 41 https://www.edchoice.org/school-choice/state/wisconsin/ 42 https://ballotpedia.org/Charter_schools_in_Wisconsin

36
years. Finally, in 2011, the state began to increase the number of educational choice programs and the number of eligible children. In 2011, the state passed a program for children in Racine, in 2013 it passed a statewide program, and in 2015 it passed a program for children with special needs. The statewide program passed in 2013 is one of the broadest in the nation, with 88 percent of all children eligible to participate.
What these states show is that it is politically possible to have larger programs that are
broadly available to most and even virtually all children.
Takeaways
The evidence presented in this section highlights these primary benefits of allowing universal
educational choice for families and educators:
- Educators will be able to freely make small adjustments and accommodations that
they believe will benefit individual students.
- Families will be more empowered to seek and actually obtain small adjustments and
accommodations for their children.
- Large and disruptive innovations that are actual improvements on the ways to
educate youth are more likely to be discovered and implemented under a universal
choice system.
- The largest benefits to students who choose will likely be in terms of post-secondary
outcomes.
- Modest test score gains for students who remain in public schools have been the
norm when greater choice is allowed, as are test score gains for disadvantaged
students who exercise choice.
Finally, this section makes three additional points relevant to the issue of whether to move
from the current K-12 education system to a universal choice system:
- There is “proof of concept” with respect to educational choice in terms of academic
studies of small-scale American choice programs and with the systemic evidence
from Arizona described above.

37
- There is a decades-long “proof of stagnation” from the current educational system
with its increasing costs, increasing staffing, stagnant wages for its most important
talent, and stagnant outcomes for students.
- There is “proof of political feasibility” given that significant educational choice
efforts have been made in several states.

38
IV. Specific Recommendations for Fall 2020 – Universal Educational Choice
It is possible for the state of Georgia to have a system of universal educational choice in place
for students, families, and educators for the fall of 2020. As described in the previous section, a
system of universal educational choice would allow families to choose among schools from all
sectors and choose among non-school education service providers who will have prior approval
from state officials. Universal educational choice would also give educators the freedom to
design school and non-school educational opportunities in the manners they deem best for
students.
To create a system of universal educational choice in Georgia, I offer the following specific
proposals tailored to the current education policy landscape. Space does not allow the
delineation of all details for each of the specific recommendations below, but I have
endeavored to cover all important details and I am willing to discuss any omitted details with
anyone interested in improving educational opportunities for children in Georgia.
My specific recommendations are briefly described below. The next section proposes metrics
that would hold the system of universal educational choice accountable to taxpayers.
Universal Education Savings Accounts
Provide each school-aged child, who currently attends a public
school or is entering grades K or 1, with an Education Savings
Account (ESA) equal to 90 percent of state taxpayer spending
per student, which would include all QBE and non-QBE state
funds for K-12 education. For FY 2016, this would have
amounted to $4,512 per student. For fall 2020, it will be
significantly higher – given the generous increases in state
taxpayer funding that Governor Nathan Deal and the General
Assembly have given to Georgia public schools in recent years.
With an ESA, a state deposits taxpayer funds into tailored bank accounts or onto tailored debit
cards for use on educational expenses. Parents can pay for online classes, private school tuition,
personal tutors and textbooks, along with a host of other education-related services, products
and providers. Families can save money for later K-12 years, move ESA funds across siblings and
even use the accounts for future college tuition and fees. ESAs give families the maximum
amount of educational choice across school and non-school educational settings and give them
an incentive to be cost-conscious as well.
39
The 90 percent amount provides some savings to the state to offset the giving of ESAs to
students who may have transferred to private schools even without receipt of ESAs.
Tax Credit Scholarships
Increase the cap on statewide donations to scholarship
organizations to $150 million, with a perpetual 20 percent
escalator clause whenever the cap is hit.
The current cap on statewide donations to Georgia’s tax credit scholarship program is $58
million. It is set too low: Donors endeavored to contribute $105.5 million to this popular
student scholarship program in 2018 – on the first business day of the year!
The cap on statewide donations should be immediately raised to $150 million annually with a
perpetual 20 percent escalator. Why $150 million instead of $105.5 million? Some donors
would surely like to contribute to the program, but are unable to, given the statewide cap is
going to be hit on the first business day of the year, as has been the case for several years
running. A cap of $150 million will ensure that more Georgia taxpayers who wish to contribute
to student scholarships have the opportunity to do so. That said, recent history suggests that
the $150 million cap also would be hit in its first year of existence, as there is large and growing
demand for this opportunity.
Given that all students will be receiving ESAs under the previous recommendation, student
scholarship organizations (SSOs) will be free to use the donations they receive to offset tuition
payments that are above the ESA amounts given to students. With the pro-low income policies
of the SSOs now, their preference for serving even more low-income students will only increase
once students receive ESAs. (The family income of students to which individual SSOs give their
scholarships is publicly available; it deserves even greater publicity.43)
Technocrats will have an itch to require SSOs to give their funds only to low-income students
and to students with special needs. This itch is problematic, as SSOs and individual private
schools will have better information about the true economic status of individual families.
Sadly, divorces happen, parents lose their jobs, families have large health expenses, etc. Private
43 Information on the income categories where individual SSOs give scholarships are publicly available here: https://dor.georgia.gov/documents/calendar-year-qualified-education-expense-credit-report . This reporting on the income of the families of scholarship recipients should be made more clear and receive more publicity. That said, the data show that overall the tax credit scholarship program has, by its actions over several years, revealed a preference for giving scholarships to students from relatively low-income backgrounds. Once all students receive $5,000, or so, ESAs, it is likely that SSOs would target their resources to even more low-income students, given their actions to date.

40
schools will recommend that their partner SSOs give scholarships to students with unique
economic circumstances, and SSOs can communicate with individual families about their
unique situations. Some large- and middle-income or even slightly higher-income families may
have a child facing bullying or a bad peer situation – and may be in a dire need of a scholarship.
No government criteria can allow for all of these social and economic eventualities.
A beauty of Georgia’s tax credit scholarship program is that no one’s funds go where they do
not want them to go. It is a choice. Those who oppose the tax credit scholarship program,
where students receive scholarships to attend private schools that their parents deem better
than their current school options, need not donate. If you want to give to an SSO that gives its
funds only to extremely low-income children and/or children with special needs, scholarship
organizations allow that. For example, GOAL allows my family to earmark our donation to only
needy students, and we do so. If you want your funds earmarked for scholarships at only
certain schools you deem of high quality, you may do so. What other government program in
world history has had 100 percent of taxpayers having their hard-earned dollars spent in a
manner they deem desirable?44
Georgia Special Needs Scholarship Program
Add these scholarship awards to the Education Savings Accounts
(ESAs) mentioned above. This change would more than double
the size of ESAs for these students with additional needs.
By converting the Georgia Special Needs Scholarship program to an ESA, families with special
needs to students would have a large array of non-school educational services available for
their children. By adding the special needs scholarship dollars to ESA dollars, special needs
students who opt for ESAs would have approximately 91 percent of the average amount of
taxpayer funds spent per student in traditional public schools. While this lower amount seems
unjust, and it is, it would be a drastic improvement over the current Georgia Special Needs
Scholarship Program. Today, average scholarship awards are only about half as large as the
average amount spent per student in traditional public schools. SSOs would be able to enhance
these awards under this proposal.
44 The accountability facing individual private schools via this program is intense—for example, a given private school must first convince students to come to their school, and donors to these SSOs must allow their donations to be used at the school. Thus, private schools must convince potential students and SSO donors that their educational offerings are worthy of funding.

41
Charter Public Schools
Provide charter school students with non-QBE state funding,
federal funding and local funding equal to each student’s
proportional share of QBE funding. For charter schools
authorized by the Georgia State Charter Schools Commission,
which do not receive local taxpayer funding under current law,
make the state supplement provided to students equivalent to
their proportional share of local funding in their community. In
plain English: Taxpayer funding per student would become equal
between traditional and charter public schools. This funding
parity also applies to career academies, which can be charter
schools.
To explain this change, let’s use large figures for ease of exposition – If a charter school student
earned 1 percent of QBE funding in his or her community, then that student would receive 1
percent of non-QBE state funding, 1 percent of federal funding and 1 percent of local funding –
or in the case of students who attend Commission charter schools, a state supplement equal to
1 percent of local funding. In reality, individual students would earn a small fraction of 1
percent, given the large number of students in each Georgia community.45
This proposal would ensure that charter school students are finally treated “no less favorably”
than traditional public school students with regard to taxpayer funding devoted to their
education. As stated previously, Georgia law requires that charter school students be treated
“no less favorably” with regard to funding and they are, in fact, treated significantly less
favorably. This recommendation would also increase funding for students at career academies.
Cyber Charter Schools
Provide cyber charter school students with two-thirds of the
amount of total funding given to brick-and-mortar public
schools.
45 As an example, if there were 200,000 K-12 students residing in Gwinnett County, and a given student earned average QBE funding among these 200,000 students, then this hypothetical “average” student would earn 1/200,000 of QBE funds for Gwinnett County students. And, this student would then receive 1/200,000 of non-QBE state funds devoted to Gwinnett County children, 1/200,000 of the federal funds devoted to Gwinnett County children, and 1/200,000 in either local taxpayer funds if attending a charter school authorized by the Gwinnett County Public Schools or a state supplement equal to that amount in the case of children attending a Commission charter school.

42
While cyber charter schools do not have significant “brick and mortar” costs, they do employ
teachers and counselors and face significant technology costs. That said, these schools incur
lower total expenses than brick-and-mortar charter schools. I analyzed this issue several years
ago with several state officials, and two-thirds funding for cyber charter schools was our
approximate conclusion in terms of need.
Given their vast enrollment, it is clear that thousands upon thousands of Georgia families
believe that cyber charter schools are the best educational option available for their children.
State policymakers should take analyses of cyber charter schools – even well-crafted analyses –
with a grain of salt, as it is especially difficult to obtain the proper counterfactual for cyber
charter students. As discussed later, the antidote to low school performance is providing
families and educators more choice, not less.
Charter School Policy
Charter school authorizers should focus on increasing choice instead of focusing on closing schools. Paradoxically, this change in emphasis will lead to better statewide outcomes for students. For proof, look to Arizona.
As the charter school movement began to pick up steam in the late 1990s and early this
century, it was common for charter school advocates to ridicule Arizona’s charter school policy
as the “Wild Wild West.” For example, in a 2004 report for the Progressive Policy Institute (PPI),
prominent education analysts – who were pro- to reasonably pro-charter schools, suggested
that Arizona revamp its charter policy along the lines proffered by some national charter school
advocates – including making it more difficult for charter schools to be formed and to close
down supposedly poor performing charter schools more rapidly.46
We could not have been more wrong. I include myself in this group of naysayers, having
derisively referred to Arizona charter school policy as the “Wild Wild West,” on occasion.
Unfortunately, some national charter advocates still hold views at odds with actual outcomes in
Arizona.
The “Wild Wild West” proved to be a better charter authorization policy relative to so-called
best practices. That is, Arizona’s decade-plus long policy of a “light touch” approval process
with 10-year charter contracts has proved to be a better policy for improving statewide
46 https://files.eric.ed.gov/fulltext/ED491207.pdf

43
performance – across all school sectors. As Matt Ladner, now of the Charles Koch Institute, has
written:
… if Arizona had five-year charters and default closures we might have
arbitrarily closed some schools which blossomed into very high
performing operations that now do a great job with disadvantaged kids …
Meanwhile these schools faced a much harsher form of accountability –
from Arizona parents. Hundreds of Arizona charter schools have closed,
and their average length of existence is 4 years, with an average of only
62 students in the final year of operation. If you live to see year 5 as an
Arizona charter school, you are probably doing something right because
everyone wants your students – your home district, fancy school districts
like Scottsdale, Madison and Chandler are playing the open enrollment
game, the other charter schools, and the private schools with the
assistance of choice programs.47
Of course, this approach is more viable if there are significant private school choice
opportunities, as has been the case in Arizona. With more private school choice opportunities,
charter schools are held accountable by both traditional public schools and private schools.
As Ladner also points out, there is so much choice in Arizona now that even high-income
traditional public school districts are recruiting the “unwashed masses” who live in other
districts to come into their schools to fill empty seats!
Even the PPI report cited earlier pointed out that several studies showed competition from
charter schools had improved the performance and customer service of Arizona’s traditional
public schools and led their traditional public schools to give more autonomy to their
educators.48 Yet, despite this evidence, the authors of the PPI report wanted Arizona to close
more charter schools in order to protect the children whose families believed those charter
schools were their best available option – so much for economic historian Deirdre McCloskey’s
notion that the bourgeoisie deserve dignity and equality and that allowing us to have dignity
and equality has led to tremendous gains in human well-being. Perhaps we should ask the
bourgeoisie why they chose the schools that they did – before working hard to close them
down and force these (often) disadvantaged parents to send their children to schools they
believe are worse than their current school.
47 https://jaypgreene.com/2017/06/28/lgk-on-arizonas-wild-west-charter-schooling/ 48 See numbered pages 24-25 in the PPI report for a description of how Arizona charter schools were leading to
improvements in traditional public schools, https://files.eric.ed.gov/fulltext/ED491207.pdf.

44
To increase choice, charter authorizers in Georgia should focus on technical assistance to
petitioners and to open charter schools. In addition, authorizers should allow proven charter
school operators from other states to open multiple schools at once in Georgia. Some of these
successful charter operators are native Georgians!
Traditional Public School Systems (Districts)
Restore autonomy over testing and teaching to the local level,
by allowing local public school boards choose annual norm-
referenced tests from a state-approved list and report the
results to parents; let local school boards choose whether to
administer state of Georgia tests of the state’s curriculum
standards. Public school systems, like all other education service
providers, will be held accountable by families exercising choice
and by their competitors.
Local school districts lost this autonomy decades ago. In a system of universal educational
choice, the primary mechanism for holding individual schools and educational providers
accountable for service quality and for keeping costs down will be the choices made by
individual families. Families will endeavor to choose the best educational services for their
children – be they traditional public schools, charter public schools, virtual schools, hybrid
schools, career academies, micro schools, private schools or non-school education service
providers. And given the nature of Education Savings Accounts, where unspent funds can be
used for other children, saved for future years, or saved to offset college tuition, families will
have an incentive to be cost-conscious – and therefore all schools and education service
providers will have an incentive to provide their services at the lowest possible cost.
In such a system of universal school choice, it is unnecessary for higher levels of government to
regulate traditional public school districts (a) based on inputs or (b) based on student
outcomes. The former has led to input policies that have dramatically increased public school
staffing relative to student enrollment growth, held down teacher salaries and led to stagnant
measurable outcomes for students over many decades.49 Public school advocates have been
shouting from the mountaintops for almost two decades that undue focus on high-stakes
standardized testing has narrowed what is taught; increased stress on students, given
educators and incentive to cheat on student tests; limited recess, physical education, field trips
49 See, for example, https://www.edchoice.org/research/back-staffing-surge/ or https://www.amazon.com/Schoolhouses-Courthouses-Statehouses-Funding-Achievement-Americas/dp/0691130000/ref=sr_1_2?ie=UTF8&qid=1516312494&sr=8-2&keywords=Eric+Hanushek.

45
and other out-of-class and untested assignments; etc.50 As discussed later in this report,
universal educational choice is the way to free traditional public schools from these policies.
Homeschools
Parents should be free to homeschool their children, and the state should impose no further
burdens on homeschool parents than exist now. Policy should respect homeschooling as a
legitimate form of education. Homeschool students should be able to earn HOPE Scholarships a
priori and participate in extracurricular activities at their local public schools if they so choose.51
Homeschool students should be offered Education Savings Accounts to
finance their education. Funds not expended on homeschooling costs
such as computers, books and curricular materials may be saved for
other children in the family or for college expenses. Many, most or even
virtually all homeschool families will decline these ESAs out of concerns
about government encroachment on their educational freedom.
My hope is that ESAs expand the educational freedom of all students, and perhaps many years
after the creation of ESAs – if educational freedom of ESA students is the rule in practice – that
homeschool families will accept ESAs. That said, accepting or declining ESAs should be the
choice of the homeschool families.
50 See, for example, https://newrepublic.com/article/145935/settling-scores. 51 If a homeschool student misbehaves at an extracurricular event, the public school should have the right to have the student leave the event, and if the misbehavior happens again, the public school should have the right to expel the misbehaving homeschool student from all future extracurricular events—I say all of this because public school leaders claim they would have no possible way to discipline a homeschool student who misbehaved at an extracurricular event. That sentiment is clearly false.

46
V. Metrics for Measuring Success in a Universal Choice K-12 Education System
Taxpayers write the significant – and increasingly large – checks to fund the K-12 education
system of today, where virtually all of those funds go to traditional public schools. Under a
universal choice system, where all students receive taxpayer resources to fund all or at least
some of their education, taxpayers have a duty and a right to know whether their funds are
being well spent, as in any education system. That said, measurements of efficacy should not:
- Harm the education of students
- Drive potential education providers from even entering the K-12 system
- Give incentives for educators to ignore potential innovations, accommodations for
individual students, or narrow curricular offerings by “teaching to the test” or
engaging in any other manipulations to goose performance on metrics in manners
that do not benefit students.52
In addition, measurements of efficacy should:
- Help parents make better judgments about the education that their own children are
receiving
- Raise awareness to families about the existence of potential choices and basic
information regarding schools and other educational settings from which they can
choose.
So the issues are (a) How can we provide valuable information to parents about how their
children are doing and valuable information about their potential alternatives? (b) How can we,
at the same time, preserve educators’ autonomy to innovate and accommodate the unique
needs of individual students as opposed to imposing a stultifying and manipulatable system of
largely multiple-choice tests? Is it possible to do (a) and (b) simultaneously?
I offer four broad recommendations to provide valuable information to families, to promote
bourgeois innovation and individualized student attention by educators, and to extricate public
school teachers and students from the current accountability regime.
52 That educators engage in such behavior is human nature and should be taken into account by those designing a system of performance metrics. Blaming public school educators for these issues is casting blame in the wrong direction. Well-intended but misguided policy is the ultimate cause of things like “teaching to the test.” Outright cheating by educators, such as erasing students’ wrong answers and replacing them with correct ones, obviously suggests culpability by educators and policies that incentivize such cheating.

47
First, for students in grades 3 and above who receive some sort of taxpayer subsidy for their
education, all schools will be required to administer to them nationally norm-referenced
tests. Schools can choose from a list of tests that are either state-approved, private school
association-approved, charter school association-approved, or approved by any association of
20 or more schools. As a rule of thumb, each of the major existing norm-referenced tests
should be allowed, as well as any quality new tests that are developed. Schools would be
required to administer these annual tests in Reading and Mathematics, but free to offer
standardized testing in other subjects and in earlier grades, if they wish. Homeschooled
students can be tested at their parents’ discretion.
Annual standardized testing would tell customers – students and their families – how each student is progressing from year to year. Such information is not available for students and parents in higher education; this absence may be one reason that fly-by-night colleges exist. If customers (families) were armed with annual, credible test results, they would be empowered with the information to avoid situations that are not contributing to learning gains.
Importantly, these test results would be reported to parents. That is, individual parents would
annually receive the test scores earned by their children, but there would be no aggregation of
scores at the teacher or school or sector level mandated by any government entity.
Interestingly, Arizona has not required norm-referenced testing of scholarship recipients in its
private school choice programs to date, and statewide student achievement rose at a rapid
rate. In their ESA expansion that has not yet begun, however, scholarship students will be
required to take norm-referenced tests at their private schools – and, upon request by parents,
private schools with more than 50 taxpayer-funded scholarship students must share average
student test score information. This latter provision provides no valuable information to
parents about school value added, could lead to more sorting by achievement across schools as
parents seek better-achieving peers (as has been happening in the traditional public school
sector), and gives private schools the incentive not to admit low-achieving students. I wrote
about these issues at length in, “The Integration Anomaly.” All of that said, reporting school
averages to parents upon request is less problematic than reporting them to the state.
Therefore, none of these negative possibilities may come to pass. But this issue is worth
monitoring going forward. The technocratic impulse to “help” students must not end up
harming the most disadvantaged. Choice systems should not import the technocratic (and
other) mistakes of our current education system.

48
Second, efforts like www.GreatSchools.org and www.privateschoolreview.com should be
promoted by civil society. These information- and crowd-sourcing websites provide excellent
basic information about schools to help parents navigate among their choices. 53 The crowd-
sourced comments will be invaluable to parents as they benefit from this form of word of
mouth. Like crowd-source tools in other arenas, schools and education service providers should
be allowed to respond to reviews.
Parents care about so many more things than just test scores, and it is important to ensure they have information. Hence, transparency is critical to the success of a universal choice system, and it is something that can be achieved in non-bureaucratic ways. For example, consider the experience of buying an airline ticket today, something that very few people, particularly low-income people, did in large numbers a mere 30 years ago. Today, thanks to websites like Google Flights and Trivago, flyers are well aware of the cost of a ticket and easily able to find the best price and value. The same is true of hotels, which include reviews by individuals. This proposal would require schools and providers simply publish on the internet basic, non-test score information such as cost, the number of teachers and number of students. Doing this will allow GreatSchools, Private School Review and non-governmental organizations to collect the information and ensure transparency without excessive government mandates.
Third, require schools to be accredited by approved accrediting agencies. Colleges have this requirement, but it leads to costly input-based policies and does not seem to have completely stopped the creation of fly-by-night schools that appear to be able to attract students without providing these students much in the way of tangible benefits. Thus schools and prospective schools should have significant choice among accrediting agencies. The Texas model of accrediting schools appears to work well. Schools can choose among 15 accrediting agencies, and there is good cooperation between public and non-public schools. This list of accrediting agencies was created by a nonprofit confederation of non-public schools.54
Thus, schools would be “approved” if they were accredited by one of the accrediting agencies allowed by non-governmental and Georgia-specific confederations of nonpublic schools or if they were accredited public schools – and they published on the web the basic non-test score information listed above. Parents would be allowed to utilize the taxpayer funds in their ESAs and any scholarships at accredited schools, and at state-approved non-school education providers.
53 For a discussion of the issue of society aiding parents in making better school choices, please see pages 21-24 of James P. Kelly III and Benjamin Scafidi, “More than Scores: An Analysis of Why and How Parents Choose Private Schools,” http://www.edchoice.org/MoreThanScores. 54 For more information on the Texas model of accreditation, please see http://www.texasprivateschools.org/accreditation.html and http://www.tepsac.org/#/home.

49
Fourth, independent researchers and business and civic organizations should analyze data to
monitor the success or failure of the education system as a statewide whole. Measuring
performance at the statewide level removes the incentive for an individual school or educator
to manipulate their offerings to increase measured performance on a school-level or individual-
level metric, because school-level and individual-level information are not collected or
reported.
Specifically, statewide data and data for statewide subgroups of students should be monitored
for the following metrics:
- NAEP test scores, https://nces.ed.gov/nationsreportcard/
- Post-secondary attendance, which is available from the National Student
Clearinghouse: http://www.studentclearinghouse.org/
- Post-secondary success, which is currently monitored by the University System of
Georgia and the Technical College System of Georgia
- Labor market outcomes for the state as a whole using data products produced by
the U.S. Bureau of the Census and others
- Parent surveys, of the kind found in this report, https://www.edchoice.org/wp-
content/uploads/2015/07/More-Than-Scores.pdf
- Surveys of Georgia economic development officials
- Surveys of Georgia business leaders, perhaps conducted with the voluntary
cooperation of the Georgia Chamber of Commerce and the Metro Atlanta Chamber
of Commerce or other business associations.
Each of these metrics should be created or monitored by non-governmental organizations
whose only interest is the success of Georgia students. Policymakers can then use this
information to make mid-course corrections.
Under a system of universal educational choice, I oppose for all schools, both public and private, No Child Left Behind-style (NCLB) accountability (government-mandated – or government-encouraged – standards, government-created or mandated tests, rewards and sanctions for performance).

50
Under the current traditional public school system, schools need to be held accountable one way or another. Under a system of government-provided schools with limited choice opportunities for families (especially lower-income families), centralized accountability like NCLB-style programs seem warranted in some fashion. Otherwise, public school employees and leaders would have, in practice, virtually no accountability to parents or taxpayers.
Nevertheless, this form of centralized accountability has proven not to have a large positive impact on educational quality. Further, it is a poor substitute for a real system of accountability, where parents can freely move taxpayer and personal funds devoted to their children’s education to the school or education provider of their choice, as would be the case under a system of universal educational choice. Under such a universal choice system, parents would hold schools and other providers accountable directly by voting with their feet, or the mere threat of exit, and would not have to rely on government actors.
Thus, there appear to be only three roads ahead. If we take one road, we go back to the public education system as it was before the 1990s, where federal, state and local government officials – both elected by voters and unelected personnel in government agencies – make all the decisions about the education of Georgia’s youth.
The second road continues NCLB-style accountability where government entities mandate content standards, government mandates student tests that measure progress toward meeting the standards, and government implements a system of rewards and sanctions to incentivize public schools, their employee, and their leadership to provide good schools for students.
A third road would be to allow parents to directly hold schools and other educational providers accountable by choosing where their child’s education dollars are spent. Public school employees and advocates who want neither centralized accountability through NCLB-style programs or real accountability through parental choice are, in fact, saying that they want taxpayers to keep paying the ever-increasing costs of public schools with almost no say in how they are run. Most Americans who are not paid by the public education system would not support this option of no accountability from either a central authority or parents if presented with each of the three possibilities. Americans want the providers of their goods and services held accountable for good performance, one way or another.
The downsides of centralized NCLB-style accountability are well-known. Centralized accountability is a substitute, albeit a poor one, for accountability from educational choice. Would you trust a government entity to be the sole source of accountability on your medical doctor? Or, would you prefer to be able to change doctors at your discretion? I suspect your answer is the same when it comes to your child’s education.
In Georgia, the state has created College and Career Ready Performance Index (CCRPI) scores to
grade individual school performance. On the surface, it appears this measure of school
performance is out of 100, but the technical documents show it is actually out of 110. The

51
state’s own analysis of CCRPI scores shows that they are, in part, measuring student
disadvantage and therefore should not be used as measures of school performance.55 How
many families really use CCRPI scores when they decide where to live or whether to send their
children to a specific charter school? The state of Georgia is 18 years into high-stakes testing
and accountability. If it cannot measure individual school performance well by now, when will
we stop waiting for Godot?
A system of universal educational choice would not need input-based policies and
accountability via high-stakes testing. In the longer run, public schools will demand to be freed
from input-based policies as they lose students to choice. Politically, it will be difficult to free
public schools from those input-based policies until that day comes.
Getting rid or significantly decreasing NCLB-style accountability for public schools is a different
story. For fall 2020, Georgia’s state leaders can petition the U.S. Department of Education for
waivers that allow individual public school systems to choose their own annual Reading and
Math norm-referenced tests from a state-approved list (e.g. Iowa, CogAT, Stanford10, Terra
Nova, etc.). Norm-referenced tests are not tied to any individual set of curriculum standards.
School systems would be free to continue to offer the state of Georgia’s tests – which are tied
to the state of Georgia’s standards – via a decision by their local school board. If the state made
such a waiver request to the current U.S. Department of Education and its leader, Betsy DeVos,
it would be interesting to see how far federal law and the department would let Georgia move
away from high stakes testing and accountability. With universal educational choice beginning
in fall 2020, Georgia would have a solid case based on policy grounds: Top-down accountability
through state-based tests and CCRPI scores would be as archaic and annoying as TV rabbit ears.
55 The Governor’s Office of Student Achievement’s “Beating the Odds Analysis” shows that CCRPI scores are negatively correlated with student economic disadvantage, the percentage of students that are African-American, and the percent of students with disabilities. Of course, no school can control these student characteristics and therefore should not be graded with a lower CCRPI merely because of who their students are. GOSA’s analysis of CCRPI scores can be found at https://gosa.georgia.gov/sites/gosa.georgia.gov/files/related_files/site_page/2017_bto_regression_table.pdf.

52
VI. Concluding Remarks
This report offers a vision for a new K-12 education system in Georgia beginning in the fall of
2020. This “Georgia 2020” proposal would create a universal educational choice system in
Georgia, where educators in both the public and private sectors would be free to “hang the
shingle” and create schools and educational settings they believe are best for students.
Likewise, families would be free to choose what educational settings they deem best for their
children from among traditional public schools, start-up charter public schools, career
academies, private schools, cyber schools, hybrid schools, micro schools, homeschools and
even approved non-school educational settings. The early returns on the school choice
programs that exist in America today and the overall evidence of improvements in outcomes
for Arizona students – the state with the largest amount of choice allowed – suggest that
moving to universal educational choice would benefit Georgia students, especially in terms of
valuable non-cognitive and post-secondary outcomes.
To measure success or failure of this proposal, state policymakers, civic groups, researchers and
interested individuals should look to statewide data on: NAEP test scores, post-secondary
outcomes, labor market outcomes, and surveys of parents, economic development officials and
business leaders to gauge whether the new universal choice system has improved outcomes for
students overall and for specific subgroups of students – and policymakers can make mid-
course corrections as needed. By looking statewide, and not tying outcome data to specific
schools, sectors or education service providers, educators will not be tempted to narrow
offerings and innovations by “teaching to the test” and other harmful behaviors that are
typically no fault of their own but incentivized by accountability systems designed to “protect”
students. The adage, “You get what you measure,” is close to what has been experienced in
public education during this era of centralized accountability.
Parents would receive test scores for their children under Georgia 2020. Parents are also in a
position to better measure valuable non-cognitive and social outcomes experienced by their
children – outcomes that inherently cannot be monitored by central observers including
governments. Armed with this information and with a large array of alternatives, parents will
be empowered to choose the educational settings they deem best for their children.
That said, the biggest benefits to students and their families from universal educational choice
may come from innovation. In a recent article on innovation in the economy overall, Kevin
Williamson wrote:
It isn’t the one-time event that will keep us innovative and prosperous –
it is creating the conditions that allow billions of little experiments to take

53
place, most of which will fail while the few that succeed will carry us all
forward with their momentum.56
This discovery of what truly works for individual students will also apply to K-12 education, if we
allow it: If we allow individual schools, individual educators and individual families to have the
dignity and equality to make decisions they think are best, only then will our education system
reach new heights of excellence and innovation – perhaps through innovations large, but
definitely through billions of tiny student- and teacher-specific innovations. No one knows what
those innovations will be, but if we allow the dignity and equality that comes from giving the
bourgeoisie – rank and file educators and parents – choice, then we will all benefit as (to
paraphrase Milton Friedman from “Capitalism and Freedom”) today’s educational leaders
become tomorrow’s educational laggards.
There is, however, one more very important issue to address: the fiscal effect on state and local
taxpayers that would result from converting from our current K-12 educational system to a
universal choice system. This issue is addressed in the next, and final, subsection of this report.
Fiscal Issues57
There are fiscal issues to be considered with regard to any K-12 education system. Under
Georgia’s current K-12 system, where virtually all taxpayer funds flow to traditional public
schools, there are perpetual issues with increasing taxpayer costs. Georgia public schools did
experience decreases in per-student funding during the Great Recession and its aftermath, a
time with the worst national economy since the Great Depression of the 1930s.
But the fiscal spigot has been turned back on. For example, between fiscal years 2015 and
2016, taxpayer funding to Georgia public schools, which includes charter schools, increased by
$1.76 billion – in just one year. Of that $1.76 billion, $470 million came from state taxpayer
funds. One year prior, the increase in state funds to public schools increased by $540 million (FY
2014-2015). The final data are not yet public, but there were also large increases in taxpayer
funds provided to Georgia public schools in fiscal years 2017 and 2018, and Governor Deal has
again proposed large increases in state funds for public schools for 2019. Thus, it appears those
bad economic times are over, and that the taxpayer funds to public schools in Georgia are
experiencing significant increases.
56 http://www.nationalreview.com/article/455574/apple-corporate-taxes-windfall 57 A recent analysis of Georgia’s tax credit scholarship program found fiscal savings. View at https://www.goalscholarship.org/docLib/20161118_201611AddendumtoTaxCreditScholarshipAudit.pdf.
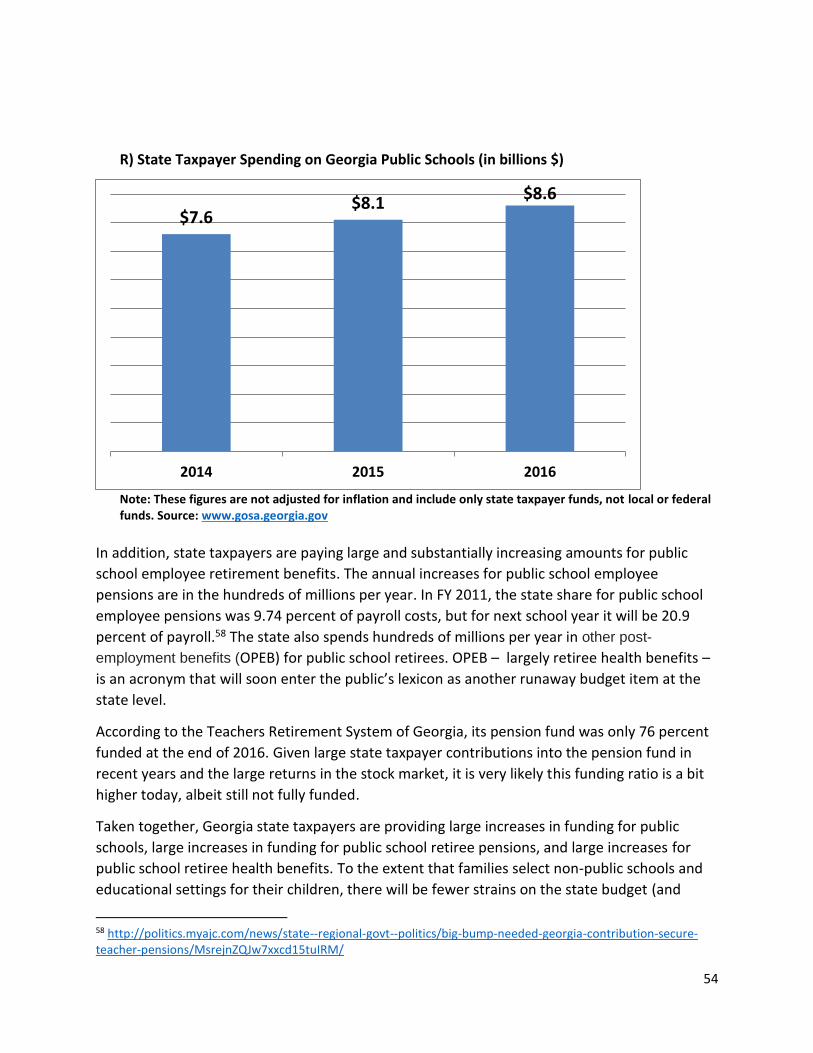
54
R) State Taxpayer Spending on Georgia Public Schools (in billions $)
Note: These figures are not adjusted for inflation and include only state taxpayer funds, not local or federal funds. Source: www.gosa.georgia.gov
In addition, state taxpayers are paying large and substantially increasing amounts for public
school employee retirement benefits. The annual increases for public school employee
pensions are in the hundreds of millions per year. In FY 2011, the state share for public school
employee pensions was 9.74 percent of payroll costs, but for next school year it will be 20.9
percent of payroll.58 The state also spends hundreds of millions per year in other post-
employment benefits (OPEB) for public school retirees. OPEB – largely retiree health benefits –
is an acronym that will soon enter the public’s lexicon as another runaway budget item at the
state level.
According to the Teachers Retirement System of Georgia, its pension fund was only 76 percent
funded at the end of 2016. Given large state taxpayer contributions into the pension fund in
recent years and the large returns in the stock market, it is very likely this funding ratio is a bit
higher today, albeit still not fully funded.
Taken together, Georgia state taxpayers are providing large increases in funding for public
schools, large increases in funding for public school retiree pensions, and large increases for
public school retiree health benefits. To the extent that families select non-public schools and
educational settings for their children, there will be fewer strains on the state budget (and
58 http://politics.myajc.com/news/state--regional-govt--politics/big-bump-needed-georgia-contribution-secure-teacher-pensions/MsrejnZQJw7xxcd15tuIRM/
$7.6$8.1
$8.6
2014 2015 2016

55
therefore on taxpayers) in the future to pay for retirees. Furthermore, there will be less need
for state capital funding for public school expansions. Governor Deal’s proposed 2019 budget
contains $260 million in bonds for K-12 public school capital and renovation costs.59 This figure
has been even higher in prior years. Additionally, fewer students in traditional public school
districts means less need for total operating funding as well.60
To be clear: While the current K-12 public education system has experienced quite large annual
increases in state taxpayer funding in the past few years, the choice proposals contained in this
report require increases in state taxpayer funds as well. The proposal for a new ESA program
would be roughly a state budgetary wash because (a) ESA funds are only 90 percent as large as
state funding would be had those students attended a public school; (b) state capital costs
would decline as fewer students choose public schools; (c) although the ESA proposal has a
prior public school attendance requirement for students in grades 2 and above, some small
number of ESAs would be going to students who would have attended a private school even
without the program. There is also the additional cost of the proposal to give special needs
students an ESA in addition to their special needs scholarships for families who choose a non-
public school setting for their special needs children – and these costs would be borne by state
taxpayers. Then again, local taxpayers would experience significant fiscal savings when special
needs students and other students leave. Additionally, increases in state funding for charter
schools approved by the State Charter Commission would also impose costs on state taxpayers.
Therefore, state policymakers have to make a choice. Over time, as history has
demonstrated, state policymakers are going to significantly increase state taxpayer funds for
K-12 education. Do they believe the best investment of those funds is to put almost all of it
into traditional public schools? Or do they believe that allowing parents to redirect some of
those funds to start-up charter schools, private schools and other educational settings are the
best use of those funds? The case of Arizona, coupled with the early returns on school choice
programs from around the nation, indicates that the answer is that a choice system would be
the better investment.
I have omitted federal taxpayer funds and local taxpayer funds in this discussion. It would be
unwise to include federal taxpayer funds into any choice program; federal strings would come
attached, and these strings are likely to inhibit innovation by educators and limit choice for
families. The Georgia State Constitution requires locally generated taxpayer funds to be spent
on local public schools.
59https://opb.georgia.gov/sites/opb.georgia.gov/files/related_files/site_page/FY%202019%20Governor%27s%20Budget%20Report.pdf 60 For a comprehensive discussion of the fiscal effects of choice on states and local public school districts, please
see https://www.edchoice.org/wp-content/uploads/2015/07/The-Fiscal-Effects-of-School-Choice-Programs.pdf.

56
To conclude, if one is concerned about the fiscal cost of an education sector, it seems counter-
intuitive to worry about the supposed fiscal strain that results from the less expensive options
(See Chart S), while claiming the much more expensive traditional public sector is perpetually
underfunded.
Put differently, reason alone would suggest that moving students from a relatively expensive
traditional public school sector in terms of taxpayer subsidies to sectors that involve
significantly less in taxpayer funds would cost taxpayers less. Specifically, when students leave
the traditional public school sector that cost taxpayers $11,213 per student in FY 2016 and
move to a less costly alternative, taxpayers will benefit overall.
S) Taxpayer Expenditures Per Student under the Proposals Offered in this Report
Note: These figures assume (a) charter school students are funded no less favorably than traditional public school students; (b) cyber charter students receive two-thirds of the funding as brick and mortar public school students; (c) ESA awards are equal to 90 percent of state funds given to public school students; and (d) that tax credit scholarship students and special needs scholarship students receive ESAs on top of their existing scholarships. Each of these assumptions mimics the recommendations in this report and these dollar amounts would have been the actual figures if these recommendations had been in place in FY 2016. Sources: www.gosa.georgia.gov; https://gosa.georgia.gov/sites/gosa.georgia.gov/files/related_files/document/Special%20Needs%20Scholarship%20End%20of%20Year%20Report%202015-2016-FINAL.pdf; and https://dor.georgia.gov/sites/dor.georgia.gov/files/related_files/document/LATP/Publication/2015%20SSO%20report%204-12-17.pdf
$11,213 $11,213
$7,468
$4,512
$8,289
$10,168
TraditionalPublic
Charter Cyber Charter ESA Alone Tax CreditScholarship +
ESA
Special NeedsScholarship +
ESA

57
Traditional public schools operate on a peculiar funding model that is unique to them: They get to retain significant funds for students they no longer serve. When students leave traditional public schools for any reason, those traditional public schools retain most federal funds and all local taxpayer funds. I am aware of no other entity in any walk of life that gets to retain funds for customers they lost. This retention of funds is certainly not the case in higher education – when a student transfers from Kennesaw State University, the college loses HOPE Scholarship funds, Pell Grants, tuition and fees and formula funds from taxpayers. Under the proposals here, traditional public schools would continue to lose only state taxpayer funds when they lose students, as is the case at present when students move from one public school district to the next, or they move out of state.

58
About the Education Economics Center at Kennesaw State University The mission of the Education Economics Center is to provide nonpartisan research and technical assistance in the evaluation and design of education policy, including both tax and expenditure issues. The objective of the Center is to promote the development of sound education policy and public understanding of education issues with the goal of maximizing student learning and achievement. The Education Economics Center is housed in the Coles College of Business at Kennesaw State University. About the Author Ben Scafidi is a professor of economics and founder and director of the Education Economics Center at Kennesaw State University. He is also a Friedman Fellow with EdChoice (Formerly the Milton and Rose Friedman Foundation for Educational Choice) and a Senior Fellow with the Georgia Public Policy Foundation. Previously, he served as the director of education policy for the Georgia GOAL Scholarship Program, the first chair of the state of Georgia’s Charter Schools Commission, a member of Georgia’s Charter Advisory Committee, the Education Policy Advisor to Governor Sonny Perdue, on the staff of both of Governor Roy Barnes’ Education Reform Study Commissions, and as an expert witness for the state of Georgia in school funding litigation. He received his Ph.D. in Economics from the University of Virginia and his bachelor’s degree in Economics from the University of Notre Dame. Ben and his wife, Lori, and their four children live in Kennesaw, Georgia.
Along with writing dozens of academic articles and policy reports on K-12 education policy, he has testified in numerous state capitols, and offered educational choice expertise to state legislators and other policy actors in more than 35 states.