Embed Size (px)
Citation preview

Georgia State Government
FY2016 Workforce Report
July 1, 2015 – June 30, 2016
Department of Administrative Services
Human Resources Administration Division
200 Piedmont Avenue, West Tower Suite 500
T: 1-877-318-2722 or 404-656-2705

Page 2 of 35
EXECUTIVE SUMMARY
Information in this report provides a snapshot of the State’s workforce for Fiscal Year 2016. The first
section containing Tables 1-6 provides a basic overview of all state entities, all branches of government.
The remainder of the report focuses on Executive Branch entities only. All data excludes Georgia World
Congress Center, Board of Regents and higher educational entities, and is further limited to entities
utilizing TeamWorks, the State’s enterprise HRIS.
Top 4 Takeaways
Staffing. The staffing model of many state entities continues to shift from hiring full-time, benefit-
eligible employees, to alternative types of employment arrangements. The full-time, benefit-eligible
employee count declined year-over-year to 66,669, just over 1,000 employees, while total state
headcount increased. An additional 16 percent of staffing was with contingent employees, and another
2 percent or 1,200 workers assigned by temporary staffing firms. Tables 5 and 6 detail staffing for the
Executive Branch as a whole and by employer, respectively.
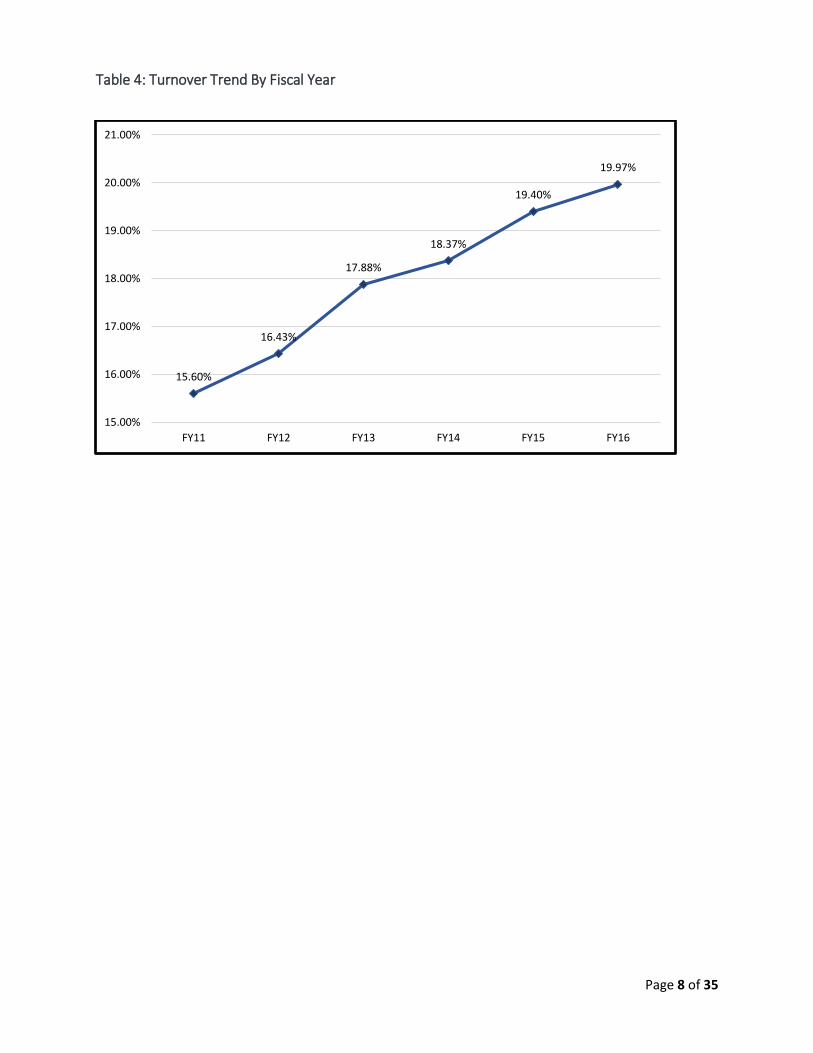
Turnover. The state’s general turnover rate increased slightly year-over-year from 19.4 to 19.9 percent.
Correctional Officer jobs at the Department of Corrections, (DOC) and the Department of Juvenile Justice
(DJJ) agencies remain the predominant driver; however, Table 27 reflects that a number of state entities
experienced turnover rates that exceeded the state’s general turnover rate of 19.9 percent. Table 26
demonstrates that the top five jobs that experienced a hiring “churn” included: Correctional Officers at
DOC and DJJ; Health Aides at the Department of Behavioral Health and Developmental Disabilities
(DBHDD); and Economic Support Specialists, Protect and Placement Specialists, and Social Services
Specialists at the Department of Human Services (DHS). While agencies with these and other jobs
experienced revolving turnover and hiring activities, DHS had a high number of vacancies in the
Economic Support Specialist and Protect and Placement Specialist jobs at the time of the data snapshot
for this report. Probation and Parole Officer jobs also experienced high vacancies, but these jobs were
not highlighted due to continued staffing of the new Department of Community
Services agency.
Retention. The state began tracking a retention rate for Executive Branch entities this past year to
determine how soon after hire employees quit. Recent benchmark data for the U.S. workforce found
that employees stayed in their jobs for at least 3 years after hire, with older employees staying for 10
years.1 Table 20 details retention rates by employer for a comparison against this benchmark. By
contrast, one of every three hires leaves state employment within 12 months of hire. While eight
smaller state entities retained 100% of their hires the first year, the following three large state entities
fell far below the state’s general one-year retention rate of 69 percent: DBHDD; DOC; DJJ.
Retirements. The number of year-over-year retirements declined slightly from 10.3 percent to 9.4
percent. Table 1 shows that just over 10 percent of the state’s workforce remains eligible to retire
immediately. Table 13 tracks retirement eligibility of the Executive Branch workforce by employer, and
shows that seven Executive Branch entities are particularly vulnerable to immediate experience drain
and within the next five years. Workers’ Board of Compensation; Georgia Student Finance; and the
Office of Commissioner of Insurance are particularly vulnerable with more than 20 percent of their
employees eligible for retirement today, climbing to 30 percent eligible for retirement within the next
five years.
1 “Employee Tenure in 2014.” Bureau of Labor Statistics press release, September 18, 2014.

Page 3 of 35
Top 3 Areas of Focus
1. Retention Strategies. Considering the state’s high turnover rate and retirement eligibility data, building the future workforce must include immediate focus on retention strategies as more employment options become available. Georgia, for instance, added 140,000 jobs to the economy over the past year. To be effective, however, retention strategies must be aligned with the turnover problem identified in individual agencies. Table 22 shows that nearly 70% percent of the turnover experienced by Executive Branch entities is due to voluntary resignation, yet the reason employees leave state government remains largely unsupported by data. Agencies continue to document departures as unspecified resignations rather than make use of the more specific termination codes available. This HR transaction practice limits an employer’s ability to develop a focused, data-supported retention strategy. An alternative approach to identifying the reasons employees quit is to conduct and analyze exit interview surveys. This technique has not been widely adopted across the state and would require manual data collection and aggregation.
The Department of Administrative Services will remain focused on standardizing data input behaviors and has developed other strategies aimed at improving the state’s retention rate from 69 percent to 75 percent by 2020. Some of these other strategies include continued refinement of career paths and labor market data for certain occupations to enable informed hiring and promotion decisions; improved communications about benefit options; improved functionality and processes for the performance management program, to include refined competencies for agencies to incorporate when hiring, promoting, and developing managers or leaders; partnerships to provide training delivery options to agencies for management or leadership development; and continued training related to the recruitment benefits of using the state’s applicant tracking system. Data related to jobs posted using the applicant tracking system this past year shows that agencies optimally utilizing competency-based screening questions in TeamGeorgiaCareers.gov experienced a job retention rate of 86 percent at year one after hire compared to the state’s general retention rate of 69% at year one. Hiring right to begin with is an effective retention strategy.
2. Cost Management. In addition to the need to develop focused, data-supported retention
strategies, there are number of local and federal changes that will create personnel cost- management challenges for employers.
The Fair Labor Standards Act was amended this year to increase the salary threshold at which
employers may exempt workers from overtime requirements. The salary threshold will rise
from $23,600 annually to $47,476 annually. Barring successful legal challenges, employers have
until December 1, 2016, to comply with the amended law. DOAS has advised HR leaders
statewide to reclassify approximately 14,000 positions, and to begin change management
related to certain workplace practices, timekeeping, and monitoring of work hours to avoid
unintentional overtime pay for these newly classified employees. The DOC, DHS, DJJ, DBHDD,
and local counties of Public Health are most notably impacted.
The City of Clarkston in Dekalb County increased the minimum wage to $15 per hour earlier this
year. State employers with work locations in the geographical area or who otherwise recruit
from the County will be challenged to compete for and retain talent in this area for jobs
requiring comparable skills and paying less than $31,000 annually.

Page 4 of 35
The Affordable Care Act, which requires employers with 50 or more full-time or full-time
equivalent employees to provide healthcare to at least 95 percent of their workforce this year,
creates higher financial risks for employers. These risks are specifically related to the more than
11,000 contingent employees in state positions, as well as the additional 1,226 workers
assigned to state employers by staffing firms. DOAS has taken several steps to assist state
employers in managing this risk, including: preparing HR leaders across the state; transitioning
temporary staffing from the procurement function to the centralized HR within the DOAS;
centralizing IRS reporting requirements; and working with numerous staffing firms to manage
the state’s risk exposure contractually. IRS penalties for non-compliance will continue to
increase year-over-year. Penalties for noncompliance in the 2016 calendar year increased to
$2,160.00 for each full-time worker and $3,240.00 for each employee that purchases
healthcare from the federal exchange and receives a tax premium. Estimates for the 2017 plan
year are $2,260.00 and $3,390.00, respectively. While these risks will be managed centrally,
employers must properly classify employees, rehires, and contractors and actively monitor
working hours, to include certain types of paid leave, in real time to also manage the risk
locally.
3. Knowledge Transfer / Succession Planning. Employers with high turnover and either a large
numbers of potential retirees, or potential retirees in single-incumbent jobs critical to their mission must act now to build their future workforce. While rehiring retirees is a talent pipeline strategy, it is not a sustainable or long-term strategy and may further aggravate retention issues as employees look to move up. The simplest step to ensure business continuity is to implement knowledge transfer techniques such as documenting processes, contacts, file locations, and other workflow information. Employers with mission critical management or leadership roles should identify high-potential employees and work to retain them. One effective retention method is to ensure high-potentials know their next career opportunity and the technical or soft skills they will need to develop in order to be competitive for that move. These individuals should have a documented development plan as part of their performance review plan that details focused learning assignments, aligns them with mentors, or assigns competency-based training aligned with the kind of managers and leaders the agency wishes to create.

Table of Contents
ENTERPRISE
Table 1: Workforce Comparison – All Branches ....................................................................... 6
Table 2: Workforce Breakdown by Branch of Government........................................................ 7
Table 3: 10 Year Headcount By Fiscal Year ............................................................................... 7
Table 4: Turnover Trend By Fiscal Year ................................................................................... 8
Table 5: Employment Category ............................................................................................. 10
EXECUTIVE
Table 6: Executive Branch Workforce By Entity ..................................................................... 11
Table 8: Ethnic Group Distribution ....................................................................................... 14
Table 9: Workforce By Job Family ......................................................................................... 14
Table 10: Workforce Job Family Detail ..................................................................................... 15
Table 11: Age & Tenure By Classification ............................................................................. 16
Table 13: Retiree Eligibility by Agency – Executive Branch .................................................... 17
Table 14: Workforce By Generations ................................................................................... 19
Table 15: Years of Service Distribution ................................................................................. 19
TALENT ACQUISITION
Table 16: Hiring Activity by Category ................................................................................... 20
Table 17: Hires By Generation ............................................................................................. 20
Table 18: Hires By Gender & Ethnic Group ........................................................................... 21
Table 19: Hires By Highest Education Level .......................................................................... 21
Table 20: Executive Branch - Retention ................................................................................ 22
Table 21: Executive Branch Retention ................................................................................... 23
SEPERATIONS
Table 22: Separations By Major Category ............................................................................. 24
Table 23: Voluntary Separations By Years of Service ............................................................ 24
Table 24: Voluntary Separations By Generations ................................................................. 25
Table 25: Job Family Separations/Hires Comparison – Executive Branch .............................. 25
Table 26: Top Separations By Jobs w/Hires Comparison........................................................ 26
Table 27: Agency Turnover Breakdown................................................................................. 27
EXHIBITS
Exhibit A: Trends in Hiring ................................................................................................... 30
Exhibit B: Trends in Separations .......................................................................................... 31
Exhibit C: Separations Major Category Descriptions ............................................................. 33
Exhibit D: State of Georgia Salary Plans ............................................................................... 34
Page 6 of 35
Table 1: Workforce Comparison – All Branches
FY 2014 FY 2015 FY 2016
Headcount
Benefit Eligible 68,012 67,690 66,669
Contingent Employees 18,135 15,788 16,949
TOTAL 85,748 83,185 83,618
Employees by Classification
Classified 4,864 (7.15%) 3,987 (5.89%) 3,336 (5.05%)
Unclassified 63,148 (92.85%) 63,703 (94.11%) 63,333 (94.94%)
Compensation by Pay Plan2:
Statewide Salary Plan (SWD) 57,439 57,457 43,532
Average Salary $36,250 $37,034 $38,214
Statewide Salary Plan (LAW) 3: N/A N/A 12,730
Average Salary N/A N/A $35,566
Statewide Executive Plan (SRE) 677 665 693
Average Salary $108,363 $109,771 $112,345
All Other Independent Plans 9,896 9,568 9,808
Average Salary $54,536 $55,752 $56,558
Gender Composition of Workforce:
Males 25,268 (37.16%) 24,490 (36.18%) 23,818 (35.73%)
Females 42,679 (62.76%) 43,123 (63.71%) 42,851 (64.27%)
Ethnic Composition of Workforce:
American Indian 122 (0.18%) 120 (0.18%) 112 (.17%)
Asian 780 (1.15%) 793 (1.17%) 816 (1.22%)
Black 32,632 (47.98%) 33,154 (48.98%) 32,823 (49.23%)
Hispanic 1,097 (1.61%) 1,190 (1.76%) 1,201 (1.80%)
Multi-Race 667 (0.98%) 704 (1.04%) 728 (1.09%)
Pacific Islander 164 (0.24%) 145 (0.21%) 133 (.20%)
White 32,550 (47.86%) 31,584 (46.66%) 30,856 (46.28%)
Average Age 44.2 44.1 44.3
Average Tenure 9.4 9.0 9.0
Retiree Eligible 11.65% 10.4% 10.65%
Overall Turnover Rate (FTE) 18.37% 19.40% 19.65%
2 The state of Georgia has a total of 27 Pay Plans. See Appendix D for a complete listing of salary plans by group. 3 In January 2016, the state Implemented the Job Classification and Career Path project. As part of the project a new salary plan for Law Enforcement staff was created.

Page 7 of 35
Table 2: Workforce Breakdown by Branch of Government
Branch
FY 2016 Count
% of Total
% Chg From FY15
EXECUTIVE 49,051 73.57% -2.19%
Authorities, Boards & Comm 745 1.12% 3.22%
Technical Colleges 5,751 8.63% 1.22%
JUDICIAL 1,500 2.25% 3.00%
LEGISLATIVE 735 1.10% 0.54%
LOCAL GOVERNMENT
County Public Health 3,947 5.92% -1.14%
Community Service Boards 4,940 7.41% -0.89%
Grand Total 66,669 100.00% -0.02%
Table 3: 10 Year Headcount By Fiscal Year
As of June 30th of each year
81,590 82,080
77,677
75,200
72,929
70,32468,696 67,993 67,667
66,669
50000
55000
60000
65000
70000
75000
80000
85000
2007 2008 2009 2010 2011 2012 2013 2014 2015 2016
Page 8 of 35
Table 4: Turnover Trend By Fiscal Year
15.60%
16.43%
17.88%
18.37%
19.40%
19.97%
15.00%
16.00%
17.00%
18.00%
19.00%
20.00%
21.00%
FY11 FY12 FY13 FY14 FY15 FY16

Executive Branch
Georgia State Government

Page 10 of 35
Table 5: Employment Category
The state’s staffing model continues to shift with just over 80 percent of staffing now full-
time, benefit-eligible employees. Sixteen percent of the state’s workforce is contingent4
who can take many forms including seasonal workers, interns and/or student workers,
rehired retirees, or casual on-call employees. These workers are usually paid on an hourly
basis and may have periods during the fiscal year in which no hours are worked. The
working hours of these individuals appears to be tightly monitored below 30 hours a week.
The Human Resources Administration Division of the Department of Administrative Services
began centrally managing temporary staffing in January 2016. For FY2016, Executive
Branch agencies added an additional 1,226 workers assigned by staffing firms, 906 of which
worked 30+ hours a week.
4 Temporary workforce numbers are comprised of employees who were active as of 6/30/2016 in the state of Georgia
PeopleSoft Payroll system. This count does not include DFACs or PH Districts who utilize separate payroll systems.
Benefit Eligible, 59,494, 82%
Contingent State, 11,895,
16%
Non-State Contingent Staff,
1,226, 2%
Benefit Eligible
Contingent State
Non-State Contingent Staff
Less than 1% of contingent
state employees may be
eligible for health care
coverage based on working
an average of 30+ hours per
week

Page 11 of 35
Table 6: Executive Branch Workforce By Entity
CO Entity FTE
Total
Contingent State
Employees FY16 Total
Contingent State
Workforce %
FY15 - 16 Variance
128* County Public Health * 3,947 176 4,123 4.27% (676)
800 Technical Colleges 5,751 6506 12,257 53.08% (643)
467 Ga. Dept. of Corrections 11,199 323 11,522 2.80% (390)
129 DHR – BOCOP* 185 24 209 11.48% (194)
441 Dept Behavioral Hlth. & Dev Disb 4,128 594 4,722 12.58% (181)
461 Dept. of Juvenile Justice 3,571 443 4,014 11.04% (128)
484 Ga. Dept. of Transportation 3,973 232 4,205 5.52% (107)
428 Ga. Dept. of Community Affairs 375 18 393 4.58% (98)
427 Department of Human Services 3,351
723
3,516 4.70% (64)
414 Ga. Dept. of Education 876 296 1,172 25.26% (62)
440 Ga. Dept. of Labor 1,338 92 1,430 6.43% (60)
465 State Board, Pardons & Paroles 585 1 586 0.17% (60)
402 Ga. Dept. of Agriculture 498 71 569 12.48% (47)
429 Dept of Economic Development 192 17 209 8.13% (44)
422 Office of Planning and Budget 330 164 494 33.20% (41)
466 Ga. Dept. of Public Safety 1,734 52 1,786 2.91% (35)
127 DFACS 6,205 165 7,020 11.60% (29)
492 Ga Public Defender Council 753 6 759 0.79% (26)
478 Secretary of State 249 29 278 10.43% (22)
976 GA Regional Trans Authority 34 1 35 2.86% (21)
475 Ga. Dept. of Driver Services 688 227 915 24.81% (18)
977 Georgia Public Broadcasting 135 135 0.00% (8)
480 GA Soil & Water Conservation 33 2 35 5.71% (7)
927 State Road & Tollway Authority 49 49 0.00% (7)
488 Ga. Dept. of Veterans Service 141 2 143 1.40% (6)
415 Technical College System of GA 223 41 264 15.53% (5)
482 Ga. Teachers Retirement Sys. 190 1 191 0.52% (4)
490 State Board of Workers' Comp 124 124 0.00% (4)
408 Office of Comm. of Insurance 223 9 232 3.88% (2)
474 Department of Revenue 972 7 979 0.72% (1)
406 GA Dept of Banking & Finance 93 3 96 3.13% (1)
489 Subsequent Injury Trust Fund 13 7 20 35.00% 0
416 Ga. Employees Retirement Sys. 90 3 93 3.23% 1

Page 12 of 35
CO Entity FTE
Total
Contingent State
Employees FY16 Total
Contingent State
Workforce %
FY15 - 16 Variance
900 Georgia Building Authority 155 10 165 6.06% 1
410 State Properties Commission 14 14 0.00% 1
470 Ga. Public Service Commission 82 82 0.00% 1
409 GA State Fin. & Invest. Comm. 101 14 115 12.17% 3
980 Georgia Technology Authority 172 19 191 9.95% 3
476 Ga. Student Finance Commission 39 39 0.00% 4
407 State Accounting Office 136 1 137 0.73% 7
420 Georgia Forestry Commission 542 123 665 18.50% 8
403 Ga. Dept. of Admin. Services 219 17 236 7.20% 12
921 Ga. Correctional Industries 200 6 206 2.91% 14
419 Ga. Dept of Community Health 943 128 1,071 11.95% 17
411 Ga. Dept. of Defense 474 134 608 22.04% 22
405 Department of Public Health 954 22 976 2.25% 26
469 Dept of Early Care & Learning 336 18 354 5.08% 32
471 Ga. Bureau of Investigation 842 13 855 1.52% 48
442 Georgia Department of Law 292 8 300 2.67% 48
462 Ga. Dept. of Natural Resources 1,650 780 2,430 32.10% 73
477 Dept. of Community Supervision 95 2 97 2.06% 97
Grand Total 59,494 11,530 71,224 16.19% (2,573)
* These are local government entities with some employees receiving state benefits.
The most populace contingent state jobs include Adjunct Faculty (3,748) used by Technical
Colleges, Clerical Worker (956), Federal Work Study Student Worker (676) and Support
Services Worker (675) used by a variety of state employers.
The Department of Community Supervision began staffing in FY2016 and will continue to staff
throughout FY2017.

Page 13 of 35
Table 7: FY2014 to 2016 Executive Branch Workforce Profile5
FY14
FY15
FY16 % Change from Previous Year
Number: 60,627 60,520 59,494 -1.70%
Full-Time 60,566 60,459 59,439 -1.69%
Part-Time 61 61 55 -9.84%
Classified 4,439 3,621 3020 -16.6%
Average Age 44 44 44 0.00%
Average Salary $39,356 $40,049 $40,826 1.94%
Average Years of Service 9.5 9.2 9.2 0.00%
Percent Minorities 52.60% 53.87% 54.34% 0.87%
Percent Female 61.50% 62.56% 63.17% 0.98%
Highlights of FY16 Workforce
Hires Number of Total Hires 9,813 11,008 10,212 3.78%
Percent of Hires Female 60.2% 63.9% 63.8% -0.16%
Percent of Hires Minorities 62.3% 66.1% 64.0% -3.18%
Average Age of New Hire (FT) 34.8 34.1 34.1 0.00%
Retention
New Hire 1 Yr Retention Rate (Hired
July 1st of FY)
69%
69%
68%
-1.77%
Turnover
Executive Branch FTE Turnover Rate
17.75%
17.0%
17.5%
0.62%
Total Number of Separations 10,823 10,770 10,964 -0.49%
Percent Voluntary Resignations 63.9% 66.8% 69.3% 5.74%
Percent Retirements 17.1% 18.2% 19.3% -5.86%
Percent Involuntary Terminations 18.2% 14.3% 12.9% -7.49%
Gender
Female 61.5% 59.5% 61.4% 1.69%
Male 38.5% 40.5% 38.6% -3.12%
Ethnicity
American Indian 0.2% 0.2% 0.2% 0.00%
Asian 1.1% 1.2% 1.2% 0.00%
Black 48.6% 49.5% 49.9% 0.79%
Hawaiian Pacific Islander 0.2% 0.2% 0.2% 0.00%
Hispanic 1.7% 1.9% 1.9% 0.00%
Multi-Race 0.9% 1.0% 1.0% 0.00%
White 47.4% 46.1% 45.7% -0.97
Retirement
Employees Retired 1,850 1,961 1,846 -5.86% % of Employees Eligible to Retire6 10.0% 10.3% 9.4% -8.74%
5 Effective FY2013, Executive Branch figures above include Technical Colleges, Authorities, Boards, and County Public Health 6 Retirement eligibility figures are based on tenure and age records from the states’ HRIS and do not reflect forfeited leave
balances or service credit which may have been purchased from the Employees’ Retirement System.

Page 14 of 35
Table 8: Ethnic Group Distribution
Ethnic Group Total % of Executive
Branch Workforce % of Georgia Labor Force
Pacific Islander 90 0.2% 0.12%
American Indian 92 0.2% 0.50%
Multi Race 561 1.0% 2.02%
Asian 683 1.2% 4.01%
Hispanic 816 1.5% 9.35%
White 24,966 44.9% 61.64%
Black 28,339 51.0% 31.72%
Table 9: Workforce By Job Family
More than half of the state’s Executive Branch workforce is concentrated in the top three job
families of Law Enforcement, Support Services, and Social Services.
0.00% 5.00% 10.00% 15.00% 20.00% 25.00%
Law Enforcement
Support Services
Social Services
Education
Healthcare
Financial
Transportation
Regulatory
Facilities
Legal
Information Technology
Food-Farm
Human Resources
Audit/General
Applied Science
Natural Resources
Engineering
Real Estate
21.92%
16.44%
15.21%
8.65%
8.34%
4.50%
4.49%
4.37%
4.23%
2.67%
2.50%
1.44%
1.12%
1.02%
0.97%
0.90%
0.79%
0.43%
2016 2015

Page 15 of 35
Table 10: Workforce Job Family Detail
Job Family
2015
2016 FY16
Variance 2015 Avg
Salary 2016 Avg
Salary FY16 % Change
Real Estate 143 258 115 $41,739 $40,425 -3.25%
Applied Science 613 579 (34) $44,861 $46,463 3.45%
Natural Resources 654 533 (121) $41,986 $44,343 5.31%
Food - Farm 854 854 0 $24,267 $24,212 -0.23%
Audit/General 979 609 (370) $90,002 $109,751 17.99%
Engineering 1,271 470 (801) $52,685 $59,695 11.74%
Legal 1,298 1,588 290 $56,793 $55,252 -2.79%
Transportation 1,395 2,671 1,276 $29,539 $38,426 23.13%
Information Technology 1,566 1,487 (79) $60,603 $63,712 4.88%
Human Resources 1,825 667 (1,158) $40,825 $46,486 12.18%
Regulatory 2,363 2,601 238 $47,011 $42,706 -10.08%
Facilities 2,573 2,518 (55) $31,591 $31,905 0.98%
Financial 3,115 2,679 (436) $45,064 $46,124 2.30%
Healthcare 5,073 4,960 (113) $40,042 $40,603 1.38%
Education 5,239 5,144 (95) $53,916 $55,108 2.16%
Support Services 8,530 9,782 1,252 $35,320 $38,293 7.77%
Social Services 8,540 9,051 511 $33,091 $33,122 0.09%
Law Enforcement 14,489 13,043 (1,446) $34,543 $35,566 2.88%
Grand Total 60,520 59,494 (1,026) $39,356 $40,826 3.60%
In January 2016 the state implemented the Job Classification and Career Path Project. One goal of
the project was to correct job misclassifications which impacted data in the Variance & Average
Salary columns above.

Page 16 of 35
Table 11: Age & Tenure By Classification
Status % of Workforce Avg. Age Avg. Tenure
Classified 5.08% 52.3 23.4
Unclassified 94.02% 43.3 8.3
Grand Total 100.00% 43.8 9.2
Projections that Georgia’s public workforce will be 100% at-will by 2025 remain on target.
Table 12: Retirement Eligibility7
The above data assumes eligibility based on 30 years of service or 60 years of age/w 10 years of
service.
More than 10% of the state’s Executive Branch workforce are eligible to retire today
See Table 15: Retiree Eligibility by Agency for a further breakdown
7 Retirement eligibility figures are based on tenure and age records from the states PeopleSoft HCM system and do not reflect
service credit which may have been purchased from the Employees’ Retirement System
2.98% 3.82%5.33%
7.62%
9.91%
13.51%
0.00%
2.00%
4.00%
6.00%
8.00%
10.00%
12.00%
14.00%
16.00%
18.00%
20.00%
6,294 8,156 11,189
Now w/In 2 Yrs w/in 5 Years
Staff
Mgrs

Page 17 of 35
Table 13: Retiree Eligibility by Agency – Executive Branch
Co Agency Total
Headcount Avg Age
Avg Tenure
Eligible Now
% Eligible
Now
Eligible w/in 2
Yrs
% Eligible w/in 2
Yrs
467 Ga. Dept. of Corrections 11,199 40.6 9.0 937 8.37% 1260 11.25%
800 Technical Colleges 5,751 48 8.6 620 10.78% 776 13.49%
484 Ga. Dept. of Transportation 3,973 45.0 12.2 570 14.35% 756 19.03%
127 DFACS 6,205 41.8 8.7 555 8.94% 699 11.27%
128 DHR - Public Health 3,947 44.8 9.8 451 11.43% 567 14.37%
427 Department of Human Services 3,351 46.0 10.3 441 13.16% 551 16.44%
441 Dept Behavioral Hlth & Dev Disb 4,128 45.1 7.6 377 9.13% 532 12.89%
462 Ga. Dept. of Natural Resources 1,650 45.4 12.3 246 14.91% 333 20.18%
440 Ga. Dept. of Labor 1,338 49.8 11.3 222 16.59% 287 21.45%
461 Dept. of Juvenile Justice 3,571 41.5 7.1 198 5.54% 267 7.48%
466 Ga. Dept. of Public Safety 1,734 41.0 11.0 197 11.36% 271 15.63%
474 Department of Revenue 972 46.8 10.0 143 14.71% 181 18.62%
465 State Board Pardons & Paroles 585 43.0 13.6 131 22.39% 144 24.62%
405 Department of Public Health 954 45.5 8.8 119 12.47% 143 14.99%
419 Ga.Dept of Community Health 943 46.6 8.8 95 10.07% 119 12.62%
471 Ga. Bureau of Investigation 842 40.5 10.0 84 9.98% 108 12.83%
414 Ga. Dept. of Education 876 48.2 6.9 81 9.25% 121 13.81%
492 Ga Public Defender Standards 753 44.4 6.6 76 10.09% 91 12.08%
402 Ga. Dept. of Agriculture 498 44.8 9.9 66 13.25% 86 17.27%
420 Georgia Forestry Commission 542 41.7 10.8 55 10.15% 76 14.02%
475 Ga. Dept. of Driver Services 688 42.8 7.1 54 7.85% 68 9.88%
408 Office of Comm. of Insurance 223 49.4 11.9 49 21.97% 60 26.91%
428 Ga. Dept. of Community Affairs 375 47.0 9.7 41 10.93% 51 13.60%
411 Ga. Dept. of Defense 474 47.7 7.5 40 8.44% 50 10.55%
415 Technical College System of GA 223 49.2 11.4 38 17.04% 45 20.18%
442 Georgia Department of Law 292 44.7 9.2 33 11.30% 41 14.04%
488 Ga. Dept. of Veterans Service 141 51.6 8.8 29 20.57% 33 23.40%
490 State Board of Workers' Comp 124 51.4 15.1 28 22.58% 36 29.03%
980 Georgia Technology Authority 172 50.3 11.2 26 15.12% 33 19.19%
921 Ga. Correctional Industries 200 47.5 10.0 26 13.00% 32 16.00%
403 Ga. Dept. of Admin. Services 219 47.4 9.0 25 11.42% 31 14.16%
478 Secretary of State 249 44.8 6.5 24 9.64% 31 12.45%
429 Dept of Economic Development 192 43.1 8.7 23 11.98% 26 13.54%
482 Ga. Teachers Retirement Sys. 190 46.8 11.1 21 11.05% 24 12.63%
469 Dept of Early Care & Learning 336 43.4 7.1 21 6.25% 23 6.85%
900 Georgia Building Authority 155 46.7 8.9 20 12.90% 28 18.06%
409 GA State Fin. & Invest. Comm. 101 51.2 10.2 19 18.81% 23 22.77%
470 Ga. Public Service Commission 82 50.0 12.3 17 20.73% 21 25.61%
422 Office of Planning and Budget 330 41.2 6.5 17 5.15% 24 7.27%
977 Georgia Public Broadcasting 135 45.3 7.7 16 11.85% 18 13.33%
129 DHR - BOCOP 185 46.5 9.3 14 7.57% 23 12.43%
477 Dept. of Community Supervision 95 46.2 11.3 12 12.63% 18 18.95%
Page 18 of 35
Co Agency Total
Headcount Avg Age
Avg Tenure
Eligible Now
% Eligible
Now
Eligible w/in 2
Yrs
% Eligible w/in 2
Yrs
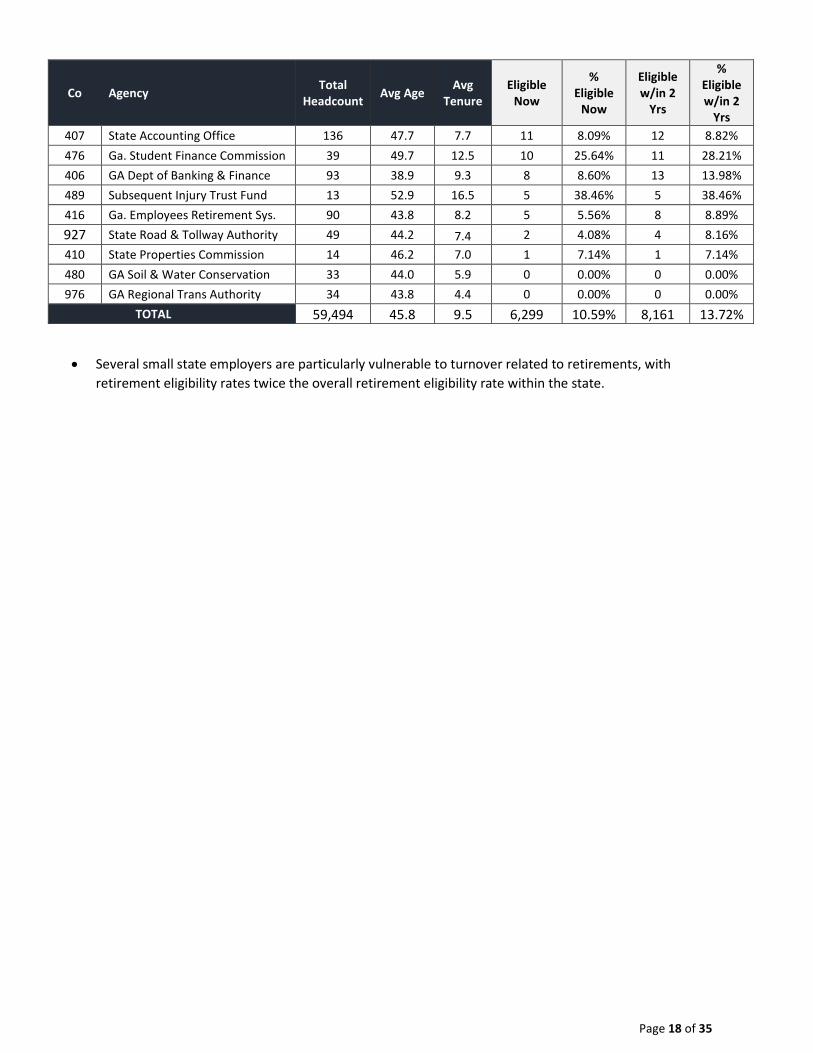
407 State Accounting Office 136 47.7 7.7 11 8.09% 12 8.82%
476 Ga. Student Finance Commission 39 49.7 12.5 10 25.64% 11 28.21%
406 GA Dept of Banking & Finance 93 38.9 9.3 8 8.60% 13 13.98%
489 Subsequent Injury Trust Fund 13 52.9 16.5 5 38.46% 5 38.46%
416 Ga. Employees Retirement Sys. 90 43.8 8.2 5 5.56% 8 8.89%
927 State Road & Tollway Authority 49 44.2 7.4 2 4.08% 4 8.16%
410 State Properties Commission 14 46.2 7.0 1 7.14% 1 7.14%
480 GA Soil & Water Conservation 33 44.0 5.9 0 0.00% 0 0.00%
976 GA Regional Trans Authority 34 43.8 4.4 0 0.00% 0 0.00%
TOTAL 59,494 45.8 9.5 6,299 10.59% 8,161 13.72%
Several small state employers are particularly vulnerable to turnover related to retirements, with
retirement eligibility rates twice the overall retirement eligibility rate within the state.

Page 19 of 35
Table 14: Workforce By Generations
The State of Georgia has six (6) generations currently in the workforce. There is 1 Traditionalist (born before 1925) and 2 Generation Z’s working for the State, not graphed.
Table 15: Years of Service Distribution
High turnover and steady retirements leaves one in three Executive Branch employees with less than
three years of tenure. Agencies must focus on retention to deliver a consistent customer service
experience and build their future workforce.
0.7%
33.4%
42.0%
23.9%
0.6%
31.4%
42.2%
25.8%
0.00%
5.00%
10.00%
15.00%
20.00%
25.00%
30.00%
35.00%
40.00%
45.00%
Veterans1925-1945
Baby Boomers1946-1964
Generation X1965-1980
Millennials1981-1997
FY15
FY16
0 - 2 3 - 4 5 - 9 10 - 14 15 - 19 20 - 24 25 - 29 30 - 35 >35 Years
% of Total 33.93% 10.46% 17.47% 14.69% 10.76% 6.65% 4.79% 1.11% 0.14%
33.93%
10.46%
17.47%
14.69%
10.76%
6.65%4.79%
1.11%0.14%
0.00%
5.00%
10.00%
15.00%
20.00%
25.00%
30.00%
35.00%
40.00%

Page 20 of 35
T A L E N T A C Q U I S I T I O N
Table 16: Hiring Activity by Category
Executive Branch employers increased hiring activity for a third year.
Table 17: Hires By Generation
The State has been successful in attracting Millennial employees; however, Table 24 demonstrates that the state struggles to retain such hires.
8,245
1,568
663
9,386
1,636
819
10,108
1,9731,308
0
2000
4000
6000
8000
10000
12000
Hires Rehires Transfers
2014 2015 2016
12.68%
32.07%55.11%
Baby Boomers Generation X Millennials

Page 21 of 35
Table 18: Hires By Gender & Ethnic Group
Table 19: Hires By Highest Education Level
Less than 50% of hires completed formal education after high school. Whether this data is an
indication of quality of hire, or an indication that formal education is not a success indicator requires
further analysis.
7,294
4,145
F
M
1.17%
58.47%
35.98%
2.53%1.61%
Asian
Black
White
Hispanic
Multi-Race
13.45%
39.10%
11.12%
24.16%
12.17%12.14%
39.10%
11.03%
24.00%
13.24%
0.00%
5.00%
10.00%
15.00%
20.00%
25.00%
30.00%
35.00%
40.00%
45.00%
Not Indicated High School Tech School /2 Yr College
Bachelor's Master's & Higher
2015 2016

Page 22 of 35
S E P A R A T I O N S
Table 20: Executive Branch - Retention
FY 2014 FY 2015
CO Entity Headcount Avg 1 YR
Retention Rate
Avg 2 YR Retention
Rate
Avg 1 YR Retention
Rate
Avg 2 YR Retention
Rate
% Change in 1 YR
Retention Rate
127 DFACS 6,205 73.47% 58.51% 68.43%
N/A until July
1 2017
-6.86%
128 County Public Health 4,026 73.35% 56.21% 74.54% 1.62%
129 DHR - BOCOP 221 78.70% 62.96% 48.11% -38.87%
402 Ga. Dept. of Agriculture 531 83.84% 66.22% 86.17% 2.78%
403 Ga. Dept. of Admin. Services 218 86.67% 65.91% 81.67% -5.77%
405 Department of Public Health 945 84.94% 57.23% 85.62% 0.80%
406 GA Dept of Banking & Finance 93 75.95% 63.33% 77.78% 2.40%
407 State Accounting Office 128 94.17% 77.27% 48.11% -48.91%
408 Office of Comm. of Insurance 216 84.85% 79.55% 78.57% -7.40%
409 GA State Fin. & Invest. Comm. 98 100.00% 67.00% 100.00% 0.00%
410 State Properties Commission 14 100.00% 50.00% 100.00% 0.00%
411 Ga. Dept. of Defense 475 77.31% 61.30% 69.90% -9.59%
414 Ga. Dept. of Education 897 91.92% 80.21% 90.70% -1.32%
415 Technical College System of GA 227 89.39% 81.82% 83.33% -6.78%
416 Ga. Employees Retirement Sys. 88 83.33% 66.67% 52.08% -37.50%
419 Ga. Dept of Community Health 941 90.11% 77.37% 85.71% -4.88%
420 Georgia Forestry Commission 540 72.32% 59.86% 83.74% 15.79%
422 Office of Planning and Budget 329 73.22% 57.01% 66.89% -8.65%
427 Department of Human Services 3,351 78.30% 67.82% 80.68% 3.05%
428 Ga. Dept. of Community Affairs 376 93.64% 83.48% 95.45% 1.94%
429 Dept of Economic Development 188 95.45% 74.24% 92.59% -3.00%
440 Ga. Dept. of Labor 1,347 88.67% 67.86% 72.84% -17.85%
441 Dept Behavioral Hlth. & Dev Disb 4,224 63.24% 44.00% 62.74% -0.80%
442 Georgia Department of Law 294 84.07% 68.52% 95.15% 13.18%
461 Dept. of Juvenile Justice 3,682 59.65% 37.51% 57.05% -4.35%
462 Ga. Dept. of Natural Resources 1,641 91.81% 80.42% 85.72% -6.64%
465 State Board, Pardons & Paroles 598 88.15% 72.23% 93.82% 6.43%
466 Ga. Dept. of Public Safety 1,739 77.55% 61.04% 82.75% 6.71%
467 Ga. Dept. of Corrections 11,552 62.19% 42.27% 59.59% -4.17%
469 Dept of Early Care & Learning 5,984 94.61% 85.95% 83.42% -11.83%
470 Ga. Public Service Commission 80 100.00% 0.00%

Page 23 of 35
FY 2014 FY 2015
CO Entity Headcount Avg 1 YR
Retention Rate
Avg 2 YR Retention
Rate
Avg 1 YR Retention
Rate
Avg 2 YR Retention
Rate
% Change in 1 YR
Retention Rate
471 Ga. Bureau of Investigation 819 92.98% 87.47% 97.41%
4.76%
474 Department of Revenue 954 87.71% 67.46% 82.98% -5.39%
475 Ga. Dept. of Driver Services 678 80.53% 55.14% 75.59% -6.13%
476 Ga. Student Finance Commission 39 100.00% 100.00% 100.00% 0.00%
477 Dept. of Community Supervision 91 N/A N/A N/A N/A
478 Secretary of State 250 70.94% 59.72% 84.28% 18.80%
480 GA Soil & Water Conservation 34 87.50% 87.50% 100.00% 14.29%
482 Ga. Teachers Retirement Sys. 179 89.29% 75.00% 87.50% -2.00%
484 Ga. Dept. of Transportation 3,999 79.22% 62.50% 72.47% -8.52%
488 Ga. Dept. of Veterans Service 142 77.78% 72.22% 85.00% 9.29%
489 Subsequent Injury Trust Fund 15 100.00% 100.00% 100.00% 0.00%
490 State Board of Workers' Comp 124 100.00% 80.00% 100.00% 0.00%
492 Ga Public Defender Council 774 81.22% 60.10% 78.43% -3.43%
800 Technical Colleges 4,247 86.73% 74.52% 84.94% -2.06%
900 Georgia Building Authority 153 75.56% 71.85% 81.11% 7.35%
921 Ga. Correctional Industries 198 76.85% 65.74% 78.19% 1.75%
927 State Road & Tollway Authority 51 80.00% 60.00% 85.71% 7.14%
976 GA Regional Trans Authority 38 85.71% 57.14% 100.00% 16.67%
977 Georgia Public Broadcasting 125 90.00% 90.00% 83.64% -7.07%
980 Georgia Technology Authority 166 100.00% 83.33% 100.00% 0.00%
Eight (8) small Executive Branch entities retained 100% of their FY15 hires.
Table 21: Executive Branch Retention
1 Year 2 Year 3 Year
Jul-12 Hires (FY13) 68.0% 50.0% 38.0%
Jul-13 Hires (FY14) 69.0% 51.0% TBD
Jul-14 Hires (FY15) 69.0% TBD TBD
Most state employers keep two of every three hires for at least a year, but only one in three
hires stay to year three.

Page 24 of 35
Table 22: Separations By Major Category
Table 23: Voluntary Separations By Years of Service
The majority of turnover is due to voluntarily resignations
7,670
1,8751,432
96
69.27%
19.3%12.93%
0.87%
0
1000
2000
3000
4000
5000
6000
7000
8000
9000
Voluntary Retirements Involuntary Other
1374
2266
1165
682505
964
714
17.91%
29.54%
15.19%
8.89%6.58%
12.57%
9.31%
0
500
1000
1500
2000
2500
<1 1 2 3 4 5-9 10+
Page 25 of 35
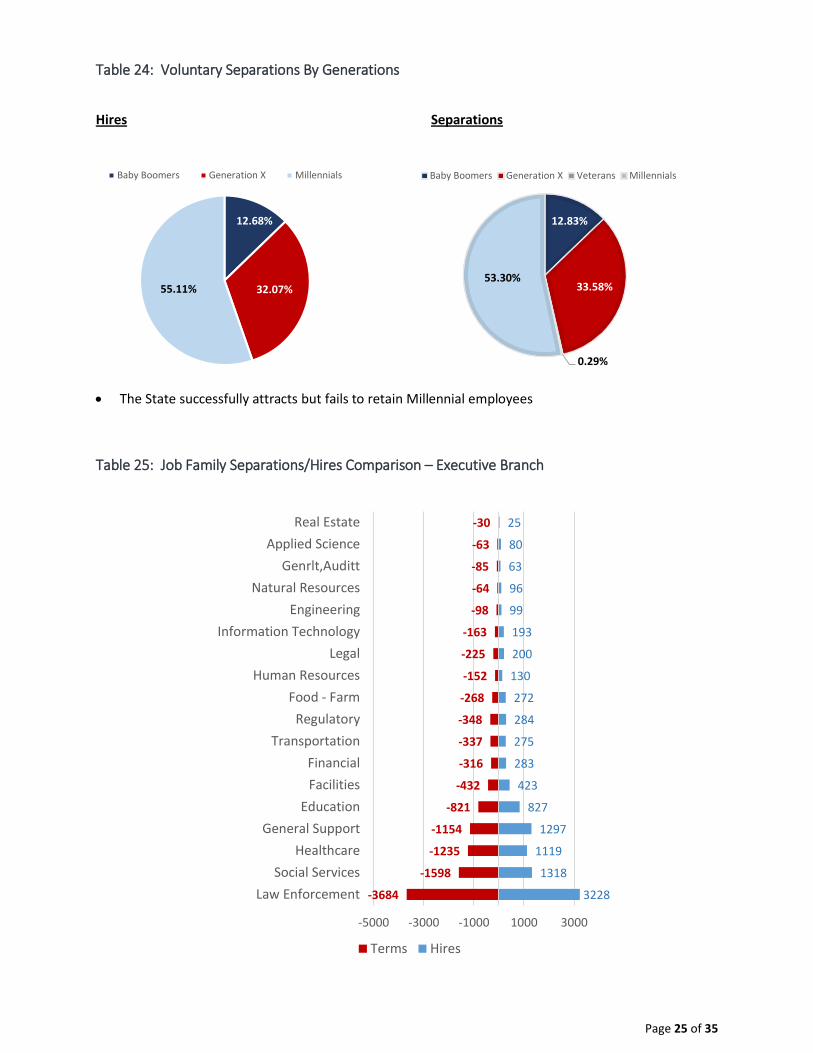
Table 24: Voluntary Separations By Generations
Hires Separations
The State successfully attracts but fails to retain Millennial employees
Table 25: Job Family Separations/Hires Comparison – Executive Branch
12.68%
32.07%55.11%
Baby Boomers Generation X Millennials
12.83%
33.58%
0.29%
53.30%
Baby Boomers Generation X Veterans Millennials
3228
1318
1119
1297
827
423
283
275
284
272
130
200
193
99
96
63
80
25
-3684
-1598
-1235
-1154
-821
-432
-316
-337
-348
-268
-152
-225
-163
-98
-64
-85
-63
-30
-5000 -3000 -1000 1000 3000
Law Enforcement
Social Services
Healthcare
General Support
Education
Facilities
Financial
Transportation
Regulatory
Food - Farm
Human Resources
Legal
Information Technology
Engineering
Natural Resources
Genrlt,Auditt
Applied Science
Real Estate
Terms Hires

Page 26 of 35
Table 26: Top Separations By Jobs w/Hires Comparison
The top 3 jobs that continue to experience hiring deficiencies are Correction Officer, Economic Support Specialist, and Nurse.
-2942
-693
-555
-460
-450
-399
-319
-215
-167
-127
-119
-96
-92
-90
-89
2720
662
660
448
316
422
248
193
204
130
97
77
95
134
86
-4000 -3000 -2000 -1000 0 1000 2000 3000 4000
(DJJ/DOC) Corrections Officers (1 &2)
(DHS) Social Svcs Spec (1-3)
(County/DHS/DOC) Admin Assitant/Support (1-3)
(DBHDD/County) Health Aides (1-3)
(DFACS/DCH) Economic Support Spec (1-3)
(TCGS) Instructors (1-3)
(County/DBHDD) Nurse (RN's & LPN's)
(DJJ/DOC) Probation/Parole Spec (1-3)
(DOT) Equipment Operators (1-3)
(DBHDD/DJJ/DOC) Food Services (1-3)
(DOC/DOT/DBHDD) General Trades Tech (All Levels)
(DPS) Troopers (All Levels)
(DOC/DBHDD) Behavioral Health Counselors (All Levels)
(DDS) Driver Examiner (1-3)
(DBHDD/DJJ/DOD) Housekeepers (All Levels)
Hires Separations

Page 27 of 35
Table 27: Agency Turnover Breakdown
Co ID Entity Involuntary Other Retirement Voluntary
Transfers Out1
Grand Total
Turnover Rate
129 DHR - BOCOP 4 0 3 71 1 79 35.7%
461 Dept. of Juvenile Justice 133 8 78 986 94 1299 35.3%
422 Office of Planning and Budget 9 0 8 49 25 91 27.7%
441 Dept Behavioral Hlth& Dev Disb 244 8 108 723 46 1129 26.7%
467 Ga. Dept. of Corrections 315 20 333 2148 100 2916 25.2%
478 Secretary of State 29 1 6 22 3 61 24.4%
411 Ga. Dept. of Defense 11 3 11 78 5 108 22.8%
900 Georgia Building Authority 3 0 10 17 4 34 22.3%
410 State Properties Commission 1 0 0 1 1 3 22.2%
127 DFACS 169 5 133 921 151 1379 21.6%
477 Dept. of Community Supervision 4 0 1 5 9 19 20.9%
402 Ga. Dept. of Agriculture 47 1 23 31 9 111 20.9%
921 Ga. Correctional Industries 0 0 13 27 1 41 20.7%
475 Ga. Dept. of Driver Services 22 0 22 78 15 137 20.2%
128 County Public Health 102 3 150 391 69 715 17.8%
442 Georgia Department of Law 0 0 7 37 7 51 17.4%
465 State Board Pardons & Paroles 2 3 26 43 29 103 17.2%
415 Technical College System of GA 5 1 7 19 6 38 16.8%
405 Department of Public Health 21 1 17 85 32 156 16.5%
492 Ga Public Defender Council 14 2 13 88 7 124 16.0%
419 Ga.Dept of Community Health 8 1 34 82 25 150 15.9%
927 State Road & Tollway Authority 1 0 1 5 1 8 15.8%
976 GA Regional Trans Authority 3 0 0 2 1 6 15.8%
488 Ga. Dept. of Veterans Service 2 0 4 16 0 22 15.5%
414 Ga. Dept. of Education 6 2 34 87 10 139 15.5%
428 Ga. Dept. of Community Affairs 3 0 16 33 6 58 15.4%
416 Ga. Employees Retirement Sys. 0 0 1 10 2 13 14.8%
800 Technical Colleges 94 12 169 532 59 866 14.5%
484 Ga. Dept. of Transportation 59 8 241 251 17 576 14.4%
466 Ga. Dept. of Public Safety 16 0 73 144 17 250 14.4%
406 GA Dept of Banking & Finance 0 1 3 9 0 13 14.0%
429 Dept of Economic Development 0 0 3 20 3 26 13.9%
427 Department of Human Services 35 6 93 242 68 444 13.5%
420 Georgia Forestry Commission 9 0 11 46 5 71 13.1%
474 Department of Revenue 18 3 38 54 9 122 12.8%
476 Ga. Student Finance Commission 0 0 2 1 2 5 12.8%
407 State Accounting Office 4 0 1 7 4 16 12.5%
440 Ga. Dept. of Labor 9 6 59 80 12 166 12.3%
1 Transfers Out includes employees who moved to a different company ID during the fiscal period.

Page 28 of 35
Co ID Entity Involuntary Other Retirement Voluntary
Transfers Out1
Grand Total
Turnover Rate
462 Ga. Dept. of Natural Resources 16 0 65 104 7 192 11.7%
469 Dept of Early Care & Learning 2 0 2 21 10 35 10.9%
408 Office of Comm. of Insurance 0 0 10 10 3 23 10.6%
490 State Board of Workers' Comp 2 0 4 5 1 12 9.6%
977 Georgia Public Broadcasting 1 0 1 8 2 12 9.6%
470 Ga. Public Service Commission 1 0 4 1 1 7 8.8%
980 Georgia Technology Authority 1 0 4 8 1 14 8.4%
482 Ga. Teachers Retirement Sys. 3 0 5 6 0 14 7.8%
471 Ga. Bureau of Investigation 0 1 16 41 4 62 7.6%
489 Subsequent Injury Trust Fund 0 0 0 1 0 1 6.8%
409 GA State Fin. & Invest. Comm. 1 0 2 0 1 4 4.1%
403 Ga. Dept. of Admin. Services 3 0 9 20 10 42 0.7%
480 GA Soil & Water Conservation 0 0 1 4 1 6 0.1%

Appendix

Page 30 of 35
Exhibit A: Trends in Hiring
8,0619,034 8,975
9,81311,022
10,212
0
2000
4000
6000
8000
10000
12000
FY11 FY12 FY13 FY14 FY15 FY16
Hires
744835
770663
859
1,227
0
200
400
600
800
1000
1200
1400
FY11 FY12 FY13 FY14 FY15 FY16
Transfers
$32,963
$31,680
$32,278
$30,764
$30,714
$31,713
$29,500
$30,000
$30,500
$31,000
$31,500
$32,000
$32,500
$33,000
$33,500
FY11 FY12 FY13 FY14 FY15 FY16
Average Full Time New Hire Salary
Page 31 of 35
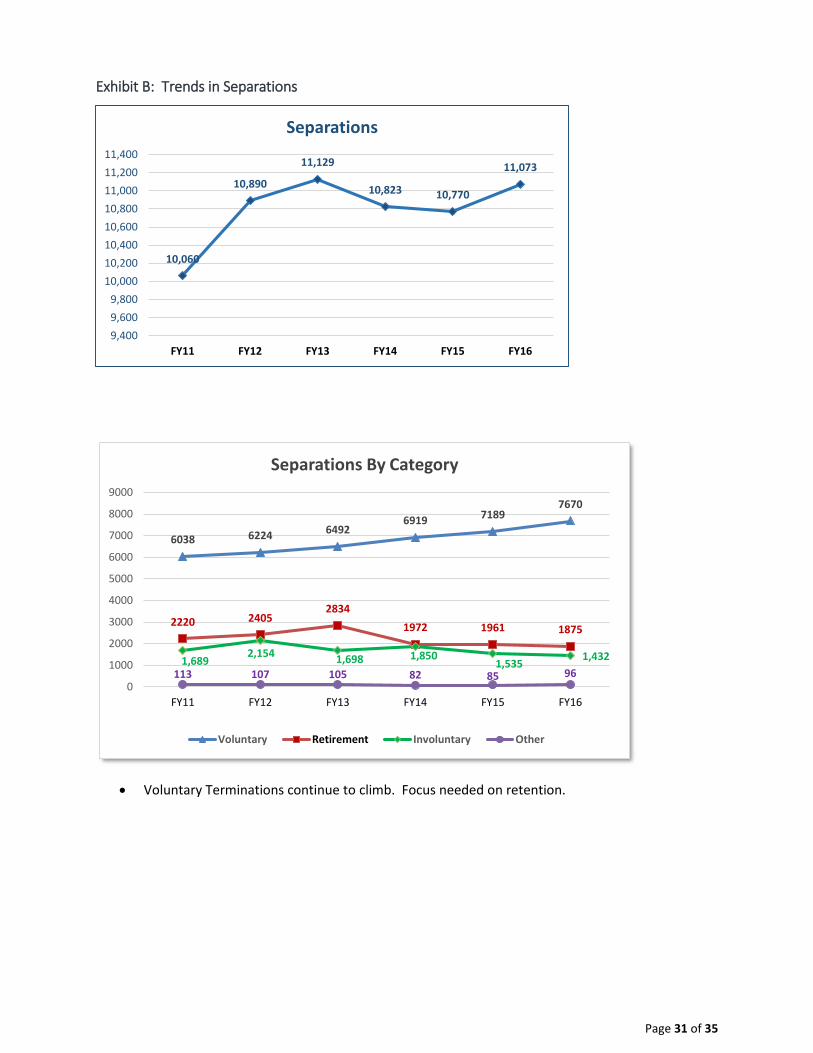
Exhibit B: Trends in Separations
Voluntary Terminations continue to climb. Focus needed on retention.
10,060
10,890
11,129
10,823 10,770
11,073
9,400
9,600
9,800
10,000
10,200
10,400
10,600
10,800
11,000
11,200
11,400
FY11 FY12 FY13 FY14 FY15 FY16
Separations
6038 6224 64926919 7189
7670
2220 24052834
1972 1961 1875
1,6892,154
1,698 1,8501,535
1,432
113 107 105 82 85 960
1000
2000
3000
4000
5000
6000
7000
8000
9000
FY11 FY12 FY13 FY14 FY15 FY16
Separations By Category
Voluntary Retirement Involuntary Other

Page 32 of 35
Employees tenure at retirement has been trending downward for six straight years.
5.9 4.9 4 4.1 3.8 3.8
25 24.3 23.4 22.7 22.6 21.8
6.6 6.75.4 5.5 4.5 4.3
14.413.4
11.9 13.111 11.2
0
10
20
30
40
50
60
FY11 FY12 FY13 FY14 FY15 FY16
Average Tenure at Separation
Voluntary Retirement Involuntary Other

Page 33 of 35
Exhibit C: Separations Major Category Descriptions
Action Reason Description Short Desc Category
OTHER TER DEA Death Death Other TER KLD Killed in Line of Duty KilledDuty Other
INVOLUNTARY
TER ATT Attendance Attendance Involuntary TER CON Misconduct Misconduct Involuntary TER DIS Dismissal Dismissal Involuntary TER DRG Drug Testing Drug Test Involuntary TER INS Insubordination Insubordin Involuntary TER MIS Misstatement on Application Misstatemt Involuntary TER NPR No Position Return From Leave Con Leave Involuntary TER RIF Reduction in Force RIF Involuntary TER RLS Release Release Involuntary TER TAR Tardiness Tardiness Involuntary TER UNS Unsatisfactory Performance Unsat Perf Involuntary TER VIO Violation of Rules Violation Involuntary
RETIREMENT TER RTM Retirement Retirement Retirement
VOLUNTARY
TER CHI Child/House Care Child/Hse Voluntary
TER EES Dissatisfied w/Fellow Employee Employees Voluntary
TER FAM Family Reasons Family Rsn Voluntary
TER FOR Forfeiture of Position Forfeit Voluntary
TER HEA Health Reasons Health Voluntary
TER HRS Dissatisfied with Hours Hours Voluntary
TER ILL Illness in Family Illness Voluntary
TER LOC Dissatisfied with Location Location Voluntary
TER LVE Failure to Return from Leave Leave Voluntary
TER MAR Marriage Marriage Voluntary
TER MUT Mutual Consent Mut Consnt Voluntary
TER PAY Dissatisfied with Pay Pay Voluntary
TER PER Personal Reasons Personal Voluntary
TER PLE Paid Leave Exhausted Lv Exhaust Voluntary
TER POL Dissatisfied w/Comp. Policies Comp Polic Voluntary
TER PRE Presumptive Resignation Presume Voluntary
TER PRM Dissatisfied w/Promotion Opps Promo Opps Voluntary
TER PSE Private Sector Employment PriSectEmp Voluntary
TER PTD Partial/Total Disability Pt/Tot Dis Voluntary
TER REF Refused Transfer Refus Xfer Voluntary
TER REL Relocation Relocation Voluntary
TER RES Resignation Resignatn Voluntary
TER RTS Return to School School Voluntary
TER SUP Dissatisfied with Supervision Supervisn Voluntary
TER TRA Transportation Problems Transportn Voluntary
TER TYP Dissatisfied w/Type of Work Work Type Voluntary
TER WOR Dissatisfied w/Work Conditions Work Conds Voluntary

Page 34 of 35
Exhibit D: State of Georgia Salary Plans
STATE OF GEORGIA SALARY PLAN
Salary Plan Code Description
STATEWIDE SALARY PLAN
SWD Statewide Salary Plan
LAW Law Enforcement Salary Plan
HOURLY
CHW Casual Hourly Worker
TPW Technical Professional Worker
SENIOR EXECUTIVE PLAN
SRE Senior Executive Salary Plan
SPECIALIZED OCCUPATIONAL PLAN
MD1 Physicians Salary Plan
ALTERNATIVE
APO AlternativePayOnly-NoSlryNoHrs
INDEPENDENT SALARY PLANS
404 Dept. of Audits Salary Plan
442 Dept. of Law Salary Plan
444 General Assembly Salary Plan
482 TRS Staff Salary Plan
977 GA Public Broadcasting Sal Plan
EDS Education Supervisor Sal Plan (2080)
FIC GSFIC Salary Plan
GCI GA Correctional Industries
GTA GA Technology Authorities Sal Plan
430 Judicial Branch Salary Plan
DA1 District Attorney Salary Plan
ADA Asst District Attorney Salary Plan
J01 Superior Court Judges Sal Plan
LC1 Superior Ct Law Clerk Sal Plan
PRN Education Principal Sal Plan (2080)
S00 10 Mo DOE (200 Days) Sal Plan
SUP TCSG Support Staff Salary Plan
T00 DOE Teachers 200 Day Sal Plan
TCH Teachers Salary Plan (2080)

For inquiries, contact:
Department of Administrative Services
Human Resources Administration Division
200 Piedmont Avenue, West Tower Suite 500
T: 1-877-318-2722 or 404-656-2705