Embed Size (px)
Citation preview

Georgia Institute of Technology
Yogendra Joshi
G.W. Woodruff School of Mechanical Engineering

Site Personnel
Site Director: Dr. Yogendra Joshi
Faculty team:
• Dr. Satish Kumar
• Dr. Minami Yoda
Researchers/Students:
• Vaibhav K. Arghode (Post Doc)
• Jayati Athavale (Ph.D.)
• Yunji Gu (M.S.)

Research Focus Areas
• Air flow imaging • Air delivery from floor tiles – measurements and modeling • Server air flow, temperature, measurements and modeling • Dynamic sensing and controls for energy usage optimization • Reduced order modeling • Liquid cooling • Waste heat recovery • Containerized data centers

Perforated Tile
Air Flow
Rate = 0.234
m3/s (496
CFM)
• A 20kW rack requires ~ 1m3/s (2,118 CFM) with a temperature difference of 20°C across the rack
• Inlet velocities ~O(0.3 (top)-1.2 (tile surface) m/s
Y. Joshi and P. Kumar, Eds., Energy Efficient Thermal Management of Data Centers, Springer, 2012
Particle Image Velocimetry

Perforated Tile Air Flow Rate = 1.224 m3/s (2594 CFM)
Inlet velocities ~O(5.83 (top)-7.5 (tile surface) m/s
Bottom servers up to the height of 500 mm from the floor do not receive cool air
Air entrainment velocity in the cold aisle (shown white dotted) has increased from ~ 0.6m/s (case 3) to 1.8m/s (case 4) severely disrupting the air distribution to the opposite rack
Increased severity of reversed flow in the servers located in the bottom of the rack (v~1.5 to 2.5 m/s). Reversed flow height increases to ~ 400 mm

Pressure outlet
Pressure inlet (K=10)
Tile
Grill
Fan
Mass flow inlet Symmetry
Gap
Pressure inlet
Pressure inlet
Tile
Aisle top
Ais
le
Experiments (PIV)
Geometrical Resolution (GR)
Velocity (m/s) Modified Body
Force (MBF)
Porous Jump (PJ)
Tile
Top (-0.8%)
Rac
k
Tile
Top (-46.2%)
Tile
Top (-43.5%)
CFD/Reduced Order Model of Tiles Data Center Lab
6
2500 CFM of air flow through both Tile and Rack
• MBF model able to capture prominent flow features from PIV and GR model
[ref] Arghode, V. K., Joshi, Y., Room Level Modeling of Air Flow in a Contained Data Center Aisle, ASME Journal of Electronic Packaging, v 136, p 011011-1-10, 2014.

Air Delivery from Tile to Adjacent Rack (PIV)
Tile Flow = Rack Flow
Umag/Uin
7
Data Center Lab
K = P/(0.5Uin2)
Ais
le
Tile (K=9.7)
Top (67.7%)
36.7% 1/4”
1,177 CFM
Tile (K=38.3)
Top (100.1%)
Porosity 21.1%
Tile (K=9.2)
Top (64.6%)
Pore size
1/8”
• Lower porosity higher air by-pass • Smaller pore size non-negligible effect on flow field • Higher flow rate minimal effect
Rac
k
Tile (K=9.7)
Top (72.5%)
Flow rate 1,766 CFM
[ref] Arghode, V. K., Joshi, Y., Experimental Investigation of Air Flow through Perforated Tile in a Raised Floor Data Center, (ISTP 2013) International Symposium on Transport Phenomena, 01-05 November 2013, Yamaguchi, Japan.
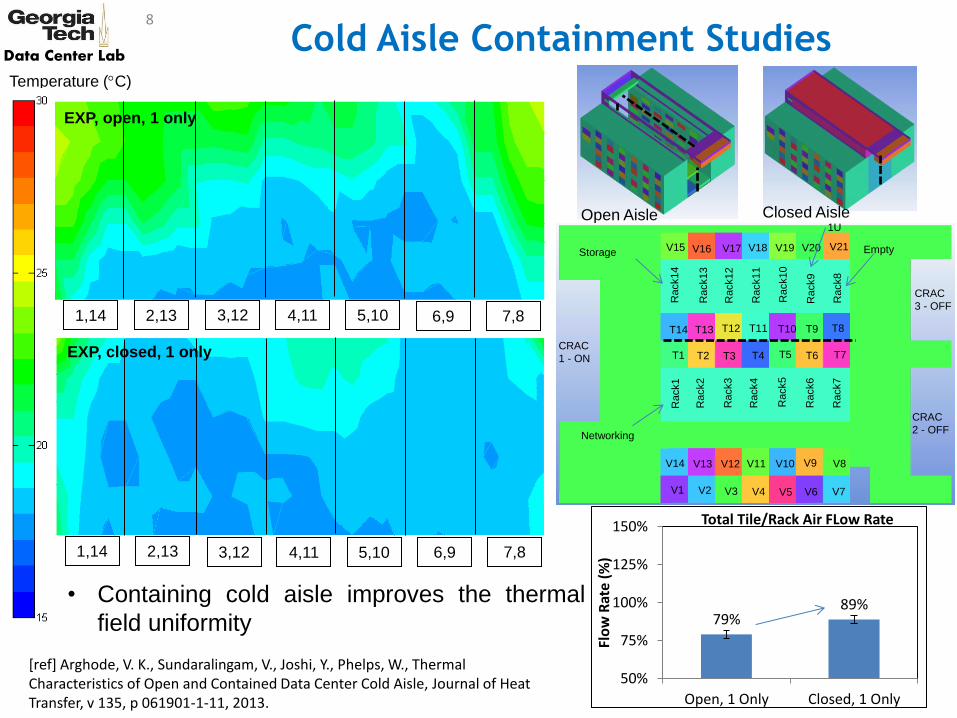
Cold Aisle Containment Studies 8
Closed Aisle
Temperature (C)
Open Aisle
1,14 2,13 3,12 4,11 5,10 6,9 7,8
EXP, closed, 1 only
1,14 2,13 3,12 4,11 5,10 6,9 7,8
EXP, open, 1 only
79% 89%
50%
75%
100%
125%
150%
Open, 1 Only Closed, 1 Only
Flo
w R
ate
(%)
Total Tile/Rack Air FLow Rate
• Containing cold aisle improves the thermal
field uniformity
[ref] Arghode, V. K., Sundaralingam, V., Joshi, Y., Phelps, W., Thermal Characteristics of Open and Contained Data Center Cold Aisle, Journal of Heat Transfer, v 135, p 061901-1-11, 2013.
T8 T9 T10 T11 T12 T13 T14
T1 T2 T3 T4 T5 T6 T7
V8 V9 V10 V11 V12 V13 V14
V1 V2 V3 V4 V5 V6 V7
V21 V20 V19 V18 V17 V16 V15
Rack8
Rack9
Rack10
Rack11
Rack12
Rack13
Rack7
Rack6
Rack5
Rack4
Rack3
Rack2
Rack14
R
ack1
CRAC
1 - ON
CRAC
3 - OFF
CRAC
2 - OFF
Storage
Networking
Empty
1U
Data Center Lab

Data Center Laboratory at Georgia Tech

CEETHERM Data Center Layout
Power
distribution
unit
Power
distribution
unit
D
O
O
R
Storage
640 node
rack
Storage
IBM Blade
Center
IBM Blade
Center
IBM Blade
Center
IBM Blade
Center
Dell Power
edge 64 Node
Rack
Network
IBM Blade
Center
IBM Blade
Center
IBM Blade
Center
IBM Blade
Center
IBM Blade
Center
IBM Blade
Center
Spare
35
71
3
24
14
HP rack
HP rack
IBM rack
Mixed HP/
IBM rack
Mixed HP/
IBM rack
HP rack
IBM Blade
Center rack
IBM rack
D
O
O
R
Server
Simulator
6
91
1
8
IBM Blade
Center rack
10
12
Downflow
CRAC
Upflow
CRAC
Upflow
CRAC
Downflow
CRAC
Downflow CRACDownflow CRAC
1
Power
distribution
unit
Experimental zone Computational zonea
8.7
5m
6.4m 6.4m
APC In row
cooler
APC In row
cooler
Equipment Donations courtesy:
Racks: APC
Fan assist Chimney Racks: Wrightline
Servers: Intel and OIT
CRAC unit: Liebert
In row coolers: APC (Critical Components)
Server Simulator: APC
Branch circuit power metering: PDI corp
Remote KVM switch: Minicom and Digi
IBM Blade Center Details:
• 10 Racks
• 6 Servers / Rack
• 14 Blades / Server
• 4 Cores/ Blade
• Total: 3360 Cores
Data Center Laboratory Layout

•3-D Stereoscopic PIV (Particle Image Velocimetry system for room level air flow mapping.
•25kW Server Simulator with adjustable fan and heater settings to simulate a variety of heat loads.
•Perforated tiles with adjustable dampers to control air discharge rate.
Experimental Facilities
3-D PIV system
Server Simulator
Fan speed and Heat
setting dials
Perforated floor tiles with dampers

•One of the first PIV systems for rack level air flow mapping
•Customized to scan the desired plane and stitch vector maps together to get full
flow field
Particle Image Velocimetry System (PIV)
PIV system
Perforated floor tile
Measurement plane area
(0.61x1.98) m2
Camera 1 (Image map A)
Camera 2 (Image map B)
Light Sheet
Laser Traverse
Aisle Center
Aisle Top
Rack Inlet
X
Y
Sever Rack
Light
Sheet
∆ t
Cross correlation function
Flow seeded
with
particles
Pulsed Laser
(Nd:YAG)
Cylindrical lens
Image map 1
pulse 1
Image map 2
pulse 2
∆x, ∆y ( Particle Displacement)
Noise filtering and
random vector
elimination
Vector
Statistics
Data Analysis
Velocity
Stream lines
Vorticity
Turbulence
CCD camera
Vector map
Interrogation
area
Δt
ΔxU
Δt
ΔyV
Velocity vectors
Data Center Lab
Laser Cameras
Traverse
Rack
Tile
Aisle
Top
2 ft
6 ft 3”
1 2

Grid based Temperature Measurement
Cold Aisle (252 thermocouples) Hot Aisle (126 thermocouples)
• T type thermocouples with wire gauge 32
• Covers width of the cold/hot aisle and height of the server racks
13
Data Center Lab

Other Measurement Tools
• Tile Air Flow Rate Measurement
• Measurement of dynamic pressure head to obtain velocity, compensation for flow resistance through the hood
• Rack Air Flow Rate Measurement (Custom, Degree C)
• Measurement of velocity using thermal anemometer
Thermistor + Anemometer (15 × 3)
0.0
0.2
0.4
0.6
0.8
1.0
1.2
0.0 0.2 0.4 0.6 0.8 1.0 1.2
Cal
ori
me
tric
Flo
w R
ate
(kg/
s)
Anemometic Flow Rate (kg/s)
Server SimulatorIBM Blade Center
±10%
14
Data Center Lab
• Plenum Pressure Measurement (Degree C) • Mass flow measured based on differential
temperature over an heated surface & correlated to differential pressure
• Compensation for connecting tube lengths

Cold Aisle Containment
CRAC-
2-D
CRAC-
3-U
CRAC-
1-D
Return
Return
PDU-2
PDU-1
Racks
Racks
Fully Contained Aisle Open Aisle
Door at aisle
entrance
Deployable
curtain at the top
Door at aisle
entrance
Blanking
panel for
front
Network
rack
Racks with
rear door
heat
exchangers
• Physically separating the hot and cold aisle
can result in uniform server inlet temperature
15
Data Center Lab

• Perforated tiles used to supply air from plenum to the room space
• Parameters porosity, pore size and shape, anterior dampers or fins
Different Tile Designs Under Investigation
“Generic” “Slotted” “Chamfered” “Fan”
TOP
BOTTOM
Data Center Lab

Dynamic Events in Data Centers
17
• Fluctuating IT load
760
780
800
820
0 5 10 15 20 25 30
Po
we
r (W
)
Time (min)
VM Power Profile
Courtesy Junwei Li, CERCS, GT
Liu et al., Phil.
Trans. R. Soc.
A 2012 370
Microsoft Live Messenger

Dynamic Resource Allocation
18
Armbrust et al., 2009, Report UCB/EECS-
2009-28
Loss of cooling resources ( Lower CRAC set
points than required)
Over-Provisioning

Potential Solution
19
760
780
800
820
0 10 20 30
Po
we
r (W
)
Time (min)
VM Power Profile Fluctuating IT Load Control of CRAC Set Points
Rapid
Thermal
Characterization
Need for real-time datacenter thermal
characterization for better capacity planning.