Embed Size (px)
Citation preview

Georgia Exports, based on State of Origin Information
This information is based on shipments that were reported as being shipped
from a Georgia establishment

Georgia Exports, based on State of Origin Information
• This information is based on shipments that were reported as being shipped from Georgia, i.e., the shipment began its international move from a Georgia origin.
• This may not necessarily equal the value of shipments that pass through Georgia ports and gateways
• Information was complied from US Census Foreign Trade information by ITTS
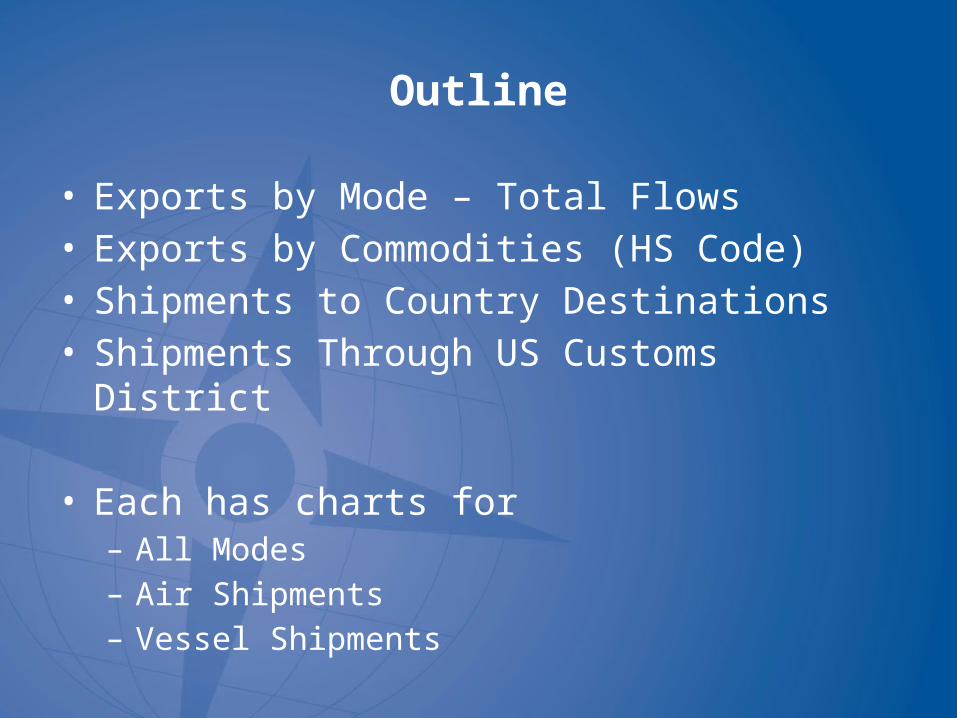
Outline
• Exports by Mode – Total Flows• Exports by Commodities (HS Code)• Shipments to Country Destinations • Shipments Through US Customs District
• Each has charts for – All Modes– Air Shipments– Vessel Shipments

Definitions
• Gateways are by Customs Districts– In some cases, they do not necessarily align
with actual port totals due to different jurisdictional boundaries
– For more information visit http://www.cbp.gov/contact/ports
• Commodity definitions are at the Harmonized Code 2 Digit level
For more information visit http://www.census.gov/foreign-trade/schedules/b/index.html
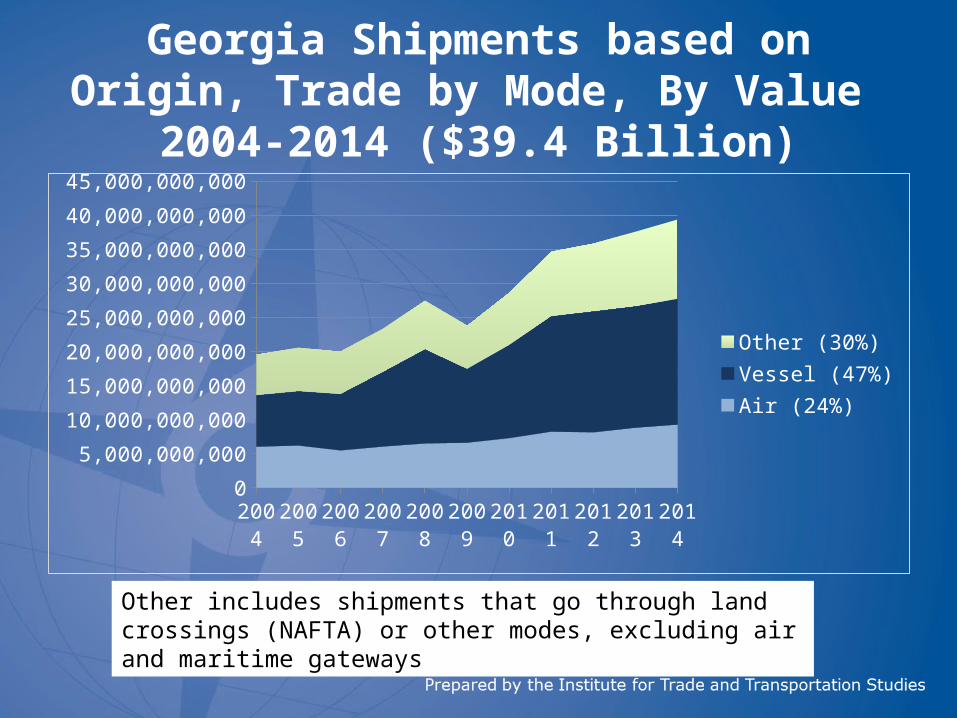
Georgia Shipments based on Origin, Trade by Mode, By Value
2004-2014 ($39.4 Billion)
Other includes shipments that go through land crossings (NAFTA) or other modes, excluding air and maritime gateways
2004 2005 2006 2007 2008 2009 2010 2011 2012 2013 20140
5,000,000,000
10,000,000,000
15,000,000,000
20,000,000,000
25,000,000,000
30,000,000,000
35,000,000,000
40,000,000,000
45,000,000,000
Other (30%)Vessel (47%)Air (24%)

Shipments by Commodity
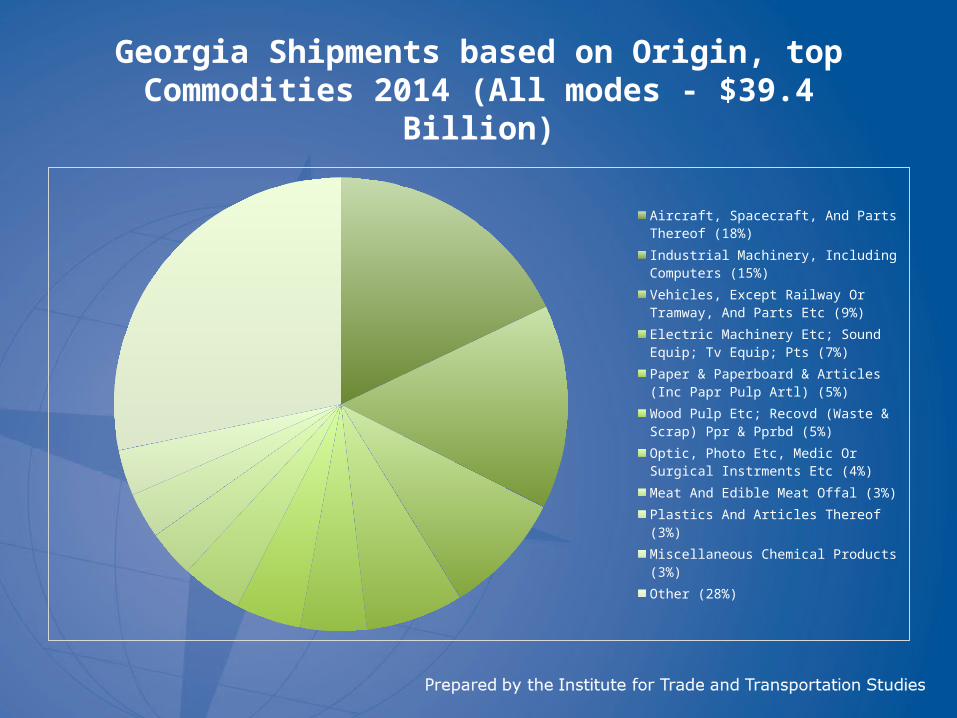
Georgia Shipments based on Origin, top Commodities 2014 (All modes - $39.4 Billion)
Aircraft, Spacecraft, And Parts Thereof (18%)Industrial Machinery, Including Computers (15%)Vehicles, Except Railway Or Tramway, And Parts Etc (9%)Electric Machinery Etc; Sound Equip; Tv Equip; Pts (7%)Paper & Paperboard & Articles (Inc Papr Pulp Artl) (5%)Wood Pulp Etc; Recovd (Waste & Scrap) Ppr & Pprbd (5%)Optic, Photo Etc, Medic Or Surgical Instrments Etc (4%)Meat And Edible Meat Offal (3%)Plastics And Articles Thereof (3%)Miscellaneous Chemical Products (3%)Other (28%)

Georgia Shipments based on Origin, Top Five Commodities, 2004-2014
(All modes - $39.4 Billion)
20042005
20062007
20082009
20102011
20122013
20140
1000000000
2000000000
3000000000
4000000000
5000000000
6000000000
7000000000
8000000000
Aircraft, Spacecraft, And Parts Thereof (18%)
Industrial Machinery, Includ-ing Computers (15%)
Vehicles, Except Railway Or Tramway, And Parts Etc (9%)
Electric Machinery Etc; Sound Equip; Tv Equip; Pts (7%)
Paper & Paperboard & Arti-cles (Inc Papr Pulp Artl) (5%)
Ranking and Share is based on 2014 values

Georgia Shipments based on Origin, top Commodities 2014
(Air Shipments- $9.3 Billion)
Aircraft, Spacecraft, And Parts Thereof (43%)
Industrial Machinery, Including Computers (21%)
Optic, Photo Etc, Medic Or Surgical Instrments Etc (11%)
Electric Machinery Etc; Sound Equip; Tv Equip; Pts (10%)
Pharmaceutical Products (3%)
Miscellaneous Chemical Products (2%)
Articles Of Iron Or Steel (1%)
Plastics And Articles Thereof (1%)
Vehicles, Except Railway Or Tramway, And Parts Etc (1%)
Glass And Glassware (1%)
Other (6%)
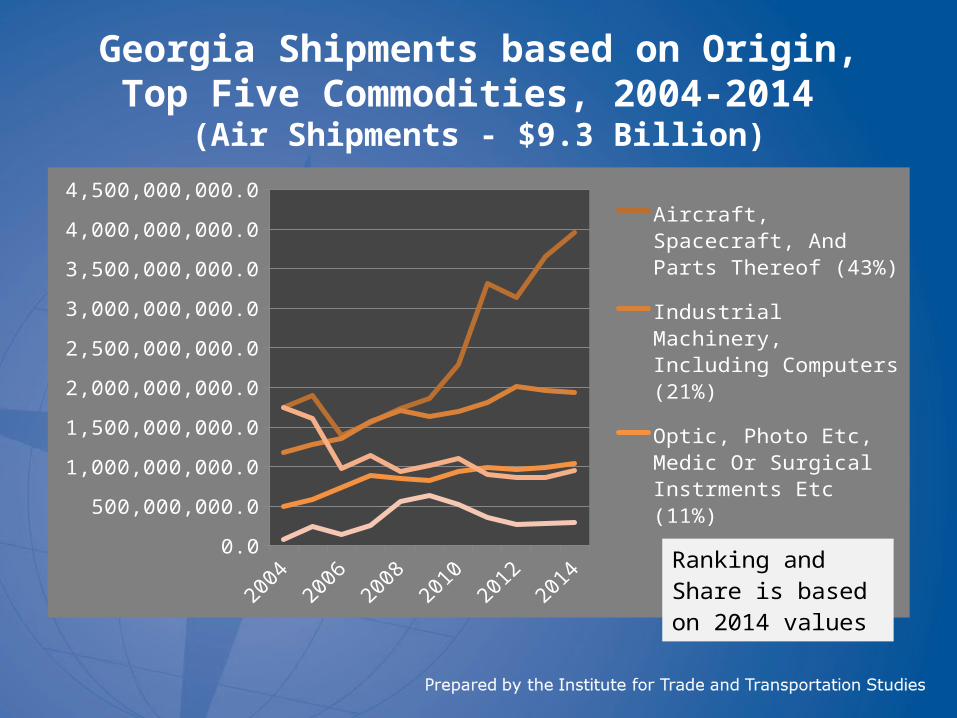
Georgia Shipments based on Origin, Top Five Commodities, 2004-2014
(Air Shipments - $9.3 Billion)
20042005
20062007
20082009
20102011
20122013
20140.0
500,000,000.0
1,000,000,000.0
1,500,000,000.0
2,000,000,000.0
2,500,000,000.0
3,000,000,000.0
3,500,000,000.0
4,000,000,000.0
4,500,000,000.0
Aircraft, Spacecraft, And Parts Thereof (43%)
Industrial Machinery, Includ-ing Computers (21%)
Optic, Photo Etc, Medic Or Surgical Instrments Etc (11%)
Electric Machinery Etc; Sound Equip; Tv Equip; Pts (10%)
Pharmaceutical Products (3%)
Ranking and Share is based on 2014 values

Georgia Shipments based on Origin, top Commodities 2014 (Vessel Shipments- $18.6 Billion)
Industrial Machinery, Including Computers (14%)
Wood Pulp Etc; Recovd (Waste & Scrap) Ppr & Pprbd (10%)
Vehicles, Except Railway Or Tramway, And Parts Etc (9%)
Paper & Paperboard & Articles (Inc Papr Pulp Artl) (7%)
Meat And Edible Meat Offal (6%)
Electric Machinery Etc; Sound Equip; Tv Equip; Pts (5%)
Miscellaneous Chemical Products (5%)
Cotton, Including Yarn And Woven Fabric Thereof (4%)
Food Industry Residues & Waste; Prep Animal Feed (3%)
Plastics And Articles Thereof (3%)
Other (34%)

Georgia Shipments based on Origin, Top Five Commodities, 2004-2014
(Vessel Shipments - $18.6 Billion)
20042005
20062007
20082009
20102011
20122013
20140.0
500,000,000.0
1,000,000,000.0
1,500,000,000.0
2,000,000,000.0
2,500,000,000.0
3,000,000,000.0Industrial Machinery, Includ-ing Computers (14%)
Wood Pulp Etc; Recovd (Waste & Scrap) Ppr & Pprbd (10%)
Vehicles, Except Railway Or Tramway, And Parts Etc (9%)
Paper & Paperboard & Arti-cles (Inc Papr Pulp Artl) (7%)
Meat And Edible Meat Offal (6%)
Ranking and Share is based on 2014 values

Shipments by Destination

Georgia Shipments based on Origin, top Destinations 2014
(All modes - $39.4 Billion)
Canada (16%) China (8%)
Mexico (8%) United Kingdom (4%)
Singapore (4%) Brazil (4%)
Japan (3%) Germany (3%)
Korea, Republic Of (3%) Australia (2%)
Other (45%)

Georgia Shipments based on Origin, Top Five Destinations, 2004-2014
(All modes - $39.4 Billion)
2004 2005 2006 2007 2008 2009 2010 2011 2012 2013 20140
1,000,000,000
2,000,000,000
3,000,000,000
4,000,000,000
5,000,000,000
6,000,000,000
7,000,000,000
8,000,000,000
Canada (16%)China (8%)Mexico (8%)United Kingdom (4%)Singapore (4%)
Ranking and Share is based on 2014 values
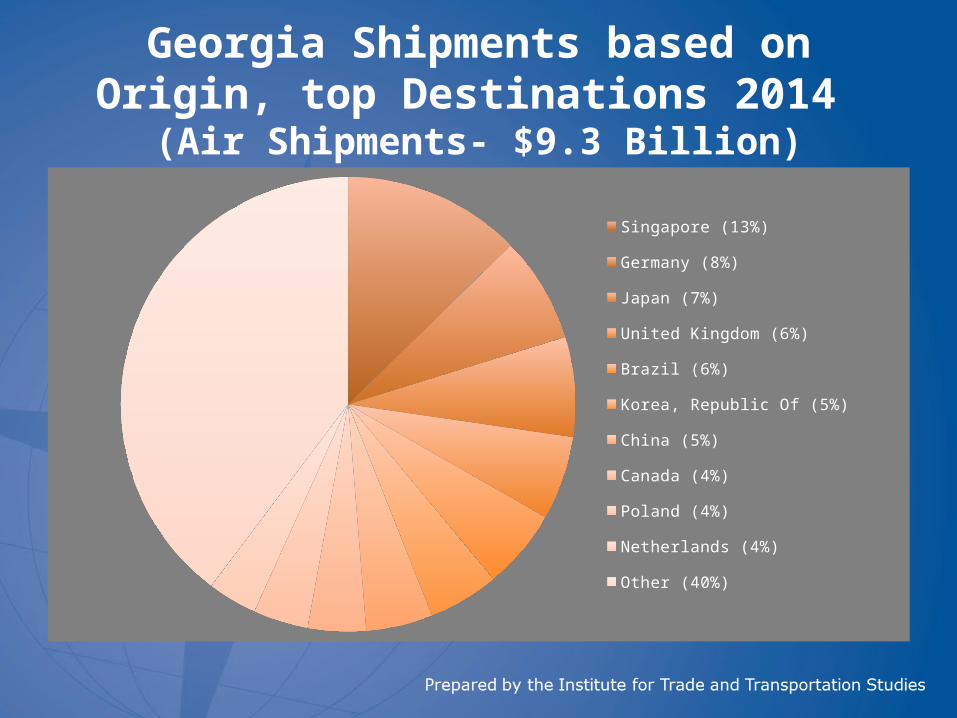
Georgia Shipments based on Origin, top Destinations 2014
(Air Shipments- $9.3 Billion)
Singapore (13%) Germany (8%)
Japan (7%) United Kingdom (6%)
Brazil (6%) Korea, Republic Of (5%)
China (5%) Canada (4%)
Poland (4%) Netherlands (4%)
Other (40%)

Georgia Shipments based on Origin, Top Five Destinations, 2004-2014
(Air Shipments - $9.3 Billion)
0.00
200,000,000.00
400,000,000.00
600,000,000.00
800,000,000.00
1,000,000,000.00
1,200,000,000.00
1,400,000,000.00
Singapore (13%)Germany (8%)Japan (7%)United Kingdom (6%)Brazil (6%)
Ranking and Share is based on 2014 values

Georgia Shipments based on Origin, top Destinations 2014 (Vessel Shipments- $18.6 Billion)
China (12%) Japan (4%)
Brazil (4%) Germany (4%)
Australia (4%) Belgium (3%)
United Kingdom (3%) Turkey (3%)
United Arab Emirates (3%) Taiwan (3%)
Other (57%)
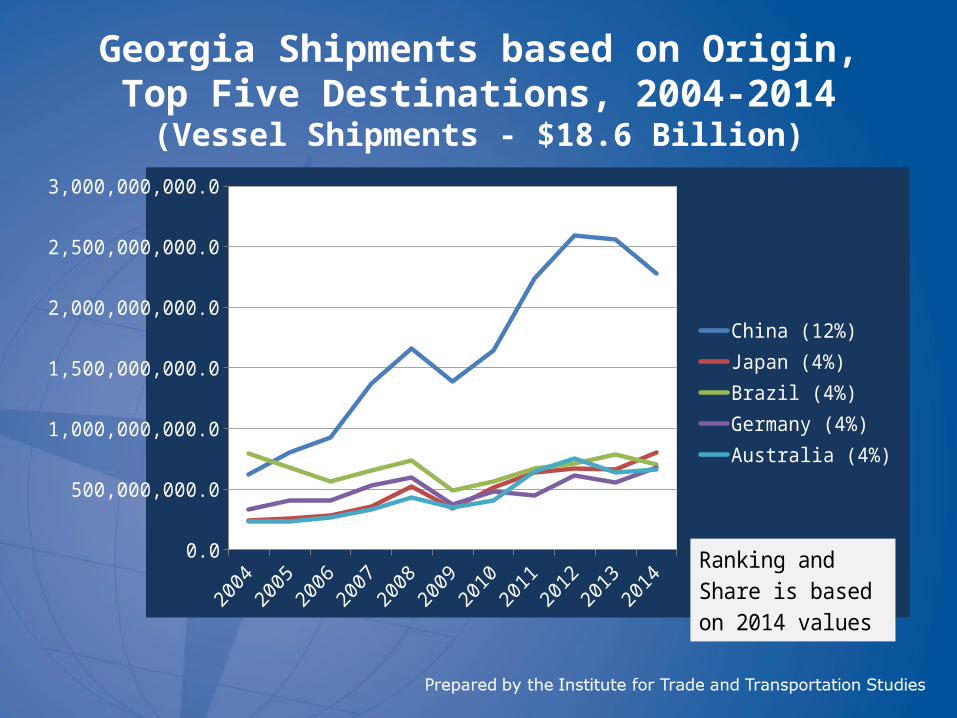
Georgia Shipments based on Origin, Top Five Destinations, 2004-2014
(Vessel Shipments - $18.6 Billion)
0.0
500,000,000.0
1,000,000,000.0
1,500,000,000.0
2,000,000,000.0
2,500,000,000.0
3,000,000,000.0
China (12%)Japan (4%)Brazil (4%)Germany (4%)Australia (4%)
Ranking and Share is based on 2014 values

Shipments by Customs Districts

Georgia Shipments based on Origin, top Customs Districts,
2014 (All modes - $39.4 Billion)
Savannah, Ga. (36%)
Atlanta, Ga. (10%)
Charleston, S.C. (5%)
Detroit, Michigan (5%)
Laredo, Texas (5%)
Buffalo-Niagara Falls, N.Y. (3%)
Cleveland, Ohio (3%)
Anchorage, Alaska (7%)
Miami Int. Airport, Fla. (23%)
Port Huron, Michigan (48%)
Other (26%)
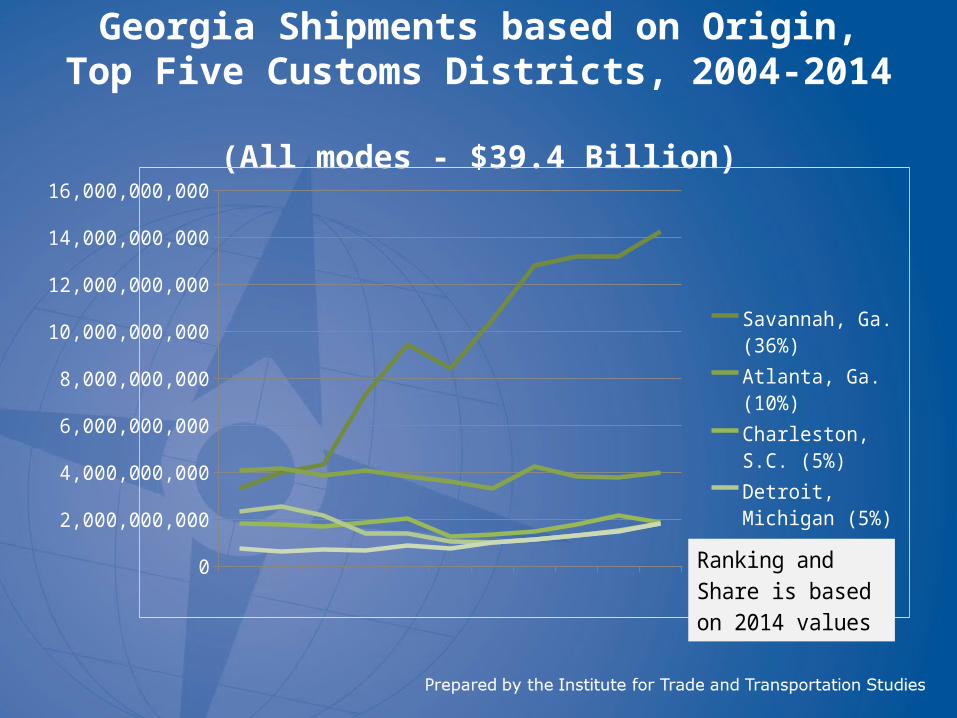
Georgia Shipments based on Origin, Top Five Customs Districts, 2004-2014
(All modes - $39.4 Billion)
2004 2005 2006 2007 2008 2009 2010 2011 2012 2013 20140
2,000,000,000
4,000,000,000
6,000,000,000
8,000,000,000
10,000,000,000
12,000,000,000
14,000,000,000
16,000,000,000
Savannah, Ga. (36%)
Atlanta, Ga. (10%)
Charleston, S.C. (5%)
Detroit, Michigan (5%)
Laredo, Texas (5%)
Ranking and Share is based on 2014 values

Georgia Shipments based on Origin, top Customs Districts,
2011 (Air Shipments- $9.3 Billion)
Atlanta, Ga. (39%)
Cleveland, Ohio (12%)
Miami Int. Airport, Fla. (10%)
New Orleans, La. (7%)
Anchorage, Alaska (6%)
J.F.K. Int. Airport, N.Y. (6%)
Chicago, Illinois (5%)
Washington, D.C. (4%)
Philadelphia Intl Airport (2%)
Honolulu Int. Airport (2%)
All Others (7%)
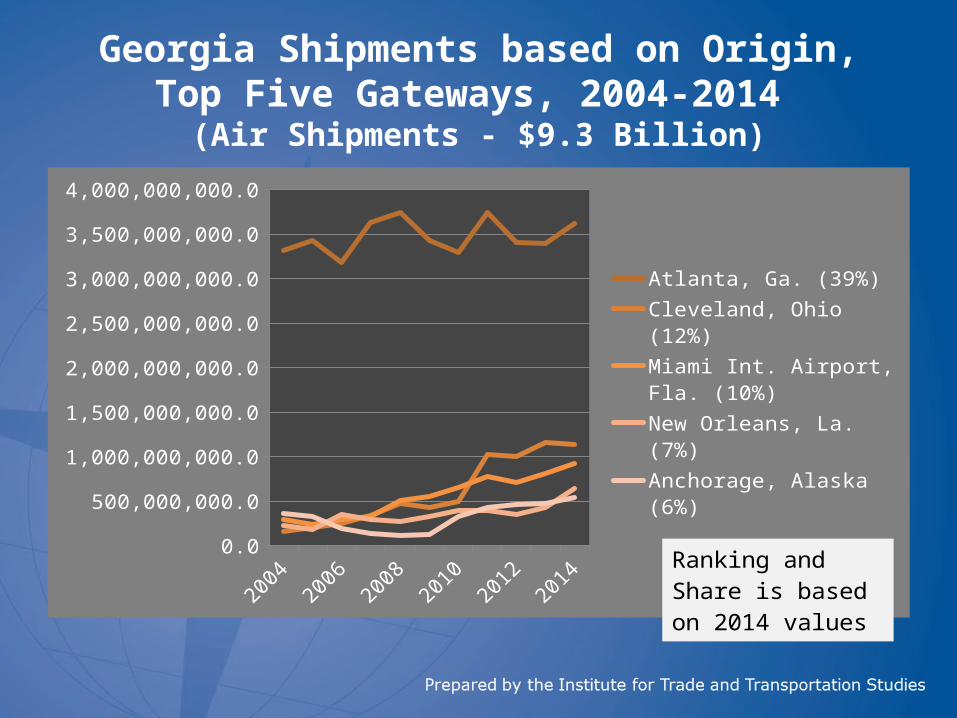
Georgia Shipments based on Origin, Top Five Gateways, 2004-2014
(Air Shipments - $9.3 Billion)
20042005
20062007
20082009
20102011
20122013
20140.0
500,000,000.0
1,000,000,000.0
1,500,000,000.0
2,000,000,000.0
2,500,000,000.0
3,000,000,000.0
3,500,000,000.0
4,000,000,000.0
Atlanta, Ga. (39%)Cleveland, Ohio (12%)Miami Int. Airport, Fla. (10%)New Orleans, La. (7%)Anchorage, Alaska (6%)
Ranking and Share is based on 2014 values
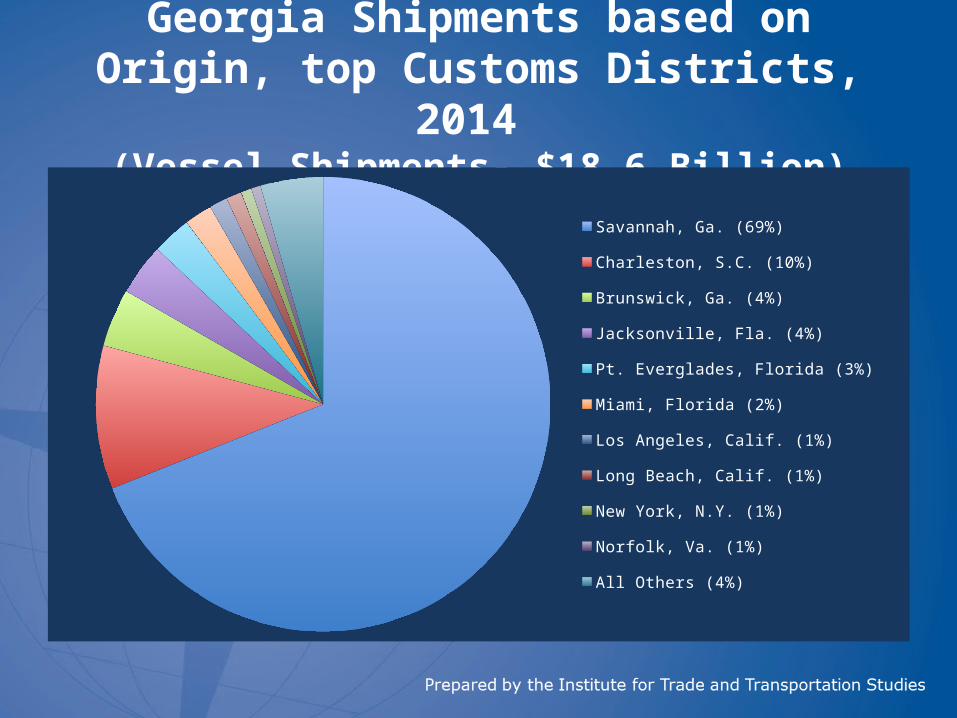
Georgia Shipments based on Origin, top Customs Districts,
2014 (Vessel Shipments- $18.6 Billion)
Savannah, Ga. (69%)
Charleston, S.C. (10%)
Brunswick, Ga. (4%)
Jacksonville, Fla. (4%)
Pt. Everglades, Florida (3%)
Miami, Florida (2%)
Los Angeles, Calif. (1%)
Long Beach, Calif. (1%)
New York, N.Y. (1%)
Norfolk, Va. (1%)
All Others (4%)
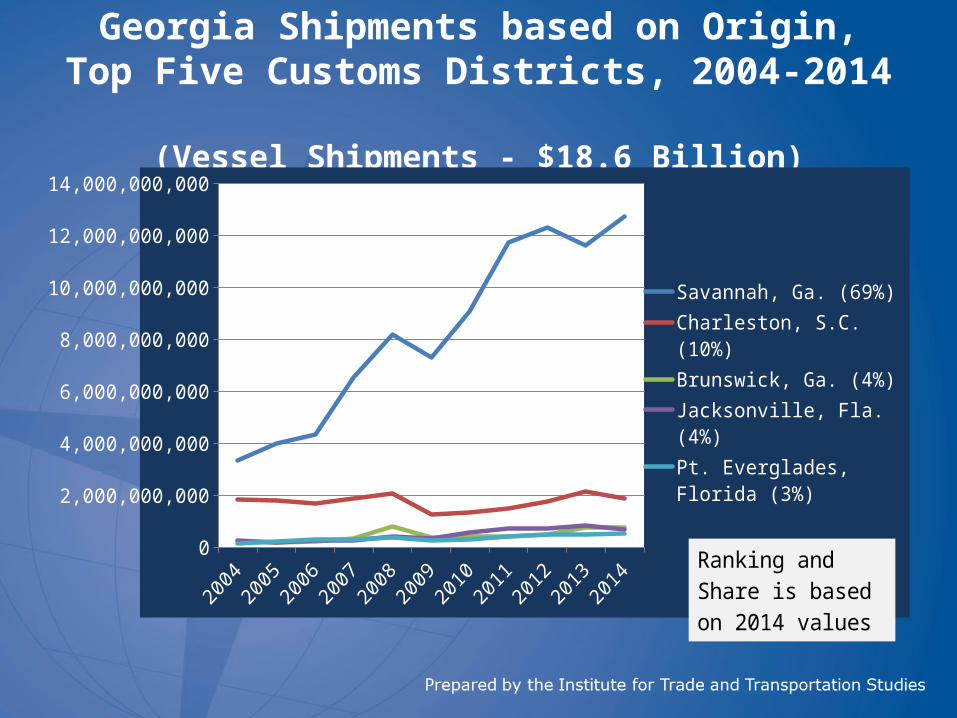
Georgia Shipments based on Origin, Top Five Customs Districts, 2004-2014
(Vessel Shipments - $18.6 Billion)
0
2,000,000,000
4,000,000,000
6,000,000,000
8,000,000,000
10,000,000,000
12,000,000,000
14,000,000,000
Savannah, Ga. (69%)Charleston, S.C. (10%)Brunswick, Ga. (4%)Jacksonville, Fla. (4%)Pt. Everglades, Florida (3%)
Ranking and Share is based on 2014 values