Embed Size (px)
Citation preview
Georgia Council on Criminal Justice ReformThird Probation Subcommittee Meeting September 7, 2016Marshall Clement, Division DirectorRuss Hauge, Senior Policy AdvisorAngie Gunter, Senior Research AssociateChenise Bonilla, Policy AnalystDan Altman, Program Associate
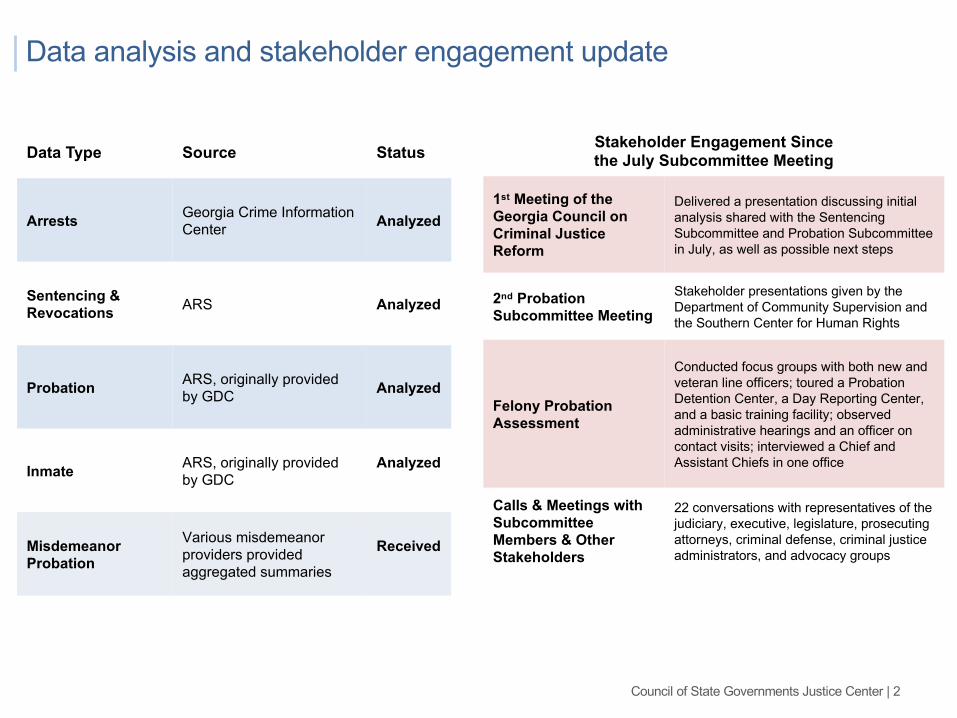
Data analysis and stakeholder engagement update
Data Type Source Status
Arrests Georgia Crime Information Center Analyzed
Sentencing & Revocations ARS Analyzed
Probation ARS, originally provided by GDC Analyzed
Inmate ARS, originally provided by GDC
Analyzed
Misdemeanor Probation
Various misdemeanor providers provided aggregated summaries
Received
Stakeholder Engagement Sincethe July Subcommittee Meeting
1st Meeting of the Georgia Council on Criminal Justice Reform
Delivered a presentation discussing initial analysis shared with the Sentencing Subcommittee and Probation Subcommittee in July, as well as possible next steps
2nd Probation Subcommittee Meeting
Stakeholder presentations given by the Department of Community Supervision and the Southern Center for Human Rights
Felony Probation Assessment
Conducted focus groups with both new and veteran line officers; toured a Probation Detention Center, a Day Reporting Center, and a basic training facility; observed administrative hearings and an officer on contact visits; interviewed a Chief and Assistant Chiefs in one office
Calls & Meetings with Subcommittee Members & Other Stakeholders
22 conversations with representatives of the judiciary, executive, legislature, prosecuting attorneys, criminal defense, criminal justice administrators, and advocacy groups
Council of State Governments Justice Center | 2
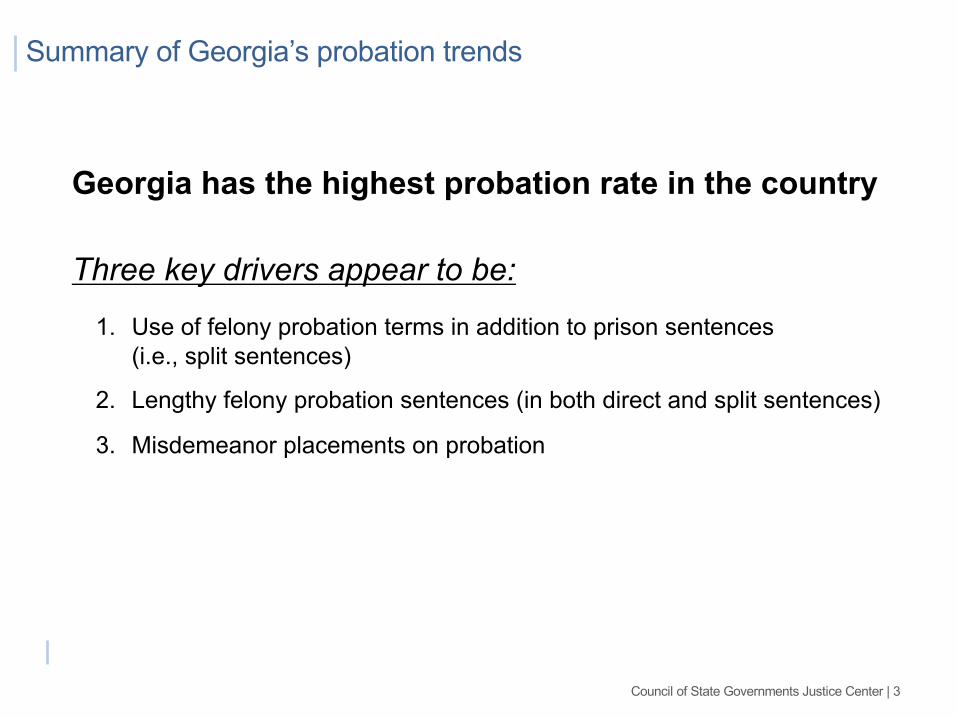
Summary of Georgia’s probation trends
Georgia has the highest probation rate in the country
Three key drivers appear to be:
1. Use of felony probation terms in addition to prison sentences(i.e., split sentences)
2. Lengthy felony probation sentences (in both direct and split sentences)
3. Misdemeanor placements on probation
Council of State Governments Justice Center | 3
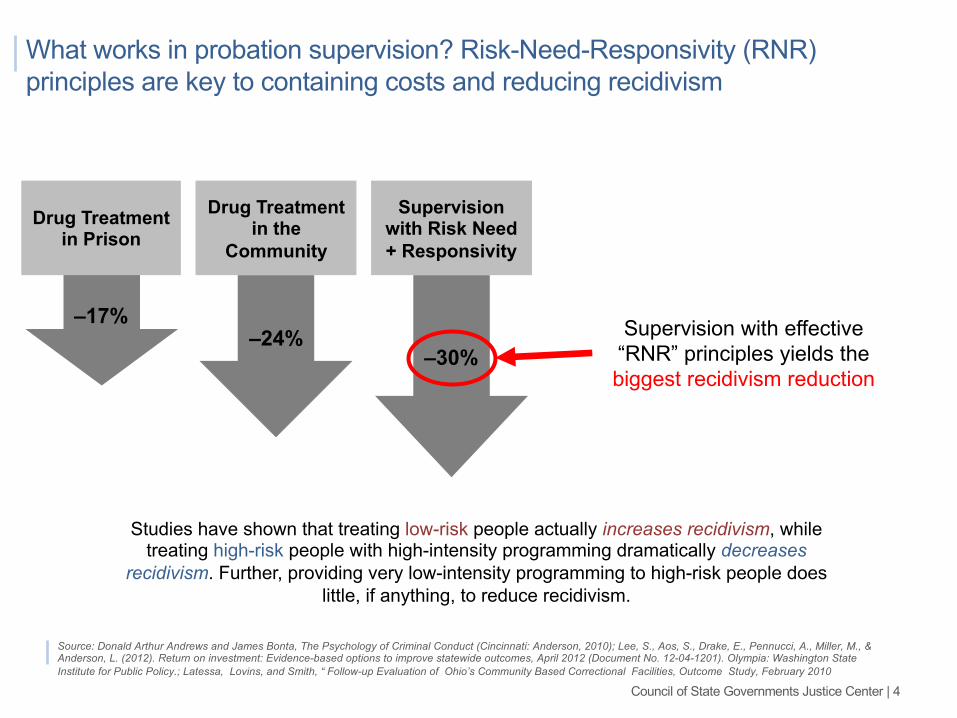
What works in probation supervision? Risk-Need-Responsivity (RNR) principles are key to containing costs and reducing recidivism
Supervision with effective “RNR” principles yields the biggest recidivism reduction
–24%–30%
–17%
Supervision with Risk Need + Responsivity
Drug Treatment in the
CommunityDrug Treatment
in Prison
Source: Donald Arthur Andrews and James Bonta, The Psychology of Criminal Conduct (Cincinnati: Anderson, 2010); Lee, S., Aos, S., Drake, E., Pennucci, A., Miller, M., & Anderson, L. (2012). Return on investment: Evidence-based options to improve statewide outcomes, April 2012 (Document No. 12-04-1201). Olympia: Washington State Institute for Public Policy.; Latessa, Lovins, and Smith, “ Follow-up Evaluation of Ohio’s Community Based Correctional Facilities, Outcome Study, February 2010
Studies have shown that treating low-risk people actually increases recidivism, while treating high-risk people with high-intensity programming dramatically decreases
recidivism. Further, providing very low-intensity programming to high-risk people does little, if anything, to reduce recidivism.
Council of State Governments Justice Center | 4
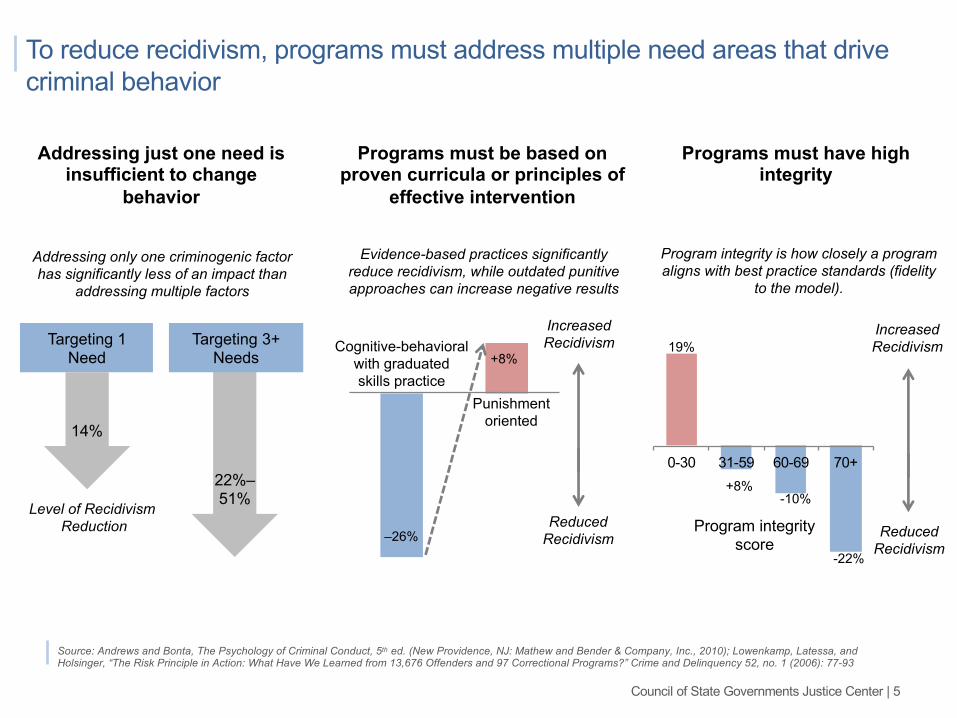
To reduce recidivism, programs must address multiple need areas that drive criminal behavior
Source: Andrews and Bonta, The Psychology of Criminal Conduct, 5th ed. (New Providence, NJ: Mathew and Bender & Company, Inc., 2010); Lowenkamp, Latessa, and Holsinger, “The Risk Principle in Action: What Have We Learned from 13,676 Offenders and 97 Correctional Programs?” Crime and Delinquency 52, no. 1 (2006): 77-93
–26%
+8%
Addressing just one need is insufficient to change
behavior
Programs must be based on proven curricula or principles of
effective intervention
Targeting 1 Need
Targeting 3+ Needs
14%
22%–51%
Cognitive-behavioral with graduated skills practice
Punishment oriented
Evidence-based practices significantly reduce recidivism, while outdated punitive approaches can increase negative results
Addressing only one criminogenic factor has significantly less of an impact than
addressing multiple factors
Level of RecidivismReduction
Increased Recidivism
ReducedRecidivism
Programs must have high integrity
Program integrity is how closely a program aligns with best practice standards (fidelity
to the model).
19%
+8%-10%
-22%
0-30 31-59 60-69 70+
Program integrity score
Increased Recidivism
Reduced Recidivism
Council of State Governments Justice Center | 5
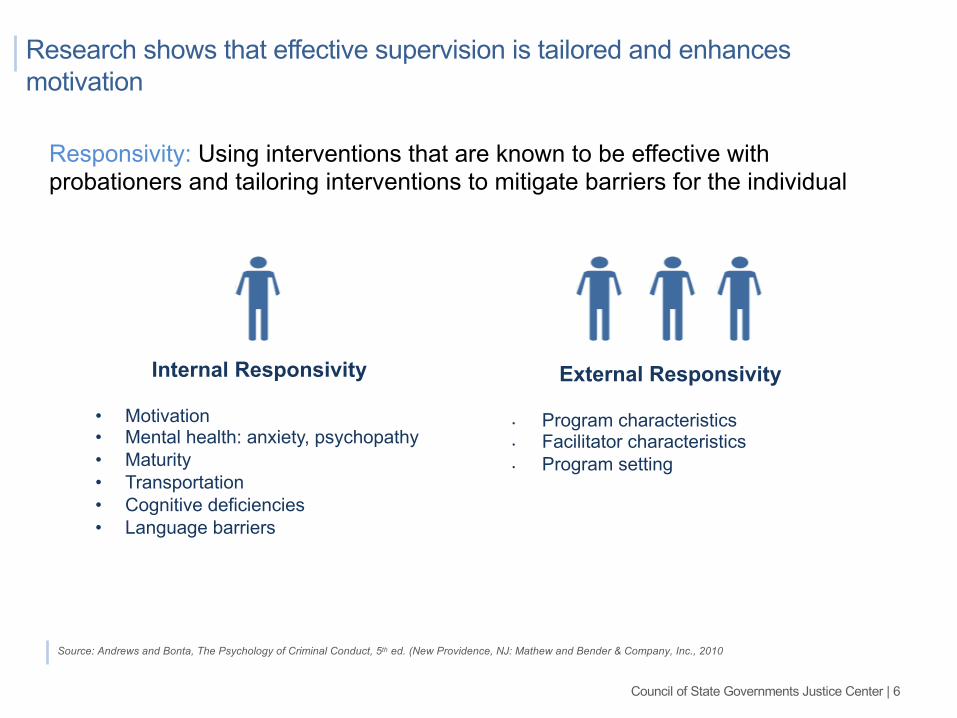
Research shows that effective supervision is tailored and enhances motivation
Source: Andrews and Bonta, The Psychology of Criminal Conduct, 5th ed. (New Providence, NJ: Mathew and Bender & Company, Inc., 2010
Responsivity: Using interventions that are known to be effective with probationers and tailoring interventions to mitigate barriers for the individual
External Responsivity
• Program characteristics• Facilitator characteristics• Program setting
Internal Responsivity
• Motivation• Mental health: anxiety, psychopathy• Maturity • Transportation• Cognitive deficiencies• Language barriers
Council of State Governments Justice Center | 6
Overview
1
2
3
4 Next Steps
Probation population trends (felony)
Probation supervision practices (felony)
Probation recidivism outcomes (felony)
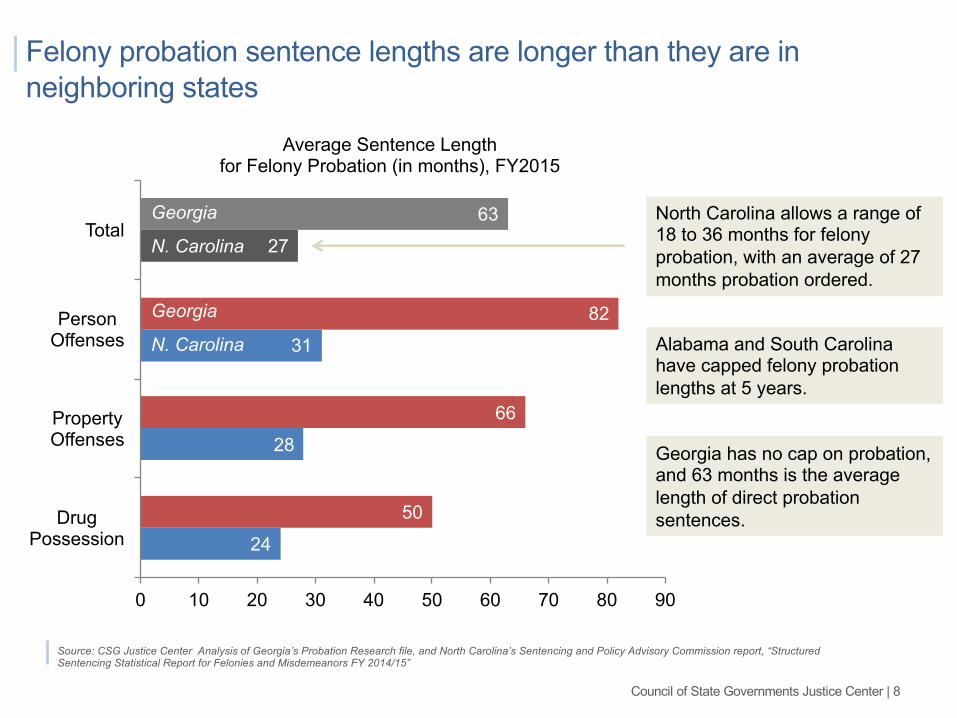
24
28
31
27
50
66
82
63
0 10 20 30 40 50 60 70 80 90
DrugPossession
PropertyOffenses
PersonOffenses
Total
Felony probation sentence lengths are longer than they are in neighboring states
Source: CSG Justice Center Analysis of Georgia’s Probation Research file, and North Carolina’s Sentencing and Policy Advisory Commission report, “Structured Sentencing Statistical Report for Felonies and Misdemeanors FY 2014/15”
Average Sentence Length for Felony Probation (in months), FY2015
Georgia North Carolina allows a range of 18 to 36 months for felony probation, with an average of 27 months probation ordered.
N. Carolina
Alabama and South Carolina have capped felony probation lengths at 5 years.
Georgia
N. Carolina
Georgia has no cap on probation, and 63 months is the average length of direct probation sentences.
Council of State Governments Justice Center | 8
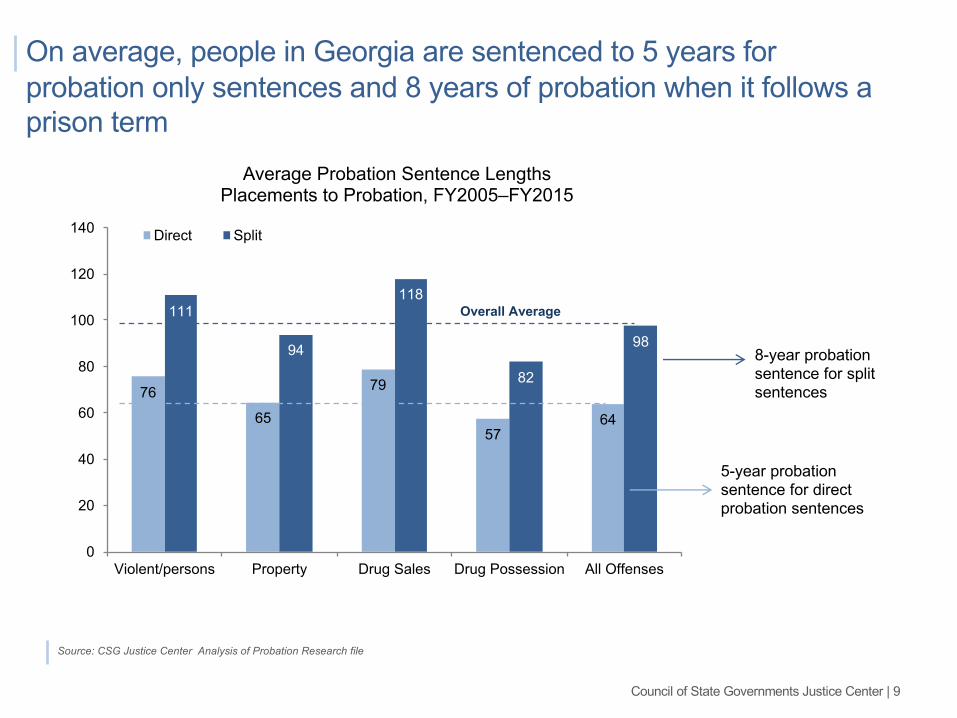
On average, people in Georgia are sentenced to 5 years for probation only sentences and 8 years of probation when it follows a prison term
Source: CSG Justice Center Analysis of Probation Research file
76
65
79
5764
111
94
118
82
98
0
20
40
60
80
100
120
140
Violent/persons Property Drug Sales Drug Possession All Offenses
Direct Split
Average Probation Sentence LengthsPlacements to Probation, FY2005–FY2015
Overall Average
8-year probation sentence for split sentences
5-year probation sentence for direct probation sentences
Council of State Governments Justice Center | 9
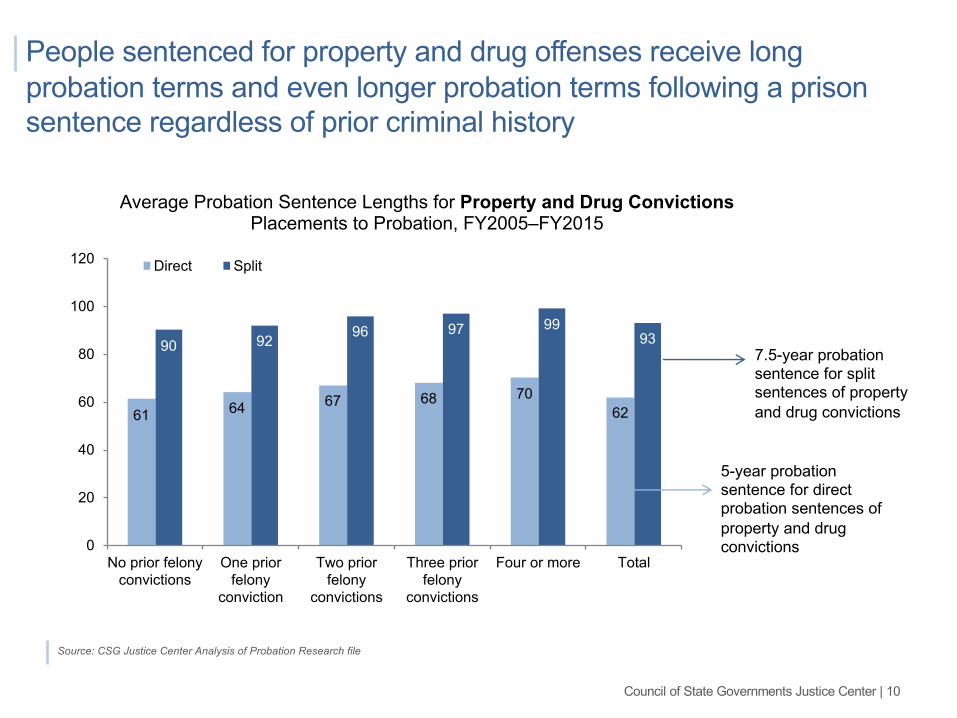
People sentenced for property and drug offenses receive long probation terms and even longer probation terms following a prison sentence regardless of prior criminal history
Source: CSG Justice Center Analysis of Probation Research file
61 64 67 68 7062
90 92 96 97 9993
0
20
40
60
80
100
120
No prior felony convictions
One prior felony
conviction
Two prior felony
convictions
Three prior felony
convictions
Four or more Total
Direct Split
Average Probation Sentence Lengths for Property and Drug ConvictionsPlacements to Probation, FY2005–FY2015
7.5-year probation sentence for split sentences of property and drug convictions
5-year probation sentence for direct probation sentences of property and drug convictions
Council of State Governments Justice Center | 10
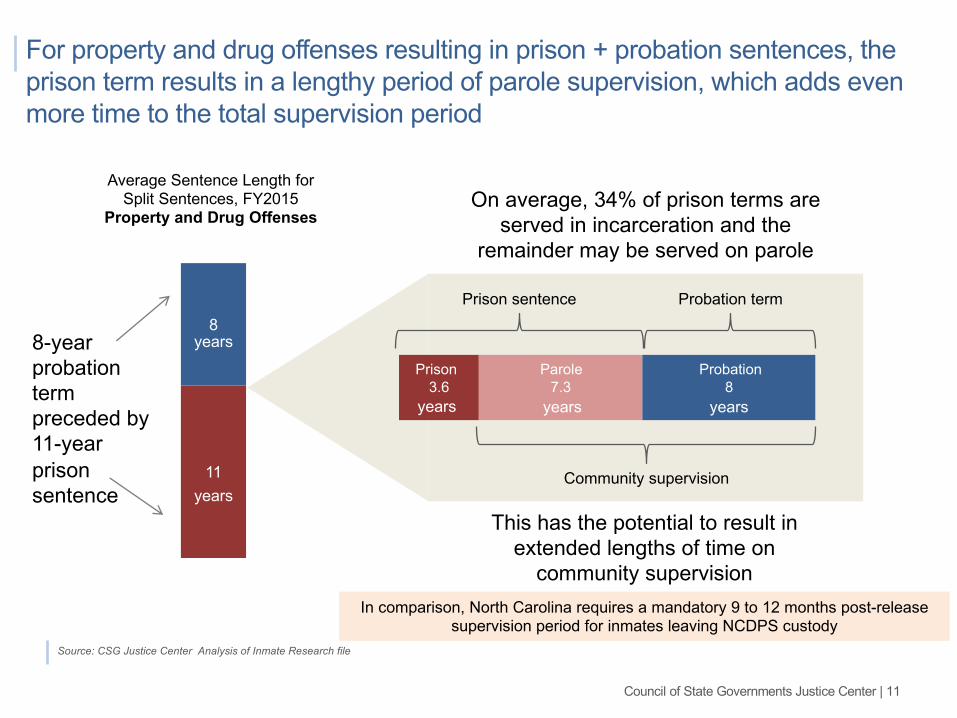
For property and drug offenses resulting in prison + probation sentences, the prison term results in a lengthy period of parole supervision, which adds even more time to the total supervision period
Source: CSG Justice Center Analysis of Inmate Research file
11
88-year probation termpreceded by 11-year prison sentence
Average Sentence Length for Split Sentences, FY2015
Property and Drug Offenses
years
years
3.6 7.3 8
Prison sentence Probation term
Prison Parole Probation
Community supervision
On average, 34% of prison terms are served in incarceration and the
remainder may be served on parole
This has the potential to result in extended lengths of time on
community supervisionIn comparison, North Carolina requires a mandatory 9 to 12 months post-release
supervision period for inmates leaving NCDPS custody
years yearsyears
Council of State Governments Justice Center | 11
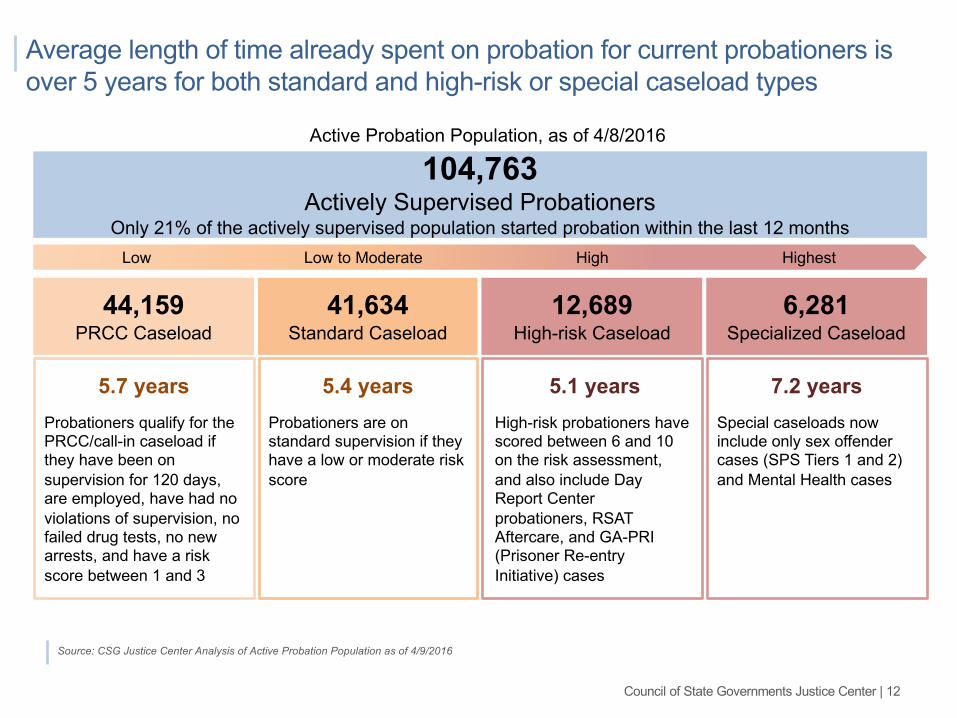
Average length of time already spent on probation for current probationers is over 5 years for both standard and high-risk or special caseload types
104,763Actively Supervised Probationers
Only 21% of the actively supervised population started probation within the last 12 months
12,689High-risk Caseload
44,159PRCC Caseload
Active Probation Population, as of 4/8/2016
5.7 years 5.1 years
6,281Specialized Caseload
7.2 yearsSpecial caseloads now include only sex offender cases (SPS Tiers 1 and 2) and Mental Health cases
High-risk probationers have scored between 6 and 10 on the risk assessment, and also include Day Report Center probationers, RSAT Aftercare, and GA-PRI (Prisoner Re-entry Initiative) cases
Source: CSG Justice Center Analysis of Active Probation Population as of 4/9/2016
41,634Standard Caseload
5.4 yearsProbationers qualify for the PRCC/call-in caseload if they have been on supervision for 120 days, are employed, have had no violations of supervision, no failed drug tests, no new arrests, and have a risk score between 1 and 3
Low Low to Moderate High Highest
Probationers are on standard supervision if they have a low or moderate risk score
Council of State Governments Justice Center | 12
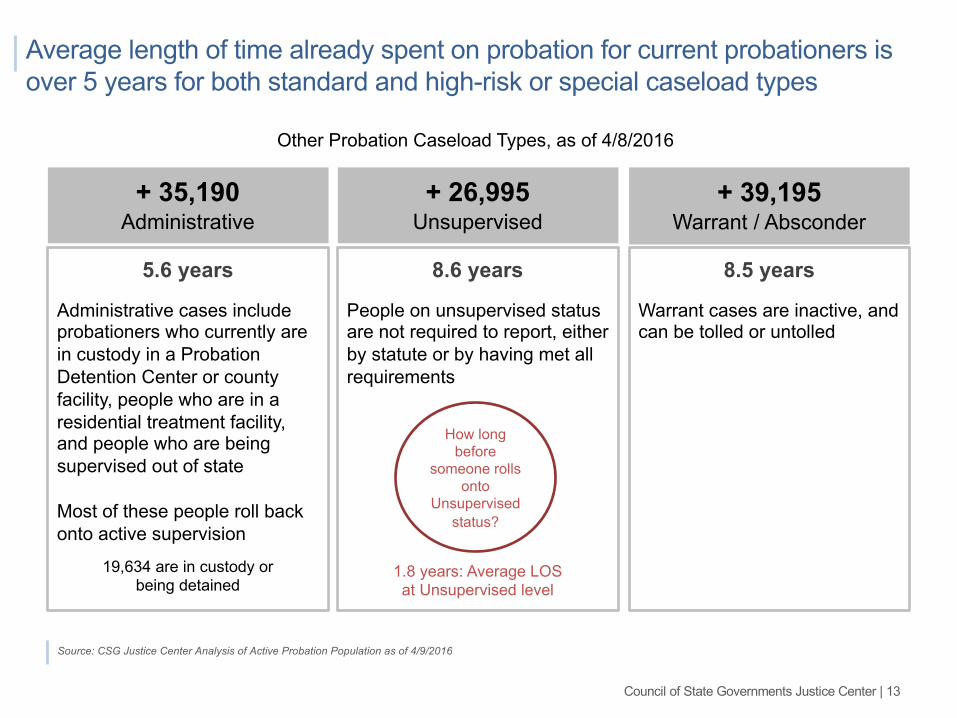
Average length of time already spent on probation for current probationers is over 5 years for both standard and high-risk or special caseload types
Source: CSG Justice Center Analysis of Active Probation Population as of 4/9/2016
Other Probation Caseload Types, as of 4/8/2016
+ 26,995Unsupervised
8.6 years
+ 35,190Administrative
5.6 years
19,634 are in custody or being detained
1.8 years: Average LOS at Unsupervised level
+ 39,195Warrant / Absconder
How long before
someone rolls onto
Unsupervised status?
8.5 years
Administrative cases include probationers who currently are in custody in a Probation Detention Center or county facility, people who are in a residential treatment facility, and people who are being supervised out of state
Most of these people roll back onto active supervision
People on unsupervised status are not required to report, either by statute or by having met all requirements
Warrant cases are inactive, and can be tolled or untolled
Council of State Governments Justice Center | 13
Overview
1 Probation population trends (felony)
2 Probation supervision practices (felony)
3 Probation recidivism outcomes (felony)
4 Next Steps
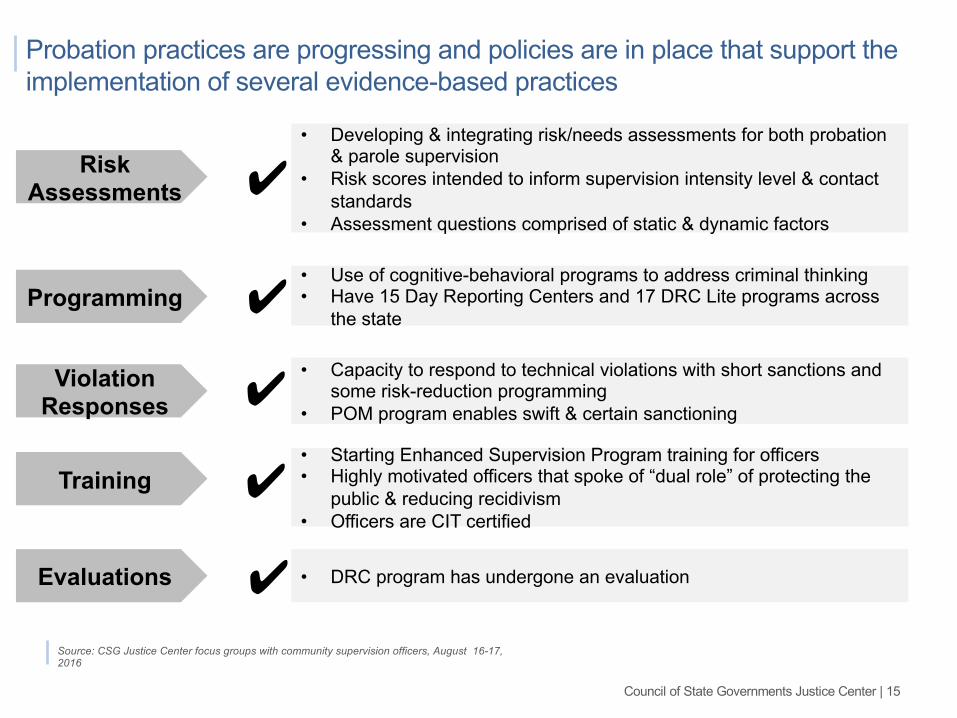
Probation practices are progressing and policies are in place that support the implementation of several evidence-based practices
Risk Assessments
Programming
Violation Responses
Training
Evaluations
• Developing & integrating risk/needs assessments for both probation & parole supervision
• Risk scores intended to inform supervision intensity level & contact standards
• Assessment questions comprised of static & dynamic factors
• Use of cognitive-behavioral programs to address criminal thinking• Have 15 Day Reporting Centers and 17 DRC Lite programs across
the state
• Capacity to respond to technical violations with short sanctions and some risk-reduction programming
• POM program enables swift & certain sanctioning
• Starting Enhanced Supervision Program training for officers• Highly motivated officers that spoke of “dual role” of protecting the
public & reducing recidivism• Officers are CIT certified
• DRC program has undergone an evaluation
✔
✔
✔
✔
✔
Source: CSG Justice Center focus groups with community supervision officers, August 16-17, 2016
Council of State Governments Justice Center | 15
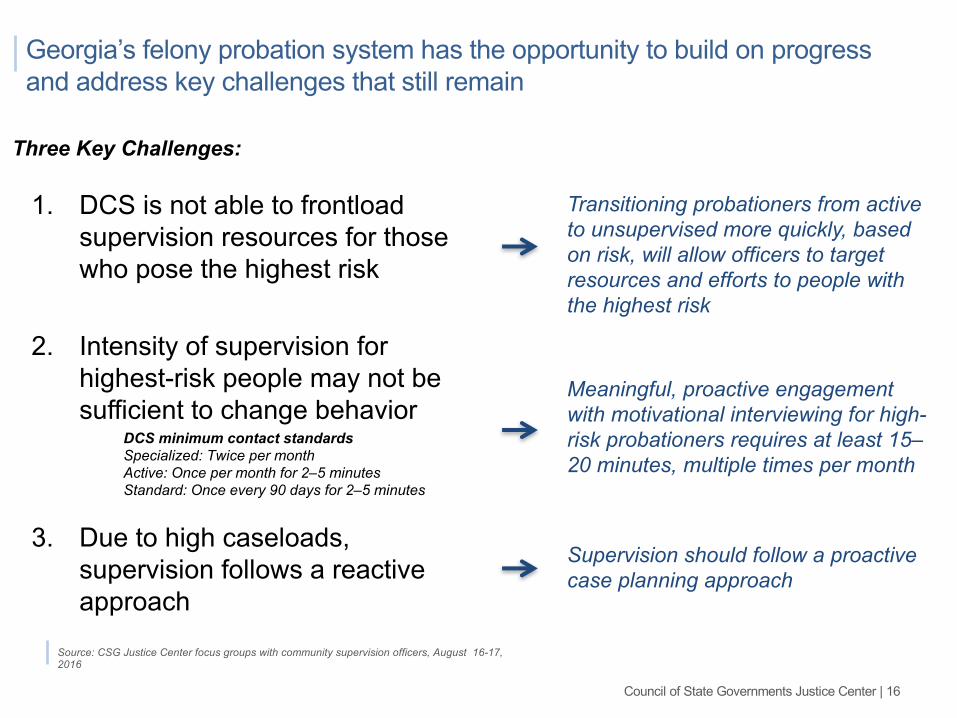
Georgia’s felony probation system has the opportunity to build on progress and address key challenges that still remain
Three Key Challenges:
1. DCS is not able to frontload supervision resources for those who pose the highest risk
2. Intensity of supervision for highest-risk people may not be sufficient to change behavior
3. Due to high caseloads, supervision follows a reactive approach
Transitioning probationers from active to unsupervised more quickly, based on risk, will allow officers to target resources and efforts to people with the highest risk
Meaningful, proactive engagement with motivational interviewing for high-risk probationers requires at least 15–20 minutes, multiple times per month
Supervision should follow a proactive case planning approach
Source: CSG Justice Center focus groups with community supervision officers, August 16-17, 2016
DCS minimum contact standardsSpecialized: Twice per monthActive: Once per month for 2–5 minutesStandard: Once every 90 days for 2–5 minutes
Council of State Governments Justice Center | 16
Source: CSG Justice Center Analysis of Probation and Inmate research files
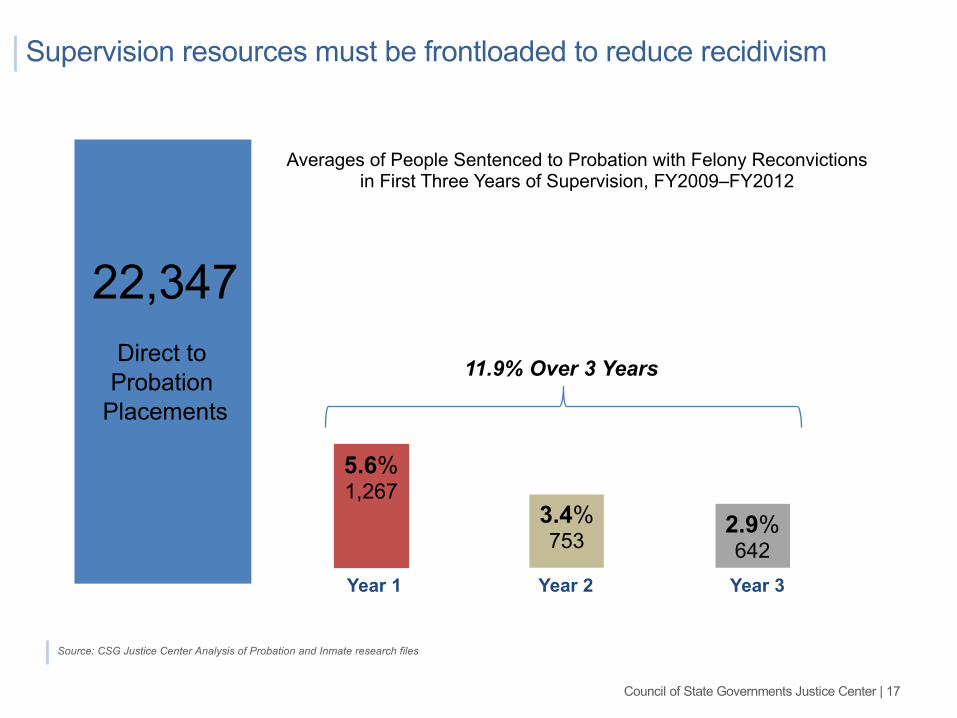
Averages of People Sentenced to Probation with Felony Reconvictionsin First Three Years of Supervision, FY2009–FY2012
Year 1 Year 2 Year 3
5.6%1,267
3.4%753
2.9%642
11.9% Over 3 Years
Supervision resources must be frontloaded to reduce recidivism
22,347Direct to Probation
Placements
Council of State Governments Justice Center | 17
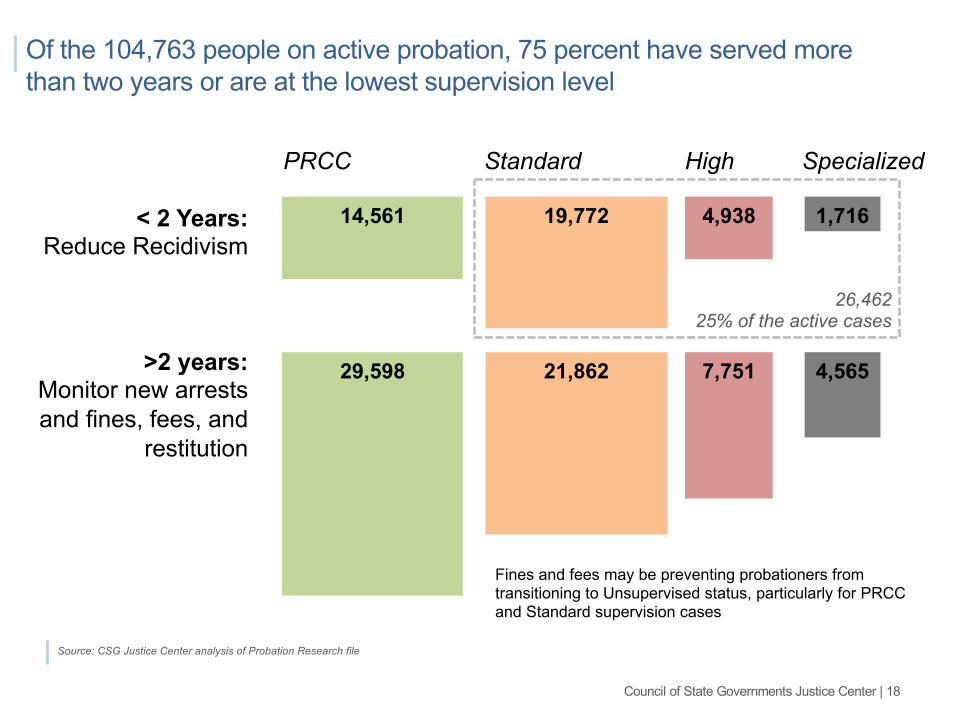
Of the 104,763 people on active probation, 75 percent have served more than two years or are at the lowest supervision level
Source: CSG Justice Center analysis of Probation Research file
14,561< 2 Years:Reduce Recidivism
>2 years:Monitor new arrests and fines, fees, and
restitution
19,772 4,938 1,716
29,598 21,862 7,751 4,565
PRCC Standard High Specialized
Fines and fees may be preventing probationers from transitioning to Unsupervised status, particularly for PRCC and Standard supervision cases
26,46225% of the active cases
Council of State Governments Justice Center | 18
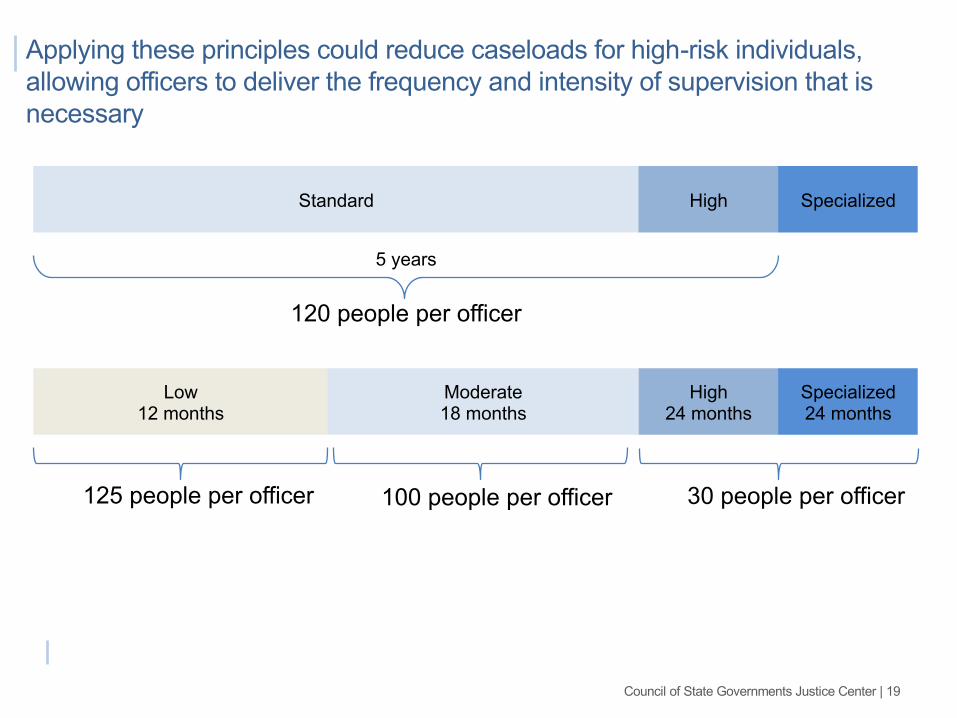
Applying these principles could reduce caseloads for high-risk individuals, allowing officers to deliver the frequency and intensity of supervision that is necessary
Standard High Specialized
Low12 months
High24 months
Specialized24 months
Moderate18 months
5 years
120 people per officer
125 people per officer 100 people per officer 30 people per officer
Council of State Governments Justice Center | 19
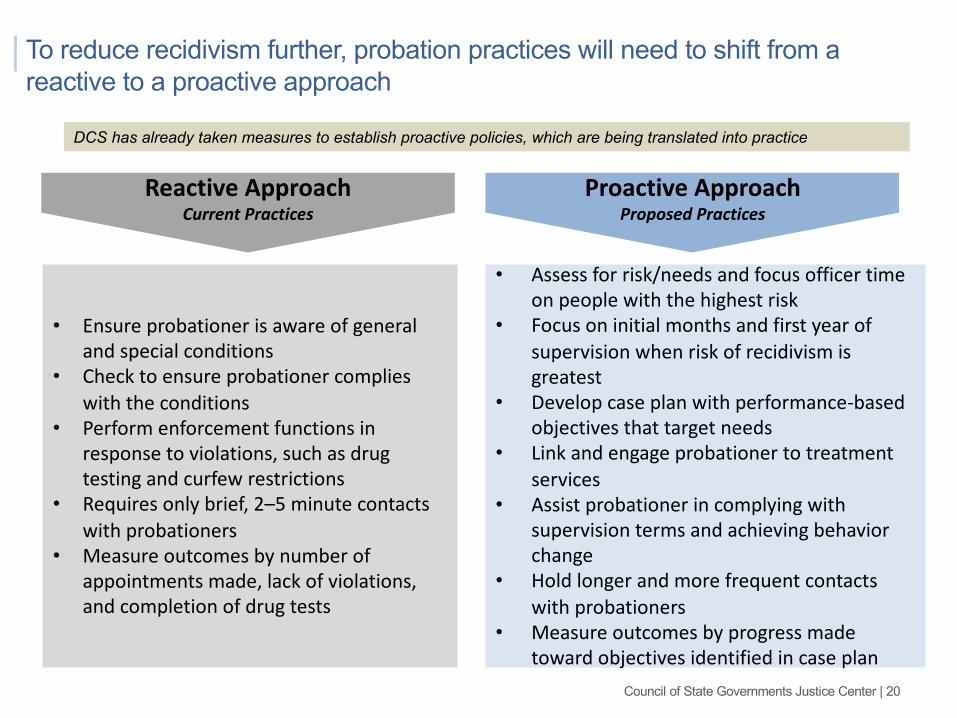
To reduce recidivism further, probation practices will need to shift from a reactive to a proactive approach
• Ensureprobationerisawareofgeneralandspecialconditions
• Checktoensureprobationercomplieswiththeconditions
• Performenforcementfunctionsinresponsetoviolations,suchasdrugtestingandcurfewrestrictions
• Requiresonlybrief,2–5minutecontactswithprobationers
• Measureoutcomesbynumberofappointmentsmade,lackofviolations,andcompletionofdrugtests
ProactiveApproachProposedPractices
ReactiveApproachCurrentPractices
• Assessforrisk/needsandfocusofficertimeonpeoplewiththehighestrisk
• Focusoninitialmonthsandfirstyearofsupervisionwhenriskofrecidivismisgreatest
• Developcaseplanwithperformance-basedobjectivesthattargetneeds
• Linkandengageprobationertotreatmentservices
• Assistprobationerincomplyingwithsupervisiontermsandachievingbehaviorchange
• Holdlongerandmorefrequentcontactswithprobationers
• Measureoutcomesbyprogressmadetowardobjectivesidentifiedincaseplan
DCS has already taken measures to establish proactive policies, which are being translated into practice
Council of State Governments Justice Center | 20
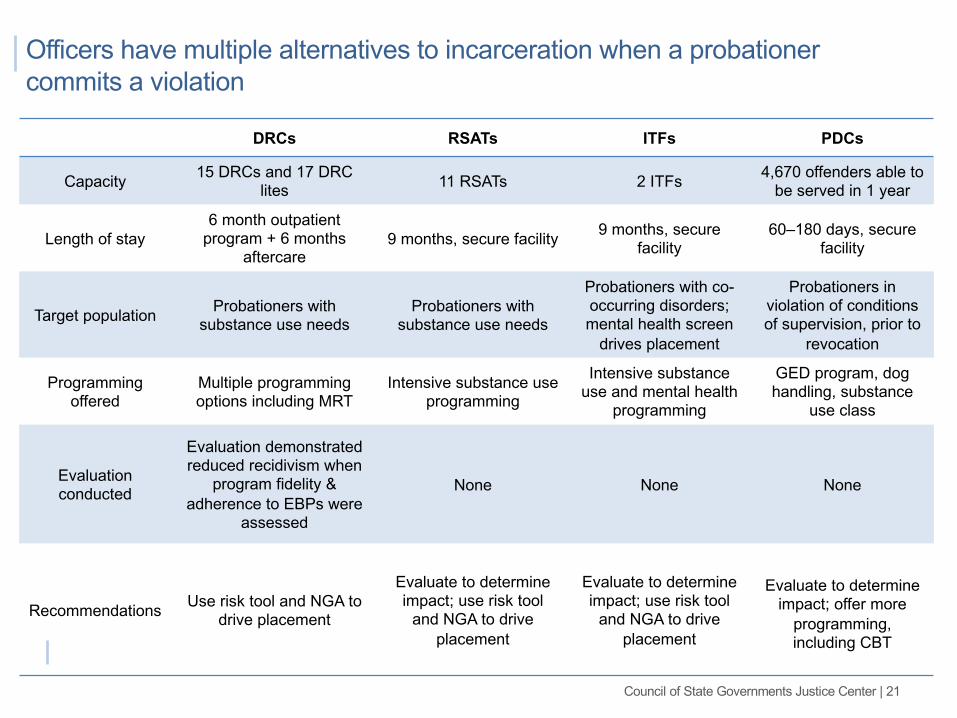
Officers have multiple alternatives to incarceration when a probationer commits a violation
DRCs RSATs ITFs PDCs
Capacity 15 DRCs and 17 DRC lites 11 RSATs 2 ITFs 4,670 offenders able to
be served in 1 year
Length of stay6 month outpatient
program + 6 months aftercare
9 months, secure facility 9 months, secure facility
60–180 days, secure facility
Target population Probationers with substance use needs
Probationers with substance use needs
Probationers with co-occurring disorders; mental health screen
drives placement
Probationers in violation of conditions of supervision, prior to
revocation
Programming offered
Multiple programming options including MRT
Intensive substance use programming
Intensive substance use and mental health
programming
GED program, dog handling, substance
use class
Evaluationconducted
Evaluation demonstrated reduced recidivism when
program fidelity & adherence to EBPs were
assessed
None None None
Recommendations Use risk tool and NGA to drive placement
Evaluate to determine impact; use risk tool
and NGA to drive placement
Evaluate to determine impact; use risk tool
and NGA to drive placement
Evaluate to determine impact; offer more
programming, including CBT
Council of State Governments Justice Center | 21
Overview
1 Probation population trends (felony)
2 Probation supervision practices (felony)
3 Probation recidivism outcomes (felony)
4 Next Steps
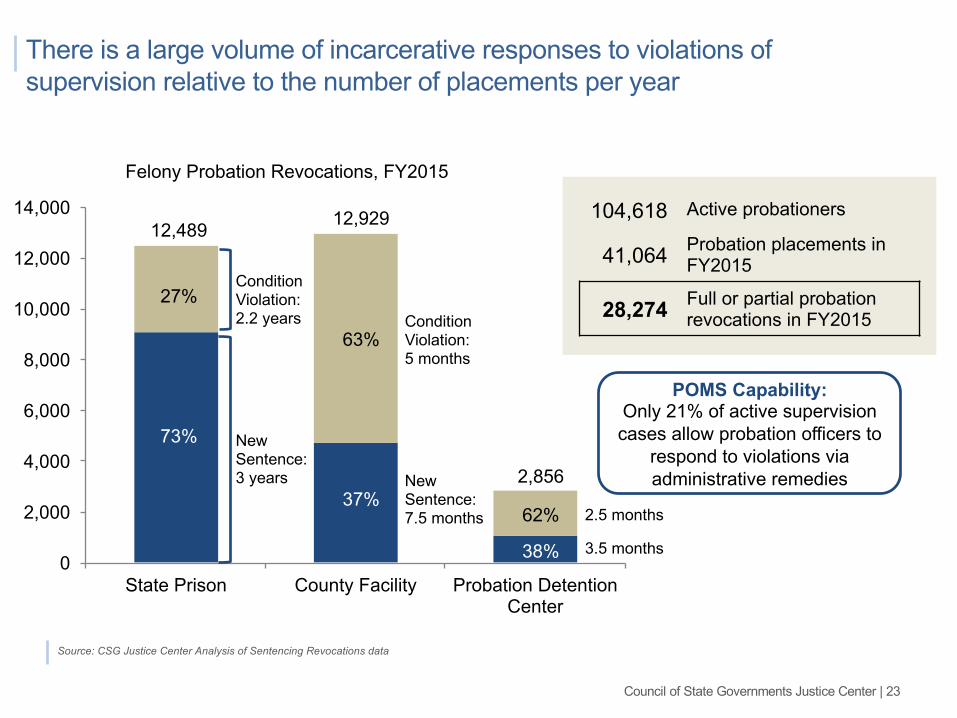
There is a large volume of incarcerative responses to violations of supervision relative to the number of placements per year
Source: CSG Justice Center Analysis of Sentencing Revocations data
0
2,000
4,000
6,000
8,000
10,000
12,000
14,000
State Prison County Facility Probation Detention Center
12,489
2,856
12,929
New Sentence:3 years
Condition Violation:2.2 years
73%
37%
38%
27%
63%
62%
104,618 Active probationers
41,064 Probation placements in FY2015
28,274 Full or partial probation revocations in FY2015
POMS Capability:Only 21% of active supervision cases allow probation officers to
respond to violations via administrative remedies
Felony Probation Revocations, FY2015
New Sentence:7.5 months
Condition Violation:5 months
3.5 months
2.5 months
Council of State Governments Justice Center | 23
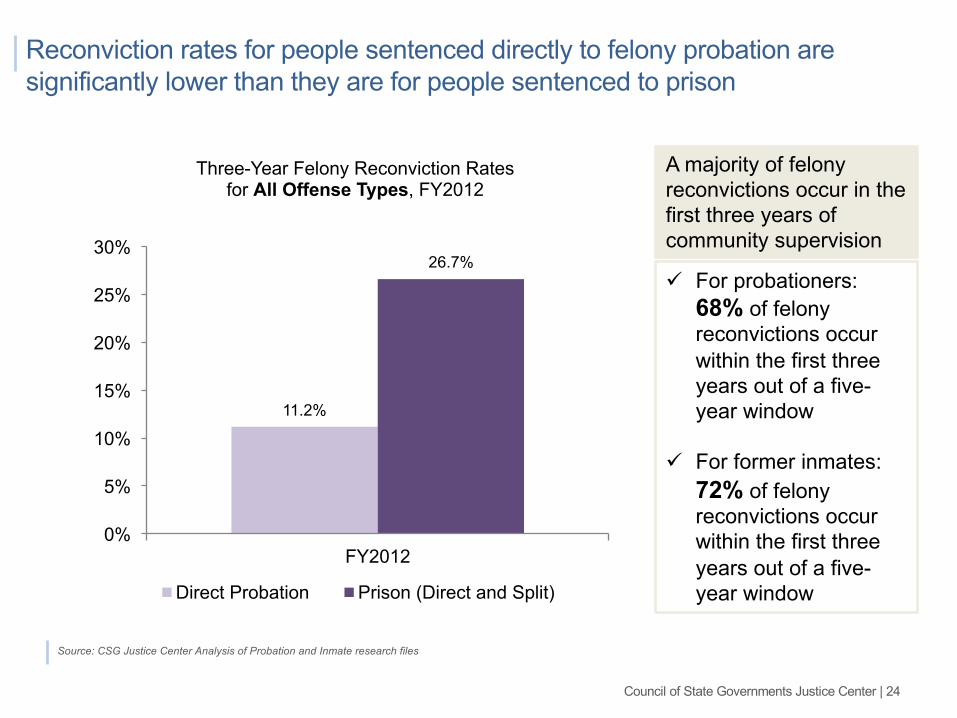
Reconviction rates for people sentenced directly to felony probation are significantly lower than they are for people sentenced to prison
Source: CSG Justice Center Analysis of Probation and Inmate research files
11.2%
26.7%
0%
5%
10%
15%
20%
25%
30%
FY2012
Direct Probation Prison (Direct and Split)
Three-Year Felony Reconviction Ratesfor All Offense Types, FY2012
ü For probationers: 68% of felony reconvictions occur within the first three years out of a five-year window
ü For former inmates: 72% of felony reconvictions occur within the first three years out of a five-year window
A majority of felony reconvictions occur in the first three years of community supervision
Council of State Governments Justice Center | 24
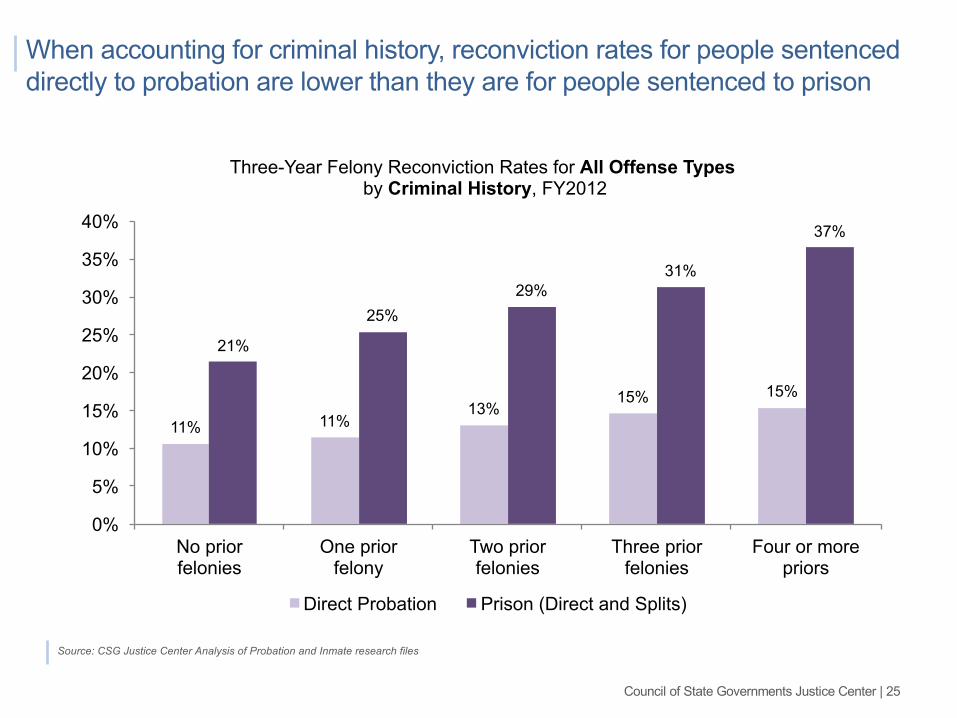
When accounting for criminal history, reconviction rates for people sentenced directly to probation are lower than they are for people sentenced to prison
Source: CSG Justice Center Analysis of Probation and Inmate research files
11% 11%13%
15% 15%
21%
25%29%
31%
37%
0%
5%
10%
15%
20%
25%
30%
35%
40%
No priorfelonies
One priorfelony
Two priorfelonies
Three priorfelonies
Four or morepriors
Direct Probation Prison (Direct and Splits)
Three-Year Felony Reconviction Rates for All Offense Types by Criminal History, FY2012
Council of State Governments Justice Center | 25
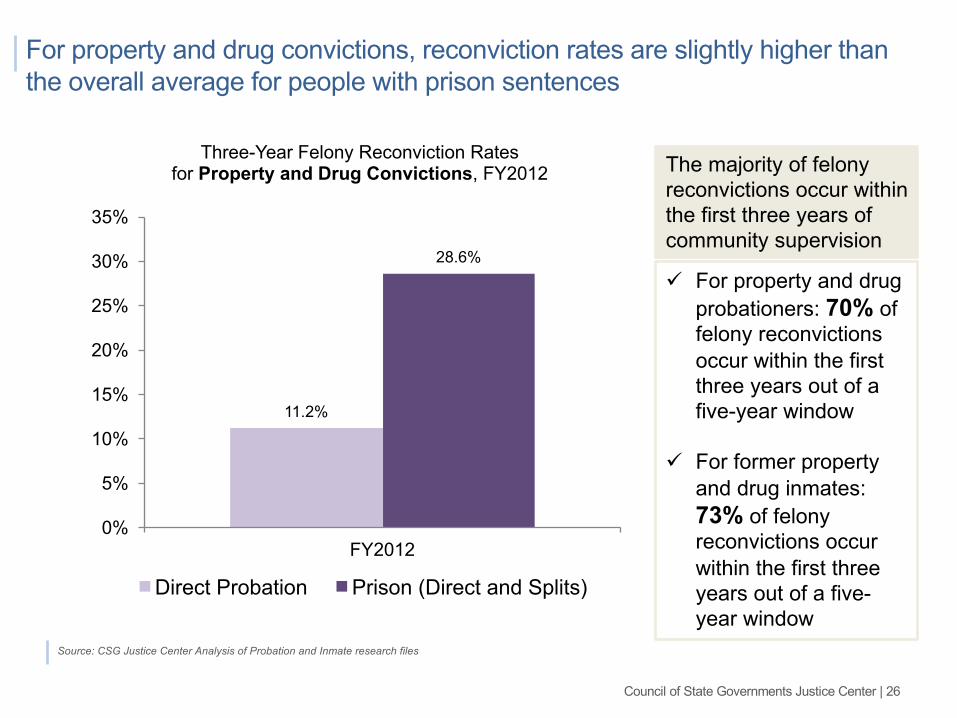
For property and drug convictions, reconviction rates are slightly higher than the overall average for people with prison sentences
Source: CSG Justice Center Analysis of Probation and Inmate research files
11.2%
28.6%
0%
5%
10%
15%
20%
25%
30%
35%
FY2012
Direct Probation Prison (Direct and Splits)
Three-Year Felony Reconviction Rates for Property and Drug Convictions, FY2012
ü For property and drug probationers: 70% of felony reconvictions occur within the first three years out of a five-year window
ü For former property and drug inmates: 73% of felony reconvictions occur within the first three years out of a five-year window
The majority of felony reconvictions occur within the first three years of community supervision
Council of State Governments Justice Center | 26
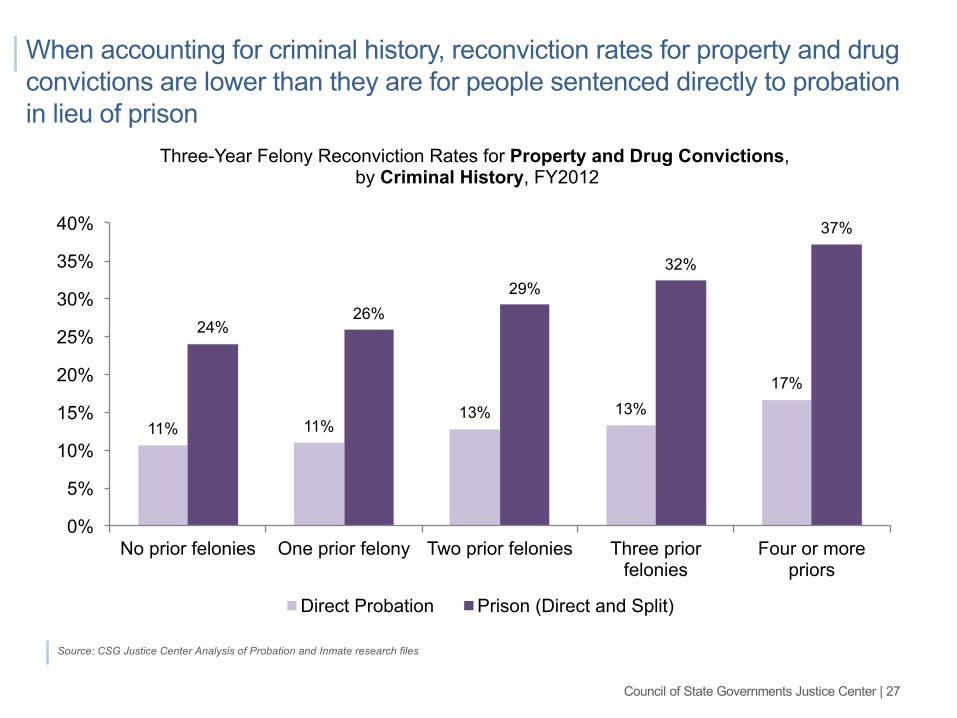
When accounting for criminal history, reconviction rates for property and drug convictions are lower than they are for people sentenced directly to probation in lieu of prison
Source: CSG Justice Center Analysis of Probation and Inmate research files
11% 11%13% 13%
17%
24%26%
29%32%
37%
0%
5%
10%
15%
20%
25%
30%
35%
40%
No prior felonies One prior felony Two prior felonies Three prior felonies
Four or more priors
Direct Probation Prison (Direct and Split)
Three-Year Felony Reconviction Rates for Property and Drug Convictions, by Criminal History, FY2012
Council of State Governments Justice Center | 27
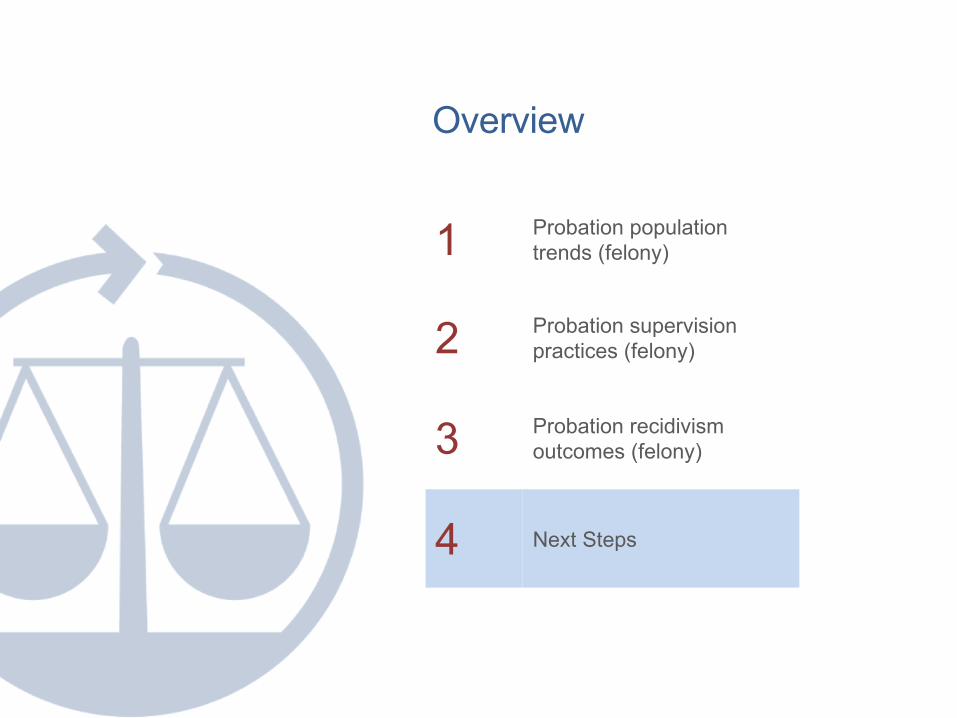
Overview
1 Probation population trends (felony)
2 Probation supervision practices (felony)
3 Probation recidivism outcomes (felony)
4 Next Steps
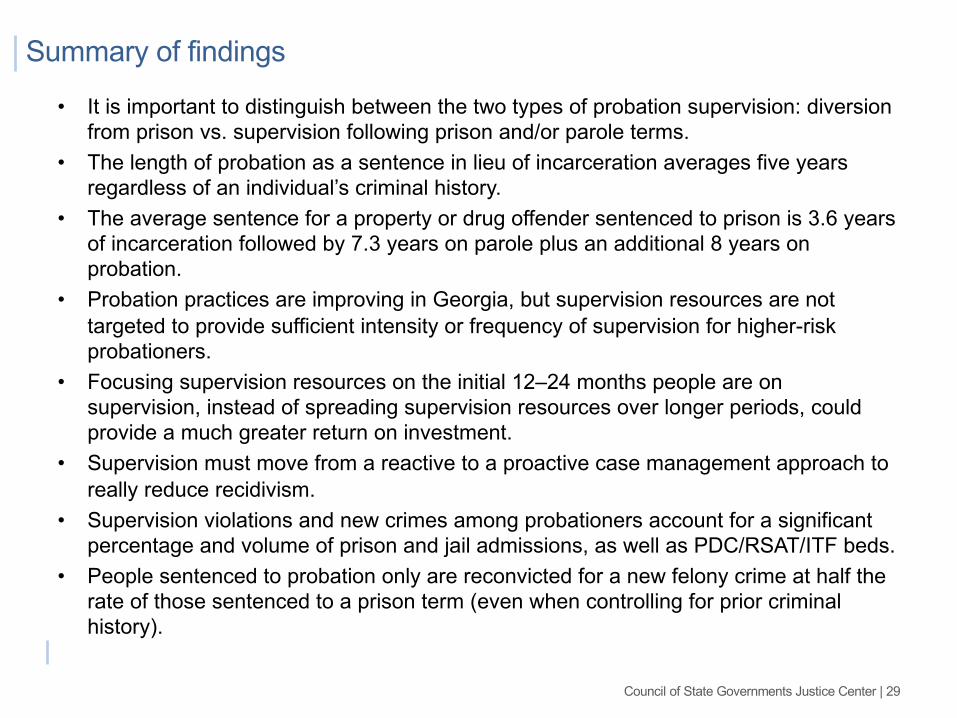
Summary of findings
• It is important to distinguish between the two types of probation supervision: diversion from prison vs. supervision following prison and/or parole terms.
• The length of probation as a sentence in lieu of incarceration averages five years regardless of an individual’s criminal history.
• The average sentence for a property or drug offender sentenced to prison is 3.6 years of incarceration followed by 7.3 years on parole plus an additional 8 years on probation.
• Probation practices are improving in Georgia, but supervision resources are not targeted to provide sufficient intensity or frequency of supervision for higher-risk probationers.
• Focusing supervision resources on the initial 12–24 months people are on supervision, instead of spreading supervision resources over longer periods, could provide a much greater return on investment.
• Supervision must move from a reactive to a proactive case management approach to really reduce recidivism.
• Supervision violations and new crimes among probationers account for a significant percentage and volume of prison and jail admissions, as well as PDC/RSAT/ITF beds.
• People sentenced to probation only are reconvicted for a new felony crime at half the rate of those sentenced to a prison term (even when controlling for prior criminal history).
Council of State Governments Justice Center | 29
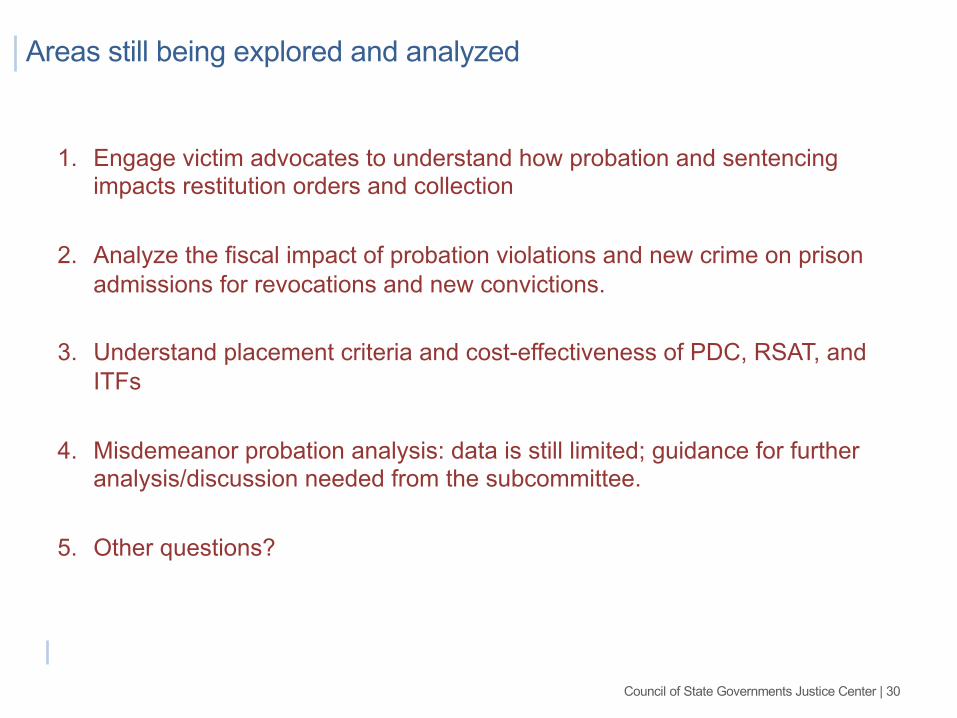
Areas still being explored and analyzed
1. Engage victim advocates to understand how probation and sentencing impacts restitution orders and collection
2. Analyze the fiscal impact of probation violations and new crime on prison admissions for revocations and new convictions.
3. Understand placement criteria and cost-effectiveness of PDC, RSAT, and ITFs
4. Misdemeanor probation analysis: data is still limited; guidance for further analysis/discussion needed from the subcommittee.
5. Other questions?
Council of State Governments Justice Center | 30
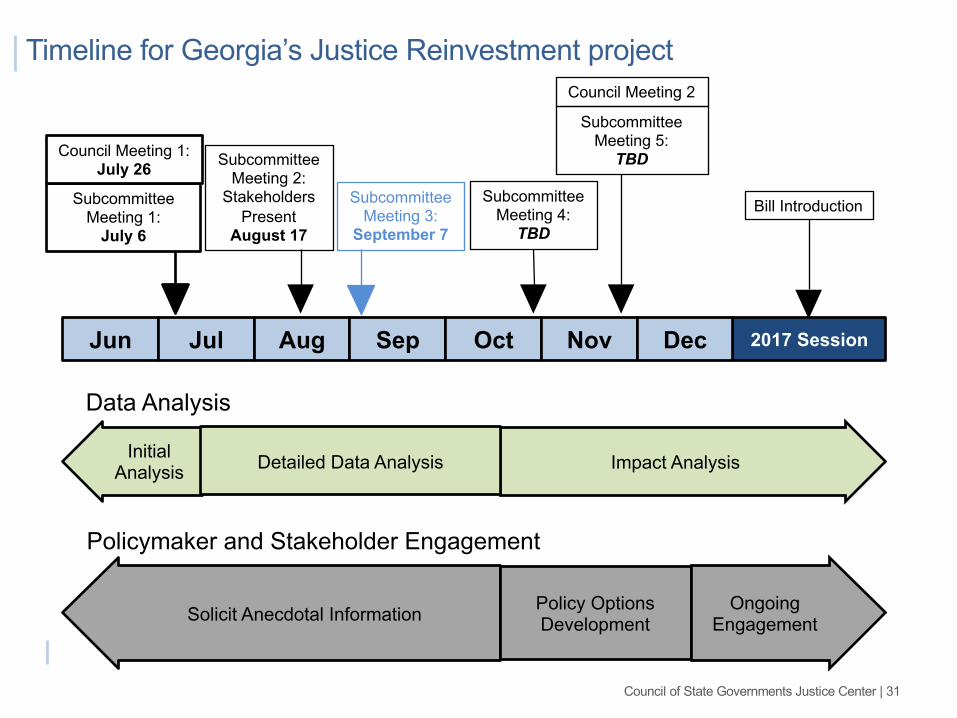
Timeline for Georgia’s Justice Reinvestment project
2017 SessionJun Jul Aug Sep Oct Nov Dec
SubcommitteeMeeting 1:
July 6
Impact Analysis
Data Analysis
InitialAnalysis Detailed Data Analysis
SubcommitteeMeeting 3:
September 7
Subcommittee Meeting 4:
TBD
Subcommittee Meeting 5:
TBD
Policymaker and Stakeholder Engagement
Solicit Anecdotal Information Policy Options Development
OngoingEngagement
Council Meeting 2
Bill Introduction
SubcommitteeMeeting 2:
Stakeholders Present
August 17
Council Meeting 1:July 26
Council of State Governments Justice Center | 31