Embed Size (px)
Citation preview
George R. WiggansAnimal Improvement Programs LaboratoryAgricultural Research Service, USDA, Beltsville, MD
[email protected] 2008
Genetic trends in dairy cattleover the next 25 years …
where are weheaded and howwill we get there
G.R. Wiggans 2008National Breeders Roundtable (2)
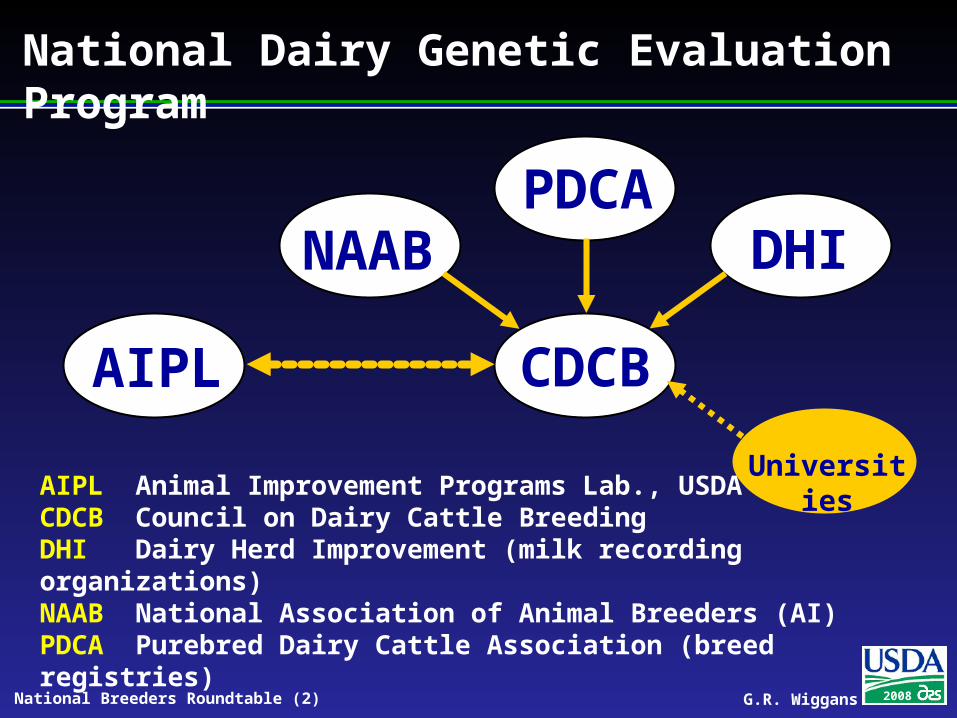
National Dairy Genetic Evaluation Program
AIPL CDCB
NAAB
PDCA DHI
UniversitiesAIPL Animal Improvement Programs Lab., USDA
CDCB Council on Dairy Cattle BreedingDHI Dairy Herd Improvement (milk recording organizations)NAAB National Association of Animal Breeders (AI)PDCA Purebred Dairy Cattle Association (breed registries)
G.R. Wiggans 2008National Breeders Roundtable (3)
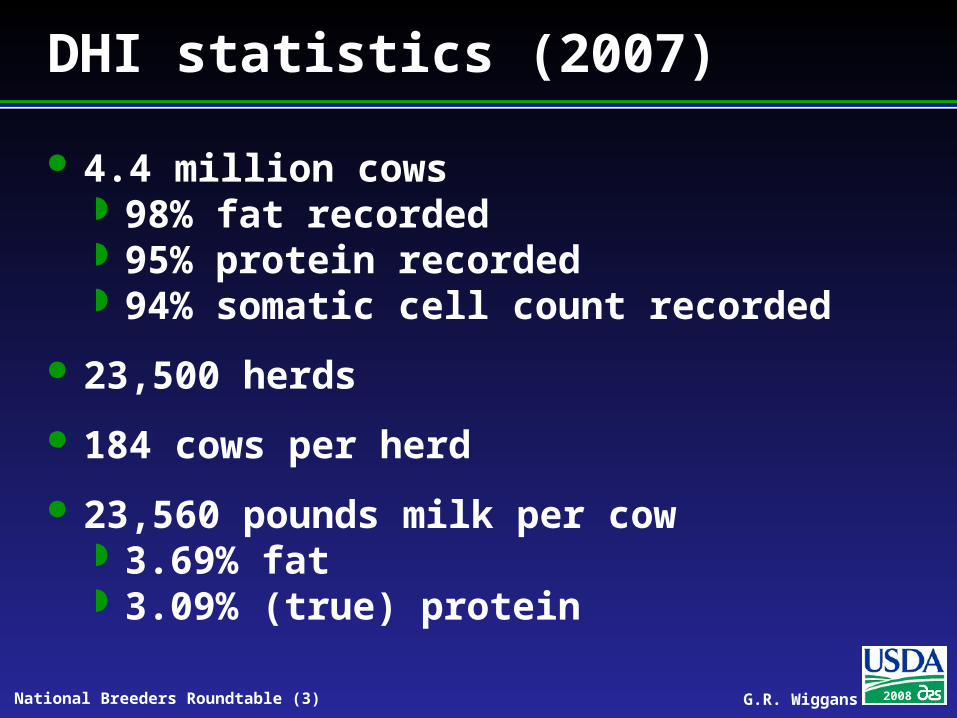
DHI statistics (2007)
4.4 million cows 98% fat recorded 95% protein recorded 94% somatic cell count recorded
23,500 herds
184 cows per herd
23,560 pounds milk per cow 3.69% fat 3.09% (true) protein
G.R. Wiggans 2008National Breeders Roundtable (4)
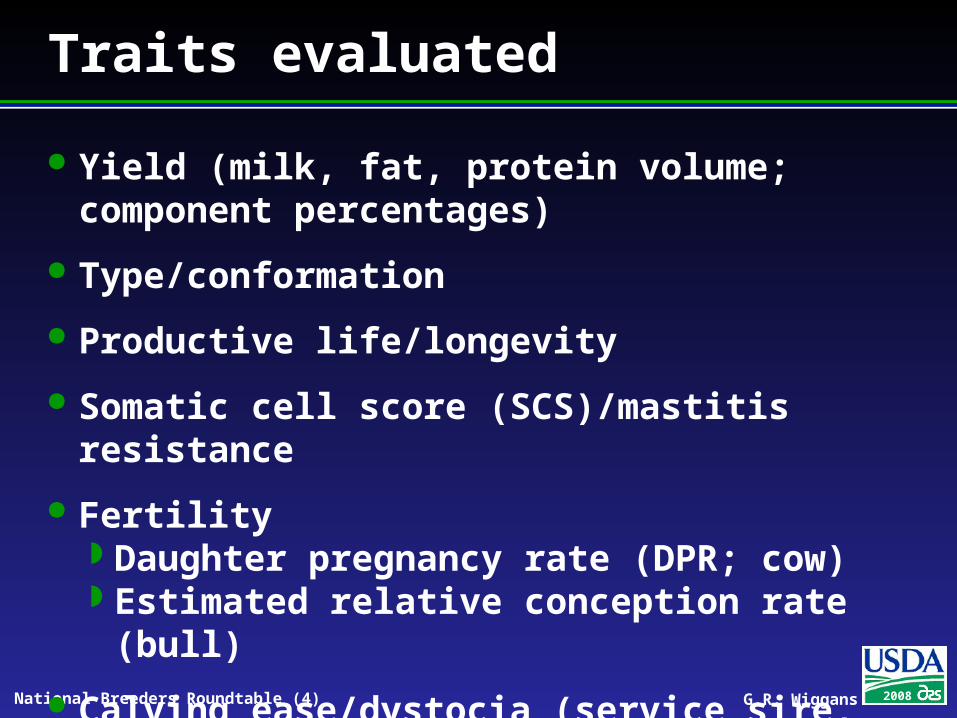
Traits evaluated
Yield (milk, fat, protein volume; component percentages)
Type/conformation
Productive life/longevity
Somatic cell score (SCS)/mastitis resistance
Fertility Daughter pregnancy rate (DPR; cow) Estimated relative conception rate (bull)
Calving ease/dystocia (service sire, daughter)
G.R. Wiggans 2008National Breeders Roundtable (5)
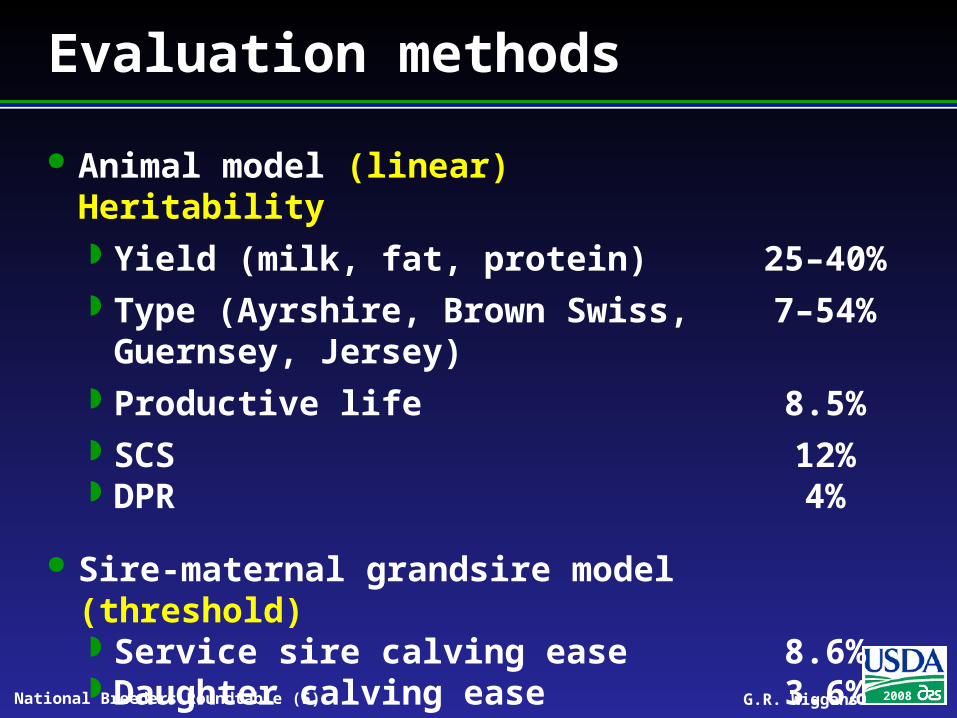
Evaluation methods
Animal model (linear) Heritability Yield (milk, fat, protein) 25–40% Type (Ayrshire, Brown Swiss, 7–54%Guernsey, Jersey)
Productive life 8.5% SCS 12% DPR 4%
Sire-maternal grandsire model (threshold) Service sire calving ease 8.6% Daughter calving ease 3.6%
G.R. Wiggans 2008National Breeders Roundtable (6)
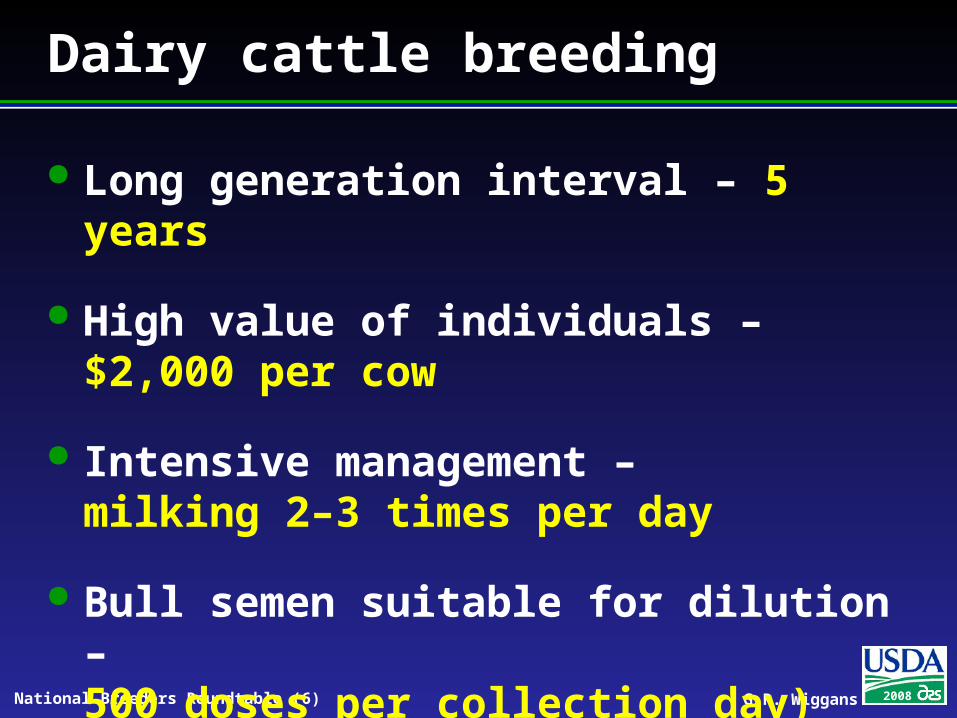
Dairy cattle breeding
Long generation interval – 5 years
High value of individuals –$2,000 per cow
Intensive management –milking 2–3 times per day
Bull semen suitable for dilution –500 doses per collection day)
G.R. Wiggans 2008National Breeders Roundtable (7)
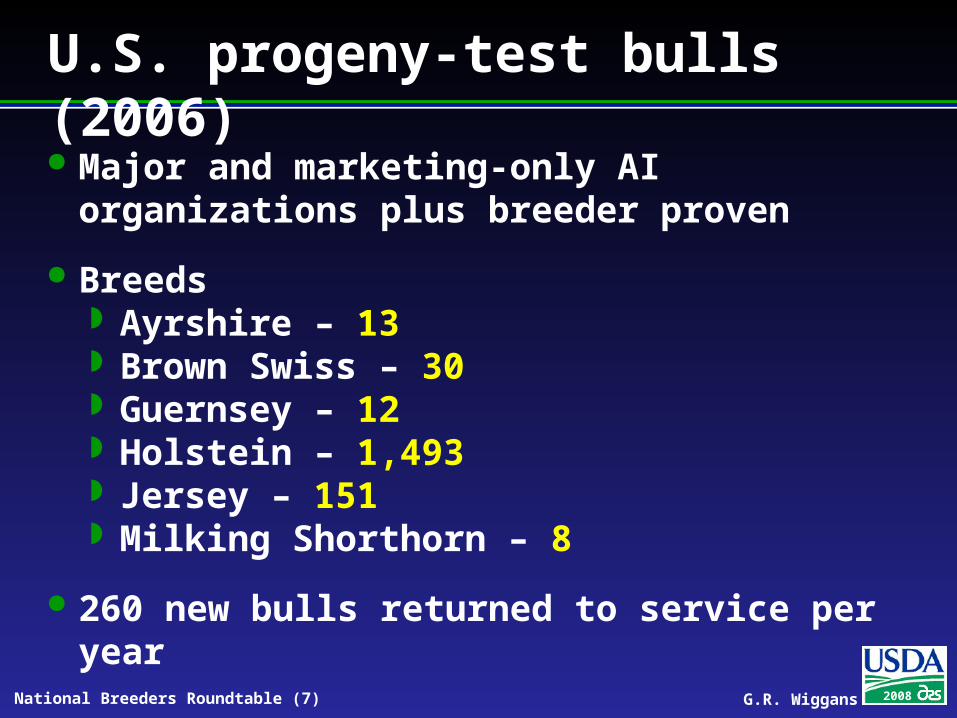
U.S. progeny-test bulls (2006) Major and marketing-only AI
organizations plus breeder proven
Breeds Ayrshire – 13 Brown Swiss – 30 Guernsey – 12 Holstein – 1,493 Jersey – 151 Milking Shorthorn – 8
260 new bulls returned to service per year
G.R. Wiggans 2008National Breeders Roundtable (8)
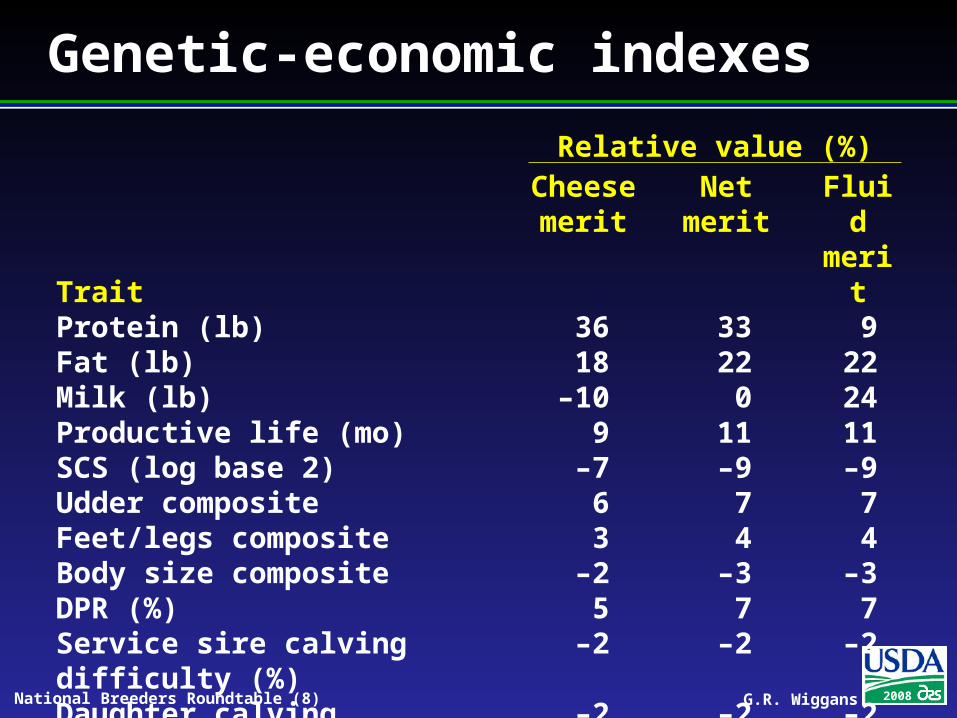
Genetic-economic indexes
Trait
Relative value (%)Chees
e merit
Netmerit
Fluid meri
tProtein (lb) 36 33 9Fat (lb) 18 22 22Milk (lb) –10 0 24Productive life (mo) 9 11 11SCS (log base 2) –7 –9 –9Udder composite 6 7 7Feet/legs composite 3 4 4Body size composite –2 –3 –3DPR (%) 5 7 7Service sire calving difficulty (%)
–2 –2 –2
Daughter calving difficulty (%)
–2 –2 –2
G.R. Wiggans 2008National Breeders Roundtable (9)
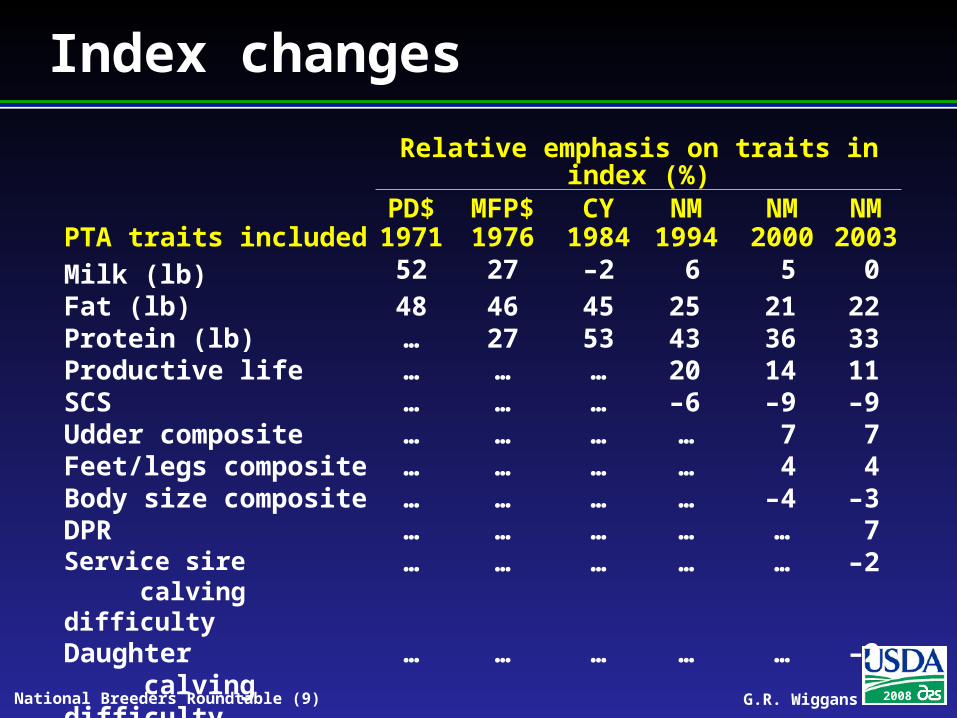
Index changes
PTA traits included
Relative emphasis on traits in index (%)
PD$1971
MFP$1976
CY1984
NM1994
NM2000
NM2003
Milk (lb) 52 27 –2 6 5 0Fat (lb) 48 46 45 25 21 22Protein (lb) … 27 53 43 36 33Productive life … … … 20 14 11SCS … … … –6 –9 –9Udder composite … … … … 7 7Feet/legs composite … … … … 4 4Body size composite … … … … –4 –3DPR … … … … … 7Service sire calving difficulty
… … … … … –2
Daughter calving difficulty
… … … … … –2
G.R. Wiggans 2008National Breeders Roundtable (10)
International reach
Semen and embryos marketed internationally
Interbull Evaluation Centre (Sweden) ranks all bulls for each participating country
Correlations between countries of <1 accommodated
Some foreign bulls used as sires of sons
U.S. and Canadian semen used widely in South America
Red breeds more popular in Europe than in North America
G.R. Wiggans 2008National Breeders Roundtable (11)
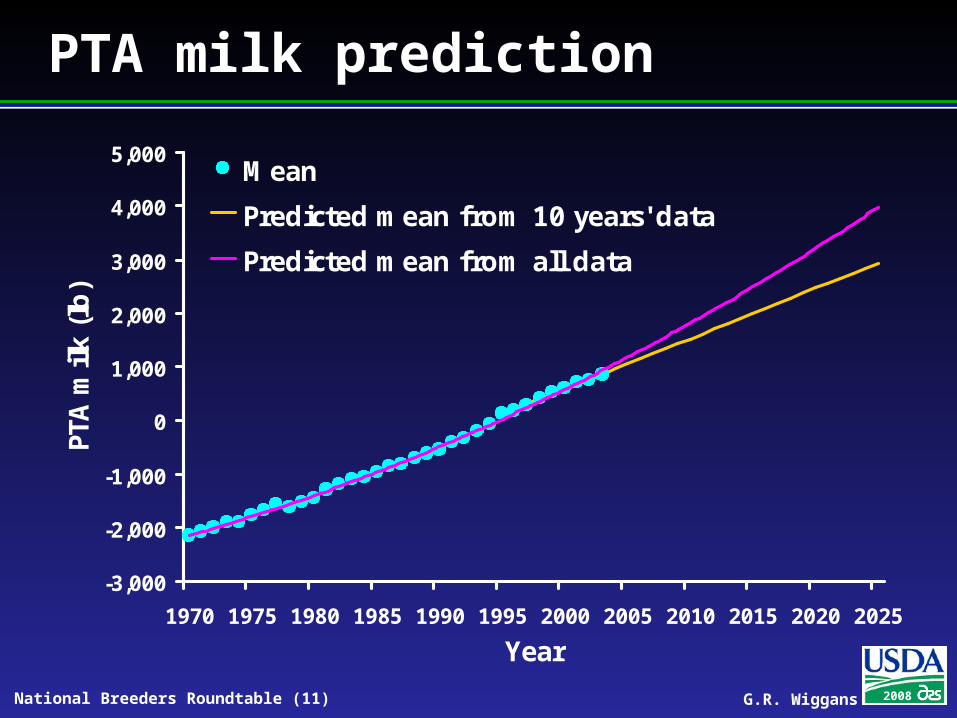
PTA milk prediction
-3,000
-2,000
-1,000
0
1,000
2,000
3,000
4,000
5,000
1970 1975 1980 1985 1990 1995 2000 2005 2010 2015 2020 2025
Year
PTA m
ilk
(lb)
Mean
Predicted mean from 10 years' data
Predicted mean from all data
G.R. Wiggans 2008National Breeders Roundtable (12)
-600
-400
-200
0
200
400
600
800
1,000
1970 1975 1980 1985 1990 1995 2000 2005 2010 2015 2020 2025
Year
Net
mer
it ($)
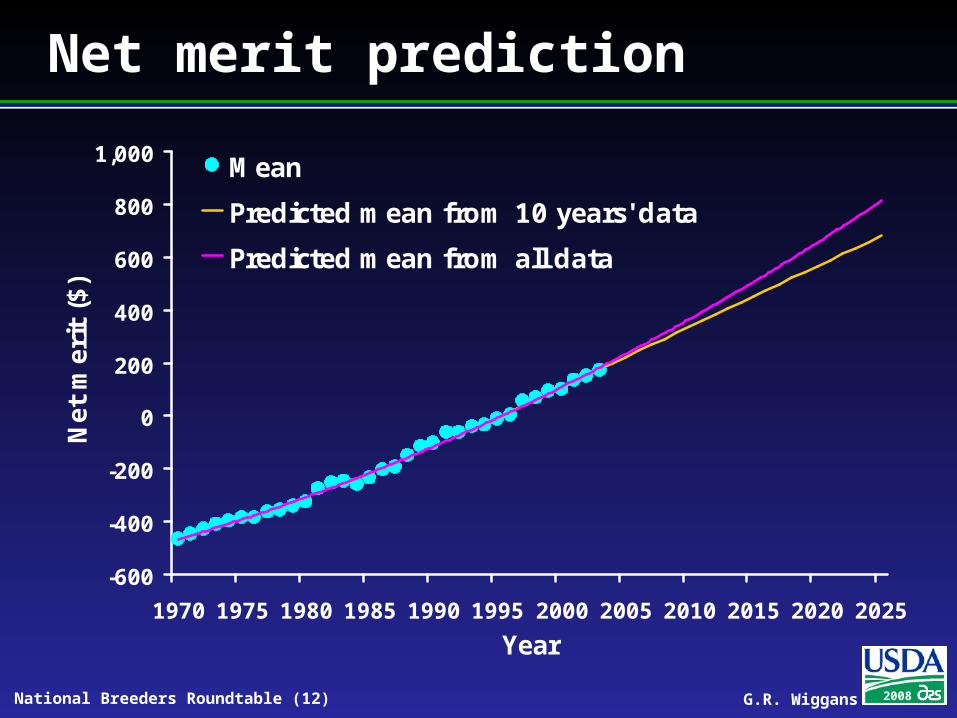
Mean
Predicted mean from 10 years' data
Predicted mean from all data
Net merit prediction
G.R. Wiggans 2008National Breeders Roundtable (13)
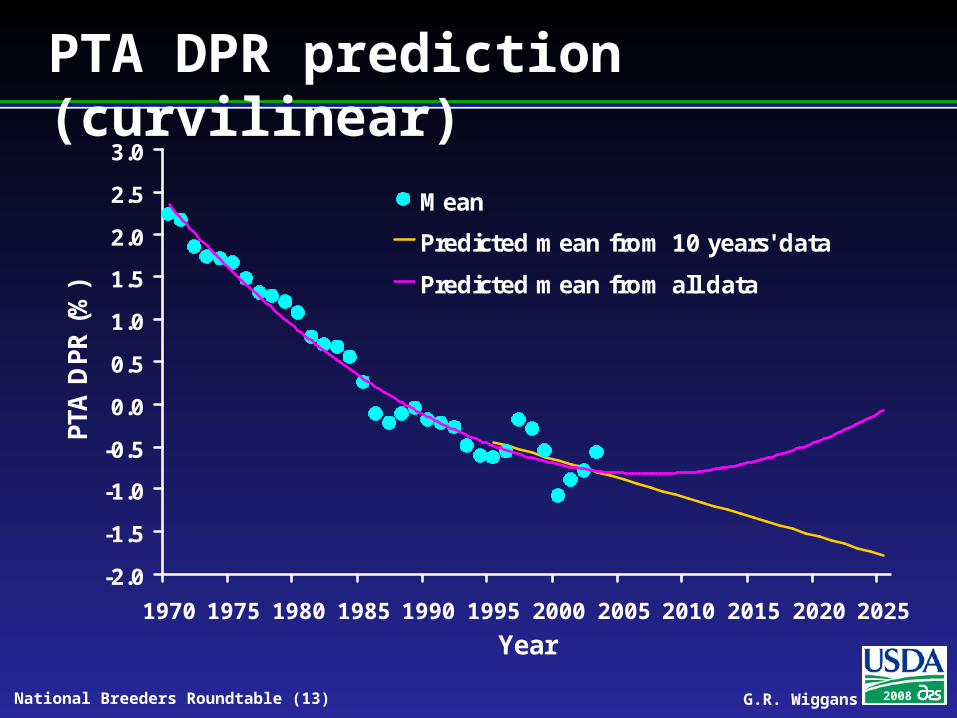
PTA DPR prediction (curvilinear)
-2.0
-1.5
-1.0
-0.5
0.0
0.5
1.0
1.5
2.0
2.5
3.0
1970 1975 1980 1985 1990 1995 2000 2005 2010 2015 2020 2025
Year
PTA D
PR (%
)
Mean
Predicted mean from 10 years' data
Predicted mean from all data
G.R. Wiggans 2008National Breeders Roundtable (14)
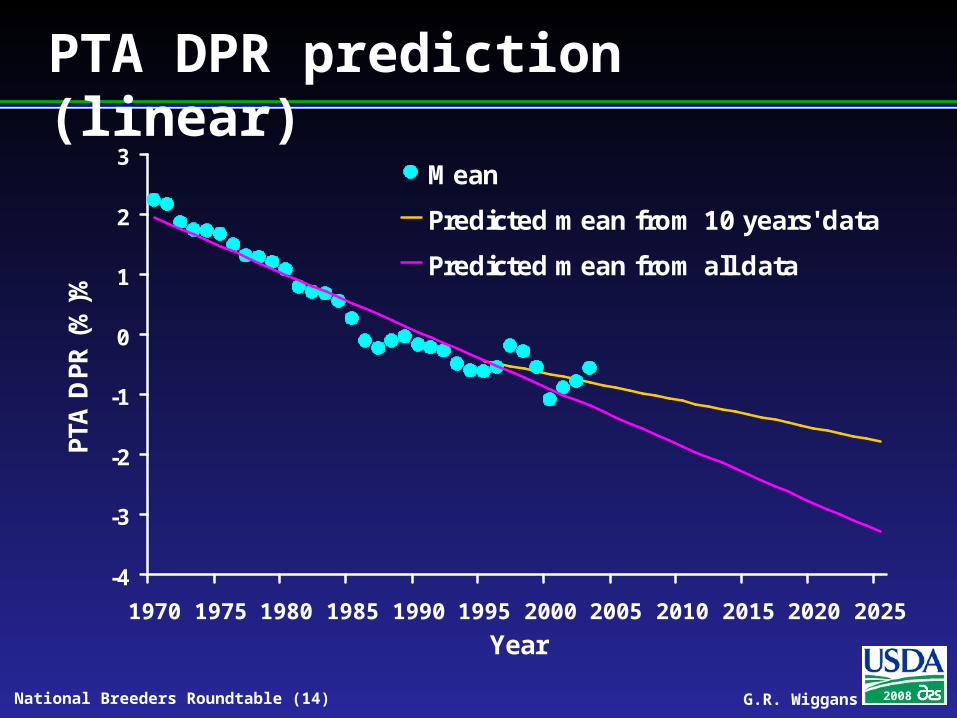
PTA DPR prediction (linear)
-4
-3
-2
-1
0
1
2
3
1970 1975 1980 1985 1990 1995 2000 2005 2010 2015 2020 2025
Year
PTA D
PR (%
)%
Mean
Predicted mean from 10 years' data
Predicted mean from all data
G.R. Wiggans 2008National Breeders Roundtable (15)
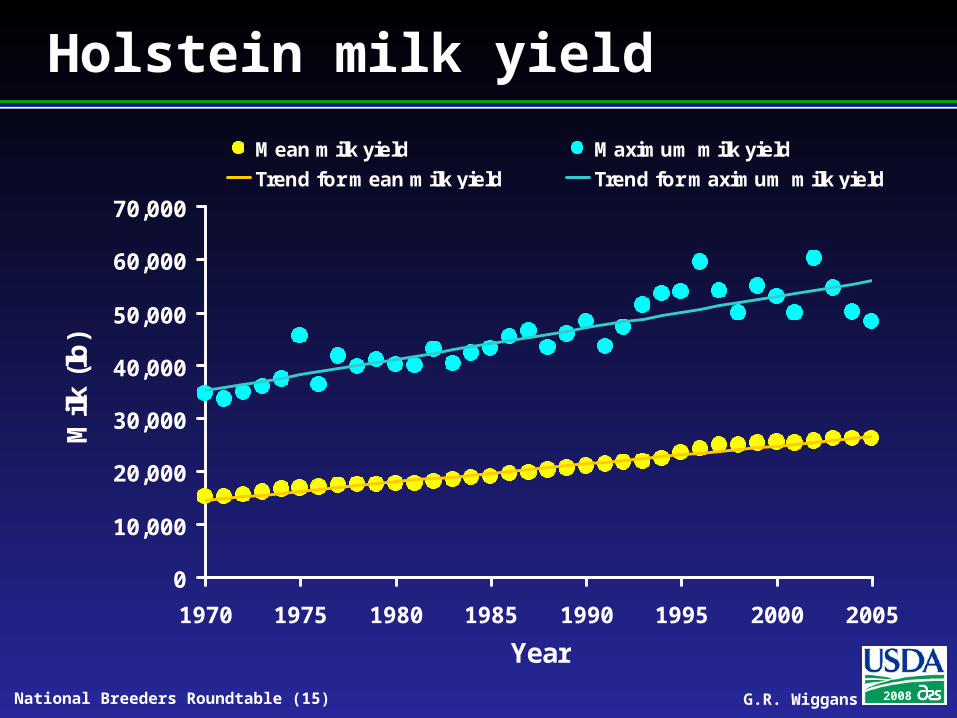
Holstein milk yield
0
10,000
20,000
30,000
40,000
50,000
60,000
70,000
1970 1975 1980 1985 1990 1995 2000 2005
Year
Milk
(lb
)
Mean milk yield Maximum milk yield
Trend for mean milk yield Trend for maximum milk yield
G.R. Wiggans 2008National Breeders Roundtable (16)
Goals beyond increased yield Improve fertility
Increase herdlife
Improve disease resistance
Reduce calving difficulty
Improve efficiency
G.R. Wiggans 2008National Breeders Roundtable (17)
Options for increasing progress Crossbreeding
Increased selection intensity
Adoption of new technologies
G.R. Wiggans 2008National Breeders Roundtable (18)
Crossbreds
Increasing interest
Way to increase fertility
Scandinavian Red breeds proposed
Hybrid vigor observed
G.R. Wiggans 2008National Breeders Roundtable (19)
All-breed animal model
Purebreds and crossbreds together
Unknown parents grouped by breed
Variance adjustments by breed
Age adjusted to 36 months, not maturity
G.R. Wiggans 2008National Breeders Roundtable (20)
Genomics
Genotype calves
Calculate genomic evaluation
Select intensively
Reduce cost of finding top bulls
Increase rate of genetic progress
G.R. Wiggans 2008National Breeders Roundtable (21)
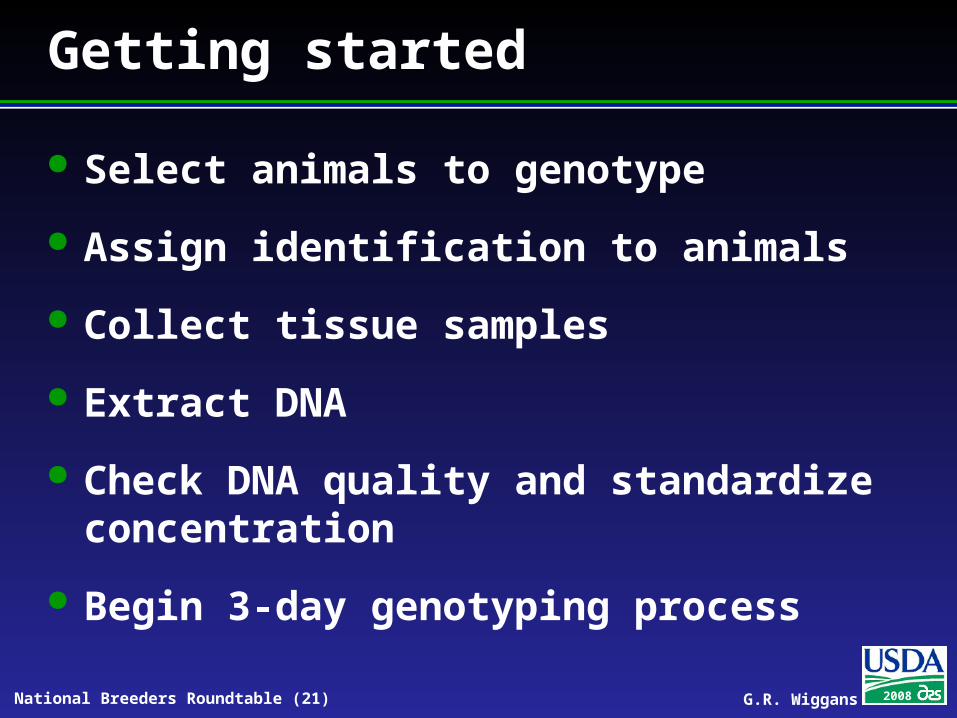
Getting started
Select animals to genotype
Assign identification to animals
Collect tissue samples
Extract DNA
Check DNA quality and standardize concentration
Begin 3-day genotyping process
G.R. Wiggans 2008National Breeders Roundtable (22)
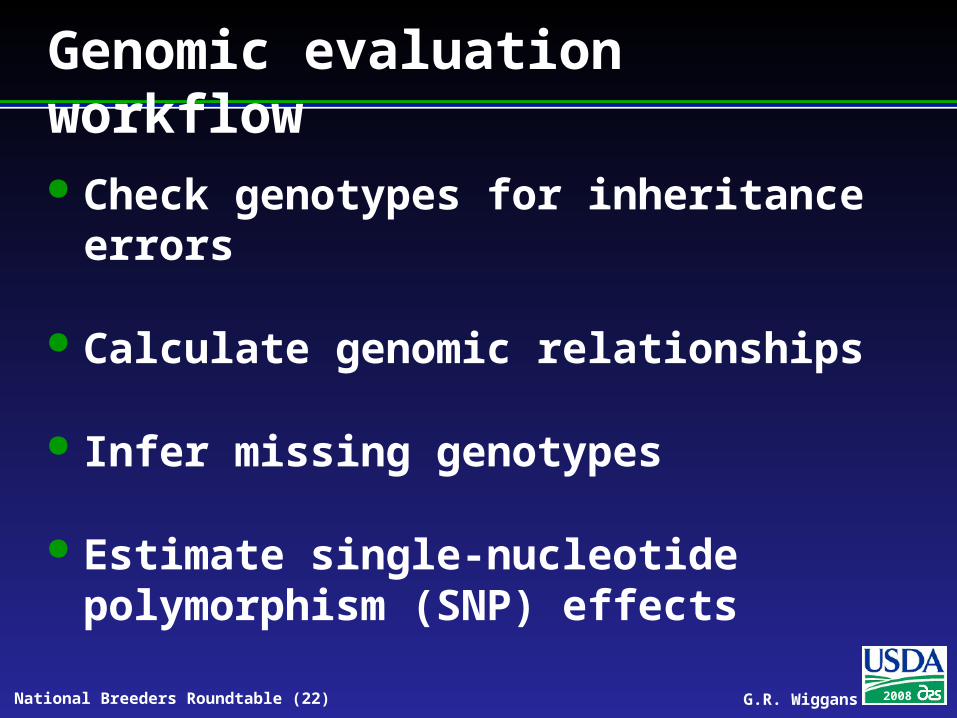
Genomic evaluation workflow Check genotypes for inheritance
errors
Calculate genomic relationships
Infer missing genotypes
Estimate single-nucleotide polymorphism (SNP) effects
G.R. Wiggans 2008National Breeders Roundtable (23)
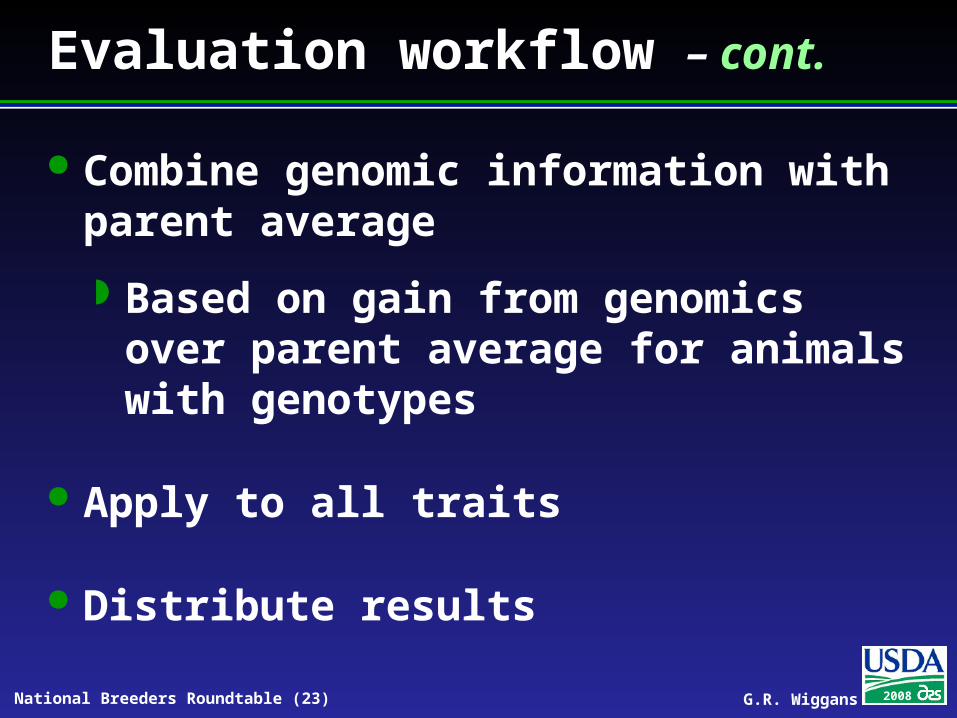
Evaluation workflow – cont.
Combine genomic information with parent average
Based on gain from genomics over parent average for animals with genotypes
Apply to all traits
Distribute results
G.R. Wiggans 2008National Breeders Roundtable (24)
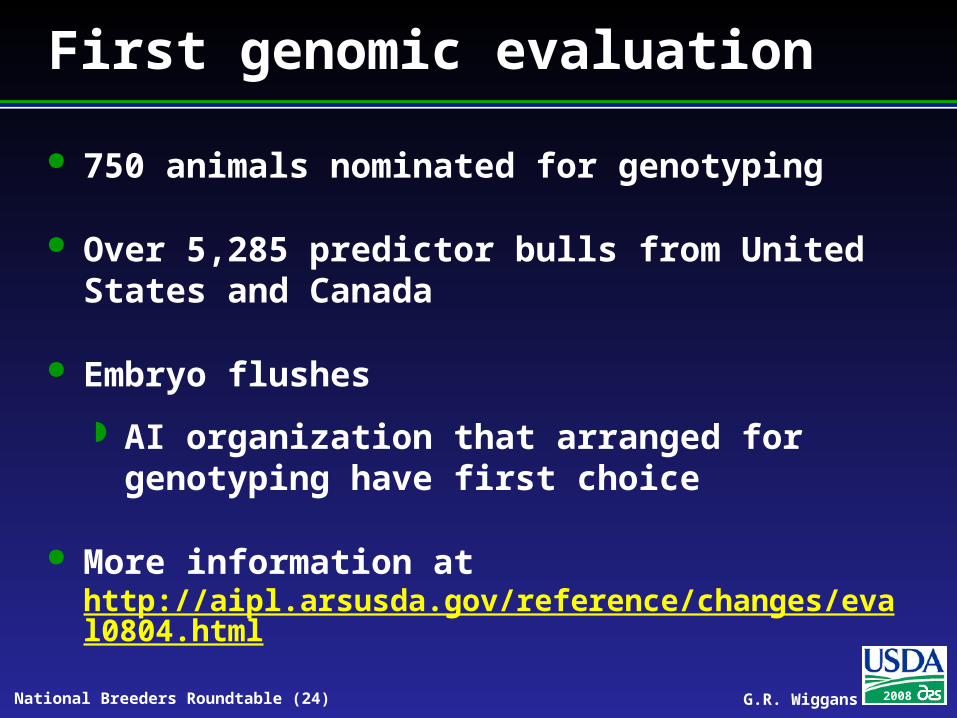
First genomic evaluation
750 animals nominated for genotyping
Over 5,285 predictor bulls from United States and Canada
Embryo flushes
AI organization that arranged for genotyping have first choice
More information at http://aipl.arsusda.gov/reference/changes/eval0804.html
G.R. Wiggans 2008National Breeders Roundtable (25)
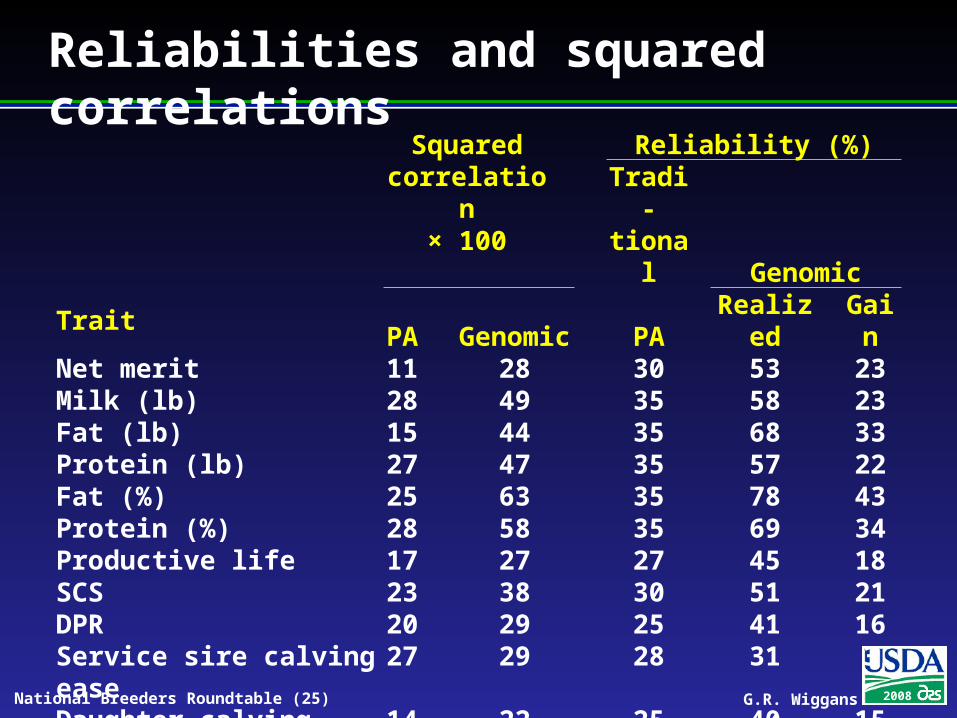
Reliabilities and squared correlations
Squared correlation
× 100
Reliability (%)Tradi
-tiona
l Genomic
TraitPA
Genomic PA
Realized
Gain
Net merit 11 28 30 53 23Milk (lb) 28 49 35 58 23Fat (lb) 15 44 35 68 33Protein (lb) 27 47 35 57 22Fat (%) 25 63 35 78 43Protein (%) 28 58 35 69 34Productive life 17 27 27 45 18SCS 23 38 30 51 21DPR 20 29 25 41 16Service sire calving ease
27 29 28 31 3
Daughter calving ease
14 22 25 40 15
Final score 23 36 24 42 18
G.R. Wiggans 2008National Breeders Roundtable (26)
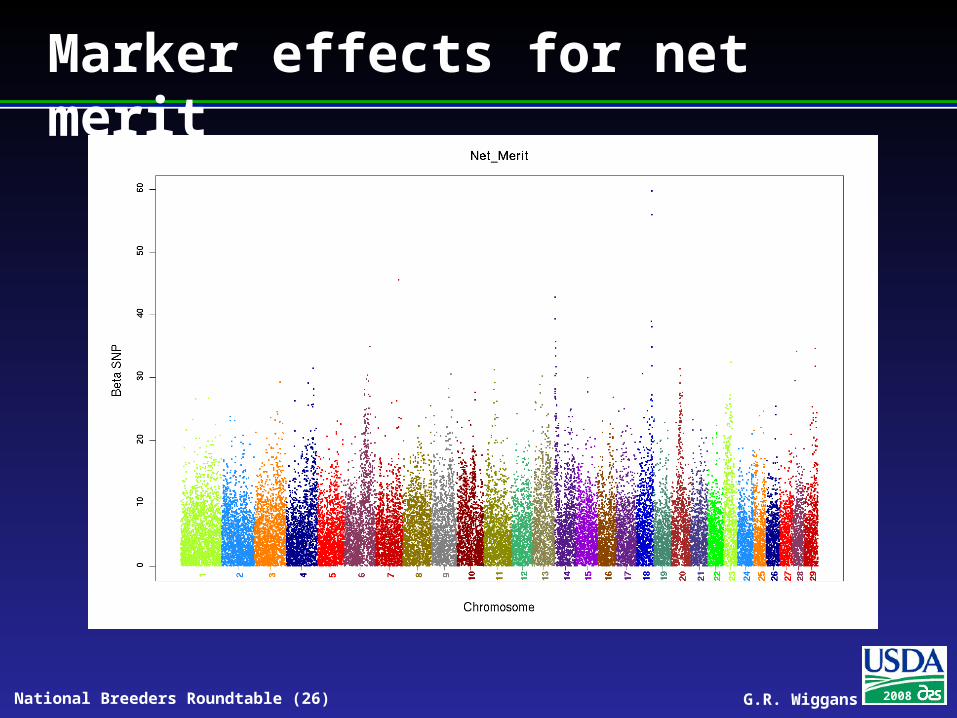
Marker effects for net merit
G.R. Wiggans 2008National Breeders Roundtable (27)
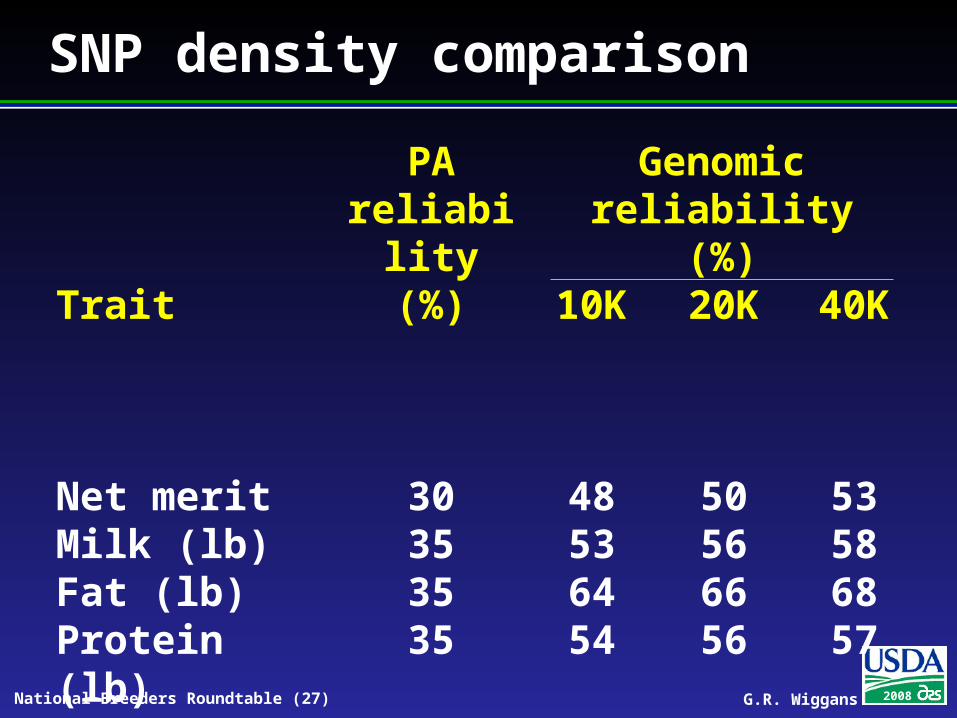
SNP density comparison
PA reliability (%)
Genomic reliability (%)
Trait 10K
20K 40K
Net merit 30 48 50 53Milk (lb) 35 53 56 58Fat (lb) 35 64 66 68Protein (lb) 35 54 56 57Productive life
27 38 41 45
SCS 30 45 47 51DPR 25 37 39 41
G.R. Wiggans 2008National Breeders Roundtable (28)
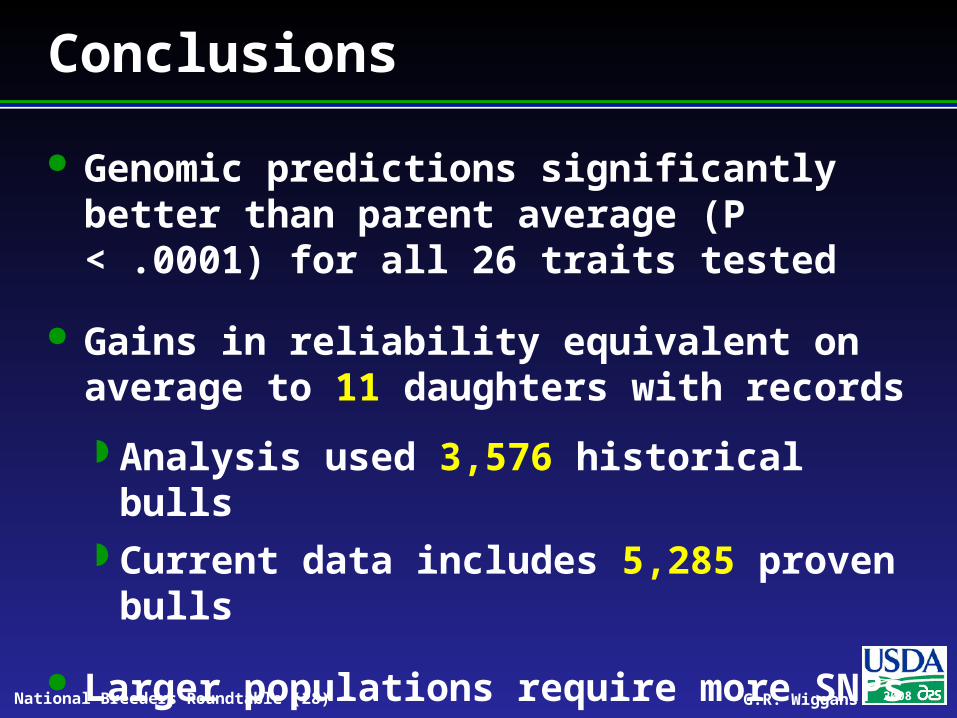
Conclusions
Genomic predictions significantly better than parent average (P < .0001) for all 26 traits tested
Gains in reliability equivalent on average to 11 daughters with records
Analysis used 3,576 historical bulls Current data includes 5,285 proven bulls
Larger populations require more SNPs
G.R. Wiggans 2008National Breeders Roundtable (29)
Current status
Field test results distributed for 750 nominated animals
Extension to Jersey and Brown Swiss in progress
Transition to commercial genotyping labs
Extension to cows planned for June
G.R. Wiggans 2008National Breeders Roundtable (30)
SNP project outcomes
Genome-wide selection
Parentage verification and traceability panels
Enhanced mapping for quantitative trait loci and gene discovery
G.R. Wiggans 2008National Breeders Roundtable (31)
Future plans
Evaluations of animals not genotyped updated using genomic information (3 times per year)
Genomic evaluations calculated and released more frequently (monthly? weekly?)
Bull evaluations made public when bull enrolled with NAAB
Cow evaluations made public immediately at USDA web site
January 2009 target for public release
G.R. Wiggans 2008National Breeders Roundtable (32)
Genomic selection (New Zealand) Identify top 30,000 bull calves
annually based on parent average
Genotype by 6 days old with 768 SNP
Genotype top 500 bull calves with 50K SNP chip
Keep top 100 bull calves
G.R. Wiggans 2008National Breeders Roundtable (33)
Genomic selection (NZ) – cont. At 1 year, limited progeny test to
check for undesirable recessives
At 2 years, market as part of DNA team
When progeny tested, graduate best to progeny-proven team
G.R. Wiggans 2008National Breeders Roundtable (34)
Research topics
Differential inclusion of X-chromosome effects to predict bulls versus cows
Contribution of cows to accuracy of genomic prediction
Benefit of genotyping more predictor bulls
Optimum methods for combining genomic and current evaluation
G.R. Wiggans 2008National Breeders Roundtable (35)
Research topics – cont.
Practicality of screening and parentage verification with low-cost, low-SNP number assay
Potential of freely sharing enough SNP for accurate parentage discovery
Computational methods to improve accuracy, such as haplotyping
G.R. Wiggans 2008National Breeders Roundtable (36)
Summary
Genomic prediction has great promise
Extensive changes in bull acquisition and marketing and in cow selection expected
Routine genotyping and validation will become industry rather than research responsibilities
G.R. Wiggans 2008National Breeders Roundtable (37)
Where do we go from here
Economic indexes adjusted as conditions change
Traits added as their collection becomes feasible and value demonstrated
Dairies increase in size and technological sophistication
Selection adapts the cow to meet human needs
G.R. Wiggans 2008National Breeders Roundtable (38)
Senior research staff