Embed Size (px)
Citation preview
George Pearl Hall Environmental
Assessment and Building Life Cycle Energy Audit
Norion M. Ubechel SAAP UNM
Fall 2008 Independent Study:
Professor W. Fleming

2
This Page Intentionally Left Blank
3
George Pearl Hall Environmental Assessment and Building Life Cycle Energy Audit.
Norion M. Ubechel
University of New Mexico School of Architecture and Planning 2401 Central Ave NE - MSC04 2530
1 - University of New Mexico Albuquerque, NM 87131-0001
ABSTRACT
Modern building energy/resource use modeling methods such as DOE2 and
EQUEST and do not use site specific data. Often, these models do not measure associated environmental impacts of energy waste streams. This assessment incorporates real-time/site-specific data to generate a baseline ecological footprint estimate for the energy and resource use of George Pearl Hall at the University of New Mexico.
This study is the first phase of a larger in-depth analysis into architectural environmental impact modeling. Drawing from the mythology outlined by Mathis Wackernagel and William Rees for calculating ecological footprints (1997) this baseline study utilizes the components of a Carbon Footprint Model to assess the environmental costs associated with George Pearl Hall, the home of the School of Architecture and Planning at the University of New Mexico in Albuquerque. The need to assess and understand the true costs of the built environment in terms of environmental degradation and impact is paramount. The Carbon Footprint Model (CFM) is an integral aspect of an Ecological Footprint Analysis (EFA), a well know environmental modeling methodology, and expresses anthropogenic induced environmental impacts as measured in terms of global warming gasses; carbon dioxide CO2 in particular.

4
Acknowledgements The author thanks William Fleming, Larry Shruster, Predock Architects, John Anderson Architects, and the UNM School of Architecture and Planning for providing data and resources for this report.
5
Contents 1. Introduction…………………………………………………………………… ……8
1.1. Architecture and the Environment … ….…………………………... …10
1.2. George Pearl Hall…………….……………………………………… …10
1.3. Ecological Footprints………....…………………....................................11
1.4. UNM Facilities…………………………………………………………..12
2. Methodology and Results
2.1 Material Costs ………………………………………...............................13
2.2 Heating Cooling and Electricity…………………………….....................14
2.3 Energy Parameters………………………….............................................15
2.4 Electricity Parameters…………………...………………………….........16
2.5 Natural Gas Parameters…………………………………………………..18
3. Results and Conclusions…………………………………………………………...20
4. Calculations………………………………………………………………………...24
5. Refrences…………………………………………………………………………..30

6
Executive Summary This analysis has shown that George Pearl Hall has a substantial yearly carbon deficit exceeding 3.5 million pounds of the green house gas carbon dioxide. The corresponding yearly carbon footprint deficit for this emission quantity totals 1,531 acres of New Mexican forests and grassland or 864 acres of global average forestlands. Carbon dioxide emissions from the concrete used in the building of the structure has been found to exceed 3 million pounds and have a corresponding carbon footprint of 932 global acres of average forest lands.

7
Acronyms and Abbreviations BTU : British Thermal Unit CCF: Cubic Hundred Feet (Natural Gas) CFM: Carbon Footprint Model CO2: Carbon Dioxide EFM: Ecological Footprint Model Gha: Global Hectare GPH: George Pearl Hall GDP: Gross Domestic Product kWH: Kilowatt Hour RPI: Retail Prices Index UNM: University of New Mexico SNL: Sandia National Labs IPCC: Intergovernmental Panel on Climate Change
8
1. Introduction
Today, mankind is facing a global epidemic: that the finite resources of the
Earth’s biosphere cannot meet the exceeding demands of material consumption
engendered by the human economy. When looking retrospectively over the last century,
we see that our current trends are merely a continuation of old habits. The expansion of
global economic activity, which, when measured by Gross World Product, is steadily
growing between two and four percent per year. Population rates have substantially
increased since 1800 from 1 billion people, to 6 billion in 1999, and nearly 7 billion in
2006. Further, along with economic escalation and insurmountable population growth
rates, there has been a substantial increase in per capita energy and material consumption
in both developed and developing nations alike. This expedited resource consumption has
raised the material standards in industrialized nations, and is at the same time, severely
degrading water, soil, forests, air, and the general biodiversity of the Earth. It is estimated
that human demand already exceeds the long-term carrying capacity of the planet by 20
percent or more (Rees, Wackernagel 1996). The trend of limitless growth that our human
economy is relishing in has created a pattern of consumption exceeding the regenerative
capacity of the Earth’s biosphere. If we cannot reach equilibrium in our interaction with
the Earth’s natural systems, the resource capacity of the Earth will become exhausted and
our civilization will face collapse.
In wake of such insuperable conditions caused by the conventional approach to
development, it is critical that we assess our impact on the biosphere. The Ecological
Footprint Model (EFM) enables us to quantitatively measure our impact on the
environment and to identify major sources of biospheric degradation. This model deals
only with demands, direct and indirect, placed on the environment, and does not include
any social or economic elements of sustainability. However, the use of biologically
productive area as a collective unit allows the EFM to generate powerful means for
gauging and communicating both regional and local environmental impacts and for
analyzing current degrees of industrial sustainability. In this perspective, the EFM is not
only a means of assessing environmental impact, but is a tool comparable to other
economic state indicator models such as the Gross Domestic Product (GDP), and the
9
Retail Prices Index (RPI) (Lewan and Simmons 2001) as well as other environmental
modeling approaches such as Life Cycle Assessments.
Sustainability is best described as the characteristic of being able to coexist with
another system indefinitely, without either system being damaged. In this view, a
sustainable society can meet its needs by using the natural resources and ecological
services of the planet without degrading the environment and diminishing the natural
capital that supplies these services. Human demand placed on the environment has the
potential to cause an imbalance in ecological cycles and not only diminish our current
natural resources but erode the capability of nature to supply them in the future.
Sustainability can only be reached by protecting natural capital from being systematically
overused and consumed.
It is important that we understand to what extent we consume natural resources
and the effects that this consumption has on the environment. If we cannot reliably and
consistently measure our impact on the environment it becomes increasingly difficult to
manage and control environmental degradation.
Carbon dioxide is a well-known global warming gas and is emitted across all
sectors of the industrial economy. Like other green house gasses, CO2 absorbs long wave
infrared radiation as it rebounds off of the Earth’s surface. This absorption traps heat in
the Earth’s atmosphere, essentially creating a greenhouse effect, without which, life on
this planet could not exist. Climatic changes occur as a net result of both internal
variability within the climate system and external factors (including natural and
anthropogenic forcing). Concentrations of atmospheric greenhouse gases and their
associated radiative forcing on the earths climatic system have substantially increased as
a result of human activities since the industrial revolution. While there is still debate in
regards to the exact effects of human induced climatic alteration, it is an undeniable fact
that anthropogenic greenhouse gas emissions contribute to this change.

10
Architecture and the Environment
Architecture and the built environment are an integral aspect of the human resource
economy and represent a significant portion of all resource use. Estimates have shown
that these factors account for 40-60 percent of all resource consumption and account for
nearly half of all global warming gasses (Mazria, 2030). The longstanding views that
there is unlimited resource quantities available and that anthropogenic induced impacts
are insignificant in changing large climatic and environmental cycles are grinding to a
halt. Concrete research conducted by the Intergovernmental Panel on Climate Change
(IPCC) has shown that there is new and stronger evidence showing that most of the
observed warming over the last 50 years is attributable to human activities (IPCC 10).
Atmospheric CO2 concentrations have reached all time highs since the onset of the
industrial revolution and ice core data analysis has shown that today’s levels are higher
than they have ever been in thousands of years.
The obvious observation arising out of this data is that if architecture and the built
environment account for such a substantial portion of human resource consumption and
green house gas emissions, then we should implement, design, and build structures and
landscapes that reduce these impacts. Edward Mazria, an environmentally driven
architect states that “to successfully impact global warming and world resource depletion,
it is imperative that ecological literacy become a central tenet of design education. Yet
today, the interdependent relationship between ecology and design is virtually absent in
many professional curricula. To meet the immediate and future challenges facing our
professions, a major transformation of the academic design community must begin
today.”
George Pearl Hall
George Pearl Hall is home to the School of Architecture and Planning at the University of
New Mexico in Albuquerque. The newly completed 104,000 square foot building (2007)
cost the University 22 million dollars. By in large it is a modern concrete, steel, and glass
structure standing four stories high with massive concrete facades on its south facing
11
elevation. Designed to foster and promote students understanding of architecture and
related arts the building has been quoted as a ‘timeless work’ from UNM’s most famous
architectural graduate Antoine Predock. The question that arises is if this building is as
‘timeless’ as it appears and does it belong in a resource constricted and energy inefficient
society?
Ecological Footprints
The relationship between human development and the natural cycles of the earth can be
measured using a model known as the Ecological Footprint Model (EFM). This
measurement determines the relative amount of land and oceans that are needed to
sustain basic natural cycles and species diversity while accommodating for human
demand placed on nature. In this way, the EFM can show the degree of environmental
impact that certain activities/technologies (etc.) place on the earth’s ecosystems and
climatic cycles. The EFM enables a means to quantitatively measure impact on the
environment and to identify major sources of biospheric degradation. The EFM is a
measurement for relating waste streams to the assimilation capacity of the Earth’s bio-
sphere. Since the Earth has a finite amount of available bio-productive land, we can
determine the area needed in terms of generic global bio-productive hectares (gha)
required to re-assimilate the waste of a population, activity, or material. Humanity is
currently living in both ecological and carbon offset deficit, meaning that we consume
resources faster than the Earth can replenish them and that our current yearly activities
create waste in quantities greater than the biosphere’s yearly assimilation capacity
(Wackernagel,2005). This study measures the area of bioproductive land needed to
mitigate the negative ecological impacts of energy and resource use of George Pearl Hall,
in Albuquerque, New Mexico.
A subset, and often the largest component, of the EFM is the Carbon Footprint Model
(CFM). The CFM model uses known emission coefficients for converting energy used
into greenhouse gas emissions, which are expressed as carbon dioxide equivalence. In
calculating the footprint area, the CFM uses two primary coefficients. One pertains to the
12
carbon sequestration capacity of a specific portion of the earth’s biosphere and the second
is an equivalence factor, which relates the carbon sequestration capacity of a specific land
type (ha) to the overall bio-productivity of the earth’s surface (gha). This analysis uses
the sequestration capacity of an average maturing forest, which has a capacity of .192 ha/
metric ton of carbon dioxide and a land equivalence factor for forest land of 1.17
(Wackernagel).
UNM Facilities Description The University of New Mexico’s Utilities Division is the primary energy/resource
facilities management center for the universities main and north campuses. Heating,
cooling, and electricity generation are all managed by the Utilities Division, which uses
natural gas combustion turbines, boiler systems, chilled water coolers, absorption chillers,
and standard gird tied electricity connections to meet the campus demands. In total the
Ford Utilities Center has a 13.5 megawatt (MW) electricity generating capacity, a
190,000 lb/hour steam generating capacity, and a 7.35 ton chilled water capacity. These
systems include the Ford Utilities Center, the North Chiller Plant, the Co-Generation
Plant, the Health Sciences Chiller Plant, the new Lomas Chilled Water Plant, the north
and main campus electrical substations, the domestic water wells and reservoir, and the
related tunnel and direct buried distribution systems of steam, chilled water, domestic
water, building control air, and natural gas. Generation and distribution of heating and
cooling is delivered via high-pressure boilers, steam-turbine-driven and electric-driven
chilling equipment, and distribution pumping systems.
Analysis Methodology and Assumptions
This Carbon Footprint analysis for George Pearl Hall draws it findings from four
primary sources: the primary material costs for building construction, heating costs,
cooling costs, and electricity costs. These four aspects of the analysis are seen as costs
because all areas emit substantial quantities of Carbon Dioxide waste. The following
descriptions describe how each of these variables was treated for the analysis and the
assumptions integrated into each component.
13
Materials Costs George Pearl Hall, like many modern buildings, has three primary materials used
in the building process: concrete, steel, and glass. Specifically there is a disproportionate
quantity of concrete used in GPH’s construction in relation to most other modern
buildings. This assumption is derived from the visual observation of massive concrete
facades, walls, and towers in the structure. While there are numerous metrical analysis
methods available for determining the relative quantity of CO2 emissions per square foot
of a commercial building, based on the average material quantities for modern concrete,
steel, and glass buildings, this analysis does not uses these data sets. Instead, this analysis
only considers the concrete quantity used in construction to derive the CO2 emissions for
the material costs.
Cement, the primary chemical bonding component of concrete, has known CO2
emissions per unit quantity produced. Since cement production is a highly energy
intensive industrial process it consequently has substantial CO2 emissions. Moreover,
according to Worrell et.al. “ the cement industry contributes about 5% to global
anthropogenic CO2 emissions, making the cement industry an important sector for CO2-
emission mitigation strategies (Annual Review of Energy and Environment).” CO2 is
emitted from the calcination process of limestone, from combustion of fuels in the kiln,
as well as from power generation. The average intensity of carbon dioxide emissions
from total global cement production is one ton of CO2 per one ton of cement, and
standard 3500 psi concrete contains 564 pounds of cement per cubic yard (Wilson). With
this relationship we can determine the total quantity of cement used in the building
process as well as the corresponding CO2 emissions.
The assumptions for this component of the analysis are that: emissions associated
with the transportation and other industrial processes for mixing and other unaccounted
aspects are not included, secondly the assumption is for standard mixtures of cement to
cubic yard of concrete at 3500 psi.
14
Heating, Cooling, and Electricity Generation The UNM Utilities Center supplies heating and cooling to all campus buildings
and supplements electricity demands with energy generated during cogeneration
processes for steam production. George Pearl Hall is heated via steam heating derived
from natural gas powered turbines and boilers.
Steam as a heating source as supplied from a district power plant system poses
several difficulties for accurate measurement of actual energy used. This complexity has
to do with variables such as differential energy consumption between turbines and
boilers, energy loss within each system (efficiency of each system), steam condensate
return temperature variability, and line losses. Further complexity has to do with the
duration of time each system is used (as stand alone and in series), and quantity of steam
that each system supplies per unit time. Inconsistency in the total BTU (British Thermal
Unit) quantity per hundred cubic foot of natural gas adds to the complexity of an accurate
systems energy analysis. To simplify the complexity of the system used on campus at
UNM this analysis assumes the following variables for steam production: 1) All steam
produced for George Pearl Hall is effectively consumed by the building and no steam
condensate is reused for further heating, 2) only one system is used for steam production
(i.e. boiler system) and that this system has a constant supply of 1000 BTU/CF natural
gas in which the heat content of the gas at atmospheric pressure is (1176 BTU/Lb) and
the heat content of condensate is 258.55 BTU/Lb, 3) there is no line efficiency loss
between the steam generation facility and the building and that the boiler operates at 83
percent efficiency year round.
UNM’s chilled water plant is an electricity driven facility. That is, the only
energy/resource input other than water into the system is electricity. Published estimates
show that an average ton of chilled water, as produced with a chilled water system, has an
electricity consumption demand of 1.0 kWh.
The use of electricity for both the production of chilled water and for other
building uses is assumed to be derived from standard New Mexican energy supply.
Although the process of cogeneration for the production steam heating also results in the
generation of electricity, this analysis does not integrate this electricity into the energy
footprint. George Pear Hall’s electricity consumption has been isolated from the
15
efficiencies of the UNM Utilities system in order to estimate the environmental impacts
associated with the buildings energy consumption, regardless of its location. Further
reason for the elimination of the use of cogenerated electricity lies in the complexity of
UNM electricity system as well. This complexity has to do with the distribution of
electricity across the entire campus, which, is dependant on the total quantity of steam
produced (only with cogeneration equipment) for the campus, not for an individual
consumer such as George Pearl Hall. Further complexity for accurate measurement of the
total quantity of cogenerated electricity delivered to an individual campus consumer
(building) is that not all electricity produced during cogeneration is sent to buildings, but
a substantial quantity of energy is used for chilled water generation and facilities
management operations.
I. Energy Footprint Parameters
The parameters for energy use in this study encompass the footprints for
electricity and natural gas usage. Each category of energy usage has specific boundaries
in relation to the Carbon Footprint Model and to space appropriation. The following
parameters are used in the Carbon Footprint Model:
1. Determine the land area required to sequester total Carbon dioxide
emissions by a maturing forest, as expressed in Global Hectares and
local land types.
2. Cross reference findings with pre-established ecological footprint
calculator models.
1. In order to determine the total land needed to sequester yearly Carbon dioxide
emissions by a maturing forest, as expressed in Global Hectares, it is necessary to
multiply CO2 emissions by a relative land absorption factor, and then multiply by a land
equivalence factor. The land equivalence factor is a method used to account for the
difference in the Earth’s bio-productivity capacity for different land types. Bio-
productivity is a measure of nature's biological productivity over a specific area on the
planet's surface. Since some areas may be more productive than others, the actual surface
area in hectares is multiplied by an ‘equivalence' factor to compensate for dissimilarity in
16
the land's ability to produce biomass. For example, arable land can produce a
substantially greater quantity of biomass per unit period of time and is generally more
productive than the world average for all other land types, while a desert grassland is less
productive than average. When finding local area needed to sequester carbon emissions
an equivalence factor is not used, and findings are expressed in hectares as opposed to
global hectares.
The local carbon sequestration rate of average New Mexican lands has been
estimated based on global forest sequestration averages, above ground net primary
production rates of Pinyon-Juniper forestlands, known carbon sequestration rates of New
Mexican desert grasslands, and desert grassland above ground net primary production
rates. The global forest sequestration average acts as the primary reference, and the
primary productivity rates of Pinyon-Juniper forests and New Mexican desert rangelands
have been used as a relationship between the known carbon sequestration capacity of
desert rangelands. Through this relationship a carbon sequestration ratio to net above
ground primary productivity was derived, and related to the primary productivity of
Pinyon-Juniper woodlands. The speculated sequestration capacity of such woodlands is
approximately 1.111ton/ha/year. Derivation of this value can be found in the calculations
section. Desert rangelands have a known sequestration rate of .1ton/ha/yr of Carbon.
2. Calculations were cross referenced in respect to the Mathis Wackernagel
Household Ecological Footprint Calculator version II 2000. Mathis Wackernagel is a
world-renowned ecological footprint analyst and is seen as a credible source for
numerical comparison in relation to the methodologies created for this analysis.
Electricity Parameters
For this analysis the electricity usage of GPH is derived from a New Mexican grid
electricity source. The findings for the Carbon Footprint of electricity usage are
expressed in terms of Global Hectares (gha). The methodology for calculating the
electricity footprint is as follows:
17
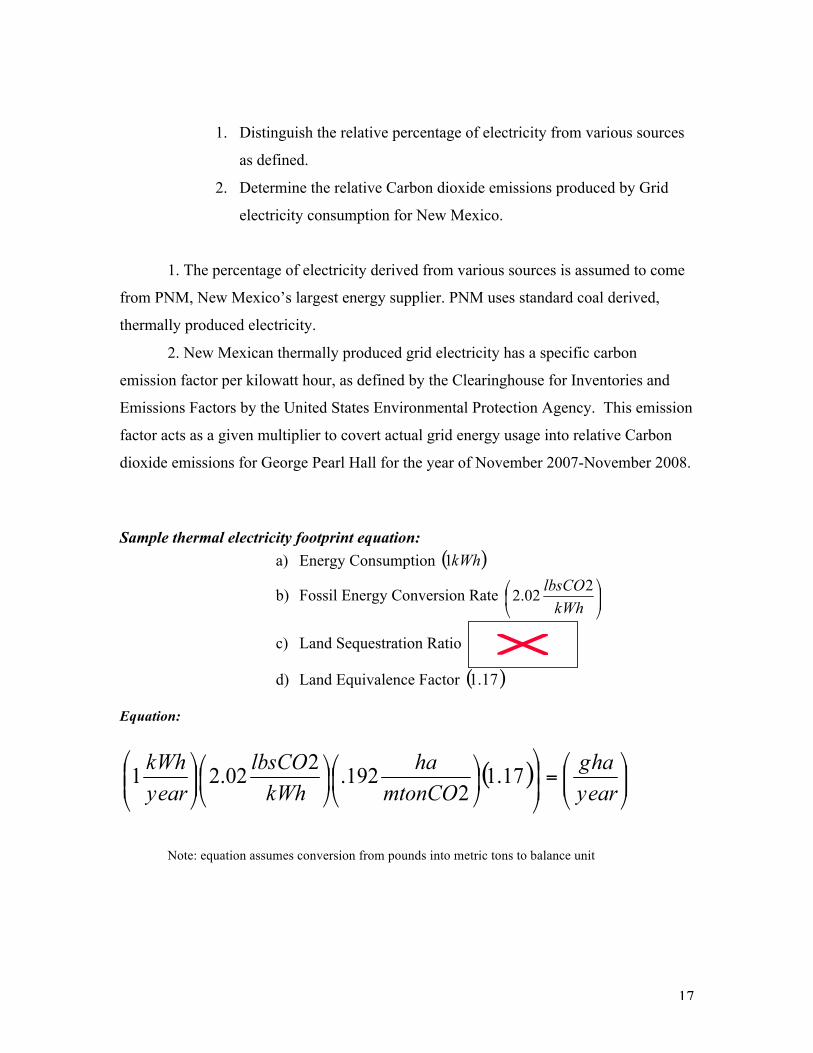
1. Distinguish the relative percentage of electricity from various sources
as defined.
2. Determine the relative Carbon dioxide emissions produced by Grid
electricity consumption for New Mexico.
1. The percentage of electricity derived from various sources is assumed to come
from PNM, New Mexico’s largest energy supplier. PNM uses standard coal derived,
thermally produced electricity.
2. New Mexican thermally produced grid electricity has a specific carbon
emission factor per kilowatt hour, as defined by the Clearinghouse for Inventories and
Emissions Factors by the United States Environmental Protection Agency. This emission
factor acts as a given multiplier to covert actual grid energy usage into relative Carbon
dioxide emissions for George Pearl Hall for the year of November 2007-November 2008.
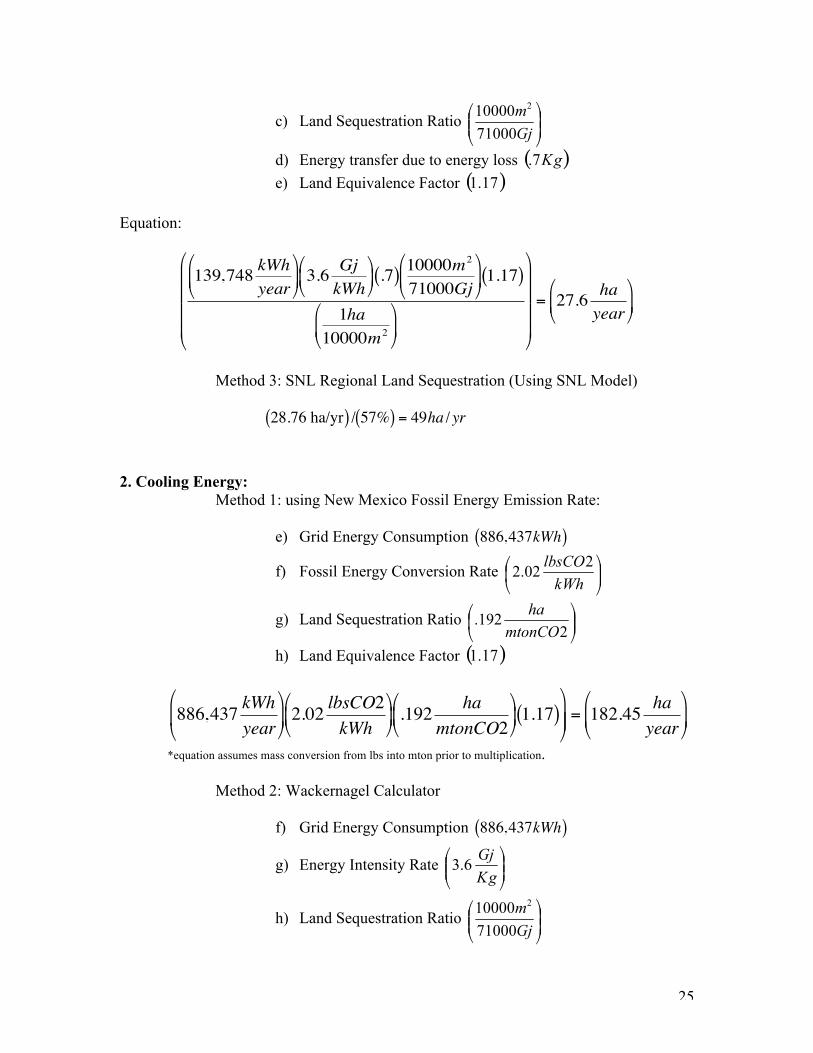
Sample thermal electricity footprint equation:
a) Energy Consumption
b) Fossil Energy Conversion Rate
c) Land Sequestration Ratio
d) Land Equivalence Factor
Equation:
Note: equation assumes conversion from pounds into metric tons to balance unit
18
Natural Gas Footprint Parameters Natural gas used at UNM’s Albuquerque campus is supplied through PNM, New
Mexico’s largest electricity and natural gas provider. The natural gas footprint has a
similar calculation methodology as that of electricity when computing the carbon-
footprint. In addition to the criteria used for deriving an energy footprint, the
methodology used to compute a natural gas footprint is as follows:
1. Determine the yearly natural gas consumption.
2. Determine the total Green House Gas (GHG) emissions in terms of
Carbon dioxide, for yearly natural gas usage.
3. Determine the relative therm conversion per one hundred cubic feet of
natural gas (CCF) for Albuquerque, New Mexico.
4. Determine the carbon absorption capacity of world average forests for
the sequestration of carbon dioxide emissions from natural gas.
1. The total yearly natural gas consumption for George Pearl Hall has been
extrapolated based on the quantity and temperature of steam supplied to the building.
Once this figure was determined, the natural gas consumption quantity measurement does
not equate for any lost gas between extraction and delivery.
2. Natural gas use conversion into CO2 emissions is based on data from the
United States Energy Information Administration’s Instructions for Form EIA 1605B,
Voluntary Reporting of Greenhouse Gas Emissions, Appendix B. This data denotes that
12.0593 pounds of CO2 are emitted per CCF consumed. This emission factor acts as the
given multiplier for converting total gas usage into total CO2 emissions.
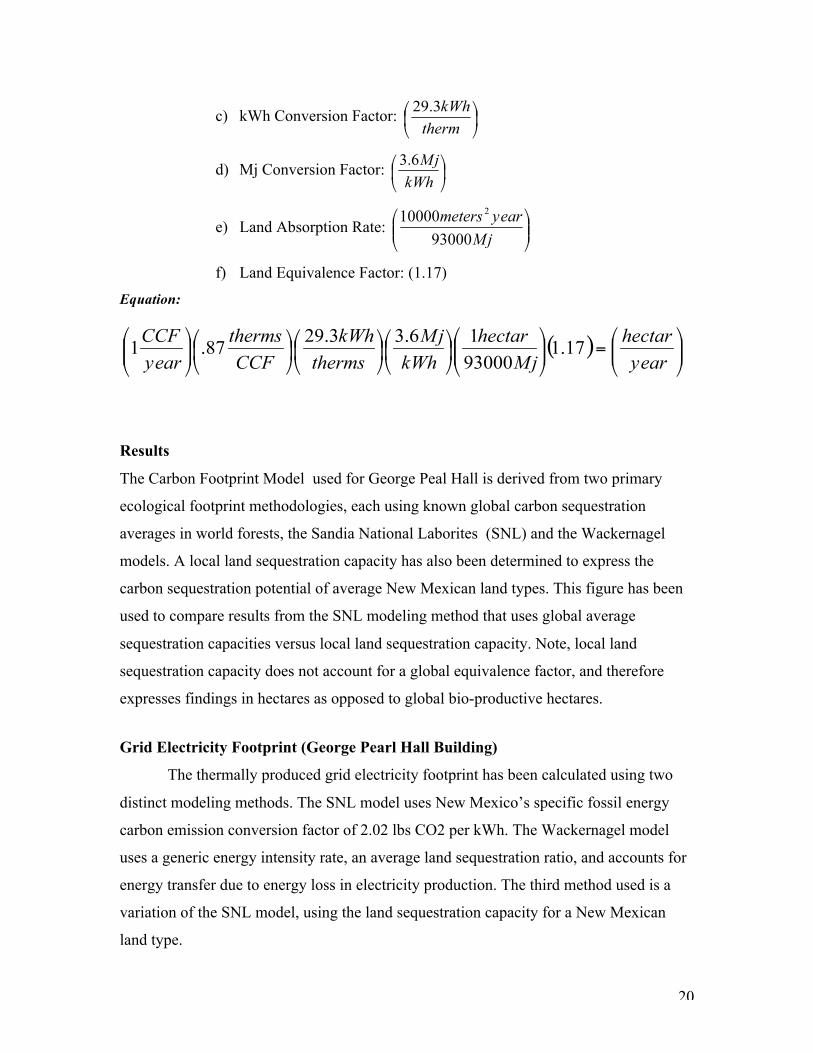
3. A second way to determine the total carbon dioxide emissions per CCF of
natural gas used is derived by using the total therms produced per gas consumption. Here,
a CCF of natural gas is converted into a total therm figure then converted into btu’s to
find kilowatt hours. In Albuquerque, in 2005, one CCF contained .87 therms. One therm
contains 100,000 btu’s, which corresponds to 29.3 kW hours. Multiplying by a factor of
3.6 gives Mega-joules (Mj) per kWh.
19
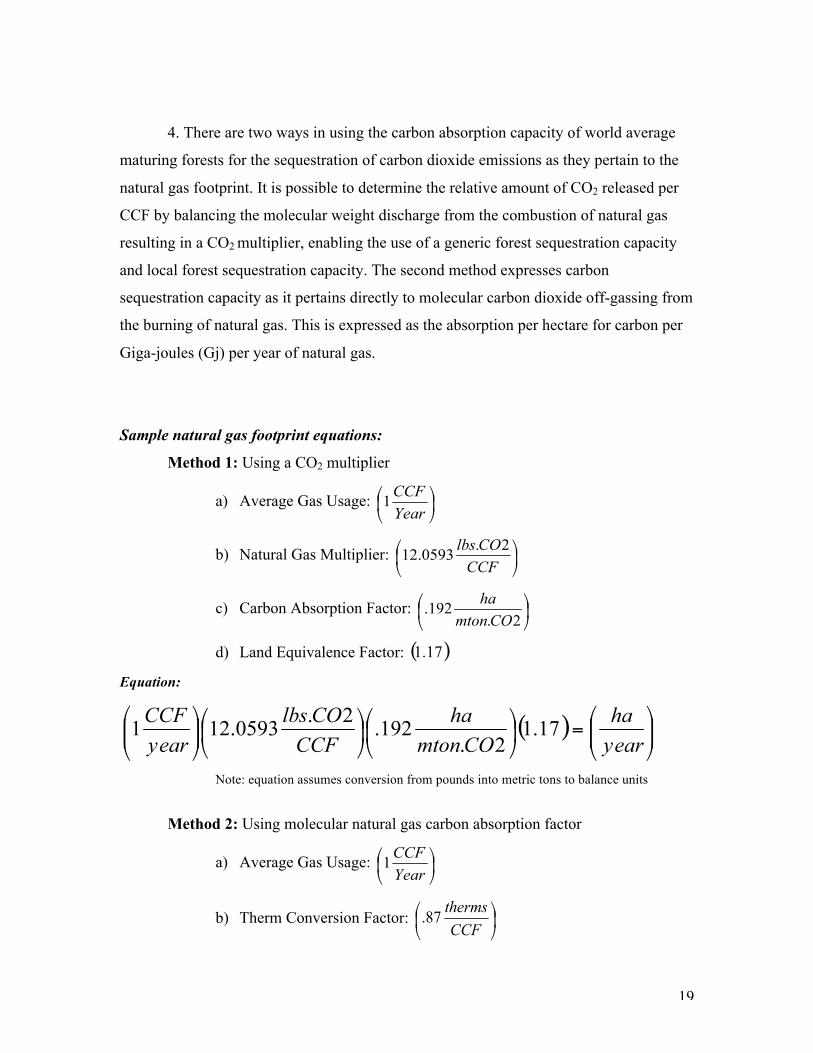
4. There are two ways in using the carbon absorption capacity of world average
maturing forests for the sequestration of carbon dioxide emissions as they pertain to the
natural gas footprint. It is possible to determine the relative amount of CO2 released per
CCF by balancing the molecular weight discharge from the combustion of natural gas
resulting in a CO2 multiplier, enabling the use of a generic forest sequestration capacity
and local forest sequestration capacity. The second method expresses carbon
sequestration capacity as it pertains directly to molecular carbon dioxide off-gassing from
the burning of natural gas. This is expressed as the absorption per hectare for carbon per
Giga-joules (Gj) per year of natural gas.
Sample natural gas footprint equations:
Method 1: Using a CO2 multiplier
a) Average Gas Usage:
b) Natural Gas Multiplier:
c) Carbon Absorption Factor:
d) Land Equivalence Factor:
Equation:
Note: equation assumes conversion from pounds into metric tons to balance units
Method 2: Using molecular natural gas carbon absorption factor
a) Average Gas Usage:
b) Therm Conversion Factor:
20
c) kWh Conversion Factor:
d) Mj Conversion Factor:
e) Land Absorption Rate:
f) Land Equivalence Factor: (1.17) Equation:
Results
The Carbon Footprint Model used for George Peal Hall is derived from two primary
ecological footprint methodologies, each using known global carbon sequestration
averages in world forests, the Sandia National Laborites (SNL) and the Wackernagel
models. A local land sequestration capacity has also been determined to express the
carbon sequestration potential of average New Mexican land types. This figure has been
used to compare results from the SNL modeling method that uses global average
sequestration capacities versus local land sequestration capacity. Note, local land
sequestration capacity does not account for a global equivalence factor, and therefore
expresses findings in hectares as opposed to global bio-productive hectares.
Grid Electricity Footprint (George Pearl Hall Building)
The thermally produced grid electricity footprint has been calculated using two
distinct modeling methods. The SNL model uses New Mexico’s specific fossil energy
carbon emission conversion factor of 2.02 lbs CO2 per kWh. The Wackernagel model
uses a generic energy intensity rate, an average land sequestration ratio, and accounts for
energy transfer due to energy loss in electricity production. The third method used is a
variation of the SNL model, using the land sequestration capacity for a New Mexican
land type.
21
During the analysis study period George Pearl Hall consumed 139,748 kWh of
electricity (the derivation of this figure can be seen in the calculations section). Using the
SNL model the carbon footprint of thermally produced grid electricity is 28.76 global
hectares of bio-productive forest per year, whereas the Wackernagel model results are
lower at 27.6 global hectares of bio-productive forest per year. The variation SNL model
shows that 49 hectares of mixed Pinyon-Juniper woodlands and desert rangelands are
needed to mitigate thermally produced gird electricity.
Chilled Water Footprint
Since chilled water uses electricity for its production it follows the same
parameters as the grid electricity footprint. During the analysis study period George Pearl
Hall consumed 886,437 kWh of electricity (the derivation of this figure can be seen in the
calculations section). Using the SNL model the carbon footprint of thermally produced
grid electricity is 182.45 global hectares of bio-productive forest per year, whereas the
Wackernagel model results are slightly lower at 174 global hectares of bio-productive
forest per year. The variation SNL model shows that 353 hectares of mixed Pinyon-
Juniper woodlands and desert rangelands are needed to mitigate thermally produced gird
electricity.
Natural Gas Footprint (Heating)
George Pearl Halls’ natural gas footprint has been calculated using two different
models. During the analysis study period George Pearl Hall consumed 136024 CCF of
natural gas (the derivation of this figure can be seen in the calculations section). The SNL
model uses an average carbon emission factor for natural gas and a corresponding land
absorption capacity and a land equivalence factor. The second method has been adopted
from the Wackernagel calculator and uses molecular energy intensity as defined in
therms per CCF of natural gas in order to convert CCF into kWh equivalence and uses a
natural gas specific carbon sequestration ratio. The variation SNL model has also been
used to express findings in terms of local land area.
22
The SNL model results are only slightly higher than the Wackernagel calculator
results, yielding a need average area of 142 global hectares per year, as opposed to the
Wackernagel results of 157 global hectares per year. The variation SNL model shows an
increase from 142 global hectares to 250 hectares.
Building Materials Footprint (Concrete)
The environmental costs associated with the use of concrete in George Pearl Hall
have also been accounted for. The relative quantity of portland cement to a cubic yard of
3500psi concrete is 564 pounds. Pearl Hall’s construction used 6750 cubic yards of
concrete or 3,807,000 pounds of portland cement. This would correspond to the emission
of 3.8 million pounds of CO2 and have an ecological footprint of 387 gha using the SNL
world model and 680 hectares using New Mexican landscapes to sequester these carbon
emissions.
Total Carbon Footprint
The sum total of all components of the footprint areas (heating, cooling,
electricity) for each model, the SNL model, the modified SNL model, and the
Wackerngel model, show George Pearl Hall’s footprint as at 353 gha, 619 ha (New
Mexican Lands), and 399.6 gha respectively. Adding the materials cost of concrete the
values for the SNL model increase by 387 gha and the modified SNL model increase by
680 hectares.
Conclusions and Limits of the Survey
This phase of the eco-footprint survey looked to establish baseline carbon
ecological impact values and does not account for every action associated within each of
the models parameters. The limits of the survey can be applied to each category: Heating,
Cooling, Electricity, and Building Materials.
Other than the previously described limits, the additional limits of the analysis for
energy and resources pertain to electricity use, natural gas use, and cement production. In
terms of land consumed to support the production, generation, and transportation of
regular grid electricity this study does not account for the following: 1) land consumed
23
for raw resource extraction, 2) land consumed by power plants, and 3) land consumed by
power lines for energy transportation. Further, the assumption is to calculate the footprint
of actual energy used in comparison with the Wackernagel model, which accounts for
energy loss in production. The limits to the footprint of natural gas usage are that this
study does not account for the infrastructure for extraction, refining, storage, and
transportation of natural gas. While this analysis accounts for the energy for the
production cement, it does not account for any other transaction costs, such as
transportation.
George Pearl Hall has a substantial yearly carbon footprint, ranging from 350 to
620 global hectares depending on the modeling type and carbon sequestration capacity of
the landscape. This total carbon dioxide emission per year, excluding those for material
costs, total more than 3.7 million pounds according to this analysis. As human impacts on
global systems continue to increase, the potential environmental implications of
architecture and the built environment must be considered. By multiplying the average
yearly emissions for George Pearl Hall over the expected life span of the building (100
years), we see that this figure totals nearly 400 billion pounds of carbon dioxide. How
can institutions committed to promoting understanding about the most pronounced issues
of today’s world do so in facilities that are indeed part of the problem and not part of the
solution.
24
Calculations
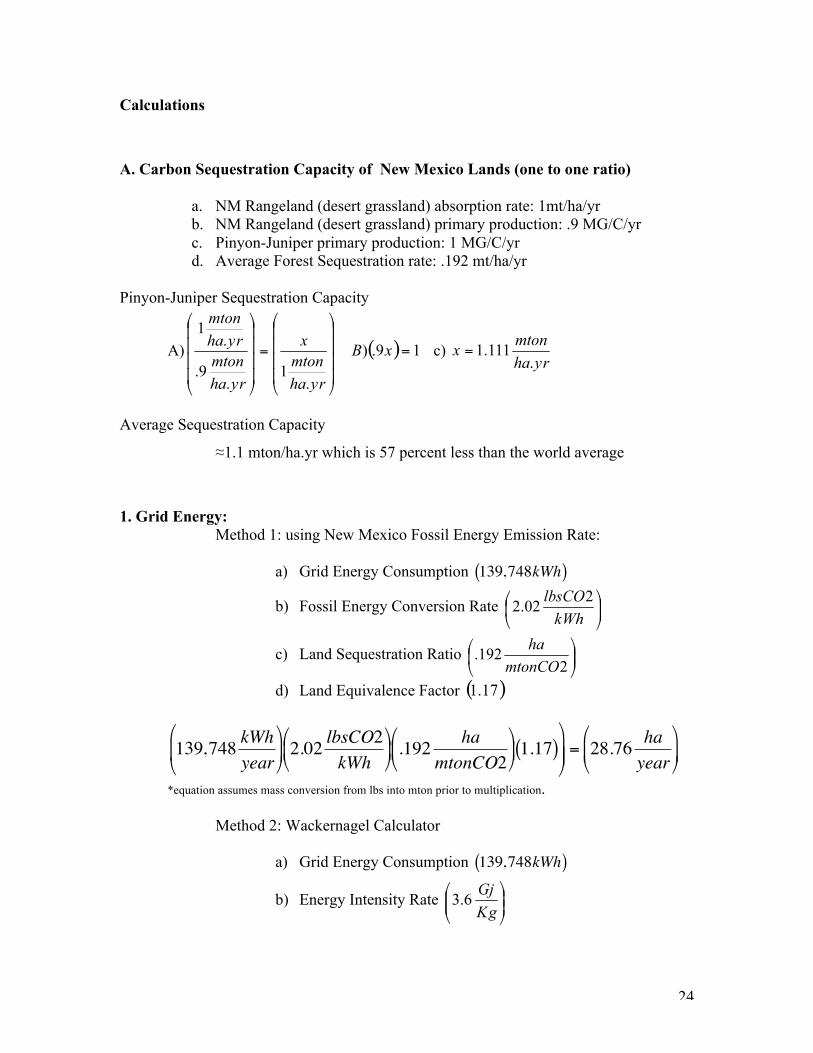
A. Carbon Sequestration Capacity of New Mexico Lands (one to one ratio)
a. NM Rangeland (desert grassland) absorption rate: 1mt/ha/yr b. NM Rangeland (desert grassland) primary production: .9 MG/C/yr c. Pinyon-Juniper primary production: 1 MG/C/yr d. Average Forest Sequestration rate: .192 mt/ha/yr
Pinyon-Juniper Sequestration Capacity
A) c)
Average Sequestration Capacity
≈1.1 mton/ha.yr which is 57 percent less than the world average
1. Grid Energy:
Method 1: using New Mexico Fossil Energy Emission Rate:
a) Grid Energy Consumption
€
139,748kWh( )
b) Fossil Energy Conversion Rate
c) Land Sequestration Ratio
d) Land Equivalence Factor
€
139,748 kWhyear
⎞
⎠ ⎟ 2.02
lbsCO2kWh
⎛
⎝ ⎜
⎞
⎠ ⎟ .192
hamtonCO2
⎛
⎝ ⎜
⎞
⎠ ⎟ 1.17( )
⎛
⎝ ⎜
⎞
⎠ ⎟ ⎟ = 28.76 ha
year⎛
⎝ ⎜
⎞
⎠ ⎟
*equation assumes mass conversion from lbs into mton prior to multiplication. Method 2: Wackernagel Calculator
a) Grid Energy Consumption
€
139,748kWh( )
b) Energy Intensity Rate
25
c) Land Sequestration Ratio
d) Energy transfer due to energy loss e) Land Equivalence Factor
Equation:
€
139,748 kWhyear
⎛
⎝ ⎜
⎞
⎠ ⎟ 3.6
GjkWh
⎛
⎝ ⎜
⎞
⎠ ⎟ .7( ) 10000m
2
71000Gj⎛
⎝ ⎜
⎞
⎠ ⎟ 1.17( )
1ha10000m2
⎛
⎝ ⎜
⎞
⎠ ⎟
⎛
⎝
⎜ ⎜ ⎜ ⎜
⎞
⎠
⎟ ⎟ ⎟ ⎟
= 27.6 hayear
⎛
⎝ ⎜
⎞
⎠ ⎟
Method 3: SNL Regional Land Sequestration (Using SNL Model)
€
28.76 ha/yr( ) / 57%( ) = 49ha / yr
2. Cooling Energy:
Method 1: using New Mexico Fossil Energy Emission Rate:
e) Grid Energy Consumption
€
886,437kWh( )
f) Fossil Energy Conversion Rate
g) Land Sequestration Ratio
h) Land Equivalence Factor
€
886,437 kWhyear
⎞
⎠ ⎟ 2.02
lbsCO2kWh
⎛
⎝ ⎜
⎞
⎠ ⎟ .192
hamtonCO2
⎛
⎝ ⎜
⎞
⎠ ⎟ 1.17( )
⎛
⎝ ⎜
⎞
⎠ ⎟ ⎟ = 182.45 ha
year⎛
⎝ ⎜
⎞
⎠ ⎟
*equation assumes mass conversion from lbs into mton prior to multiplication. Method 2: Wackernagel Calculator
f) Grid Energy Consumption
€
886,437kWh( )
g) Energy Intensity Rate
h) Land Sequestration Ratio

26
i) Energy transfer due to energy loss j) Land Equivalence Factor
Equation:
€
886,437 kWhyear
⎛
⎝ ⎜
⎞
⎠ ⎟ 3.6
GjkWh
⎛
⎝ ⎜
⎞
⎠ ⎟ .7( ) 10000m
2
71000Gj⎛
⎝ ⎜
⎞
⎠ ⎟ 1.17( )
1ha10000m2
⎛
⎝ ⎜
⎞
⎠ ⎟
⎛
⎝
⎜ ⎜ ⎜ ⎜
⎞
⎠
⎟ ⎟ ⎟ ⎟
= 174 hayear
⎛
⎝ ⎜
⎞
⎠ ⎟
Method 3: SNL Regional Land Sequestration (Using SNL Model)
€
182 ha/yr( ) / 57%( ) = 320ha / yr
3.Heating Natural Gas Footprint Method 1: Using a CO2 multiplier
a) Average Gas Usage:
€
136,024.84 CCFYear
⎛
⎝ ⎜
⎞
⎠ ⎟
b) Natural Gas Multiplier:
c) Carbon Absorption Factor:
d) Land Equivalence Factor:
€
136,024.84 CCFyear
⎛
⎝ ⎜
⎞
⎠ ⎟ 12.0593
lbs.CO2CCF
⎛
⎝ ⎜
⎞
⎠ ⎟ .192
hamton.CO2
⎛
⎝ ⎜
⎞
⎠ ⎟ 1.17( ) = 142 ha
year⎛
⎝ ⎜
⎞
⎠ ⎟
*equation assumes mass conversion from lbs into mton prior to multiplication. Method 2: Using molecular natural gas carbon absorption factor
a) Average Gas Usage:
€
136,024.84 CCFYear
⎛
⎝ ⎜
⎞
⎠ ⎟
27
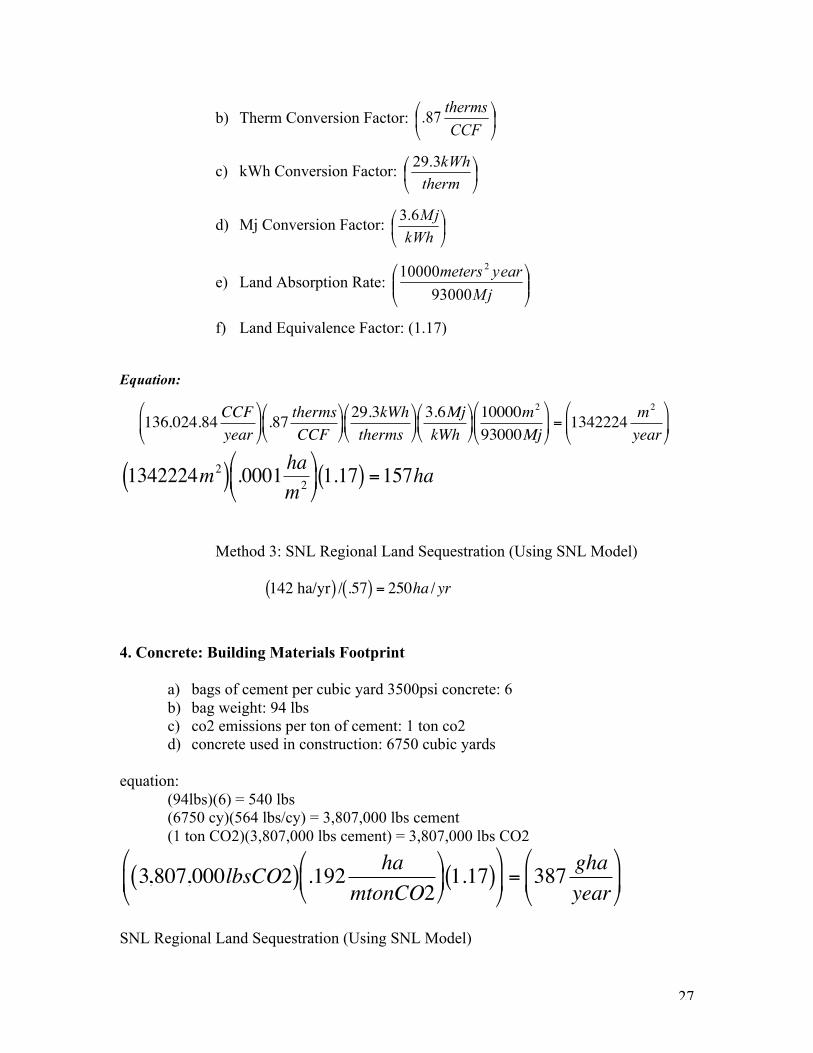
b) Therm Conversion Factor:
c) kWh Conversion Factor:
d) Mj Conversion Factor:
e) Land Absorption Rate:
f) Land Equivalence Factor: (1.17)
Equation:
€
136,024.84 CCFyear
⎛
⎝ ⎜
⎞
⎠ ⎟ .87
thermsCCF
⎛
⎝ ⎜
⎞
⎠ ⎟ 29.3kWhtherms
⎛
⎝ ⎜
⎞
⎠ ⎟ 3.6MjkWh
⎛
⎝ ⎜
⎞
⎠ ⎟ 10000m2
93000Mj⎛
⎝ ⎜
⎞
⎠ ⎟ = 1342224 m2
year⎛
⎝ ⎜
⎞
⎠ ⎟
Method 3: SNL Regional Land Sequestration (Using SNL Model)
€
142 ha/yr( ) / .57( ) = 250ha / yr
4. Concrete: Building Materials Footprint
a) bags of cement per cubic yard 3500psi concrete: 6 b) bag weight: 94 lbs c) co2 emissions per ton of cement: 1 ton co2 d) concrete used in construction: 6750 cubic yards
equation: (94lbs)(6) = 540 lbs (6750 cy)(564 lbs/cy) = 3,807,000 lbs cement (1 ton CO2)(3,807,000 lbs cement) = 3,807,000 lbs CO2
€
3,807,000lbsCO2( ) .192 hamtonCO2
⎛
⎝ ⎜
⎞
⎠ ⎟ 1.17( )
⎛
⎝ ⎜
⎞
⎠ ⎟ = 387 gha
year⎛
⎝ ⎜
⎞
⎠ ⎟
SNL Regional Land Sequestration (Using SNL Model)
€
1342224m2( ) .0001 ham2
⎛
⎝ ⎜
⎞
⎠ ⎟ 1.17( ) =157ha
28
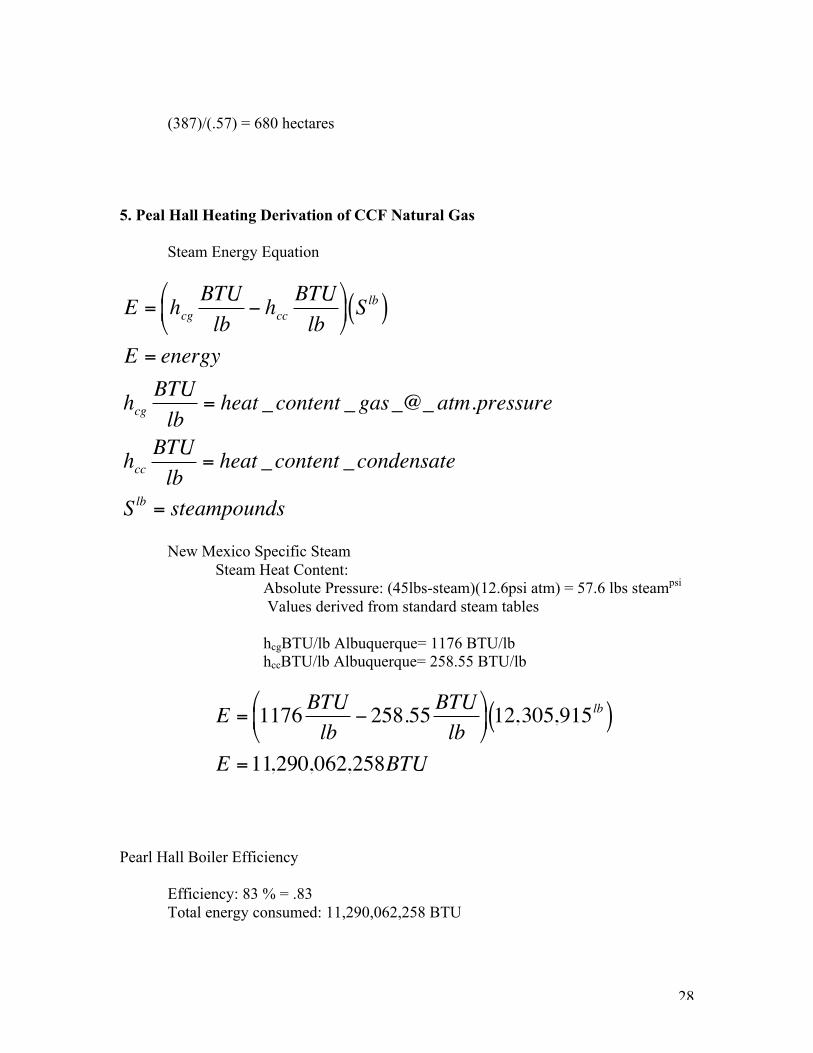
(387)/(.57) = 680 hectares 5. Peal Hall Heating Derivation of CCF Natural Gas Steam Energy Equation
€
E = hcgBTUlb
− hccBTUlb
⎛
⎝ ⎜
⎞
⎠ ⎟ Slb( )
E = energy
hcgBTUlb
= heat _content _ gas_@_ atm.pressure
hccBTUlb
= heat _content _condensate
Slb = steampounds
New Mexico Specific Steam Steam Heat Content: Absolute Pressure: (45lbs-steam)(12.6psi atm) = 57.6 lbs steampsi
Values derived from standard steam tables hcgBTU/lb Albuquerque= 1176 BTU/lb hccBTU/lb Albuquerque= 258.55 BTU/lb
€
E = 1176 BTUlb
− 258.55 BTUlb
⎛
⎝ ⎜
⎞
⎠ ⎟ 12,305,915lb( )
E =11,290,062,258BTU
Pearl Hall Boiler Efficiency Efficiency: 83 % = .83 Total energy consumed: 11,290,062,258 BTU

29
Equation: (11,290,062,258 BTU)/(.83) = 13,602,484,648.2 BTU Convert BTU to CCF 1000 BTU/CF = 100,000BTU/CCF (cubic hundred feet) Equation: (13,602,484,648.2 BTU) / (100,000 BTU/CCF) = 136024.84 CCF
30
References:
Brown, Joel. Carbon Sequestration Potential in New Mexico Rangelands. USDA Natural Resources Conservation Service & The US Department of Energy. Doherty, Stephen. Toward a Better Understanding of Our Ecological Footprint: Development of Sustainable Progress Indicators for Slippery Rock University. Slippery Rock University Press. PA. Ecological Footprint Standards 2006. The Global Footprint Network Standards Committees. June, 2006. Emission Factors and Energy Prices for the Cleaner and Greener Environmental Program. Prepared by Leonardo Academy Inc. For the MPERRS. April, 2004. Environmental Program. Loh, Jonathan and Mathis Wackernagel. EPA Victoria: EPA Ecological Footprint Calculators: Technical Background Paper. Publication 972. February 2005. Getz, J. Photosynthesis and water-use efficiency in pinyon-juniper communities along an elevation gradient in northern New Mexico. Boston University. 1992. Goodale, C. Forest Carbon Sinks in the Northern Hemisphere. Ecological Society of America. 2002. Grier, C. Biomass distribution and productivity of Pinus-edulis—Juniperus mononsperma woodlands of north-central Arizona. Northern Arizona University. 1991. IPCC Synthesis Report: Climate Change 2001 Synthesis Report; Summary for Policymakers. Third Assessment Report. 2001. Johnson, Peter Allan. Exploring the Ecological Footprint of Tourism in Toronto. University of Waterloo. Waterloo, Ontario, Canada, 2003 Kimble, J.M. The Potential of US Forest Soils to Sequester Carbon and Mitigate the Greenhouse Effect. CRC Press. Washington DC. 2003. Lewan and Simmons. A Short Primer on the Ecological Footprint. 2001. Methods for estimating carbon dioxide emissions and sinks from forest management and land use change. October 1999. Prepared by: ICF Incorporated Prepared for: Greenhouse Gas Committee Emission Inventory Improvement Program Rees, William. Impeding Sustainability? The Ecological Footprint of Higher Education. May, 2003.
31
SRef-ID: 1607-7962/gra/EGU06-A-05019 © European Geosciences Union 2006 Stavins, Robert N. The cost of U.S. forest-based carbon sequestration. Harvard University. Prepared for the Pew Center on Global Climate Change. 2005. The Ecological Footprint of Victoria Assessing Victoria’s Demand on Nature. Prepared for EPA Victoria by Global Footprint Network and the University of Sydney. October, 2005 Wilson, Alex, Cement and Concrete: Environmental Considerations, in Environmental Building News, Volume 2, Number 2, March/April 1993. The World Watch Institute. 2005 State of the World: Redefining Global Security. Worldwatch Books. 2005. Using Remote Sensing and GIS Technology. New Mexico State University. 2004. Wackernagel, Mathis. National Footprint and Biocapacity Accounts 2005: The underlying calculation method. Global Footprint Network. May, 2005. World Resources: Data Tables Part 2. 2002-2004. United Nations World Wildlife Fund. Living Planet Report 2004 and 2002. Online References: Best Foot Forward: http://www.bestfootforward.com/foot.html Carbon Sequestration: http://www.asb.cgiar.org/data/dataset/IDADCMZB.htm
Endress + Hauser - Coal Power Plant: http://www.endress.com
Global Footprint Network: http://www.footprintnetwork.org/
Redefining Progress: http://www.ecologicalfootprint.org/
Revisiting Carrying Capacity: Area-Based Indicators of Sustainability: http://dieoff.org/page110.htm
Southwest Partnership for Carbon Sequestration: http://www.southwestcarbonpartnership.org/
Technology Transfer Network Clean Air Technology Center http://www.epa.gov/ttn/catc/products.html#software

32
Technology Transfer Network Clearinghouse for Inventories & Emissions Factors http://www.epa.gov/ttn/chief/ap42/ap42supp.html
Watch Your Step: Understanding the Impact of Your Personal Consumption on the Environment: http://ublib.buffalo.edu/libraries/projects/cases/footprint/footprint.html
World Business Council for Sustainable Support: http://www.ghgprotocol.org
(http://www.unm.edu/ ~ppd/utilities.html).