Embed Size (px)
Citation preview

Geophysical Report
for the Stumpy Bay Property
Shakespeare Twp., Sudbury Mining Division
Submitted by: Mitchell B. Turcott, B.Sc.
Date: February, 2003
41I05SW2012 2.25068 SHAKESPEARE 010

Table of Contents
Page1) Introduction l
2) Property Location and Access l
3) Regional Geology 3
4) Property Geologyi) Lithology 5 ii) Mineralization 6
5) Geophysics 7
6) Conclusion and Recommendations 11
7) References 12
8) Certification 13
List of Figures and Maps
Figure 1: Stumpy Bay Property Location Map l
Figure 2: Stumpy Bay Property Location Photo 2
Figure 3: Shakespeare Twp. Claim Map, Stumpy Bay Claim Group 2
Figure 4: Stumpy Bay Property Grid Location Aerial Photograph 8
List of Maps
Map 1: Stumpy Bay Property Grid Location Map Pocket
Map 2: Stumpy Bay Vertical Field Magnetic Contour Map Pocket
Map 3: Stumpy Bay VLF Electromagnetic Response Profile Map Pocket
Appendix
Fluxgate Magnetometer Raw Data Sheets Appendix l
VLF (EM-16) Response Profiles A Data Appendix 2
Scintrex MF-2 Fluxgate Magnetometer Information Appendix 3
Geonics Ltd. VLF EM-16 Information Appendix 4

Stumpy Bay Property Shakespeare Twp., Sudbury Mining Division
Introduction:The Stumpy Bay Property contains copper-bearing sulphide mineralization and
precious metals in sheared and silicified Huronian metasediment s. Intrusive rocks which host Ursa Major Minerals recently discovered Cu, Ni, PGM deposit also intrude the Huronian metasediments on the Stumpy Bay Property and these intrusive rocks represent the footwall to the Ursa Major discovery. The objective of the 2003 work program was to locate and outline geophysical anomalies with a similar strike to the Ursa Major PGM discovery within the footwall intrusive rocks. A grid was established along the northern boundary of the Stumpy Bay Property and a magnetometer and VLF geophysical survey was conducted.
Property Location and Access:The Stumpy Bay Property is located in Lots 2 *fe 3, Concession V, Shakespeare
Township. UTM co-ordinates: 436000E, 5I32000N. The claim group consists of 9- 16ha units numbered 1231439, 1231440, 1231441 (Figures 2 ft 3).
Access to the property is provided by an all weather road ( Agnew Lake Road) from the town of Webbwood. north to Agnew Lake, then by boat or over the ice to the claim group along the north shore of Agnew Lake and Stumpy Bay (Figure l). The town of Webbwood is located approximately 55 miles west of Sudbury, Ontario on Hwy. 17.
Figure 1: Stumpy Bay Property Location Map
Stumpy Bay Property Shakespeare Twp Sudbury Mining District
SudburyCopper Cifp
O H T A R l O
CLAPPERTOH ISLANDlitte Curent
MANITOULIN l S L A FT D S' French tKey Harbour' l
i. ^J rights rsssrwJ. l
Scale: l cm to 30 km. Map modified from Encarta, 1998 Edition, Virtual Globe.

Figure 2: Stumpy Bay Property Location Photo (Shakespeare Twp.)
Note: keel Lino stumpy Bay Claim Group Scale: Approximate!} 1:50,000 Yellow Lines ~ Internal Claim Lines within the Claim Group
Figure 3: Shakespeare Twp. Claim Map, Stumpy Bay Claim Group
Agnew Lake
Shakespeare Twp.
Scale: '/2 W = V* mile

Regional Geology:
The Huronian Supergroup is an assemblage of sedimentary and subordinate volcanic rocks which lie unconformably on Archean rocks of the Superior Province and forms the eastern part of the Southern Province. The Supergroup can be subdivided into 4 groups which have variable thicknesses (thickening toward the southeast). In ascending stratigraphic order these groups are the Elliot Lake, Hough Lake, Quirke Lake and Cobalt groups.
Intensive exploration of the Huronian Supergroup in the late 50's and early 60's as a result of the discovery of uranium deposits in the Elliot Lake and Espanola areas (l 95 O's) has provided researchers with an excellent data base. Uranium deposits associated with a quartz pebble conglomerate of the Matinenda Formation and a suite of volcanic rocks are what characterizes the oldest basal Elliot Lake Group. The Hough Lake and Quirke Lake Groups comprise two cyclic repetitions of a lower conglomeratic unit (Ramsay Lake 8i Bruce Formations), a middle pelite-greywacke unit (Pecors and Espanola Formation), and an upper sandstone unit (Mississagi & Serpent Formations). The Cobalt Group consists of the Gowganda, Lorrain, Gordon Lake and Bar River Formations. These formations contain repetitive conglomerate-pelitic-sandstone sequences much like the Hough Lake and Quirke Lake Group (Card, 1977).
The Huronian rocks record rapid deposition by facies migration of mainly immature clastic sediments that were derived from a dominantly felsic plutonic terrane to the North, and were deposited in the form of a southeastward thickening wedge on the Southern flank of the Superior Province craton. It has been surmised that recurrent glaciation played a major role in the development of the Huronian sequence. According to this model, the conglomerates represent the direct deposit of several major continental- marine glacial episodes, the pelitic rocks are post-glacial transgressive deposits and the sandstones represent regressive, prograding fluvial deposits. Pettijohn (1970) has pointed out that the Huronian sequence may also represent the deposits of a series of regressive marine cycles that rarely, if ever, became emergent surfaces of accumulation (Card, 1977).
The Huronian Volcanic sequence of the Sudbury area (the eastern volcanic rocks) are similar to those of Archean greenstone belts comprising thick accumulations of mafic, intermediate and felsic flows, pyroclastics and interflow sediments. The Huronian metavolcanics are slightly richer in K2O than many of the early Precambrian volcanic suites which may suggest an increase in K2O within the mantle over time. The volcanic accumulations may represent fissure-type eruptions whose emplacement was controlled by early marginal faults. The Elsie Mountain, Stobie and Copper Cliff Formations represent one major mafic-felsic volcanic cycle while the felsic Creighton Granite and related mafic Gabbro-Anorthosite plutons are related closely to the volcanic accumulations in time, space and possibly genesis (Card, 1977 A 1978).

Regional Geology con't:
Several Igneous intrusions are spatially associated with the rocks of the Huronian Supergroup, including the Nipissing Gabbro intrusive suite. The intrusions extend from Sault Ste. Marie through the Sudbury Region and from Cobalt through the Gowganda regions (Lightfoot A Naldrett, 1996). Precise U-Pb geochronology on magmatic baddeleyite from Nipissing Gabbro has yielded ages of 2219 +I- 3.6 Ma from the Gowganda area, 2212 +I- 2 Ma from the Sudbury area and 2217 +I- 4 Ma, 2210 +/-3.S Ma from the Cobalt area (Lightfoot & Naldrett, 1996). The Nipissing intrusive rocks form dikes, sills and undulating sheets which range in thickness from a few hundred metres to over a thousand metres (Lightfoot A Naldrett, 1996; Koziol & Chubb, 1996). Two pyroxene gabbro is the most common intrusive rock type, however, other varieties of Nipissing intrusive rocks include leucogabbro, granophyric gabbro and granophyre (Koziol & Chubb, 1996). The Nipissing intrusives southwest of Sudbury (between Sudbury & Blind River) are elongated parallel to the main structural fabric of the Murray Fault System (Card, 1978) and are typically amphibole rich metagabbros consisting of albitic plagioclase and actinolite or actinolite and blue/green hornblende (Card, 1978).
These rocks have undergone upper greenschist to amphibolite facies regional metamorphism and deformation that may be related to the Paleoproterozoic Penokean Orogeny which occurred between 1900 and 1850 Ma (Lightfoot St Naldrett, 1996). Buchan 8c Card (1985) believe that the emplacement of the Nipissing Gabbro may be related to faulting associated with the deposition of the Huronian strata (Lightfoot SL Naldrett, 1996). Nipissing Gabbro bodies have been folded along with the Huronian sequence and are thus typically conformable with regional structures. Relatively late deformation of the Nipissing is most pronounced West of the Sudbury Basin, particularly eastward from the Baldwin Anticlinorium towards Sudbury (Card, 1978). The degree of metamorphism and deformation associated with Nipissing intrusives suggests that these rocks were emplaced after initiation of early major folding, but prior to later deformation and regional metamorphism (Card, 1978).
Distribution of Nipissing Gabbro is generally related to major regional faulting, but is also commonly spatially associated along the contacts between massive conglomeratic units (Ramsey Lake, Bruce, Gowganda Formations) and siltstone, sandstone and calcareous facies (Espanola Formation) within the Huronian Supergroup (Card, 1978).
Basinal portions of Nipissing Gabbro intrusives consist of quartz diabase overlain by hypersthene gabbro accompanied by an overlying vari-textured gabbro with pegmatoidal patches. Arches consist of vari-textured gabbro overlain by quartz diorite, granodiorite, granophyre and aplitic granitoids. Intrusives are typically undifferentiated and consist of basal quartz diabase overlain by gabbro. Differentiation into hypersthene gabbro and more felsic phases like granophyre and granodiorite occur less frequently and are the exception rather than the rule (Lightfoot & Naldrett, 1996).

Regional Geology con't:
Nipissing intrusives are dominantly Tholeiitic with more evolved magmas trending towards calc-alkaline compositions. The geochemistry of the Nipissing suite is consistent with features of Phanerozoic Continental Flood Basalts (Lightfoot A Naldrett, 1996).
Several other intrusive rock suites, such as the East Bull Lake, Agnew Lake (Shakespeare/Dunlop) Gabbro-Anorthosite Intrusives, Croker Island and Cutler intrusions are spatially and perhaps genetically associated with both the supracrustal development and subsequent dynamothermal metamorphism of the Huronian Supergroup.
Property Geology:
i) Lithology:
The Stumpy Bay Property is predominantly composed of Huronian sediments and mafic (gabbroic) intrusive rocks. Huronian rocks on the property consist of two groups, the Elliot Lake Group and the Hough Lake Group. Formations within the Elliot Lake Group include the Matinenda Formation which is predominantly feldspathic sandstone, protoquartzite, sub-greywacke, greywacke, argillite and siltstone, and the McKim Formation which is predominantly biotitic metapelite. Formations within the Hough Lake Group include the Ramsay Lake Formation which is predominantly a polymictic para conglomerate with a protoquartzite matrix, and the Pecors Formation which ranges from argillite to siltstone. Stratigraphically, the Hough Lake Group overlies the Elliot Lake Group.
The gabbroic rocks found within the Stumpy Bay Property intrude all of the Huronian lithologies. Card & Palonen mapped the intrusive rocks within the Stumpy Bay Property as Nipissing in age (approx. 2212 ma) (Card A Palonen, 1976).Textures range from massive, medium to coarse grained, undifferentiated metagabbro, to locally brecciated, sheared and strongly foliated biotite and tremolite rich rocks. Sulphides typically consist of l-307o finely disseminated pyrrhotite and chalcopyrite (+I- pyrite) making the rock weakly magnetic, with localized areas containing blebby chalcopyrite and pyrrhotite sulphide patches.
There is a 10-15 meter wide tremolite unit at UTM E0436559 fe N 5132385 (Zone 17, NAD 27) with approximately 100 meters of outcrop exposure. This may represent a meta-pyroxenite layer and possibly the lowest stratigraphic unit of the igneous intrusion. The tremolite or meta-pyroxenite unit has been mapped on the Falconbridge mining patents (Ursa Major option) to the north and west of the Stumpy Bay claim group and has also been recognized on the Big Swan Property located in Porter Twp. This unit is very anomalous in Pt and Pd in Porter Twp.

ii) Mineralization
Card and Palonen (1976), describe the Nipissing gabbro associated with the Falconbridge nickel, copper, PGE deposit located adjacent to the Stumpy Bay Property in Shakespeare Township (Figure 2) as being highly sheared, locally pegmatitic and containing abundant granophyre. Mineralization consisting of pyrrhotite, chalcopyrite and pentlandite is exposed over a strike length of 760 metres (2,500 feet) and for widths of 30 metres (100 feet) (Card A Palonen, 1976). The mineralized zone lies entirely within the gabbro, which strikes east-northeast, parallel to, and approximately 30 metres south of the contact with the gabbro and Mississagi Formation (Card A Palonen, 1976). Falconbridge Nickel Mines Limited estimates that the deposit contains 3 to 4 million tons of ore averaging G.34% nickel, Q.40% copper plus precious metals consisting of platinum, palladium, gold and rare earth elements (Card A Palonen, 1976).
This property, originally owned by the Sudbury Shakespeare Gold Copper Syndicate is now held by Falconbridge Nickel Mines Limited who have recently optioned the property to Ursa Major Minerals. Ursa Major is currently exploring the property for its Platinum Group Mineral (PGM) potential and made the following press release in October of2002:
OCTOBER 17, 2002 -13:45 EOTURSA Major Minerals Confirms Significant Near-SurfaceNickel, Copper, PlatinumGroup Metal Discovery at Shakespeare Project, Sudbury Area, Ontario.
TORONTO, ONTARIO-URSA Major Minerals Incorporated (URSA Minerals)is pleased to provide assay results from the recently completed drill program on the Company's nickel, copper, and platinum group element discovery in Shakespeare Township, located west of Sudbury, Ontario.
All five holes intersected a wide zone of significant near-surface nickel, copper, and platinum group element mineralization. Highlights of assay results received on the 3,493 ft (1,065 m) five hole program include hole U3-06 which intersected 265.8 feet (81.0 m) grading Q.66% nickel, G.61% copper, 0.47 g/t platinum, 0.54 g/t palladium and 0.27 g/t gold. With the assay results reported on the two discovery holes on July 23, 2002, including U3-04 which returned 292.8 ft (89.3 m) grading Q.57% nickel, G.64% copper, 0.56 g/t platinum, 0.61 g/t palladium and 0.32 g/t gold, URSA Minerals now has a total of 7 holes in the newly discovered zone.
The intersections to date have been consistent in both grade and width. The zone has been drilled over 3 sections at 200 foot (61 m) intervals and to a depth of approximately 500 feet (152 m). Intersections indicate true widths of approximately 160 feet (49 m) to greater than 200 feet (61 m). The zone remains fully open on strike in both directions and at depth. Additional zones are present in both the hanging wall and footwall in holes U3- 05 and U3-09. Holes U3-05, -06, and -07 were drilled across the mineralized structure from south to north and holes U3-08 and 09 were drilled from north to south.

ii) Mineralization con't:
The spatial proximity of the Falconbridge NI, CU, PGE deposit to the Stumpy Bay Property provides for the potential for similar mineralization to occur within the gabbro in the Stumpy Bay area. Prospecting of the mafic intrusive rocks along the north boundary of the Stumpy Bay Property in 2000, revealed t-3% blebby sulphides up to 0.5 cm in diameter within the gabbro. The sulphide blebs are composed of chalcopyrite and pyrrhotite, usually with chalcopyrite rimming pyrrhotite, suggesting a magmatic origin. Four samples, numbers MTOO-109 to 112 were taken from this area in 2000 and submitted for analysis. Assay results indicate anomalous platinum and palladium values ranging from 53 to 78 ppb combined PGEs (See Year 2000 Assessment File Report). The blebby chalcopyrite mineralization appears to strike in an east-west direction, parallel to the sedimentary contact and is continuous for over two hundred metres.
Structurally controlled copper, cobalt and precious metal rich mineralization associated with a silicified shear zone occurs within the Stumpy Bay Property. The Stumpy Bay shear zone is parallel to structures found within the Falconbridge Property and in Porter and Dunlop townships. Sulphide mineralization consisting of chalcopyrite, bornite, pyrrhotite and arsenopyrite occurs in a zone of silicified and brecciated Matinenda micaceous sandstone and pelite. The mineralized zone strikes northeast at 64.50, dips steeply northward and is conformable to primary bedding within the host sediments. Surface sampling and diamond drilling in the 1950's and 60's indicates that the mineralized shear zone averages Ipercent copper across 10 feet over a strike length of approximately 1900 feet.
Four grab samples taken in 2000 from trenches located along the shear zone and submitted for analysis assayed from t.6% to S.5% copper plus cobalt values ranging from 234ppm to 1882pm and highly anomalous gold (572 ppb AU) and silver (13.9 ppm Ag) (Year 2000 Assessment Report, sample numbers MTOO-001 to 004).
Geophysics
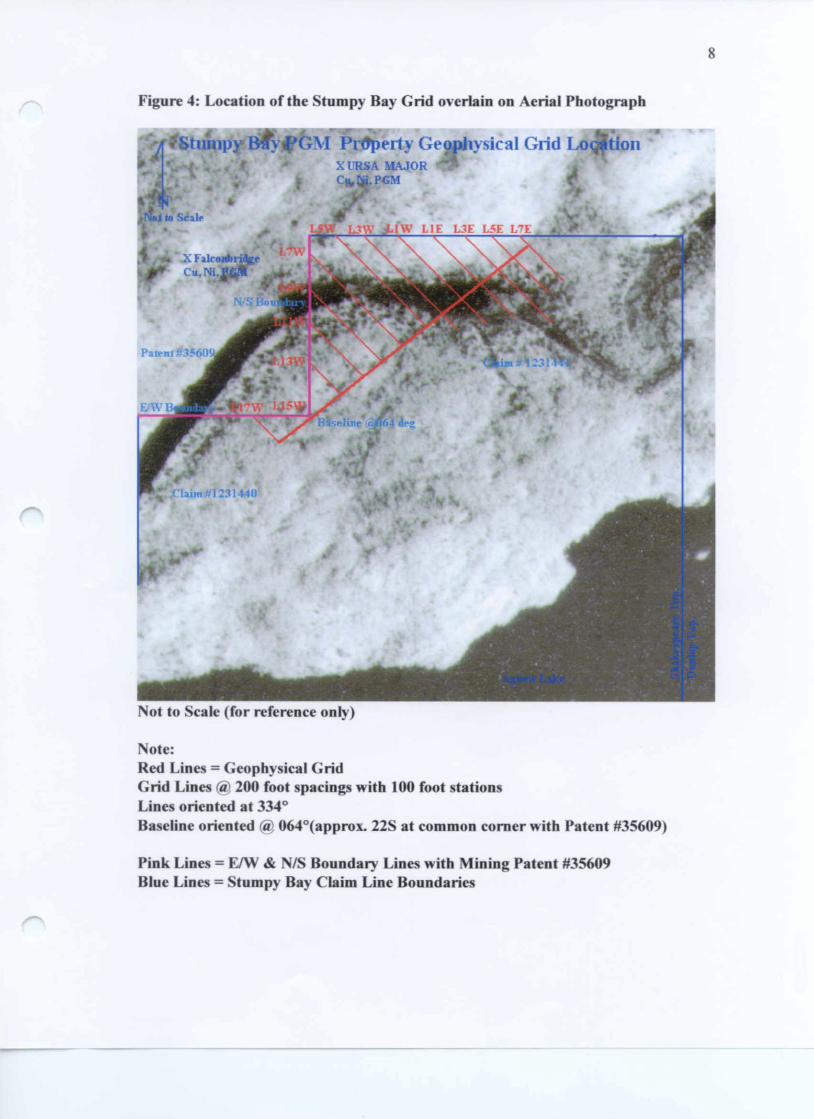
M. Turcott supervised the cutting 5.2 km of grid over the northern portion of the Stumpy Bay Property with an orientation that would match the Ursa Major Minerals grid to the north (Figure 4 8c Map 1) in January & February of 2003,. The corner post of the patented mining claims #35609, 35596 and 35597 owned by Falconbridge Ltd. is the common corner for claim #1231441 of the Stumpy Bay Property. The corner pin was located and the E/W and N/S boundary of patent #35609 was cut out to help control the grid boundaries and establish the property boundary (Figure 4 & Map 1). A baseline was established with an orientation of 0640 from the corner of patent # 35609 and claims #1231440 & 1231441 (Figure 4 & Map 1). Grid lines were cut every 200 feet at right angles to the baseline with stations every 100 feet. This was done to coincide with the Ursa Major grid located to the north of the Stumpy Bay Property for right angle orientation across geological structures, interpretation of the geophysical results and possible future work in conjunction with Ursa Major Minerals.
8
Figure 4: Location of the Stumpy Bay Grid overlain on Aerial Photograph
M Property GeMtfiysical Grid LoXIIRSA MAJORCi^i.PGM
Mtfi-
ScalL3W A l W LIE L3E L5E L7E
Not to Scale (for reference only)
Note:Red Lines = Geophysical GridGrid Lines (a: 200 foot spacings with 100 foot stationsLines oriented at 3340Baseline oriented (a-. 0640(approx. 22S at common corner with Patent #35609)
Pink Lines ^ E/W A N/S Boundary Lines with Mining Patent #35609 Blue Lines = Stumpy Bay Claim Line Boundaries

Geophysics con't:
i) Magnetometer Survey (M. Turcott Supervisor; Feb. 9 A 10,2003)
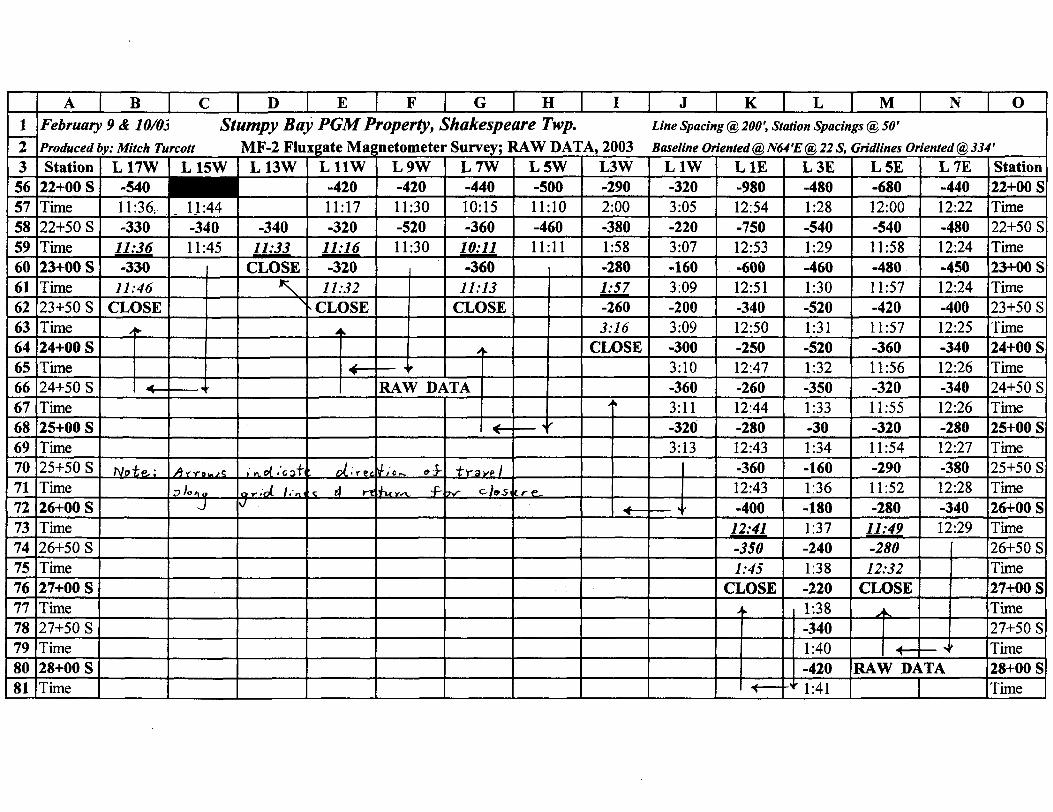
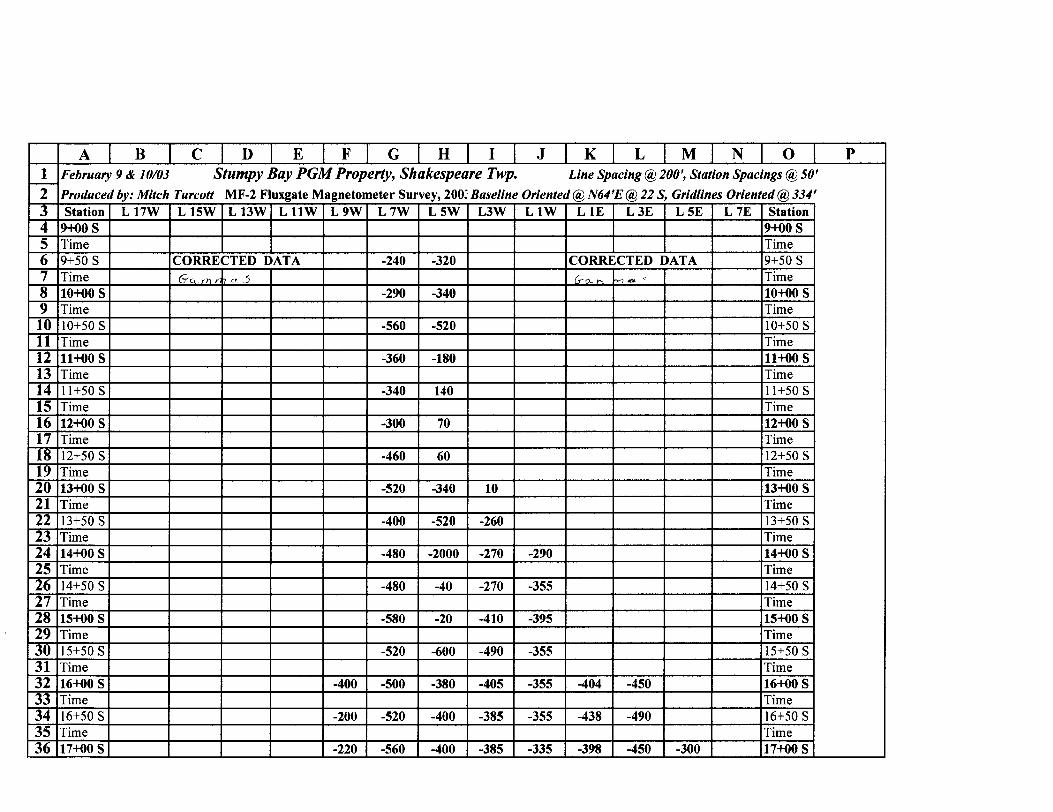
The instrument used for the magnetometer survey was a Scintrex Ltd. MF-2 Fluxgate Magnetometer which measures the vertical component of the earth's magnetic field. Readings are in Gammas with an accuracy of+l- 15 Gammas (Appendix 3 for instrument information).
Map 2 is a vertical field magnetic contour map, representative of data collected from the 5.2 km Stumpy Bay Property grid in February of 2003 from the northern portion of the property (Map 1). Stations were read every 50 feet and lines were spaced every 200 feet & oriented @ 3340 . All magnetic data has been corrected for drift (Appendix l, RAW DATA Sheets).To make all of the station readings positive, 2000 Gammas were added to every station. The magnetic background of the surveyed area is approximately -500 to -450 gammas (l 500-1550, Map 2).
Contour intervals based on 200 Gamma increments were used to visually interpret the magnetic data. Several magnetic anomalies with a strong positive relief and an east/west trending orientation were defined using the contour method. The most extensive anomaly occurs from line 9W, 16S to L3E, 27S and is coincident with a moderately strong VLF conductor (Map 2). This area is predominantly within the marsh area of the Stumpy Bay Property with little or no outcrop exposure (Map 1).
There is also a strong positive magnetic anomaly with flanking negative magnetic anomalies in the NW portion of the grid from L7W, 11S to L3 W, 16S. A VLF conductor is coincident with this magnetic high on L5W *fe L7W @ 12S and may represent a PGM + sulphide body similar to the mineralization discovered by Ursa Major Minerals immediately to the north of this location (Maps 1& 2).
ii) VLF (EM-16) Electromagnetic Response Survey (M. Turcott Operator; Feb. 9,10 A 21, 2003)
The instrument used for the electromagnetic survey was a Geonics Ltd. EM-16 (Appendix 4 for instrument information). The EM-16 VLF method uses military and time standard VLF transmissions as the primary field. The receiver (EM-16) is then used to measure the secondary fields radiating from local conductive targets. Readings are in percent CM)) In Phase (I/P) and percent (07o) Out of Phase (O/P or Quadrature).
Map 3 is a VLF electromagnetic profile map, representative of data collected from the 5.2 km Stumpy Bay Property grid in February of 2003 from the northern portion of the property (Map 1). Stations were read every 50 feet, lines were spaced every 200 feet *fe oriented @ 3340 . All readings were taken facing NW and the military transmission station Annapolis, Maryland (NSS) with a frequency of 21.4 kHz was used. Individual VLF Response Profiles and VLF data collected during the survey is included in Appendix 2.

10
VLF (EM-16) Electromagnetic Response con't:
Several VLF conductors with an E/W trend were defined using the EM-16 method to survey the Stumpy Bay grid (Maps 2 &3J. The most extensive conductor occurs from L3E, 27S to L17W, 20+50S. The strong positive Out of Phase or Quadrature response to this conductor suggests that there is conductive overburden present, however, the strong positive magnetic correlation with this conductor suggests that a sulphide body is likely present below the conductive overburden (Maps 2, 3 *fe Appendix 2). The dip of the conductor is likely to the north. The grid lines need to be extended further south to facilitate the collection of more VLF data to generate a more complete VLF response profile.
Several dislocations and interruptions of the conductor axis suggest that faulting or folding may have displaced the conductor. There is good geological evidence for regional drag folding, thrust faulting and other tectonic events in the area to support this interpretation.
There is also a weak VLF conductor with a coincident magnetic high from L5W, 12S to L7W, 11+50S and L7W, 10S (Maps 2 Se 3). The orientation of this conductor axis is approximately E/W with a northerly dip and is similar to the PGM + sulphide (Cu,Ni) mineralization trend outlined by Ursa Major Minerals immediately to the north of this location.

11
Conclusion A Recommendations:
The Stumpy Bay Property warrants further exploration. The property contains favourable intrusive and sedimentary lithologies which have the potential to host significant PGM and base metal mineralization. The demand for precious metals and in particular palladium and platinum metals for various industrial applications and modern technological advances will outstrip supply in the very near future.
Exploration for economic PGM deposits within Northern Ontario has resulted in significant discoveries, particularly the Ursa Major Minerals *fe Falconbridge Ltd. joint venture in Shakespeare Twp. Ursa Major Minerals has recently announced significant diamond drill intersections ^60 meters) of nickel A copper sulphides plus precious metals (PGM's) from their Shakespeare Property option. The Stumpy Bay Property is the footwall of the Cu/Ni/PGM deposit being explored by Ursa Major Minerals. Stumpy Bay is located less than V* mile to the southeast of this newly discovered mineralization, making it an attractive exploration target.
VLF and magnetic geophysical surveys conducted over the northern area of the Stumpy Bay Property in February of 2003 have defined several anomalies likely associated with sulphide mineralization. The trend of VLF conductors identified on the property during the survey is similar to the strike of the PGM + sulphide (Ni, Cu) mineralization discovered by Ursa Major Minerals. Several dislocations and interruptions of the conductor axis suggest that faulting or folding may have displaced the conductor. Further ground geophysics, soil sampling and diamond drilling are required to determine their orientation and possible economic significance.
Further exploration should also be conducted within the Huronian sediments to locate base & precious metal mineralization and to determine the viability of mining the highly siliceous sediments for silica flux in local smelters.
The Porter Syncline could be an excellent structural target for PGE mineralization. Recent exploration of Nipissing age intrusive rocks in Shakespeare, Dunlop and Porter Townships has shown that there is good potential for economic mineralization to occur.

12
References
Bennett, G., Dressler, B.O. and Robertson, J.A., 1992. In Geology of Ontario: P.C. Thurston, H.R. Williams, R.H. Sutcliffe and G.M. Stott (ed.). Ontario Geological Survey, Special Volume 4, Part l, p.566-591.
Brunne, D.A., 1999, OPAP Report, PGE Mineralization, Big Swan Property, Porter Twp.: Assessment File, Ministry of Northern Development and Mines.
Card, K.D., 1978, Geology of the Sudbury-Manitoulin Area Districts of Sudbury and Manitoulin: Ontario Geological Survey, Report 166, p.132-145, 212-215.
Card, K.D., Innes, D.G., and Debicki, R.L., 1977, Stratigraphy, Sedimentology and Petrology of the Huronian Supergroup in the Sudbury-Espanola Area: Geoscience Study 16, p. 12-46.
Card, K.D. and Palonen, P.A., 1976, Geology of the Dunlop-Shakespeare Area, District of Sudbury: Geoscience Report 139.
Conrod, D.M., 1989, Petrology and Geochemistry of the Duncan Lake, Beaton Bay, Milner Lake, and Miller Lake Nipissing Intrusions within the Gowganda Area: Ontario Geological Survey, Open File Report 5701.
Ginn, R.M., 1961, Geology of Porter Township: Geological Report No. 5, Ontario Department of Mines.
Hawke, D.R., 1998, Work Report -1998 Program, Bye Claim, Dunlop Township: Assessment Files, Ministry of Northern Development and Mines.
Koziol, M., Chubb, P., 1985, Technical Report on the Big Swan Property: Cameco Gold, OGS Assessment Files.
Lewis, C.L., 1949, A Sulphide Bearing Quartz Diorite Intrusive in Shakespeare Township Ontario: Falconbridge Exploration Ltd.
Lightfoot, P.C. and Naldrett, A.J., 1996, Petrology and Geochemistry of the Nipissing Gabbro: Exploration Strategies for Nickel, Copper and Platinum Group Elements in a Large Igneous Province: Ontario Geological Survey Study 58.
Turcott, M.B., 1998, Au-in-Skarn mineralization in the Paleoproterozoic, Big Swan Property, Porter Twp.: BSc. Thesis, Department of Earth Science, Laurentian University, Sudbury, Ontario.
Wyslouzil, D.M. A Buchan, R., 1985, Petrographic Study of the Shakespeare Township Cu-Ni-PGE Deposit: Falconbridge Exploration Ltd.

13
Certification
I, Mitchell B. Turcott do hereby certify the following:
1) I am a licensed prospector in the province of Ontario residing at Box 338, Webbwood, Ontario.
2) I have worked as a contract geologist since 1979.
3) I graduated from Cambrian College in 1981 with a Geological Technician Diploma and from Laurentian University in 1999 with an Hons. B. Se. Geology Specialization Degree.
4) I am a member of the Prospectors and Developers Association and the Geological Association of Canada.
5) This report is based on the references cited plus my personal knowledge and experience.
M.B. Turcott
Box 338Webbwood, Ont. POP-2GO (705) 869-1984

Appendix l MF-2 Fluxgate Magnetometer Raw Data

1234567891011121314151617181920212223242526272829
A B C D E F G H I J K L M N OFebruary 9 A 10/03 Stumpy Bay PGM Property, Shakespeare Twp. Line Spacing @ 200', Station Spacing* @ 50' Produced by: Mitch Turcott MF-2 Fluxgate Magnetometer Survey; RAW DATA, 2003 Baseline Oriented @N64'E@ 22 S, Gridlines Oriented@334'Station
9+00 STime9+50 STime10+00 STime10+50 STime11+00 STime11+50 STime12+00 STime12+50 STime13+00 STime13+50 STime14+00 STime14+50 STime15+00 STime
L17W L15W L13W
RAW DATA
RAW DATA
RAW DATA
L HW L9W L7W
-240
10:40-290
10:39-56010:38-360
10:37-34010:36-30010:35-46010:34-52010:33-40010:32-480
10:31-48010:30-580
10:29
L5W
-32010:45-340
10:46-52010:47-18010:47140
10:4970
10:5160
10:53-340
10:54-52010:55-200010:56-40
10:57-20
10:59
L3W
202:36-250
2:35-260
2:34-260
2:34-4002:32
L1W
-280
2:44-3402:47-3802:47
LIE L3E
RAW DATA
RAW DATA
RAW DATA
L SE L7E Station9+00 STime9+50 STime10+00 STime10+50 STime11+00 STime11+50 STime12+00 STime12+50 STime13+00 STime13+50 STime14+00 STime14+50 STime15+00 STime

123
3031323334353637383940414243444546474849505152535455
A B C D E F G H I J K L M N OFebruary 9 A 10/03 Stumpy Bay PGM Property, Shakespeare Twp. Line Spacing @ 200', station Spacing* @ 50'Produced by: Mitch Turcott MF-2 Fluxgate Magnetometer Survey; RAW DATA, 2003 Baseline Oriented @ N64 'E @ 22 S, Gridlines Oriented @ 334 'Station15+50 STime16+00 STime16+50 STime17+00 STime17+50 STime18+00 STime18+50 STime19+00 STime19+50 STime20+00 STime20+50 STime21+00 STime21+50 STime
L17W
l
E/W-48011:39-53011:38-32011:37-40011:37
L15W L13W
RAW DATA
RAW DATA
E/W-39011:42-50011:43-44011:44
L HW
-24011:19-14011:19-24011:18-44011:18-38011:18
L9W
-40011:23-20011:23-22011:24-12011:25-10011:26-14011:27-28011:27-14011:28-14011:28-32011:29-40011:29-50011:30
L7W-52010:29-50010:28-52010:27-56010:26-54010:25-64010:25-60010:24-70010:24-48010:23-40010:23-36010:22-46010:22-42010:15
L5W-60011:00-38011:01-40011:02-40011:03-38011:04-48011:04-60
11:05160
11:06270011:06-92011:08-54011:09-52011:09-50011:10
L3W-4802:30-4002;29-3802:29-3802:28-3202:08-3052:08-3202:06-4002:06-5202:052202:031002:021802:0160
2:00
L1W-3402:49-3402:51-3402:51-3202:53-3002:54-2902:55-4502:57-2402:58-2402:59-4003:00-380
3:01-4203:02-480
3:04
LIE
-3801:06-4201:06-3801:05-3801:04-3201:03-3801:02-4001:01-6001:00-26012:59
2012:57320
12:56-72012:55
L3E
-420
1:16-4601:17-4201:19-4001:20-3801:21-5601:22-4001:22-4601:23-4201:24-4201:25-3801:26-5401:27
L SE
-30012:10-40012:09-45012:09-45012:07-40012:07-44012:06-42012:05-42012:05-60
12:02-50012:01
L7E
-38012:14-32012:15-30012:16-36012:17-32012:19-32012:20-34012:20-54012:21
Station15+50 STime16+00 STime16+50 STime17+00 STime17+50 STime18+00 STime18+50 STime19+00 STime19+50 STime20+00 STime20+50 STime21+00 STime21+50 STime
123
5657585960616263646566676869707172737475767778798081
A BFebruary 9 &
C10/05
Produced by: Mitch TurcottStation
22+00 STime22+50 STime23+00 STime23+50 STime24+00 STime24+50 STime25+00 STime25+50 STime26+00 STime26+50 STime27+00 STime27+50 STime28+00 STime
L17W
D E F G H I J K L M N 0Stumpy Bay PGM Property, Shakespeare Twp. Line Spacing @ 200', station Spadngs @ 50'
MF-2 Fluxgate Magnetometer Survey; RAW DATA, 2003 Baseline Oriented @N64'E® 22 S, Gridlines Oriented @334'L15W L13W
-540 ^^^H11:36,-330
11. 36-330
11. 46CLOSE
y t-
^
Note,:
11:44-34011:45
Aw^,tP lo t\ o
-sj
-34011:33
CLOSE*\
N
i ' n. ot .6 a "fi
r-^ /--vs/
L HW-42011:17-320
11:16-320
11:32CLOSE
1 1
4—
oL; r *c.Q d ft
L9W-42011 :30-52011
~. i
:30
f
L7W-44010: 15-360
10:11-360
11:13CLOSE
^
RAW DATA
f/'e^ o^-
fw,~v -f-
h
*-
fra y f 1rs 0/0.51
L5W-50011:10-46011:11
^ ^
If^,
L3W-2902:00-3801.58-2801:57-2603:1 6
CLOSE
4 i
4 —
L1W-3203:05-2203:07-1603:09-2003:09-3003: 10-3603: 11-3203:
*
13
LIE-98012:54-75012:53-60012:51-34012:50-25012:47-26012:44-28012:43-36012:43-400
12:41-3501 :45
CLOSEb
^
L3E-4801:28-5401:29-4601:30-5201:31-5201:32-3501:33-301:34-1601:36-1801:37-2401:38-2201:38-3401:40-420
-* 1:41
L5E-68012:00-54011:58-480
11:57-42011:57-36011:56-32011:55-32011:54-29011:52-280
11:49-28012:32
CLOSEA
T1 4
L 7E-44012:22-48012:24-45012:24-40012:25-34012:26-34012:26-28012:27-38012:28-34012:29
- -^
RAW DATA
Station22+00 STime22+50 STime23+00 STime23+50 STime24+00 STime24+50 STime25+00 STime25+50 STime26+00 STime26+50 STime27+00 STime27+50 STime28+00 STime
123456789101112131415161718192021222324252627282930313233343536
A B C D E F G H I J K L M N OFebruary 9 *fc 10/03 Stumpy Bay PGM Property, Shakespeare Twp. Line Spacing @ 200', Station Spacings @ 50
Pt
Produced by: Mitch Turcott MF-2 Fluxgate Magnetometer Survey, 200; Baseline Oriented @ N64 'E @ 22 S, Gridlines Oriented @ 334 'Station
9+00 STime9+50 STime10400 STime10+50 STime11+00 STime11+50 STime12+00 STime12+50 STime13+00 STime13+50 STime14+00 STime14+50 STime15+00 STime15+50 STime16+00 STime16+50 STime17+00 S
L17W L15W L13W L nw
CORRECTED DATAG'Ci.rn r , ci 5
L9W
-400
-200
-220
L7W
-240
-290
-560
-360
-340
-300
-460
-520
-400
-480
-480
-580
-520
-500
-520
-560
L5W
-320
-340
-520
-180
140
70
60
-340
-520
-2000
-40
-20
-600
-380
-400
-400
L3W
10
-260
-270
-270
-410
-490
-405
-385
-385
L1W
-290
-355
-395
-355
-355
-355
-335
LIE L3E L5E
CORRECTED DATA6-0- r,
-404
-438
-398
v? *!f *-
-450
-490
-450 -300
L7E Station9+00 STime9+50 STime10+00 STime10+50 STime11+00 STime11+50 STime12+00 STime12+50 STime13+00 STime13+50 STime14+00 STime14+50 STime15+00 STime15+50 STime16+00 STime16+50 STime17+00 S

123
373839404142434445464748495051525354555657585960616263646566676869
A B C D E F G H I J K L M N OFebruary 9 A 10/03 Stumpy Bay PGM Property, Shakespeare Twp. Line Spacing @ 200', Station Spacings @ 50
Pr
Produced by: Mitch Turcott MF-2 Fluxgate Magnetometer Survey, 200; Baseline Oriented @ N64 'E @ 22 S, Gridlines Oriented @ 334 'Station
Time17+50 STime18+00 STime18+50 STime19+00 STime19+50 STime20+00 STime20+50 STime21+00 STime21+50 STime22+00 STime22+50 STime23+00 STime23+50 STime24+00 STime24+50 STime25+00 STime
L17W
E/W-480
-530
-320
-400
-540
-330
L15W
E/W-390
-500
-440
-280
-340
L13W
-340
L nw
-240
-140
-240
-440
-380
-420
-320
L9W
-120
-100
-140
-280
-140
-140
-320
-400
-500
-420
-520
L7W
-540
-640
-600
-700
-480
-400
-360
-460
-420
-440
-360
L5W
-380
-480
-60
160
2700
-920
-540
-520
-500
-500
-460
L3W
-320
-305
-320
-400
-520
220
100
180
60
-290
-380
-280
L1W
-315
-305
-465
-255
-255
-415
-395
-440
-500
-340
-240
-180
-220
-320
-380
-340
LIE
-398
-338
-398
-418
-618
-278
8
308
-732
-992
-762
-612
-346
-256
-266
-286
L3E
-430
-410
-590
-436
-496
-456
-456
-416
-576
-516
-576
-496
-562
-562
-392
-72
L SE
-400
-450
-450
-400
-440
-420
-420
-60
-500
-680
-540
-480
-420
-360
-320
-320
L7E
-380
-320
-300
-360
-320
-320
-340
-540
-440
-480
-450
-400
-340
-340
-280
StationTime17+50 STime18+00 STime18+50 STime19+00 STime19+50 STime20+00 STime20+50 STime21+00 STime21+50 STime22+00 STime22+50 STime23+00 STime23+50 STime24+00 STime24+50 STime25+00 STime

12370717273747576777879808182838485868788
A B C D E F G H I J K L M N O PFebruary 9 A 10/03 Stumpy Bay PGM Property, Shakespeare Twp. Line Spacing @ 200', Station Spacings @ 50'Produced by: Mitch Turcott MF-2 Fluxgate Magnetometer Survey, 200; Baseline Oriented @ N64 'E @ 22 S, Gridlines Oriented @ 334Station
25+50 STime26+00 STime26+50 STime27+00 STime27+50 STime28+00 STime28+50 STime29+00 STime29+50 STime30+00 S
L17W L15W LOW L HW L9W L7W L5W L3W L1W LIE-366
-400
L3E-202
-222
-282
-262
-388
-468
L SE-290
-280
L7E-380
-340
Station25+50 STime26+00 STime26+50 STime27+00 STime27+50 STime28+00 STime28+50 STime29+00 STime29+50 STime30+00 S
f

Stumpy Bay PGM Property Vertical Field Component Magnetic Contour Map
Shakespeare Twp., Sudbury Mining District M. Turcott, February/2003
Vertical Field Magnetic Contour Map: Stumpy Bay PGM Property, Shakespeare Twp., Sudbury District
VLF Conductor Am
H. Tunxtt,
NOTE:This magnetic contour map is representative of data collected from the Stumpy Bay Property in February of 2003 from the northern portion of the property (Map l, 2002 Assessment Report). Stations were read every 50 feet and lines were spaced every 200 feet A oriented @ 3340.
The instrument used for the survey was a Scintrex Ltd. MF-2 Fluxgate Magnetometer which measures the vertical component of the earth's magnetic fleld. Readings are in Gammas with an accuracy of +J- 15 Gammas.
All magnetic data has been corrected for drift (see RAW DATA Sheets).To make all of the station readings positive, 2000 Gammas have been added to every station.
Contouring is based on 200 Gamma intervals.
Appendix 2 VLF (EM-16) Response Profiles Si Data

1234567891011121314151617181920212223242526272829303132333435"3637383940414243
A B C DEJFGH I J K LStumpy Bay PGM Property, Shakespeare Twp. Line Spacing @ 200', station spacing* @ so' facing NWProduced by: Mitch Turcott
Station9+00 S9+50 S10+00 S10+50 S11+00 S11+50 S12+00 S12+50 S13+00 S13+50 S14+00 S14+50 S15+00 S15+50 S16+00 S16+50 S17+00 S17+50 S18+00 S18+50 S19+00 S19+50 S20+00 S20+50 S21+00 S21+50 S22+00 S22+50 S23+00 S23+50 S24+00 S24+50 S25+00 S25+50 S26WSS26+50 S27+00 S27+50 S28+00 S28+50 S
L7EI/P
-25 -30-30-35-35-50-45-50-50-50-50-65-55-55
:::.-45-35
:;afe30 vi-
L 7E O/P
10101410122416141816101888
1414
..-'..12--
EM- 16 YLF Survey Data, 2003 Baseline Oriented @, N64'E @ 22 S, Gridlines Oriented , 334' Military Station Used = Annapolis, Maryland (NSS)
I/P = In Phase Component "/o O/P = Oi;!t of Phase Comoonent "/o
1 1 ; : '-26 s L ^E VLF Profile 18S,-r*;; - 10 \3 —— jf *" ~*r^^~^~* —— *,;--fr-. ——————————————————————————————————— 'L7E '
' 1 1 s)i l - l U IM : - '-s- In Phasei! ---20: i! j ( ' JA —t— Out of Phase ;. . *}f\ m -^f^ i' j i! Ik--' 1'-' 33 —— Ir\\ ^fi m ar^ | : :i i i -4(K /' i : ;1 ! l ! X ^ ,' '' ' - SO' X ^ ^ T ^r"^ ^~* 'M -" ; H..^ r ~ ' ~ \\ \ i .60 \ -''! ' i ' "3 !i i L ,7.(1 . . — ............... . .... . ......... .Ji ! i :' ; : Not to Scale, for Reference Only ! ] ;i ' : ' '
i i f i' i '
M '

123456789101112131415161718192021222324252627is293031323334353637383940414243
A B C D E F G H I J K LStumpy Bay PGM Property, Shakespeare Twp. Line Spacing @, 200', Station Spacing* @ SO' facing NWProduced by: Mitch Turcott
Station9+00 S9+50 S10+00 S10+50 S11+00 S11+50 S12+00 S12+50 S13+00 S13+50 S14+00 S14+50 S15+00 S15+50 S16+00 S16+50 S17+00 S17+50 S18+00 S18+50 S19+00 S19+50 S20+00 S20+50 S21+00 S21+50 S22+00 S22+50 S23+00 S23+50 S24+00 S24+50 S25+00 S25+50 S26+00 S26+50 S27+00 S27+50 S28+00 S28+50 S
L5EI/P
-20-30-30-30-30-30-30-40-50-50-60-50-50-50-30-25-15-10*io
L 5E O'/Pi:
? i
i
,
8101420101618210 !!212 i10122020' -i30 ;30 \32. 132f j
li j
i \ l
EM-16 VLF Survey Data, 2003 Baseline Oriented (a) N64'E@ 22 S, Gridlines Oriented 334' Military Station Used = Annapolis, Maryland (NSS)
HP = In Phase Component "/o O/P = Out of Phase Component "/o Not to Scale, for Reference Only
i i ! '
26S t SE VT.F Profile '17S'
**^~* -^ 30 f"**-* \ ! ^
' ; V* - 2QL. * /' VA fts r- 1 .- -^ ' x rt /\' ' ^^v"1-^* l/b v "S. ' *~*^-*~* f V f
!\/ * \/ ; ——— -' . , v : \-i J L^
.a-a - -10 ^-fl !1 , ^ f N, 1 ————————————————————
: - \ 1 .20 -i \ l!-1^- In Phase: a i /hi i ii i Na -4- -T0a-a-*W Ni ..jua^m^ -*~ Out of Phase
: \ ; 7 \ ' 'i j \ -^40 \ a i
.-i, i- .s -s- i *;n -.. - * — -! - 'v ,- -^ ' ' x /" '
L.........™.y-!-^n-. - - . - -.-—V.. Ji !
i Not to Scale, for Reference Only i : ;i i

12345678910li121314151617181920212223242526272829303132334435363?383*)40414243
A B C DEFGH I J K LStumpy Bay PGM Property, Shakespeare Twp. Line Spacing @ w, station Spacing* @ so 1 facing NWProduced by: Mitch Turcott
Station9+00 S9+50 S10+00 S10+50 S11+00 S11+50 S12+00 S12+50 S13+00 S13+50 S14+00 S14+50 S15+00 S15+50 S16+00 S16+50 S17+00 S17+50 S18+00 S18+50 S19+00 S19+50 S20+00 S20+50 S21+00 S2 1+50 S22+00 S22+50 S23+00 S23+50 S24*0ftS2S24+30S""
25+50 S w26+00 SS26450 S 'Vr27+00 S27+50 S28+00 S28+50 S
L3EI/P
-12-15-15-18-25-25-25-28-35-40-40-50-55-65-70-65
•T*^3g !*~"
^ff'.flS ."'~.~apEtjarHmafc
y^O ' :
...-,'4 . -.66 .-'-
5
L3EO/P
101414131111121214H1010128914
s*afiJ-^"""22OTtf-±- t ,vl81SSI02A
6,,.,,2 -
-4-10-8
EM-16 VLF Survey Data, 2003 Baseline Oriented ajN64'E (w, 22 S, Gridlines Oriented (y 334' Military Station Vted = Annapolis, Maryland (XSS)
1^ = 111 Phase Component "/o ; O/P = Out of Phase Component "/o i
li ' '
128+50 s i L 3E VLF Profile lias.: "nr JU - ••'-' "- - . ...— -.-.— .-. -. — -...,—..,,.. ————
jf-*-*-,*'^ v-^r' * * '- 0 ~/***^ ———————————————————— ' ————————— 'L 3E '
if a*-^5 \\— -^31 "' \ ' -a^*-**^ — *— Ir; Phase 't -20 \ : , ^ :i
1 1 -r-*-*-* |!-*- Out of Phase!t-30 \ ^ :r -40 \ a-^ ! ;l \ X i! -' t -5o \ ^ i' ii -60
i | ™ ^x^3 : i 1 -70 ————————————— -5*1- ——————————— ' ——————— - -Ji
[Not to Scale, for Reference Only j ; |1 ——————————————————————————— . ' ————————————————— '
i ! ; j j i
J i : j ii i 'i M; i

123456789
10111213141516171819202122232425262728293031323334353637383940414243
A B C DEFGH I J K LStumpy Bay PGM Property, Shakespeare Twp. Line Spacing ® 200', station Spacing* @. so 1 facing NWProduced by: Mitch Turcott
Station9400 S9+50 S10+00 S10+50 S11+00 S1 1+50 S12+00 S12+50 S13+00 S13+50 S14+00 S14+50 S15+00 S15+50 S16+00 S16+50 S17+00 S17+50 S18+00 S18oOS19+00 S19+50 S20+00 S20+50 S21+00 S2 1+50 S22+00 S22+50 S23+00 S23+50 S24400 S24+50 S25400 S25+50 S26400 S26+50 S27+00 S27+50 S28+00 S28+50 S
L1EI/P
-14-17-20-20-25-30-30-40-40-45-55-60-72-80-75-54-42-25-1025
L1EO/P
810101212181412121212106661416166-211
EM-16 VLF Survey Data, 2003 Baseline Oriented® N64'E@ 22 S, Gridlines Or : ?nted@ 334' Military Station Used = Annapolis, Maryland (MS S)
I/P = In Phase Component "/o ; O/P = Out of Phase Component Yo i
l '
M26S: L IE VLF Profile lies; :!i "lA !
1 ^ ' ' "" A. '
1 -- 10 \ y \ JT* * * *^* V^*-^4six j* * — 5—e \1 -f, *^S - T ipu #. i ,L lh
'---10 \11 \ ^-aOn \ m r*^**!i 1 ~r ."-s- In PV.se :
: r -30 \ 't-*' !l \ 7 '\-*~ Out c f Phase: -40 \ ^ -— - - -
^-50 \ f :a -?; ; - - -60 \ JT
; -r A '- ' :. , - ' }J ' * : qn ^^V
~ O w -J
! ! i Not to Scale, for Reference Only ; :i '"-" " '" ' . i ;i . .
i
i i
! f j
^ 1

12345678910111213141516171819202122232425262728293031323334353637383940414243
A B C DEFGHll J K LStumpy Bay PGM Property, Shakespeare Twp. Line Spacing @. 200', Station Spadngs @ SO' facing NWProduced by: Mitch Turcott
Station9+00 S9+50 S10+00 S10+50 S11+00 S^j11+50 S12+00 S12+50 S13+00 S13+50 S14+00 S14+50 S15+00 S15+50 S16+00 S16+50 S17+00 S17+50 S18+00 S18+50 S19+00 S19+50 S20+00 S20^50 S21+00 S21+50 S22+00 S22+50 S23+00 S23+50 S24+00 S24+50 S25+00 S25+50 S26+00 S26+50 S27+00 S27+50 S28+00 S28+50 S
L1WI/Pl
\
\
ii•*
i
n~-?9
ilO-i!3-:is-:jo-22-27-30-35-40-42-45-55-60-70-63-50-32-20-6 ,6 i12 '
'
ii!
L1WO/P
101078
1014141312161610103646141660-8
-12
EM- 1 6 VLF Survey Data, 2003 Baseline Oriented @ N64 'E @ 22 S, Gridlines Oriented @ 334 ' Military Station Used = Annapolis, Maryland (NSS)
IIP = In Phase Component "/o O/P = Out of Phase Component 07o
l; ' :!! 25 s L 1 W VLF Profile jws:ii "i i on : 'i *- v ' ;
1! i ^^ ——————————————————————————————— ;L1W :H vA k\^\ ^^i-*""*"' '.'' J- -20 Vi ^?r ' ] - .-i~ T^ t)U i;;p : -
l:- -30 \ x^^^ ::-^ Out of Phase!
|r -Hu \ ^:;-.50 ^ ^
- -60 ' r',: i -.; ' ' ' " ;! ! ! Not to Scale, for Reference Onlv i ' ji ! !

12345678910111213141516171819202122232425262728293031323334353637383940414243
A B C DEFGH I J K LStumpy Bay PGM Property, Shakespeare Twp. Line Spacing @. 200', station Spacing* @ so 1 facing NWProduced by: Mitch Tui'cott
Station9+00 S9+50 S10+00 S10+50 S11+00 S1 1+50 S12+00 S12+50 S13+00 S13+50 S14+00 S14+50 S15+00 S15+50 S16+00 S16+50 S17+00 S17+50 S18+00 S18+50 S19+00 S19+50 S20+00 S20-^50 S21+00 S21+50 S22+00 S22+50 S23+00 S23+50 S24+00 S24+50 S25+00 S25+50 S26+00 S26+50 S27+00 S27+50 S28+00 S28+50 S
L 3W I/P
-11-16-20-20-27-24-30-28-30-3
-40-50-60-60-65-89-80-40-2-62
L3WO/P1'
ii.|;
ii(
-Ji ;
i,
' 6866891210
1 ' 12141214
, 88140
1014110
, i -21
. j
- :
l' 1
jj^
i i1 i
i
1 l il
EM-16 VLF Survey Data. 2003 Baseline Oriented® N64'E@ 22 S, Gridlines Oriented® 334' Military Station Used = Annapolis, Maryland (NSS)
I/P = In Phase Component "/o O/P ^ Out of Phase Component "/o
i i ; ili 1!
i'[23isj L 3W VLF Profile |13S 'i j ! ii l on - ' 'r 1 , ^\J . - - - - - .- -.!
f~ i ^*k /^"^^ — ̂ ~ ^^ "*~^*r^*^*~-*~- ̂ —*r--*— -A [ !J ^^^^ - * ' 'T -^TTT ' '
! ^^1 ' A . - ~ ii i . A \ /\ *^*-- -20 \ f \ j*—*r1 \ l ' :~5- In Phase !:
4- -40 *; 3 ; : ! \ ^' l—*- Out of Phase:;\ ^ r ~- xi ~" -oO \ ^,:- --s : i
\ \ -^\ r '
: : ^-80 K ''
• i i i or)
1 1 ;Not to Scale, for Reference Only i i i!l ' ' i!

1234567891011121314151617181920212223242526272829303132333435363"!
M3i)40414243
A B c DEFGH I|J K LStumpy Bay PGM Property, Shakespeare Twp. Line Spacing @ 200', station Spadngs @ so 1 facing NWProduced by: Mitck Turcott
Station9400 S9+50 S10+00 S10+50 S11+00 S1 1+50 S12+00 S12+50 S13+00 S13+50 S14+00 S14+50 S15+00 S15+50 S16+00 S16+50 S17+00 S17+50 S18+00 S18+50 S19+00 S19+50 S20+00 S20+50 S21+00 S21+50 S22+00 S22+50 S23*80 S^23+50 S24+00 S-24+50 S 1asisffss(25*50-8*
26+50 S27+00 S27+50 S28+00 S-28+50 S
L 5VV I/J'i
15 ,:1012 li50 i0-2 ;.-4-8
-10-15-23 ,-25 ;-25-30-35-50-50. j
- -43 \ \-45-43-40h-~2Ti'-15
- -5 I '0 ,—: -.4
^— 4-
ii^i:,::,'., -. ' ..v^.Cf. .-.-. '. -j
^
i-^—n
L 5\V O/P
52404447
12111610141414141416201617169400
../......:.. .
.... ^. ,. . .-u. ..,
ji
i i
EM-16 VLF Survey Data, 2003 Baseline Oriented @N64 'E® 22 S, Gridlines Oriented @ 334' Military Station Used = Annapolis, Maryland (NSS)
I/P - In Phase Component "/,, O/P = Out of Phase Comnonent "/0
^22^20, 5 i ^w vi f Profile ios1 1
!T-20 ————— : — -*- ————————————————————————— ; ?~ f ^^^^ . ,-\. X :i
r- 10 7 ^ ̂A. /VT :;x ^*-^/^: i j^ ' -'
t i "^^A ^p^^^ i 1 i '
Ip' 1^ ̂: V^ !'-*-InPhase ! ji ' k; ,- a^ n iij .. 9o\ ' 7 !!-*- Out of Phase]!
™ \ W . tl l| l
II k w-*-3 i i!' -L -30 \ -^ i i !l \ /"-40 ^ , ,' ; r! i ^•"J" 'x l ;:
1 50 \J J ' Mii i'H , ————————————————————— n
1 ; Not to Scale, for Reference Only ! !!i II
j

12345678910111213141516171819202122232425262728293031323334353637383946414243
A B C DEFGH I J K LStumpy Bay PGM Property, Shakespeare Twp. Line Spacing @ 200', station Spacing* @ so 1 facing NWProduced by: Mitch Turcott
Station9+00 S9+50 S10+00 S10+50 S11+00 S11+50 S12+00 S12+50 S13+00 S13+50 S14+00 S14+50 S15+00 S15+50 S16+00 S16+50 S17+00 S17+50 S18+00 S18+50 S19+00 S19+50 S20+00 S20+50 S21+00 S21+50 S22+00 S22+20 S23+00 S23+50 S24+00 S24+50 S25*00525+50 S2fr*OOSi26+50 S27+00 S27+50 S28+00 S28+50 S
L7WI/P
106
-10-10-5002-4-7-20-30-30-35-40-60-30-35-50-75-80-54-28-15-100-*o
. . .
,.;i:.i;;-::':.:,-.
L7WO/P
0-20-6-2415181881684512412884861043-4-6
EM-16 VLF Survey Data, 2003 Baseline Oriented (w N64' E (y 22 S, Gridlines tinented (y 334' Military Station Used = Annapolis, Maryland (*SS)
I/P = In Phase Component "/u . O/P = Out of Phase Component "/o \
1 i
JH22+20S' L 7W VLF Profile 9+sos^AHr'r-rO- ..-.— ~...,~ . ...- ^ ......,
*-ljfT^ ^^^ V V-V" ^ \, -i^-L T -V! | 3^v , - ^-psryz* L /Wlirfvo r^ ^u
! i i V f ' — ̂ — In '?Hase: ' T -30 ^ ^ J*Vi|| \ if \ jr : — *— Out of Phase ! 1 1 4- -40 \ 7 \ F ——————————
i \ \ / \ f i i 4- -50 \ d \ iH |,o T 7 Y !,iiii.70 \ .'M i o 0 \^ ' ;. i "-SU ' 13 """ ' •••~ " •""j —————————————————————— !!
| j |Not to Scale, for Reference Only ; . ; ,1 !1 I'M
i i
l ili jr i i 1 j
if !

12i45678910li
i 1213141516171819202122232425262728293031323334353637383940414243
A B c D E F G H I J K LStumpy Bay PGM Property, Shakespeare Twp. Line Spacing (a 200 ', Station Spacing* @ SO 'facing NWProduced by: Mitch Turcott
Station9+00 S9+50 S10+00 S10+50 S11+00 S11+50 S12+00 S12+50 S1 3+00 S13-50 S14+00 S14+50 S15+00 S15^50 S16+00 S16oOS17+00 S17+50 S18+00 S18+50 S19+00 S19+50 S20+00 S20+50 S21+00 S2 1+50 S22+00 S22+20 S23+00 S23+50 S24+00 S24+50 S25+00 S25+50 S26+00 S26+50 S27+00 S27+50 S28+00 S28-50 S
L9WI/P L 9W O/P
i
EM-16 VLF Survey Data, 2003 j ; Baseline Oriented (y N64'E @ 22 S, Gridlines Oriented @ 334' Military Station Used ~ Annapolis, Maryland (NSS)
I/P = In Phase Component Yo O/P = Out of Phase Component "A
i ' l
.
22-20 s. L 9\V YLF Profile ioSon
i : ^
-60-60-50-48-48-55-45-37-15-10-10-10-100
•^4.
2101010161266442.2-6
1 10 ,-x"" ~~"~x * -k: 1 1U ^' t v v^^
™-Q — --,t~Z. —————————————————————————————————— "i, —— i y QWIS ^^^""••^
T . 1Cl ——— i.———t. ——— ̂
-i .'jn \ " ^iictsci , — *— Out of Phase- -30
: ! \- ; 1 1 4- -40 s ~X ; ! !
i xr! t j - : 'X^*' ''X i !
l "^ '^i /;f-\ \w p
i ;; ! :Not to Scale, for Reference Only : i
123456789
101112131415161718192021222324252627282930"l joi323334353637383940414243
A B C DEFGH I J K LStumpy Bay PGM Property, Shakespeare Twp. Line Spacing @ 200', station Spacing* @ so 1 facing NWProduced by: Mitch Turcott
Station9400 S9+50 S10+00 S10+50 S11+00 S11+50 S12+00 S12+50 S13+00 S13+50 S14+00 S14+50 S15+00 S15+50 S16+00 S16+50 S17+00 S17+50 S18+00 S18+50 S19+00 S19+50 S20+00 S20+50 S21+00 S21+50 S22+00 S22-20 S23+00 S23+50 S24+00 S24+50 S25+00 S25+50 S26400 S26+50 S27+00 S27+50 S28400 S28+50 S
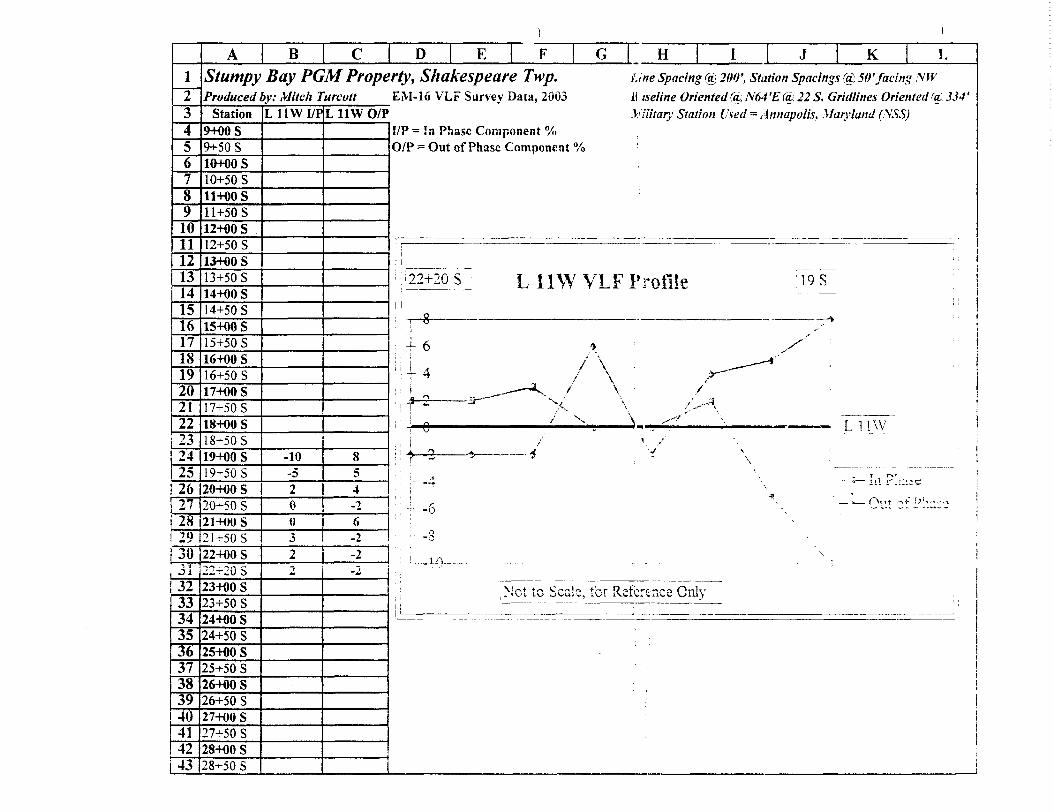
L11WI/P
-10-52003214x
EM-16 VLF Survey Data, 2003 11 iseline Oriented CcbN64' E (cu,22S, Gridlines Oriented (a. 1334'L HW O/P Military Station Used = Annapolis, Maryland (XSS)
854-26 J7"to
-2-2
I/P = !n Phase Component 0At O/P = Out of Phase Component "/o
liH '22+20 S L llWVLF?rofi!e : ^9SM ' \. ; Q . ...... . . .. ^. :i i i - u " " ,
j
!|6 J : /' '
: i|4 A ' r-^4 '•g /^ -•^-*---**^" ~'^ ' \ ,- , ,i T~~ J x \ /.^"\
..\ ! Q.... ,/ \... \ ...^f ~- L1P w. , i ' V /'i; 4— 3 ——— t —— - -* . -i
: i \
- ; - .4 '', - ; I, i Pl,;.-r-
! l ^ \ "-"^.O-.t ^c-DU^,.,: -- -6 \ -~ -" " ———
o - -, , . ~. t
: Net to Scale, for Reference Only \1 1
1 '
.! i
i
i

12345678910ii
i O
13141516171819202122232425262728293031323334353637383940414243
AStumpyProduced
Station9+00 S9+50 S :10+00 S10+50 S11+00 S j11-50 S12+00 S12-50 S13+00 S
B cBayPGMPropey, \ Mitch TurcottL 13W I/P
f
:|l
i
L 13W O/P
D E | F G i H j I j J j K j Lrty, Shakespeare Twp. Line Spacing (o, 200', Station Spacing* (a, 50' facing .\W EM- 1 6 VLF Survey Data, 2003 Baseline Oriented (aj Ntt4 'E (o. 22 S, Cmdlines Oriented (c. 334 '
Military Station Used - Annapolis, Man-land (VSS) I/P = In Phase Component "/o O/P = Out of Phase Component "/o
1
13-50 S14+00 S i : i!4*50 S15+00 S15+50 S J16+00 S16-50 S17+00 S1 7+50 S18+00 S18+50 S19+00 S19+50 S20+00 S20-^50 S21+00 S21+50 S22+00 S22+20 S23+00 S23+50 S24+00 S24+50 S25+00 S25+50 S26+00 S26+50 S27+00 S27+50 S28+00 S28-00 S
1
10
.ri'ii
-8
-~ --;; 6 7 -j 7 ii r \?f TT ri.,^^i-, -- — — L^ iJ-\* \ i^I' i i Witte - _ --
ii i 4- g - iiif 6
i ^nT^: l ?i T 2 ' ;, ^-e ————————————————————————————————————— L 13W '
i -1- -21 illi - .4 i :; 1 ' ' ' T-1 DTinco ' !i -f. .6 M - —""S-! 1 — * O' it nf Pha^pi t -5 - ' ' . ..... - . - — . .--..-. -. . . - . , ,
i i INot to Scale, for Reference Only ! i jM i

12345678910
i 111213141516171819202122232425262728293031323334353637383940414243
A B C D E i F G i a j I J j K j LStumpy Bay PGM Property, Shakespeare Twp. Um Spacing (c 200', Station Spacing (a so 1 facing NWProduced by: Mitch Turcott
Station9+00 S9+50 S10+00 S10+505^11+00 S11+50 S12+00 S12-00 S13+OftS13-50 S14-KiO S14+50 S15+00 S15+50 S16+00 S16^50 S17+00 S17+so s18+00 S18+50 S19+00 S19+50 S20+00 S20+50 S21+00 S21+50 S22+00 S22+20 S23+00 S23+50 S24+00 S24+50 S25+00 S25+50 S26+00 S26+50 S27+00 S27+50 S28+00 S28-50 S
L 15W I/PEM- 1 6 VLF Survey Data, 2003 Baseline Oriented (a. N64 'E (a, 22 S, Gridlines Oriented (a, 334 '
L 15W O/P .Military Station Used ^ Annapolis, Maryland (VSS)
25302830
-S-8-4-8
HP - In Phase Component "/o O/P = Out of Phase Component "/o
1- - - - -- - - - -- - - - -- - -
'
; 22-20 s L I5W VLF Profile 2i sM '
E-^ft^-^-. —•— --- -- -•••- - --- - i- -— - -~- — -...-.. . - .— - .....
i r 25 ~~~ " -i.- ...f . ,, . in DV.OCOj ill i llv*^^ ,
i -j- 20 ~~*'~~ Out of Phase
if 15 ' :'MJ 10 :; i l . ; i! f5illt i p ————— —— - —— —— ——————————————————— : L !5W ! l
l li-—-- — ̂ ̂ - —^ : i -1 i in " !. . i^j
i l Not to Scale, for Reference Only i l| i —————————————————————————— -L —— i - j
1

12345678910111213141516171819202122232425262728293031323334353637383940414243
A B C D E F | G H I | J K LStumpy Bay PGM Property, Shakespeare Twp. Line Spacing @ 200', station Spacwgs @ so 1 facing ^wProduced by: Aj'f/c/i Turcott
Station9+00 S9+50 S10+00 S10+50 S11+00 S11+50 S12+00 S12+50 S13+00 S13+50 S14+00 S14+50 S15+00 S15+50 S16+00 S16+50 S17+00 S17+50 S18+00 S18+50 S19+00 S19+50 S20+00 S20+50 S21+00 S21+50 S22+00 S22^20 S23+00 S23+50 S24+00 S24+50 S25+00 S.25+50 S26+00 S26+50 S27+00 S27+50 S28+00 S28+50 S
L 17 W I/Pj.—H
litji t
j.,i-
t^'15
EM-16 VLF Survey Data, 2003 Baseline Oriented fa, N64 'E (a), 22 S, Gridlines Oriented® 334'L 17W O/P Military Station Used = Annapolis, Maryland (NSS)
-650 -6
iJJ. -10;tt4542
i i
j"•~\
f ln i\ 'J :
' '
-6-4-4
]- i
I/P - In Phase Component "A O/P ~ Out of Phase Component 0X,
i . !ii|22-f20 s : L 17W VLF Profile : 20 s ;;
i i -. i !i j -^se ————————————————————————^f110 ^^-^ i' -J- In Phase l
1 "~^"j ~ ' - 3-~^— i : ii•'— :;0 ^~~~~~ — -^ M—*— Out of Phase
:^0 \ i::j i0 \ i - ".:T-S —————————————————————————————————— ; ——— L 17W
1 : \, -20
i
\ \ 'Not to Scale, for Reference Only \ \n ' ! i

Appendix 3 Scintrex MF-2 Fluxgate Magnetometer Information

' 'SCINTREX
MF-2 MAGNETOMETER
2.
OPERATION OF THE I"..TRUMH:::T :
1. Remove all fcrro-jn.Tjnetic' ol.joct:: iron thu pperitor' s
person, e.g. keys, coins, button,? si:, (nippers should
be non-magnetic).
Attach carrying str?p tc the i nstr-::a -;n': . For li-jht
surveying the upper button:; cfn t'2 'i.ici: and the strap
carried around the neck. In rcug'n t'rrvin, and fer long
surveys, it is advisable to attach ':ho :;tr^p to one
upper button around one shoulder to cho lcwer button
on the other side of the instrivncnt.
If external batteries are to fce unal, attach battery
pack cable to the instrument, c.nd the pack itself tc
the operator's back.
4. Switch on Main Switch (1) to thu f i r .-t position - BAT.
Meter needle should come ts cast within the red arc.
".Vr If not, replace or recharge the batteries.
5. Latitude Adjustment (Bucking):
Put Range Switch (3) to 100K po:;iticr., Main Switch to -
Positive ("+' 1 ) , Latitude Switch (3), to O gammas and'
l
3.
i i
r-
The bucking is then z-iro. -ir.d tha ~ cnctomst^r will
read the vertical component of the rrgr^tic field
with \ya accuracy. The MF-2, with calibrated latitude
control as nn option, h a.-3 latitude :-.-.itch steps of
10,000 gammas ± 0.5": thus t'T? reading car be taken or.
more sensiti/e z-ng'is and -h.j total value of vertical
component calculated by adding the neter reading to
the value of the field indicated on the Latitude
\ l \ iy
Switch. In order to obtain readings in :rore sensitive
ranges, it is necessary to .'idjur.t the l ititude controls
to give a zero rending. Firs-, not '.he Latitude Switch
(3) to the position which aiv.j.; a ro;;di'ig closest to
, zero on the pO3itivt2 sid.3, and then usj the Fine
''Control to obtain zero, "ow- set the Rcnge Switch to
'•a -desired range, and readjust the Fine Control, if nec
essary, to obtain an i5xact z;iro reading.
6. The only requirement ;or t.skin" n;en:-ure:r.9nts with the
MF-2, is that the instrument bo ronrjnably stationary,
with the level bubble (5) ranting v.-: thin the perirr.ater
of the "inner" circle of tha Love l.

NOUfigB
Oflli MDO.-.Cj3i V SDO3VHJ 9
13A31 S
lOt l NO".) 3NU 30fllliVl ^
toi I/AS aoniiivi c3ONVU Z
J i-iivw i
S^TcJi^
1OSNJtN l J t l l
01

7. Calibration i
. . . - . This instrument is factory c r. l i! :r ntec! and field tests
have shown that only misuse (i.e.. dropping, rough handling,
improoer shipping) can affect the calibration. Therefcn'a,
f ' it is not necessary to r s-salibrr.^c i:i the field. However.
should re-calibration become nece rsnry, for ?.ny reason, ^he
instrument should bo returned to ':he manufacturer.
8. All parts, except the non-rechara^rblo batteries and
cables, are guaranteed for a period of one year and in
the event of a malfunction will tf; replaced free of
charge, providing no obvious T.isu.'is h~'.s baen coranitted.
Should the instrument becono inoperative, check the
batteries and cables (especially connections) . If these
prove to be in good order, rnturn the instrument to
your supplier, or directly to the rjian-i f acturer , for
prompt repair.
*** WARNINGS Always remove tr.o e:-:t'?rn -.1 batteries when
the unit is being stored or shipped. Those units with
internal rechargeable batteries, s hou. l -J be re-charged
after each daily use, if possible, ant: at least once
*~^ every six months should the unit r -main in storage.
9. The charging of rechargeable batterie.i should be carried
out using the accompanying charging unit. The procedure
being:
a) Turn the magnetometer rr.iin -witch to OFF.
*** H. B.*** This applies to instruments with external batteries only. .^ _ ^
b) .Connect trie charger cable to tt.-' magnetometer ^ .- - - plug; (b) .
.c) Plug charger into 120VAC 50 to SO Hz.
d) The charger Pilot licjht will indicate that the batteries ara beirvj charged and will go off when they are fully charged.
e) If charging is to be done from T 23 to 427 .,,;:' D. C. source, connect the D^C- c.-ble to th-s charter,
and proceed a;v above. . ,. . -. ,— ----- .. ^^,
f) Should the source of charging p'iwer be 220 volts A. C., an internal adjustment to the charger is necessary. '
If a power source for charginn the batteries is not available in the field, the asternal battery paok (optional) should be used, i: exiernal pack is used, the internal batteries hnve ~o be re- charged every 6 months.For convenience the shorting plus with chain can be remov/ed and stored in the pocket o: the case.

O
10. - Regional .Latitude Settings: ,- . ( ,-,
normally, each unit is pro's^t for ';he northern.. Horai^sc^ha^e,
'•••- ~ pre-settlhg"for the SbtithfJrrTnomirphci: - viTT^Bc 'done '~ ~""f~"~
at the factory, as par your instructions and at no
extra cost. However, shou.ld the unit to required for
use in both Hemispheres, re-sottim; instructions will
be supplied on request.
FIEU PROCEDURE t
1. Select a base control station, the choice of location
'.'- being governed by the following considerations:
a) General magnetic background (i.e. not anomalous
~i i;.i -- — 6-ir'r"' ' ^ * if possible).
b) Accessibility, in relation to ths r.rea baincj i
surveyed. ' ^ ;: i •n.,,-'^
2. Set the magnetometer to read betwaen~"0- mA—446*ginwas.; ( '^.5
(For the sake of convenience in contouring and to avoid;; J
small negative readings, an arbitrary v.ilue of 800 to '
1000 gamma may ba added to all resdingr;) .
3. For effective diurnal control, control stations should
^-v b9 permanently marked, and readings should ba taken
~"' . at the same height and location each tine: a simple
method is to have the top of the control station picket
at about waist height. Rest the prol.e end of the raagnet-
; orneter on this picket whila taking the reading. In barren
country, a mound, large rock or sore Fijr.ilar object,
can be marked and used as a substitute for pickets.
4. Normal magnetometer survey procedures should te adhered
to for the remainder of tha survey.
5. Powerful magnets should be kopt nor^ th ;n l foot away
from the MF-2 instrument.
6. During winter operation, external batteries (if used)
should be kept in a pocket or under s pnrXa. (On\y use^
-iattf,tiec.v.'ifeh low, staal content e.q. Everaady). , :

Appendix 4 Geonics Ltd. VLF EM-16 Information

77 VLF Electromagnetic Unit
,-,ulir r-ii-..J ai'ti p.Tfsntsd axr.lusivsly by G'jonics LimitpH ths VLFmethod ofeTectromagnetic surveying has been proven to be a major advance in exploration geophysical instrumentation.
Since the beginning of 1965 a large number of mining companies have found the EM16 system to meet the need for a simple, light and effective exploration tool for mining geophysics.
The VLF method uses the military and time standard VLF transmissions as primary field. Only a receiver is then used to measure the secondary fields radiating from the local con ductive targets. This allows a very light, one-man instrument to do the job. Because of the almost uniform primary field, good response from deeper targets is obtained.
The EM16 system provides the in-phase and quadrature components of the secondary field with the polarities indicated.
Interpretation technique has been highly developed particularly to differentiate deeper targets from the many surface indications.
Principle of OperationThe VLF transmitters have vertical antennas. The magnetic signal component is then horizontal and concentric around the transmitter location.
SpecificationsSource of primary Held
Transmitting stations used
Operating frequency range
Parameters measured
Method of reading
Scale range
Readability
VLF transmitting stations.
Any desired station frequency can be supplied with the instrument in the form of plug-in tuning units. Two tuning units can be plugged in at one time. A switch selects either station.
About 15-25 kHz.
(1) The vertical in-phase component (tangent of the tilt angle of the polarization ellipsoid).(2) The vertical out-of-phase (quadra ture) component (the short axis of the polarization ellipsoid compared to the long axis).
In-phasa from a mechanical inclino meter and quadrature from a calibrated dial. Nulling by audio tone.
Reading time 10-40 seconds depending on signal strength.
Operating temperature range 40 to 50* C.
Operating controls
Power Supply
Dimensions
Weight
Instrument supplied with
In-phass ± 150",'o; quadrature dO'/a. Shipping weight
ON-OFr switch, battery testing push button, station selector, switch, volume control, quadrature, dial 4oy8 , Inclinometer dial isoro.
6 size AA (penlight) alkaline calls. Life about 200 hours.
42 x U x 9 cm (16 x 5.5 x 3.5 in.)
1.9 kg (3.5 IDS.)
Monotonic speaker, carrying case, manual of operation, 3 station selector plug-in tuning units (additional fre quencies are optional), set of batteries.
4.5 kg (10 Ibs.)
GEONICS l IMITFD Designers 4 manufacturers VJLWINIV.J Limner of g e0pnysi cai i nstrumen,3 2 Thomcliffe Park DriveToronto/Ontario/CanadaM4H1H2Tel: (416) 425-1821Cables: Geonic's

^xV "l*!*'V*-- ''-t*.* ^OIASAlt D---KE X r""** 'A*'* \. ,
,o: ..*M. \ stfif&'S. N™ .~"X IK*/, i',V IN . A"
m,...,*. A:".'.'.:'vHYM - ~-W.1UIWI*-' A."- \ V '
lW- X,.'
X** ^-
[Ul 1*1,
'O'131
TOCUM'
'\
Courtesy of Newfoundland A Labrador Corp. Ltd.
Areas of VLF SignalsCoverage shown only for v/ell-known stations. OtKefreliable, fully operational xtaijsKs
inft ir if-' signals in your area consult Geonfcs urnnoa: Extensive field s.rpar;encrnaTpJ5PS5twattfflr"" circles of coverage shown are very conservative and are actually much larger In extent.
EM 16 Profile over Lockport Mine Property, NewfoundlandAdditional cass histories on request.
horizontal coil
vertical coilIO -O * IO
Station Selector Receiving Colls In-Phase Dial Quadrature DialTwo tuning units can be plugged Vertical receiving coil circuit in shows the tilt-angle of the instru- is calibrated In percentage mark- in at one time. A switch selects instrument picks up any vertical mont lor minimum signal. This ings and nulls the vertical Quad- either station. signal present. Horizontal receiv- angle Is the measure of the vertical rature signal in the vertical coil
ing coil circuit, alter automatic in-phase signal expressed in circuit.90 a signal phase shift, leeds signal percentage when compared to theinto quadrature dial in series with horizontal field.the receiving coil.
By selecting a suitable transmitter station as a source, the EM 16 user can survey with the most suitable primary field azimuth.
The EM 16 has two receiving coils, one for the pick-up of tha horizontal (primary) field and the other for detecting any anomalous vertical secondary field. The coils are thus ortho gonal, and are mounted inside the instrument "handle".
The actual measurement is done by first tilting the coil assembly to minimize the signal in the vertical (signal) coil and then further sharpening the null by using the reference signal to buck out the remaining signal. This is done by a calibrated "quadrature" dial.
The tangent of the tilt angle is the measure of the vertical in-phase component and the quadrature reading Is the signal at right angles to the total field. All readings are obtained in per centages and do not depend on the absolute amplitude of the primary signals present.
The "null" condition of the measurement is detected by the drop in the audio signal emitted from the patented resonance loudspeaker. A jack is provided f o r'those preferring tha use of an earphone instead.
The power for the instrument is from 6 penlight cells. A battery tester is provided.
Oct/73
90
PRINCIPLE OF OPERATION
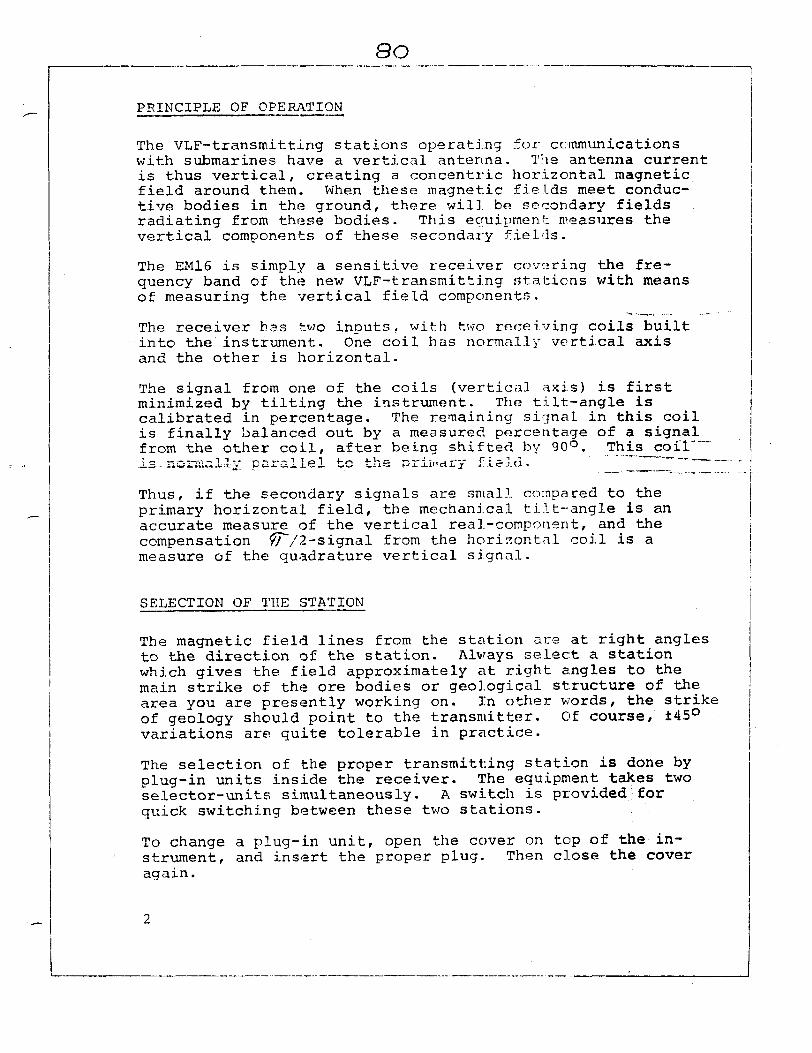
The VLF-transmitting stations operating for communications with submarines have a vertical antenna. The antenna current is thus vertical, creating a concentric horizontal magnetic field around them. When these magnetic fields meet conduc tive bodies in the ground, there will be secondary fields radiating from these bodies. This equipment measures the vertical components of these secondary fields.
The EM16 is simply a sensitive receiver covering the fre quency band of the new VLF-transmitting stations with means of measuring the vertical field components.
The receiver has two inputs, with two receiving coils built into the instrument. One coil has normally vertical axis and the other is horizontal.
The signal from one of the coils (vertical axis) is first minimized by tilting the instrument. The tilt-angle is calibrated in percentage. The remaining signal in this coil is finally balanced out by a measured percentage of a signal^ from the other coil, after being shifted by 90 O . This^coil"~ .Xs-.iiOiSially parallel tc the primary field. 3^.3 *"~"~
Thus, if the secondary signals are small compared to the primary horizontal field, the mechanical tilt-angle is an accurate measure of the vertical real-component, and the compensation #TY2-signal from the horizontal coil is a measure of the quadrature vertical signal.
SELECTION OF THE STATION
The magnetic field lines from the station are at right angles to the direction of the station. Always select a station which gives the field approximately at right angles to the main strike of the ore bodies or geological structure of the area you are presently working on. In other words, the strike of geology should point to the transmitter. Of course, 45 O variations are quite tolerable in practice.
The selection of the proper transmitting station is done by plug-in units inside the receiver. The equipment takes two selector-units simultaneously. A switch is provided for quick switching between these two stations.
To change a plug-in unit, open the cover on top of the in strument, and insert the proper plug. Then close the cover again.

Here is a list of some of the stcitiorui useful in Canada and United States.
Station NAA: Cutler, Maine Freq. 17.8 kHzStation NPG: Seattle, Washington Freq. 18.6 kHzStation NSS: Annapolis, Maryland Freq. 21.4 kHzStation NBA: Panama Freq. 24.0 kHz
For European use CBR: Rugby, England Freq. 16.0 kHzNWC: Australia Freq. 22.3 kHz
When ordering an instrument, consult GeonioF for latest information for best selection of stations.
TAKING A READING
The direction of the survey lines should be selected ap proximately along the lines of the primary magnetic field, at right angles to the direction to the station being used. Before starting the survey, the instrument can be used to orient oneself in that respect. By turning the instrument sideways, the signal is minimum when the instrument is pointing towards the station, thus indicating that the magnetic field is at right angles to the receiving coil ' inside the handle.
To take a reading, first orient the reference coil (in the lower end of the handle) along the magnetic lines. Swing the instrument back and forth for minimum sound intensity in the speaker. Use the volume control to set the sound level for comfortable listening. Then use. your left hand to adjust the quadrature component dial on the front left cor-,,,, ner of the instrument to further minimize the sni.mcU-.-After^. -flading "the ninirauiu liign^i strength en both adjustment^-,.--- ,^ .. read the inclinometer by looking into the piiall lens. Also,mark down the quadrature reading. j
i l
While travelling to the next location you can, if you wish, j keep the instrument in operating position. If fast changes j in the readings occur, you might take extra stations to pin- l point accurately the details of anomaly. j
The dials inside the inclinometer are calibrated in positive and negative percentages. If the instrument is facing 180 O from the original direction of travel, the polarities of the readings will be reversed. Therefore, in the same area take the readings always facing in the same direction even when travelling in opposite way along the lines.
92.
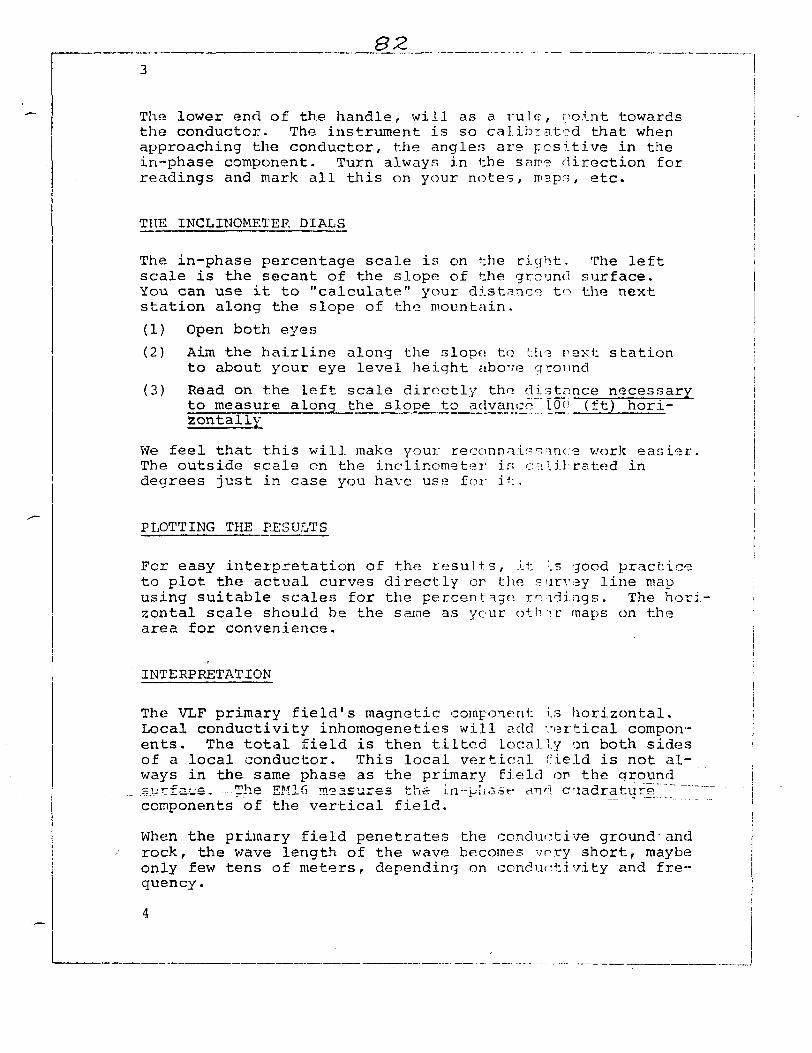
The lower end of the handle, will as a rule, point towards the conductor. The instrument is so calibrated that when approaching the conductor, the angles are positive in the in-phase component. Turn always in the sarre direction for readings and mark all this on your notes, trap", etc.
THE INCLINOMETER DIALS
The in-phase percentage scale is on the right. The left scale is the secant of the slope of the ground surface. You can use it to "calculate" your distance to the next station along the slope of the mountain.
(1) Open both eyes
(2) Aim the hairline along the slope to th3 rext station to about your eye level height ;ibove ground
(3) Read on the left scale directly thn distance necessary to measure along the slope to_advance^ Ion (ft) hori zontally
We feel that this will make your reconnaissance work easier. The outside scale on the inclinometer ir; calibrated in degrees just in case you have use for it.
PLOTTING THE RESULTS
For easy interpretation of the results, it '.s good practice to plot the actual curves directly or the survey line map using suitable scales for the percentage readings. The hor: zontal scale should be the same as your othir maps on the area for convenience.
INTERPRETATION
The VLF primary field's magnetic component is horizontal. Local conductivity inhoinogeneties will add vertical compon ents. The total field is then tilted Locally on both sides of a local conductor. This local vertical ffield is not al ways in the same phase as the primary field on the ground surface.-...The EM16 measures the In-phast- ana Quadrature"" components of the vertical field.
When the primary field penetrates the conductive ground'and rock, the wave length of the wave becomes vrry short, maybe only few tens of meters, depending on conductivity and fre quency .

At the same time the wave travels practical Ly directly down wards. The amplitude of the field aJ.so decreases very fast, completely disappearing within one wavelength. The magnetic field remains, however, horizontal.
Figure 7 shows graphically the length and phare angle of the primary field penetrating into a conductive material.
The phase shift in radians per meter and tJie attenuation in nepers per meter (t/e) is:
u,..f ( l(J -- c-mcluctivity
rrvio/m
Figure 7 also reminds of the fact that all "secondary fields have a small (or large in poor conductors) positive phase shift in the target itself due to its resistive component, and that the secondary fields have another negative phase shift while penetrating back to surface fron the upper edge of the target.
The targets are located somewhere in the d e nth scale (phase shift scale in this case) . Suppose we have semi-infinite vertical sheet target starting from the sur '"ac'j. Figure 8 shows that the total integrated primary fio'.d inphase and quadrature flux has a value of H- 0.5 and - ''.5 respectively.
These two charts can be used to analyze th^ Inphase and quadrature readings taken on both sides of ' .he target. If one knows the actual conductivity of the overburden and the rock, the task is easier. Because of the mn.ny variables involved the precise analysis is usually impossible.
Mostly encountered and easily solved prcblon is, however, the separation of surface conductors from the nore interest ing ones at depth. This is easily done by observing the negative quadrature signals compared to t.he usually positive or zero ones from the surface targets. See tha sample pro files 9 and 10. This way we can often tell if we have a more interesting sulfide target under a swamp for example.
Another use for the quadrature polarity Is : ; n the following a faultier a shear zone. Normally these wenk conductors give a fair amount of positive (the quadrature follows the in-phase polarity) quadrature. When we bavr a local sulfide concentration in these structures , we get a negative quadra ture response.
84-
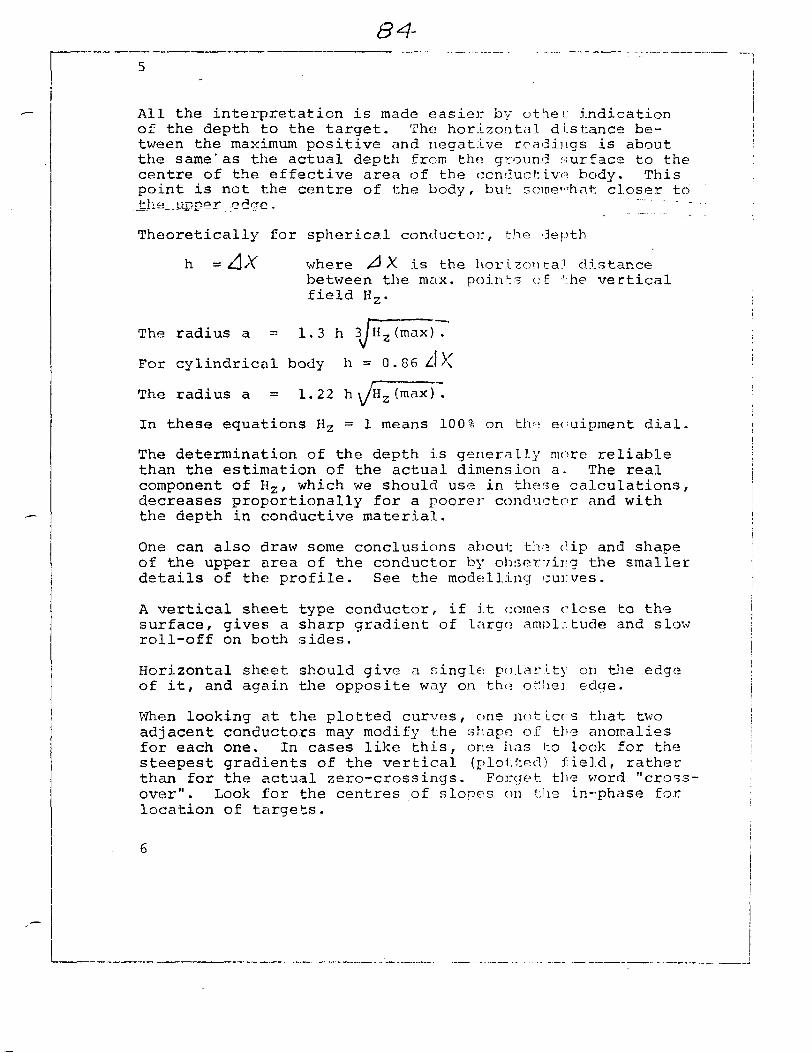
All the interpretation is made easier by other indication of the depth to the target. The horizontal distance be tween the maximum positive and negative readings is about the same' as the actual depth from the ground surface to the centre of the effective area of the conductive body. This point is not the centre of the body, but somewhat closer to t* ' ti i^rso^f
Theoretically for spherical conducto}:, t.ho depth
h — 4jX where /^ X is the horizon ea."' distancebetween the max. points of ':he vertical field Hz .
The radius a ^ 1.3 h 3 /H z (max) .
For cylindrical body h 3: 0.86 //X
The radius a = 1.22 h \^Z (max) .
In these equations H z s l means 100 * on the equipment dial.
The determination of the depth is generally more reliable than the estimation of the actual dimension a. The real component of H z , which we should use in these calculations, decreases proportionally for a poorer conductor and with the depth in conductive material.
One can also draw some conclusions about tlv? clip and shape of the upper area of the conductor by observirg the smaller details of the profile. See the modelling curves.
A vertical sheet type conductor, if it comer? close to thesurface, gives a sharp gradient of large amplitude and slowroll-off on both sides.
Horizontal sheet should give a single; polarity en the edge of it, and again the opposite way on tho other edge.
When looking at the plotted curves, one not Lcrs that two adjacent conductors may modify the shape, of the anomalies for each one. In cases like this, one has l:o look for the steepest gradients of the vertical (plotted) field, rather than for the actual zero-crossings. Forget the word "cross over". Look for the centres of slopes on t: ! ie in-phase for location of targets.
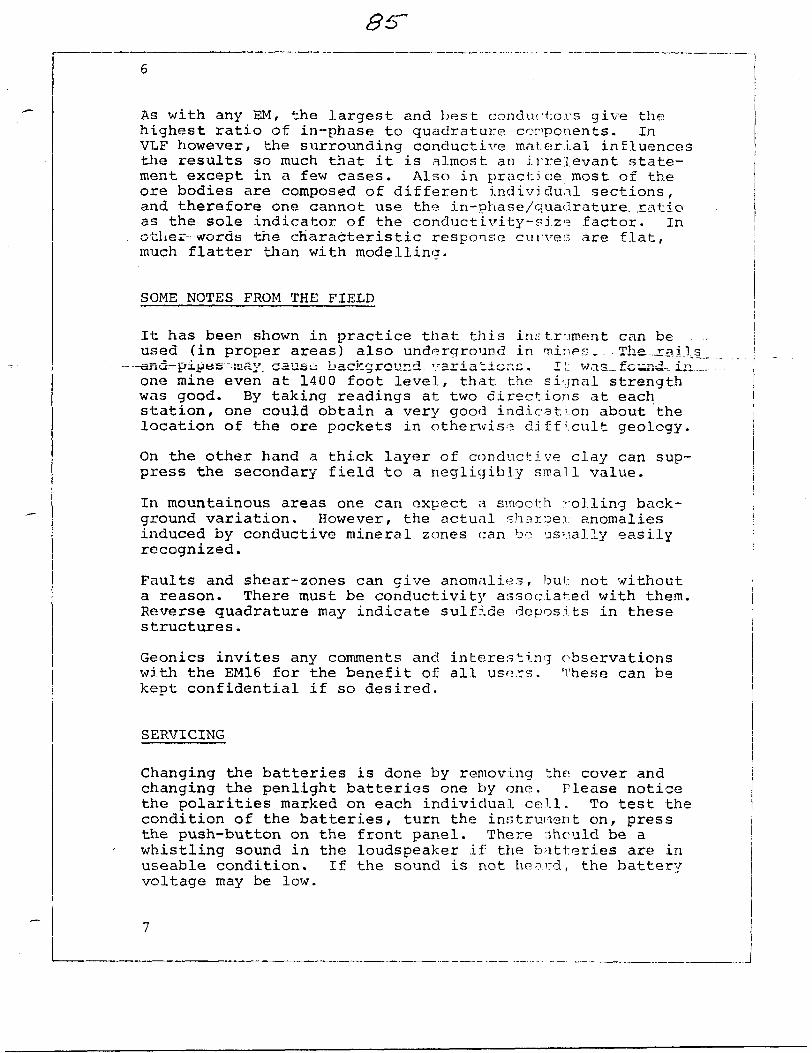
86"
As v/ith any EM, the largest and best conductors give the highest ratio of in-phase to quadrature conponents. In VLF however, the surrounding conductive material influences the results so much that it is almost an irrelevant state ment except in a few cases. Also in practice most of the ore bodies are composed of different individual sections, and therefore one cannot use the in-phase/quadrature. .ratio as the sole indicator of the conductivity-size factor. In other words the characteristic response curve;:; are flat, much flatter than with modellina.
SOME NOTES FROM THE FIELD
It has been shown in practice that this instrument can be used (in proper areas) also underground in minps... The-..rax -ana pipes -insy. caus^: background, variations, I L w.3.s~ found-:, i one mine even at 1400 foot level, that the signal strength was good. By taking readings at two directions at each station, one could obtain a very good indicati.on about the location of the ore pockets in otherwise difficult geology.
On the other hand a thick layer of conductive clay can sup press the secondary field to a negligibly small value.
In mountainous areas one can expect a smooth rolling back ground variation. However, the actual sharper anomalies induced by conductive mineral zones can be usually easily recognized.
Faults and shear-zones can give anomalies, but not without a reason. There must be conductivity associated with them Reverse quadrature may indicate sulfide deposits in these structures.
Geonics invites any comments and interesting observations with the EM16 for the benefit of all users. These can be kept confidential if so desired.
SERVICING
Changing the batteries is done by removing the cover and changing the penlight batteries one by one. Please notice the polarities marked on each individual cell. To test the condition of the batteries, turn the instrument on, press the push-button on the front panel. There should be a whistling sound in the loudspeaker if the batteries are in useable condition. If the sound is riot heard, the battery voltage may be low.

It may be occasionally necessary to clean the contacts of the plug-in unit. For this, use a clean ra r that is very slightly moistened with oil. The oily rag '.s good also for the battery terminals.
If any repairs are necessary, we recommend '.hat the instru ment be shipped to Geonics Limited fer a thorough check-up and testing with proper measuring instruments.
PHOTOGRAPHS
Figure l shows the insertion of the station selector plug-in units in the EM16.
Figure 2 shows how to use the instrument '.o find the direction of the primary field. Swing the instrument horizontally for minimum signal."
Figure "3 shows that you are now facing in th^ survey line ' direction along the primary field. The trans mitter is on your left or right.
Figure 4 shows that you are approaching a conductor. In- phase readings are positive. Quadrature may be negative if target is deeper.
Figure 5 you have passed over the conductor already.Tn-phase di.pl shows negative vsli-f?. Quadrature^' ~~ could be positive if deeper target 'ras 'behind'you.
Figure 6 shows a sample profile over a massive sulfide target.

And Survey Lines
Conductor Behind
t RECOINIISI'M lilt
^. 2W 3W
OUBASt OTKf
300'
Pic. 6
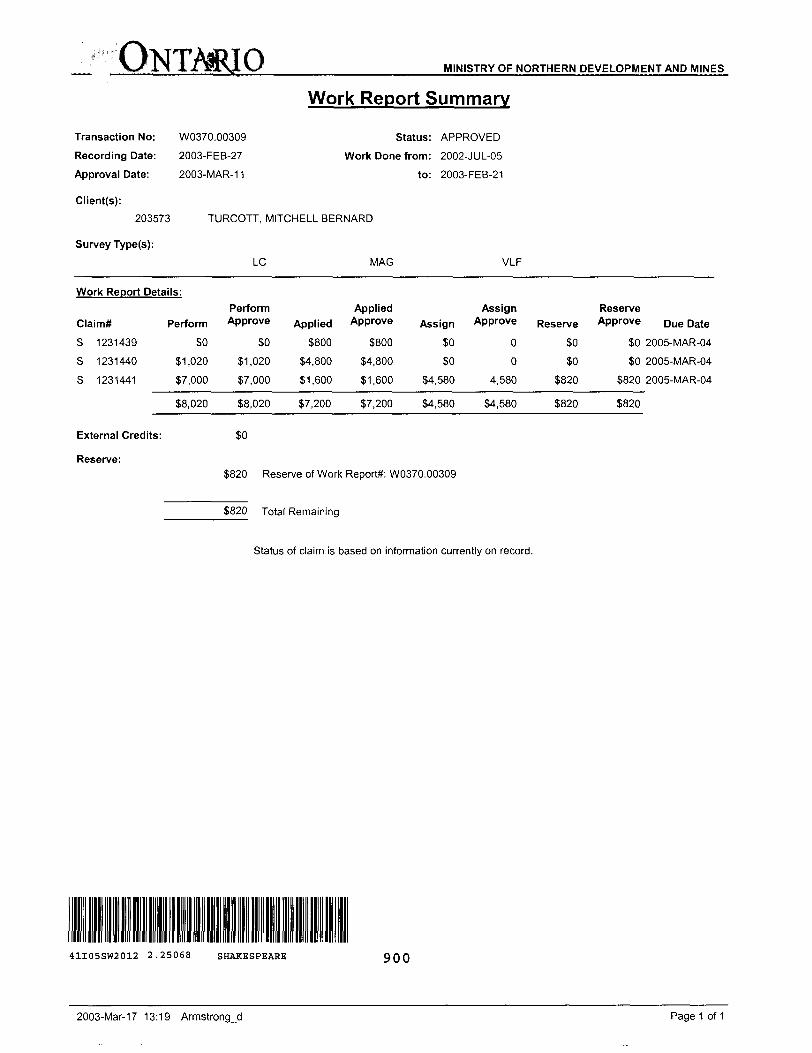
ONTMUO MINISTRY OF NORTHERN DEVELOPMENT AND MINES
Transaction No:
Recording Date:
Approval Date:
Client(s):
203573
Survey Type(s):
W0370.00309
2003-FEB-27
2003-MAR-11
Work Report Summary
Status: APPROVED
Work Done from: 2002-JUL-05
to: 2003-FEB-21
TURCOTT, MITCHELL BERNARD
LC MAG VLF
Work Report Details:
Claim# Perform
S 1231439 SO
S 1231440 51,020
S 1231441 57,000
58,020
External Credits:
Reserve:
Perform Applied Approve Applied Approve
SO S800 5800
51,020 S4.800 S4.800
37,000 51,600 51,600
S8.020 57,200 S7.200
50
Assign
so50
54,580
54,580
Assign Approve Reserve
0 SO
0 50
4,580 5820
54,580 5820
Reserve Approve Due Date
SO 2005-MAR-04
50 2005-MAR-04
5820 2005-MAR-04
S820
5820 Reserve of Work ReporW: W0370.00309
5820 Total Remaining
Status of claim is based on information currently on record.
41I05SW2012 2.25068 SHAKESPEARE 900
2003-Mar-17 13:19 ArmstrongjJ Page 1 of 1
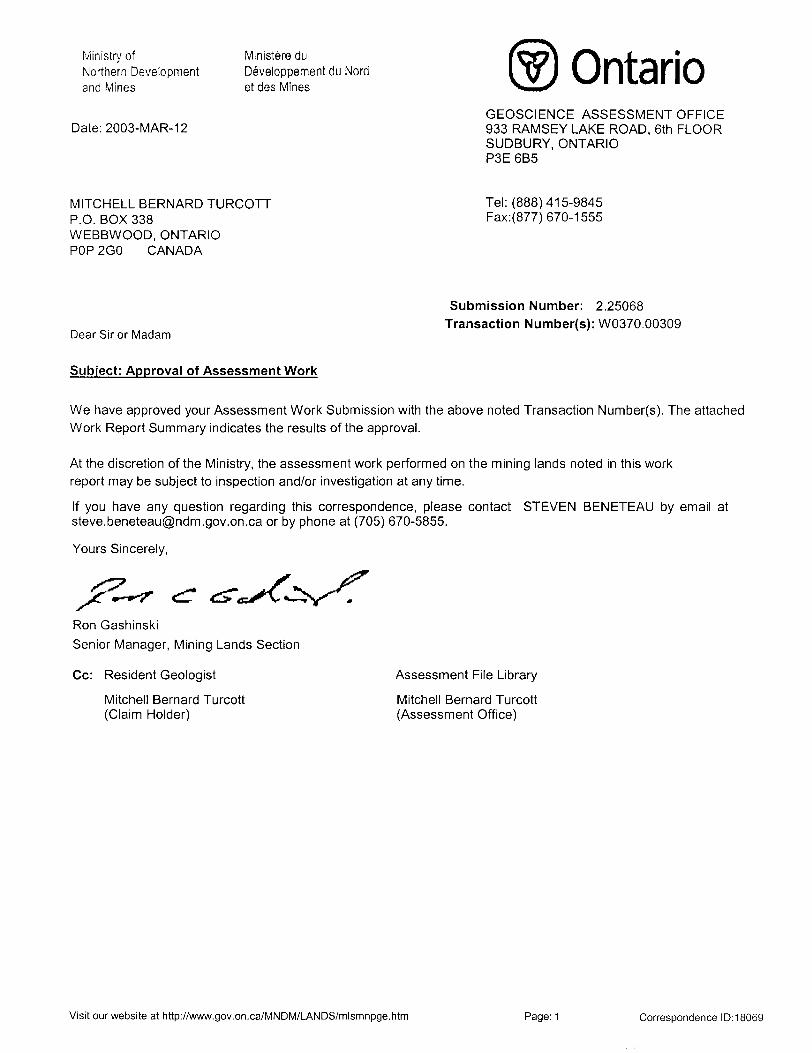
Ministry ofNorthern Developmentand Mines
Date:2003-MAR-12
Ministere du Developpement du Nord etdes Mines Ontario
GEOSCIENCE ASSESSMENT OFFICE 933 RAMSEY LAKE ROAD, 6th FLOOR SUDBURY, ONTARIO P3E 6B5
MITCHELL BERNARD TURCOTT P.O. BOX 338 WEBBWOOD, ONTARIO POP 2GO CANADA
Tel: (888) 415-9845 Fax:(877)670-1555
Dear Sir or Madam
Submission Number: 2.25068 Transaction Number(s): W0370.00309
Subject: Approval of Assessment Work
We have approved your Assessment Work Submission with the above noted Transaction Number(s). The attached Work Report Summary indicates the results of the approval.
At the discretion of the Ministry, the assessment work performed on the mining lands noted in this work report may be subject to inspection and/or investigation at any time.
If you have any question regarding this correspondence, please contact STEVEN BENETEAU by email at [email protected] or by phone at (705) 670-5855.
Yours Sincerely,
Ron Gashinski
Senior Manager, Mining Lands Section
Cc: Resident Geologist
Mitchell Bernard Turcott (Claim Holder)
Assessment File Library
Mitchell Bernard Turcott (Assessment Office)
Visit our website at http://www.gov.on.ca/MNDM/LANDS/mlsmnpge.htm Page: 1 Correspondence 10:18069

CANADA
MINISTRY OF NORTHERN DEVELOPMENT AND MINES
PROVINCIAL MINING RECORDER'S OFFICE
Mining Land Tenure Map
^ll!j 5130000IM
UTM2one17 SOOOrri end
Those wishing lo stake* mining claim s should consult with the Provincial Mining Recorders' Office of the Ministry of Northern Dovolopmenl and Minos for additional information on the status ol the lands shown hereon. This map is not intended for navigational, survey, or land titte determination purpose as the information shown on this map is compiled from various sources. Completeness arid accuracy are not guaranteed, Additional infonnation may also be obtained through thft local Land Titles or Registry Office, or the Ministry of NwEuraf Resources.
Tho information shown is derived from digital date available in tho Provincial Mining Recorders' Office at tho tlmo of downloading from the Ministry of Northern Dovwlopmant and Mines web sit w,
General Information and LimitationsContact information:Provincial Mining Recorders' OfficeWillet Green Mtilsr Centre 933 Ramsay Lahe RoadSudbury ON P5E6B5Home Page: www.mndrn.gov.on.ca/MNOM/MINES/LANDS/nilsrrmpga.htn-
Toll Free Map Datum: NAD 83Tel; 1 (885)4 15-6845 ext S7*aijedran: UTM (8 dagree)Fax; 1 (877) 670-1444 Topographic Data Source; Land Information Ontario
Mining Land Tongro Source: Provincial Mining Recorders' Office
Thki mop ma/ not nhow unregisjtored land tenure and interests in lHnd including certain patents, laasss, oasmmsntB, right of ways. flooding rijhts, licences, or other forms of disposition of riohts and interest from thn Crown. Also cartBin land tenure and tend uses tnal relict or prohibit tree entry to slake mining claims may not be illustrated.
Date l Time of Issue: Tue Mar 11 14:40;13 EST2003
TOWNSHIP l AREA PLAN SHAKESPEARE G-3001
ADMINISTRATIVE DISTRICTS l DIVISIONS
Mining Division SudburyLand Titles/Registry Division SUDBURYMinistry of Natural Resources District SUDBURY
TOPOGRAPHIC
Administrative Boundaries
f"'" ; Township
! i 1 Concession. Lol
[K* Provincial Park
laf-'m'} ludian ReserveK: "": Cliff, Rt ft Pile
Land Tenure
Freehold Patent
r
A,
Contour
Mine Shafts
Railway
ftofld
Trail
Natural Gaa Pipeline
Utilities
Surface Anil Mining Rights
Surface Rights Only
Winino WtRhts Only
nt
Surface And Mining Rights
Sufftice RigWe Only
Winino RightB Qjity
Uses N
SurfncK Ant! Mining Rights
Surface Riants Only
Mininfi Ria*itB Onty
Ofdof In Coudrti (Not open for staking)
Power 1.5335 AgroQrTusrU
Mining Oaim
Filed Onfy Minirtg Clahns
LAND TENURE WITHDRAWALS
0"1;,i :;1 | ATOMK Wttlvir^wn trrifn Dtaf
Miring AMa Witndcawai Ty Wsr'n Surface AM Mining Higmj W Ws Surface Rights Oily VW^drflwr Wm MNciu Riiijlhiy Otilv WiiWrawn
Otti*r In Council Withdrawal Typos Warn Surface And Mining Rights WlllKlrewfi Wjj Stirfiiui ftgmsOnly Witfidrawn "
IMPORTANT NOTICES
Soln 1:40000
LAND TENURE WITHDRAWAL DESCRIPTIONSIdentfflsr Type Dnte OeKription
7564 Wsm Jan 1, 2001 W.P.L.A. NO 110, FILE 9214 SURFACE RIGHTS WITHDRAWN
7803 WOT Jan l 2001 W.P.L.A. NO 110, FILE 9214 SURFACE RIGHTS WITHDRAWN
7637 Wsm Jan 1,2001 E 1/2 OF NE 1/4 OF S 1/2 OF LOT 1, CON, 6 WININO RIGHTS WITHDRAWN BY
W-LL-F212 WOT Nciv23.2001 Mining and Surface rights withdrawal Section 35 of tho Mining Act RSO 1999 Orde
W-LL-F212/00 Wsm Oct4.2000 SEC 36 W-LL-F 212/00 ONT OCT. 04/00 MSS
W.4W2 Ws JuM4, 1982 SEC.36/80 W.4/62 14/07/82 S.R.0.137636
41I05SW2012 2.25068 SHAKESPEARE 200

MAPI: GEOPHYSICAL LOCATION MAP, STUMPY BAY PROPERTY
LEGEND
L. 35597
?)35609i**—*
1231440
L3E
23 S
E
Mining Lease
Mining Patent
Mining Claim
Mining Claim Post
Grid Line Number 5 east
Grid Station Number 23 south
UTM location coordinates E or N
Stumpy Bay Property Claim Boundary
Internal Claim Lines (Stumpy Bay Property)
NOTE:The geophysical grid established on the Stumpy Bay Property in Shakespeare Twp. is an of the Ursa Major Minerals grid located to the north and west of the property. The grid has stations every 100 feet and lines were spaced every 200 feet SL oriented @ 3340. A baseline was established at approximately 22S and oriented @ 0640 (at right angles to the grid lines). The E/W St N/S boundary of mining patent P 35609 & #1231440 Si 1231441 was cut out to establish the Stumpy Bay Property boundary and for grid location control.
Falconbridge Ltd. Cu, Ni, PGM Property Option to
URSA MAJOR MINERALS
PJ 35603P 35604
1231441(2-16ha units)
Magnetic Declination ^ 70 West
@35609
Bay Grid
Lines oriented @ 3340 with 100' stations BL (baseline) oriented (ffi 0640 (2) 22S
1231440(6-16ha units)
Li 35597Gull Island
UTM 5132000m N
1231339(l-16ha unit)
AGNEW LAKE
STUMPY BAY PROPERTYShakespeare Twp., Sudbury District
CON.V CON. IV
Fluxgate Magnetometer Survey (MF-2) VLF Electromagnetic Survey (EM-16)
UTM E
Drawn by: Mitch Turcott Date: February, 2003

H H Oin W
1/1 o
CO•o
MAP 3: VLF (EM-16) Response ProfilesStumpy Bay Property, Shakespeare Twp., Sudbury Mining District
JLIfTW JL/3U/
~*07. -\0l O Z *l*7.8 S — t -
fs
W
us
U!
135
W
If*
US
175
ia^IO3
IJS
go si
./2/S\
2^7 Si
235
2YS
255f.* **
2*5
275
235
•" *
•B 1
•M* .
V
~
-
"
m
m
t
*
B m
^\ '~ 9
Mx"*/'•^^— — -;
". Iks,'*
*
*
•M
U. 1
"
K* -
f ™
.^^
^. \ '"~~~~-~-!^S,
-~
' \^
^ f fx* N t. * *
•v
m
*
B **
W
-
ix'x*
- — ~, x^* i
4
x^**^^5v^^^y-T J#
*
*
. . . .*
4
i
^
^"̂
9
^Y.\
i .
j " _
o
f Xt * -
*iia^^"*""
'msl7x ,^•^^
i'i -f *^-* '̂
a
V^X^*
j*** "' /*
S117
-^b^\- /\ •^
j^yffl^ ^n"IHI' ' J N,
B-
m-
*r
m
J--** * ™
M
V/l
•c^ --A-\ xt X*NN*NX\
x ^S"^
•^/'
1/'
B. 4 M
\ 1
\ l
f /'
* ^X"*
^^//'
^fajff..- t 1^^ * *^s^^A.
N.B-
B-
B
—— * '
7 X0 *
•* 9 t m
f**0 *
1
1
—— ̂
X '/ \Ti*\
s"" x
B/*s \
T 1V
:-^l^-^l 'x* \* " *
x \w
y*\
X^7*'~//s
f^'*^C' ^^^" *^^ **
——- 4 ^~^^^7
m
- tm
\ \ *
t *\t' y '/v. l \/ :
\ \\ \
9/x* * -y^
# *-^f -* N S
^*^ -- ""
"^ * ^^"
x^" ^^^"
^^k,
^^^^~^--^j^5^* ^X ^~^
X*
*
.
M
fl
*
^ 0 ' '
1
xi
/™" V *\
V\x* x*\* 9
l i7
;* y—— # -* *
NIf" x/'/f'- * *7 /'
;~ i .-^\ i - *^*^^^^. \ .
^x-l/ ^-"/'' "^^Ik.̂̂
^j
M
*
M
/
-} VI1
B. * ~
Nx'
X. 9 '
yt1 ii .4 n1 L-— *^
x^^Xi/f
T fi l* *: l •j^ * *"^^^^ t
^-^ ^"f \ I*x. *^^*.
X' ^^Vk~ -f * *^.
^Nfe."™ ' * '^^^tot *
X\
• m
~ \ \r i
:.l 9 "
"'
l .
{x|-- :n ^- /j: ^i v i \
- * 9 - "
0 '
1- *
1*\
\/
y
~ *V
*\ s \
N
^.•^\ /\[x x'*
/*
•''\ "i
1~ c i
-
\'\x
M. * ' m
. - ' , ::,, , ^:^•r
- *^" —
*\
\
^ -~ ""
V ^^
\
f 1
f* "
*\
\•v.
x
s *
Z VLf Efl **Sr^t ScWe-IS
I0S . __ . fn Physe.
l/ S *--., C?n"t *^ PJtjse- CQw.a/ret.'tM.re)
l J C V/ IP C OA,ctliCct Df /?X'\S
-175 Magnetic Declination - T West
i AC
J . . r.:. . . . ,"x ' ' ' ' -•---••-v^.- ----
;. -us **\
*^ *s.
^21 5 MAP 2: VLF (EM-16) Electromagnetic Response Profiles'* Stumpy Bay Property, Shakespeare Twp., Sudbury District
9
\-2*.S NOTE:' :
J This VLF electromagnetic profile map is representative of data collected.^ — 2?S from the Stumpy Bay Property in February of 2003 from the northern
v ^. portion of the property (Map 1). Stations were read every 50 feet, lines.*- " ' 2?S were spaced every 200 feet A oriented @ 3340.
" v ^{•^*
1N N ^ 2 5 S ^ne instrument used for the survey was a Geonics Ltd. EM-16.\ j The VLF method uses military and time standard VLF transmissions as\f 2L s the P"maI7 ̂ eW- The receiver (EM-16) is then used to measure the
secondary fields radiating from local conductive targets. Readings are inpercent C54) In Phase (I/P) and percent (0A) Out of Phase (O/P or
-27S Quadrature).
255 AU readings were taken facing NW and the military transmission stationAnnapolis, Maryland (MSS) with a frequency of 21.4 kHz was used.
JL/5W L 7" Lie LIZ JLIlf re SCALErl*ttttfi^Q(|[ feet
V" '"••"V.
Produced by: Mitch Turcott, February, 2003
to to o

Feb. 9 1 10, 2003
Produced by: Mitch Turcott
Stumpy Bay PGM Property, Shakespeare Twp MF-2 Fluxgate Magnetometer Survey, 2003
Line Spacing ® 200', Station Spacings (a SO'
Baseline Oriented @, N64 'E (a. 22 S, Gridlines Oriented fa 334'
MAP 2: Vertical Field MagneticsStumpy Bay Property, Shakespeare Twp., Sudbury District
NOTE:This magnetic contour map is representative of data collected from the Stumpy BayProperty in February of 2003 from the northern portion of the property (Map 1).Stations were read every 50 feet and lines were spaced every 200 feet A oriented @3340.
The instrument used for the survey was a McPhar MF-2 Fluxgate Magnetometer which measures the vertical component of the earth's magnetic field. Readings are in Gammas with an accuracy of+A- 15 Gammas.
AU magnetic data has been corrected for drift (see RAW DATA Sheets).To make all of the station readings positive, 2000 Gammas have been added to everystation.
Contouring is based on 200 Gamma intervals.
CONTOUR COLOUR LEGEND
^ 1000 Gammas
^ 1400 Gammas
1600 Gammas
1800 Gammas
2000 Gammas
>= 2200 Gammas
VLF (EM-16) Conductor Axis
SCALE: l inch = 200 feet
Magnetic declination = 70 West
K) W O