Embed Size (px)
Citation preview
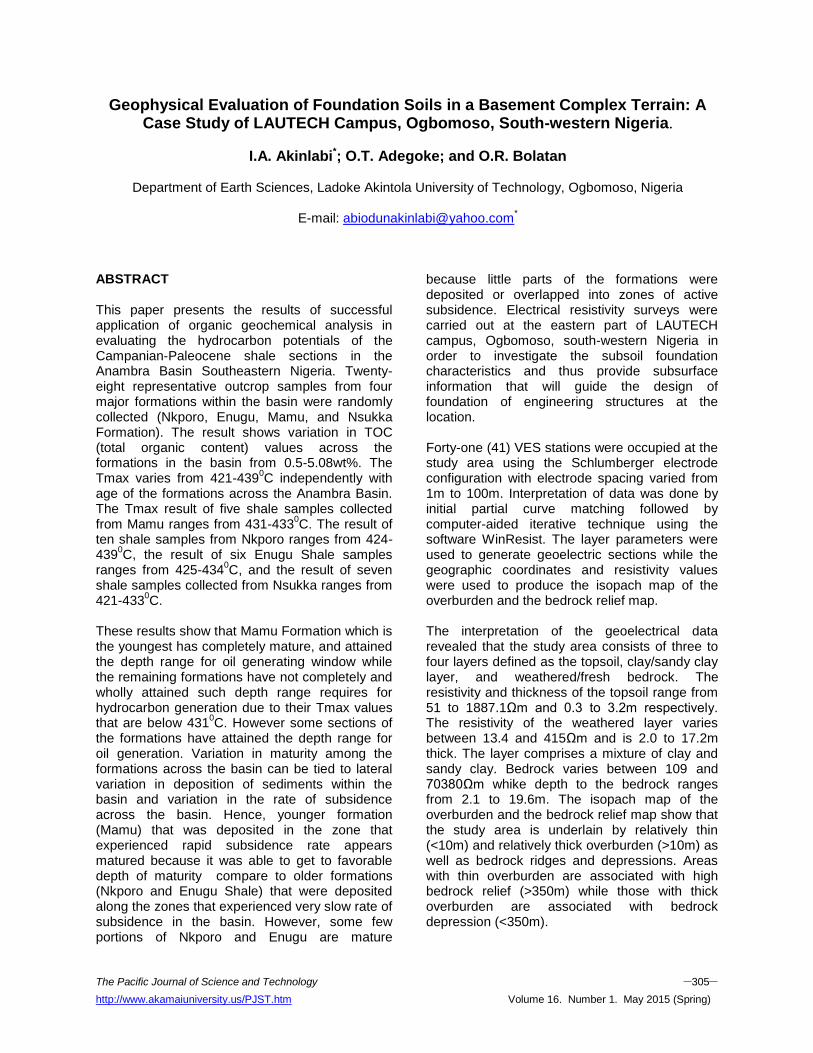
The Pacific Journal of Science and Technology –305– http://www.akamaiuniversity.us/PJST.htm Volume 16. Number 1. May 2015 (Spring)
Geophysical Evaluation of Foundation Soils in a Basement Complex Terrain: A Case Study of LAUTECH Campus, Ogbomoso, South-western Nigeria.
I.A. Akinlabi*; O.T. Adegoke; and O.R. Bolatan
Department of Earth Sciences, Ladoke Akintola University of Technology, Ogbomoso, Nigeria
E-mail: [email protected]*
ABSTRACT This paper presents the results of successful application of organic geochemical analysis in evaluating the hydrocarbon potentials of the Campanian-Paleocene shale sections in the Anambra Basin Southeastern Nigeria. Twenty-eight representative outcrop samples from four major formations within the basin were randomly collected (Nkporo, Enugu, Mamu, and Nsukka Formation). The result shows variation in TOC (total organic content) values across the formations in the basin from 0.5-5.08wt%. The Tmax varies from 421-439
0C independently with
age of the formations across the Anambra Basin. The Tmax result of five shale samples collected from Mamu ranges from 431-433
0C. The result of
ten shale samples from Nkporo ranges from 424-439
0C, the result of six Enugu Shale samples
ranges from 425-4340C, and the result of seven
shale samples collected from Nsukka ranges from 421-433
0C.
These results show that Mamu Formation which is the youngest has completely mature, and attained the depth range for oil generating window while the remaining formations have not completely and wholly attained such depth range requires for hydrocarbon generation due to their Tmax values that are below 431
0C. However some sections of
the formations have attained the depth range for oil generation. Variation in maturity among the formations across the basin can be tied to lateral variation in deposition of sediments within the basin and variation in the rate of subsidence across the basin. Hence, younger formation (Mamu) that was deposited in the zone that experienced rapid subsidence rate appears matured because it was able to get to favorable depth of maturity compare to older formations (Nkporo and Enugu Shale) that were deposited along the zones that experienced very slow rate of subsidence in the basin. However, some few portions of Nkporo and Enugu are mature
because little parts of the formations were deposited or overlapped into zones of active subsidence. Electrical resistivity surveys were carried out at the eastern part of LAUTECH campus, Ogbomoso, south-western Nigeria in order to investigate the subsoil foundation characteristics and thus provide subsurface information that will guide the design of foundation of engineering structures at the location. Forty-one (41) VES stations were occupied at the study area using the Schlumberger electrode configuration with electrode spacing varied from 1m to 100m. Interpretation of data was done by initial partial curve matching followed by computer-aided iterative technique using the software WinResist. The layer parameters were used to generate geoelectric sections while the geographic coordinates and resistivity values were used to produce the isopach map of the overburden and the bedrock relief map. The interpretation of the geoelectrical data revealed that the study area consists of three to four layers defined as the topsoil, clay/sandy clay layer, and weathered/fresh bedrock. The resistivity and thickness of the topsoil range from 51 to 1887.1Ωm and 0.3 to 3.2m respectively. The resistivity of the weathered layer varies between 13.4 and 415Ωm and is 2.0 to 17.2m thick. The layer comprises a mixture of clay and sandy clay. Bedrock varies between 109 and 70380Ωm whike depth to the bedrock ranges from 2.1 to 19.6m. The isopach map of the overburden and the bedrock relief map show that the study area is underlain by relatively thin (<10m) and relatively thick overburden (>10m) as well as bedrock ridges and depressions. Areas with thin overburden are associated with high bedrock relief (>350m) while those with thick overburden are associated with bedrock depression (<350m).

The Pacific Journal of Science and Technology –306– http://www.akamaiuniversity.us/PJST.htm Volume 16. Number 1. May 2015 (Spring)
The subsurface of the study area can support deep foundations, except at VES 28 where the overburden thickness is less than 3m. The areas underlain by sandy clay and bedrock ridges are expected to be more competent for safe foundation. The clay layer will be good foundation materials if the clay has activity less than 0.75 indicative of low swell-shrink potential. The results of this study will serve as useful guide in the choice of sites for engineering structures and also reduce the amount of geotechnical probes for foundation studies and hence reduce the overall cost of investigation.
(Keywords: geoelectric, foundation, geotechnical, overburden, bedrock)
INTRODUCTION Many engineering structures such as roads, buildings, and bridges are known to collapse shortly after construction and well before their design age. Poor construction materials, bad designs, usage factors, and poor drainage network are some of the factors considered as responsible for these failures. Geological factors are rarely considered as precipitators of foundation failure even though the foundation of such engineering structures is founded on geology. This is due to non-appreciation of the fact that proper design of engineering structures requires adequate knowledge of subsurface conditions beneath such structures. The non-recognition of this fact has led to loss of integrity of many engineering structures across the country (Olorunfemi et al 2000; Olorunfemi et al; 2005). The integrity of the foundation of many engineering structures can be undermined by the existence of geological features and/or engineering characteristics of the underlying geologic sequences. It is therefore vital for engineers to carry out pre-design investigations of engineering sites, the most important of which involves the use of applied geophysics beginning with geological near-surface structure and ending in the determination of the properties of soils and rocks by geophysical methods.
Geophysics is able to provide a broad, composite picture of the subsurface over large area with speed and economy not attainable by other means (Sharma, 1997). Geophysical surveys have been shown to be efficient and cost effective in also providing the required geotechnical information (Gokhale and Dasari, 1984; Adeduro et al., 1987; Ojo et al., 1990; Olorunfemi et al., 2000). Since the ongoing physical development on Ladoke Akintola University of Technology campus, Ogbomoso involves the construction of infrastructure such as roads, lecture theaters, office complexes and laboratories, it is important that the characteristics of the subsoils be understood so as to ensure that foundations of structures are safely sited. Geophysics can be applied to provide useful information regarding the early detection of potentially dangerous subsurface conditions. The sources of hazards in civil engineering works are essentially undetected near-surface structures such as cavities and/or inhomogeneities in foundation geomaterials (Olorunfemi and Mesida, 1987; Soupios et al., 2007). This study was therefore aimed at providing subsurface information meant to guide in the choice of the parts of the campus for the foundations of various proposed structures by ddelineating the geoelectric sequences using the layer parameters (layer resistivities and thicknesses), determining the nature and thickness of the overburden, depth to the bedrock, bedrock relief and possible presence of geological features which may cause structural failure. The information above would enable the construction engineers to take appropriate decisions in the design and siting of adequately safe foundations for future physical development projects on the university campus. The study area is located between Latitudes between 08
0 10ʹ N to 08
0 12ʹ N and Longitudes
040
15ʹE to 040 17ʹ E. The topographic elevation
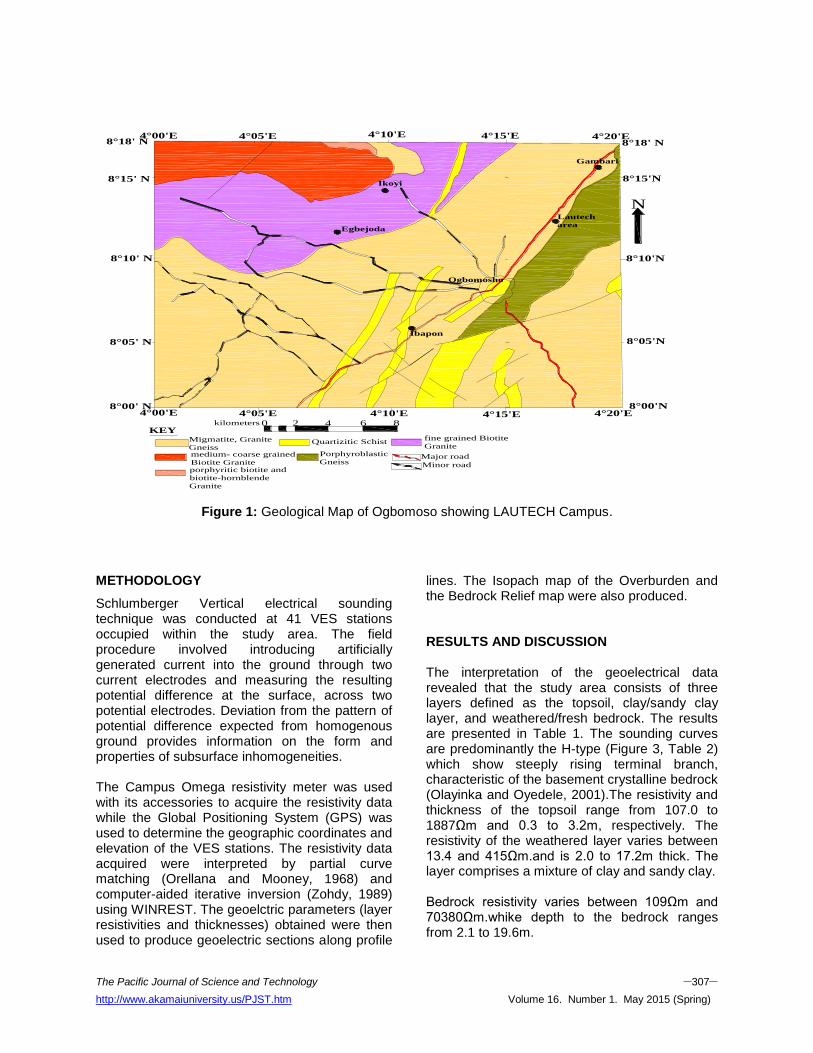
varies from about 322m to 388m at its highest points. It lies within the basement complex terrain of south-western Nigeria with migmatite gneiss and granite gneiss as the major rock types. The location and geology of the study area are presented in Figure 1.
The Pacific Journal of Science and Technology –307– http://www.akamaiuniversity.us/PJST.htm Volume 16. Number 1. May 2015 (Spring)
Figure 1: Geological Map of Ogbomoso showing LAUTECH Campus.
METHODOLOGY
Schlumberger Vertical electrical sounding technique was conducted at 41 VES stations occupied within the study area. The field procedure involved introducing artificially generated current into the ground through two current electrodes and measuring the resulting potential difference at the surface, across two potential electrodes. Deviation from the pattern of potential difference expected from homogenous ground provides information on the form and properties of subsurface inhomogeneities. The Campus Omega resistivity meter was used with its accessories to acquire the resistivity data while the Global Positioning System (GPS) was used to determine the geographic coordinates and elevation of the VES stations. The resistivity data acquired were interpreted by partial curve matching (Orellana and Mooney, 1968) and computer-aided iterative inversion (Zohdy, 1989) using WINREST. The geoelctric parameters (layer resistivities and thicknesses) obtained were then used to produce geoelectric sections along profile
lines. The Isopach map of the Overburden and the Bedrock Relief map were also produced. RESULTS AND DISCUSSION The interpretation of the geoelectrical data revealed that the study area consists of three layers defined as the topsoil, clay/sandy clay layer, and weathered/fresh bedrock. The results are presented in Table 1. The sounding curves are predominantly the H-type (Figure 3, Table 2) which show steeply rising terminal branch, characteristic of the basement crystalline bedrock (Olayinka and Oyedele, 2001).The resistivity and thickness of the topsoil range from 107.0 to 1887Ωm and 0.3 to 3.2m, respectively. The resistivity of the weathered layer varies between 13.4 and 415Ωm.and is 2.0 to 17.2m thick. The layer comprises a mixture of clay and sandy clay. Bedrock resistivity varies between 109Ωm and 70380Ωm.whike depth to the bedrock ranges from 2.1 to 19.6m.
8°15' N 8°15'N
8°00' N 8°00'N4°00'E 4°15'E
4°00'E 4°15'E
4°05'E 4°10'E
4°05'E 4°10'E
8°05' N
8°10' N 8°10'N
8°05'N
N
kilometers 0 2 4 6 8
Ogbomosho
Ikoyi
Egbejoda
Ibapon
KEYMigmatite, Granite
GneissQuartizitic Schist
fine grained Biotite
Granite
medium- coarse grained
Biotite Granite
Porphyroblastic
GneissMajor road
Minor road
Gambari
porphyritic biotite and
biotite-hornblende
Granite
Lautech
area
4°20'E
4°20'E8°18' N 8°18' N
The Pacific Journal of Science and Technology –308– http://www.akamaiuniversity.us/PJST.htm Volume 16. Number 1. May 2015 (Spring)
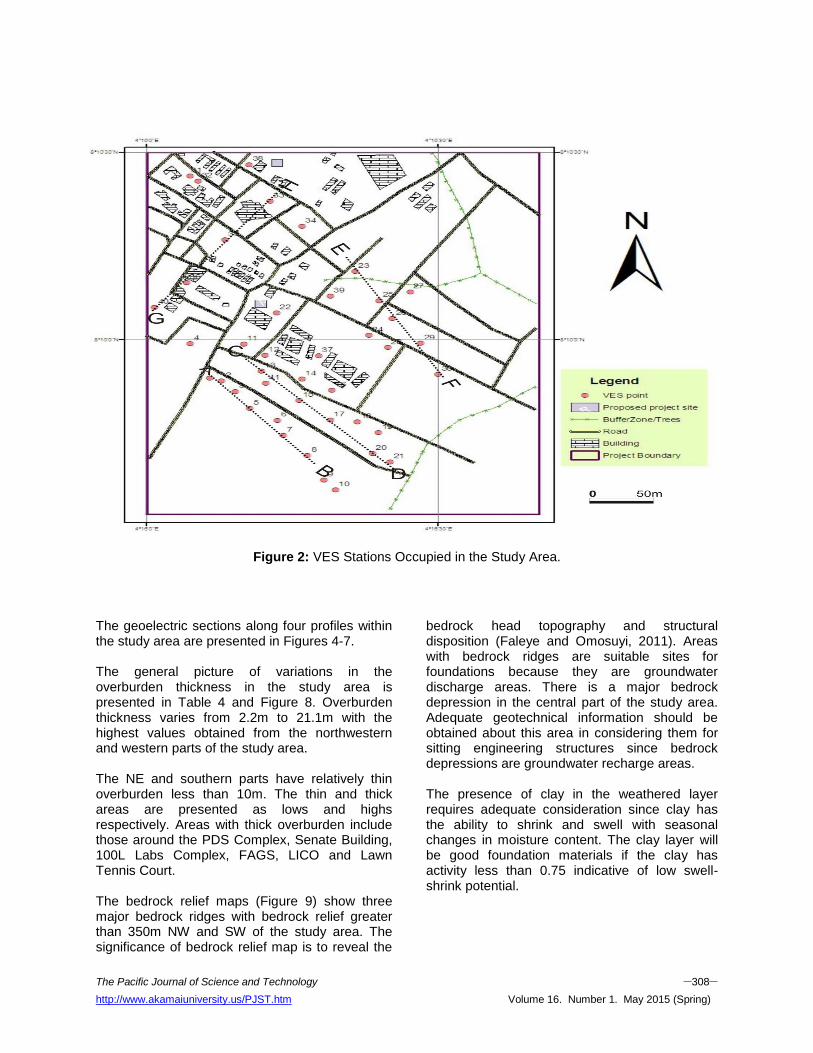
Figure 2: VES Stations Occupied in the Study Area.
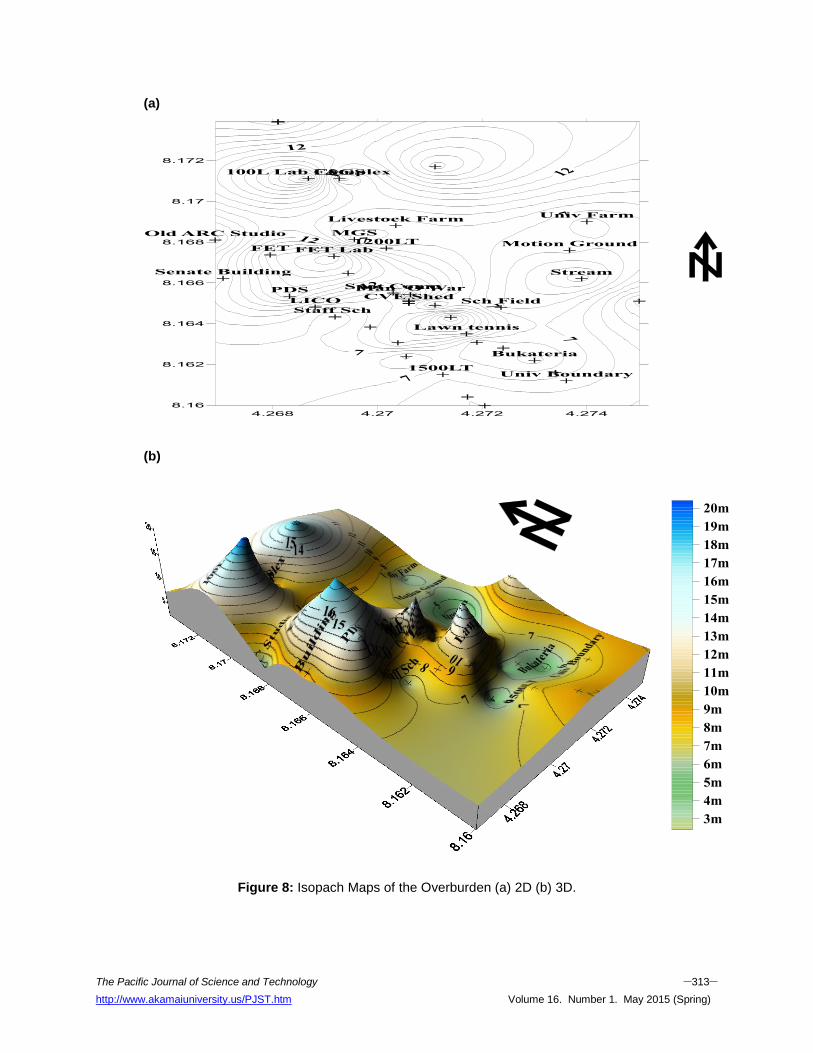
The geoelectric sections along four profiles within the study area are presented in Figures 4-7. The general picture of variations in the overburden thickness in the study area is presented in Table 4 and Figure 8. Overburden thickness varies from 2.2m to 21.1m with the highest values obtained from the northwestern and western parts of the study area. The NE and southern parts have relatively thin overburden less than 10m. The thin and thick areas are presented as lows and highs respectively. Areas with thick overburden include those around the PDS Complex, Senate Building, 100L Labs Complex, FAGS, LICO and Lawn Tennis Court. The bedrock relief maps (Figure 9) show three major bedrock ridges with bedrock relief greater than 350m NW and SW of the study area. The significance of bedrock relief map is to reveal the
bedrock head topography and structural disposition (Faleye and Omosuyi, 2011). Areas with bedrock ridges are suitable sites for foundations because they are groundwater discharge areas. There is a major bedrock depression in the central part of the study area. Adequate geotechnical information should be obtained about this area in considering them for sitting engineering structures since bedrock depressions are groundwater recharge areas. The presence of clay in the weathered layer requires adequate consideration since clay has the ability to shrink and swell with seasonal changes in moisture content. The clay layer will be good foundation materials if the clay has activity less than 0.75 indicative of low swell-shrink potential.

The Pacific Journal of Science and Technology –309– http://www.akamaiuniversity.us/PJST.htm Volume 16. Number 1. May 2015 (Spring)
Figure 3: Typical Sounding Curve from the Study Area.
Figure 4: Geoelectric Section Beneath Profile AB Comprising VES 1, 2, 3, 5, 7, and 8.
Table 1: Classification of Sounding Curves.
CLASS CURVE TYPE FREQUENCY
Class 1 H 38
Class 2 A 1
Class 3 HK 1
Class 4 HKH 1
TOTAL 41
The Pacific Journal of Science and Technology –310– http://www.akamaiuniversity.us/PJST.htm Volume 16. Number 1. May 2015 (Spring)
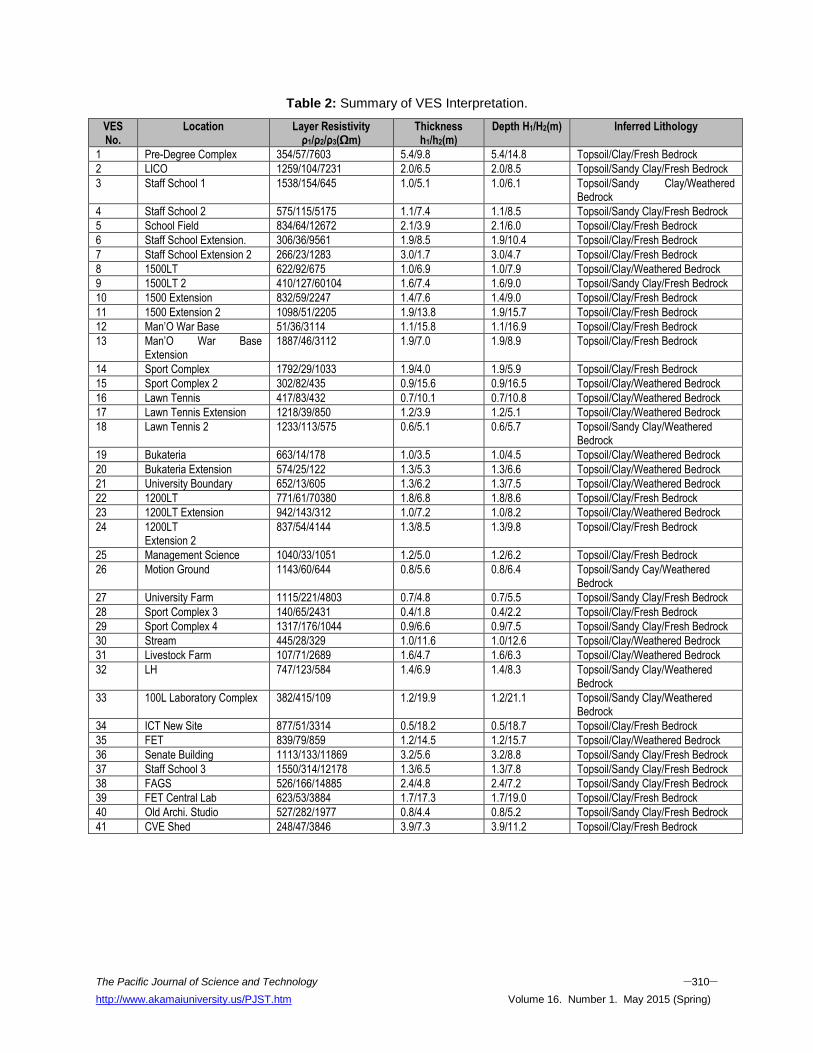
Table 2: Summary of VES Interpretation.
VES No.
Location Layer Resistivity ρ1/ρ2/ρ3(Ωm)
Thickness h1/h2(m)
Depth H1/H2(m) Inferred Lithology
1 Pre-Degree Complex 354/57/7603 5.4/9.8 5.4/14.8 Topsoil/Clay/Fresh Bedrock
2 LICO 1259/104/7231 2.0/6.5 2.0/8.5 Topsoil/Sandy Clay/Fresh Bedrock
3 Staff School 1 1538/154/645 1.0/5.1 1.0/6.1 Topsoil/Sandy Clay/Weathered Bedrock
4 Staff School 2 575/115/5175 1.1/7.4 1.1/8.5 Topsoil/Sandy Clay/Fresh Bedrock
5 School Field 834/64/12672 2.1/3.9 2.1/6.0 Topsoil/Clay/Fresh Bedrock
6 Staff School Extension. 306/36/9561 1.9/8.5 1.9/10.4 Topsoil/Clay/Fresh Bedrock
7 Staff School Extension 2 266/23/1283 3.0/1.7 3.0/4.7 Topsoil/Clay/Fresh Bedrock
8 1500LT 622/92/675 1.0/6.9 1.0/7.9 Topsoil/Clay/Weathered Bedrock
9 1500LT 2 410/127/60104 1.6/7.4 1.6/9.0 Topsoil/Sandy Clay/Fresh Bedrock
10 1500 Extension 832/59/2247 1.4/7.6 1.4/9.0 Topsoil/Clay/Fresh Bedrock
11 1500 Extension 2 1098/51/2205 1.9/13.8 1.9/15.7 Topsoil/Clay/Fresh Bedrock
12 Man’O War Base 51/36/3114 1.1/15.8 1.1/16.9 Topsoil/Clay/Fresh Bedrock
13 Man’O War Base Extension
1887/46/3112 1.9/7.0 1.9/8.9 Topsoil/Clay/Fresh Bedrock
14 Sport Complex 1792/29/1033 1.9/4.0 1.9/5.9 Topsoil/Clay/Fresh Bedrock
15 Sport Complex 2 302/82/435 0.9/15.6 0.9/16.5 Topsoil/Clay/Weathered Bedrock
16 Lawn Tennis 417/83/432 0.7/10.1 0.7/10.8 Topsoil/Clay/Weathered Bedrock
17 Lawn Tennis Extension 1218/39/850 1.2/3.9 1.2/5.1 Topsoil/Clay/Weathered Bedrock
18 Lawn Tennis 2 1233/113/575 0.6/5.1 0.6/5.7 Topsoil/Sandy Clay/Weathered Bedrock
19 Bukateria 663/14/178 1.0/3.5 1.0/4.5 Topsoil/Clay/Weathered Bedrock
20 Bukateria Extension 574/25/122 1.3/5.3 1.3/6.6 Topsoil/Clay/Weathered Bedrock
21 University Boundary 652/13/605 1.3/6.2 1.3/7.5 Topsoil/Clay/Weathered Bedrock
22 1200LT 771/61/70380 1.8/6.8 1.8/8.6 Topsoil/Clay/Fresh Bedrock
23 1200LT Extension 942/143/312 1.0/7.2 1.0/8.2 Topsoil/Clay/Weathered Bedrock
24 1200LT Extension 2
837/54/4144 1.3/8.5 1.3/9.8 Topsoil/Clay/Fresh Bedrock
25 Management Science 1040/33/1051 1.2/5.0 1.2/6.2 Topsoil/Clay/Fresh Bedrock
26 Motion Ground 1143/60/644 0.8/5.6 0.8/6.4 Topsoil/Sandy Cay/Weathered Bedrock
27 University Farm 1115/221/4803 0.7/4.8 0.7/5.5 Topsoil/Sandy Clay/Fresh Bedrock
28 Sport Complex 3 140/65/2431 0.4/1.8 0.4/2.2 Topsoil/Clay/Fresh Bedrock
29 Sport Complex 4 1317/176/1044 0.9/6.6 0.9/7.5 Topsoil/Sandy Clay/Fresh Bedrock
30 Stream 445/28/329 1.0/11.6 1.0/12.6 Topsoil/Clay/Weathered Bedrock
31 Livestock Farm 107/71/2689 1.6/4.7 1.6/6.3 Topsoil/Clay/Weathered Bedrock
32 LH 747/123/584 1.4/6.9 1.4/8.3 Topsoil/Sandy Clay/Weathered Bedrock
33 100L Laboratory Complex 382/415/109 1.2/19.9 1.2/21.1 Topsoil/Sandy Clay/Weathered Bedrock
34 ICT New Site 877/51/3314 0.5/18.2 0.5/18.7 Topsoil/Clay/Fresh Bedrock
35 FET 839/79/859 1.2/14.5 1.2/15.7 Topsoil/Clay/Weathered Bedrock
36 Senate Building 1113/133/11869 3.2/5.6 3.2/8.8 Topsoil/Sandy Clay/Fresh Bedrock
37 Staff School 3 1550/314/12178 1.3/6.5 1.3/7.8 Topsoil/Sandy Clay/Fresh Bedrock
38 FAGS 526/166/14885 2.4/4.8 2.4/7.2 Topsoil/Sandy Clay/Fresh Bedrock
39 FET Central Lab 623/53/3884 1.7/17.3 1.7/19.0 Topsoil/Clay/Fresh Bedrock
40 Old Archi. Studio 527/282/1977 0.8/4.4 0.8/5.2 Topsoil/Sandy Clay/Fresh Bedrock
41 CVE Shed 248/47/3846 3.9/7.3 3.9/11.2 Topsoil/Clay/Fresh Bedrock

The Pacific Journal of Science and Technology –311– http://www.akamaiuniversity.us/PJST.htm Volume 16. Number 1. May 2015 (Spring)
Figure 5: Geoelectric Section Beneath Profile CD Comprising VES 13, 15, 17, 20, and 21.
Figure 6: Geoelectric Section Beneath Profile EF Comprising VES 23, 25, 26, 29, and 30.
Figure 7: Geoelectric Section Beneath Profile GH Comprising VES 33, 35, 36, and 40.

The Pacific Journal of Science and Technology –312– http://www.akamaiuniversity.us/PJST.htm Volume 16. Number 1. May 2015 (Spring)
Table 3: Overburden Thickness and Bedrock Relief in the Study Area.
VES NO
LOCATION NORTHING (°)
EASTING (°)
ELEVATION (m)
OVERBURDEN THICKNESS (m)
BEDROCK RELIEF (m)
1 Pre-Degree Complex 8.16534 4.26832 358 19.5 338.5
2 LICO 8.16481 4.26881 363 7.7 355.3
3 Staff School 8.16433 4.26919 366 5.5 362.5
4 Staff School 2 8.16383 4.18628 347 8.5 338.5
5 School Field 8.16479 4.27236 346 6 340
6 Staff Sch. Ext. 8.16306 4.27039 350 10.4 339.6
7 Staff Sch. Extension 2 8.16239 4.27055 344 7.5 336.7
8 1500LT 8.1615 4.27125 339 7.9 331.1
9 1500LT 2 8.1604 4.27172 337 9 328
10 1500 Extension 8.15997 4.27205 335 9 326
11 1500 Extension 2 8.16647 4.26944 347 15.7 319.3
12 Man’O War Base 8.16542 4.27063 346 16.9 329.1
13 Man’O War Base Ext. 8.1655 4.2703 325 8.2 316.8
14 Sport Complex 8.1649 4.2711 329 9.2 319.8
15 Sport Complex 2 8.1643 4.2714 357 16.5 340.5
16 Lawn Tennis 8.1635 4.2717 343 9.8 333.2
17 Lawn Tennis Ext. 8.16308 4.2719 340 5.1 334.9
18 Lawn Tennis 2 8.1628 4.2724 352 5.7 346.3
19 Bukateria 8.1622 4.273 337 4.5 332.5
20 Bukateria Extension 8.1616 4.2734 334 6.6 327.4
21 University Boundary 8.1612 4.27361 327 7.5 321.5
22 1200LT 8.16770 4.27017 388 8.6 379.4
23 1200LT Extension 8.1651 4.2706 329 8.2 320.8
24 1200LT Ext. 2 8.165 4.2706 356 9.8 346.2
25 Management Science 8.16813 4.26956 356 6.2 349.8
26 Motion Ground 8.1676 4.27367 349 6.4 342.6
27 University Farm 8.169 4.274 341 5.6 335.4
28 Sport Complex 3 8.1662 4.2739 342 2.2 339.8
29 Sport Complex 4 8.1665 4.2745 340 7.5 332.5
30 Stream 8.1651 4.275 337 12.6 324.4
31 Livestock Farm 8.16881 4.27035 362 6.3 355.7
32 LH 8.1739 4.2681 369 8.3 360.7
33 100L Labs Complex 8.17112 4.26868 372 19.3 352.7
34 ICT New Site 8.1717 4.2711 351 18.7 332.3
35 FET 8.16737 4.26795 368 15.8 352.2
36 Senate Building 8.16622 4.26705 359 8.7 350.3
37 Staff School 3 8.1651 4.2706 353 7.8 345.2
38 FAGS 8.17111 4.26927 371 7 364
39 FET Labs 8.16730 4.26917 363 19 344
40 Archi. Studio 8.1681 4.2669 357 4.2 352.8
41 CVE Shed 8.165 4.2706 350 10.3 339.7
The Pacific Journal of Science and Technology –313– http://www.akamaiuniversity.us/PJST.htm Volume 16. Number 1. May 2015 (Spring)
(a)
(b)
Figure 8: Isopach Maps of the Overburden (a) 2D (b) 3D.

The Pacific Journal of Science and Technology –314– http://www.akamaiuniversity.us/PJST.htm Volume 16. Number 1. May 2015 (Spring)
(a)
(b)
Figure 9: Bedrock Relief Maps (a) 2D (b) 3D Map.

The Pacific Journal of Science and Technology –315– http://www.akamaiuniversity.us/PJST.htm Volume 16. Number 1. May 2015 (Spring)
CONCLUSION The geoelectric sections along the profiles revealed an inhomogeneous subsurface consisting of three layers namely: topsoil, clay/sandy clay layer and the weathered/fresh bedrock. The study area is underlain by bedrock ridges and depressions. Overburden thickness varies between 2.2m and 21.1m. The areas underlain by bedrock ridges are expected to be more competent for safe foundation since they are groundwater discharge zones and cannot easily accumulate water. Adequate geotechnical information should be obtained about the areas underlain by bedrock depression to ascertain the soil strength and suitability as foundation materials. The subsoil can support deep foundations, except at VES 28 where the overburden thickness is less than 3m. The presence of clay in the weathered layer requires adequate consideration since clay has the ability to shrink and swell with seasonal changes in moisture content. The clayey layers will be good foundation materials if the clay has activity less than 0.75 indicative of low swell-shrink potential. The results of this study will serve as useful guide in the choice of sites for engineering structures and also reduce the amount of geotechnical probes required for foundation studies and the overall cost of investigation. REFERENCES
1. Adeduro, A.D., B.D. Ako, and E.A. Mesida. 1987. “Damsite Foundation Investigation: An Experience in a Sedimentary Terrain”. Journ. Min, and Geol. 23(1&2):127-134.
2. Faleye, E.T. and G.O. Omosuyi. 2011. “Geophysical and Geotechnical Characterization of Foundation Beds at Kuchiyaku, Kuje Area, Abuja, Nigeria”. Journal of Emerging Trends in Engineering and Applied Sciences. 2(5):864-870.
3. Gokhale, K.V. and M.R. Dasari. 1984. Experiments
in Engineering Geology. McGraw-Hill: New Delhi, India. 144.
4. Ojo, J.S., T.A. Ayangbesan, and M.O. Olorunfemi. 1990. “Geophysical Survey of a Damsite: A Case Study”. Journal of Min. and Geol. 26(2):201-206.
5. Olayinka, A.I. and A.A. Oyedele. 2001. “Geoelectrical Investigation of Sites along the
Proposed Ibadan-Ilorin Dual Carriageway”. Journal Min. and Geol. 37(2):163-175.
6. Olorunfemi, M.O. and E.A. Mesida. 1987. “Engineering Geophysics and its Implication in Engineering Site Investigations (Case Study from Ile-Ife Area)”. The Nigerian Engineers. 22(2):57-
66.
7. Olorunfemi, M.O., J.S. Ojo, F.A. Sonuga, O. Ajayi, and M.I. Oladapo. 2000. “Geoelectric and Electromagnetic Investigation of the Failed Koza and Nassarawa Earth Dams around Katsina, Northern Nigeria”. Journal of Min, and Geol. 36(1):51-65.
8. Olorunfemi, M.O., J.S. Ojo, A.I. Idoringie, and W.E. Oyetoran. 2005. “Geophysical Investigation of Structural Failure of a Factory Site in Asaba Area, Southern Nigeria”. Journal of Min. and Geol. 41(2):111-121.
9. Orellana, E. and H.M. Mooney. 1968. Master Tables and Curves for Vertical Electrical Soundings over Layered Structures. Interciencia: Madrid. 34.
10. Sharma, P.V. 1997. Environmental and Engineering Geophysics. Cambridge University Press: Cambridge: U.K. 475p.
11. Soupios, P.M., P. Geogarkopoulos, N. Papadopoulos, V. Saltas, A. Andreadakis, F. Vallianatos, A. Sarris, and J.P. Makris. 2007. “Use of Engineering Geophysics to Investigate a Site for Building Foundation”. Journal of Geophysics and Engineering. 4:99-103.
12. Zohdy, A.A.R. 1989. “A New Method for the Automatic Interpretation of Schlumberger and Wenner Sounding Curves”. Geophysics. 54:245-253.
SUGGESTED CITATION Akinlabi, I.A., O.T. Adegoke, and O.R. Bolatan. 2015. “Geophysical Evaluation of Foundation Soils in a Basement Complex Terrain: A Case Study of LAUTECH Campus, Ogbomoso Sout-western Nigeria”. Pacific Journal of Science and Technology. 16(1):305-315.
Pacific Journal of Science and Technology