Embed Size (px)
Citation preview
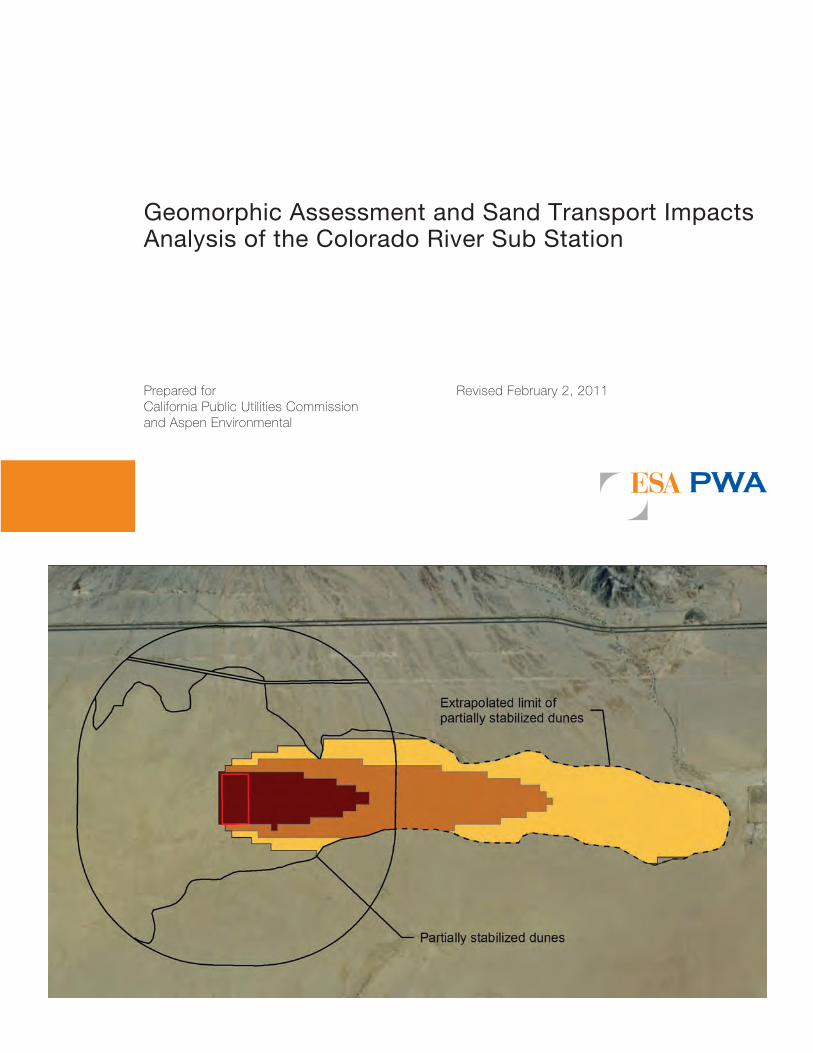
Geomorphic Assessment and Sand Transport Impacts Analysis of the Colorado River Sub Station
Revised February 2, 2011Prepared forCalifornia Public Utilities Commissionand Aspen Environmental
J:\2039_CRSS_Sand_Analysis\Report\CRSS_PWA_SandTransportEffects112310.doc
11/24/10
Services provided pursuant to this Agreement are intended solely for the use and benefit of the California Public Utilities Commission and Aspen Environmental. No other person or entity shall be entitled to rely on the services, opinions, recommendations, plans or specifications provided pursuant to this agreement without the express written consent of Philip Williams & Associates, Ltd., 550 Kearny Street, Suite 900, San Francisco, CA 94108.
Page i
TABLE OF CONTENTS
Page No.
1. OBJECTIVES OF THIS APPENDIX 1
2. SUMMARY OF KEY FINDINGS 1
3. RELATIONSHIP BETWEEN HYDRO-GEOMORPHIC PROCESSES AND BIOLOGICAL RESOURCES 2
4. DESCRIPTION OF THE CRSS PROJECT SITE 8 4.1 IDENTIFYING THE EXTENT OF MFTL HABITAT 9 4.2 MAJOR LAND UNITS 11
5. ASSESSING THE IMPACTS OF THE PROJECT ON SAND TRANSPORT TO DUNE HABITAT 13
5.1 BACKGROUND AND DEFINITION OF SAND SHADOWS 13 5.2 DESCRIPTION OF THE ESA PWA SAND TRANSPORT MODEL 13
5.2.1 Model Theory 13 5.2.2 Computational Framework for the Sand Transport Model 14 5.2.3 Assigning primary and secondary sand transport directions to the model 15 5.2.4 Upwind boundary condition 16
5.3 SIMULATION OF PROJECT ALTERNATIVES 16 5.4 DISCUSSION OF RESULTS 26
6. REFERENCES 27
7. LIST OF PREPARERS 28
8. APPENDIX A – EXCERPTS FROM KENNEY, M. 2010. PRELIMINARY GEOMORPHIC AEOLIAN REPORT: COLORADO RIVER SUBSTATION, RIVERSIDE COUNTY, CA 29
Page 1
1. OBJECTIVES OF THIS APPENDIX The Colorado River Sub Station Project (Project or Proposed Project) is a proposed electricity substation to support a number of nearby solar energy projects. The project site is located in the Chuckwalla Valley of the Mojave Desert. This area supports a series of sand dune habitats that are reliant on the delivery of fine sand from wind (aeolian) and water (fluvial) sources. The objectives of this Appendix are to:
1. Provide a brief description of the Project area’s sand dunes and a discussion of the sand transport processes that created and now maintain the existing dunes.
2. Provide a discussion of potential direct and indirect impacts of the Proposed Project and its alternatives on the existing sand dune system and the processes that support them.
3. Describe mitigation for those impacts, or a well-supported conclusion that those impacts cannot be mitigated.
2. SUMMARY OF KEY FINDINGS The Proposed Project area is located in the most active part of the Chuckwalla sand transport corridor, a regionally-significant geomorphic feature that transports sand by wind action to a series of sand dune habitat areas that support Mojave Fringe Toed Lizards (MFTL). In addition to directly impacting an area of sand dunes, the project will block wind transport of sand and will create a ‘sand shadow’ downwind (east) of the site. Sand shadows are areas where the upwind supply of sand is cut off by wind fences and other infrastructure, but where existing sand can be eroded downwind, resulting in the loss of the fine sand upon which dune habitats are dependent. Previous studies have shown that such sand shadows result in dune deflation, substrate coarsening and complete loss of MFTL habitat within a period from a few months to a few years (Griffith et al. 2002; Turner et al. 1984). Sand transport modeling results indicate that if implemented the CRSS 500 kV Expansion Project in its originally intended location (Alternative 1) would create a total of 90 acres of direct impact to dune areas within the sand transport corridor and 1,365 acres of indirect (sand shadow) impacts downwind of the Project where we would expect to see deflation and dune loss within the life of the Project. Other locations and configurations analyzed as part of this study would create 10 - 120 acres of direct impacts and 10-1,280 acres of indirect impacts. Calculated direct and indirect impacts for each alternative are summarized in Table 1.
Page 2
3. RELATIONSHIP BETWEEN HYDRO-GEOMORPHIC PROCESSES AND
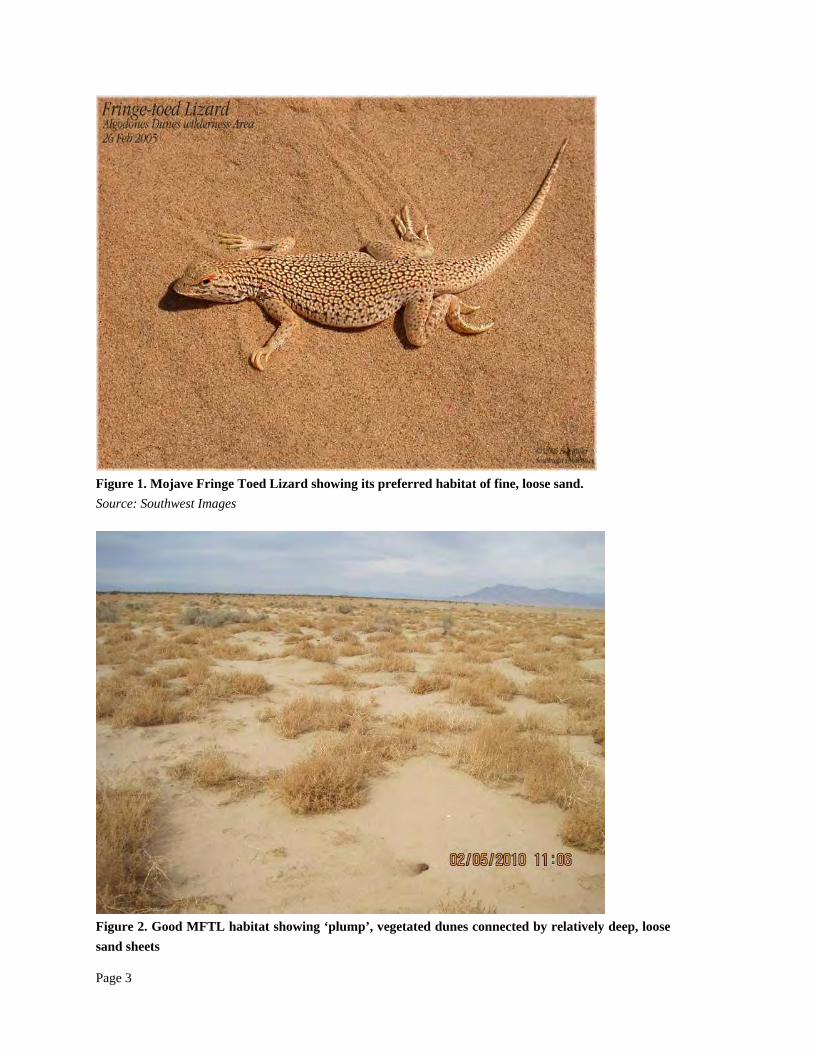
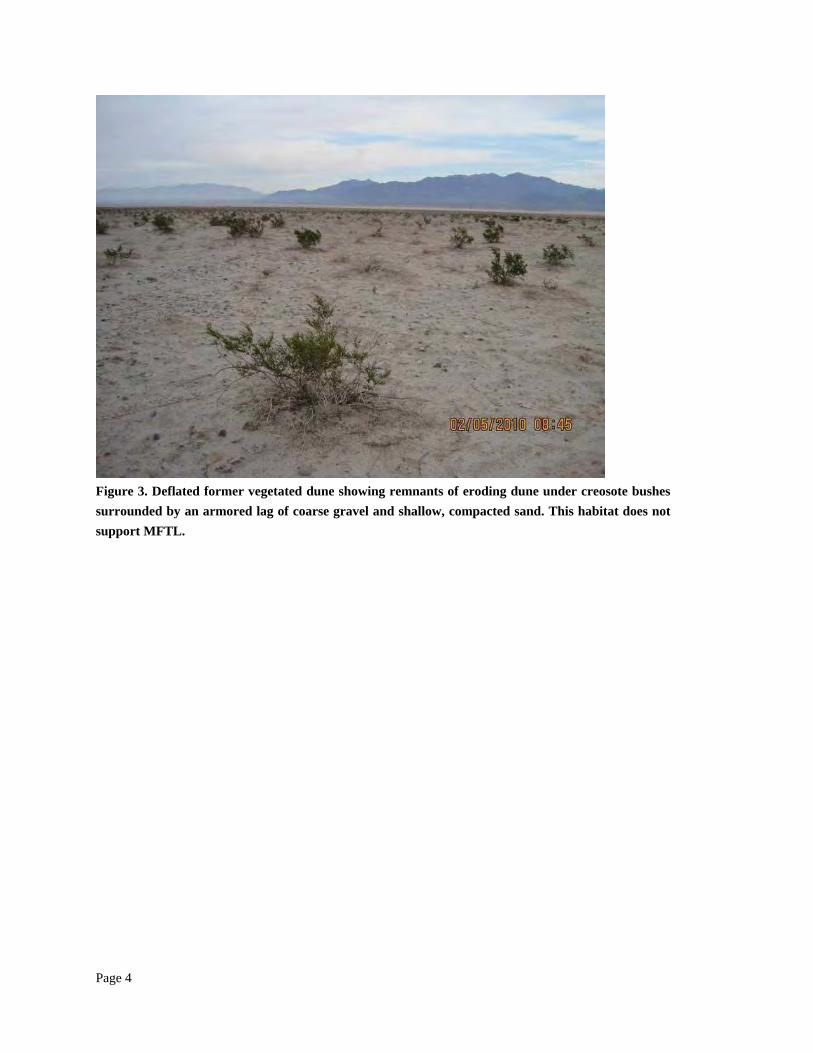
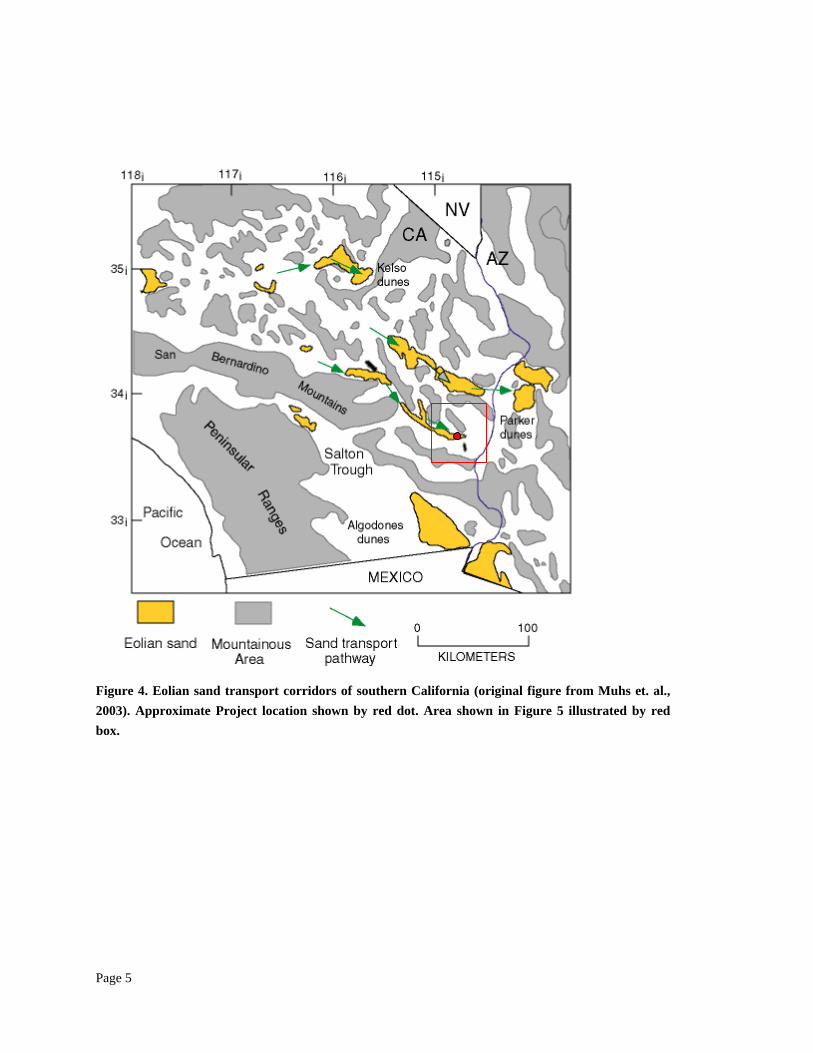
BIOLOGICAL RESOURCES This Appendix focuses on several hydro-geomorphic processes that play a significant role in the health of the ecosystem of the Project site and its surroundings. These processes are wind transportation of sand relative to the creation, preservation and destruction of sand dunes, and water transport of sediment through the alluvial fan drainage system. Sand dune fauna such as MFTL rely on a regular supply of fine wind blown sand for their habitat (Figure 1). Active sand dunes (dunes that have an active layer of mobile sand) exist in a state of dynamic equilibrium: they are continuously losing sand downwind due to erosion and transport, but that is offset by supplies of new sand from upwind (see Figure 2). If the sand supply is cut off the dunes deflate; that is to say they lose sand downwind and shrink in size and depth (see Figure 3 for an example). The finest sand (which is most easily transported) is lost first with coarser sand and gravel being left behind to form an armor or lag. This combination of lag and thin sand deposits does not support many dune-dependent species. For example, Turner et al (1984) conducted experiments on paired plots of sand dunes up and downwind of wind barriers to look at abundance of MFTL. They showed that downwind sand dunes experienced deflation within 4-17 years of the erection of a relatively small wind barrier (a single line of tamarisk trees) and that while MFTL were abundant upwind of the barriers they were virtually absent downwind. Thus barriers pose a direct threat to sand transport and habitat. Maintaining MFTL habitat requires the regular addition of wind-blown sand from a reliable source. Most of the sand dune habitat in the Mojave Desert follows discrete pathways referred to as sand transport corridors. These have been approximately mapped by Muhs et al. (2003) and are shown relative to the Project site in Figures 4 and 5. The presence and location of sand transport corridors are controlled by the availability of sand that can be eroded and transported by wind, the prevailing wind direction, and topography (especially the presence of fault-controlled troughs). Most sand corridors trend approximately northwest to southeast along troughs. Additional sand is added to corridors from local wind corridors that can be thought of as ‘sand corridor tributaries’ and by fluvial sources. Alluvial fan channels transport sand from the mountain fronts to the troughs. With increasing distance away from the mountain front the sand is preferentially sorted1 and reduced in size by abrasion. At a sufficient distance down-fan sediment becomes fine enough to be picked up and transported by wind action. This creates local dune habitat around ephemeral channels and supplies material downwind to accumulate in larger sand corridors.
1 “Preferential sorting”. Alluvial fans are made up of distributary drainage systems that spread water into increasing
numbers of smaller channels as water moves downstream (the opposite of most temperate drainage networks). As water
spreads out the channels lose sediment transport capacity and the coarsest particles are deposited first, with
successively smaller particles being passed downstream.
Page 3
Figure 1. Mojave Fringe Toed Lizard showing its preferred habitat of fine, loose sand. Source: Southwest Images
Figure 2. Good MFTL habitat showing ‘plump’, vegetated dunes connected by relatively deep, loose sand sheets
Page 4
Figure 3. Deflated former vegetated dune showing remnants of eroding dune under creosote bushes surrounded by an armored lag of coarse gravel and shallow, compacted sand. This habitat does not support MFTL.
Page 5
Figure 4. Eolian sand transport corridors of southern California (original figure from Muhs et. al., 2003). Approximate Project location shown by red dot. Area shown in Figure 5 illustrated by red box.
CRSS Sand Transport Analysisfigure 5
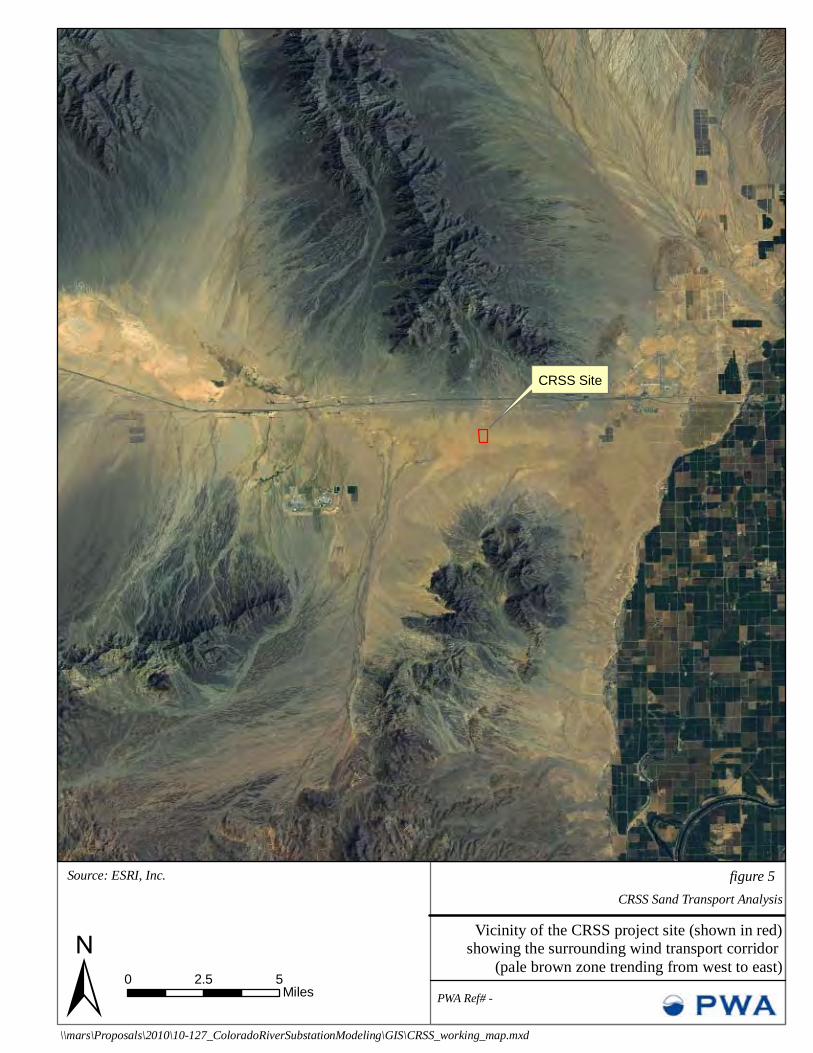
Vicinity of the CRSS project site (shown in red) showing the surrounding wind transport corridor
(pale brown zone trending from west to east)PWA Ref# -
\\mars\Proposals\2010\10-127_ColoradoRiverSubstationModeling\GIS\CRSS_working_map.mxd±Source: ESRI, Inc.
0 52.5 Miles
CRSS Site
Page 7
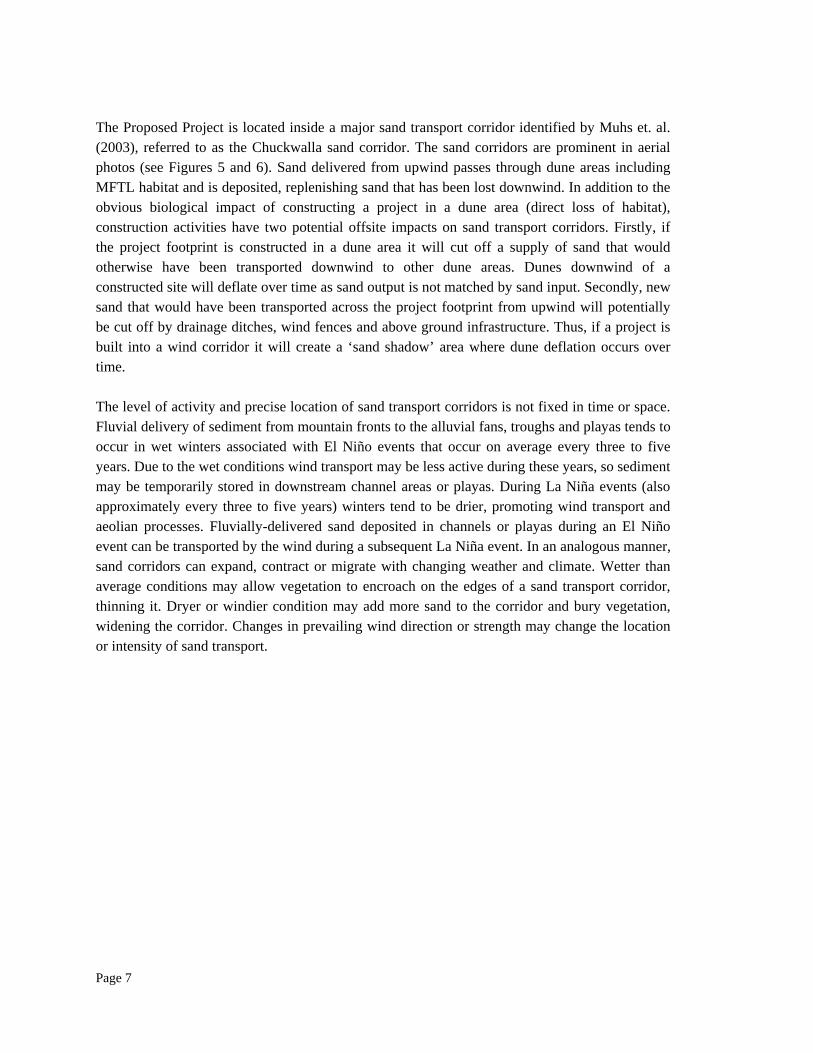
The Proposed Project is located inside a major sand transport corridor identified by Muhs et. al. (2003), referred to as the Chuckwalla sand corridor. The sand corridors are prominent in aerial photos (see Figures 5 and 6). Sand delivered from upwind passes through dune areas including MFTL habitat and is deposited, replenishing sand that has been lost downwind. In addition to the obvious biological impact of constructing a project in a dune area (direct loss of habitat), construction activities have two potential offsite impacts on sand transport corridors. Firstly, if the project footprint is constructed in a dune area it will cut off a supply of sand that would otherwise have been transported downwind to other dune areas. Dunes downwind of a constructed site will deflate over time as sand output is not matched by sand input. Secondly, new sand that would have been transported across the project footprint from upwind will potentially be cut off by drainage ditches, wind fences and above ground infrastructure. Thus, if a project is built into a wind corridor it will create a ‘sand shadow’ area where dune deflation occurs over time. The level of activity and precise location of sand transport corridors is not fixed in time or space. Fluvial delivery of sediment from mountain fronts to the alluvial fans, troughs and playas tends to occur in wet winters associated with El Niño events that occur on average every three to five years. Due to the wet conditions wind transport may be less active during these years, so sediment may be temporarily stored in downstream channel areas or playas. During La Niña events (also approximately every three to five years) winters tend to be drier, promoting wind transport and aeolian processes. Fluvially-delivered sand deposited in channels or playas during an El Niño event can be transported by the wind during a subsequent La Niña event. In an analogous manner, sand corridors can expand, contract or migrate with changing weather and climate. Wetter than average conditions may allow vegetation to encroach on the edges of a sand transport corridor, thinning it. Dryer or windier condition may add more sand to the corridor and bury vegetation, widening the corridor. Changes in prevailing wind direction or strength may change the location or intensity of sand transport.
Page 8
4. DESCRIPTION OF THE CRSS PROJECT SITE
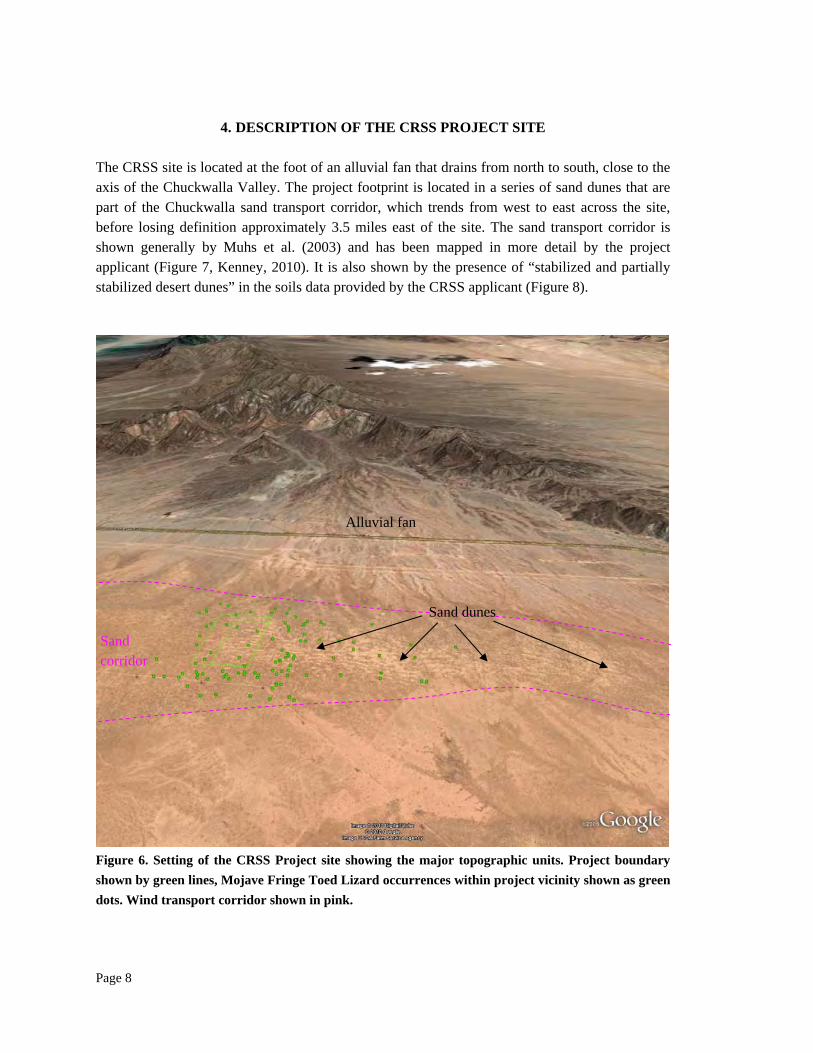
The CRSS site is located at the foot of an alluvial fan that drains from north to south, close to the axis of the Chuckwalla Valley. The project footprint is located in a series of sand dunes that are part of the Chuckwalla sand transport corridor, which trends from west to east across the site, before losing definition approximately 3.5 miles east of the site. The sand transport corridor is shown generally by Muhs et al. (2003) and has been mapped in more detail by the project applicant (Figure 7, Kenney, 2010). It is also shown by the presence of “stabilized and partially stabilized desert dunes” in the soils data provided by the CRSS applicant (Figure 8).
Figure 6. Setting of the CRSS Project site showing the major topographic units. Project boundary shown by green lines, Mojave Fringe Toed Lizard occurrences within project vicinity shown as green dots. Wind transport corridor shown in pink.
Alluvial fan
Sand dunes
Sand corridor
Page 9
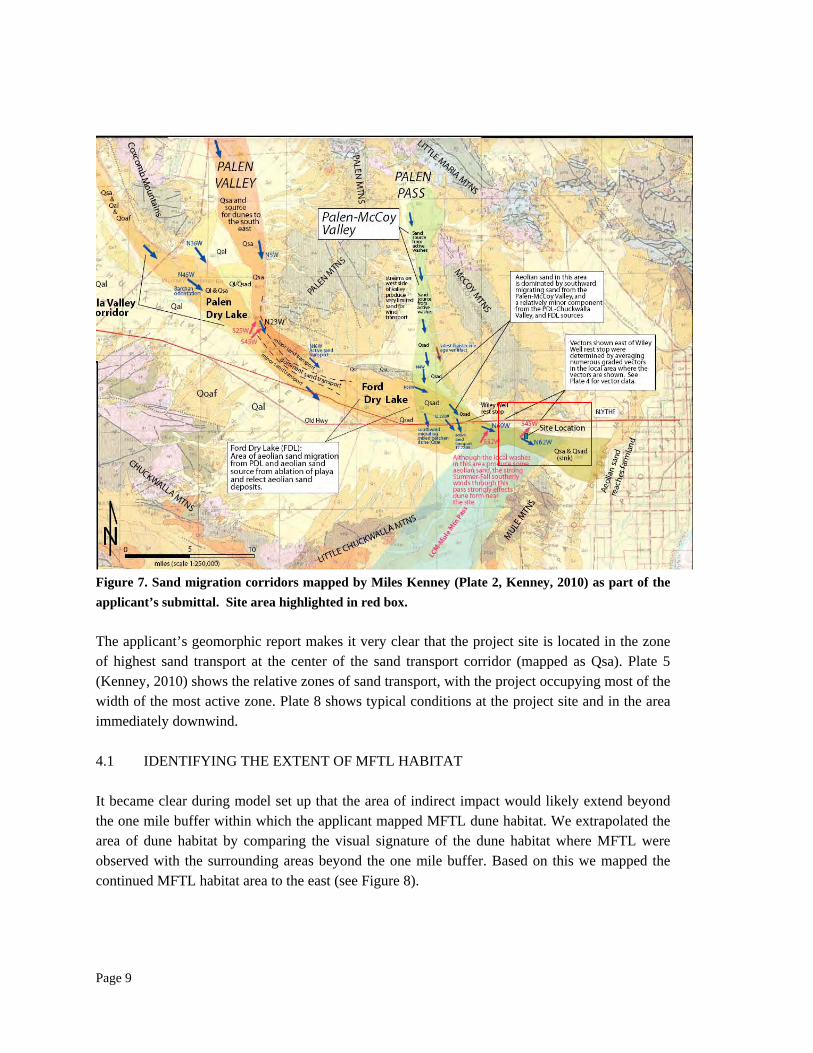
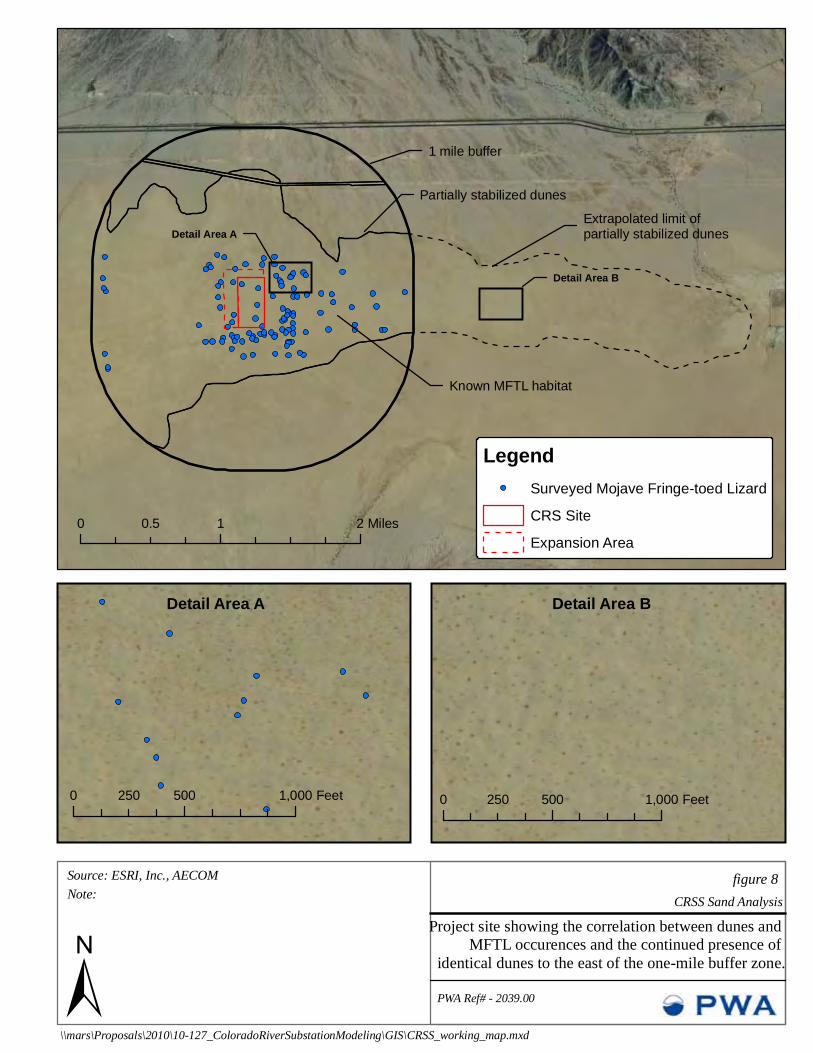
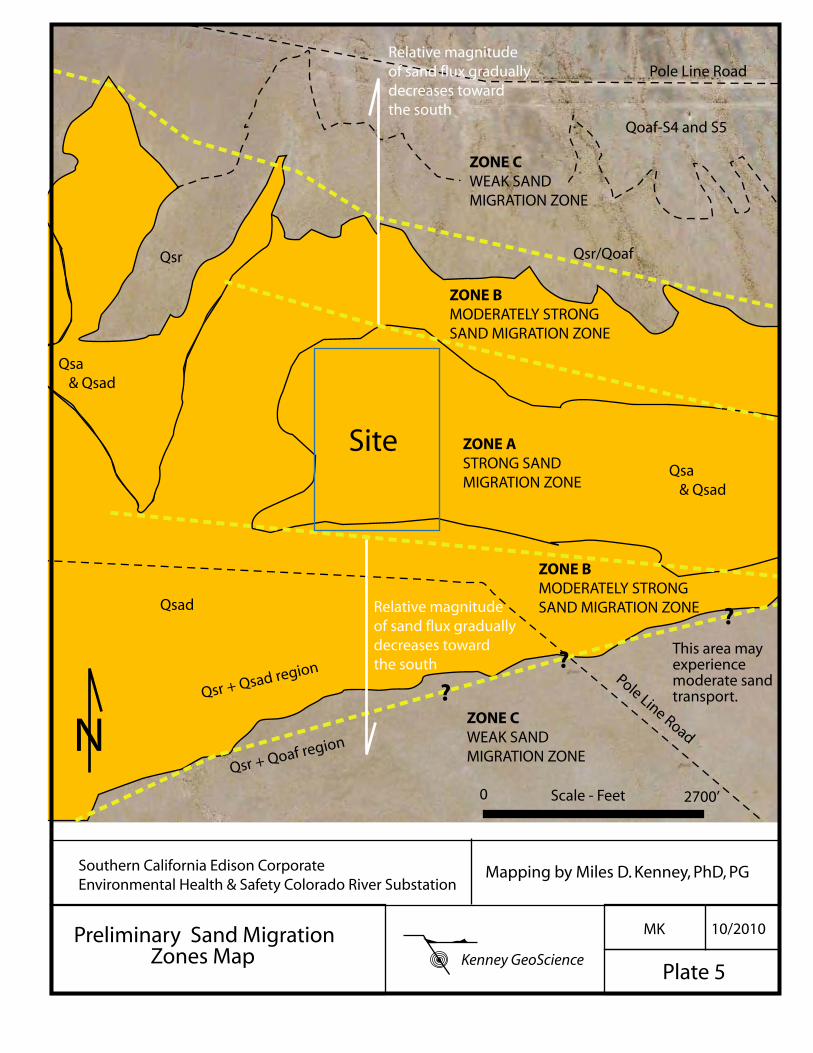
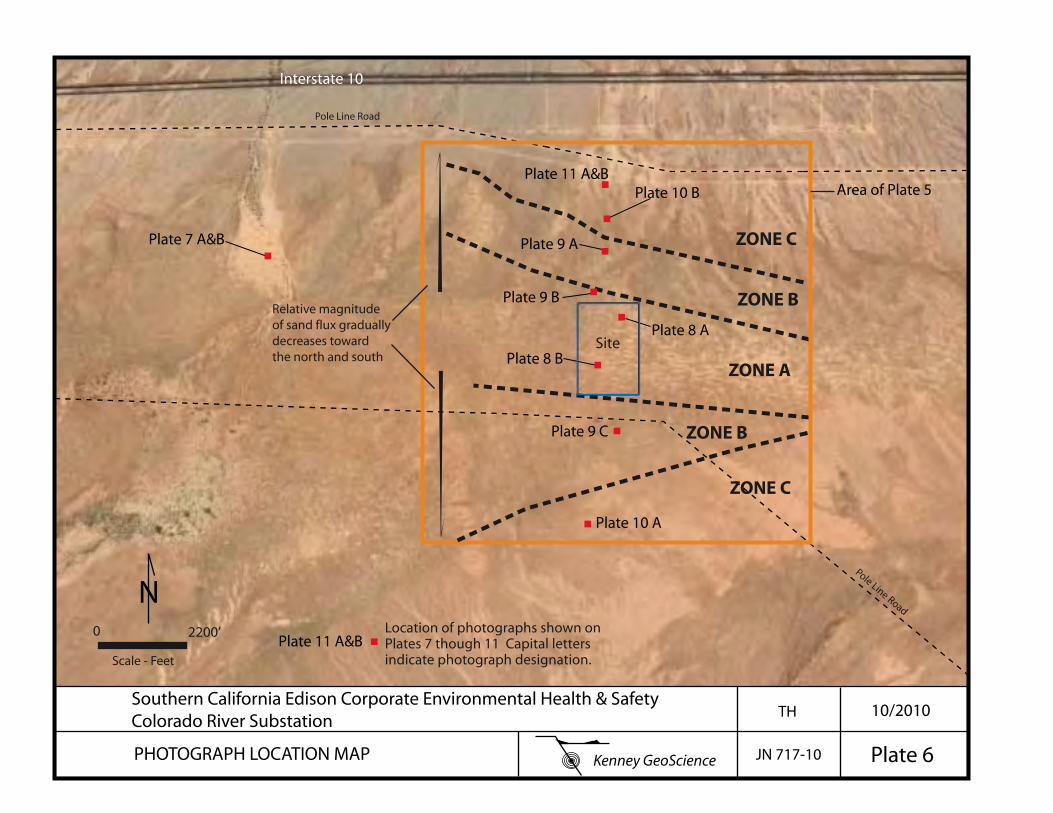
Figure 7. Sand migration corridors mapped by Miles Kenney (Plate 2, Kenney, 2010) as part of the applicant’s submittal. Site area highlighted in red box. The applicant’s geomorphic report makes it very clear that the project site is located in the zone of highest sand transport at the center of the sand transport corridor (mapped as Qsa). Plate 5 (Kenney, 2010) shows the relative zones of sand transport, with the project occupying most of the width of the most active zone. Plate 8 shows typical conditions at the project site and in the area immediately downwind. 4.1 IDENTIFYING THE EXTENT OF MFTL HABITAT It became clear during model set up that the area of indirect impact would likely extend beyond the one mile buffer within which the applicant mapped MFTL dune habitat. We extrapolated the area of dune habitat by comparing the visual signature of the dune habitat where MFTL were observed with the surrounding areas beyond the one mile buffer. Based on this we mapped the continued MFTL habitat area to the east (see Figure 8).
CRSS Sand Analysisfigure 8
Project site showing the correlation between dunes and MFTL occurences and the continued presence of
identical dunes to the east of the one-mile buffer zone.PWA Ref# - 2039.00
\\mars\Proposals\2010\10-127_ColoradoRiverSubstationModeling\GIS\CRSS_working_map.mxd±Source: ESRI, Inc., AECOMNote:
0 1 20.5 Miles
LegendSurveyed Mojave Fringe-toed LizardCRS SiteExpansion Area
0 500 1,000250 Feet 0 500 1,000250 Feet
1 mile buffer
Partially stabilized dunesExtrapolated limit of partially stabilized dunes
Known MFTL habitat
Detail Area B
Detail Area A
Detail Area A Detail Area B
Page 11
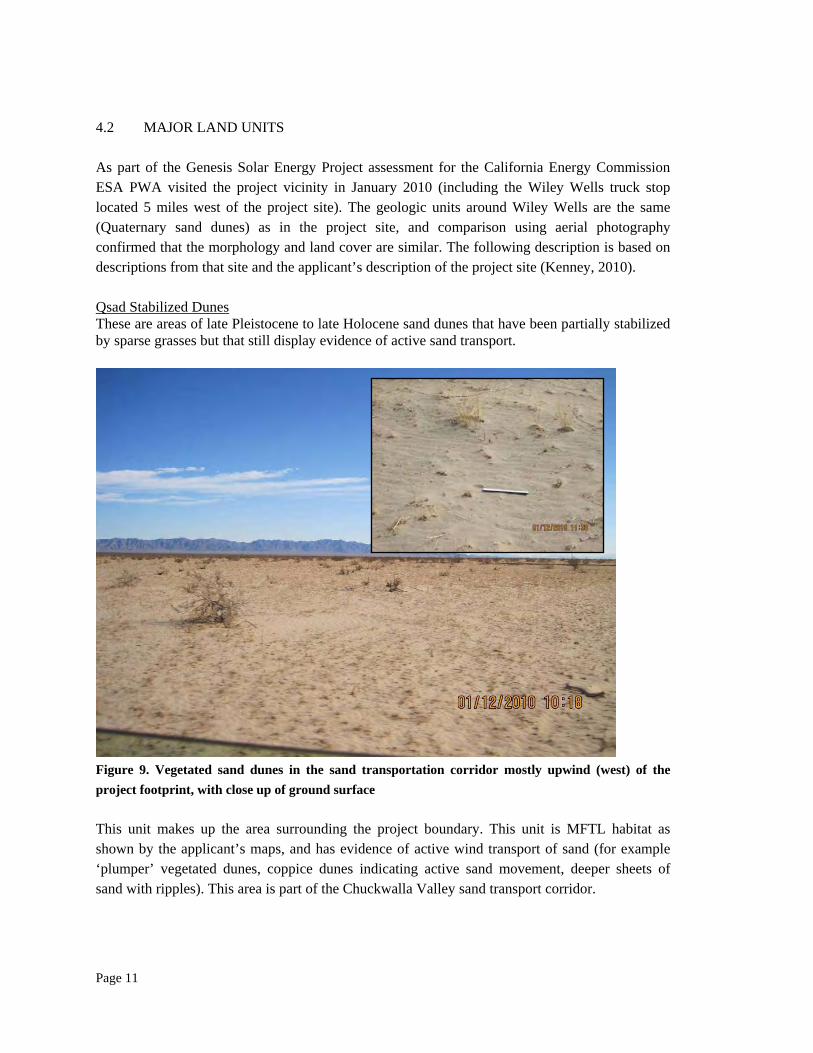
4.2 MAJOR LAND UNITS As part of the Genesis Solar Energy Project assessment for the California Energy Commission ESA PWA visited the project vicinity in January 2010 (including the Wiley Wells truck stop located 5 miles west of the project site). The geologic units around Wiley Wells are the same (Quaternary sand dunes) as in the project site, and comparison using aerial photography confirmed that the morphology and land cover are similar. The following description is based on descriptions from that site and the applicant’s description of the project site (Kenney, 2010). Qsad Stabilized Dunes These are areas of late Pleistocene to late Holocene sand dunes that have been partially stabilized by sparse grasses but that still display evidence of active sand transport.
Figure 9. Vegetated sand dunes in the sand transportation corridor mostly upwind (west) of the project footprint, with close up of ground surface This unit makes up the area surrounding the project boundary. This unit is MFTL habitat as shown by the applicant’s maps, and has evidence of active wind transport of sand (for example ‘plumper’ vegetated dunes, coppice dunes indicating active sand movement, deeper sheets of sand with ripples). This area is part of the Chuckwalla Valley sand transport corridor.
Page 12
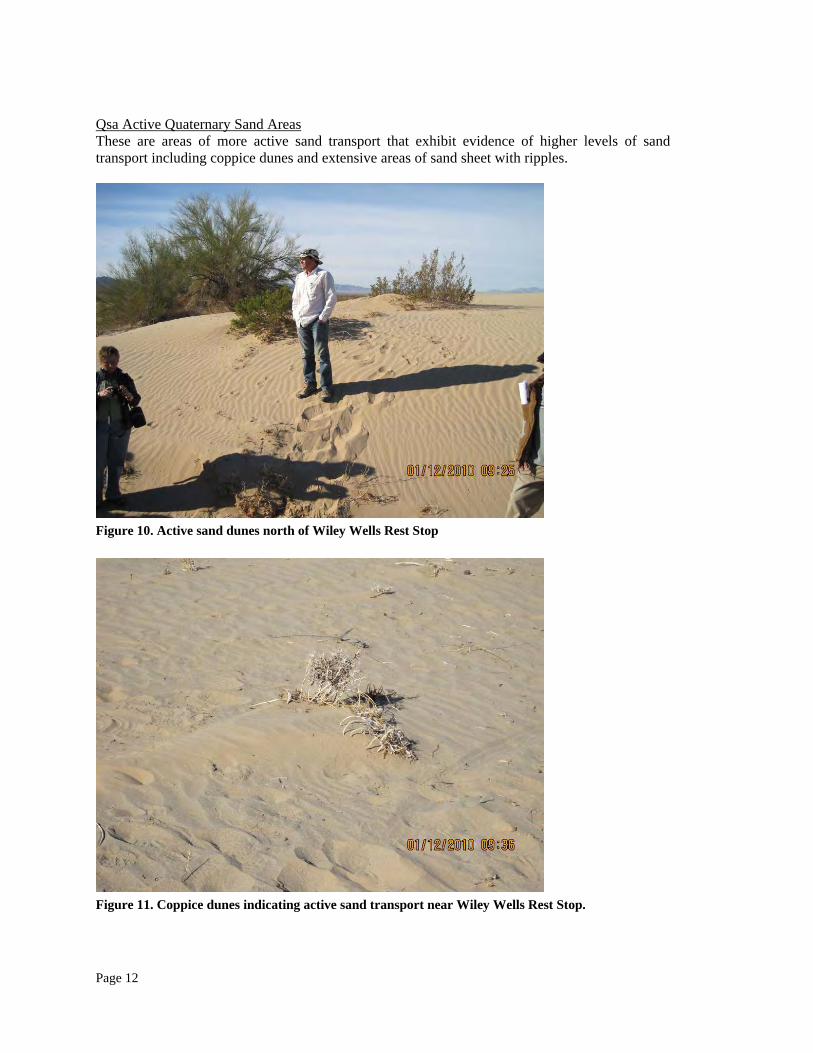
Qsa Active Quaternary Sand Areas These are areas of more active sand transport that exhibit evidence of higher levels of sand transport including coppice dunes and extensive areas of sand sheet with ripples.
Figure 10. Active sand dunes north of Wiley Wells Rest Stop
Figure 11. Coppice dunes indicating active sand transport near Wiley Wells Rest Stop.
Page 13
5. ASSESSING THE IMPACTS OF THE PROJECT ON SAND TRANSPORT TO DUNE
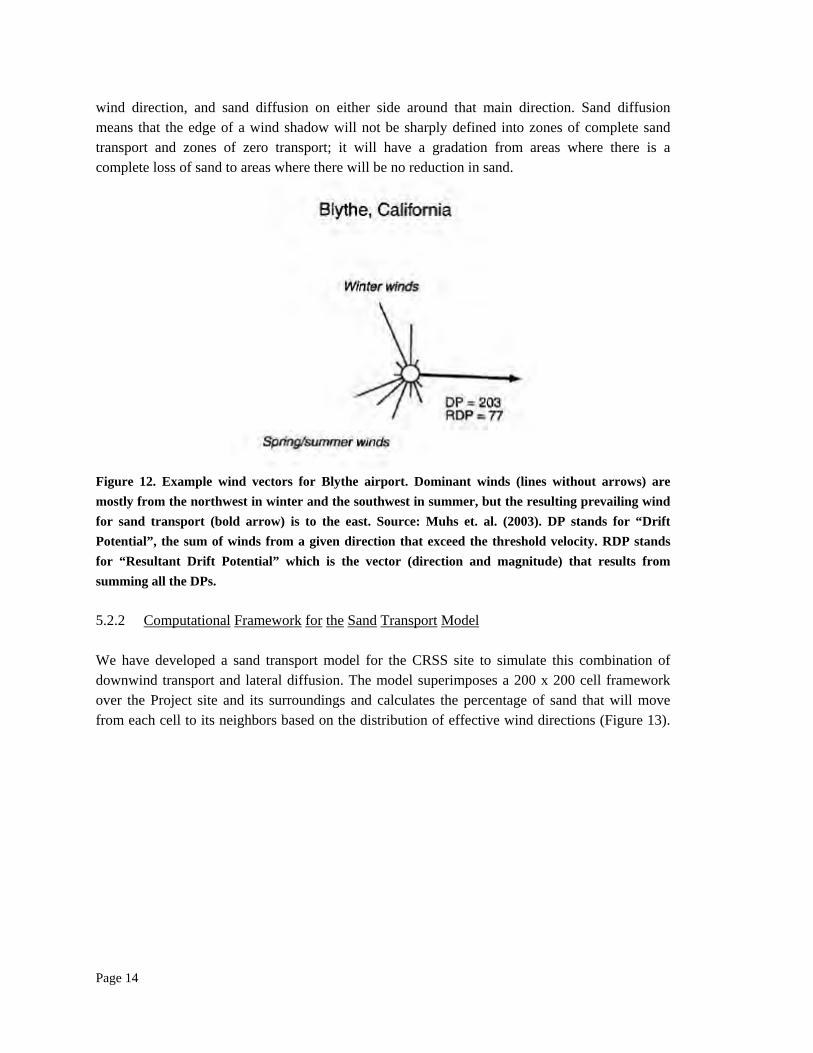
HABITAT 5.1 BACKGROUND AND DEFINITION OF SAND SHADOWS The primary off-site impact is disruption of sand transport to the sand transport corridor. The Project has the potential to disrupt the Chuckwalla wind transport corridor because it presents a ground-level boundary to sand movement. Most sand transport (as opposed to dust transport) occurs close to the ground through the processes of rolling and saltation (bouncing of sand particles). For example, Bagnold (1941) found that the mean elevation of saltating sand grains with a diameter of 0.25 mm was less than 1 cm off the ground, and more recent research has found that 90 percent of sand transport occurs within 30 cm of the ground surface. We would therefore expect the project to pose an effective barrier to sand transport, and create a sand shadow downwind. A sand shadow is an area downwind of a sand barrier where the wind is able to remove fine sand but there is no replacement by sand from upwind. Over time existing sand dunes in a shadow area will be deflated – they will shrink and become thinner and coarser as the fine sand is blown away by the wind. Deflated dunes have little or no habitat value for MFTL and other fine sand dependent species. 5.2 DESCRIPTION OF THE ESA PWA SAND TRANSPORT MODEL In order to quantitatively assess the area of sand shadow associated with different Project alternatives ESA PWA developed a numerical model of sand transport. The model predicts areas of sand shadow in response to inputs of prevailing wind direction, distribution of wind around that mean, and the location of sand barriers. 5.2.1 Model Theory Sand transport occurs when wind speed exceeds a threshold velocity that varies with material size but is often assumed to be around 14 miles per hour. Sand is transported in whatever direction the wind is traveling once it exceeds the threshold velocity. Over time a prevailing direction emerges, and sand dunes reflect that prevailing direction (for example, coppice2 dunes develop tails that are oriented away from the prevailing wind that transports sand). However, the prevailing wind is the resultant vector of numerous wind events with different orientations. This is illustrated in Figure 12, which shows the distribution of wind with differing speeds and the resulting prevailing wind transport direction for Blythe. Because of the variations in wind direction over a year sand transport can be thought of as two processes: primary sand migration that follows the prevailing 2 Coppice dunes are small dunes that form around vegetation with a ‘teardrop’ shape that is oriented with the blunt end facing into the prevailing wind. They indicate the prevailing direction of wind transport.
Page 14
wind direction, and sand diffusion on either side around that main direction. Sand diffusion means that the edge of a wind shadow will not be sharply defined into zones of complete sand transport and zones of zero transport; it will have a gradation from areas where there is a complete loss of sand to areas where there will be no reduction in sand.
Figure 12. Example wind vectors for Blythe airport. Dominant winds (lines without arrows) are mostly from the northwest in winter and the southwest in summer, but the resulting prevailing wind for sand transport (bold arrow) is to the east. Source: Muhs et. al. (2003). DP stands for “Drift Potential”, the sum of winds from a given direction that exceed the threshold velocity. RDP stands for “Resultant Drift Potential” which is the vector (direction and magnitude) that results from summing all the DPs. 5.2.2 Computational Framework for the Sand Transport Model We have developed a sand transport model for the CRSS site to simulate this combination of downwind transport and lateral diffusion. The model superimposes a 200 x 200 cell framework over the Project site and its surroundings and calculates the percentage of sand that will move from each cell to its neighbors based on the distribution of effective wind directions (Figure 13).
Page 15
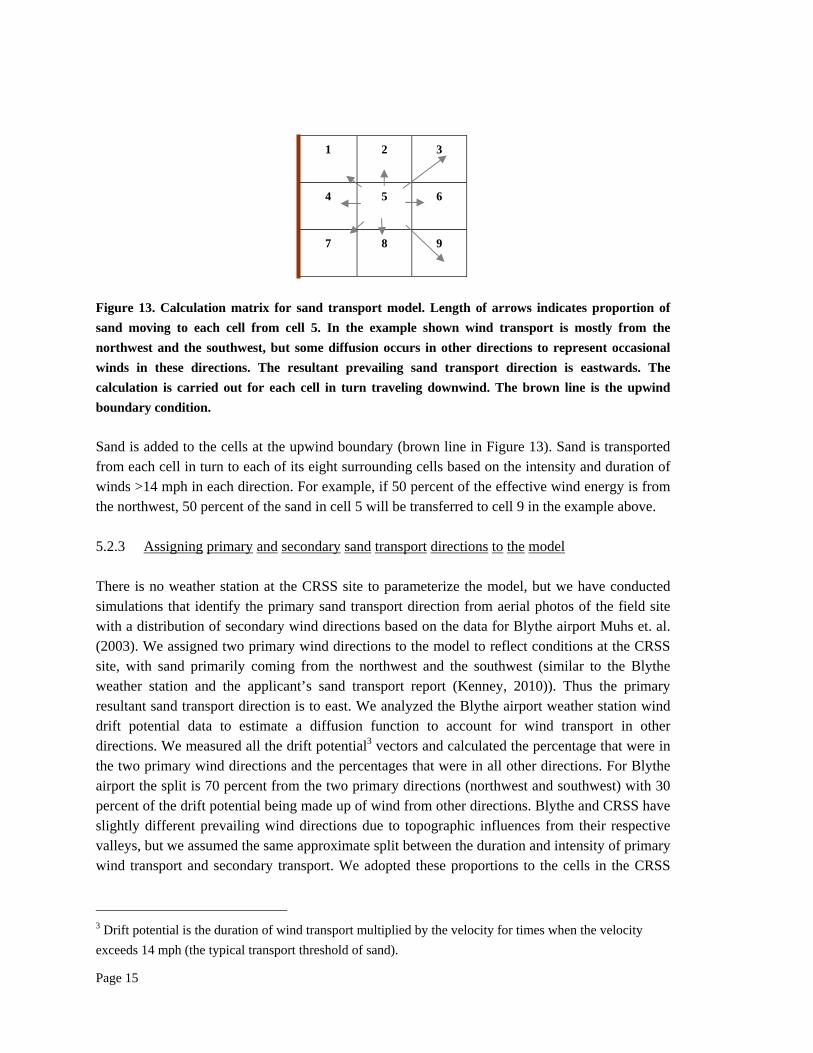
Figure 13. Calculation matrix for sand transport model. Length of arrows indicates proportion of sand moving to each cell from cell 5. In the example shown wind transport is mostly from the northwest and the southwest, but some diffusion occurs in other directions to represent occasional winds in these directions. The resultant prevailing sand transport direction is eastwards. The calculation is carried out for each cell in turn traveling downwind. The brown line is the upwind boundary condition. Sand is added to the cells at the upwind boundary (brown line in Figure 13). Sand is transported from each cell in turn to each of its eight surrounding cells based on the intensity and duration of winds >14 mph in each direction. For example, if 50 percent of the effective wind energy is from the northwest, 50 percent of the sand in cell 5 will be transferred to cell 9 in the example above. 5.2.3 Assigning primary and secondary sand transport directions to the model There is no weather station at the CRSS site to parameterize the model, but we have conducted simulations that identify the primary sand transport direction from aerial photos of the field site with a distribution of secondary wind directions based on the data for Blythe airport Muhs et. al. (2003). We assigned two primary wind directions to the model to reflect conditions at the CRSS site, with sand primarily coming from the northwest and the southwest (similar to the Blythe weather station and the applicant’s sand transport report (Kenney, 2010)). Thus the primary resultant sand transport direction is to east. We analyzed the Blythe airport weather station wind drift potential data to estimate a diffusion function to account for wind transport in other directions. We measured all the drift potential3 vectors and calculated the percentage that were in the two primary wind directions and the percentages that were in all other directions. For Blythe airport the split is 70 percent from the two primary directions (northwest and southwest) with 30 percent of the drift potential being made up of wind from other directions. Blythe and CRSS have slightly different prevailing wind directions due to topographic influences from their respective valleys, but we assumed the same approximate split between the duration and intensity of primary wind transport and secondary transport. We adopted these proportions to the cells in the CRSS
3 Drift potential is the duration of wind transport multiplied by the velocity for times when the velocity exceeds 14 mph (the typical transport threshold of sand).
1 2 3
4 5 6
7 8 9
Page 16
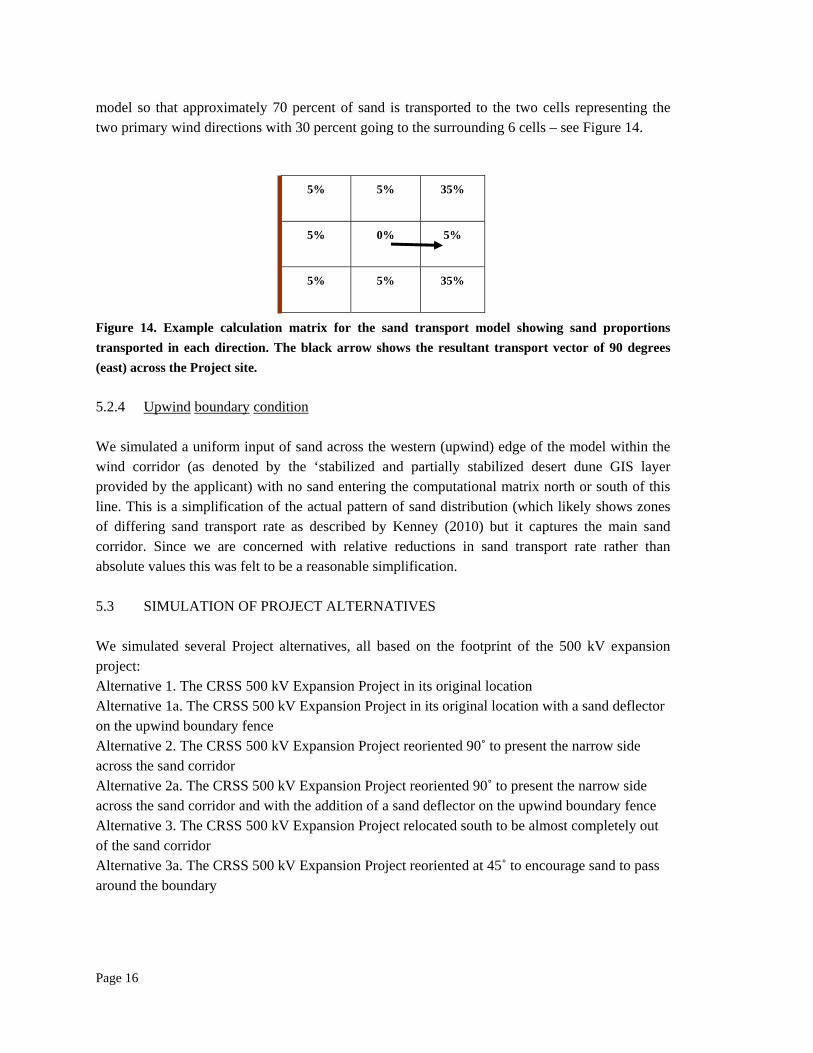
model so that approximately 70 percent of sand is transported to the two cells representing the two primary wind directions with 30 percent going to the surrounding 6 cells – see Figure 14. Figure 14. Example calculation matrix for the sand transport model showing sand proportions transported in each direction. The black arrow shows the resultant transport vector of 90 degrees (east) across the Project site. 5.2.4 Upwind boundary condition We simulated a uniform input of sand across the western (upwind) edge of the model within the wind corridor (as denoted by the ‘stabilized and partially stabilized desert dune GIS layer provided by the applicant) with no sand entering the computational matrix north or south of this line. This is a simplification of the actual pattern of sand distribution (which likely shows zones of differing sand transport rate as described by Kenney (2010) but it captures the main sand corridor. Since we are concerned with relative reductions in sand transport rate rather than absolute values this was felt to be a reasonable simplification. 5.3 SIMULATION OF PROJECT ALTERNATIVES We simulated several Project alternatives, all based on the footprint of the 500 kV expansion project: Alternative 1. The CRSS 500 kV Expansion Project in its original location Alternative 1a. The CRSS 500 kV Expansion Project in its original location with a sand deflector on the upwind boundary fence Alternative 2. The CRSS 500 kV Expansion Project reoriented 90˚ to present the narrow side across the sand corridor Alternative 2a. The CRSS 500 kV Expansion Project reoriented 90˚ to present the narrow side across the sand corridor and with the addition of a sand deflector on the upwind boundary fence Alternative 3. The CRSS 500 kV Expansion Project relocated south to be almost completely out of the sand corridor Alternative 3a. The CRSS 500 kV Expansion Project reoriented at 45˚ to encourage sand to pass around the boundary
5% 5% 35%
5% 0% 5%
5% 5% 35%
Upwind Boundary
Page 17
For the first scenario we imported the Project footprint into the model in GIS. For subsequent simulations we took the footprint and relocated or rotated it with the same surface area. We also conducted a series of simulations where we added a fence oriented 45˚ to the prevailing sand transport direction at the upwind project boundary to deflect sand around the project site. For the existing conditions assessment we simulated the sand corridor without any project, to determine that the existing conditions sand corridor matched the observed pattern of sand dunes from aerial photos. This simulation (Figure 15) provided a baseline against which to assess the project. Comparison of the predicted sand concentration relative to the mapped limits of the sand transport corridor suggests the baseline condition was a reasonable representation of the process. For the proposed conditions we used the same sand input distribution but added the project. Project boundaries that are perpendicular to the prevailing sand transport direction were assumed to be a complete barrier to sand transport, with zero sand being transported across a project cell. We modified the model to allow sand to migrate along project boundaries that were at 45˚ or more acute to the prevailing sand transport direction. In these cases we assume that sand strikes the boundary fence and then migrates along it until it reaches the downwind limit of the project, at which point the sand is free to move in the directions determined by the range of wind conditions. Areas where the project footprint overlays sand dunes are recorded as direct impact areas. Areas downwind of the project where there is a greater than 25% reduction in sand delivery are considered to be indirect impact areas. In all Alternatives the model predicted a sand transport shadow downwind of the Project based on the prevailing wind direction, with diffusion gradually transporting sand into the shadow (due to variations around the prevailing wind direction). At a certain point downwind the shadow disappears because diffusion is able to bring sediment back into the area downwind of the obstruction. We calculated the percentage of sand reduction between pre-project and post-project conditions. By overlying the percent sand reduction on the observed and predicted MFTL habitat layers we are able to calculate both an area of impact and a percentage of impact for each alternative. This is shown in detail in Table 2. We excluded from the analysis areas where the reduction in sand delivery was less than 25 percent. The different alternatives and their predicted sand shadows are shown visually in Figures 16 through 21.
Page 18
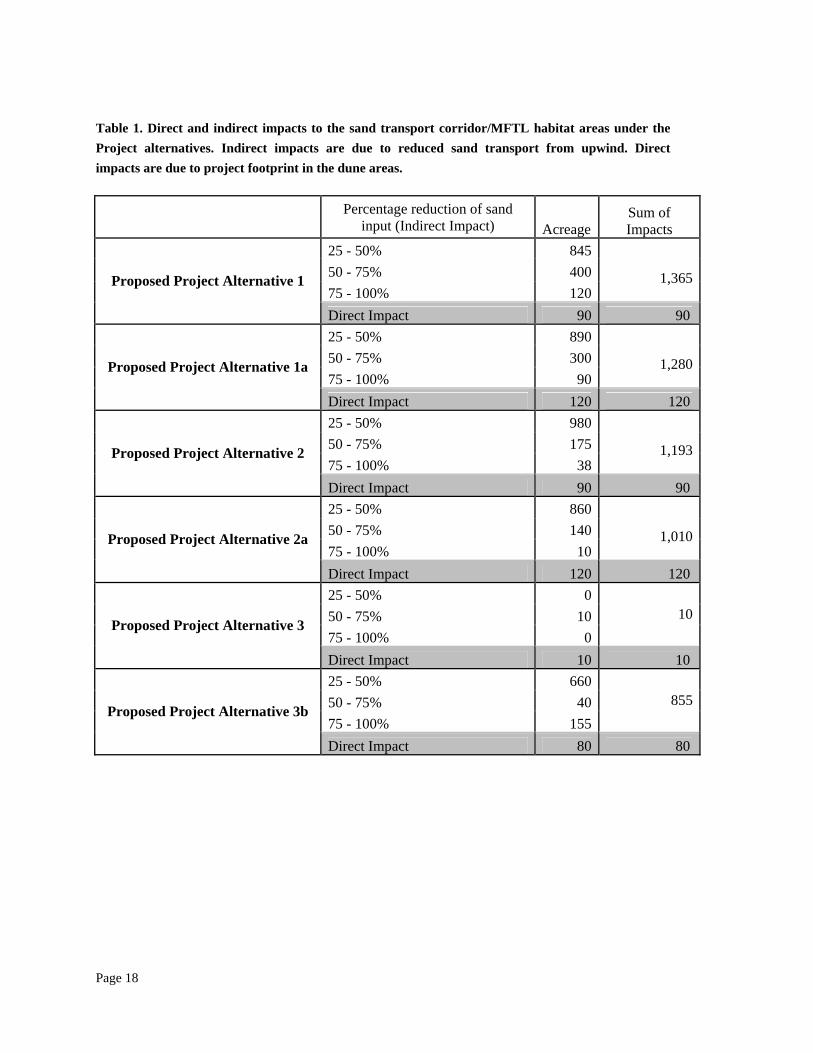
Table 1. Direct and indirect impacts to the sand transport corridor/MFTL habitat areas under the Project alternatives. Indirect impacts are due to reduced sand transport from upwind. Direct impacts are due to project footprint in the dune areas.
Percentage reduction of sand
input (Indirect Impact) Acreage Sum of Impacts
25 - 50% 845 50 - 75% 400 75 - 100% 120
1,365 Proposed Project Alternative 1
Direct Impact 90 90 25 - 50% 890 50 - 75% 300 75 - 100% 90
1,280 Proposed Project Alternative 1a
Direct Impact 120 120 25 - 50% 980 50 - 75% 175 75 - 100% 38
1,193 Proposed Project Alternative 2
Direct Impact 90 90 25 - 50% 860 50 - 75% 140 75 - 100% 10
1,010 Proposed Project Alternative 2a
Direct Impact 120 120 25 - 50% 0 50 - 75% 10 75 - 100% 0
10 Proposed Project Alternative 3
Direct Impact 10 10 25 - 50% 660 50 - 75% 40 75 - 100% 155
855 Proposed Project Alternative 3b
Direct Impact 80 80
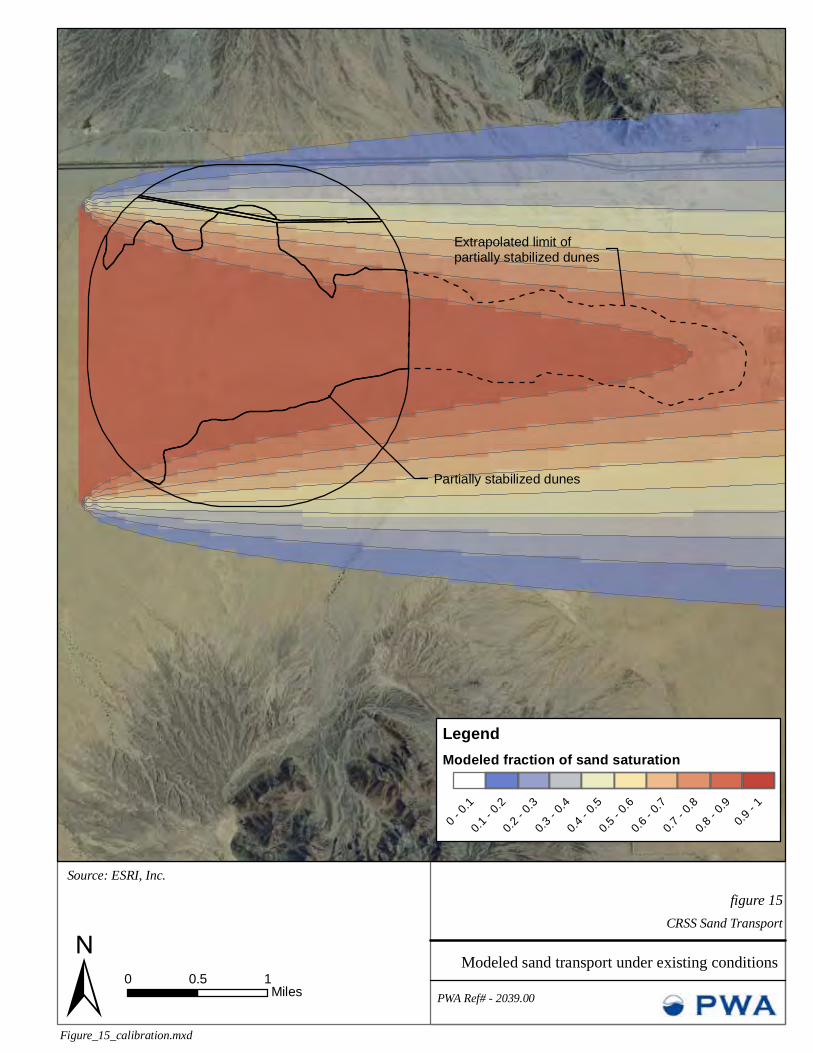
CRSS Sand Transportfigure 15
Modeled sand transport under existing conditions PWA Ref# - 2039.00
Figure_15_calibration.mxd±Source: ESRI, Inc.
0 10.5 Miles
LegendModeled fraction of sand saturation
0 - 0.1
0.1 - 0
.20.2
- 0.3
0.3 - 0
.40.4
- 0.5
0.5 - 0
.60.6
- 0.7
0.7 - 0
.80.8
- 0.9
0.9 - 1
Partially stabilized dunes
Extrapolated limit of partially stabilized dunes
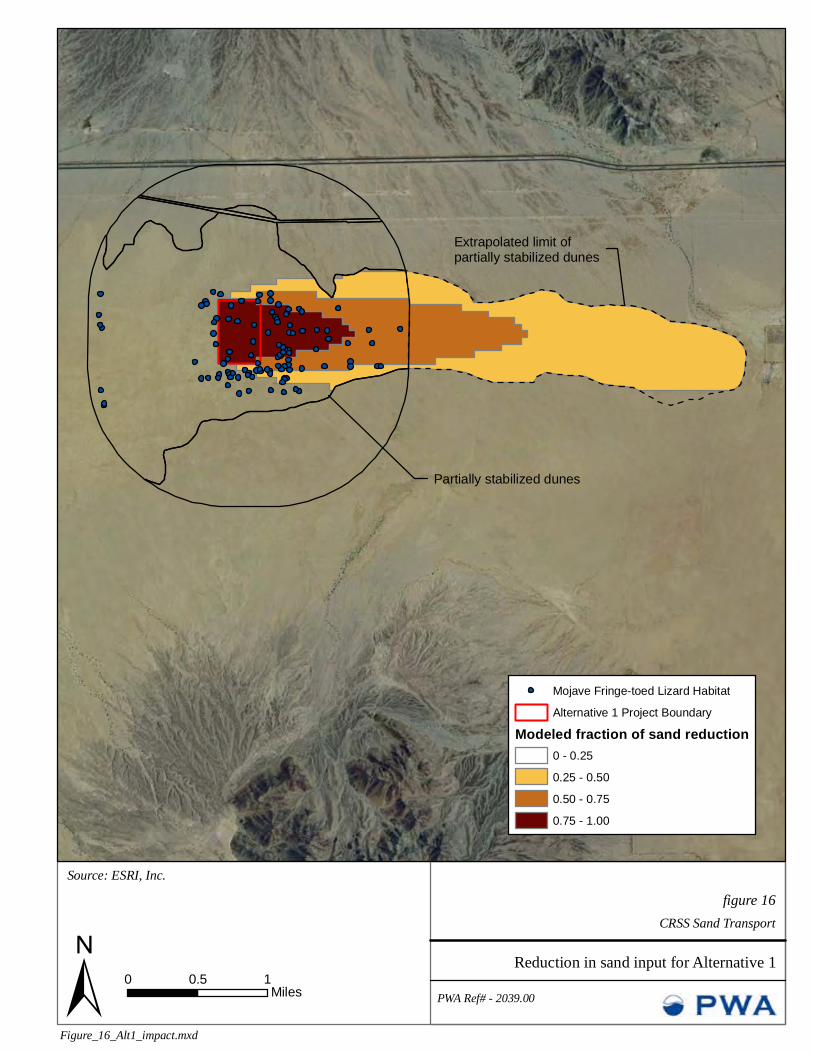
CRSS Sand Transportfigure 16
Reduction in sand input for Alternative 1PWA Ref# - 2039.00
Figure_16_Alt1_impact.mxd±Source: ESRI, Inc.
0 10.5 Miles
Mojave Fringe-toed Lizard HabitatAlternative 1 Project Boundary
Modeled fraction of sand reduction0 - 0.250.25 - 0.500.50 - 0.750.75 - 1.00
Partially stabilized dunes
Extrapolated limit of partially stabilized dunes
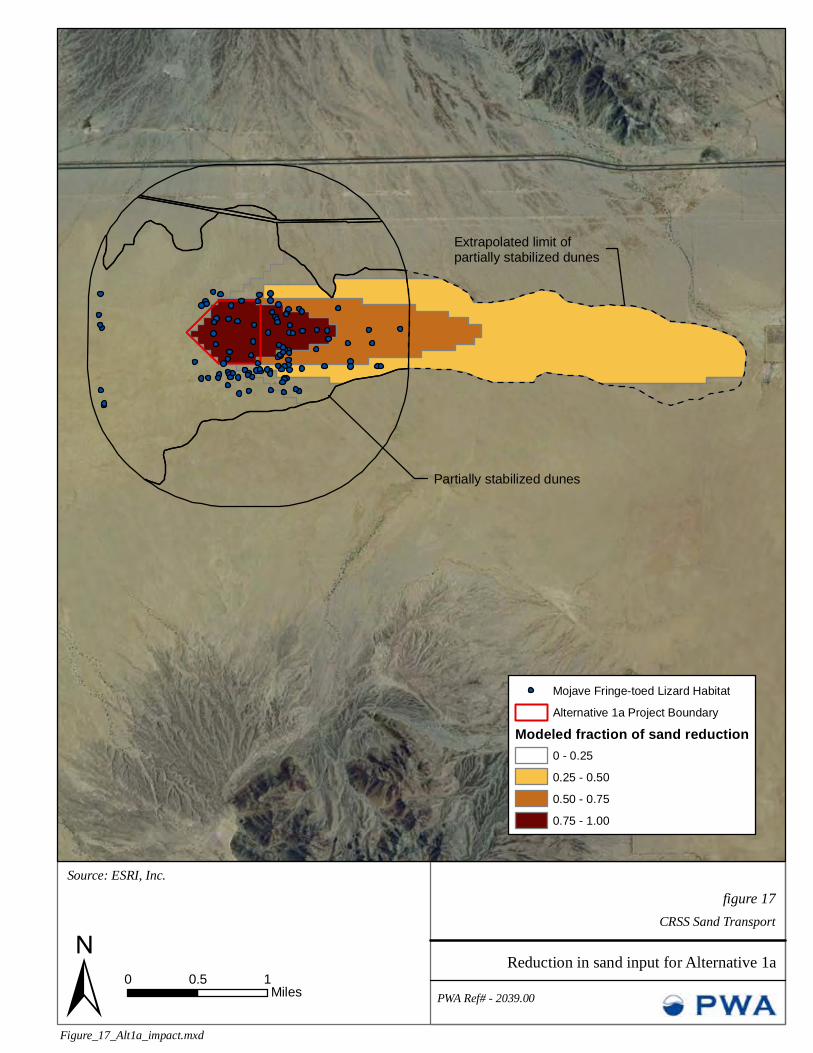
CRSS Sand Transportfigure 17
Reduction in sand input for Alternative 1aPWA Ref# - 2039.00
Figure_17_Alt1a_impact.mxd±Source: ESRI, Inc.
0 10.5 Miles
Mojave Fringe-toed Lizard HabitatAlternative 1a Project Boundary
Modeled fraction of sand reduction0 - 0.250.25 - 0.500.50 - 0.750.75 - 1.00
Partially stabilized dunes
Extrapolated limit of partially stabilized dunes
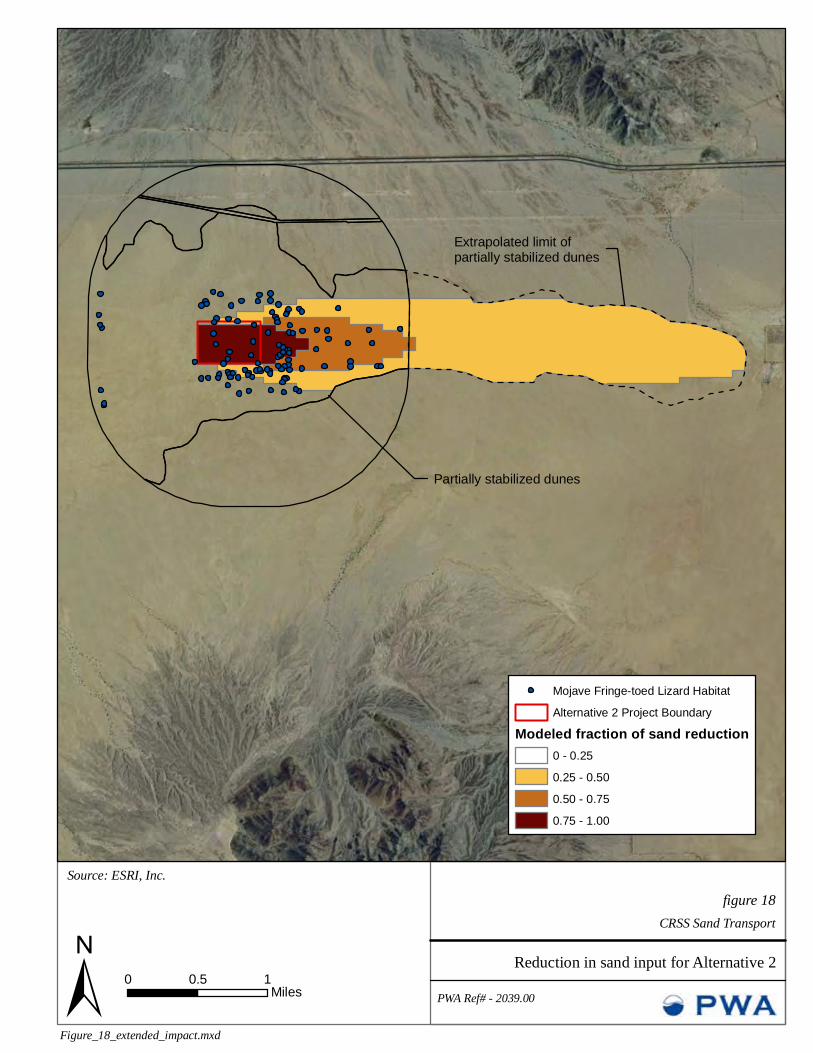
CRSS Sand Transportfigure 18
Reduction in sand input for Alternative 2PWA Ref# - 2039.00
Figure_18_extended_impact.mxd±Source: ESRI, Inc.
0 10.5 Miles
Mojave Fringe-toed Lizard HabitatAlternative 2 Project Boundary
Modeled fraction of sand reduction0 - 0.250.25 - 0.500.50 - 0.750.75 - 1.00
Partially stabilized dunes
Extrapolated limit of partially stabilized dunes
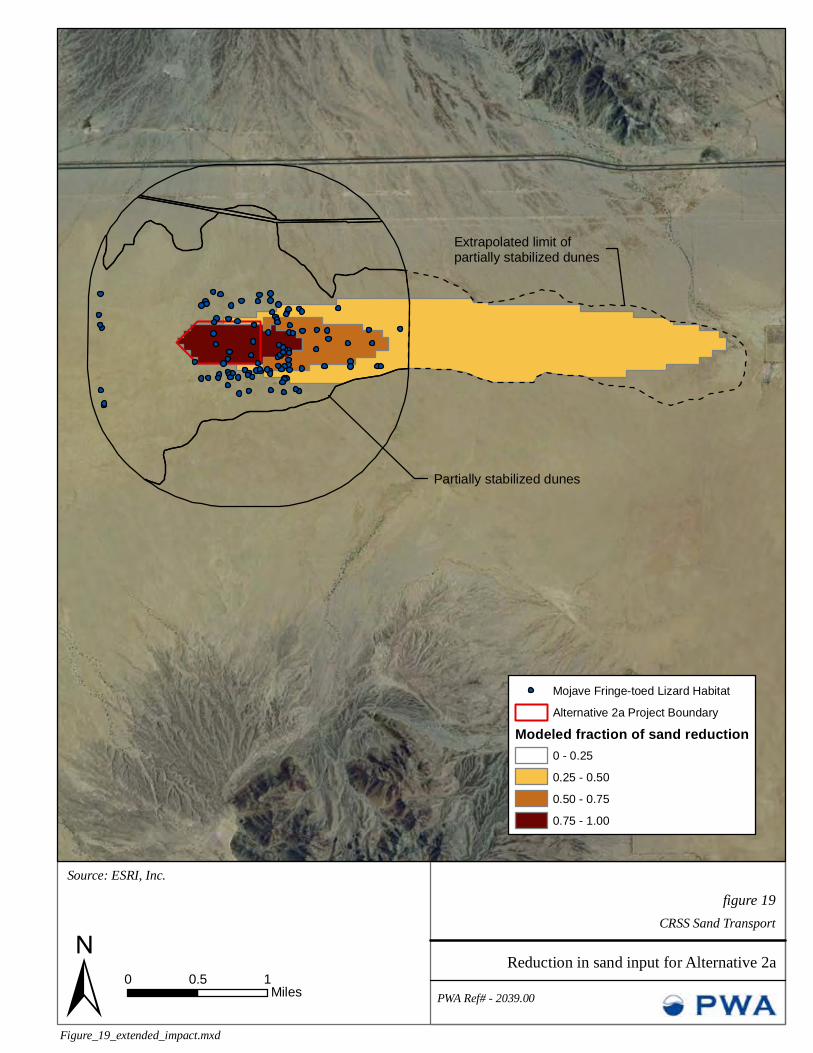
CRSS Sand Transportfigure 19
Reduction in sand input for Alternative 2aPWA Ref# - 2039.00
Figure_19_extended_impact.mxd±Source: ESRI, Inc.
0 10.5 Miles
Mojave Fringe-toed Lizard HabitatAlternative 2a Project Boundary
Modeled fraction of sand reduction0 - 0.250.25 - 0.500.50 - 0.750.75 - 1.00
Partially stabilized dunes
Extrapolated limit of partially stabilized dunes
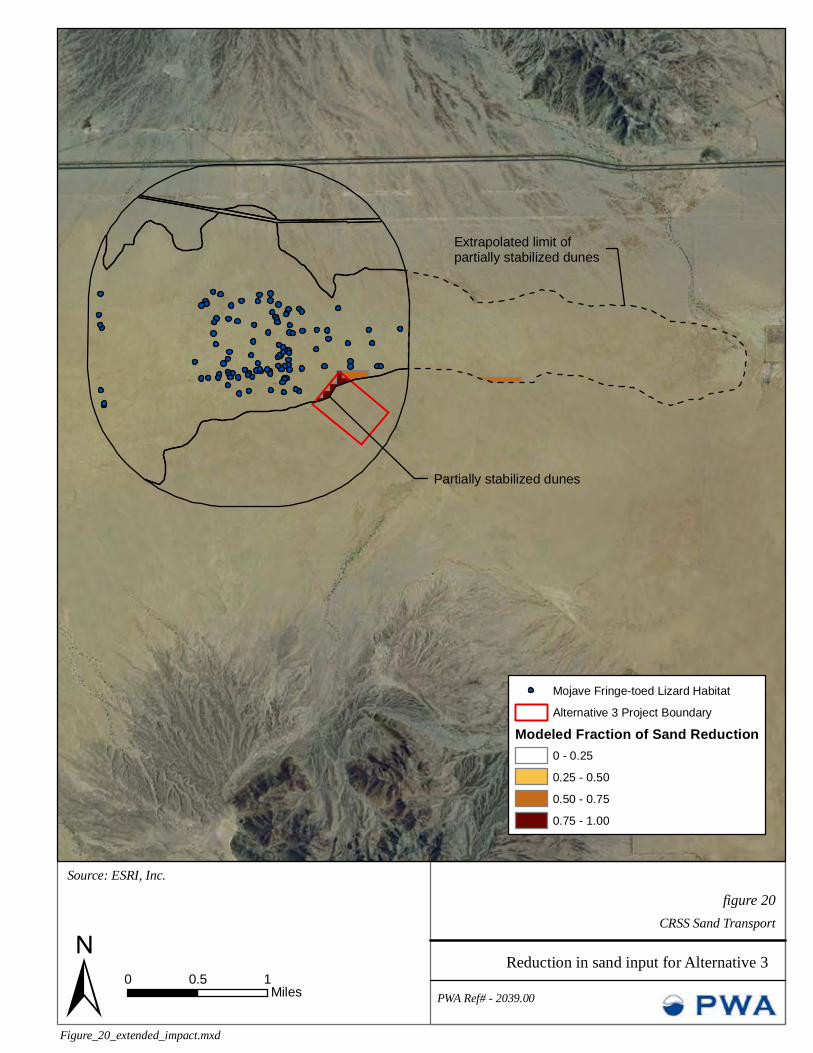
CRSS Sand Transportfigure 20
Reduction in sand input for Alternative 3PWA Ref# - 2039.00
Figure_20_extended_impact.mxd±Source: ESRI, Inc.
0 10.5 Miles
Mojave Fringe-toed Lizard HabitatAlternative 3 Project Boundary
Modeled Fraction of Sand Reduction0 - 0.250.25 - 0.500.50 - 0.750.75 - 1.00
Partially stabilized dunes
Extrapolated limit of partially stabilized dunes
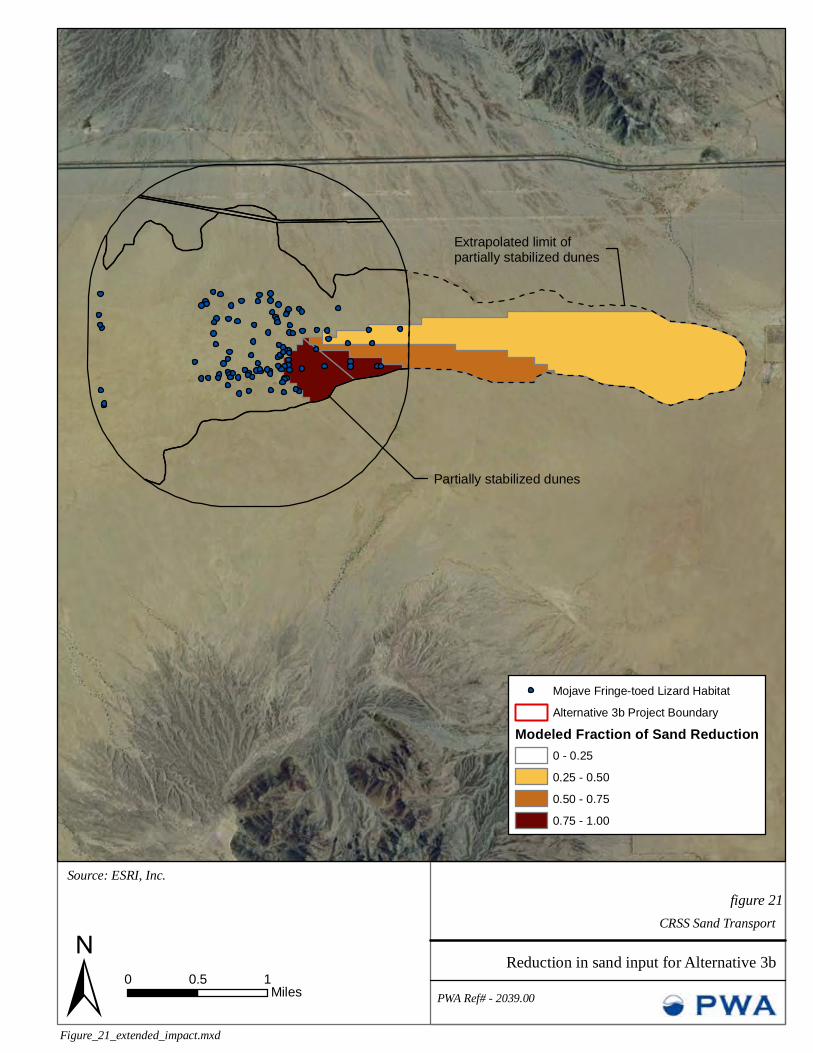
CRSS Sand Transportfigure 21
Reduction in sand input for Alternative 3bPWA Ref# - 2039.00
Figure_21_extended_impact.mxd±Source: ESRI, Inc.
0 10.5 Miles
Mojave Fringe-toed Lizard HabitatAlternative 3b Project Boundary
Modeled Fraction of Sand Reduction0 - 0.250.25 - 0.500.50 - 0.750.75 - 1.00
Partially stabilized dunes
Extrapolated limit of partially stabilized dunes
Page 26
5.4 DISCUSSION OF RESULTS Table 1 provides a detailed break down of the direct and indirect impacts of the project alternatives. All the alternatives except for Alternative 3 have large areas of indirect impact, because they all block a large proportion (approximately half to a third) of the sand transport corridor. Alternative 1. (Figure 16) This alternative has the highest indirect impact, at 1,365 acres. This is because the project presents the greatest cross section area to the most active part of the sand transport corridor, and does not reduce impact by passing sand around the site. The direct impact is 90 acres. Alternative 1a. (Figure 17) In this alternative the sand fence is extended upwind and sloped at 45˚ to encourage sand to pass around the boundary. This increases the direct impact over Alternative 1 from 90 to 120 acres, but reduced the indirect impact from 1,365 to 1,280 acres. The benefits of this alternative are minimal and there may potentially be a net adverse effect since the direct impacts are more severe than the indirect impacts. Alternative 2. (Figure 18) In this alternative the project site is rotated 90˚ to present the shorter side across the sand transport corridor. The direct impact is the same as for Alternative 1 (90 acres) but the indirect impact is slightly less (1,193 acres). Alternative 2a. (Figure 19) This alternative is the same as Alternative 2 with the addition of the 45˚ wind fence extension to encourage sand to pass around the boundary. It increases the direct impact area from 90 to 120 acres but reduced the indirect impact to 1,010 acres. The reduction in indirect impact exceeds the increase in direct impacts compared with Alternative 1. Alternative 3. (Figure 20) This alternative moves the project footprint south out of the main part of the sand transport corridor. The resulting direct and indirect impacts are minimal, at 10 acres for each. However, this alternative is located on land that is not believed to be available to the applicant. Alternative 3a. (Figure 21) This alternative realigns the project to the edge of the most active part of the sand transport corridor and reorients it to be at 45˚ to the prevailing wind. The direct impacts are 80 acres, while the indirect impacts are 855 acres. While significant, this is the lowest impact of the alternatives located on land available to the applicant.
Page 27
6. REFERENCES Bagnold, R.A. 1941. The Physics of Blown Sand. Griffiths, P.G., Webb, R.H. and Lancaster, N. 2002. Eolian sand supply to Coachella Valley fringe-toed lizard habitat in the northern Coachella Valley, California. Abstracts of the Geological Society of America Volume 34, no. 6, page 75, October 2002. Kenney, M. 2010. Preliminary Geomorphic Aeolian Report: Colorado River Substation, Riverside County, CA Muhs, D.R., Reynolds, R.L., Been, J. and Skipp, G. Eolian sand transport pathways in the southwestern United States: importance of the Colorado River and local sources. Quaternary International Volume 104, pages 3-18, 2003. Turner, F.B., Weaver, D.C. and Rorabaugh, J.C. 1984. Effects of reduction in windblown sand on the abundance of the Fringe-toed Lizard (Uma inornata) in the Coachella Valley, California. Copeia, 1984(2), pp. 370-378.
Page 28
7. LIST OF PREPARERS
This report was prepared by the following ESA PWA staff: Andrew Collison, Ph.D. Christian Nilsen, M.S., P.E. James Gregory, M.S.

Page 29
8. APPENDIX A – EXCERPTS FROM KENNEY, M. 2010. PRELIMINARY
GEOMORPHIC AEOLIAN REPORT: COLORADO RIVER SUBSTATION, RIVERSIDE COUNTY, CA
Qsr
ZONE CWEAK SANDMIGRATION ZONE
ZONE CWEAK SANDMIGRATION ZONE
Plate 5
Preliminary Sand Migration Zones Map
N0 2700’Scale - Feet
MK 10/2010
Mapping by Miles D. Kenney, PhD, PGSouthern California Edison Corporate Environmental Health & Safety Colorado River Substation
Kenney GeoScience
Qsad
Qoaf-S4 and S5
SiteQsa & Qsad
Qsa & Qsad
Highway 10
Qsr/Qoaf
Pole Line Road
ZONE ASTRONG SAND MIGRATION ZONE
ZONE BMODERATELY STRONGSAND MIGRATION ZONE
ZONE BMODERATELY STRONGSAND MIGRATION ZONE
Pole Line Road
Qsr + Qsad region
Qsr + Qoaf region
Relative magnitudeof sand flux graduallydecreases toward the south
Relative magnitudeof sand flux graduallydecreases toward the south
??
?This area mayexperiencemoderate sandtransport.
Pole Line Road
Pole Line Road
Plate 11 A&BPlate 10 B
Plate 9 A
Plate 9 B
Plate 8 A
Plate 8 B
Plate 9 C
Plate 10 A
Plate 7 A&B
Plate 11 A&B
Southern California Edison Corporate Environmental Health & Safety Colorado River Substation
Plate 6
10/2010TH
JN 717-10PHOTOGRAPH LOCATION MAP Kenney GeoScience
N0 2200’
Scale - Feet
Area of Plate 5
ZONE C
ZONE C
ZONE A
ZONE B
ZONE B
Relative magnitudeof sand flux graduallydecreases toward the north and south
Site
Interstate 10
Location of photographs shown on Plates 7 though 11 Capital lettersindicate photograph designation.
NS
E WLittle Chuckwalla Mountains
Chuckwalla Mountains Palen Mountains
Kenney GeoScience
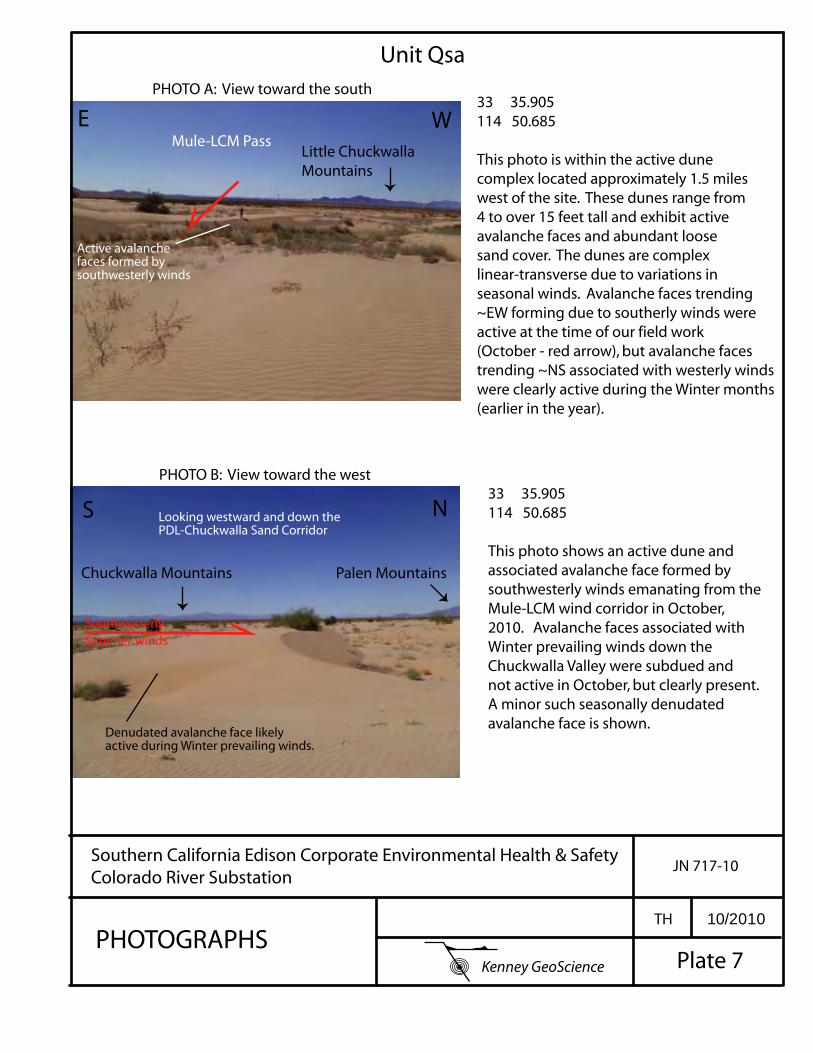
Unit Qsa
33 35.905114 50.685
This photo is within the active dunecomplex located approximately 1.5 mileswest of the site. These dunes range from4 to over 15 feet tall and exhibit active avalanche faces and abundant loosesand cover. The dunes are complexlinear-transverse due to variations inseasonal winds. Avalanche faces trending~EW forming due to southerly winds wereactive at the time of our field work (October - red arrow), but avalanche faces trending ~NS associated with westerly winds were clearly active during the Winter months(earlier in the year).
PHOTO A: View toward the south
33 35.905114 50.685
This photo shows an active dune andassociated avalanche face formed by southwesterly winds emanating from theMule-LCM wind corridor in October,2010. Avalanche faces associated with Winter prevailing winds down the Chuckwalla Valley were subdued andnot active in October, but clearly present.A minor such seasonally denudated avalanche face is shown.
PHOTO B: View toward the west
Southern California Edison Corporate Environmental Health & Safety Colorado River Substation
JN 717-10
Plate 7
TH 10/2010PHOTOGRAPHS
Mule-LCM Pass
Active avalanchefaces formed bysouthwesterly winds
Looking westward and down thePDL-Chuckwalla Sand Corridor
Denudated avalanche face likely active during Winter prevailing winds.
Southwesterly Summer winds
Minor loose sand
Gravel lag surface
NS
Note lack of coppice dunes
Chuckwalla Mountains
Small coppicedune tail
southwesterlywinds
southwesterlywinds
Little Chuckwalla MountainsMule Mountains
E
WE
W
Little Chuckwalla Mountains
Mule Mountains
Mule-LCMwind corridor
Mule-LCMwind corridor
Kenney GeoScience
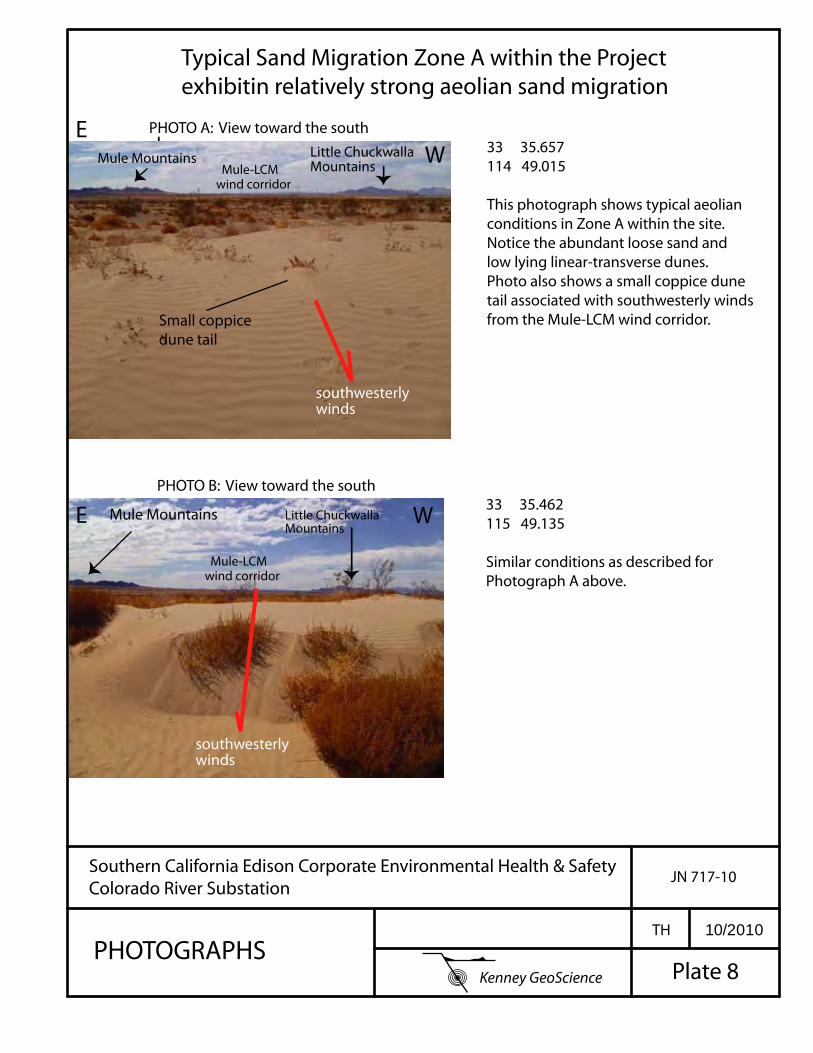
Typical Sand Migration Zone A within the Projectexhibitin relatively strong aeolian sand migration
33 35.657114 49.015
This photograph shows typical aeolianconditions in Zone A within the site.Notice the abundant loose sand andlow lying linear-transverse dunes.Photo also shows a small coppice dunetail associated with southwesterly windsfrom the Mule-LCM wind corridor.
PHOTO A: View toward the south
33 35.462115 49.135
Similar conditions as described forPhotograph A above.
PHOTO B: View toward the south
Southern California Edison Corporate Environmental Health & Safety Colorado River Substation
JN 717-10
Plate 8
TH 10/2010PHOTOGRAPHS
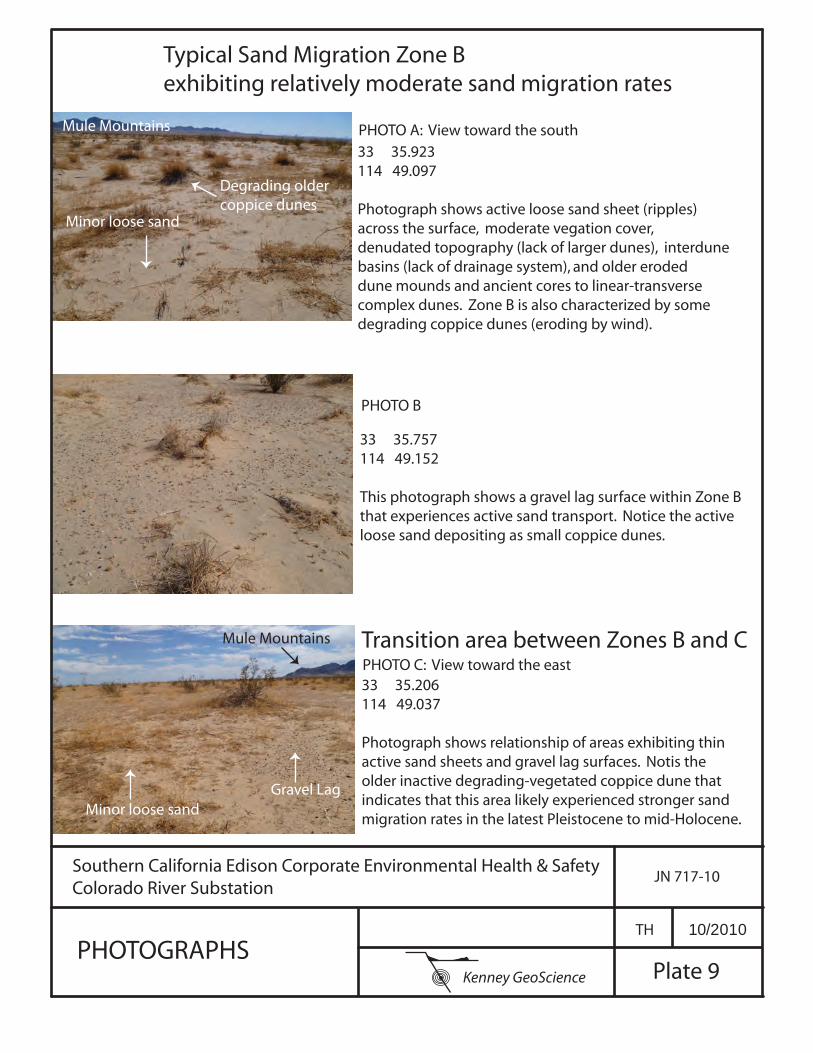
Typical Sand Migration Zone Bexhibiting relatively moderate sand migration rates
33 35.757114 49.152
This photograph shows a gravel lag surface within Zone Bthat experiences active sand transport. Notice the activeloose sand depositing as small coppice dunes.
PHOTO A: View toward the south
33 35.206114 49.037
Photograph shows relationship of areas exhibiting thinactive sand sheets and gravel lag surfaces. Notis the older inactive degrading-vegetated coppice dune thatindicates that this area likely experienced stronger sandmigration rates in the latest Pleistocene to mid-Holocene.
PHOTO C: View toward the east
Southern California Edison Corporate Environmental Health & Safety Colorado River Substation
JN 717-10
Plate 9
TH 10/2010PHOTOGRAPHS
PHOTO B
33 35.923114 49.097
Photograph shows active loose sand sheet (ripples)across the surface, moderate vegation cover, denudated topography (lack of larger dunes), interdunebasins (lack of drainage system), and older eroded dune mounds and ancient cores to linear-transversecomplex dunes. Zone B is also characterized by somedegrading coppice dunes (eroding by wind).
Transition area between Zones B and C
Mule Mountains
Mule Mountains
Minor loose sandGravel Lag
Minor loose sand
Degrading older coppice dunes
Kenney GeoScience
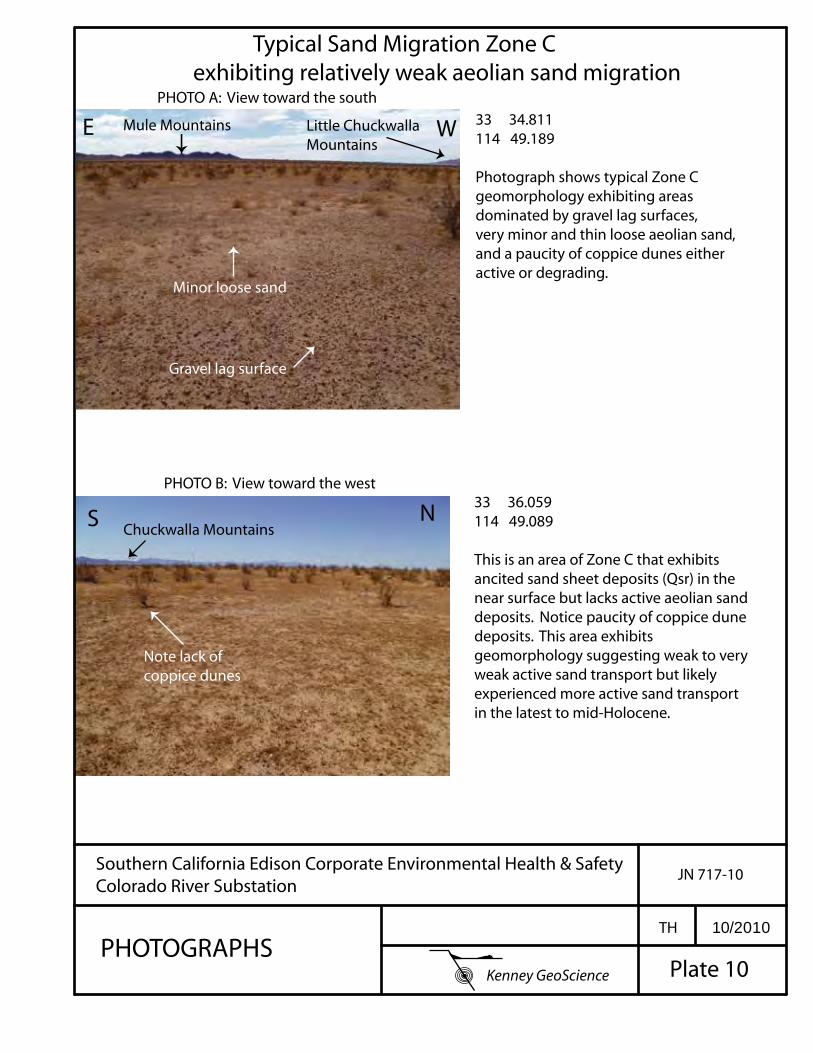
Typical Sand Migration Zone Cexhibiting relatively weak aeolian sand migration
33 34.811114 49.189
Photograph shows typical Zone Cgeomorphology exhibiting areasdominated by gravel lag surfaces,very minor and thin loose aeolian sand,and a paucity of coppice dunes eitheractive or degrading.
PHOTO A: View toward the south
33 36.059114 49.089
This is an area of Zone C that exhibitsancited sand sheet deposits (Qsr) in thenear surface but lacks active aeolian sanddeposits. Notice paucity of coppice dunedeposits. This area exhibitsgeomorphology suggesting weak to veryweak active sand transport but likelyexperienced more active sand transportin the latest to mid-Holocene.
PHOTO B: View toward the west
Southern California Edison Corporate Environmental Health & Safety Colorado River Substation
JN 717-10
Plate 10
TH 10/2010PHOTOGRAPHS
Mule MountainsE W
Minor loose sand
Gravel lag surface
NS
Note lack of coppice dunes
Little Chuckwalla Mountains
Chuckwalla Mountains
Kenney GeoScience
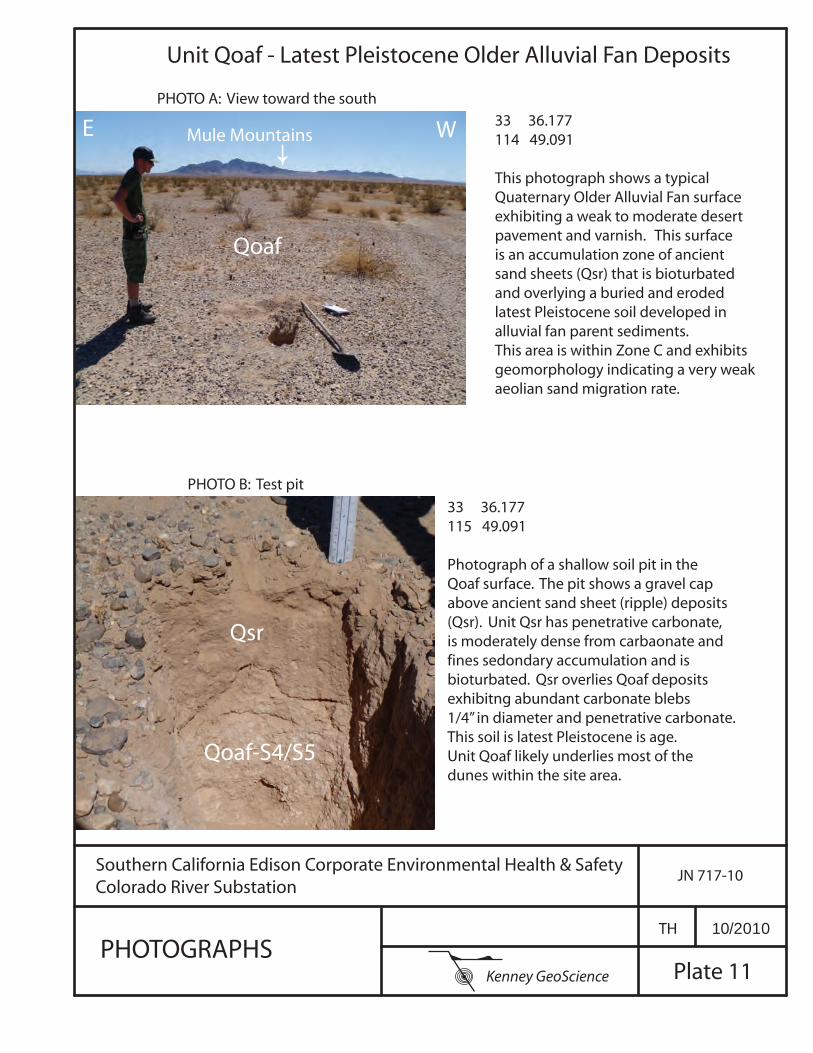
Unit Qoaf - Latest Pleistocene Older Alluvial Fan Deposits
33 36.177114 49.091
This photograph shows a typical Quaternary Older Alluvial Fan surfaceexhibiting a weak to moderate desertpavement and varnish. This surfaceis an accumulation zone of ancientsand sheets (Qsr) that is bioturbated and overlying a buried and erodedlatest Pleistocene soil developed inalluvial fan parent sediments. This area is within Zone C and exhibitsgeomorphology indicating a very weakaeolian sand migration rate.
PHOTO A: View toward the south
33 36.177115 49.091
Photograph of a shallow soil pit in theQoaf surface. The pit shows a gravel capabove ancient sand sheet (ripple) deposits(Qsr). Unit Qsr has penetrative carbonate,is moderately dense from carbaonate andfines sedondary accumulation and is bioturbated. Qsr overlies Qoaf depositsexhibitng abundant carbonate blebs1/4” in diameter and penetrative carbonate.This soil is latest Pleistocene is age.Unit Qoaf likely underlies most of the dunes within the site area.
PHOTO B: Test pit
Southern California Edison Corporate Environmental Health & Safety Colorado River Substation
JN 717-10
Plate 11
TH 10/2010PHOTOGRAPHS
Mule MountainsE W
Qoaf
Qsr
Qoaf-S4/S5
Kenney GeoScience

550 Kearny Street
Suite 900
San Francisco, CA 94108
415.262.2300 phone
415.262.2303 fax
www.pwa-ltd.com
K:\projects\2039_CRSS_Sand_Analysis\Report\Mitigation Report 121210\CRSS_PWA_SandTransportEffects010511_memo.doc
memorandum
date 1/5/11 to Scott White from Andrew Collison subject Supplemental analysis to assess sand transport rates and potential for mitigation
ESA PWA was asked to reevaluate project impacts and to assess the potential for a sand mitigation program at the proposed Colorado River Substation. The hypothetical program would involve collecting sand at the upwind side of the project, trucking it around the project site, and depositing it downwind so that it could be re-transported to downwind dune habitat. This memo focuses on the following questions:
1. What rate of sand delivery would likely be encountered, and what volume of sand would likely have to be trucked around the project site?
2. How far downwind of the project site would the sand have to be trucked before it could be released into the wind stream, and thus what is the area in the lee of the project that would be impacted?
3. What elements would go into a potential mitigation program? Note that our approach to these questions focused solely on the physical processes and did not account for biological issues. We are commenting on the practicality of a mitigation scheme from a purely mechanical sand transport perspective.
1. At what rate would sand accumulate on the project boundary and require removal?
There are no published data on sand transport rates in the project vicinity, and initial analyses of impact (PWA, 2010) used relative concentrations of sand (i.e. applied a uniform distribution of sand across the western sand corridor boundary and measured percent reduction in sand rather than actual flux of sand.) For this supplementary report we conducted a literature review to determine a range of potential sand delivery rates. We have used the site classification developed by Kenney (2010) to break the site into Zones A-C, where Zone A has the most active sand transport and Zone C the least. Kocurek and Lancaster (1999) estimated a mean sediment flux of 7.86 m3 m-1 yr-1 for Kelso dunes (located 100 miles northwest of the project site) based on wind velocity data. Like the project site, Kelso dunes is located in one of the major sand transport corridors identified by Muhs et al. (2003). However, the rate estimated at Kelso dunes is likely much higher than the rate found at the project site since Kelso dunes are almost completely unvegetated and are much larger and more active than those found at the project site.
2
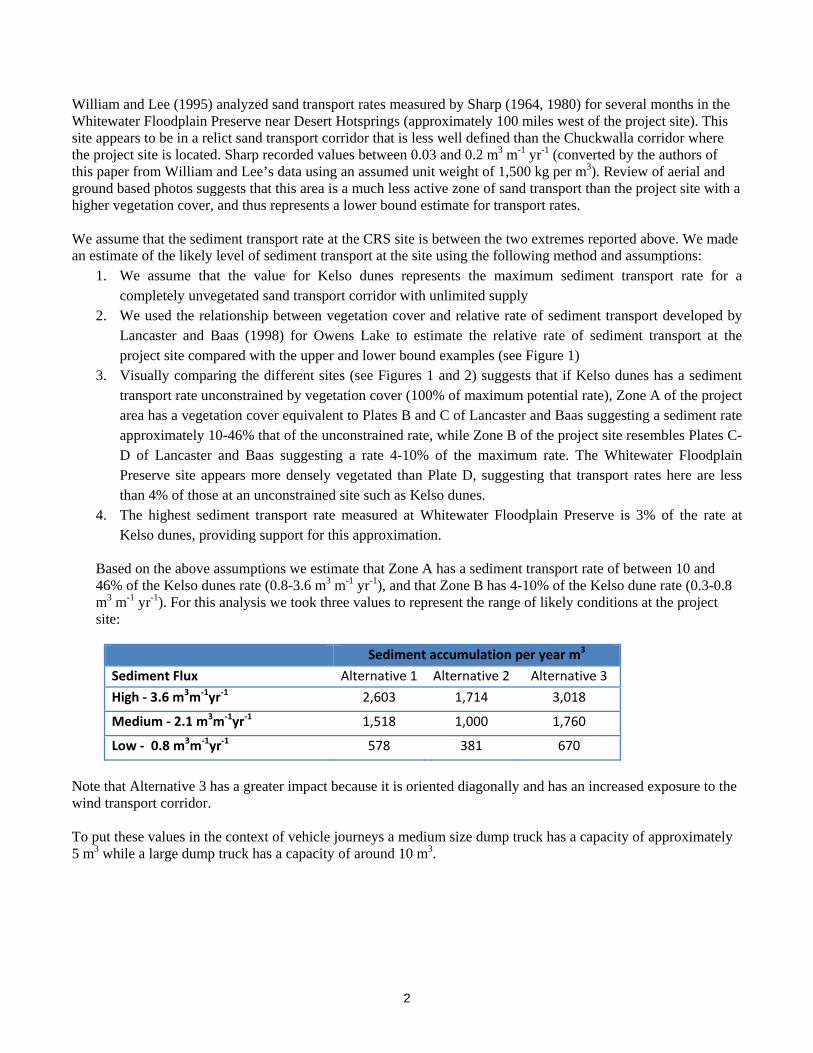
William and Lee (1995) analyzed sand transport rates measured by Sharp (1964, 1980) for several months in the Whitewater Floodplain Preserve near Desert Hotsprings (approximately 100 miles west of the project site). This site appears to be in a relict sand transport corridor that is less well defined than the Chuckwalla corridor where the project site is located. Sharp recorded values between 0.03 and 0.2 m3 m-1 yr-1 (converted by the authors of this paper from William and Lee’s data using an assumed unit weight of 1,500 kg per m3). Review of aerial and ground based photos suggests that this area is a much less active zone of sand transport than the project site with a higher vegetation cover, and thus represents a lower bound estimate for transport rates. We assume that the sediment transport rate at the CRS site is between the two extremes reported above. We made an estimate of the likely level of sediment transport at the site using the following method and assumptions:
1. We assume that the value for Kelso dunes represents the maximum sediment transport rate for a completely unvegetated sand transport corridor with unlimited supply
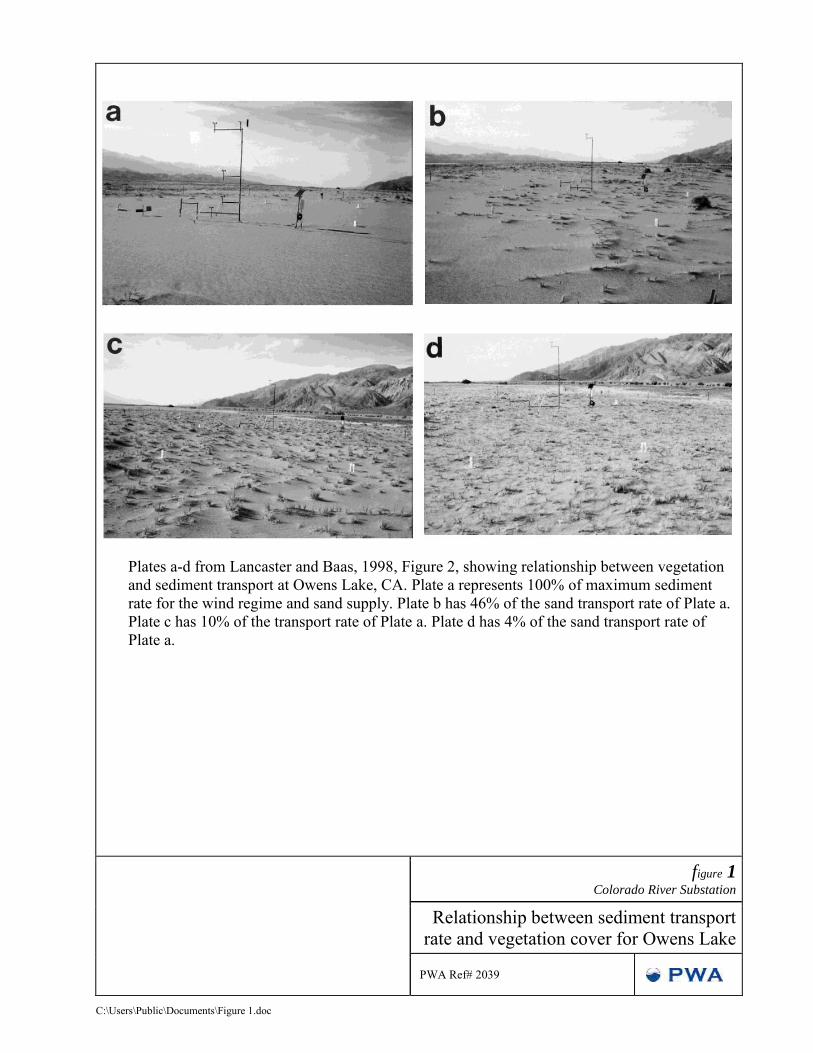
2. We used the relationship between vegetation cover and relative rate of sediment transport developed by Lancaster and Baas (1998) for Owens Lake to estimate the relative rate of sediment transport at the project site compared with the upper and lower bound examples (see Figure 1)
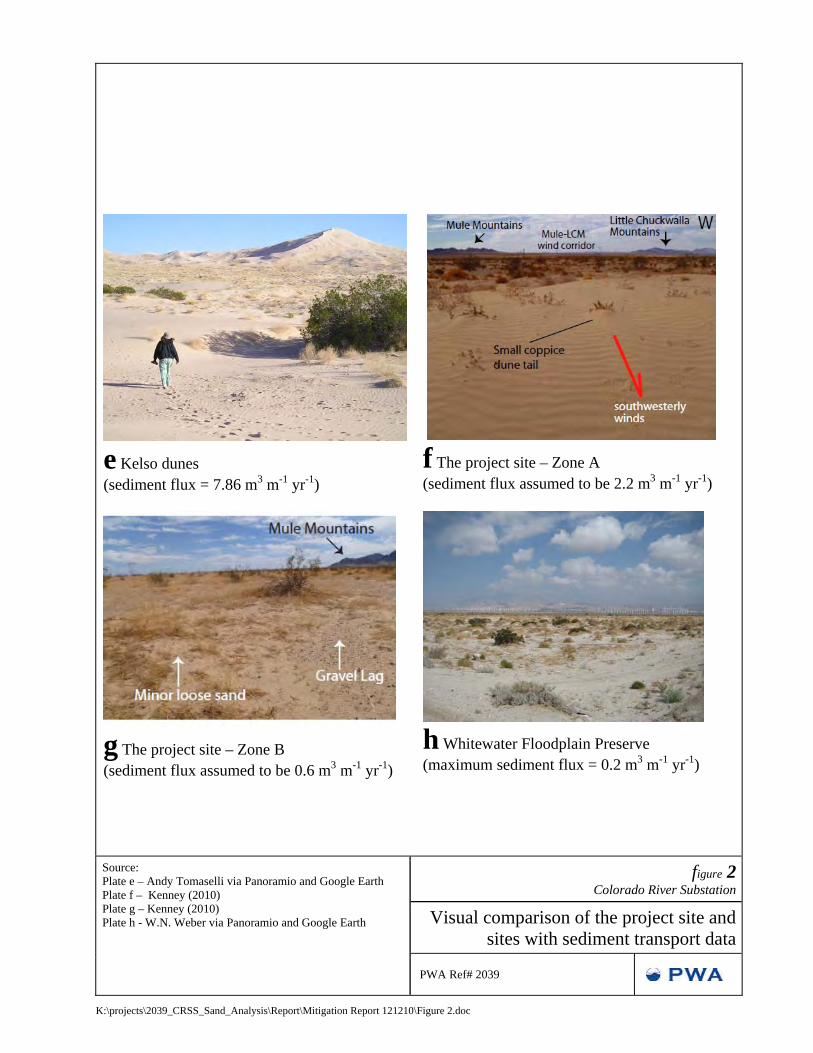
3. Visually comparing the different sites (see Figures 1 and 2) suggests that if Kelso dunes has a sediment transport rate unconstrained by vegetation cover (100% of maximum potential rate), Zone A of the project area has a vegetation cover equivalent to Plates B and C of Lancaster and Baas suggesting a sediment rate approximately 10-46% that of the unconstrained rate, while Zone B of the project site resembles Plates C-D of Lancaster and Baas suggesting a rate 4-10% of the maximum rate. The Whitewater Floodplain Preserve site appears more densely vegetated than Plate D, suggesting that transport rates here are less than 4% of those at an unconstrained site such as Kelso dunes.
4. The highest sediment transport rate measured at Whitewater Floodplain Preserve is 3% of the rate at Kelso dunes, providing support for this approximation.
Based on the above assumptions we estimate that Zone A has a sediment transport rate of between 10 and 46% of the Kelso dunes rate (0.8-3.6 m3 m-1 yr-1), and that Zone B has 4-10% of the Kelso dune rate (0.3-0.8 m3 m-1 yr-1). For this analysis we took three values to represent the range of likely conditions at the project site:
Sediment accumulation per year m3
Sediment Flux Alternative 1 Alternative 2 Alternative 3
High ‐ 3.6 m3m‐1yr‐1 2,603 1,714 3,018
Medium ‐ 2.1 m3m‐1yr‐1 1,518 1,000 1,760
Low ‐ 0.8 m3m‐1yr‐1 578 381 670
Note that Alternative 3 has a greater impact because it is oriented diagonally and has an increased exposure to the wind transport corridor. To put these values in the context of vehicle journeys a medium size dump truck has a capacity of approximately 5 m3 while a large dump truck has a capacity of around 10 m3.
3
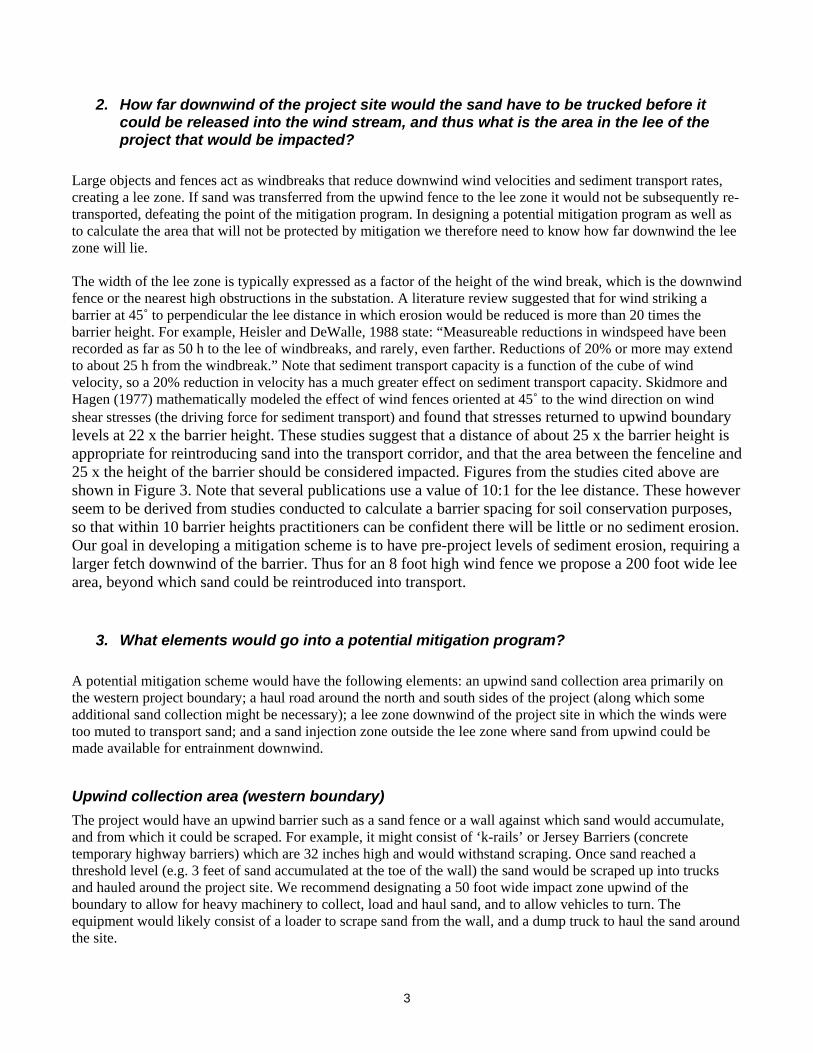
2. How far downwind of the project site would the sand have to be trucked before it could be released into the wind stream, and thus what is the area in the lee of the project that would be impacted?
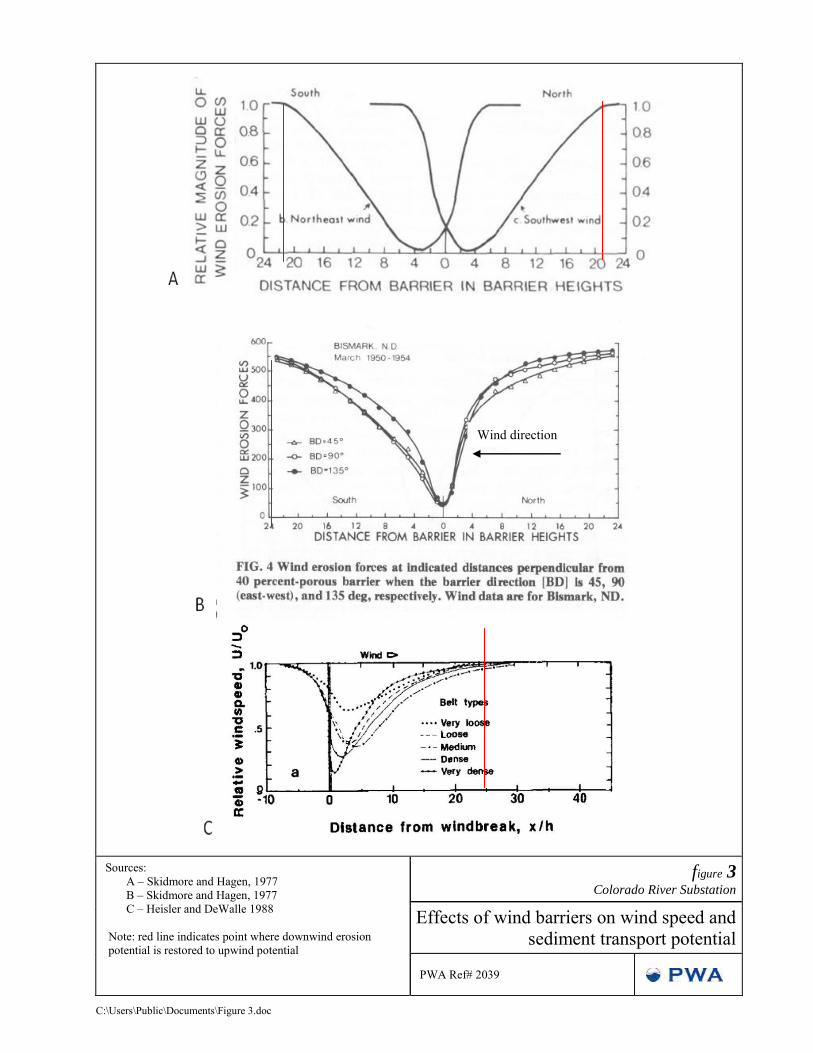
Large objects and fences act as windbreaks that reduce downwind wind velocities and sediment transport rates, creating a lee zone. If sand was transferred from the upwind fence to the lee zone it would not be subsequently re-transported, defeating the point of the mitigation program. In designing a potential mitigation program as well as to calculate the area that will not be protected by mitigation we therefore need to know how far downwind the lee zone will lie. The width of the lee zone is typically expressed as a factor of the height of the wind break, which is the downwind fence or the nearest high obstructions in the substation. A literature review suggested that for wind striking a barrier at 45˚ to perpendicular the lee distance in which erosion would be reduced is more than 20 times the barrier height. For example, Heisler and DeWalle, 1988 state: “Measureable reductions in windspeed have been recorded as far as 50 h to the lee of windbreaks, and rarely, even farther. Reductions of 20% or more may extend to about 25 h from the windbreak.” Note that sediment transport capacity is a function of the cube of wind velocity, so a 20% reduction in velocity has a much greater effect on sediment transport capacity. Skidmore and Hagen (1977) mathematically modeled the effect of wind fences oriented at 45˚ to the wind direction on wind shear stresses (the driving force for sediment transport) and found that stresses returned to upwind boundary levels at 22 x the barrier height. These studies suggest that a distance of about 25 x the barrier height is appropriate for reintroducing sand into the transport corridor, and that the area between the fenceline and 25 x the height of the barrier should be considered impacted. Figures from the studies cited above are shown in Figure 3. Note that several publications use a value of 10:1 for the lee distance. These however seem to be derived from studies conducted to calculate a barrier spacing for soil conservation purposes, so that within 10 barrier heights practitioners can be confident there will be little or no sediment erosion. Our goal in developing a mitigation scheme is to have pre-project levels of sediment erosion, requiring a larger fetch downwind of the barrier. Thus for an 8 foot high wind fence we propose a 200 foot wide lee area, beyond which sand could be reintroduced into transport.
3. What elements would go into a potential mitigation program?
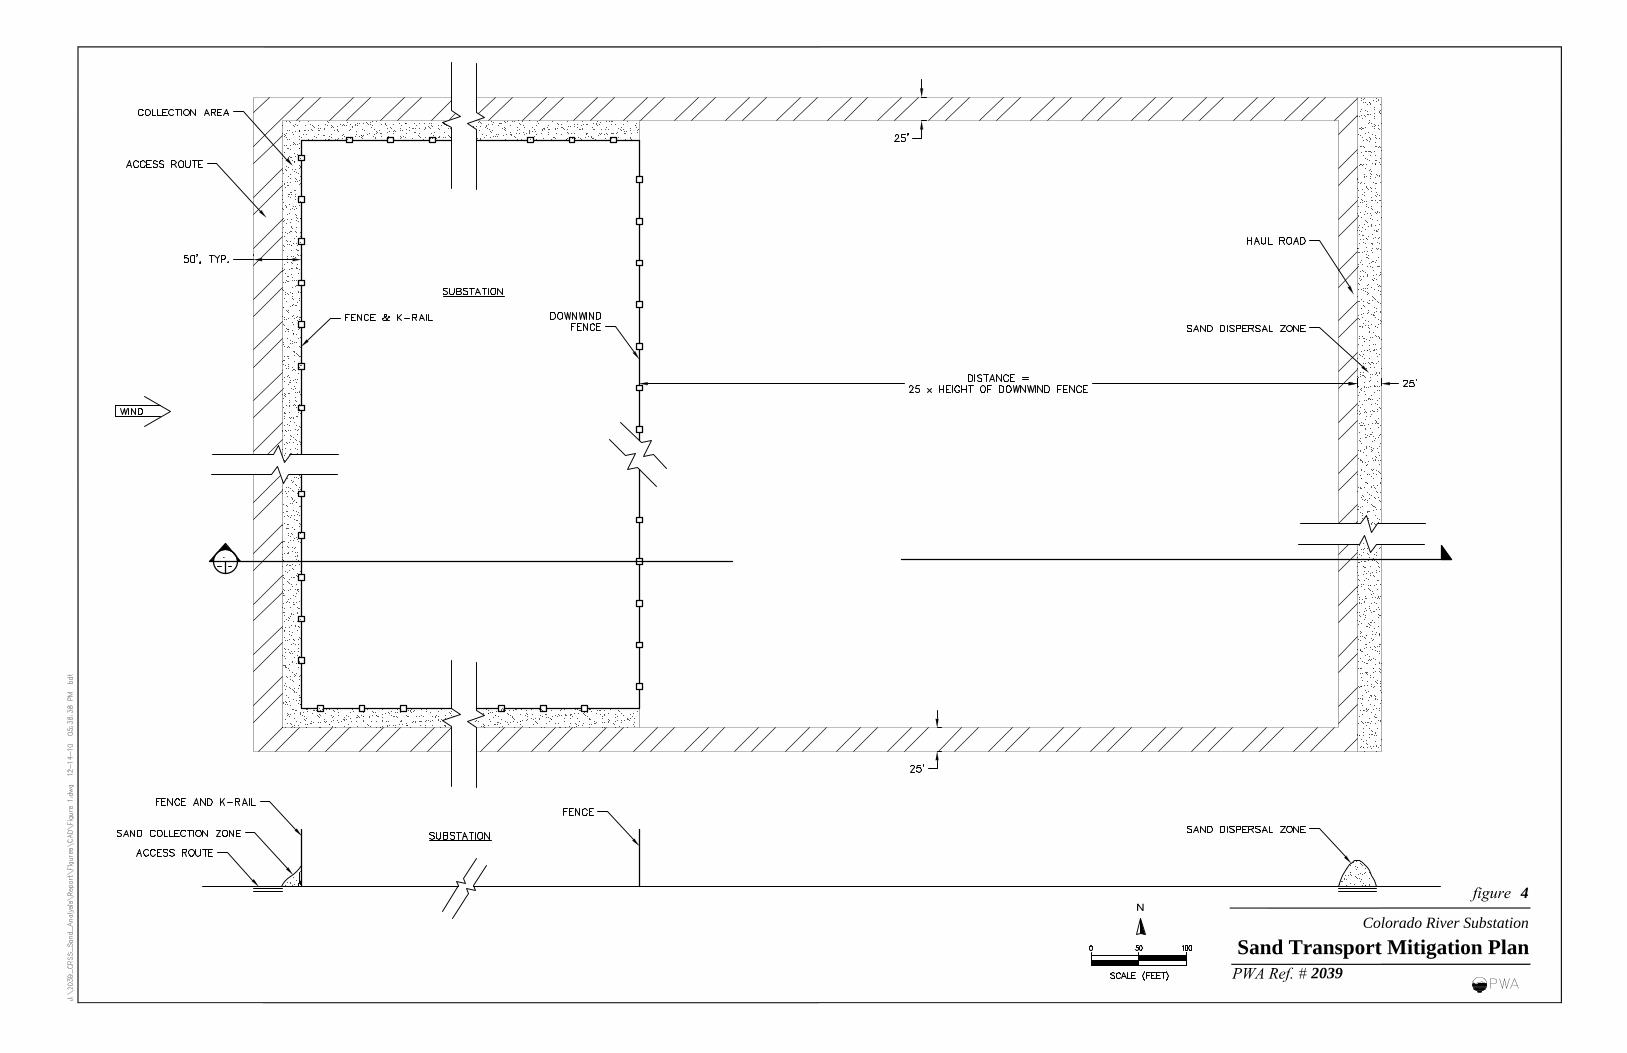
A potential mitigation scheme would have the following elements: an upwind sand collection area primarily on the western project boundary; a haul road around the north and south sides of the project (along which some additional sand collection might be necessary); a lee zone downwind of the project site in which the winds were too muted to transport sand; and a sand injection zone outside the lee zone where sand from upwind could be made available for entrainment downwind.
Upwind collection area (western boundary)
The project would have an upwind barrier such as a sand fence or a wall against which sand would accumulate, and from which it could be scraped. For example, it might consist of ‘k-rails’ or Jersey Barriers (concrete temporary highway barriers) which are 32 inches high and would withstand scraping. Once sand reached a threshold level (e.g. 3 feet of sand accumulated at the toe of the wall) the sand would be scraped up into trucks and hauled around the project site. We recommend designating a 50 foot wide impact zone upwind of the boundary to allow for heavy machinery to collect, load and haul sand, and to allow vehicles to turn. The equipment would likely consist of a loader to scrape sand from the wall, and a dump truck to haul the sand around the site.
4
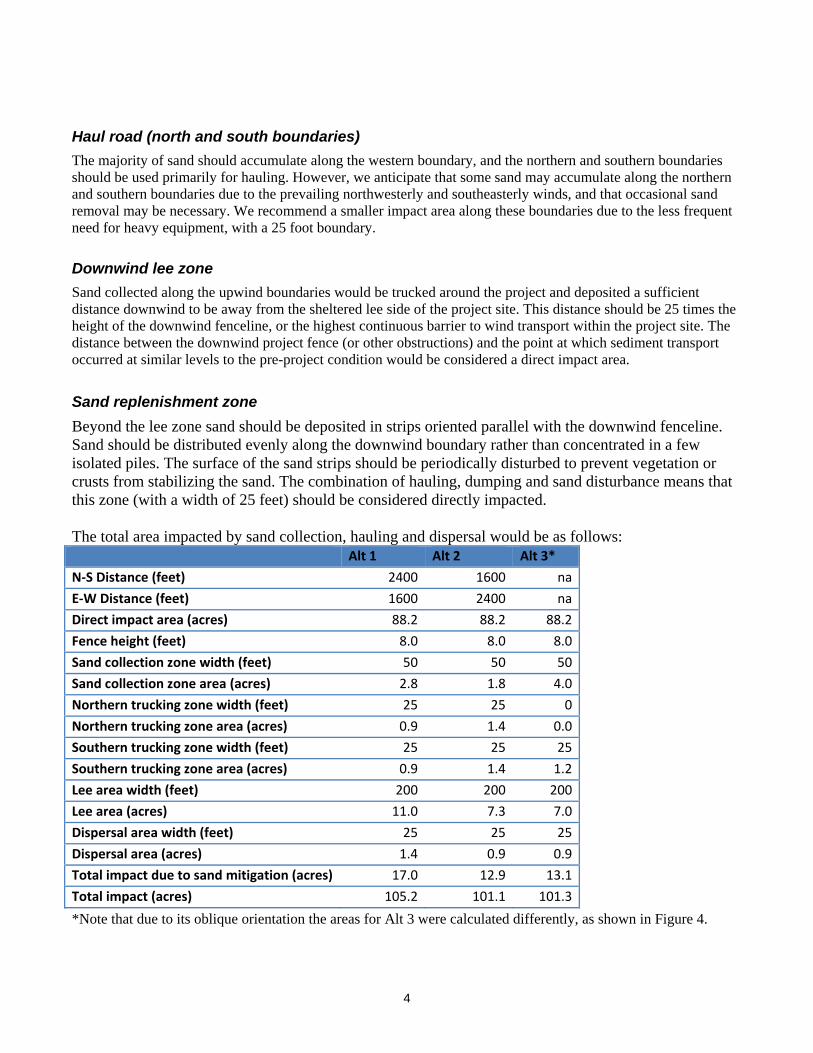
Haul road (north and south boundaries)
The majority of sand should accumulate along the western boundary, and the northern and southern boundaries should be used primarily for hauling. However, we anticipate that some sand may accumulate along the northern and southern boundaries due to the prevailing northwesterly and southeasterly winds, and that occasional sand removal may be necessary. We recommend a smaller impact area along these boundaries due to the less frequent need for heavy equipment, with a 25 foot boundary.
Downwind lee zone
Sand collected along the upwind boundaries would be trucked around the project and deposited a sufficient distance downwind to be away from the sheltered lee side of the project site. This distance should be 25 times the height of the downwind fenceline, or the highest continuous barrier to wind transport within the project site. The distance between the downwind project fence (or other obstructions) and the point at which sediment transport occurred at similar levels to the pre-project condition would be considered a direct impact area. Sand replenishment zone
Beyond the lee zone sand should be deposited in strips oriented parallel with the downwind fenceline. Sand should be distributed evenly along the downwind boundary rather than concentrated in a few isolated piles. The surface of the sand strips should be periodically disturbed to prevent vegetation or crusts from stabilizing the sand. The combination of hauling, dumping and sand disturbance means that this zone (with a width of 25 feet) should be considered directly impacted. The total area impacted by sand collection, hauling and dispersal would be as follows: Alt 1 Alt 2 Alt 3*
N‐S Distance (feet) 2400 1600 na
E‐W Distance (feet) 1600 2400 na
Direct impact area (acres) 88.2 88.2 88.2
Fence height (feet) 8.0 8.0 8.0
Sand collection zone width (feet) 50 50 50
Sand collection zone area (acres) 2.8 1.8 4.0
Northern trucking zone width (feet) 25 25 0
Northern trucking zone area (acres) 0.9 1.4 0.0
Southern trucking zone width (feet) 25 25 25
Southern trucking zone area (acres) 0.9 1.4 1.2
Lee area width (feet) 200 200 200
Lee area (acres) 11.0 7.3 7.0
Dispersal area width (feet) 25 25 25
Dispersal area (acres) 1.4 0.9 0.9
Total impact due to sand mitigation (acres) 17.0 12.9 13.1
Total impact (acres) 105.2 101.1 101.3
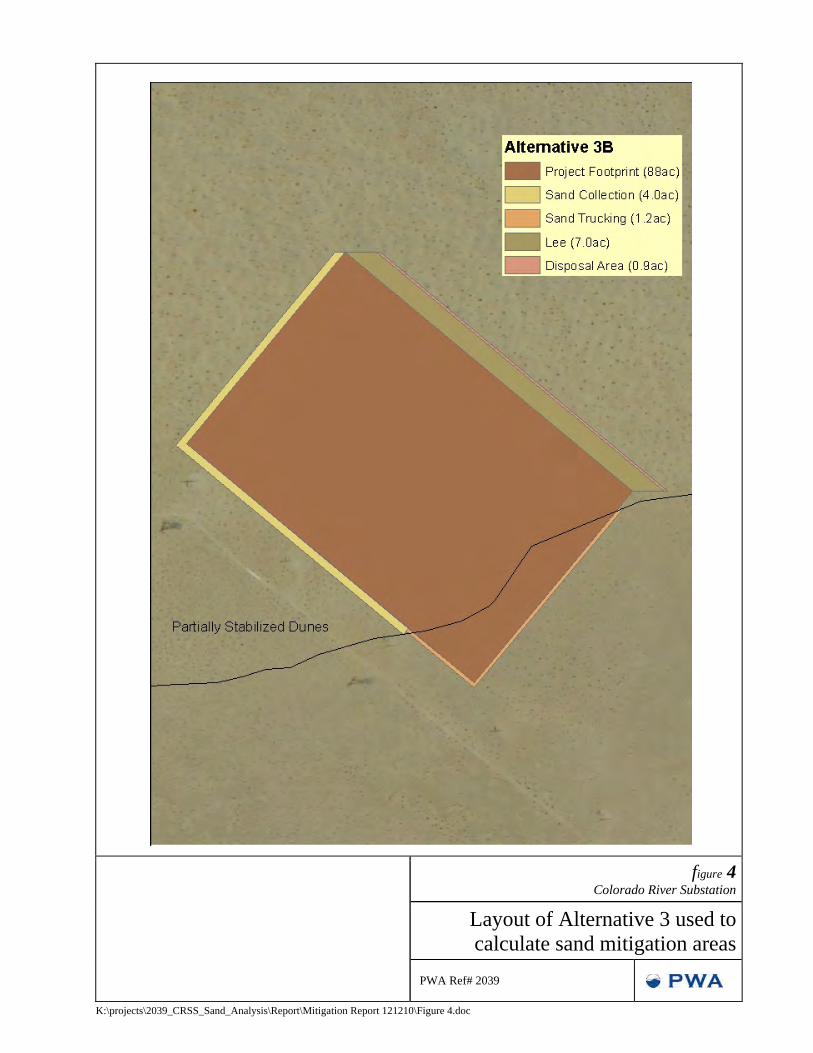
*Note that due to its oblique orientation the areas for Alt 3 were calculated differently, as shown in Figure 4.
5
4. References
Fryrear, D.W. and Bilbro, J.D. Wind erosion control with residues and related practices. In: Unger, P.W. (Editor) 1994, p.12. Managing agricultural residues. CRC Press. Heisler, G.M. and DeWalle, D.R. 1988. Effects of windbreak structure on wind flow. Agriculture, Ecosystems and Environment, Volume 22-23, p 41-69. Kenney, M. 2010. Preliminary Geomorphic Aeolian Report: Colorado River Substation, Riverside County, CA Kocurek, G. and Lancaster, N. 1999. Aeolian system sediment state: theory and Mojave Desert Kelso dune field example. Journal of Sedimentology 46, p. 505-515. Lancaster, N. and Baas, A. 1998. Influence of vegation cover on sand transport by wind: field studies at Owens Lake, California. Earth Surface Processes and Landforms, Volume 23, p. 69-82. Muhs, D.R., Reynolds, R.L., Been, J. and Skipp, G. Eolian sand transport pathways in the southwestern United States: importance of the Colorado River and local sources. Quaternary International Volume 104, pages 3-18, 2003. Sharp, R.P. 1964. Wind-driven sand in Coachella Valley, California. Geological Society of America Bulletin, volume 75, p. 785-804. Cited in Griffiths et al. 2002. Sharp, R.P. 1980. Wind-driven sand in Coachella Valley, California: Further data. Geological Society of America Bulletin, volume 91, p. 724-730. Cited in Griffiths et al. 2002. Skidmore, E. L. and Hagen, L. J. 1977. Reducing Wind Erosion with Barriers. Transactions of the American Society of Agricultural Engineers, Vol. 20, No. 5, p. 911-915 USDA. 1982. Erosion Handbook – Wind and Water, Section EH-2 (Texas edition), Soil Conservation Service, USDA, Washington DC.
C:\Users\Public\Documents\Figure 1.doc
Plates a-d from Lancaster and Baas, 1998, Figure 2, showing relationship between vegetation and sediment transport at Owens Lake, CA. Plate a represents 100% of maximum sediment rate for the wind regime and sand supply. Plate b has 46% of the sand transport rate of Plate a. Plate c has 10% of the transport rate of Plate a. Plate d has 4% of the sand transport rate of Plate a.
figure 1 Colorado River Substation
Relationship between sediment transport rate and vegetation cover for Owens Lake
PWA Ref# 2039
K:\projects\2039_CRSS_Sand_Analysis\Report\Mitigation Report 121210\Figure 2.doc
e Kelso dunes (sediment flux = 7.86 m3 m-1 yr-1)
f The project site – Zone A (sediment flux assumed to be 2.2 m3 m-1 yr-1)
g The project site – Zone B (sediment flux assumed to be 0.6 m3 m-1 yr-1)
h Whitewater Floodplain Preserve (maximum sediment flux = 0.2 m3 m-1 yr-1)
Source: Plate e – Andy Tomaselli via Panoramio and Google Earth Plate f – Kenney (2010) Plate g – Kenney (2010) Plate h - W.N. Weber via Panoramio and Google Earth
figure 2Colorado River Substation
Visual comparison of the project site and sites with sediment transport data
PWA Ref# 2039
C:\Users\Public\Documents\Figure 3.doc
Sources: A – Skidmore and Hagen, 1977 B – Skidmore and Hagen, 1977 C – Heisler and DeWalle 1988
Note: red line indicates point where downwind erosion potential is restored to upwind potential
figure 3 Colorado River Substation
Effects of wind barriers on wind speed and sediment transport potential
PWA Ref# 2039
Wind direction
K:\projects\2039_CRSS_Sand_Analysis\Report\Mitigation Report 121210\Figure 4.doc
figure 4Colorado River Substation
Layout of Alternative 3 used to calculate sand mitigation areas
PWA Ref# 2039
-
4
Colorado River Substation
Sand Transport Mitigation Plan2039