Embed Size (px)
Citation preview

Geology of Phosphate Deposits of Northern Peninsular Florida By GILBERT H. ESPENSHADE and CHARLES W. SPENCER
GEOLOGICAL SURVEY BULLETIN 1118
Prepared on behalf of the U.S. Atomic Energy Commission
UNITED STATES GOVERNMENT PRINTING OFFICE, WASHINGTON : 1963
UNITED STATES DEPARTMENT OF THE INTERIOR
STEWART L. UDALL, Secretary
GEOLOGICAL SURVEY
Thomas B. Nolan, Director
The U.S. Geological Survey Library has cataloged this publication as follows :
Espenshade, Gilbert Howry, 1912-Geology of phosphate deposits of northern peninsular
Florida, by Gilbert H. Espenshade and Charles W. Spenc.er. Washington, U.S. Govt. Print. Off., 1962.
v, 115 p. illus., maps (part col.) diagrs., tables. 24 em. (U.S. Geo-logical Survey. Bulletin 1118)
Part of illustrative matter folded in pocket. Bibliography : p. 56-58.
1. Geology-Florida. 2. Phosphates-Florida. 3. Mines and mineral resources-Florida. 4. Borings-Florida. I. Spencer, Charles Winthrop, 1930- joint author. II. Title: Phosphate deposits of northern peninsular Florida. (Series)
For sale by the Superintendent of Documents, U.S. Government Printing Office Washington 25, D.C.
CONTENTS
Page Abstract ____________________________________ -·_____________________ 1
Introduction------------------------------------------------------ 3 Previous investigation__________________________________________ 3 Present investigation and scope of work__________________________ 3
Acknowledgments--------------------------------------------- 6 GeneralgeologY--------------------------------------------------- 6
Stratigraphy and geologic history _____ ---------------------_----- 6 Structure----------------------------------------------------- 9 GeomorphologY----------------------------------------------- 10
Nomenclature of phosphate minerals and deposits_____________________ 14 Sedimentary phosphatic materials __ ----------------------------- 15 Supergene phosphatic rna terials ___________ .. _ _ _ _ _ _ _ _ _ _ _ _ _ _ _ _ _ _ _ _ _ 16
Hawthorn formation and younger beds________________________________ 17 Miocene series ____ ------- ________________________ ------------- 17
Hawthorn formation _____________________ -------------_____ 17
StratigraphY------------------------------------------ 17 Lnhology_____________________________________________ 18
Dolomite and phosphatic dolomite___________________ 18 Limestone________________________________________ 19
ClaY--------------------------------------------- 19 Phosphorite ____ ------_____________________________ 21
Distribution and thickness ____ -------------------_______ 21 Faunaandage---------------------------------------- 25
Beds of late Miocene age___________________________________ 26 Miocene(?) or Pliocene(?) series_________________________________ 27
Clayeysand---------------------------------------------- 27 Pliocene(?) to Recent_ _ _ _ _ _ _ _ _ _ _ _ _ _ _ _ _ _ _ _ _ _ _ _ _ _ _ _ _ _ _ _ _ _ _ _ _ _ _ _ _ _ 27
Sand----------------------------------------------------- 27 Weathering alterations_____________________________________________ 28
Supergene alteration of phosphorite _________________ ------_______ 28 Possible stratigraphic implications_______________________________ 29
Hard-rock phosphate deposits_______________________________________ 32
Geology------------------------------------------------------ 32 Stratigraphy and lithology______________________________________ 32 Age of the phosphatic sands and clays____________________________ 37 Origin________________________________________________________ 38
III
IV CONTENTS
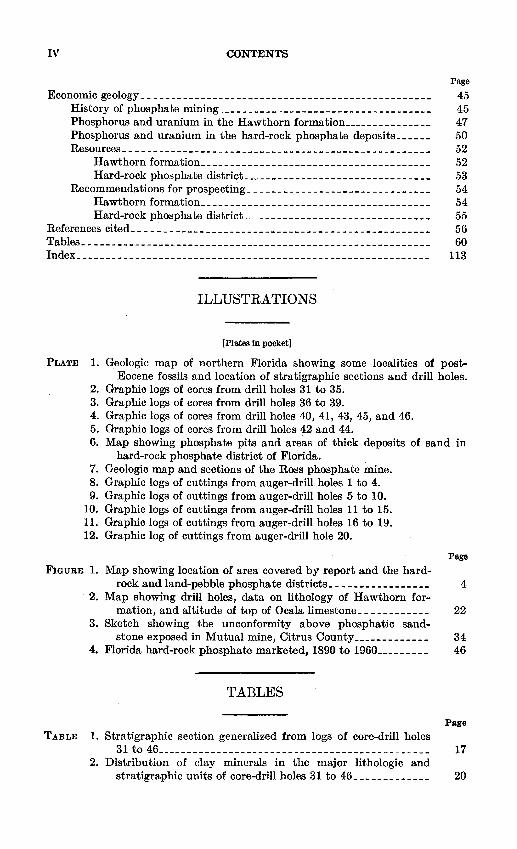
Page Economic geology_________________________________________________ 45
History of phosphate mining____________________________________ 45 Phosphorus and uranium in the Hawthorn formation_______________ 47 Phosphorus and uranium in the hard-rock phosphate deposits______ 50 Resources---------------------------------------------------- 52
Hawthorn formation_______________________________________ 52
Hard-rock phosphate district ___ ----------------------------- 53 Recommendations for prospecting ___ ------- __ ------------------- 54
Hawthorn formation __ ----------------------------------___ 54 Hard-rock phosphate district ______ -------------------------- 55
References cited__________________________________________________ 56
Tables----------------------------------------------------------- 60 Index------------------------------------------------------------ 113
ILLUSTRATIONS
[Plates in pocket]
PLATE 1. Geologic map of northern Florida showing some localities of post-Eocene fossils and location of stratigraphic sections and drill holes.
2. Graphic logs of cores from drill holes 31 to 35. 3. Graphic logs of cores from drill holes 36 to 39. 4. Graphic logs of cores from drill holes 40, 41, 43, 45, and 46. 5. Graphic logs of cores from drill holes 42 and 44. 6. Map showing phosphate pits and areas of thick deposits of sand in
hard-rock phosphate district of Florida. 7. Geologic map and sections of the Ross phosphate mine. 8. Graphic logs of cuttings from auger-drill holes 1 to 4. 9. Graphic logs of cuttings from auger-drill holes 5 to 10.
10. Graphic logs of cuttings from auger-drill holes 11 to 15. 11. Graphic logs of cuttings from auger-drill holes 16 to 19. 12. Graphic log of cuttings from auger-drill hole 20.
Page
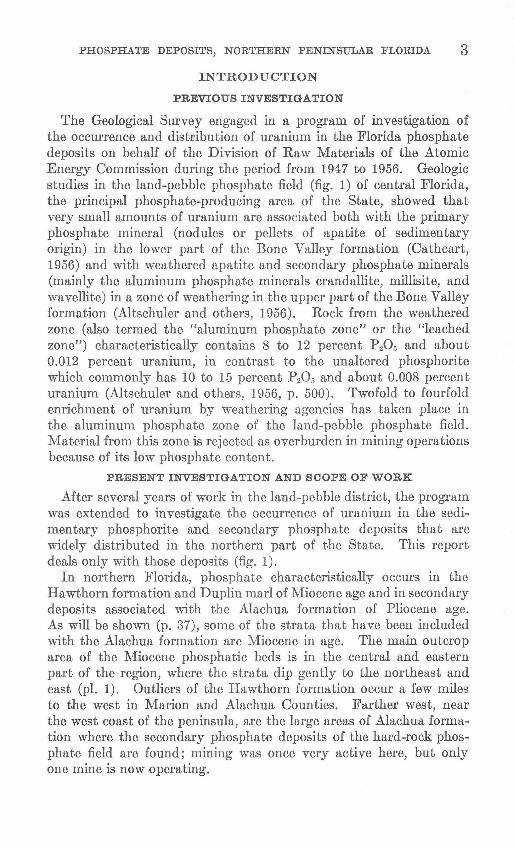
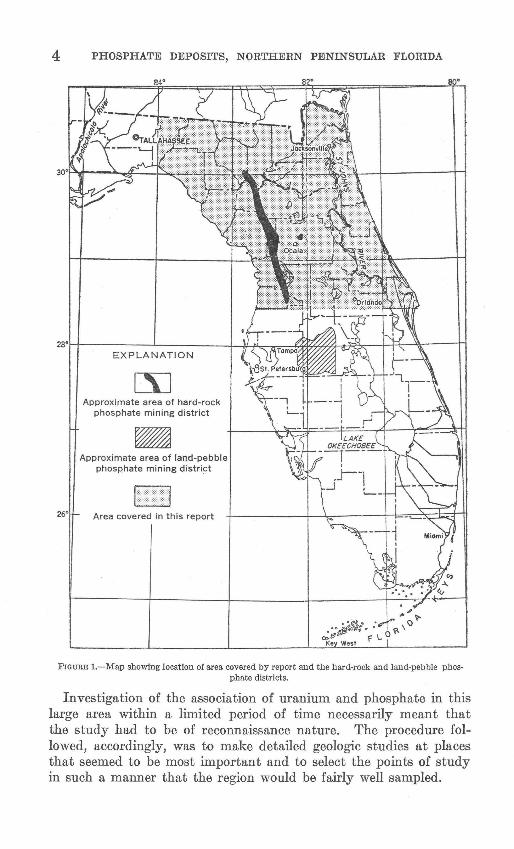
FIGURE 1. Map showing location of area covered by report and the hard-rock and land-pebble phosphate districts_________________ 4
2. Map showing drill holes, data on lithology of Hawthorn for-mation, and altitude of top of Ocala limestone ___ --------- 22
3. Sketch showing the unconformity above phosphatic sand-stone exposed in Mutual mine, Citrus County_____________ 34
4. Florida hard-rock phosphate marketed, 1890 to 1960_________ 46
TABLES
Page
TABLE 1. Stratigraphic section generalized from logs of core-drill holes 31 to 46---------------------------------------------- 17
2. Distribution of clay minerals in the major lithologic and stratigraphic units of core-drill holes 31 to 46_____________ 20
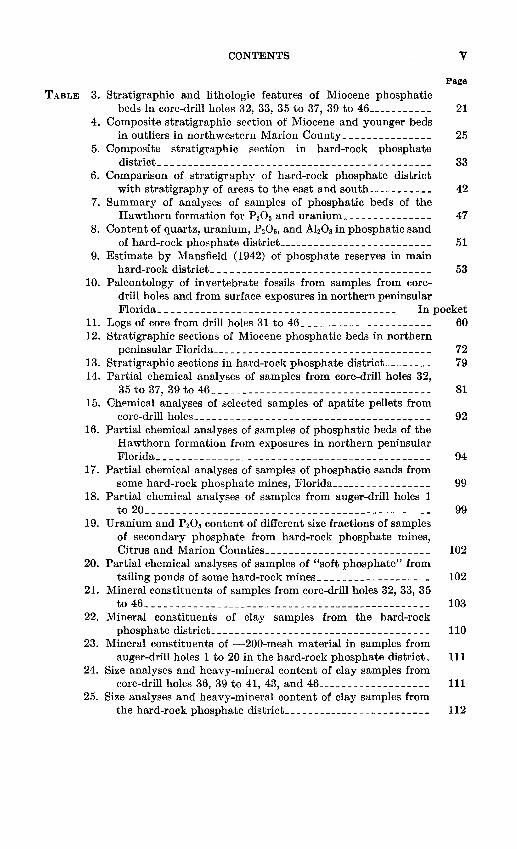
TABLE 3.
4.
5.
6.
7.
8.
9.
10.
11. 12.
13. 14.
15.
16.
17.
18.
19.
20.
21.
22.
23.
24.
25.
CONTENTS v
Page
Stratigraphic and lithologic features of Miocene phosphatic beds in core-drill holes 32, 33,35 to 37,39 to 46___________ 21
Composite stratigraphic section of Miocene and younger beds in outliers in northwestern Marion County_______________ 25
Composite stratigraphic section in hard-rock phosphate district_ _ _ _ _ _ _ _ _ _ _ _ _ _ _ _ _ _ _ _ _ _ _ _ _ _ _ _ _ _ _ _ _ _ _ _ _ _ _ _ _ _ _ _ _ _ 33
Comparison of stratigraphy of hard-rock phosphate district with stratigraphy of areas to the east and south___________ 42
Summary of analyses of samples of phosphatic beds of the Hawthorn formation for P205 and uranium_______________ 47
Content of quartz, uranium, P205, and Ah03 in phosphatic sand of hard-rock phosphate district__________________________ 51
Estimate by Mansfield (1942) of phosphate reserves in main hard-rock district_____________________________________ 53
Paleontology of invertebrate fossils from samples from core-drill holes and from surface exposures in northern peninsular Florida_ _ _ _ _ _ _ _ _ _ _ _ _ _ _ _ _ _ _ _ _ _ _ _ _ _ _ _ _ _ _ _ _ _ _ _ _ _ _ _ In pocket
Logs of core from drill holes 31 to 46 _ _ _ _ _ _ _ _ _ _ _ _ _ _ _ _ _ _ _ _ _ _ 60 Stratigraphic sections of Miocene phosphatic beds in northern
peninsular Florida____ _ _ _ _ _ _ _ _ _ _ _ _ _ _ _ _ _ _ _ _ _ _ _ _ _ _ _ _ _ _ _ _ _ 72
Stratigraphic sections in hard-rock phosphate district________ 79 Partial chemical analyses of samples from core-drill holes 32,
35 to 37, 39 to 46_____________________________________ 81 Chemical analyses of selected samples of apatite pellets from
core-drill holes_ _ _ _ _ _ _ _ _ _ _ _ _ _ _ _ _ _ _ _ _ _ _ _ _ _ _ _ _ _ _ _ _ _ _ _ _ _ _ _ 92
Partial chemical analyses of samples of phosphatic beds of the Hawthorn formation from exposures in northern peninsular Florida______________________________________________ 94
Partial chemical analyses of samples of phosphatic sands from some hard-rock phosphate mines, Florida_________________ 99
Partial chemical analyses of samples from auger-drill holes 1 to 20------------------------------------------------ 99
Uranium and P205 content of different size fractions of samples of secondary phosphate from hard-rock phosphate mines, Citrus and Marion Counties____________________________ 102
Partial chemical analyses of samples of "soft phosphate" from tailing ponds of some hard-rock mines___________________ 102
Mineral constituents of samples from core-drill holes 32, 33, 35 to 46------------------------------------------------ 103
Mineral constituents of clay samples from the hard-rock phosphate district_____________________________________ 110
Mineral constituents of -200-mesh material in samples from auger-drill holes 1 to 20 in the hard-rock phosphate district_ 111
Size analyses and heavy-mineral content of clay samples from core-drill holes 36, 39 to 41, 43, and 46___________________ 111
Size analyses and heavy-mineral content of clay samples from the hard-rock phosphate district _______________ .__________ 112

GEOLOGY OF PHOSPHATE DEPOSITS OF NORTHERN PENINSULAR FLORIDA
By GILBERT H. EsPENSHADE and CHARLES W. SPENCER
ABSTRACT
Stratigraphic information, fossil collections, and phosphate samples were obtained in a reconnaissance geologic study of uraniferous phosphate deposits from exposures at numerous localities and from 30 auger-drill holes and 16 core-drill holes.
New data are presented on the lithology, stratigraphy, and paleontology of the Hawthorn formation (early and middle Miocene age) and younger beds in an area extending north from central Lake County to the Florida-Georgia line. Phosphatic dolomite is the dominant lithologic type in the Hawthorn formation and forms the lower part of the section, which is here called the phosphatic dolomite unit. Phosphorite (phosphatic clayey sand) forms the upper part of the Hawthorn, which is called the phosphorite unit. The Hawthorn is covered by nonphosphatic sand and clayey sand of Miocene(?) or younger age. Carbonatefluorapatite, in the form of shiny pellets and grains, is the sedimentary phosphate mineral. Two varieties of dolomite occur in the Hawthorn-hard, tough, cemented dolomite and soft claylike dolomite composed of uncemented tiny dolomite rhombs. Clay beds associated with dolomite are made up of the clay minerals attapulgite and montmorillonite, with attapulgite apparently most abundant. Montmorillonite is the only clay mineral in nearly all the nondolomitic phosphorite. Both clay minerals form beds of fuller's earth. Kaolinite is the clay mineral in the clayey sands that overlie the phosphorite beds of the Hawthorn. The phosphorite unit of the Hawthorn formation in northern peninsular Florida is lithologically identical with the phosphorite of the Bone Valley formation, which overlies the Hawthorn in central Florida.
Thickness of the Hawthorn formation where intersected by the different drill holes ranges from 24 feet in one of the most southerly drill holes to 288 feet in the most northeasterly drill hole. In general, the thickness of the Hawthorn and the relative proportion of dolomite beds to phosphorite beds are greatest in the northernmost drill holes. Similar sequences of lithologic units were penetrated by most drill holes, but similar lithologic units are not everywhere of the same age. In one drill hole, both the phosphatic dolomite unit and the overlying phosphorite unit contain fossils of early Miocene age; in another drill hole, early Miocene fossils occur only in the basal beds of the phosphatic dolomite unit, and middle Miocene fossils occur in the overlying beds of the phosphatic dolomite unit.
Supergene alteration of the upper phosphorite beds of the Hawthorn formation by ground water has resulted at many places in partial leaching of apatite pellets; deposition of the secondary aluminum phosphate minerals crandallite, millisite,
1
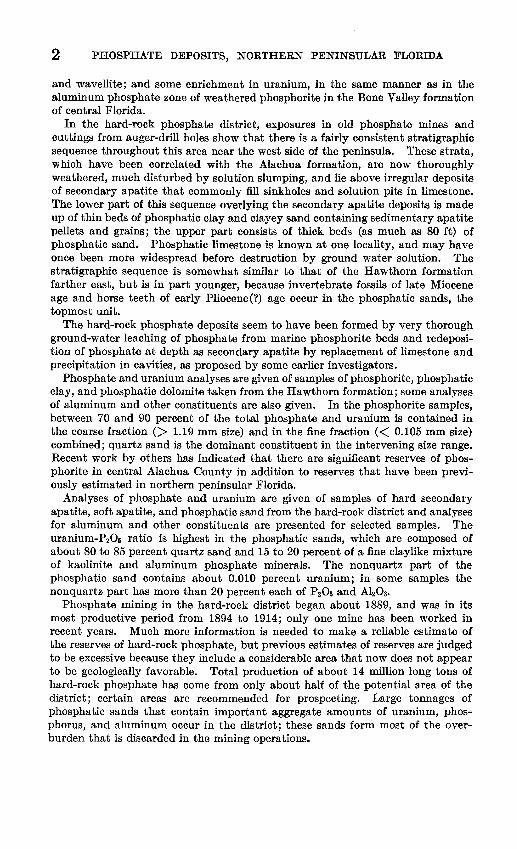
2 PHOSPHATE DEPOSITS, NORTHERN PENINSULAR FLORIDA
and wavellite; and some enrichment in uranium, in the same manner as in the aluminum phosphate zone of weathered phosphorite in the Bone Valley formation of central Florida.
In the hard-rock phosphate district, exposures in old phosphate mines and cuttings from auger-drill holes show that there is a fairly consistent stratigraphic sequence throughout this area near the west side of the peninsula. These strata, which have been correlated with the Alachua formation, are now thoroughly weathered, much disturbed by solution slumping, and lie above irregular deposits of secondary apatite that commonly fill sinkholes and solution pits in limestone. The lower part of this sequence overlying the secondary apatite deposits is made up of thin beds of phosphatic clay and clayey sand containing sedimentary apatite pellets and grains; the upper part consists of thick beds (as much as 80 ft) of phosphatic sand. Phosphatic limestone is known at one locality, and may have once been more widespread before destruction by ground water solution. The stratigraphic sequence is somewhat similar to that of the Hawthorn formation farther east, but is in part younger, because invertebrate fossils of late Miocene age and horse teeth of early Pliocene(?) age occur in the phosphatic sands, the topmost unit.
The hard-rock phosphate deposits seem to have been formed by very thorough ground-water leaching of phosphate from marine phosphorite beds and redeposition of phosphate at depth as secondary apatite by replacement of limestone and precipitation in cavities, as proposed by some earlier investigators.
Phosphate and uranium analyses are given of samples of phosphorite, phosphatic clay, and phosphatic dolomite taken from the Hawthorn formation; some analyses of aluminum and other constituents are also given. In the phosphorite samples, between 70 and 90 percent of the total phosphate and uranium is contained in the coarse fraction (> 1.19 mm size) and in the fine fraction ( < 0.105 mm size) combined; quartz sand is the dominant constituent in the intervening size range. Recent work by others has indicated that there are significant reserves of phosphorite in central Alachua County in addition to reserves that have been previously estimated in northern peninsular Florida.
Analyses of phosphate and uranium are given of samples of hard secondary apatite, soft apatite, and phosphatic sand from the hard-rock district and analyses for aluminum and other constituents are presented for selected samples. The uranium-P205 ratio is highest in the phosphatic sands, which are composed of about 80 to 85 percent quartz sand and 15 to 20 percent of a fine claylike mixture of kaolinite and aluminum phosphate minerals. The nonquartz part of the phosphatic sand contains about 0.010 percent uranium; in some samples the nonquartz part has more than 20 percent each of P205 and Al20a.
Phosphate mining in the hard-rock district began about 1889, and was in its most productive period from 1894 to 1914; only one mine has been worked in recent years. Much more information is needed to make a reliable estimate of the reserves of hard-rock phosphate, but previous estimates of reserves are judged to be excessive because they include a considerable area that now does not appear to be geologically favorable. Total production of about 14 million long tons of hard-rock phosphate has come from only about half of the potential area of the district; certain areas are recommended for prospecting. Large tonnages of phosphatic sands that contain important aggregate amounts of uranium, phosphorus, and aluminum occur in the district; these sands form most of the overburden that is discarded in the mining operations.
PHOSPHATE DEPOSITS, NORTHERN PENINSULAR FLORIDA 3
INTRODUCTION
PREVIOUS INVESTIGATION
The Geological Survey engaged in a program of investigation of the occurrence and distribution of uranium in the Florida phosphate deposits on behalf of the Division of Raw Materials of the Atomic Energy Commission during the period from 194 7 to 1956. Geologic studies in the land-pebble phosphate field (fig. 1) of central Florida, the principal phosphate-producing area of the State, showed that very small amounts of uranium are associated both with the primary phosphate mineral (nodules or pellets of apatite of sedimentary origin) in the lower part of the Bone Valley formation (Cathcart, 1956) and with weathered apatite and secondary phosphate minerals (mainly the aluminum phosphate minerals crandallite, millisite, and wavellite) in a zone of weathering in the upper part of the Bone Valley formation (Altschuler and others, 1956). Rock frorn the weathered zone (also termed the "aluminum phosphate zone" or the "leached zone") characteristically contains 8 to 12 percent P205 and about 0.012 percent uranium, in contrast to the unaltered phosphorite which cmnmonly has 10 to 15 percent P20 5 and about 0.008 percent uranium (Altsehuler and others, 1956, p. 500). Twofold to fourfold enrichment of uranium by weathering agencies has taken place in the aluminum phosphate zone of the land-pebble phosphate field. Material from this zone is rejected as overburden in mining operations because of its low phosphate content.
PRESENT INVESTIGATION AND SCOPE OF WORK
After several years of work in the land-pebble district, the program was extended to investigate the occurrence of uranium in the sedimentary phosphorite and secondary phosphate deposits that are widely distributed in the northern part of the State. This report deals only with those deposits (fig. 1).
In northern Florida, phosphate characteristically occurs in the Hawthorn formation and Duplin marl of Miocene age and in secondary deposits associated with the Alachua formation of Pliocene age. As will be shown (p. 37), some of the strata that have been included with the Alachua formation are Miocene in age. The main outcrop area of the 11iocene phosphatic beds is in the central and eastern part of the region, where the strata dip gently to the northeast and east (pl. 1). Outliers of the Hawthorn formation occur a few miles to the west in Marion and Alachua Counties. Farther west, near the west coast of the peninsula, are the large areas of Alachua formation where the secondary phosphate deposits of the hard-rock phosphate field are found; mining was once very active here, but only one mine is now operating.
4 PHOSPHATE DEPOSITS, NORTHERN PENINSULAR FLORIDA
EXPLANATION
Approximate area of hard-rock phosphate mining district -Approximate area of land-pebble phosphate mining district
Area covered in this report
FIGURE 1.-Map showing location of area covered by report and the bard-rock and land-pebble phosphate districts.
Investigation of the association of uranium and phosphate in this large area within a limited period of time necessarily meant that the study had to be of reconnaissance nature. The procedure followed, accordingly, was to make detailed geologic studies at places that seemed to be most important and to select the points of study in such a manner that the region would be fairly well sampled.
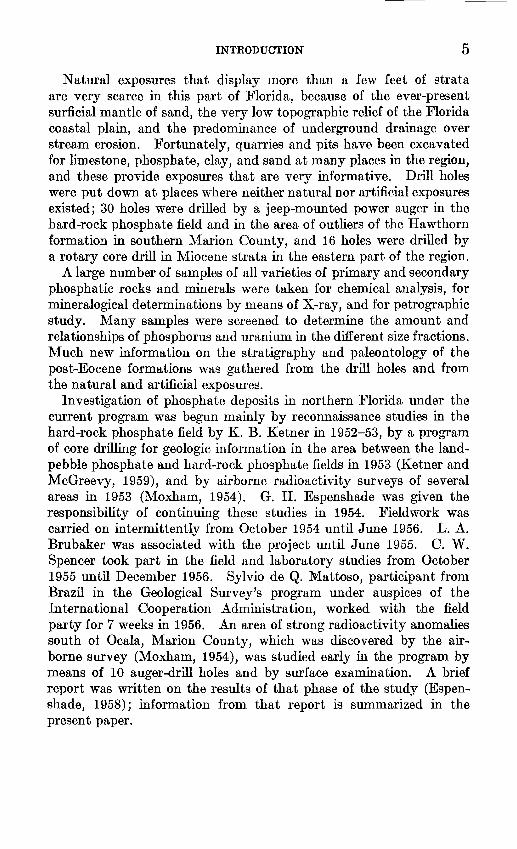
INTRODUCTION 5
Nat ural exposures that display 1nore than a few feet of strata are very scarce in this part of Florida, because of the ever-present surficial mantle of sand, the very low topographic relief of the Florida coastal plain, and the predominance of underground drainage over stream erosion. Fortunately, quarries and pits have been excavated for limestone, phosphate, clay, and sand at many places in the region, and these provide exposures that are very informative. Drill holes were put down at places where neither natural nor artificial exposures existed; 30 holes were drilled by a jeep-mounted power auger in the hard-rock phosphate field and in the area of outliers of the Hawthorn formation in southern Marion County, and 16 holes were drilled by a rotary core drill in Miocene strata in the eastern part of the region.
A large number of samples of all varieties of primary and secondary phosphatic rocks and minerals were taken for chemical analysis, for mineralogical determinations by means of X-ray, and for petrographic study. ~1any samples were screened to determine the amount and relationships of phosphorus and uranium in the different size fractions. Much new information on the stratigraphy and paleontology of the post-Eocene formations was gathered from the drill holes and from the natural and artificial exposures.
Investigation of phosphate deposits in northern Florida under the current program was begun mainly by reconnaissance studies in the hard-rock phosphate field by K. B. Ketner in 1952-53, by a program of core drilling for geologic infonnation in the area between the landpebble phosphate and hard-rock phosphate fields in 1953 (Ketner and McGreevy, 1959), and by airborne radioactivity surveys of several areas in 1953 (Moxham, 1954). G. H. Espenshade was given the responsibility of continuing these studies in 1954. Fieldwork was carried on intermittently from October 1954 until June 1956. L. A. Brubaker was associated with the project until June 1955. C. W. Spencer took part in the field and laboratory studies from October 1955 until December 1956. Sylvia de Q. Mattoso, participant from Brazil in the Geological Survey's program under auspices of the International Cooperation Administration, worked with the field party for 7 weeks in 1956. An area of strong radioactivity anomalies south of Ocala, Marion County, which was discovered by the airborne survey (Moxham, 1954), was studied early in the program by means of 10 auger-drill holes and by surface examination. A brief report was written on the results of that phase of the study (Espenshade, 1958); information from that report is summarized in the present paper.
6 PHOSPHATE DEPOSITS, NORTHERN PENINSULAR FLORIDA
ACKNOWLEDGMENTS
Many colleagues in the Geological Survey have contributed to this work. Druid Wilson has devoted much time to the study of the collections of Miocene invertebrate fossils, and he is responsible for nearly all the fossil identifications and age assignments presented in this report. K. B. Ketner, Z. S. Altschuler, C. W. Cooke, and V. T. Stringfield have been particularly helpful in introducing the senior author to the geology of the phosphate deposits and northern Florida and in discussing different geologic problems in the field and office. Numerous chemical analyses and mineral determinations have been made by the various analysts named in the tables of analyses.
Herman Gunter, R. 0. Vernon, and others of the Florida Geological Survey have aided the investigation in the course of several field conferences and other discussions. The staff of the Tennessee Valley Authority in Ocala, Fla., which was engaged in prospecting for phosphate deposits in the hard-rock district, has furnished data on the results of its exploration. Local residents and officials have been most cooperative; the Kibler-Camp Phosphate Enterprise gave access to its producing mine south of Dunnellon, and State and county road officials granted permission to drill holes along road right-of-ways. E. C. Pirkle, of the University of Florida, who was studying the geology of Alachua County, contributed significant information and ideas to the field studies of this project.
GENERAL GEOLOGY
STRATIGRAPHY AND GEOLOGIC HISTORY
The general features of the geology of northern peninsular Florida are well known and are outlined by Cooke (1945) in his bulletin on the geology of the State. Detailed geologic studies in the region are few, however, and cover only three counties: Citrus and Levy Counties, by Vernon (1951), and Alachua County, by Pirkle (1956a, b; 1957a, b; 1958). Much detailed stratigraphic and physiographic study remains to be done before the geology of this part of the State and the history of geologic events during the Cenozoic era are fully understood.
The oldest rocks exposed in Florida are limestones of Eocene age (n1ainly the Ocala limestone) that crop out along the west side of the northern part of the peninsula in an area about 140 miles long and as much as 50 miles wide (pl. 1). These Eocene limestones are exposed in a broad arch, trending northwest, that is known as the Ocala uplift, or arch. Younger sedimentary rocks surround the Ocala arch on the north, east, and south; the west side is bordered by the shallow waters of the Gulf of Mexico. Limestones of late Oligocene age (principally the Suwannee limestone) rest unconformably on the Eocene beds around the northwest and southeast ends of the arch.
GENERAL GEOLOGY 7
Miocene sedimentary rocks of diverse character-clay, clayey sand, clayey-sandy phosphorite, and phosphatic dolomite (the Hawthorn formation)-are exposed, or have been penetrated in wells and drill holes, around the north end and east side of the arch, dipping gently northeast and east. Sin1ilar, but younger, beds (late Miocene) that are exposed farther east (pl. 1) have been correlated with the Duplin marl of North Carolina by Cooke (1945). The Miocene beds lie conformably upon the Oligocene lin1estone at the north end of the Ocala uplift and unconformably upon Eocene limestone at the east side of the uplift; they are also exposed in many small outliers upon the Eocene limestone near the middle of the arch and on Oligocene limestone at the south end. Phosphatic sands and clays (Alachua formation) cover the Eocene limestone in a narrow belt about 100 miles long on the axis of the Ocala arch. The age of the Alachua formation is considered to range from early Miocene to Pleistocene by Vern on (1951), and is believed to be Pliocene by Cooke (1945) and others. Pliocene and Pleistocene sediments, mostly sand and clayey sand, cover the Miocene beds along the eastern half of northern peninsular Florida.
Because the phosphate deposits are Miocene or younger in age, the pre-Miocene stratigraphy and geologic history need only a few further comments here; more complete discussions may be found in the papers by Cooke (1945) and Vernon (1951). Exploratory wells for oil in this part of Florida have shown that several thousand feet of Eocene and Cretaceous sedimentary rocks, largely of carbonate lithology, are present in depth and that beneath these strata are clastic sedimentary rocks, volcanic rocks, and granitic rocks of Paleozoic and possible Precambrian age. In the area of exposed Eocene rocks on the crest of the Ocala uplift in Citrus and Levy Counties, Vernon (1951) has distinguished three formations of Eocene age where the Ocala limestone alone is shown on plate 1. He has separated the Ocala limestone into two for1nations-the Ocala limestone (restricted) and the underlying Moodys Branch fonnation (subdivided into the Williston and Inglis members): he has also found exposures of the older A von Park limestone at several places. Puri (1957) has recently raised the Ocala to the status of a group that is subdivided into three formations: the Crystal River (youngest), the Williston, and the Inglis.
Strata of Miocene and younger age are characterized by large amounts of clastic sediments, clay and sand, in contrast to the dominant carbonate lithology of the older Cenozoic rocks. This marked change in depositional environment was accompanied by widespread formation of sedimentary phosphate during Miocene time.
Transgressions and withdrawals of the sea have happened at differ-
8 PHOSPHATE DEPOSITS, NORTHERN PENINSULAR FLORIDA
ent times during and since the Miocene epoch. Older clastic sediments have been reworked locally during marine invasions, and then modified further by slumping and deposition into sinkholes during periods of weathering and erosion. Similar appearing sediments in some areas contain vertebrate fossils of several ages. These events have resulted in subtle differences of lithology and stratigraphy that are easily confused or overlooked and have thereby hindered the und erst an ding of post-Oligocene stratigraphy and geologic history.
Disagreement exists among students of Florida geology about the nature of origin and the age of the Alachua formation and the hardrock phosphate deposits that are associated with the Alachua formation. This matter will be discussed at some length below (p. 38), but the differing points of view are here summarized. Vernon (1951) considers the Alachua formation to be a terrestrial deposit, possibly in part lacustrine and ftuvatile, of sand, clay, phosphatic clay, and phosphate rock that was formed on the crest of the Ocala uplift during Miocene and later time. According to this point of view, the Ocala uplift was an island area when the marine sediments of the Hawthorn formation were deposited. Hence, the Hawthorn formation would have never extended across the crest of the Ocala arch, although Vernon (1951, p. 179) does recognize that marine clays of Hawthorn age were deposited locally in southern Citrus County (pl. 1). Heregards the hard-rock phosphate deposits as ancient guano deposits. Vernon believes that the Alachua forn1ation ranges in age from early Miocene to Pleistocene, and that it may be the terrestrial equivalent of the entire 1narine Miocene of Florida. Cooke (1945), on the other hand, believes that n1arine sediments of the Hawthorn formation were deposited in the Ocala arch area during Miocene time. Uplift followed and these beds were very deeply weathered in Pliocene time, resulting in an irregularly compacted residuum of sand, clay, and phosphatic material, which makes up the Alachua formation. Cooke agrees with Sellards (1913) that the hard-rock phosphate deposits were formed by ground-water solution of phosphate from the Miocene strata and redeposition of phosphate by replacement and cavity filling in the underlying limestone beds. We think that the theories of Cooke and Sellards are for the most part correct.
Some of the difficulty in defining the Alachua formation is due to the fact that vertebrate fossils of different ages occur in strata that have been called Alachua. Cooke (1945, p. 201) explains this situation as follows:
The fossils commonly attributed to the Alachua formation include bones of Miocene animals, which were probably buried in sinkholes during Tampa time [pre-Hawthorn], bones of Pliocene animals, which may be regarded as the indigenous fauna, and Pleistocene bones, evidently younger than the true Alachua fauna.
GENERAL GEOLOGY 9
There is likewise uncertainity about the age and correlation of the clayey sands that underlie the hilly "hike country" along the axis of the peninsula. These sediments are made up of white coarse sand and kaolinite, with large quartz pebbles and much mica; they commonly have crossbedding, and characteristically weather red to orange. Cooke (1945, p. 231) correlates these clayey sands with the Citronelle formation (pl. 1); its type locality is in southern Alabama, and it is presumed to be Pliocene in age. MacNeil (1950, p. 98) feels that the Citronelle formation may be Pliocene or early Pleistocene in age. These clayey sands extend southward into Highlands County, about 70 miles south of Lake Apopka, where they have also been correlated with the Citronelle by Cooke (1945, pl. 1). However, Bishop (1956, p. 24-28) concludes that the coarse clayey sands in Highlands County are deltaic deposits of Hawthorn age that grade both downward and laterally into typical marine Hawthorn strata. Near Haines City, Polk County, about midway between Lake Apopka and Highlands County, Ketner and McGreevy (1959, p. 71) have found fossils of late n1iddle Miocene or early late Miocene age in the micaceous clayey sands that are mapped as Citronelle by Cooke (1945, pl. 1); they conclude that these clayey sands are older than the Citronelle formation in its type area.
Sands of probable Pleistocene age form a widespread mantle in northern Florida, not only in the areas shown as Pleistocene on plate 1, but also at many other places, particularly throughout the areas of clayey sand that are mapped as the Alachua or the Citronelle formation on plate 1. Slightly clayey bedded sands overlie unconformably the phosphatic sands and solution rubble of the Alachua formation in many hard-rock phosphate deposits that have surface altitudes of less than 100 feet. These bedded sands were presumably reworked from the older sands during Pleistocene marine invasions; they pass upward into loose sands, some of which appear to be windblown deposits.
STRUCTURE
The Ocala uplift, or arch, is the dominant structural feature in the exposed Cenozoic rocks of Florida. Vernon (1951, pl. 2) presents a structure contour map, based upon an horizon in the upper Eocene formations, that shows the Ocala arch and a zone of faults trending northwest along the axis of the arch. Carr and Alverson (1959, p. 59-60) describe a northwest-trending fault in northern Polk County that seems to be an extension to the southeast of the fault zone discovered by Vernon. In another map, Vernon (1951, fig. 33) shows structure contours and isopachs in Miocene strata. Another domal structure, called the Peninsular arch by Applin (1951), has been found at the unconformable contact of the Mesozoic and pre-Mesozoic rocks
10 PHOSPHATE DEPOSITS, NORTHERN PENINSULAR FLORIDA
by exploratory drill holes for oil. The crest of this buried dome does not coincide with the Ocala uplift, for it is more than 50 miles to the northeast (Vernon, 1951, fig. 11). Cooke (1945, p. 6-7) concludes that warping of the Ocala arch began before late Eocene and continued into late Miocene. Vernon (1951, p. 62) dates this structural uplift as early Miocene in age, with possible renewed activity at later times. Ketner and McGreevy (1959, p. 75) point out that nearly horizontal beds of late Miocene age lie upon the warped beds of the Ocala uplift, and therefore the uplift must have been formed before late Miocene time.
The present study did not add much new data on the structural geology of the region. Bedding in Ocala limestone and younger strata appears horizontal, except where the younger beds have obviously slumped into sinkholes in the Ocala limestone. Several fault surfaces in Ocala limestone were seen in pits in central and western Marion County. These surfaces trend between N. 65 W. and N. 85 W. (more west than those shown by Vernon), are about vertical, and have gently plunging slickensides (10° to 20° NW. or SE.) that suggest the major component of movement was horizontal
Miocene strata of about the same age occur over a wide range of altitudes; for example, beds with early Miocene fossils occur between 100 and 150 feet above sea level at localities 21 and 22 (pl. I); at about 40 feet above sea level in drill hole 36; and about 270 feet below sea level in drill hole 44. These beds of early Miocene age have a northeasterly dip of about 10 feet per mile, which could represent the initial dip of the beds or could be due to differential vertical moven1ent. However, dL"illing has shown that the Miocene strata have less clastic material and thicken northeastward in the direction of drill hole 44, which suggests that there was differential subsidence during Miocene sedimentation. The occurrence of fossiliferous Miocene beds of different ages at about the same altitudes (30 to 70 ft above sea level) in several drill holes-such as the lower Miocene beds in drill hole 36, middle Miocene beds in drill holes 40 to 45, and upper Miocene beds in drill holes 42 and 44-may also be the result of differential subsidence during Miocene sedimentation or may be partly the result of differential uplift since deposition.
GEOMORPHOLOGY
In northern peninsular Florida, a wide belt of flat land extends inland from each coast and merges with a higher central region whose surface ranges from nearly flat to rolling or hilly. Cooke (1939) gives the names "Coastal Lowlands" to the coastal belts and "Central Highlands" to the Inedial region. He states that the "Coastal Lowlands" are less than 100 feet above sea level nearly everywhere and that the
GENERAL GEOLOGY 11
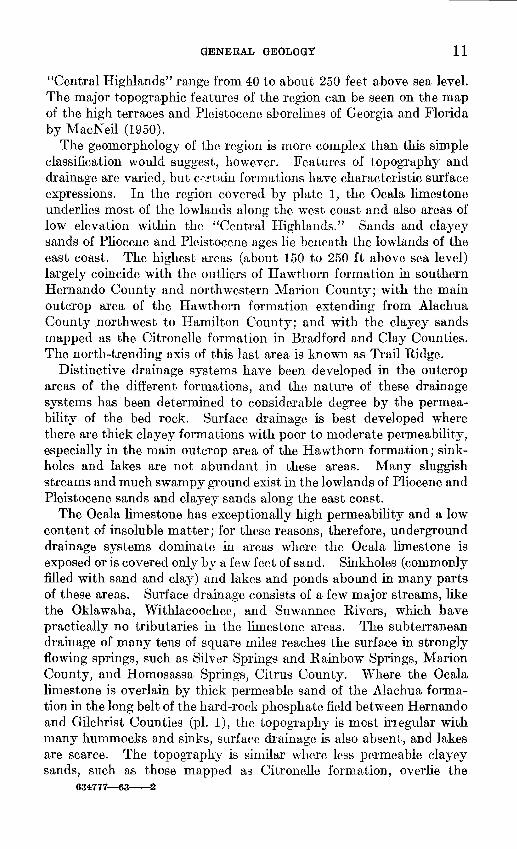
"Central Highlands" range frmn 40 to about 250 feet above sea level. The major topographic features of the region can be seen on the map of the high terraces and Pleistocene shorelines of Georgia and Florida by MacNeil (1950).
The geomorphology of the region is more complex than this simple classification would suggest, however. Features of topography and drainage are varied, but c;o;:tftin formations have characteristic surface expressions. In the region covered by plate 1, the Ocala limestone underlies most of the lowlands along the west coast and also areas of low elevation within the "Central Highlands." Sands and clayey sands of Pliocene and Pleistocene ages lie beneath the lowlands of the east coast. The highest areas (about 150 to 250 ft above sea level) largely coincide with the outliers of Hawthorn formation in southern Hernando County and northwestern Marion County; with the main outcrop area of the Hawthorn formation extending from Alachua County northwest to Hamilton County; and with the clayey sands mapped as the Citronelle formation in Bradford and Clay Counties. The north-trending axis of this last area is known as Trail Ridge.
Distinctive drainage systems have been developed in the outcrop areas of the different formations, and the nature of these drainage systems has been determined to considerable degree by the permeability of the bed rock. Surface drainage is best developed where there are thick clayey formations with poor to n1oderate permeability, especially in the main outcrop area of the Hawthorn formation; sinkholes and lakes are not abundant in these areas. Many sluggish streams and much swampy ground exist in the lowlands of Pliocene and Pleistocene sands and clayey sands along the east coast.
The Ocala li1nestone has exceptionally high permeability and a low content of insoluble matter; for these reasons, therefore, underground drainage systems dominate in areas where the Ocala limestone is exposed or is covered only by a few feet of sand. Sinkholes (commonly filled with sand and clay) and lakes and ponds abound in many parts of these areas. Surface drainage consists of a few n1ajor streams, like the Oklawaha, Withlacoochee, and Suwannee Rivers, which have practically no tributaries in the limestone areas. The subtenanean drainage of many tens of square miles reaches the surface in strongly flowing springs, such as Silver Springs and Rainbow Springs, Marion County, and Homosassa Springs, Citrus County. VVhere the Ocala lin1estone is overlain by thick permeable sand of the Alachua formation in the long belt of the hard-rock phosphate field between Hernando and Gilchrist Counties (pl. 1), the topography is most inegular with many hummocks and sinks, surface drainage is also absent, and lakes are scarce. The topography is sin1ilar where less permeable clayey sands, such as those mapped as Citronelle formation, overlie the
634777-63-2
12 PHOSPHATE DEPOSITS, NORTHERN PENINSULAR FLORIDA
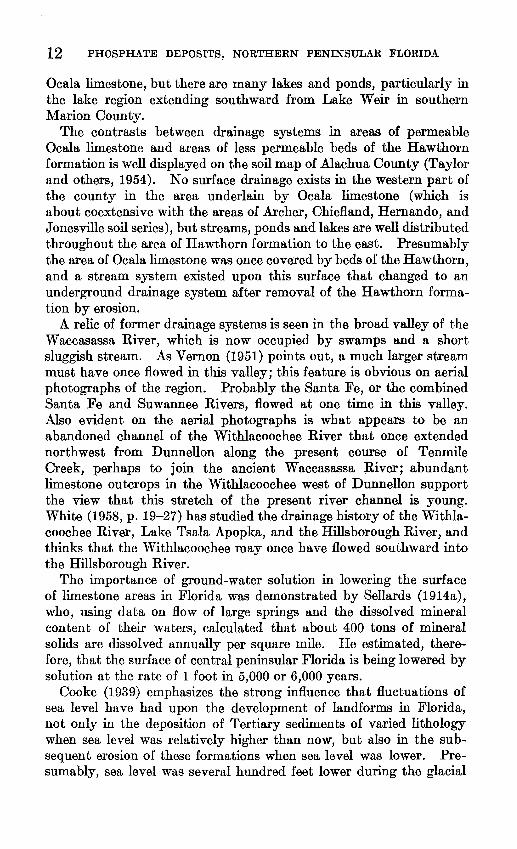
Ocala limestone, but there are many lakes and ponds, particularly in the lake region extending southward from Lake Weir in southern Marion County.
The contrasts between drainage systems in areas of permeable Ocala limestone and areas of less permeable beds of the Hawthorn formation is well displayed on the soil map of Alachua County (Taylor and others, 1954). No surface drainage exists in the western part of the county in the area underlain by Ocala limestone (which is about coextensive with the areas of Archer, Chiefland, Hernando, and Jonesville soil series), but streams, ponds and lakes are well distributed throughout the area of Hawthorn formation to the east. Presumably the area of Ocala limestone was once covered by beds of the Hawthorn, and a stream system existed upon this surface that changed to an underground drainage system after removal of the Hawthorn formation by erosion.
A relic of former drainage systems is seen in the broad valley of the Waccasassa River, which is now occupied by swamps and a short sluggish stream. As Vernon (1951) points out, a much larger stream must have once flowed in this valley; this feature is obvious on aerial photographs of the region. Probably the Santa Fe, or the combined Santa Fe and Suwannee Rivers, flowed at one time in this valley. Also evident on the aerial photographs is what appears to be an abandoned channel of the Withlacoochee River that once extended northwest from Dunnellon along the present course of Tenmile Creek, perhaps to join the ancient Waccasassa River; abundant limestone outcrops in the Withlacoochee west of Dunnellon support the view that this stretch of the present river channel is young. White (1958, p. 19-27) has studied the drainage history of the Withlacoochee River, Lake Tsala Apopka, and the Hillsborough River, and thinks that the Withlacoochee may once have flowed southward into the Hillsborough River.
The importance of ground-water solution in lowering the surface of limestone areas in Florida was demonstrated by Sellards (1914a), who, using data on flow of large springs and the dissolved mineral content of their waters, calculated that about 400 tons of mineral solids are dissolved annually per square mile. He estimated, therefore, that the surface of central peninsular Florida is being lowered by solution at the rate of 1 foot in 5,000 or 6,000 years.
Cooke (1939) emphasizes the strong influence that fluctuations of sea level have had upon the development of landforms in Florida, not only in the deposition of Tertiary sediments of varied lithology when sea level was relatively higher than now, but also in the subsequent erosion of these formations when sea level was lower. Presumably, sea level was several hundred feet lower during the glacial
GENERAL GEOLOGY 13
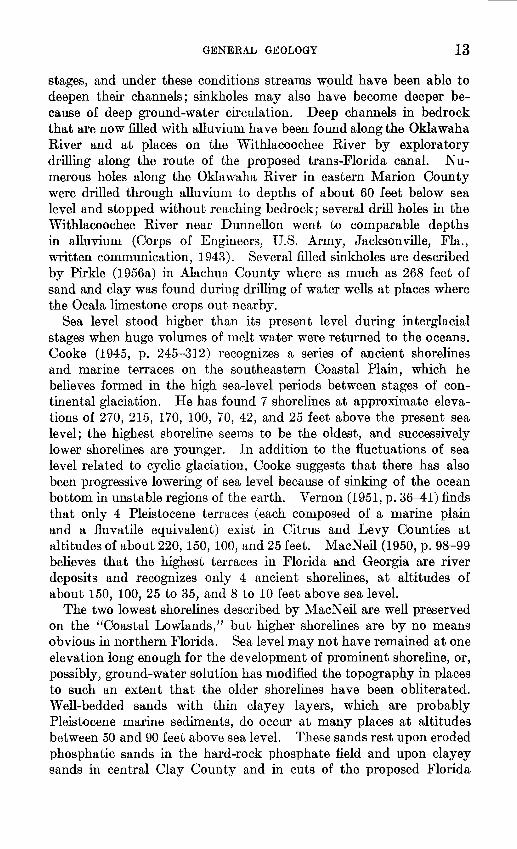
stages, and under these conditions streams would have been able to deepen their channels; sinkholes may also have become deeper because of deep ground-water circulation. Deep channels in bedrock that are now filled with alluvium have been found along the Oklawaha River and at places on the Withlacoochee River by exploratory drilling along the route of the proposed trans-Florida canal. Numerous holes along the Oklawaha River in eastern Marion County were drilled through alluviun1 to depths of about 60 feet below sea level and stopped without reaching bedrock; several drill holes in the Withlacoochee River near Dunnellon went to comparable depths in alluvium (Corps of Engineers, U.S. Army, Jacksonville, Fla., written communication, 1943). Several filled sinkholes are described by Pirkle (1956a) in Alachua County where as much as 268 feet of sand and clay was found during drilling of water wells at places where the Ocala limestone crops out nearby.
Sea level stood higher than its present level during interglacial stages when huge volumes of melt water were returned to the oceans. Cooke (1945, p. 245-312) recognizes a series of ancient shorelines and marine terraces on the southeastern Coastal Plain, which he believes formed in the high sea-level periods between stages of continental glaciation. He has found 7 shorelines at approximate elevations of 270, 215, 170, 100, 70, 42, and 25 feet above the present sea level; the highest shoreline seems to be the oldest, and successively lower shorelines are younger. In addition to the fluctuations of sea level related to cyclic glaciation, Cooke suggests that there has also been progressive lowering of sea level because of sinking of the ocean bottom in unstable regions of the earth. Vernon (1951, p. 36-41) finds that only 4 Pleistocene terraces (each composed of a marine plain and a fluvatile equivalent) exist in Citrus and Levy Counties at altitudes of about 220, 150, 100, and 25 feet. MacNeil (1950, p. 98-99 believes that the highest terraces in Florida and Georgia are river deposits and recognizes only 4 ancient shorelines, at altitudes of about 150, 100, 25 to 35, and 8 to 10 feet above sea level.
The two lowest shorelines described by MacNeil are well preserved on the "Coastal Lowlands," but higher shorelines are by no means obvious in northern Florida. Sea level may not have remained at one elevation long enough for the development of prominent shoreline, or, possibly, ground-water solution has 1nodified the topography in places to such an extent that the older shorelines have been obliterated. Well-bedded sands with thin clayey layers, which are probably Pleistocene marine sediments, do occur at many places at altitudes between 50 and 90 feet above sea level. These sands rest upon eroded phosphatic sands in the hard-rock phosphate field and upon clayey sands in central Clay County and in cuts of the proposed Florida
14 PHOSPHATE DEPOSITS, NORTHERN PENINSULAR FLORIDA
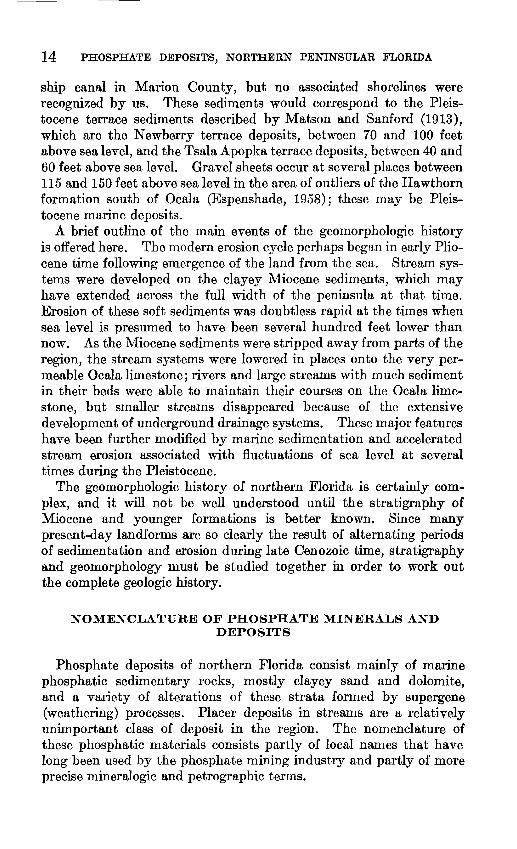
ship canal in Marion County, but no associated shorelines were recognized by us. These sediments would correspond to the Pleistocene terrace sediments described by Matson and Sanford (1913), which are the Newberry terrace deposits, between 70 and 100 feet above sea level, and the Tsala Apopka terrace deposits, between 40 and 60 feet above sea level. Gravel sheets occur at several places between 115 and 150 feet above sea level in the area of outliers of the Hawthorn formation south of Ocala (Espenshade, 1958); these may be Pleistocene marine deposits.
A. brief outline of the main events of the geomorphologic history is offered here. The modern erosion cycle perhaps began in early Pliocene time following emergence of the land from the sea. Stream systems were developed on the clayey Miocene sediments, which may have extended across the full width of the peninsula at that time. Erosion of these soft sediments was doubtless rapid at the times when sea level is presumed to have been several hundred feet lower than now. A.s the Miocene sediments were stripped away from parts of the region, the stream systems were lowered in places onto the very permeable Ocala limestone; rivers and large streams with much sediment in their beds were able to maintain their courses on the Ocala limestone, but smaller streams disappeared because of the extensive development of underground drainage systems. These major features have been further modified by marine sedimentation and accelerated stream erosion associated with fluctuations of sea level at several times during the Pleistocene.
The geomorphologic history of northern Florida is certainly complex, and it will not be well understood until the stratigraphy of Miocene and younger formations is better known. Since many present-day landforms are so clearly the result of alternating periods of sedimentation and erosion during late Cenozoic time, stratigraphy and geomorphology must be studied together in order to work out the complete geologic history.
NOMENCLATURE OF PHOSPHATE MINERALS AND DEPOSITS
Phosphate deposits of northern Florida consist mainly of marine phosphatic sedimentary rocks, mostly clayey sand and dolomite, and a variety of alterations of these strata formed by supergene (weathering) processes. Placer deposits in streams are a relatively unimportant class of deposit in the region. The nomenclature of these phosphatic materials consists partly of local nan1es that have long been used by the phosphate mining industry and partly of more precise mineralogic and petrographic terms.
NOMENCLATURE OF PHOSPHATE MINERALS AND DEPOSITS 15
SEDIMENTARY PHOSPHATIC MATERIALS
The Hawthorn formation in northern peninsular Florida contains small to abundant amounts of oviform phosphate particles composed of the mineral, carbonate-fluorapatite (Altschuler and others, 1958). These particles are typically structureless and are best described as "pellets"; the sand-size particles n1ay be termed "grains." The apatite pellets are comn1only between 1 and 10 mm in diameter, are white, tan, gray, dark brown, or black, and have a shiny luster. "Phosphate pellet" is used as a synonym for "apatite pellet." Phosphatized fossils, sharks' teeth, and casts and rnolds of small mollusks, are in places associated with the apatite pellets. In this report, a rock containing "substantial sedimentary apatite" is termed a "phosphorite," following the usage of Altschuler, Clarke, and Young (1958, p. 50).
In the Hawthorn forn1ation in northern Florida, apatite pellets are characteristically much more abundant in clayey sand (containing rnontmorillonite clay), which generally forms the upper part of the formation, than in clay and sandy argillaceous dolomite, which make up the lower part of the Hawthorn. These apatite-bearing clayey sands are here called phosphorites, and the stratigraphic unit composed of these beds is called the phosphorite unit of the Hawthorn forn1ation. Impure dolon1ite containing a few percent apatite pellets dominates the lower part of the Hawthorn; it is here called phosphatic dolomite and makes up the phosphatic dolomite unit of the Hawthorn formation. Beds of clay (rnontn1orillonite and attapulgite) are con1mon within the phosphatic dolmnite unit and are called phosphatic clay where they contain several percent of fine apatite particles; beds of phosphatic clayey sand (sirnilar to beds of the phosphorite unit) also occur in the phosphatic dolmnite unit locally; beds of phosphatic limestone a few feet thick forn1 the base of the Hawthorn at son1e places.
The phosphorite beds of the Hawthorn are very similar to the phosphorite that forms the lower unit of the Bone Valley formation in central Florida (Cathcart, 1956, p. 490). In the mining industry, the rich phosphorite beds of the Bone Valley are termed the ''landpebble phosphate deposits"; this term, or simply "pebble phosphate deposits," has also been applied to rich phosphorite beds of the Hawthorn in northern Florida. In strean1s and rivers of central and northern Florida, placer deposits of apatite pellets eroded from phosphatic sedin1entary strata are tern1ed "river-pebble deposits."
16 PHOSPHATE DEPOSITS, NORTHERN PENINSULAR FLORIDA
SUPERGENE PHOSPHATIC MATERIALS
Weathering has altered the phosphatic sedimentary rocks in various ways. In many places the more soluble minerals, apatite and carbonates, have been partly or completely dissolved by ground water, and some of the phosphate has commonly been redeposited in the form of secondary phosphate minerals. In the phosphatic beds of the Bone Valley formation, ground-water leaching characteristically is most thorough in the uppermost beds and gradually diminishes downward. Throughout much of the land-pebble district, apatite pellets have been dissolved in the top few feet of the phosphatic beds and secondary phosphate minerals have been formed-the calciun1 aluminum phosphates crandallite and millisite and the aluminun1 phosphate wavellite; these minerals and clay form the cementing matrix to quartz sand in moderately porous to very porous rock (Altschuler and others, 1956). This zone of strong leaching and abundant secondary phosphate minerals is known as the leached zone, or aluminum phosphate zone. Apatite pellets are generally weathered to soft white pellets in the rock just beneath this zone, but may still be fairly fresh a few feet below. This zone of abundant apatite is termed the "calcium phosphate zone" (Cathcart, 1956). Phosphorite beds of the Hawthorn formation are weathered in similar fashion with the formation of well-developed aluminum phosphate zones at many places in northern Florida.
Secondary phosphate minerals predominate in the hard-rock phosphate deposits near the west coast of northern peninsular Florida (fig. 1); these minerals have apparently been formed by very thorough weathering of sedimentary phosphate strata. Two forms of secondary apatite occur: "hard-rock phosphate," composed of cream to brown hard massive apatite that forms irregular botryoidal masses or may replace fossiliferous limestone, and "soft phosphate," composed of soft white apatite with claylike appearance and consistency (Sellards, 1913). Hard-rock phosphate is the material recovered by washing plants in the mining operations; soft phosphate is carried off as slimes in waste water and is deposited with clay and fine sand in tailing ponds from which it is generally recovered later as the product known as colloidal phosphate. A widespread thick cover of quartz sand overlies the hard-rock phosphate deposits; this is called phosphatic sand because it characteristically contains a fine matrix of kaolinite and the calcium aluminum phosphates crandallite and millisite. Mineralogically, the phosphatic sand of this district resembles the rock of the aluminum phosphate zone in the weathered phosphorites of the Hawthorn and Bone Valley formations.

PHOSPHATE DEPOSITS, NORTHERN PENINSULAR FLORIDA 17
HAWTHORN FORMATION AND YOUNGER BEDS
MIOCENE SERIES
HAWTHORN FORMATION
STRATIGRAPHY
The term "Hawthorne beds" was originally given to beds of phosphatic sandstones, sands, ferruginous gravels, and greenish clays exposed near Hawthorn, Alachua County, and at other places in northern peninsular Florida (Dall and Harris, 1892). Subsequent work has shown that beds of the Hawthorn fonnation are extensive in northern Florida (pl. 1). Recent discussions of the Hawthorn formation in this region are by Cooke (1945), Vernon (1951), and Pirkle (1956b). Because only part of the sequence is seen in n10st exposures, the best infor1nation on stratigraphy of the Hawthorn comes from samples frmn water wells and drill holes. The following discussion of the Hawthorn formation is based n1ainly upon the core samples of drill holes 31 to 46 (table 1), and on smne additional information from the natural exposures that were examined.
TABLE !.-Stratigraphic section generalized from logs of core-drill holes 31 to 46
Series Description Thickness (feet)
Pleistocene(?) to Recent _______ Sand to clayey sand, white to brown, generally fine-grained_ 5- 85+
Miocene(?) or Pliocene(?) _____ Clayey sand to sandy clay, tan to red (weathered), medium- o- 38 to coarse-grained; contains few quartz pebbles, kaolinite, and muscovite.
Sand to limy clayey sand, gray, fine-grained; contains many o- 35 Upper Miocene ________________ fine apatite grains, shell fragments; clay minerals mont-
morillonite and kaolinite. These beds were found only in drill holes 42 and 44.
Hawthorn formation: Phosphorite unit: Clayey sand, white to tan, fine- to
coarse-grained; contains considerable white to dark apatite pellets and grains; local thin beds of green to tan clay (montmorillonite). In samples from many
o- 40
holes, soft apatite pellets and aluminum phosphate minerals accompanied by uranium enrichment have
Lower and middle Miocene ____ resulted from weathering.
Phosphatic dolomite unit: Some light-gray, hard, and 7-278 dense; some cream to light gray green, soft, and un-consolidated; quartz sand and apatite grains common. Green clay (attapulgite and montmorillonite) and phosphatic clayey sand are interbedded with phos-phatic sandy dolomite in strata cut by some drill holes.
Ocala limestone: Unconformity
Upper Eocene _________________ Soft, white, permeable limestone. Commonly is dolo-mitized, and bas solution cavities near contact with the Hawthorn.
The Hawthorn formation in this region, as defined here, consists of a sequence of beds of distinctive lithologies-limestone, dolomite, phosphatic dolomite, clay, phosphatic clayey sand, and phosphoritethat contain fossils of early and middle Miocene age. The thickness and geographic distribution of the lithologic units are variable; but
18 PHOSPHATE DEPOSITS, NORTHERN PENINSULAR FLORIDA
in all the drill holes and in many surface exposures, beds in the lower part of the Hawthorn are dolomite, generally containing quartz sand and a small amount of apatite grains and pellets, and also interbedded clay and phosphatic clayey sand locally. These beds of sandy phosphatic dolomite and interbedded clay and phosphatic clayey sand are here grouped together as the phosphatic dolomite unit of the Hawthorn (table 1). Uppermost beds of the Hawthorn are mainly phosphorite, locally interbedded with clay, and are here called the phosphorite unit (table 1).
Dolomitic beds compose much of the Hawthorn formation, particularly where the section is thickest; in 11 of the 13 drill holes that cut the most complete sections of the Hawthorn, dolomitic beds make up 50 percent or more of the formation. Dolomite is likewise characteristic of the exposed carbonate beds of the Hawthorn formation that were examined at various places in the region, except in central Marion County where thin limestone beds occur at the base of the Hawthorn. The predominance of dolomite in the carbonate beds of the Hawthorn formation in northern Florida does not seem to have been generally recognized previously, because most writers have referred to these carbonate beds as limestone. In central peninsular Florida, carbonate beds of the Hawthorn formation are mostly dolomitic limestone, according to Carr and Alverson (1959, p. 39).
The different lithologic units of the Hawthorn formation have distinctive clay minerals. Attapulgite is the dominant mineral in the clay beds of the phosphatic dolomite unit; attapulgite and montmorillonite occur together or separately in beds of dolomite and phosphatic clayey sand in the phosphatic dolomite unit. Montmorillonite is the characteristic clay mineral in beds of the phosphorite unit. These two clay minerals are also distinctive minerals in dolomite of the Hawthorn formation and in phosphorite of the Bone Valley formation in central Florida (Petersen, 1955; Cathcart, 1956).
LITHOLOGY
DOLOMITE AND PHOSPHATIC DOLOMITE
The dolomitic beds in the lower part of the Hawthorn formation commonly contain considerable quartz sand, clay, and apatite pellets. Two varieties of phosphatic dolornite are common: soft, unconsolidated phosphatic dolomite and hard, dense phosphatic dolomite. The soft phosphatic dolomite is cream to light gray green, and largely made up of uncemented tiny dolomite rhombs. It has a claylike consistency, and may be mistaken for clay on casual examination, but the abundant little rhombic crystals are visible with the hand lens. The hard phosphatic dolomite is a cream to light gray, dense, tough rock, composed mainly of well-cemented small rhombic crystals of
HAWTHORN FORMATION AND YOUNGER BEDS 19
dolomite (generally about 0.01 to 0.04 mm in diameter, but in places as large as 0.1 mm). Dolomite pebbles and irregular tubular holes (possibly worm borings) filled with sand and pho:sphate are common. Quartz sand makes up 10 to 20 percent of the dolomite; the quartz grains generally are between 0.2 and 0.4 mm in diameter and have a n1aximum of about 1 mm. Other clastic minerals are a little feldspar, mostly microcline, and very small amounts of garnet and other heavy minerals. Apatite pellets are very con1mon, and may form up to 5 or 10 percent of the rock; pellets are most commonly from 0.1 to 0.5 mm in dian1eter and have a maximum of about 3 mm.
Both the soft and hard varieties of dolon1ite occur together where the sequence of dolomite beds is thickest (in those drill holes that cut dolomite beds ranging in thickness from 92 to 278 feet). The hard dolomite occurs, with little or no soft dolomite, where the dolomite beds are rather thin (in those drill holes where dolomite beds range from 7 to 60 ft thick).
Considerable clay may be present, either dispersed rather uniformely throughout the dolomite or in irregular pockets ]n the dolomite. In a few places, as at map locality 2 (pl. 1) on the Alapaha River, Hamilton County, and in core from drill holes 43 and 4:5, dolomite appears to form a boxwork of stringers that cut the clay. Attapulgite and montmorillonite are the characteristic clay minerals in the dolomitic beds, with attapulgite apparently being most nbundant (table 2); questionable loughlinite or sepiolite was found in a few samples.
LIMESTONE
The limestone that forms the base of the Hawthorn formation in central Marion County consists of thin beds of several varieties of white to cream dolomitic limestone: dense textured limestone with conchoidal fracture; dense limestone honeycon1bed with cavities about 1 to 2 inches wide and containing considerable quartz sand and small apatite grains; and very fossiliferous limestone, smne of which is sandy phosphatic limestone conglomerate.
CLAY
Clay beds occur in both the phosphatic dolomite unit and the overlying phosphorite unit. The clays in both units are light gray to green, and contain variable amounts of very fine quartz and phosphate grains that are generally smaller than 0.1 mn1 in diameter. Attapulgite is the dominant clay n1ineral, associated with minor a1nounts of montmorillonite, in samples from clay beds in the phosphatic dolomite unit (table 2). Montmorillonite is. the only clay mineral in nearly all samples from clay beds within the phosphorite unit. Both types of clay are locally known as fuller's earth. The two elays have somewhat
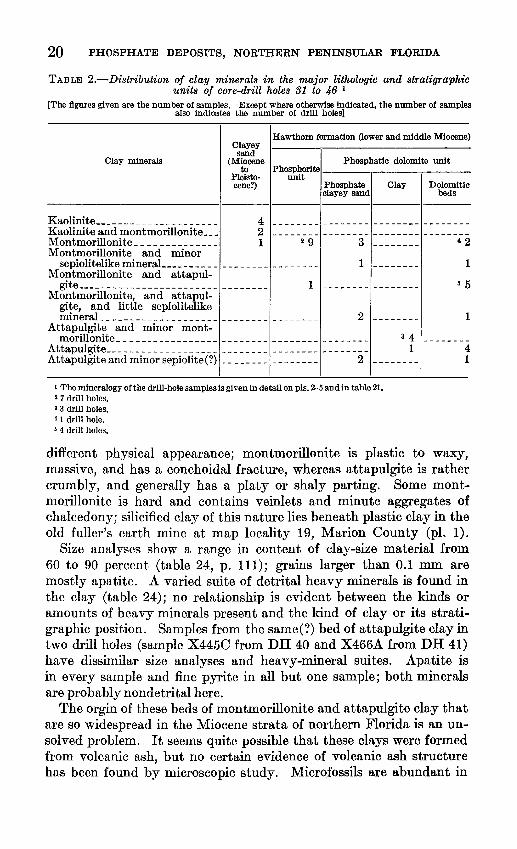
20 PHOSPHATE DEPOSITS, NORTHERN PENINSULAR FLORIDA
TABLE 2.-Distribution of clay minerals in the major lithologic and stratigraphic units of core-drill holes 31 to 46 1
[The figures given are the number of samples. Except where otherwise indicated, the number of samples also indicates the number of drill holes]
Hawthorn formation (lower and middle Miocene) Clayey sand
Clay minerals (Miocene Phosphatic dolomite unit to Phosphoritei-----.---.-----
Pleisto- unit cene?) Phosphate Clay
clayey sand Dolomitic
beds
Kaolinite ____________________ _ 4 -------- -------- -------- --------Kaolinite and montmorillonite __ _ Montmorillonite _____________ _ Montmorillonite and minor
2 1 2 9
sepiolitelike mineraL ________________________ _ Montmorillonite and attapul-
3 --------
1 --------
gite _______________________________ _ 1 -------- --------
Montmorillonite, and attapulgite, and little sepiolitelike mineral ___________ ------- _______________ ---
Attapulgite and minor mont-2 --------
1
55
1
morillonite _________________________________ -------- a 4 _______ _ Attapulgite__ _ _ _ _ _ _ _ _ _ _ _ _ _ _ _ _ _ _ _ _ _ _ _ _ _ _ _ _ _ _ _ _ _ _ _ _ _ _ _ _ _ 1 4 Attapulgiteandminorsepiolite(?) ________ ________ 2 -------- 1
t The mineralogy of the drill-hole samples is given in detail on pls. 2-5 and in table 21. 2 7 drill holes. a 3 drill holes. 4 1 drill hole. • 4 drill holes.
different physical appearance; montmorillonite is plastic to waxy, massive, and has a conchoidal fracture, whereas attapulgite is rather crumbly, and generally has a platy or shaly parting. Some montmorillonite is hard and contains veinlets and minute aggregates of chalcedony; silicified clay of this nature lies beneath plastic clay in the old fuller's earth mine at map locality 19, Marion County (pl. 1).
Size analyses show a range in content of clay-size material from 60 to 90 percent (table 24, p. 111); grains larger than 0.1 mm are mostly apatite. A. varied suite of detrital heavy minerals is found in the clay (table 24); no relationship is evident between the kinds or amounts of heavy minerals present and the kind of clay or its stratigraphic position. Samples from the same(?) bed of attapulgite clay in two drill holes (sample X445C from DH 40 and X466A. from DH 41) have dissimilar size analyses and heavy-mineral suites. Apatite is in every sarnple and fine pyrite in all but one sample; both minerals are probably nondetrital here.
The orgin of these beds of montmorillonite and attapulgite clay that are so widespread in the Miocene strata of northern Florida is an unsolved problem. It seems quite possible that these clays were formed from volcanic ash, but no certain evidence of volcanic ash structure has been found by microscopic study. Microfossils are abundant in
HAWTHORN FORMATION AND YOUNGER BEDS 21
some clay and might be mistaken for volcanic shards. Grim (1933) found curved microstructures in clay from the old fuller's earth mine at map locality 19 (pl. 1) which he regarded as of questionable volcanic nature; microfossils are very abundant in the clay at this pit, but we have found no volcanic shards.
PHOSPHORITE
Clayey sands and sandy clays containing variable amounts of apatite are most abundant above the phosphatic dolomite unit, but are also interbedded with phosphatic dolomite. They are tan to gray where fresh, and weather white to tan. Phosphate pellets, which range in diameter from about 1 to 10 mm, are hard, shiny, and dark where fresh. In weathered Inaterial, however, the pellets are soft, dull, and light in color and may be accompanied by wavellite, crandallite, and millisite; fine-grained apatite (<0.1 mm) is rather abundant in some weathered phosphorite. Montmorillonite is the dominant clay mineral in beds lying above the phosphatic dolomite unit; attapulgite was also found in a few samples from phosphatic clayey sand beds within the dolomite zone (table 2). Small amounts of questionable loughlinite and sepiolite were also found.
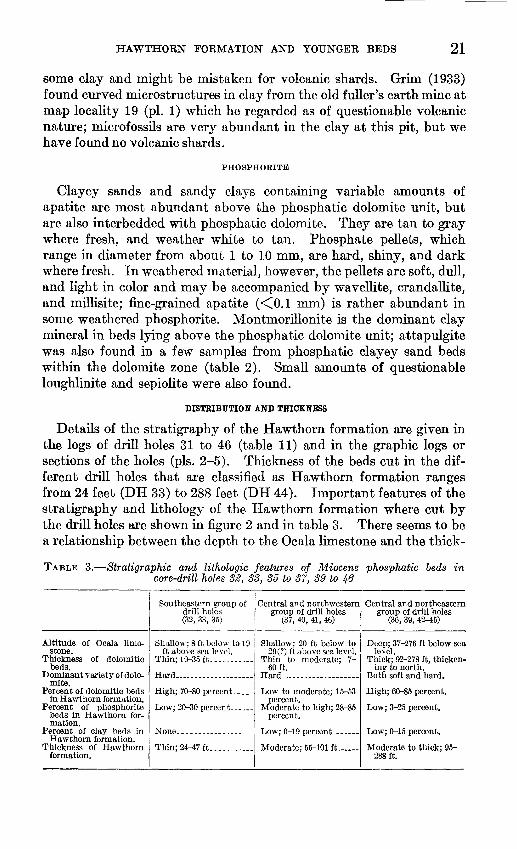
DISTRIBUTION AND TIDCKNESS
Details of the stratigraphy of the Hawthorn formation are given in the logs of drill holes 31 to 46 (table 11) and in the graphic logs or sections of the holes (pls. 2-5). Thickness of the beds cut in the different drill holes that are classified as Hawthorn formation ranges from 24 feet (DH 33) to 288 feet (DH 44). Important features of the stratigraphy and lithology of the Hawthorn formation where cut by the drill holes are shown in figure 2 and in table 3. There seems to be a relationship between the depth to the Ocala limestone and the thick-
TABLE 3.-Stratigraphic and lithologic features of Miocene phosphatic beds in core-drill holes 32, 33, 35 to 37, 39 to 46
Altitude of Ocala limestone.
Thickness of dolomitic beds.
Dominant variety of dolomite.
Percent of dolomitic beds in Hawthorn formation.
Percent of phosphorite beds in Hawthorn formation.
Percent of clay beds in Hawthorn formation.
Thickness of Hawthorn formation.
Southeastern group of drill boles (32, 33, 35)
Central and northwestern Central and northeastern group of drill boles group of drill boles
(37, 40, 41, 46) (36, 39, 42-45)
Shallow; 8ft below to 19 Shallow; 20 ft below to Deep; 37-276 ft below sea ft above sea level. ::?9(?) ft above sealevel. level.
Tbin;19-35ft ___________ Thin to moderate; 7- Thick;92-278ft,thicken-60 ft. ing to north.
Hard____________________ Hard____________________ Both soft and bard.
High; 7Q-80 percent _____ Low to moderate; 15-53 High; 6Q-85 percent. percent.
Low; 2Q-30 percent______ Moderate to high; 28-85 Low; 3-25 percent. percent.
None ___________________ Low; 0-19 percent _______ Low; Q-15 percent.
Thin; 24-47 ft_ __________ Moderate; 55-101ft__ ____ Moderate to thick; 95-288ft.
22 PHOSPHATE DEPOSITS, NORTHERN PENINSULAR FLORIDA
278
so<e>1o -276
170r 75~0
50~;-.::y -131 5o<9>- ,Riv~~. • ~., ·+297 '-----.,_ 120 Starke
-6o~15 -37
133
80~0 Gainesville•
-103
20 0 20
EXPLANATION
A, number of drill hole
8, total thickness, in feet, of dolomitic sediments
C, altitude, in feet, of top of Ocala limestone (above or below sea level)
D, percent of dolomite beds (except dolomitic clay) in phosphorite sequence
E, percent of clay beds (including dolomit1c clays) in phosphorite sequence
The percent of clayey sandy phogphorite beds is equal to 100-(D+E)
FIGURE 2.-Map showing drill holes, data on lithology of Hawthorn formation, and altitude of top of Ocala limestone.
ness and relative proportion of dolomite and phosphorite beds in the Hawthorn formation. Where the Ocala limestone is at shallow depth, the sequence of dolomite is thin and phosphorite beds make up a large proportion of the Hawthorn. Where the Ocala limestone is deeper, the dolomite sequence is thicker and makes up a large proportion of the Hawthorn formation.
The natural exposures of the Hawthorn formation in northern Florida display incomplete sections whose stratigraphy and lithology are similar to those of the beds cut by the drill holes. North of
HAWTHORN FORMATION AND YOUNGER BEDS 23
Alachua County, the best exposures of the Hawthorn are found at map localities 2, 4, and 7 (pl. 1; table 12, p. 72). Phosphorite, clay, and phosphatic sandy dolomite comprise 63 feet of strata that are exposed on the west bluff of the Alapha River at n1ap locality 2, Hamilton County. Eighteen feet of phosphatic clayey sand and sandy dolomite are exposed at map locality 4 on the west bank of the Suwannee River, Hamilton County. At Brooks Sink, Bradford County (map locality 7), 66 feet of dolomite, phosphatic dolomite, and clay, overlain by about 15 feet of surficial sand, are spectacularly displayed in the vertical walls of a sinkhole which is about 200 feet in diameter.
Much information about the Hawthorn formation in Alachua County has been gathered recently by Pirkle (1956b; 1957a, b) from studies of exposures and cuttings from numerous water wells and phosphate prospect holes. Pirkle (1956b) finds that the main part of the Hawthorn formation consists of beds of variable thickness of clay, sand, and limestone, which is dolomitic in places; above these beds, at many localities, is phosphorite, which 1nay be as n1uch as 40 feet thick. His sections (Pirkle, 1956b, figs. 10, 11) show that the phosphorite bed pinches out toward the west and northwest. The Hawthorn formation generally thickens toward the northeast, reaching a total of about 175 feet thick.
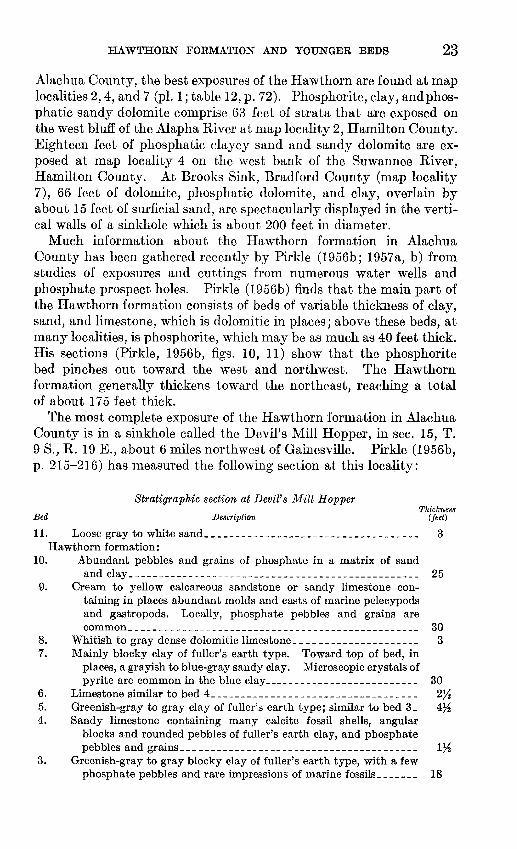
The most complete exposure of the Hawthorn formation in Alachua County is in a sinkhole called the Devil's Mill Hopper, in sec. 15, T. 9 S., R. 19 E., about 6 miles northwest of Gainesville. Pirkle (1956b, p. 215-216) has measured the following section at this locality:
Stratigraphic section at Devil' s llfill Hopper
Bed Description Thickness
(feet)
11. Loose gray to white sand____________________________________ 3 Hawthorn formation:
10. Abundant pebbles and grains of phosphate in a matrix of sand and claY------------------------------------------------- 25
9. Cream to yellow calcareous sandstone or sandy limestone con-taining in places abundant molds and casts of marine pelecypods and gastropods. Locally, phosphate pebbles and grains are common_________________________________________________ 30
8. Whitish to gray dense dolomitic limestone_____________________ 3 7. Mainly blocky clay of fuller's earth type. Toward top of bed, in
places, a grayish to blue-gray sandy clay. Microscopic crystals of pyrite are common in the blue clay__________________________ 30
6. Limestone similar to bed 4----------------------------------- 2% 5. Greenish-gray to gray clay of fuller's earth type; similar to bed 3_ 4% 4. Sandy limestone containing many calcite fossil shells, angular
blocks and rounded pebbles of fuller's earth clay, and phosphate pebbles and grains___ _ _ _ _ _ _ _ _ _ _ _ _ _ _ _ _ _ _ _ _ _ _ _ _ _ _ _ _ _ _ _ _ _ _ _ _ _ 1%
3. Greenish-gray to gray blocky clay of fuller's earth type, with a few phosphate pebbles and rare impressions of marine fossils_______ 18
24 PHOSPHATE DEPOSITS, NORTHERN PENINSULAR FLORIDA
Thickness Bed Description (feet)
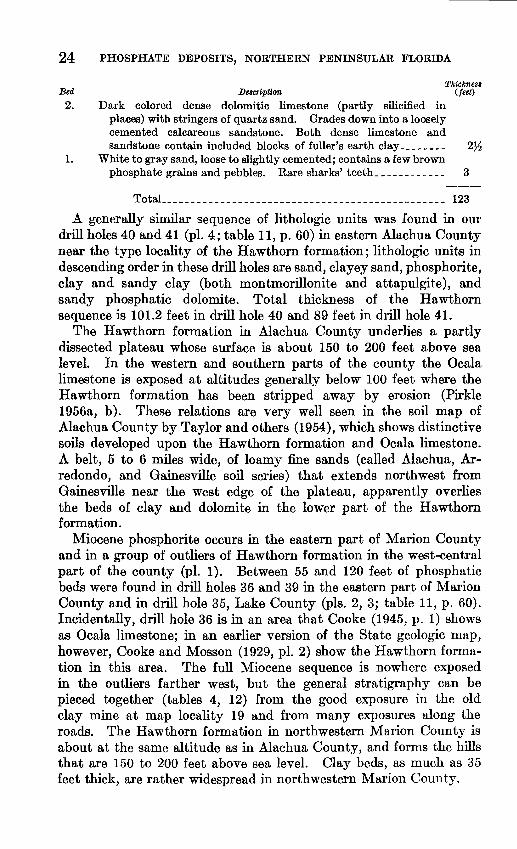
2. Dark colored dense dolomitic limestone (partly silicified in places) with stringers of quartz sand. Grades down into a loosely cemented calcareous sandstone. Both dense limestone and sandstone contain included blocks of fuller's earth clay________ 272
1. White to gray sand, loose to slightly cemented; contains a few brown phosphate grains and pebbles. Rare sharks' teeth____________ 3
Total ________________________________________________ 123
A generally similar sequence of lithologic units was found in our drill holes 40 and 41 (pl. 4; table 11, p. 60) in eastern Alachua County near the type locality of the Hawthorn formation; lithologic units in descending order in these drill holes are sand, clayey sand, phosphorite, clay and sandy clay (both montmorillonite and attapulgite), and sandy phosphatic dolomite. Total thickness of the Hawthorn sequence is 101.2 feet in drill hole 40 and 89 feet in drill hole 41.
The Hawthorn formation in Alachua County underlies a partly dissected plateau whose surface is about 150 to 200 feet above sea level. In the western and southern parts of the county the Ocala limestone is exposed at altitudes generally below 100 feet where the Hawthorn formation has been stripped away by erosion (Pirkle 1956a, b). These relations are very well seen in the soil map of Alachua County by Taylor and others (1954), which shows distinctive soils developed upon the Hawthorn formation and Ocala limestone. A belt, 5 to 6 miles wide, of loamy fine sands (called Alachua, Arredondo, and Gainesville soil series) that extends northwest from Gainesville near the west edge of the plateau, apparently overlies the beds of clay and dolomite in the lower part of the Hawthorn formation.
Miocene phosphorite occurs in the eastern part of Marion County and in a group of outliers of Hawthorn formation in the west-central part of the county (pl. 1). Between 55 and 120 feet of phosphatic beds were found in drill holes 36 and 39 in the eastern part of Marion County and in drill hole 35, Lake County (pls. 2, 3; table 11, p. 60). Incidentally, drill hole 36 is in an area that Cooke (1945, p. 1) shows as Ocala limestone; in an earlier version of the State geologic map, however, Cooke and Mosson (1929, pl. 2) show the Hawthorn formation in this area. The full Miocene sequence is nowhere exposed in the outliers farther west, but the general stratigraphy can be pieced together (tables 4, 12) from the good exposure in the old clay mine at map locality 19 and from many exposures along the roads. The Hawthorn formation in northwestern Marion County is about at the same altitude as in Alachua County, and forn1s the hills that are 150 to 200 feet above sea level. Clay beds, as much as 35 feet thick, are rather widespread in northwestern Marion County.

HAWTHORN FORMATION AND YOUNGER BEDS 25
TABLE 4.-Composite stratigraphic section of Miocene and younger beds in outliers in northwestern Marion County, Fla.
Series Description Thickness (feet)
Pleistocene(?) to Recent Loamy sand containing pebbles of phosphatic sandstone and limonite-stained sandstone.
0-4
Sandstone, tan to gray, medium-to coarse-grained; 0-10 Miocene(?) or Pliocene(?) locally with quartz pebbles as much as one-half inch in
diameter; matrix of white to light-green clay, mixed with white phosphatic mineral in places.
Hawthorn formation: Clayey sand to sandy clay, tan to light-green; locally Q-10
contains considerable apatite pellets. Clay, light-green, plastic to hard, compact; conchoidal 5(?)-35(?)
fracture; contains variable amounts of apatite pellets
Lower and middle Miocene and considerable fine quartz sand, Silicified shells of Ostrea normalis and manatee ribs are widespread.
Limestone, cream, dense; some beds of limestone con- Q-10 glomerate; slightly dolomitic; contains much quartz sand and apatite pellets; very fossiliferous. Distribu-tion is very restricted; known at map localities 14, 17 (and one-quarter mile east), 21, 22, 24, 25.
Unconformity
I Upper Eocene Ocala limestone: Limestone, white, soft.
The basal beds of the Hawthorn formation in northern Marion County are thin-bedded dense sandy phosphatic slightly dolomitic limestone that has a maximum thickness of about 10 feet, and that rests upon Ocala limestone at about half a dozen localities (table 4). This basal limestone is excellently exposed in beds 7 to 8 feet thick in the quarry of the Dixie Lime Product Co., which is about one-quarter of a mile northeast of map locality 17. The limestone at map localities 21 and 22 (early Miocene age) was called Tampa limestone by Cooke (1945, p. 129-130). In addition to these localities, Puri (1957, p. 72) states that 10 feet of hard cream limestone of Hawthorn(?) age overlie Eocene limestone in the Kendrick pit of the Cummer Lime & Manufacturing Co.
In southern Marion County, interbedded phosphorite and phosphatic clay occur in outliers of the Hawthorn formation (Espenshade, 1958); thin beds of phosphatic lin1estone are exposed at map localities 24 and 25 (pl. 1).
The broad picture of the distribution of lithologic units within the Hawthorn formation in northern peninsular Florida seems to be that dolomite is the dominant rock type on the east, clayey-sandy phosphorite is well-developed at several places in the central part of the region, and clay and clayey sands are important lithologic types farther west and south; the basin of sedimentation was probably deepest toward the northeast, where carbonate deposition prevailed.
FAUNA AND AGE
The well-preserved fossils that were found in the phosphatic strata are of early and middle Iviiocene age (table 10). Although similar
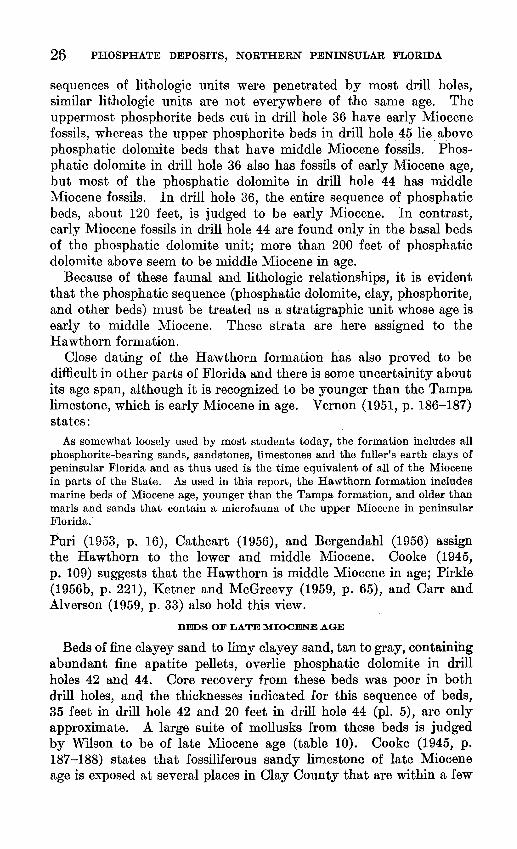
26 PHOSPHATE DEPOSITS, NORTHERN PENINSULAR FLORIDA
sequences of lithologic units were penetrated by most drill holes, similar lithologic units are not everywhere of the same age. The uppermost phosphorite beds cut in drill hole 36 have early Miocene fossils, whereas the upper phosphorite beds in drill hole 45 lie. above phosphatic dolomite beds that have middle Miocene fossils. Phosphatic dolomite in drill hole 36 also has fossils of early Miocene age, but Inost of the phosphatic dolomite in drill hole 44 has middle Miocene fossils. In drill hole 36, the entire sequence of phosphatic beds, about 120 feet, is judged to be early Miocene. In contrast, early Miocene fossils in drill hole 44 are found only in the basal beds of the phosphatic dolomite unit; more than 200 feet of phosphatic dolomite above seem to be middle Miocene in age.
Because of these faunal and lithologic relationships, it is evident that the phosphatic sequence (phosphatic dolomite, clay, phosphorite, and other beds) must be treated as a stratigraphic unit whose age is early to middle Miocene. These strata are here assigned to the Hawthorn formation.
Close dating of the Hawthorn formation has also proved to be difficult in other parts of Florida and there is some uncertainity about its age span, although it is recognized to be younger than the Tampa limestone, which is early Miocene in age. Vernon (1951, p. 186-187) states:
As somewhat loosely used by most students today, the formation includes all phosphorite-bearing sands, sandstones, limestones and the fuller's earth clays of peninsular Florida and as thus used is the time equivalent of all of the Miocene in parts of the State. As used in this report, the Hawthorn formation includes marine beds of Miocene age, younger than the Tampa formation, and older than marls and sands that contain a microfauna of the upper Miocene in peninsular Florida.
Puri (1953, p. 16), Cathcart (1956), and Bergendahl (1956) assign the Hawthorn to the lower and middle Miocene. Cooke (1945, p. 109) suggests that the Hawthorn is middle Miocene in age; Pirkle (1956b, p. 221), Ketner and McGreevy (1959, p. 65), and Carr and Alverson (1959, p. 33) also hold this view.
BEDS OF LATE MIOCENE AGE
Beds of fine clayey sand to limy clayey sand, tan to gray, containing abundant fine apatite pellets, overlie phosphatic dolomite in drill holes 42 and 44. Core recovery from these beds was poor in both drill holes, and the thicknesses indicated for this sequence of beds, 35 feet in drill hole 42 and 20 feet in drill hole 44 (pl. 5), are only approximate. A large suite of mollusks from these beds is judged by Wilson to be of late Miocene age (table 10). Cooke (1945, p. 187-188) states that fossiliferous sandy limestone of late Miocene age is exposed at several places in Clay County that are within a few

HAWTHORN FORMATION AND YOUNGER BEDS 27
miles of drill hole 44; he correlates these beds with the Duplin n1arl. At Brooks Sink, Bradford County (table 12, loc. 7), about 26 feet
of sandy dolomitic coquina with scarce phosphate pellets are exposed above typical phosphatic dolon1ite of the Hawthorn formation. Mollusks from these beds are middle or late Miocene in age according to Wilson (table 10). Ostracodes from the uppermost shell beds here are called lower Choctawhatchee in age by Puri (Pirkle, 1956b, p. 207-210).
MIOCENE(?) OR PLIOCENE(?) SERIES
CL.A YEY S.AND
The phosphatic beds are overlain in most drill holes and natural exposures by clayey sands that are composed of fine to coarse quartz grains and considerable clay. Both kaolinite and n1ontn10rillonite are present; kaolinite is more common in the uppermost beds and montmorillonite in the lower beds. Quartz pebbles and muscovite flakes occur in the clayey sand at 1nany places. The fresh clayey sand is light to dark gray, and the weathered material is commonly mottled orange to brown. Thickness of the clayey sand where cut by the drill holes ranges fron1 about 2 feet (DH 31) to 47.5 feet (DH 37).
Clayey sand of this character is very widespread in the region. Its age is problematical, and is called Miocene(?) or Pliocene(?) in this report; there may be clayey sand of n1ore than one age. The clayey sand that underlies much of eastern Alachua County is thought by Pirkle (1956b) to be of Pleistocene age or, less probably, Pliocene. Cooke (1945, pl. 1) correlates the clayey sands that occur throughout much of the middle of the peninsula with the Citronelle formation of Pliocene age. However, in Polk County (south of the area shown on pl. 1) fossils of late middle Miocene or early late Miocene age were found in sin1ilar clayey sand by I{etner and McGreevy (1959, p. 71); clayey sand in Highlands County is also called Miocene by Bishop (1956).
PLIOCENE(?) TO RECENT
S.AND
Loose to loamy tan to brown sand lies upon clayey sand in many places; in general, it seems to have about the same grain size as the clayey sand, and contains quartz pebbles also where the underlying clayey sand contains quartz pebbles. Charcoal fragments are conlmon in the loose sand. In natural exposures these sands range in thiclmess from a few feet to about 15 feet, but n10re than 30 feet of sand was penetrated in several drill holes; drill hole 38 went to a depth of 61 feet, entirely in sand. In some exposures in central Clay County and southeastern ~Iarion County, the sands are beddedalternating layers (1 to 3 in. thick) of clayey sand and loose sand-for
634777-63-3
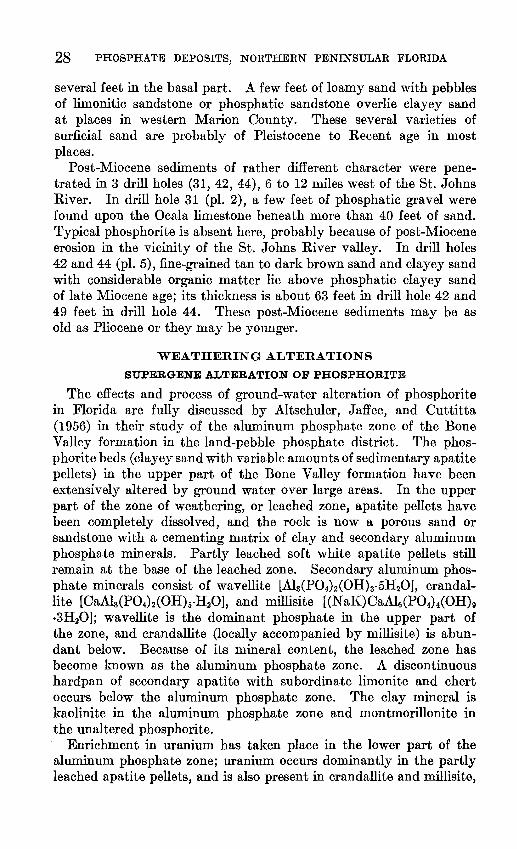
28 PHOSPHATE DEPOSITS, NORTHERN PENINSULAR FLORIDA
several feet in the basal part. A few feet of loamy sand with pebbles of limonitic sandstone or phosphatic sandstone overlie clayey sand at places in western Marion County. These several varieties of surficial sand are probably of Pleistocene to Recent age in most places.
Post-Miocene sediments of rather different character were penetrated in 3 drill holes (31, 42, 44), 6 to 12 miles west of the St. Johns River. In drill hole 31 (pl. 2), a few feet of phosphatic gravel were found upon the Ocala limestone beneath more than 40 feet of sand. Typical phosphorite is absent here, probably because of post-Miocene erosion in the vicinity of the St. Johns River valley. In drill holes 42 and 44 (pl. 5), fine-grained tan to dark brown sand and clayey sand with considerable organic matter lie above phosphatic clayey sand of late Miocene age; its thickness is about 63 feet in drill hole 42 and 49 feet in drill hole 44. These post-Miocene sediments may be as old as Pliocene or they may be younger.
WEATHERING ALTERATIONS
SUPERGENE ALTERATION OF PHOSPHORITE
The effects and process of ground-water alteration of phosphorite in Florida are fully discussed by Altschuler, Jaffee, and Cuttitta (1956) in their study of the aluminum phosphate zone of the Bone Valley formation in the land-pebble phosphate district. The phosphorite beds (clayey sand with variable amounts of sedimentary apatite pellets) in the upper part of the Bone Valley formation have been extensively altered by ground water over large areas. In the upper part of the zone of weathering, or leached zone, apatite pellets have been completely dissolved, and the rock is now a porous sand or sandstone with a cementing matrix of clay and secondary aluminum phosphate minerals. Partly leached soft white apatite pellets still remain at the base of the leached zone. Secondary aluminum phosphate minerals consist of wavellite [Ala(P04)2(0H)3·5H20], crandallite [CaAla(P04)2(0H)s·H20], and millisite [(NaK:)CaAl6(P04)4(0H)9
·3H20]; wavellite is the dominant phosphate in the upper part of the zone, and crandallite (locally accompanied by millisite) is abundant below. Because of its mineral content, the leached zone has become known as the aluminum phosphate zone. A discontinuous hardpan of secondary apatite with subordinate limonite and chert occurs below the aluminum phosphate zone. The clay mineral is kaolinite in the aluminum phosphate zone and montmorillonite in the unaltered phosphorite.
Enrichment in uranium has taken place in the lower part of the aluminum phosphate zone; uranium occurs dominantly in the partly leached apatite pellets, and is also present in crandallite and millisite,
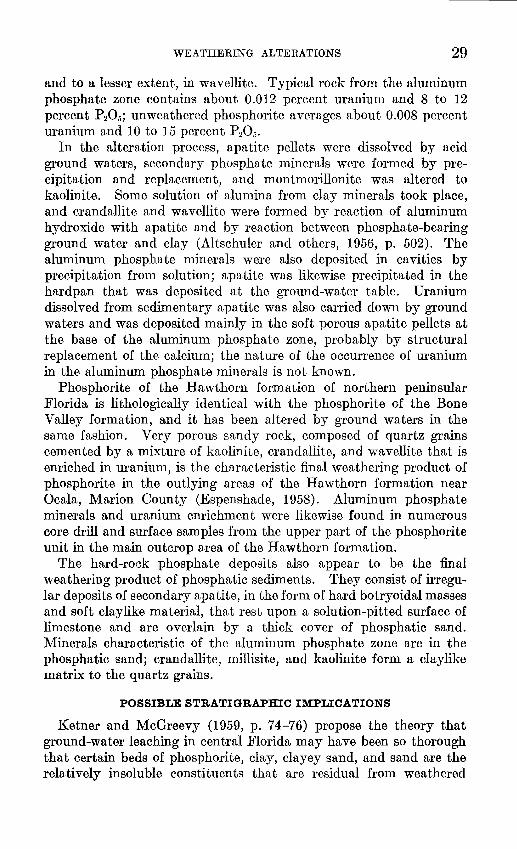
WEATHERING ALTERATIONS 29
and to a lesser extent, in wavellite. Typical rock fron1 the aluminum phosphate zone contains about 0.012 percent uranium and 8 to 12 percent P20 5; unweathered phosphorite averages about 0.008 percent uranium and 10 to 15 percent P 20 5•
In the alteration process, apatite pellets were dissolved by acid ground waters, secondary phosphate minerals were formed by precipitation and replacen1ent, and montmorillonite was altered to kaolinite. Some solution of alumina from clay minerals took place, and crandallite and wavellite were formed by reaction of aluminum hydroxide with apatite and by reaction between phosphate-bearing ground water and clay (Altschuler and others, 1956, p. 502). The aluminum phosphate minerals were also deposited in cavities by precipitation from solution; apatite was likewise precipitated in the hardpan that was deposited at the ground-water table. Uranium dissolved from sedimentary apatite was also carried down by ground waters and was deposited mainly in the soft porous apatite pellets at the base of the aluminum phosphate zone, probably by structural replacement of the calcium; the nature of the occurrence of uranium in the aluminum phosphate rninerals is not known.
Phosphorite of the Hawthorn formation of northern peninsular Florida is lithologically identical with the phosphorite of the Bone Valley formation, and it has been altered by ground waters in the same fashion. Very porous sandy rock, composed of quartz grains cemented by a mixture of kaolinite, crandallite, and wavellite that is enriched in uranium, is the characteristic final weathering product of phosphorite in the outlying areas of the Hawthorn formation near Ocala, Marion County (Espenshade, 1958). Aluminum phosphate minerals and uranium enrichment were likewise found in numerous core drill and surface samples from the upper part of the phosphorite unit in the main outcrop area of the Hawthorn forn1ation.
The hard-rock phosphate deposits also appear to be the final weathering product of phosphatic sediments. They consist of irregular deposits of secondary apatite, in the form of hard botryoidal masses and soft claylike material, that rest upon a solution-pitted surface of limestone and are overlain by a thick cover of phosphatic sand. Minerals characteristic of the aluminum phosphate zone are in the phosphatic sand; crandallite, millisite, and kaolinite form a claylike matrix to the quartz grains.
POSSIBLE STRATIGRAPHIC IMPLICATIONS
Ketner and McGreevy (1959, p. 74-76) propose the theory that ground-water leaching in central Florida may have been so thorough that certain beds of phosphorite, clay, clayey sand, and sand are the relatively insoluble constituents that are residual from weathered
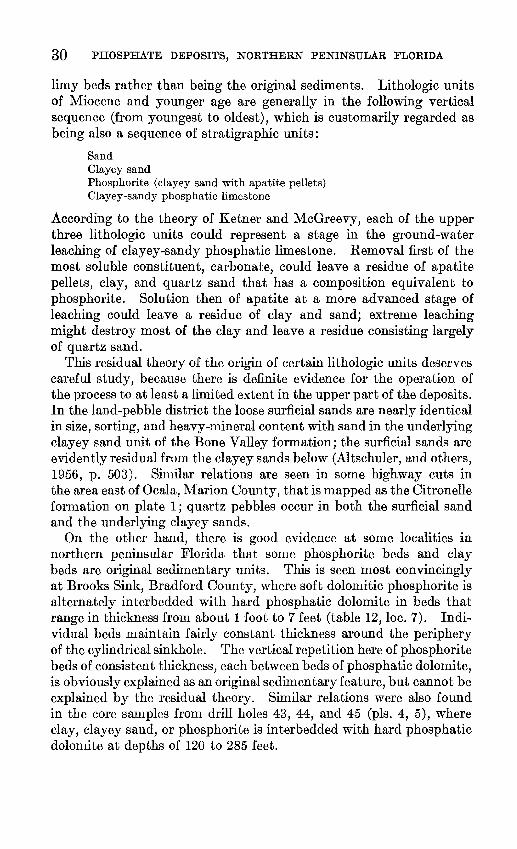
30 PHOSPHATE DEPOSITS, NORTHERN PENINSULAR FLORIDA
limy beds rather than being the original sediments. Lithologic units of Miocene and younger age are generally in the following vertical sequence (from youngest to oldest), which is customarily regarded as being also a sequence of stratigraphic units:
Sand Clayey sand Phosphorite (clayey sand with apatite pellets) Clayey-sandy phosphatic limestone
According to the theory of Ketner and McGreevy, each of the upper three lithologic units could represent a stage in the ground-water leaching of clayey-sandy phosphatic limestone. Removal first of the most soluble constituent, carbonate, could leave a residue of apatite pellets, clay, and quartz sand that has a composition equivalent to phosphorite. Solution then of apatite at a more advanced stage of leaching could leave a residue of clay and sand; extreme leaching might destroy most of the clay and leave a residue consisting largely of quartz sand.
This residual theory of the origin of certain lithologic units deserves careful study, because there is definite evidence for the operation of the process to at least a limited extent in the upper part of the deposits. In the land-pebble district the loose surficial sands are nearly identical in size, sorting, and heavy-mineral content with sand in the underlying clayey sand unit of the Bone Valley formation; the surficial sands arc evidently residual from the clayey sands below (Altschuler, and others, 1956, p. 503). Sin1ilar relations are seen in some highway cuts in the area east of Ocala, Marion County, that is mapped as the Citronelle formation on plate 1; quartz pebbles occur in both the surficial sand and the underlying clayey sands.
On the other hand, there is good evidence at some localities in northern peninsular Florida that son1e phosphorite beds and clay beds are original sedimentary units. This is seen most convincingly at Brooks Sink, Bradford County, where soft dolomitic phosphorite is alternately interbedded with hard phosphatic dolomite in beds that range in thickness from about 1 foot to 7 feet (table 12, loc. 7). Individual beds maintain fairly constant thickness around the periphery of the cylindrical sinkhole. The vertical repetition here of phosphorite beds of consistent thickness, each between beds of phosphatic dolomite, is obviously explained as an original sedimentary feature, but cannot be explained by the residual theory. Similar relations were also found in the core samples fron1 drill holes 43, 44, and 45 (pis. 4, 5), where clay, clayey sand, or phosphorite is interbedded with hard phosphatic dolon1ite at depths of 120 to 285 feet.
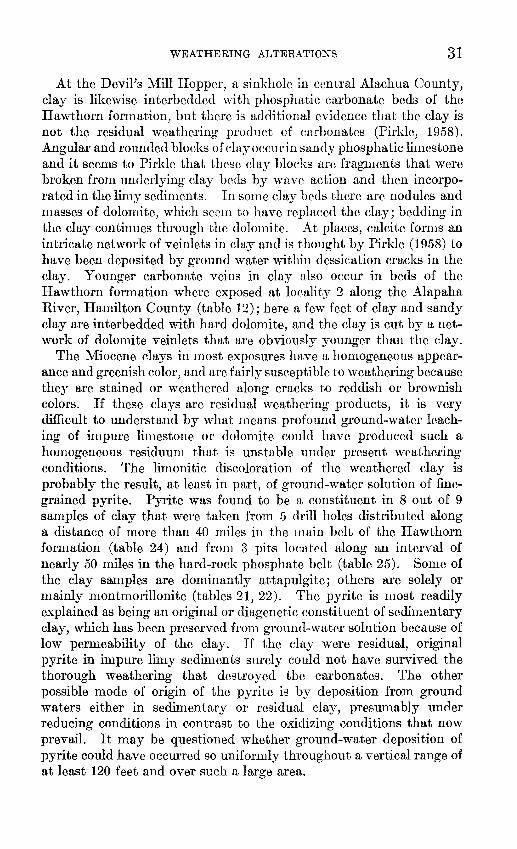
WEATHERING ALTERATIONS 31
At the Devil's Mill Hopper, a sinkhole in central Alachua County, clay is likewise interbedded with phosphatic carbonate beds of the Hawthorn fonnation, but there is additional evidence that the clay is not the residual weathering product of carbonates (Pirkle, 1958). Angular and rounded blocks of clay occur in sandy phosphatic linwstone and it seen1s to Pirkle that these clay blocks are fragrnents that were broken fron1 underlying clay beds by wave action and then incorporated in the lin1y sedin1ents. In son1e clay beds there are nodules and rnasses of dolon1ite, which seem to have replaced the clay; bedding in the clay continues through the dolomite. At places, calcite fonns an intricate network of veinlets in clay and is thought by Pirkle (1958) to have been deposited by ground water within dessication cracks in the clay. Younger carbonate veins in clay also occur in beds of the Hawthorn formation where exposed at locality 2 along the Alapaha River, Harnilton County (table 12); here a few feet of clay and sandy clay are interbedded with hard dolomite, and the clay is cut by a network of dolon1ite veinlets that are obviously younger than the clay.
The Miocene clays in rnost exposures have a hon1ogeneous appearance and greenish color, and are fairly susceptible to weathering because they are stained or weathered along cracks to reddish or brownish colors. If these clays are residual weathering products, it is very difficult to understand by what n1eans profound ground-water leaching of impure lirnestone or dolon1ite could have produced such a hornogeneous residuun1 that is unstable under present weathering conditions. The lirnonitic discoloration of the weathered clay is probably the result, at least in part, of ground-water solution of finegrained pyrite. Pyrite was found to be a constituent in 8 out of 9 samples of clay that were taken fr01n 5 drill holes distributed along a distance of more than 40 miles in the 1nain belt of the Hawthorn forrnation (table 24) and fr01n 3 pits located along an interval of nearly 50 miles in the hard-rock phosphate belt (table 25). Some of the clay samples are don1inantly attapulgite; others are solely or mainly montmorillonite (tables 21, 22). The pyrite is rnost readily explained as being an original or diagenetic constituent of sedirnentary clay, which has been preserved fron1 ground-water solution because of low penneability of the clay. If the clay were residual, original pyrite in impure lin1y sediments surely could not have survived the thorough weathering that destroyed the carbonates. The other possible n1ode of origin of the pyrite is by deposition frorn ground waters either in sedirnentary or residual clay, presrunably under reducing conditions in contrast to the oxidizing conditions that now prevail. It may be questioned whether ground-water deposition of pyrite could have occurred so uniforn1ly throughout a vertical range of a.t least 120 feet and over such a large area.
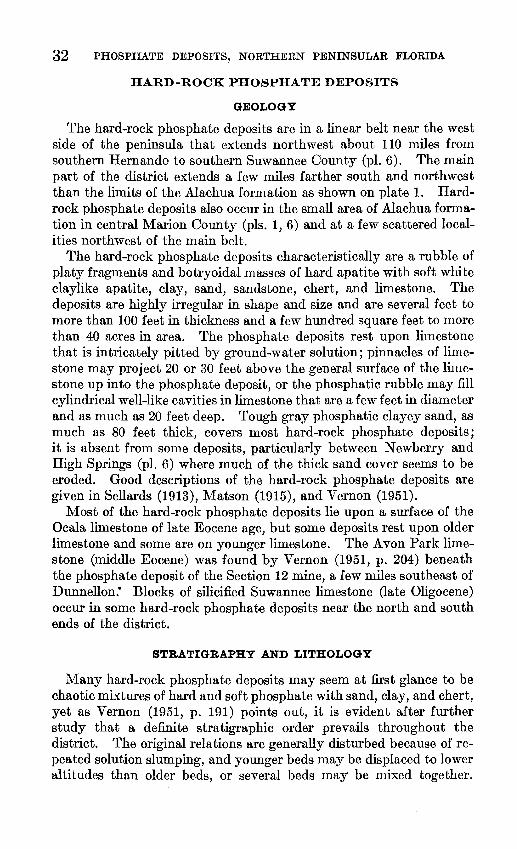
32 PHOSPHATE DEPOSITS, NORTHERN PENINSULAR FLORIDA
HARD-ROCK PHOSPHATE DEPOSITS
GEOLOGY
The hard-rock phosphate deposits are in a linear belt near the west side of the peninsula that extends northwest about 110 miles from southern Hernando to southern Suwannee County (pl. 6). The main part of the district extends a few miles farther south and northwest than the limits of the Alachua formation as shown on plate 1. Hardrock phosphate deposits also occur in the small area of Alachua formation in central Marion County (pls. 1, 6) and at a few scattered localities northwest of the main belt.
The hard-rock phosphate deposits characteristically are a rubble of platy fragments and botryoidal masses of hard apatite with soft white claylike apatite, clay, sand, sandstone, chert, and limestone. The deposits are highly irregular in shape and size and are several feet to more than 100 feet in thickness and a few hundred square feet to more than 40 acres in area. The phosphate deposits rest upon limestone that is intricately pitted by ground-water solution; pinnacles of limestone may project 20 or 30 feet above the general surface of the limestone up into the phosphate deposit, or the phosphatic rubble may fill cylindrical well-like cavities in limestone that are a few feet in diameter and as much as 20 feet deep. Tough gray phosphatic clayey sand, as much as 80 feet thick, covers most hard-rock phosphate deposits; it is absent from some deposits, particularly between Newberry and High Springs (pl. 6) where much of the thick sand cover seems to be eroded. Good descriptions of the hard-rock phosphate deposits are given in Sellards (1913), Matson (1915), and Vernon (1951).
Most of the hard-rock phosphate deposits lie upon a surface of the Ocala limestone of late Eocene age, but some deposits rest upon older limestone and some are on younger limestone. The A von Park limestone (middle Eocene) was found by Vernon (1951, p. 204) beneath the phosphate deposit of the Section 12 mine, a few miles southeast of Dunnellon." Blocks of silicified Suwannee limestone Oate Oligocene) occur in some hard-rock phosphate deposits near the north and south ends of the district.
STRATIGRAPHY AND LITHOLOGY
Many hard-rock phosphate deposits may seem at first glance to be chaotic mixtures of hard and soft phosphate with sand, clay, and chert, yet as Vernon (1951, p. 191) points out, it is evident after further study that a definite stratigraphic order prevails throughout the district. The original relations are generally disturbed because of repeated solution slumping, and younger beds may be displaced to lower altitudes than older beds, or several beds may be n1ixed together.
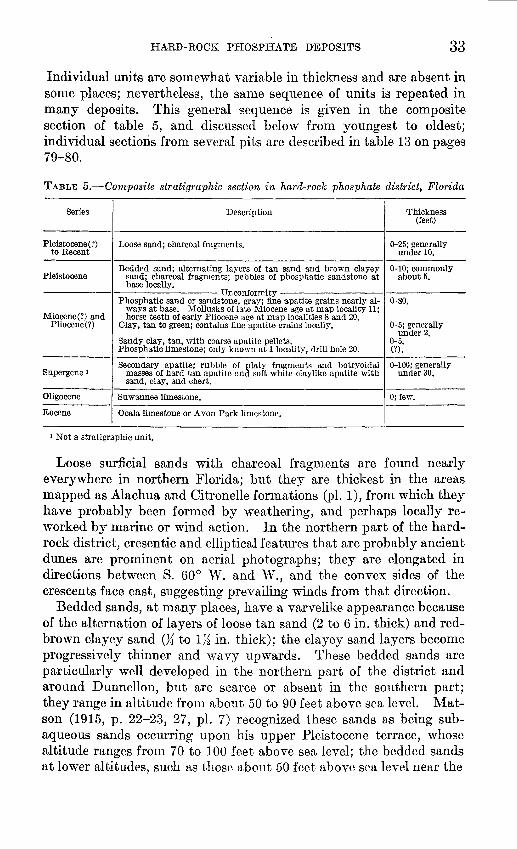
HARD-ROCK PHOSPHATE DE1POSITS 33
Individual units are somewhat variable in thickness and are absent in some places; nevertheless, the same sequence of units is repeated in many deposits. This general sequence is given in the c01nposite section of table 5, and discussed below from youngest to oldest; individual sections from several pits are described in table 13 on pages 79-80.
TABLE 5.-Cornposite stratigraphic section in hard-rock phosphate district, Florida
Series Description Thickness (feet)
Pleistocene(?) Loose sand; charcoal fragments. 0-25; generally to Recent under 10.
Pleistocene Bedded sand; alternating layers of tan sand and brown clayey 0-10; commonly
sand; charcoal fragments; pebbles of phosphatic sandstone at about 5, base locally.
Unconformity Phosphatic sand or sandstone, gray; fine apatite grains nearly al- 0-80.
Miocene(?) and ways at base. Mollusks of late Miocene age at map locality 11; horse teeth of early Pliocene age at map localities 8 and 20.
Pliocene(?) Clay, tan to green; contains fine apatite grains locally, 0-5; generally under 2,
Sandy clay, tan, with coarse apatite pellets. 0-5. Phosphatic limestone; only known at !locality, drill hole 20. (?).
Supergene 1 Secondary apatite; rubble of platy fragments and botryoidal 0-100; generally
masses of hard tan apatite and soft white claylike apatite with under30. sand, clay, and chert.
Oligocene Suwannee limestone. 0; few. -
Eocene Ocala limestone or A von Park limestone.
1 Not a stratigraphic unit.
Loose surficial sands with charcoal fragn1ents are found nearly everywhere in northern Florida; but they are thickest in the areas mapped as Alachua and Citronelle formations (pl. 1), from which they have probably been formed by weathering, and perhaps locally reworked by marine or wind action. In the northern part of the hardrock district, cresentic and elliptical features that are probably ancient dunes are prominent on aerial photographs; they are elongated in directions between S. 60° W. and W., and the convex sides of the crescents face east, suggesting prevailing winds from that direction.
Bedded sands, at many places, have a varvelike appearance because of the alternation of layers of loose tan sand (2 to 6 in. thick) and redbrown clayey sand 0~ to I;~ in. thick); the clayey sand layers become progressively thinner and wavy upwards. These bedded sands are particularly well developed in the northern part of the district and around Dunnellon, but are scarce or absent in the southern part; they range in altitude frorn about 50 to 90 feet above sea level. Matson (1915, p. 22-23, 27, pl. 7) recognized these sands as being subaqueous sands occurring upon his upper Pleistocene terrace, whose altitude ranges fron1 70 to 100 feet above sea level; the bedded sands at lower altitudes, such as those about 50 feet above sea level near the
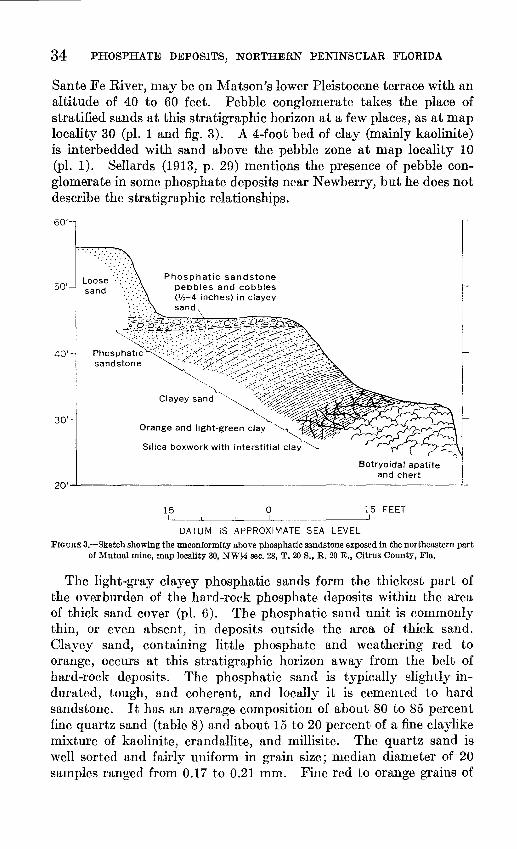
34 PHOSPHATE DEPOSITS, NORTHERN PENINSULAR FLORIDA
Sante Fe River, may be on Matson's lower Pleistocene terrace with an altitude of 40 to 60 feet. Pebble conglomerate takes the place of stratified sands at this stratigraphic horizon at a few places, as at map locality 30 (pl. 1 and fig. 3). A 4-foot bed of clay (mainly kaolinite) is interbedded with sand above the pebble zone at map locality 10 (pl. 1). Sellards (1913, p. 29) mentions the presence of pebble conglomerate in some phosphate deposits near Newberry, but he does not describe the stratigraphic relationships.
60'
50'
40'
30'
Phosphatic sandstone pebbles and cobbles <V2-4 in-ches) in clayey sand
Botryoidal apatite and chert
20'~-------------------------------------------------------L-
15 0 15 FEET
DATUM IS APPROXIMATE SEA LEVEL
FIGURE 3.-Sketch showing the unconformity above phosphatic sandstone exposed in the northeastern part of Mutual mine, map locality 30, NW% sec. 28, T. 20 S., R. 20 E., Citrus County, Fla.
The light-gray clayey phosphatic sands form the thickest part of the overburden of the hard-rock phosphate deposits within the area of thick sand cover (pl. 6). The phosphatic sand unit is commonly thin, or even absent, in deposits outside the area of thick sand. Clayey sand, containing little phosphate and weathering red to orange, occurs at this stratigraphic horizon away from the belt of hard-rock deposits. The phosphatic sand is typically slightly indurated, tough, and coherent, and locally it is cemented to hard sandstone. It has an average composition of about 80 to 85 percent fine quartz sand (table 8) and about 15 to 20 percent of a fine claylike mixture of kaolinite, crandallite, and millisite. The quartz sand is well sorted and fairly uniform in grain size; median diameter of 20 samples ranged from 0.17 to 0.21 mm. Fine red to orange grains of
HARD-ROCK PHOSPHATE DEPOSI'.DS 35
apatite, about the sa1ne size as the quartz grains, occur nearly everywhere near the base of the phosphatic sand; fine apatite grains are locally common in smne hard phosphatic sandstone.
Tan to green plastie clay, in thin beds a foot or two thick, commonly lies beneath the phosphatic sand (table 5). Fine apatite grains may be present in the clay. Sarnples of clay from 3 deposits were found by X-ray determination to be principally montmorillonite (table 22, p. 110), resen1bling the clay that is characteristic of the upper part of the Hawthorn formation; the heavy-1nineral content of these clays (table 25, p. 112) is also sin1ilar to that of the clay samples from beds of the Hawthorn. In son1e deposits, as at locality 27 (table 13, p. 79), sandy elay containing large apatite pellets (as much as 1 em in diameter) occurs below the elay bed. Limestone containing fine apatite grains is known to oeeur beneath phosphatic sandy clay at only one locality, drill hole 20 (pl. 12).
The secondary apatite zone is not an ordinary stratigraphic unit, of course, because this 1nixture of hard and soft secondary apatite with sand and clay slumped fron1 above, and chert and limestone fragments relict from dissolved limestone beds has apparently been formed by ground-water activity at the contact between the phosphatic beds and the underlying li1nestone. In an individual deposit, the thickness of this zone n1ay be highly variable and the upper and lower contacts very irregular. Some deposits obviously occur in solution depressions in lin1estone.
Secondary apatite has a wide variety of fonns. Typical "hardrock phosphate" consists of fragments or rounded n1asses of hard light-tan to brown dense apatite. Botryoidal structure with finely banded curved layers of apatite and irregular, diseontinuous cavities is characteristic (Matson, 1915, pls. 4, 5); some botryoidal masses are 5 to 10 feet in diameter. "Plate rock" is a variety of secondary phosphate that is composed of thin platy or irregular layers (a few millimeters thick) of apatite, with wavy interstitial cavities; the layers may be broken into fragn1ents that are cemented by dense apatite (Matson, 1915, pls. 6, 14A). This variety of phosphate was abundant in the mines near Anthony, which were ealled "plate rock" mines. Some secondary phosphate, having marked breccia structure, contains sharply angular frag1nents of apatite in a matrix of hard, sandy apatite. Several generations of apatite with different colors or structure are very widespread and have charaeteristic features, showing that phosphate deposition was discontinuous. Breccia structure is evidently formed by collapse and breakage of a n1ass of secondary phosphate into a solution cavity, followed by cen1entation of the fragments by a younger generation of apatite. Delicate incrustations of tiny wavellite needles 1nay line cavities in the apatite.
36 PHOSPHATE DEPOSITS, NORTHERN PENINSULAR FLORIDA
Phosphatized casts of fossils from the Eocene limestones are not uncmnmon (Matson, 1915, pl. 14B). Druid vVilson identified the following genera of mollusks in samples from the stockpile of the Kibler-Camp phosphate mine (sec. 17, T. 17 S., R. 19 E.):
Pelecypoda: Barbatia sp. Glycymeris sp. "Venericardia" n. sp. Fimbria sp. (genus confined to Eocene in North America)
Gastropoda: Xenophora sp.
Porous silicified limestone is comn1only partly replaced by finely banded apatite, but we have not seen replacements of this nature in pure limestone. For this reason, it n1ay be that phosphatized fossil casts represent replacement of silicified fossiliferous limestone rather than direct replacement of the pure limestone. Phosphatized manatee ribs and shark, mastodon, and horse teeth are also found in the deposits (Sellards, 1913, pls. 4-7).
Soft white claylike phosphate mixed with sand and clay forn1s the matrix of the hard-rock phosphate. This material is washed away from the hard-rock phosphate in the n1illing process and deposited in waste ponds. These slimes are composed largely of apatite, crandallite, quartz, and possibly kaolin and montmorillonite minerals according to X-ray determinations 1 of five samples of slimes.
Many characteristics of the hard-rock phosphate deposits are displayed in the small deposit on the Ross property, Marion County (pl. 7). Stratigraphic relations are not disturbed much by solution slumping here; phosphatic sand lies nearly horizontally upon a few feet of sand and sandy clay containing large phosphate pellets, which in turn, lies above typical secondary phosphate rubble (map loc. 18, pl. 1 and table 13). This deposit is several miles east of the area of thick sand cover and is evidently a small outlier of the phosphatic beds that is preserved in a shallow sink in Ocala limestone in an area where most of the phosphatic strata has been stripped by erosion.
Twenty auger-drill holes were put down in the southern half of the hard-rock district to get stratigraphic information and to obtain samples of the phosphatic sands (pis. 8-12). Correlation between the strata penetrated in the different holes proved difficult, but it appears that the sands are most phosphatic in the low areas within the belt of hard-rock deposits. The highest areas have less secondary phosphate and better preserved remnants of the original sediments, such as the phosphatic limestone found in drill hole 20 (pl. 12) on a hill of 150 feet altitude and the thick clay in drill hole 8 (pl. 9) on a hill of
1 F. A. Hildebrand and D. D. Riska, aualysts.
HARD-ROCK PHOSPHATE DEPOSITS 37
195 feet altitude; thick beds of clay underlie the highest hills at the southern end of the district.
AGE OF THE PHOSPHATIC SANDS AND CLAYS
These phosphatic sands and clays, as well as the underlying secondary apatite deposits, were originally nan1ecl the "Dunnellon fonnation" by Sellards (1910, p. 32), but he later concluded that they were equivalent to the Alachua forrnation and dropped his earlier nan1e (Sellards, 1914b ).
Invertebrate fossils have been found in these sands at only one place, the old phosphate n1ine of locality 11 (pl. 1; table 10) where they occur in large loose blocks of phosphatic sandstone within the pit; Druid Wilson assigns late Miocene age to these mollusks. Horse teeth found in place in phosphatic sand at n1ap localities 8 and 20 are called early Pliocene(?) by G. E. Lewis (written communication, 1956), who identified these teeth as follows:
Map locality 8: Hard-rock phosphate mine in SW%NWX sec. 21, T. 9 S., R. 17 E., Alachua
County. Sample 277 from phosphatic clayey sand. Undetermined bone fragments 3 fragments of upper cheek teeth 2 ?very much worn cheek teeth of ? Nannippus aff. N. mz'nor 1 fragment of carapace of ?Gopherus sp.
Map locality 20: Hard-rock phosphate mine in SWXSW~~ sec 4, T. 14 S., R. 19 E., tevy
County. Sample 181 from phosphatic sand, 8 feet below top of bed. Much-worn upper cheek tooth of Nannippus cf. N. minor.
Lewis states:
If these horse teeth do in fact represent much-worn Nannippus teetb, I would judge their age to be early Pliocene. However, the upper cheek teeth of Nannippus are very highcrowned when little worn (35 to 75 mm high), and have a discrete protocone almost to the base of the crown, whereas these Alachua and Levy County specimens are 19 (No. 181), 15 and 13 (No. 277) mm high at the paracone, and in the Alachua County specimens (No. 277) the protocone is connected to the protoconule as in the genus and subgenus M erychippus (Protohippus). Therefore, the remote possibility exists that No. 277 might be secondarily derived Merychippus aff. M. gunteri from the early Middle Miocene Hawthorn formation. The discrete protocone and very complicated enamel patterns of the fossettes of No. 181 make its reference to Nannippus much more probable.
According to Simpson (1929), vertebrate fossils of Miocene age have been found in one phosphate deposit near Newberry, vertebrate fossils of early Pliocene age have been found at 6 localities in the hard-rock district, and Pleistocene vertebrates have also been found at various places in the district. He rejects the custom of assigning all these fossils to the Alachua formation, because he believes that Pliocene and Pleistocene fossils have not only been mixed together naturally, but that fossils from several localities that are s0me miles apart
38 PHOSPHATE DEPOSITS, NORTHERN PENINSULAR FLORIDA
have been erroneously reported as coming from a single locality. Sin1pson (1929, p. 260) concludes that "the fauna of the Alachua forn1ation, when purged of mixture, is probably not later than the close of the lower Pliocene."
No general agreen1ent on the nature and age of the Alachua fornlation has yet been reached. Pirkle (1956b) gives a recent review of the problems and points out that strata of the Hawthorn formation and also Pleistocene sediments have been included with the Alachua fonnation. Vernon (1951, p. 189-195) regards the Alachua as a terrestrial deposit of early Miocene to Pleistocene age. Cooke (1945, p. 200) states:
The Alachua is unique among geologic formations in Florida in that most of it was not deposited in water, either salt, or brackish, or fresh. The bulk of the Alachua is merely the collapsed and compacted residue of the Hawthorn formation in situ together with accumulations in sinkholes and ponds. These later accumulations contain the bones of Pliocene animals.
He comments that it was a considerable expansion of the original meaning of the Alachua formation for Sellards to include the phosphatic sand of the hard-rock district in the Alachua.
Ketner and McGreevy (1959, p. 59-70), from studies in several phosphate mines at the south end of the hard-rock phosphate district, conclude that the term "Alachua formation" should be restricted to clay deposits of late Miocene or early Pliocene age and should not include the phosphatic sands and underlying units. They assign the phosphatic sands to the Hawthorn formation (middle Miocene according to their view) and the clay and phosphorite below to the Tampa limestone (early Miocene). We, too, believe that the phosphatic sands and underlying units should not be placed in the Alachua formation; we feel, however, from the evidence of fossils from the northern part of the district, that the age of t,hese beds falls somewhere in the range between n1iddle Miocene and early Pliocene.
ORIGIN
Most investigators of the hard-rock phosphate deposits have agreed that the phosphate was deposited from ground waters by replacement of limestone and by precipitation in cavities, but they have not agreed upon the nature of the original phosphatic material frmn which the ground waters dissolved phosphate in the first place. The original phosphatic source material has obviously been greatly modified by ground-water leaching. The principal theories that have been offered about the nature of this original phosphatic 1naterial are given below.
1. Marine phosphorite of Miocene or younger age once covered the area of the hard-rock phosphate district; phosphate was dissolved by ground water and reprecipitated at depth.
HARD-ROCK PHOSPHATE D-EPOSITS 39
2. Sedimentary phosphate originally occurred in Eocene lin1estone or other pre-Miocene strata; phosphate was dissolved by ground water and reprecipitated at depth.
3. Guano deposits accumulated on island bird rookeries during Miocene and younger time; these have been rnodified by ground water during and since guano deposition.
The first theory, that the hard-rock deposits are the end product of long periods of weathering of 11iocene or younger phosphorites which once covered the district, was originally proposed by Sellards (1913) and was also supported by Matson (1915) and Cooke (1945); Sellards reviewed all the theories of origin suggested by earlier workers. This mode of origin seems to us to be most probable, for reasons that will be discussed below.
The second theory has no evidence in its support, because sedimentary phosphorite of pre-Miocene age is unknown in formations that crop out in Florida.
The guano theory was favored by several of the early students of the hard-rock phosphate deposits, and it has recently been strongly endorsed by Vernon (1951); he concludes that the hard-rock phosphate district was an island area during n1uch of Miocene and younger time, and that enormous an1ounts of guano accumulated in large bird colonies. The phosphate deposits would thus be guano deposits that have been modified by ground-water action.
The choice between the weathered phosphorite and the guano theories of origin of the hard-rock phosphate deposits depends mainly upon the true nature of the phosphatic sand, clay, and phosphorite of the hard-rock phosphate district. Is it the residuum of marine phosphorite from which nearly all soluble material has been leached, or is it made up of terrestrial sedirnents accumulated on guano islands? Present evidence clearly indicates, we believe, that the phosphatic sands, sandy clays, and clays that overlie the secondary phosphate deposits represent a marine stratigraphic sequence that is similar in several respects to, and different in some ways from, the Hawthorn formation of known Miocene age which is exposed farther east. Remnants of beds of early and middle Miocene age in the southern part of the Ocala uplift, just south of the hard-rock phosphate district, are described by Carr and Alverson (1959, p. 59-60); they conclude, "the evidence indicates that there was extensive, if not complete, inundation of the uplift by lower and middle Miocene seas." There is a possibility that the hard-rock district was a land area early in the Miocene as suggested by Cooke (1945, p. 119-120), rather than during all the Miocene as Vernon (1951) suggests, before it was submerged and covered by sediments of younger Miocene and Pliocene age. Guano deposits could, therefore, have been forrned in the area during
40 PHOSPHATE DEPOSITS, NORTHERN PENINSULAR FLORIDA
early Miocene time; these conjectural guano deposits might have been later changed by phosphatic ground waters descending through overlying marine phosphorite strata. Although the possiblity of initial guano deposits must be admitted, we find no evidence to support the guano theory and think that the phosphate deposits of the hard-rock district were most probably formed by the profound weathering of marine phosphorite beds in the n1anner outlined below.
The evidence for the existence of a uniform stratigraphic sequence, above the hard-rock phosphate deposits has already been given (p. 33-35). This sequence is broadly similar to that of the known Miocene phosphatic beds in northern Florida (table 6). Corresponding units have similar lithologic characteristics. The apatite grains and pellets that are found nearly everywhere in the clays and sands above the secondary apatite deposits are identical in appearance, except for generally being lighter in color due to weathering, with apatite pellets and grains in phosphorite beds of the Hawthorn. Kaolinite is the characteristic clay mineral of the upper sandy unit in the hard-rock district and also above the known Miocene beds; montmorillonite is the clay mineral in the more clayey unit beneath in both sequences. Montmorillonite must certainly be the primary clay mineral in these sequences, as it is in the Bone Valley formation of the land-pebble district in central Florida (Altschuler and others, 1956). We do not have good evidence for the origin of kaolinite in the phosphatic sand, however; it might have been formed by the weathering of montmorillonite, as Altschuler, Jaffe, and Cuttitta (1956) have shown is the case in the land-pebble district, or possibly from the weathering of feldspar, or it might be the original sedimentary clay mineral.
Phosphatic carbonate rock (limestone) has been found only at one locality in the hard-rock district, a poor sample from auger-drill hole 20; the insoluble residue of this limestone consists of nearly equal parts of attapulgite and quartz. 2 This occurrence may be an unleached remnant of phosphatic carbonate strata that were once widespread in the area.
Silicified wood is mentioned by both Sellards (1913, p. 28-29) and Vernon (1951) as occurring in the bard-rock phosphate deposits. However, Sellards notes that it is very rare, to which we would agree, because we found none in the many pits that we examined. The presence of silicified wood in the deposits can have little significance in relation to the origin of the deposits, until something is known about the stratigraphic position and distribution of the silicified wood.
Although there seems to be good evidence for the widespread deposition of marine phosphorite in the hard-rock district, various im-
z X-ray determination by H. C. Starkey, P. D. Blackmon, J. C. Hathaway, and Gillison Chloe.
HARD-ROCK JPHOSPHATE D'E~OSI'I1S 41
portant stratigraphic and geon1orphologic problen1s ren1ain to be solved, among which are the follo·wing:
1. Were there originally extensive beds of phosphatic carbonate in the lower part of the sequence? Core drilling at the site of auger-drill hole 20 (pl. 1) and on other hills in the region with altitudes of about 150 feet might yield significant information on this n1atter.
2. Are two different lithologic facies that were deposited contemporaneously represented in the hard-rock district and the area farther south? Thick beds of rnontrnorillonite clay (25 to 30ft thick) overlain by thin beds of phosphatic sand occur at altitudes between 150 and 200 feet in Citrus and Hernando Counties adjacent to the southern part of the hard-rock district,8 as at n1ap locality 29 (pl. 1; table 13). Within the main hard-rock district beds of n1ontmorillonite clay are thin (less than 5 ft thick) and occur at altitudes below 100 feet; these beds may contain apatite grains and pellets, and are commonly overlain by a thick cover of phosphatic sand (50 to 75 ft thick).
3. What is the reason for the general difference in altitude of 50 to 100 feet between the 2 areas just discussed? The most likely reasons for this difference in altitude are (1) differential uplift between these areas since deposition, such as Altschuler and Young (oral communication, 1958) believe has occurred between northward-trending ridges and valleys in the land-pebble district, or (2) n1uch n1ore active groundwater solution in the area of thin clay and thick phosphatic sand beds (bard-rock district) than in the area of thick clay beds (Citrus and Hernando Counties). It is easily possible that several hundred feet of limestone has been dissolved by ground water beneath the phosphatic sand cover of the hard-rock district, if lirnestone solution in Florida proceeds at the rate estimated by Sellards (1914.a), that is, 1 foot in 5,000 or 6,000 years.
4. Could the phosphatic sand have originally been deposited in a very long sand bar, now much changed by erosion, in which phosphate deposition was restricted to a narrow part of the sand bar? The area of thick sand cover is more than 100 n1iles long in a northwest trend, and the hard-rock phosphate deposits occur rnostly in a rather narrow belt along the east side of this area (pl. 6). The present linear distribution of the hard-rock phosphate deposits could perhaps be more readily explained as the result of weathering of a sedin1entary phosphorite deposit of linear rather than broad extent.
5. Since the phosphatic beds of the hard-rock district rnay be in part younger than the Hawthorn forn1ation, is it possible that erosion
• The areasofMioceneclay mapped in Citrus County by Vernon (1951) are shown on plate 1, but there are some unmapped areas of clay in Hernando County, such as the clay found in drill hole 8 (pl. 9), that are not shown on plate 1.
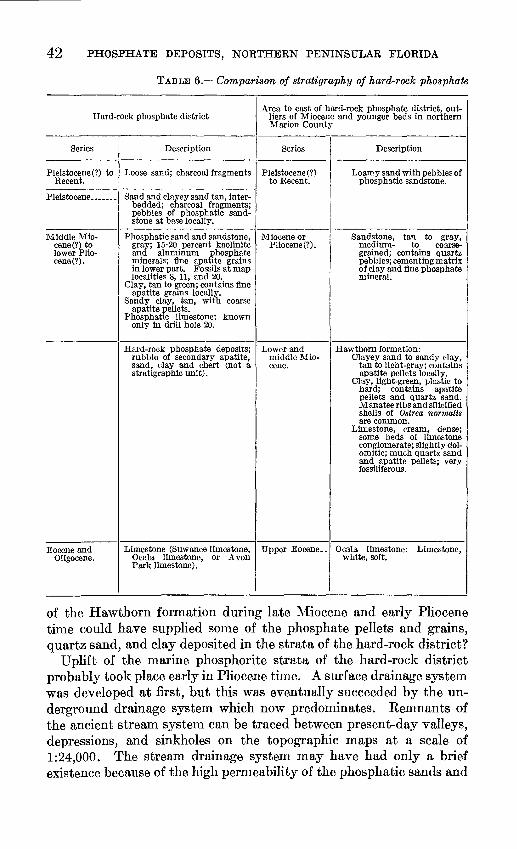
42 PHOSPHATE DEPOSITS, NORTHERN PENINSULAR FLORIDA
TABLE 6.-Comparison of stratigraphy of hard-rock phosphate
Hard-rock phosphate district Area to east of hard-rock phosphate district, out
liers of Miocene and younger beds in northern Marion County
Description Series Description Series I ---------l------------------l----------~------------------1
Pleistocene(?) to Loose sand; charcoal fragments Pleistocene(?) Loamy sand with pebbles of Recent. to Recent. phosphatic sandstone.
Pleistocene_______ Sand and clayey sand tan, interbedded; charcoal fragments; pebbles of phosphatic sandstone at base locally.
Middle Miocene(?) to lower Pliocene(?).
Phosphatic sand and sandstone, Miocene or gray; 15-20 percent kaolinite Pliocene(?). and aluminum phosphate minerals; fine apatite grains in lower part. Fossils at map localities 8, 11, and 20.
Clay, tan to green; contains fine apatite grains locally.
Sandy clay, tan, with coarse apatite pellets.
Phosphatic limestone; known only in drill hole 20.
Hard-rock phosphate deposits; Lower and rubble of secondary apatite, middle Mio-sand, clay and chert (not a cene. stratigraphic unit).
Sandstone, tan to gray, medium- to coarsegrained; contains quartz pebbles; cementing matrix of clay and fine phosphate mineral.
Hawthorn formation: Clayey sand to sandy clay,
tan to light-gray; contains apatite pellets locally.
Clay, light-green, plastic to hard; contains apatite
~~~~e:~~s~d;Iu~f3:d shells of Ostrea normalis are common.
Limestone, cream, dense; some beds of limestone conglomerate; slightly dolomitic; much quartz sand and apatite pellets; very fossiliferous.
Eocene and Oligocene.
Limestone (Suwanee limestone, Upper Eocene__ Ocala limestone: Limestone, Ocala limestone, or A von white, soft. Park limestone).
of the Hawthorn formation during late Miocene and early Pliocene time could have supplied some of the phosphate pellets and grains, quartz sand, and clay deposited in the strata of the hard-rock district?
Uplift of the marine phosphorite strata of the hard-rock district probably took place early in Pliocene time. A surface drainage system was developed at first, but this was eventually succeeded by the underground drainage system which now predominates. Remnants of the ancient stream system can be traced between present-day valleys, depressions, and sinkholes on the topographic maps at a scale of 1:24,000. The stream drainage system may have had only a brief existence because of the high permeability of the phosphatic sands and
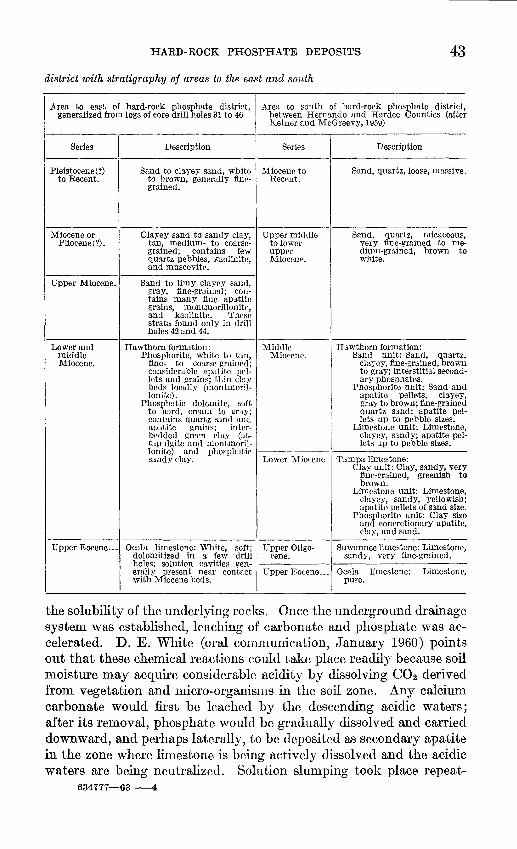
HARD-ROCK PHOSPHATE DEPOSI'DS 43
district with stratigraphy of areas to the east and south
Area to east of hard-rock phosphate district, Area to south of hard-rock phosphate district, generalized from logs of core drill holes 31 to 46 between Hernando and Hardee Counties (after
Ketner and McGreevy, 19.59)
Series Description Series I Description 1---1----1.--~----
Pleistocene(?) Sand to clayey sand, white Miocene to Sand, quartz, loose, massive. to Recent. to brown, generally fine- Recent.
grained.
Miocene or Pliocene(?).
Upper Miocene_
Lower and middle Miocene.
Clayey sand to sandy clay, tan, medium- to coarsegrained; contains few quartz pebbles, kaolinite, and muscovite.
Sand to limy clayey sand, gray, fine-grained; contains many fine apatite grains, montmorillonite, and kaolinite. These strata found only in drill holes 42 and 44.
I
Hawthorn fonnation: Phosphorite, white to tan,
fine- to coarse-grained; considerable apatite pellets and grains; thin clay beds locally (montmorillonite).
Phosphatic dolomite, soft to hard, cream to gray; contains quartz sand and apatite grains; interbedded green clay (attapulgite and montmoril
Upper middle to lower upper Miocene.
Middle Miocene.
Sand, quartz, micaceous, very fine-grained to mecHum-grained, brown to white.
Hawthorn formation: Sand unit: Sand, quartz,
clayey, fine-grained, brown to gray; interstitial secondary phosphates.
Phosphorite unit: Sand and apatite pellets, clayey, gray to brown; fine-grained quartz sand; apatite pellets up to pebble sizes.
Limestone unit: Limestone, clayey, sandy; apatite pellets up to pebble sizes.
lonite) and phosphatic 1-------1-----------sandy clay.
Upper Eocene ___ Ocala limestone: White, soft; dolomitized in a few drill
Lower l\1iocene_
Upper Oligocene.
Tampa limestone: Clay unit: Clay, sandy, very
fine-grained, greenish to brown.
Limestone unit: Limestone, clayey, sandy, yellowish; apatite pellets of sand size.
Phosphorite unit: Clay size and concretionary apatite, clay, and sand.
Suwannee limestone: Lin1estone, sandy, very fine-grained.
holes; solution cavities gen- 1-------1-----------erally present near contact with Miocene beds.
Upper Eocene___ Ocala limestone: Limestone, pure.
the solubility of the underlying rocks. Once the underground drainage system was established, leaching of carbonate and phosphate was accelerated. D. E. White (oral con1n1unication, January 1960) points out that these chemical reactions could take place readily because soil moisture may acquire considerable acidity by dissolving C02 derived from vegetation and 1nicro-organisn1s in the soil zone. Any calciun1 carbonate would first be leached by the descending acidic waters; after its removal, phosphate would be gradually dissolved and carried downward, and perhaps laterally, to be deposited as secondary apatite in the zone where lin1estone is being actively dissolved and the acidic waters are being neutralized. Solution slun1ping took place repeat-
634777-63-4
44 PHOSPHATE DEPOSITS, NORTHERN PENINSULAR FLORIDA
edly, causing brecciation of secondary apatite or mixing it with other materials. Phosphate deposition was discontinuous, and several generations of secondary apatite are commonly evident, such as successive botryoidal layers, phosphate breccia recemented by apatite, and cavities in hard tan apatite partly filled by chalklike apatite. The origin of the abundant soft claylike apatite is not clear; it may have been deposited from solution in ground water, or possibly it was transported as a suspension of very fine particles in the ground water. However, Ketner and McGreevy (1959, p. 76-77) suggest that the soft apatite is a primary mineral deposited in early Miocene time in phosphatic beds in the Tampa limestone, whereas the hard botryoidal apatite was formed much later by ground-water action. The aluminum phosphate minerals crandallite and millisite were formed in the phosphatic sands, and wavellite was formed as incrustations of delicate crystals in fractures in clay and cavities in hard apatite. The kaolinite that is associated with the aluminum phosphate minerals in the phosphatic sands may also have been formed in the weathering process.
Original sedimentary apatite pellets and grains are still present at many places. Apatite pellets (as large as 1 em) in clay or very clayey sands have commonly escaped complete solution, although they may be weathered to a soft chalklike state. Small red or brown apatite grains (less than 0.5 mm) are very widespread in the lower part of the phosphatic sands. Some of this phosphatic sand has been cemented to a hard sandstone. A few thin patches of phosphatic sand and sandstone with grains and pellets of apatite occur about 5 miles east of Inverness at n1ap locality 28 (pl. 1) in sees. 7 and 18, T. 19 S., R. 21 E.; these probably are small outliers of Miocene phosphorite.
Considerable erosion has taken place since the formation of the hard-rock phosphate deposits. The elongate belt of thick sand cover (pl. 6) seems to have undergone marine erosion nearly everywhere along its west side. The phosphatic sands have been partly or completely stripped from many deposits between Newberry and High Springs (pl. 6) at altitudes less than 100 feet above sea level; masses of secondary apatite probably were originally exposed at the surface here, and they are known to crop out at various places farther south. Loose sands or bedded sands commonly rest unconformably upon secondary phosphate rubble in the Newberry-High Springs region. A probable earlier erosional break, represented by conglomerate beds which are a foot or two thick and are composed of rounded pebbles of chert and phosphatic sandstone within clayey sand or reworked phosphatic sand, occurs at map locality 10 (pl. 1) and several nearby pits. Two erosional breaks were also recognized in deposits of this region by Matson (1915, p. 29, 53), who also points
ECONOMIC GEOLOGY 45
out that the deposits near Newberry generally are thinner and have less barren overburden than deposits south of Dunnellon. In all probability, this situation is the result of greater erosion in the area near Newberry where much of the thick sand cover is absent (pl. 6).
ECONOMIC GEOLOGY
ffiSTORY OF PHOSPHATE MINING
The first phosphate n1ining in Florida was in phosphorite beds near Hawthorn, Alachua County, in 1883 and 1884 (Sellards, 1913, p. 41), after the discovery that the sandstone being quarried here for construction stone by C. A. Sin1mons contained considerable phosphate (Hawes, 1883). River pebble deposits were n1ined in northern Florida to a limited extent in Black Creek, Clay County.
Phosphate was discovered in the hard-rock phosphate district in a well dug near Dunnellon by Albertus Vogt in May 1888 (Sellards, 1913). Prospecting and n1ining developed rapidly, and by 1909 there were 20 companies that were operating 75 plants. Only 3 companies were operating in 1941; the Kibler-Can1p Phosphate Enterprise has been the only company active in the district since 1949. The Tennessee Valley Authority began prospecting for hard-rock phosphate deposits in 1950; most of their work before 1956 was in the area south of Dunnellon. About 500 pits have been worked in the district by about 75 companies according to Kibler (1941).
Total production of hard-rock phosphate was about 14,293,000 long tons to the end of 1960. The largest quantity sold in 1 year was 646,156 long tons in 1907 (fig. 4). The tonnage sold annually exceeded 300,000 long tons each year from 1894 to 1914, but it has been less than 200,000 long tons during every year since 1914, except for 1919 and 1920; the a1nount sold annually since 1950 has ranged between 70,000 and 96,000 long tons, equal to about 1 percent of the annual production from the land-pebble field. 1rfost of the hard-rock phosphate has been exported. In recent years, the slimes from old tailings ponds have been dug up, dried, and the "soft" or "colloidal" phosphate sold for use as a soil conditioner or for mixing with cattle feed.
The hard-rock phosphate industry during its most productive period is well described by Matson (1915); Kibler (1941) gives a good account of the modern period. In the early days of mining, the overburden sand was removed by horse scraper, and the phosphate ore mined by pick and shovel. Now the overburden is removed by washing it hydraulically into a sun1p and then pumping it to a waste pond. The phosphate ore is n1ined by dragline to depths of about 50 feet below water level; mining below water level was formerly
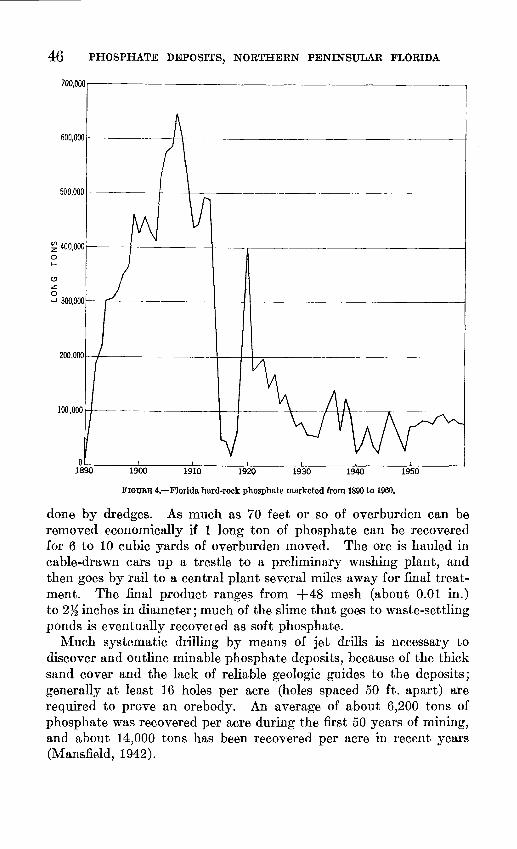
46 PHOSPHATE DEPOSITS, NORTHERN PENINSULAR FLORIDA
:::r-1-----~--f---1t-------~~~~~~~~~-~-~------l 500,000 t-------
~ 400,000r-----~r---~--t-~--------r---~--~-~------l 0 1-
(!)
z 0 ~~.ooor-~---------+--+~--~----------~
FIGURE 4.-Florida hard-rock phosphate marketed from 1890 to 1960.
done by dredges. As much as 70 feet or so of overburden can be removed economically if 1 long ton of phosphate can be recovered for 6 to 10 cubic yards of overburden moved. The ore is hauled in cable-drawn cars up a trestle to a preliminary washing plant, and then goes by rail to a central plant several miles away for final treatment. The final product ranges from +48 mesh (about 0.01 in.) to 2~ inches in diameter; much of the slime that goes to waste-settling ponds is eventually recove1ed as soft phosphate.
Much systematic drilling by means of jet drills is necessary to discover and outline minable phosphate deposits, because of the thick sand cover and the lack of reliable geologic guides to the deposits; generally at least 16 holes per acre (holes spaced 50 ft. apart) are required to prove an orebody. An average of about 6,200 tons of phosphate was recovered per acre during the first 50 years of mining, and about 14,000 tons has been recovered per acre in recent years (Mansfield, 1942).

ECONOMIC GEOLOGY 47
PHOSPHORUS AND URANIUM IN THE HAWTHORN FORMATION
The new data gathered about the occurrence of phosphorus and uranium in the Hawthorn forn1ation come fron1 drill hole and channel samples from 35 localities that are rather widely distributed in northern Florida. Much of this infonnation is sun11narized in table 7; more detailed data, including analyses of different size fractions, are given in tables 14-16 and 21 and in the report on the area south of Ocala (Espenshade, 1958).
TABLE 7.-Summary of analyses of samples of phosphatic beds of the Hawthorn formation for P205 and uranium
A. SAMPLES OF PHOSPHORITE WITH SIGNIFICANT CONTENT OF P20o AND URANIUM
Locality
Drill hole 25 2 _____________________ _
25 2 _____________________ _
26 2 _____________________ _
26 2 _____________________ _
27 2 _____________________ _
27 2 _____________________ _
28 2 _____________________ _
29 2 _____________________ _
32 ______________________ _ 32 ______________________ _ 37 ______________________ _ 40 ______________________ _ 40 ______________________ _ 41 ______________________ _ 41 ______________________ _ 45 ______________________ _ 46 ______________________ _
Drill-hole samples
Depth (feet)
1 - 3 3 17 -21
4. 5- 7. 5 3 12 -16 3 17.5-21
30 -41. 5 40 -43. 5
3 4. 5- 9. 0 28 -32 33 -39. 5 61. 5-65. 5 37 -40 40 -46 17 -22 22 -24 30. 5-34 29. 5-32. s
Surface samples
Percentage
17. 1 8. 4 8. 0
10. 3 5. 6
20. 7 9. 1
15.0 10.8 12. 9 16. 7 6.2
10. 0 8. 6
15. 9 14. 6 10. 1
Percentage
0.015 . 020 . 004 . 005 . 022 . 005 . 005 . 014 . 015 . 017 . 010 . 013 . 004 . 019 . 009 . 008 . 003
Locality Sample length (feet)
P20o Uranium
Map locality 5 ______________________ 4. 5 14. 3 0.003 6 ______________________ 1.5 10. 1 . 001
7; 3 samples:
9---~~:==============i 1. 8-2. 2 10. 2-11. 8 0. 002- . 008
6 I 16. 5 . 012 12 _____________________ 1 I 16. 0 . 016 I I
Phosphate minerals 1
Apm. Ap. Ap . Ap,W. Apm, Wm. Ap,W. Ap. Apm. Ap.
Phosphate minerals 1
Ap, W, C.
Ap . Ap, W . Ap, W.
1 Phosphate minerals were determined by X-ray only for the samples listed here: Ap, apatite; W, wavellite; C, crandallite. Minerals identified microscopically: Aprn, apatite; "rm, wavellite.
2 Detailed analyses of samples from drill holes 21-30 are given in Espenshade (1958); detailed analyses of other samples are given in tables 14-16 and 21.
3 Samples of what is probably the same bed; the 4 drill holes are spaced abont 200ft apart along a road.
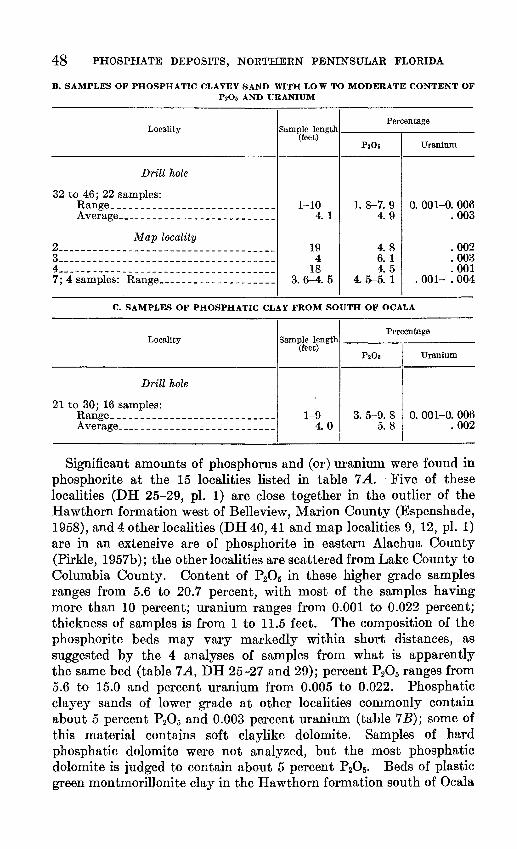
48 PHOSPHATE DEPOSITS, NOR'JlHERN PENINSULAR FLORIDA
B. SAMPLES OF PHOSPHATIC CLAYEY SAND WITH LOW TO MODERATE CONTENT OF P,Oa AND URANIUM
Locality
Drill hole
32 to 46; 22 samples: Range ___________________________ _ Average __________________________ _
Map locality 2-------------------------------------3 ____________________________________ _
4-------------------------------------7; 4 samples: Range ___________________ _
Percentage Sample lengthl----....,-----
(feet)
1-10 1. 8-7. 9 0.001-0.006 4. 1 4.9 . 003
19 4. 8 . 002 4 6. 1 . 003
18 4. 5 . 001 3.6-4. 5 4. 5-5. 1 . 001- . 004
C. SAMPLES OF PHOSPHATIC CLAY FROM SOUTH OF OCALA
Percentage Locality Sample length
(feet) P20a Uranium
Drill hole
21 to 30; 16 samples: Range ____________________________ 1-9 3. 5-9. 8 0.001-0.006 Average ___________________________ 4. 0 5. 8 . 002
Significant amounts of phosphorus and (or) uranium were found in phosphorite at the 15 localities listed in table 7 A. Five of these localities (DH 25-29, pl. 1) are close together in the outlier of the Hawthorn formation west of Belleview, Marion County (Espenshade, 1958), and 4 other localities (DH 40, 41 and map localities 9, 12, pl. 1) are in an extensive are of phosphorite in eastern Alachua County (Pirkle, 1957b); the other localities are scattered from Lake County to Columbia County. Content of P20 5 in these higher grade samples ranges from 5.6 to 20.7 percent, with most of the samples having more than 10 percent; uranium ranges from 0.001 to 0.022 percent; thickness of samples is from 1 to 11.5 feet. The composition of the phosphorite beds may vary markedly within short distances, as suggested by the 4 analyses of samples from what is apparently the same bed (table 7 A, DH 25-27 and 29); percent P20 5 ranges from 5.6 to 15.0 and percent uranium from 0.005 to 0.022. Phosphatic clayey sands of lower grade at other localities commonly contain about 5 percent P20 5 and 0.003 percent uranium (table 7 B); some of this material contains soft claylike dolomite. Samples of hard phosphatic dolomite were not analyzed, but the most phosphatic dolomite is judged to contain about 5 percent P205• Beds of plastic green montmorillonite clay in the I-Iawthorn formation south of Ocala
ECONOMIC GEOLOGY 49
contain abundant small white phosphate particles; 16 samples of this phosphatic clay have an average content of 5.8 percent P205
and 0.002 percent uranium (table 70). No consistent relationship is evident between the uranium and phos
phorous content of the phosphorite sa1nples. However, the analyses of the different size fraction show that in most of the higher grade samples, between 70 and 90 percent of the total P 20 5 and uranium is contained in the coarse fraction ( + 14-mesh, or > 1.19 mm) and fine fraction -150-mesh, or <o.105 mn1) combined; either the coarse fraction or the fine fraction may contain most of the phosphorous and uranium. Quartz sand is the do min ant constituent in the intervening size range ( -14- and + 150-mesh). Distribution of phosphorus and uranium seems to be rather erratic in the lower grade material. In only 3 out of 12 samples of the lower grade material do the combined + 14-mesh and -150-mesh fractions have more than 50 percent of the total P 20 5; 6 of the 12 samples have more than 50 percent of the total uranium in the combined coarse and fine fractions.
In the apatite pellets themselves (as distinguished fron1 the samples of the phosphorite just described) the content of P20 5 and uranium is related to the sizes of the apatite particles. The small apatite pellets, such as the -35+ 150-mesh flotation contentrates (tables 14, 15), nearly always have higher P20 5 and lower Si02 content than the large pellets ( + 14-mesh), because inclusions of quartz sand are more common in the larger pellets; uranium content is commonly lower in the small pellets than in the large pellets. The uranimn-phosphorus ratio generally is highest in the -150-mesh size, about half as large in the + 14-mesh size and still less in the flotation concentrates of -35+ 150-mesh size. Similar patterns of uranium and phosphorus relationships were found by Cathcart (1956, p. 493) in a study of hundreds of samples from the land-pebble phosphate district; he states: "the phosphate content increases and uraniun1 content decreases as the size of the nodules decrease." Cathcart's figure 170B indicates that the uranium-phosphate ratio in the phosphorites of the land pebble district is also highest in the - 150-mesh fraction (slimes).
Phosphorite of the Hawthorn formation at n1any of the sample localities in northern Florida has been altered by ground-water redistribution of phosphorus and uranium. These alterations are rather well-developed in phosphorite cut by drill holes 32, 37, 40, 41, 45, and 46 (tables 14, 16) and at several surface exposures. The upper part of the phosphorite beds has soft chalklike apatite pellets at all these places; kaolinite, claylike apatite, wavellite, crandallite, phosphate-cemented sandstone, and angular fragments of secondary apatite are also present at some places (table 7 A). Radioactivity logs of some drill holes indicate high uraniu1n content in the weathered
50 PHOSPHATE DEPOSITS, NORTHERN PENINSULAR FLORIDA
upper beds of the clayey-sandy phosphorite (pls. 2-4). Uraniferous beds were also detected by the radioactivity logs in the lower part of the phosphatic dolomite sequence at depths of 80 to 335 feet in drill holes 35, 41, 42, 44, and 45 (pls. 2, 4, 5). Core recovery fron1 these beds was poor, and it is not known whether the high uranium content is associated with secondary phosphate minerals. It may be that poorly consolidated phosphorite, which did not yield good core samples, is interbedded with the phosphatic dolomite here. Uranium enrichment of these beds n1ight be the result of a hypothetical period of terrestrial weathering which interrupted phosphatic sedimentation during Miocene time, or it might be due to deep ground-water circulation in post-Miocene time.
Highly leached phosphorite, consisting of soft vesicular sandstone cemented by a white mixture of wavellite, crandallite, and kaolinite, is abundant in the outlying areas of the Hawthorn formation south of Ocala (Espenshade, 1958) and also at several places north of Ocala, particularly in sees. 18 and 36, T. 13 S., R. 21 E., and sec. 1, T. 14 S., R. 21 E. Apatite pellets have for the most part been completely leached, and the rock now has numerous ovoid cavities; partly decomposed apatite pellets are in places relict in the cavities. The leached phosphorite is very similar to the aluminum phosphate, or leached zone, rock of the upper part of the Bone Valley formation of the land-pebble district (Altschuler and others 1956). Samples of this porous, leached phosphorite from the area south of Ocala are rather uniform in composition: P20 5 ranges from 12.7 to 16.8 percent, uranium frmn 0.019 to 0.023 percent, Ab03 from 14.7 to 20.0 percent, and quartz from 40.1 to 54.1 percent; specific gravity of the rock is about 1. Phosphatic sandstone from the old C. A. Simmons' quarry a few miles west of Hawthorn, Alachua County, is similar in composition; the analyses of 2 samples contain 13.05 and 16.07 percent P20 5, 12.85 and 19.57 percent Al20 3, and 12.02 and 2.83 percent CaO (Hawes, 1883). The first sample probably contains apatite as well as aluminum phosphate minerals, as indicated by its high CaO content.
PHOSPHOROUS AND URANIUM IN THE HARD-ROCK PHOSPHATE DEPOSITS
According to Mansfield (1942, p. 45), the grade of +48-mesh hard-rock phosphate produced through the years has been 29.8 percent P 20 5 (65 percent BPL, bone phosphate of lime) or better; much of the Inaterial shipped has contained a n1inimum of 35.3 percent P20s (77 percent BPL). Four san1ples of secondary phosphate from hardrock mines have a P20 5 content ranging from 21.2 to 30.0 percent (table 19, p. 102); uranium content of these 4 san1ples ranges from
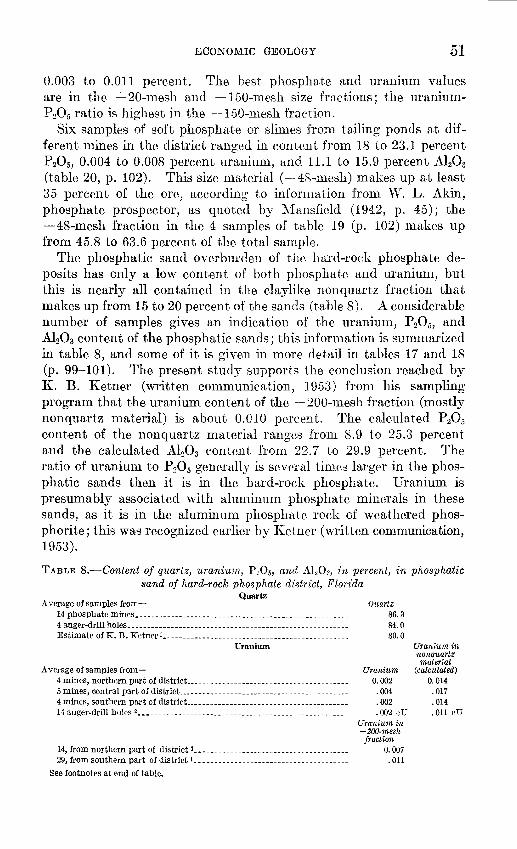
ECONOMIC GEOLOGY 51
0.003 to 0.011 percent. The best phosphate and uranium values are in the + 20-mesh and -150-Inesh size fractions; the uraniumP205 ratio is highest in the -150-Inesh fraction.
Six san1ples of soft phosphate or sli1nes fron1 tailing ponds at different mines in the district ranged in content from 18 to 23.1 percent P205, 0.004 to 0.008 percent uraniun1, and 11.1 to 15.9 percent Al203
(table 20, p. 102). This size material ( -48-mesh) makes up at least 35 percent of the ore, according to inforn1ation from VV. L. Akin, phosphate prospector, as quoted by 11ansfield (1942, p. 45); the -48-mesh fraction in the 4 san1ples of table 19 (p. 102) 1nakes up from 45.8 to 63.6 percent of the total sample.
The phosphatic sand overburden of the hard-rock phosphate deposits has only a low content of both phosphate and uraniun1, but this is nearly all contained in the claylike nonquartz fraction that makes up from 15 to 20 percent of the sands (table 8). A considerable number of san1ples gives an indication of the uraniun1, P20 5, and Al203 content of the phosphatic sands; this information is sun1n1arized in table 8, and some of it is given in more detail in tables 17 and 18 (p. 99-101). The present study supports the eonclusion reached by K. B. Ketner (written con1n1unieation, 1953) fron1 his san1pling program that the uranium content of the -200-Inesh fraction (mostly nonquartz material) is about 0.010 percent. The calculated P20 5 content of the nonquartz material ranges fr01n 8.9 to 25.3 percent and the calculated Al20 3 content fron1 22.7 to 29.9 percent. The ratio of uranium to P 20 5 generally is several tin1es larger in the phosphatic sands then it is in the hard-rock phosphate. Uranium. is presun1ably associated with aluminum phosphate minerals in these sands, as it is in the aluminun1 phosphate rock of weathered phosphorite; this was recognized earlier by Ketner (written communication, 1953).
TABLE 8.-Content of quartz, 1tmnium, P205, and AhOz, in percent, in phosphatic sand of hard-rock phosphate district, Florida
Quartz Average of samples from- Quartz
14 phosphate mines _____________ ---------------------------______________ 86. 3 4 auger-drill holes _____ -------------------------------------______________ 84. 0 Estimate of K. B. KetnE'r 1----------------------------------------------- 80.0
Uranium
Average of samples from-4 mines, northern part of district _____________________ --------------------5 mines, central part of district _______ ------------------------------------4 mines, southern part of district ________________________________________ _ 14 auger-drill holes 2 ____________________________________________________ _
14, from northern part of district I---------------------------------------29, from southern part of district 1 __ • --------------- ____________________ _
See footnotes at end of table.
Uranium in nonquartz material
Uranium (calculated) 0. 002 0.014 . 004 . 017 . 002 .014 . 002 eU . 011 e U
Uranium in -200-mesh
fraction 0.007 .011
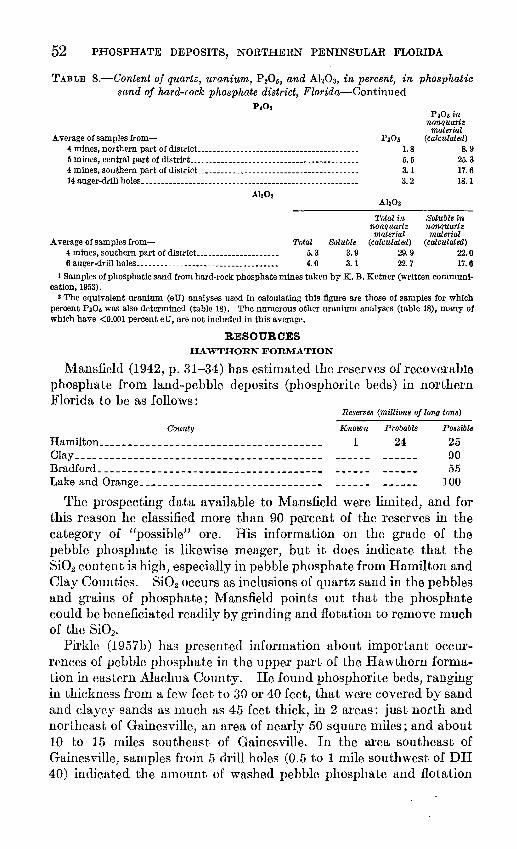
52 PHOSPHATE DEPOSITS, NORTHERN PENINSULAR FLORIDA
TABLE 8.-Content of quartz, uranium, P20 5, and Ah03, in percent, in phosphatic sand of hard-rock phosphate district, Florida-Continued
Average of samples from-4 mines, northern part of district_ _______________________________________ _
5 mines, central part of district-------------------------------------------4 mines, southern part of district_ _______________________________________ _ 14 auger-drill holes. _____________________________________________________ _
AhOs
Average of samples from-4 mines, southern part of district_ ___________________ _ 6 auger-drill holes ___________________________________ _
Total 5.3 4.0
Soluble 3.9 3.1
P20sin nonquartz
material P20a (calculated)
1.8 8. 9 5.5 25.3 3.1 17.6 3. 2 18.1
AbOs
Total in nonquartz material
(calculated) 29.9 22.7
Soluble in nonquartz material
(calculated) 22.0 17.6
t Samples of phosphatic sand from hard-rock phosphate mines taken by K. B. Ketner (written communication, 1953).
2 The equivalent uranium (eU) analyses used in calculating this figure are those of samples for which percent P206 was also determined (table 18). The numerous other uranium analyses (table 18), many of which have <0.001 percent eU, are not included in this average.
RESOURCES HAWTHORN FORMATION
Mansfield (1942, p. 31-34) has estimated the reserves of recoverable phosphate from land-pebble deposits (phosphorite beds) in northern Florida to be as follows:
Reserves (miUions of long tons)
Countv Known Probable Hamilton____ _ _ _ _ _ _ _ _ _ _ _ _ _ _ _ _ _ _ _ _ _ _ _ _ _ _ _ _ _ _ _ _ _ _ 1 24
ClaY------------------------------------------Bradford _____________________________________ _ Lake and Orange ______________________________ _
Possible
25 90 55
100
The prospecting data available to Mansfield were limited, and for this reason he classified more than 90 percent of the reserves in the category of "possible" ore. His information on the grade of the pebble phosphate is likewise Ineager, but it does indicate that the Si02 content is high, especially in pebble phosphate from Hamilton and Clay Counties. Si02 occurs as inclusions of quartz sand in the pebbles and grains of phosphate; Mansfield points out that the phosphate could be beneficiated readily by grinding and flotation to remove much of the Si02.
Pirkle (1957b) has presented information about important occurrences of pebble phosphate in the upper part of the Hawthorn formation in eastern Alachua County. He found phosphorite beds, ranging in thickness from a few feet to 30 or 40 feet, that 'vere covered by sand and clayey sands as Inuch as 45 feet thick, in 2 areas: just north and northeast of Gainesville, an area of nearly 50 square miles; and about 10 to 15 miles southeast of Gainesville. In the area southeast of Gainesville, samples frOin 5 drill holes (0.5 to 1 mile southwest of DH 40) indicated the amount of washed pebble phosphate and flotation
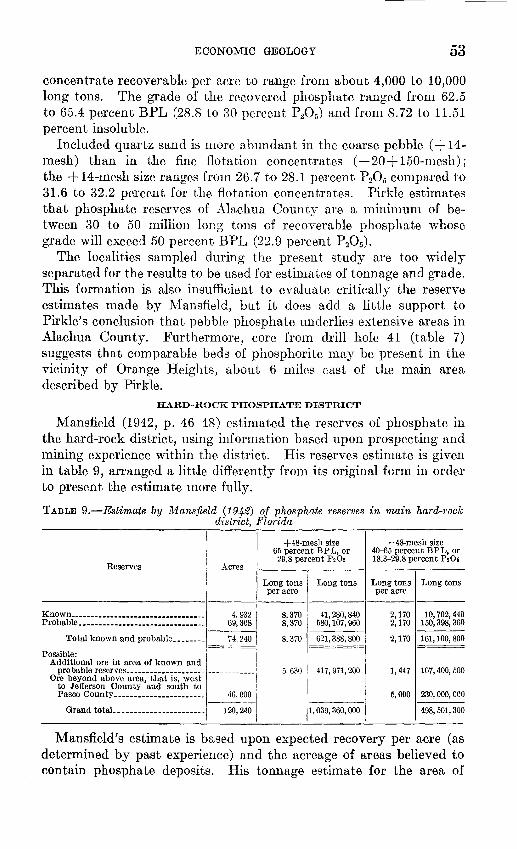
ECONOMIC GEOLOGY 53
concentrate recoverable per acre to range from about 4,000 to 10,000 long tons. The grade of the recovered phosphate ranged fron1 62.5 to 65.4 percent BPL (28.8 to 30 percent P 20 5) and from 8. 72 to 11.51 percent insoluble.
Included quartz sand is n1ore abundant in the coarse pebble ( + 14-mesh) than in the fine flotation concentrates ( -20+ 150-nlesh); the +14-mesh size ranges frmn 26.7 to 28.1 percent P 20 5 compared to 31.6 to 32.2 percent for the flotation concentrates. Pirkle estimates that phosphate reserves of Alachua County are a n1inin1um of between 30 to 50 n1illion long tons of recoverable phosphate whose grade will exceed 50 percent BPL (22.9 percent P20 5).
The localities sampled during the present study are too widely separated for the results to be used for estin1ates of tonnage and grade. This formation is also insufficient to evaluate critically the reserve estimates rnade by Mansfield, but it does add a little support to Pirkle's conclusion that pebble phosphate underlies extensive areas in Alachua County. Furthermore, core frmn drill hole 41 (table 7) suggests that comparable beds of phosphorite 1nay be present in the vicinity of Orange Heights, about 6 miles east of the main area described by Pirkle.
HARD-ROCK PHOSPHATE DISTRICT
Mansfield (1942, p. 46-48) estimated the reserves of phosphate in the hard-rock district, using infonnation based upon prospecting and 1nining experience within the district. His reserves estin1ate is given in table 9, arranged a little differently from its original forn1 in order to present the estimate n1ore fully.
TABLE 9.-Estirnate by Mansfield (1942) of phosphate reserves in rnain hard-rock district, Florida
+48-mesh size -48-mesh size 65 percent BPL, or 40-£5 percent BPL, or 29.8 percent P20s 18.3-29.8 percent P205
Reserves Acres
Long tons Long tons Long tons Long tons per acre per acre
Known---------------------------------- 4,932 8,370 41,280,840 2,170 10,702,440 Probable.------------------------------- 69,308 8,370 580,107,960 2,170 150, 398, 360
Total known and probable ________ 74,240 8,370 621,388,800 2,170 161, 100, 800
Possible: Additional ore in area of known and
probable reserves _____________ ------_ ------------ 5, 630 417, 971, 200 1,447 107, 400, 500 Ore beyond above area, that is, west
to Jefferson County and south to Pasco County----------------------- 46,000
1. 039. 360, 000 1
5,000 230, 000, 000
Grand totaL_--------------------- 120,240 498, 501, 300
Mansfield's estimate is based upon expected recovery per acre (as determined by past experience) and the acreage of areas believed to contain phosphate deposits. His tonnage estimate for the area of
54 PHOSPHATE DEPOSITS, NORTHERN PENINSULAR FLORIDA
4,932 acres is entirely reasonable, but all this tonnage can hardly be regarded as known or measured ore. The area that Mansfield regards as having probable reserves of phosphate is clearly excessive, because he includes considerable ground in which the phosphatic sands are absent or have been widely eroded, and in which there is little likeli· hood that minable hard-rock phosphate deposits exist; the largest such area is in western Marion County where the Ocala limestone is at the surface. Furthermore, the figures for recovery per acre derived from the productive area should not be applied to such a large surrounding area, in which the phosphatic strata have been eroded in many places. Mansfield's estimate of possible ore seems overliberal for the same reasons, that is, excessive area and too large a factor for recovery per acre.
In summary, present geologic information, which was not available to Mansfield, indicates that a significant part of the areas included in his estimate should be excluded because of unfavorable geologic conditions. Much more inforn1ation is needed about the hard-rock phosphate deposits and the geology of the region before a satisfactory estimate of the hard-rock phosphate reserves can be made.
The phosphatic sands of the hard-rock district may be regarded as a potential resource of phosphate and also uranium and aluminum, because of the enormous tonnages of phosphatic sand that exist in the district. Here again, information is too poor to permit estimation of the tonnages of phosphatic sand because the size of the area and the thickness of sand are known only in a very general way. If the average thickness is about 15 feet, there would be about 15 million long tons per square mile where the sands have not been eroded; the content of mixed clay and aluminum phosphate minerals would be between 2 and 3 million tons per square mile. Thus, the total tonnage of aluminum phosphate minerals and clay contained in the phosphatic sands of the district Inay be much larger than the reserves of recoverable hard-rock phosphate.
RECOMMENDATIONS FOR PROSPECTING
HAWTHORN FORMATION
More exploration of phosphorite beds of the Hawthorn for1nation is desirable in the vicinities of drill holes 37, 41, and 46 and n1ap locality 5 (pl. 1), in addition to the areas discussed by Mansfield (1942) and Pirkle (1957b). There may be significant amounts of phosphate pellets, eroded from the phosphorite beds of eastern Alachua County, in the bottoms of the large lakes of the region-Newman, Lochloosa, and Orange. The outliers of the Hawthorn formation in southern Marion County may have phosphorite beds of potential economic importance. However, much of this material has been strongly
ECONOMIC GEOLOGY 55
weathered and altered to almninmn phosphate rock, and considerable exploration would be needed to detern1ine the extent and grade of unaltered pebble phosphate.
HARD·ROCK PHOSPHATE DISTRICT
Reliable guides to secondary phosphate deposits in the hard-rock district have not been discovered, and the exploration practice has been to search for outcrops of phosphate (which have long since been found), and to drill systematically in the vicinity of, or in the ground between, old mines. The location and distribution of these deposits must be n1ainly dependent upon two factors: the original sedimentary distribution, which may have been largely restricted to the eastern part of the sand-covered area; and the redistribution of phosphate by ground waters, which may have involved considerable lateral transport of phosphate in places. Old stream channels and sinkholes must have been the sites of most active ground-water 1novement, and these are especially recommended for prospecting. They are well shown on the Geological Survey's new 77~-Ininute topographic sheets (1 :24,000 scale) that cover 1nuch of the district, and can be readily found by tracing out the 50-foot and 100-foot contour lines. The possibility of partial erosion of deposits must be kept in mind in prospecting areas where thick sand cover is lacking (pl. 6).
Research to in1prove the technique of prospecting for hard-rock phosphate deposits deserves careful investigation. For many years the customary practice has been to drill at closely spaced intervals through the phosphatic sand, and then to take samples by chopping bit or core bit from any hard-rock deposit lying below. It is possible that the phosphatic sand l;ying above a hard-rock deposit has a higher phosphate content than does sand lying above barren ground. If so, widely spaced drilling and san1pling of phosphatic sand at shallow depths might suffice to outline areas of abnor1nally high phosphate content that overlie unsuspected hard-rock deposits. This matter could be readily tested by shallow drilling and smnpling in phosphatic sand above son1e explored but unmined hard-rock phosphate ore bodies.
Much of the mining and prospecting has been concentrated in two parts of the hard-rock distric-t-in a belt between Newberry and High Springs at the northern end of the district and in another belt between Dunnellon and a few miles north of Hernando near the center of the district (pl. 6). The parts of the hard-rock district where n1ining has been moderate to heavy Inake up a total length of about 55 1niles, and the parts where there has been little or no mining have about the sa1ne total length. It is probable that undiscovered deposits still exist in
56 PHOSPHATE DEPOSITS, NORTHERN PENINSULAR FLORIDA
both of these parts. Several extensive areas that have not been prospected much are regarded as favorable for exploration:
1. Between Newberry and High Springs, in the area of thick sand cover just west of the main group of mines.
2. The sand-covered area from Florida State Route 24 between Archer and Bronson for about 25 miles south to near Dunnellon has scarcely been prospected; there are a few old mines farther east where the sand cover is thin and discontinuous. See the Bronson NE, Bronson SE, Tidewater, and Romeo 7~-minute topographic quadrangles.
3. In the vicinity of Dunnellon, in the sinkhole country just west of the heavily mined area. See the Dunnellon and Holder 7~-minute quadrangles.
4. The large valley that trends northwest from sec. 12, T. 20 S., R. 19 E. (Inverness quadrangle) to sec. 11, T. 19 S., R. 19 E. (Lecanto quadrangle); the old Hamburg and Holder mines are in this valley.
5. The sinkhole country extending about 7 miles south of Inverness has been little prospected. See Inverness and Nobleton 7}~-minute quadrangles.
REFERENCES CITED
Altschuler, Z. S., Clarke, R. S., Jr., and Young, E. J., 1958, Geochemistry of uranium in apatite and phosphorite: U.S. Geol. Survey Prof. Paper 314-D, p. 45-90.
Altschuler, Z. S., Jaffe, E. B., and Cuttitta, Frank, 1956, The aluminum phosphate zone of the Bone Valley formation, Florida, and its uranium deposits, in Page, L. R., Stocking, H. E., and Smith, H. B., compilers, Contributions to the geology of uranium and thorium by the United States Geological Survey and Atomic Energy Commission for the United Nations International Conference on Peaceful Uses of Atomic Energy, Geneva, Switzerland, 1955: U.S. Geol. Survey Prof. Paper 300, p. 495-504.
Applin, P. M., 1951, Preliminary report on buried pre-Mesozoic rocks in Florida and adjacent States: U.S. Geol. Survey Circ. 91, 28 p.
Bergendahl, M. H., 1956, Stratigraphy of parts of DeSoto and Hardee Counties, Florida: U.S. Geol. Survey Bull. 1030-B, p. 65-98.
Bishop, E. W., 1956, Geology and ground-water resources of Highlands County, Florida: Florida Geol. Survey Rept. Inv. 15, 115 p.
Carr, W. J., and Alverson, D. C., 1959, Stratigraphy of middle Tertiary rocks in part of west-central Florida: U.S. Geol. Survey Bull. 1092, 111 p.
Cathcart, J. B., 1956, Distribution and occurrence of uranium in the calcium phosphate zone of the land-pebble phosphate district of Florida, in Page, L. R., Stocking, H. E., and Smith, H. B., compilers, Contributions to the geology of uranium and thorium by the United States Geological Survey and Atomic Energy Commission for the United Nations International Conference on Peaceful Uses of Atomic Energy, Geneva, Switzerland, 1955: U.S. Geol. Survey Prof. Paper 300, p. 489-494.
Cooke, C. W., 1939, Scenery of Florida interpreted by a geologist: Florida Geol. Survey Bull. 17, 118 p.
REFERENCES CITED 57
Cooke, C. W., 1945, Geology of Florida: Florida Geol. Survey Bull. 29, 339 p. Cooke, C. W., and Mossom, Stuart, 1929, Geology of Florida: Florida Geol.
Survey, 20th Ann. Rept., 1927-1928, p. 31-227. Dall, H. \V., and Harris, G. D., 1892, Correlation papers-Neocene: U.S. Geol.
Survey Bull. 84, 349 p. Epenshade, G. H., 1958, Geologic features of areas of abnormal radioactivity south
of Ocala, Marion County, Florida: U.S. Geol. Survey Bull. 1046--J, p. 205-219.
Grim, R. E., 1933, Petrography of the fuller's earth deposits, Olmstead, Ill., with a brief study of some non-Illinois earths: Econ. Geology, v. 28, p. 344-363.
Hawes, G. W ., 1883, On a phosphatic sandstone from Hawthorne, in Florida: U.S. Natl. Mus. Proc. for 1882, p. 46--48.
Ketner, K. B., and McGreevy, L. J., 1959, Stratigraphy of the area between Hernando and Hardee Counties, Fla.: U.S. Geol. Survey Bull. 1074-C, p. 49-124.
Kibler, D. B., Jr., 1941, Mining and preparation of Florida hard-rook phosphate: Am. lnst. Mining Metall. Engineers Tech. Bull. 1315, 9 p.
MacNeil, F. S., 1950, Pleistocene shore lines in Florida and Georgia: U.S. Geol. Survey Prof. Paper 221-F, p. 95-107.
Mansfield, G. R., 1942, Phosphate resources of Florida: U.S. Geol. Survey Bull. 934, 82 p.
Matson, G. C., 1915, The phosphate deposits of Florida: U.S. Geol. Survey Bull. 604, 101 p.
Matson, G. C., and Sanford, Samuel, 1913, Geology and ground waters of Florida: U.S. Geol. Survey Water-Supply Paper 319, 445 p.
Moxham, R. M., 1954, Airborne radioactivity surveys for phosphate in Florida: U.S. Geol. Survey Circ. 230, 4 p.
Petersen, R. G., 1955, Origin of the land-pebble phosphate deposits of Florida determined from their clay-mineral content [abs.]: Geol. Soc. America Bull., v. 66, p. 1696.
Pirkle, E. C., 1956a, Notes on physiographic features of Alachua County, Florida: Florida Acad. Sci. Quart. Jour., v. 19, p. 168-182.
--- 1956b, The Hawthorne and Alachua formations of Alachua County, Florida: Florida Acad. Sci. Quart. Jour., v. 19, p. 197-240.
--- 1957a, Hawthorne exposures southeast of Gainesville, Florida: Florida Acad. Sci. Quart. Jour., v. 20. p. 137-142.
--- 1957b, Economic consideration of pebble phosphate deposits of Alachua County, Florida: Econ. Geology, v. 52, p. 354-378.
--- 1958, Lithologic features of Miocene sediments exposed in the Devil's Mill Hopper, Florida: Florida Acad. Sci. Quart. Jour. v. 21, p. 149-161.
Puri, H. S., 1953, Contribution to the study of the Miocene of the Florida panhandle: Florida Geol. Survey Bull. 36, 345 p.
--- 1957, Stratigraphy and zonation of the Ocala group: Florida Geol. Survey Bull. 38, 248 p.
Sellards, E. H., 1910, A preliminary paper on the Florida phosphate deposits: Florida Geol. Survey Third Ann. Rept., p. 17-41.
--- 1913, Origin of the hard-rock phosphates of Florida: Florida Geol. Survey Fifth Ann. Rept., p. 23-80.
--- 1914a, Some Florida lakes and lake basins: Florida Geol. Survey Sixth Ann. Rept., p. 115-159.
--- 1914b, The relation between the Dunnellon formation and the Alachua clays of Florida: Florida Geol. Survey Sixth Ann. Rept., p. 161-162.
58 PHOSPHATE DEPOSITS, NORTHERN PENINSULAR FLORIDA
Simpson, G. G., 1929, The extinct land mammals of Florida: Florida Geol. Survey 20th Ann. Rept., 1927-1928, p. 229-294.
Taylor, A. E., Leighty, R. G., Marco, M. B., Lounsbury, Clarence, Henderson, J. R., and Gall, 0. E., 1954, Soil survey of Alachua County, Florida: Soil Conserv. Service, Ser. 1940, no. 10, 66 p.
Vernon, R. 0., 1951, Geology of Citrus and Levy Counties, Florida: Florida Geol. Survey Bull. 33, 256 p.
White, W. A., 1958, Some geomorphic features of central peninsular Florida: Florida Geol. Survey Bull. 41, 92 p.
TABLES 11-25
fi~4 777 --fi3- - 5
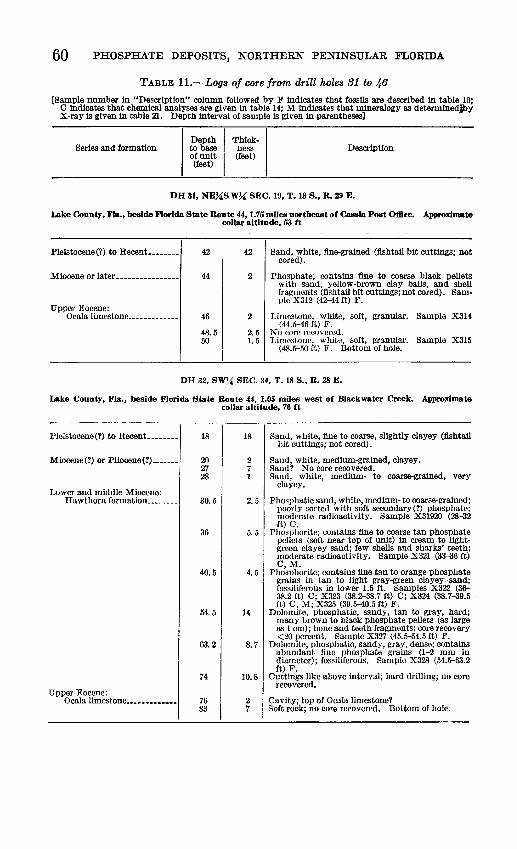
60 PHOSPHATE DEPOSITS, NORTHERN PENINSULAR FLORIDA
TABLE 11.-Logs of core from drill holes 31 to 4-6
[Sample number in "Description" column followed by F indicates that fossils are described in table 10; C indicates that chemical analyses are given in table 14; M indicates that mineralogy as determinedjby X-ray is given in table 21. Depth interval of sample is given in parentheses]
Depth Thick-Series and formation to base ness Description
of unit (feet) (feet)
DH 31, NEUS WU SEC. 19, T. 18 S., R. 29 E.
Lake County, Fla., beside Florida State Route 44, 1.75 miles northeast of Cassia Post Office. Approximate collar altitude, 53 ft
Pleistocene(?) to Recent. _______ 42 42 Sand, white, fine-grained (fishtail bit cuttings; not cored).
Miocene or later_--------------- 44 2 Phosphate; contains fine to coarse black pellets with sand, yellow-brown clay balls, and shell fragments (fishtail bit cuttings; not cored). Sam-ple X312 (42-44ft) F.
Upper Eocene: Ocala limestone _____________ 46 2 Limestone, white,
(44.5-46 ft) F. soft, granular. Sample X314
48.5 2. 5 No core recovered. 50 1.5 Limestone, white, soft, granular. Sample X315
(48.5--50 ft) F. Bottom of hole.
DH 32, SWU SEC. 34, T. 18 S., R. 28 E.
Lake County, Fla., beside Florida State Route 44, 1.05 miles west of Blackwater Creek. Approximate collar altitude, 76 ft
Pleistocene(?) to Recent_ ______ _
Miocene(?) or Pliocene(?) ______ _
Lower and middle Miocene: Hawthorn formation _______ _
Upper Eocene: Ocala limestone ____________ _
18
20 27 28
30.5
36
40.5
54.5
63.2
74
76 83
18 Sand, white, fine to coarse, slightly clayey (fishtail bit cuttings; not cored).
2 Sand, white, medium-grained, clayey. 7 Sand? No core recovered. 1 Sand, white, medium- to coarse-grained, very
clayey.
2. 5 Phosphatic sand, white, medium- to coarse-grained; poorly sorted with soft secondary(?) phosphate; moderate radioactivity. Sample X31920 (28-32 ft) c.
5. 5 Phosphorite; contains fine to coarse tan phosphate pellets (soft near top of unit) in cream to lightgreen clayey sand; few shells and sharks' teeth; moderate radioactivity. Sample X321 (33-36 ft) C,M.
4. 5 Phosphorite; contains fine tan to orange phosphate grains in tan to light gray-green clayey sand; fossiliferous in lower 1.5 ft. Samples X322 (36--38.2 ft) C; X323 (38.2--38.7 ft) C; X324 (38.7-39.5 ft) C, M; X325 (39.5-40.5 ft) F.
14 Dolomite, phosphatic, sandy, tan to gray, hard; many browu to black phosphate pellets (as large as 1 em); bone and teeth fragments; core recovery <20 percent. Sample X327 (45.5--54.5 !t) F.
8. 7 Dolomite, phosphatic, sandy, gray, dense; contains abundant fine phosphate grains (1-2 mm in diameter); fossiliferous. Sample X328 (54.5--63.2 ft) F.
10. 8 Cuttings like above interval; hard drilling; no core recovered.
2 Cavity; top of Ocala limestone? 7 Soft rock; no core recovered. Bottom of hole.
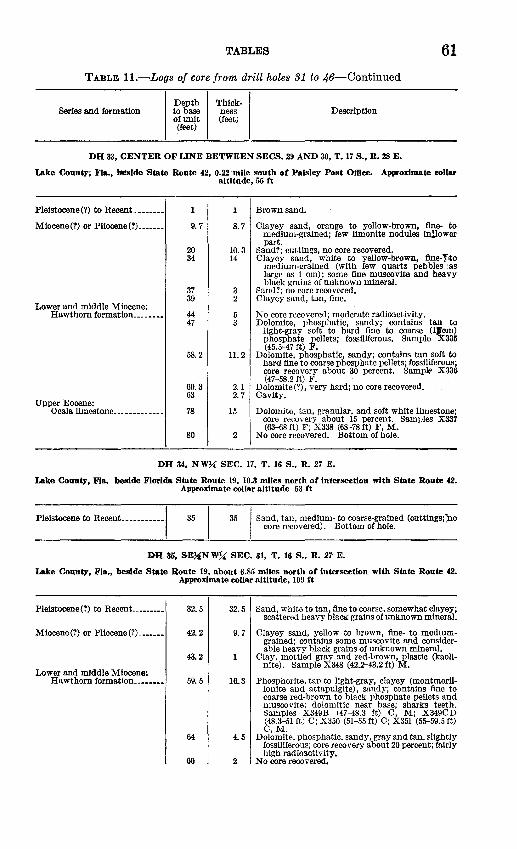
TABLES 61 TABLE 11.-Logs of core from drill holes 31 to 46-Continued
Series and formation Depth to base of unit (feet)
Thickness (feet)
Description
DH 33, CENTER OF LINE BETWEEN SECS. 29 AND 30, T. 17 S., R. 28 E.
Lake County; Fla., liEside Smte Route 42, 0.22 mile south of Paisley Post Office. Approximate eollar altitude, 55 ft
Pleistocene(?) to Recent.-------
Miocene(?) or Pliocene(?) ______ _
Lower and middle Miocene: Hawthorn formation _______ _
Upper Eocene: Ocala limestone ____________ _
9. 7
20 34
37 39
44 47
58.2
60.3 63
78
so
8. 7
10.3 14
3 2
5 3
11.2
2.1 2. 7
15
2
Brown sand.
Clayey sand, orange to yellow-brown, fine- to medium-grained; few limonite nodules inllower part.
Sand?; cuttings, no core recovered. Clayey sand, white to yellow-brown, fine-J;to
medium-grained (with few quartz pebbles 'as large as 1 em); some fine muscovite and heavy black grains of unknown mineral.
Sand?; no core recovered. Clayey sand, tan, fine.
No core recovered; moderate radioactivity. Dolomite, phosphatic, sandy; contains tan to
light-gray soft to hard fine to coarse (lJ'cm) phosphate pellets; fossiliferous. Sample X335 (45.5-47 ft) F.
Dolomite, phosphatic, sandy; contains tan soft to hard fine to coarse phosphate pellets; fossiliferous; core recovery about 30 percent. Samplf' X336 (47-58.2 ft) F.
Dolomite(?), very hard; no core recovered, Cavity.
Dolomite, tan, granular, and soft white limestone;
I core recovery about 15 percent. Samples X337 (63--68 ft) F; X338 (68-78 ft) F, M.
No core recovered. Bottom of hole.
DH 34, NW~ SEC. 17, T. 16 S., R. 27 E.
Lake County, Fla. beside Florida State Route 19, 10.3 miles north of intersection with State Route 42.
Ple"tocene to Rooon'-----------1
Approximate collar altitude 53ft
35 35
I Sand, tan, medium- to coarse-grained (cuttings;)lo
core recovered). Bottom of hole.
DH 35, SE~N w_u SEC. 31, T. 18 S., R. 2'7 E.
Lake County, Fla., beside State Route 19, about 6.85 miles north of intersection with State Route 42. Approximate collar altitude, 109 rt
Pleistocene(?) to Recent _________ 32.5 32.5 Sand, white to tan, fine to coarse, somewhat clayey; scattered heavy black grains of unknown mineral.
Miocene(?) or Pliocene(?)------- 42.2 9. 7 Clayey sand, yellow to brown, fine- to medium-grained; contains some muscovite and consider-able heavy black grains of unknown mineral.
43.2
Lower and middle Miocene:
Clay, mottled gray and red-brown, plastic (kaoli-nite). Sample X348 (42.2--43.2 ft) M.
Hawthorn formation ________ 59.5 16.3 Phosphorite, tan to light-gray, clayey (montmoril-lonite and attapulgite), sandy; contains fine to coarse red-brown to black phosphate pellets and muscovite; dolomitic near base; sharks teeth. Samples X349B (47-48.3 ft) C, M; X349CD (48.3-51 ft) C; X350 (51-55ft) C; X351 (55-59.5 ft)
64 4.5 C,M.
Dolomite, phosphatic, sandy, gray and tan, slightly fossiliferous; core recovery about 20 percent; fairly
66 2 high radioactivity.
No core recovered,
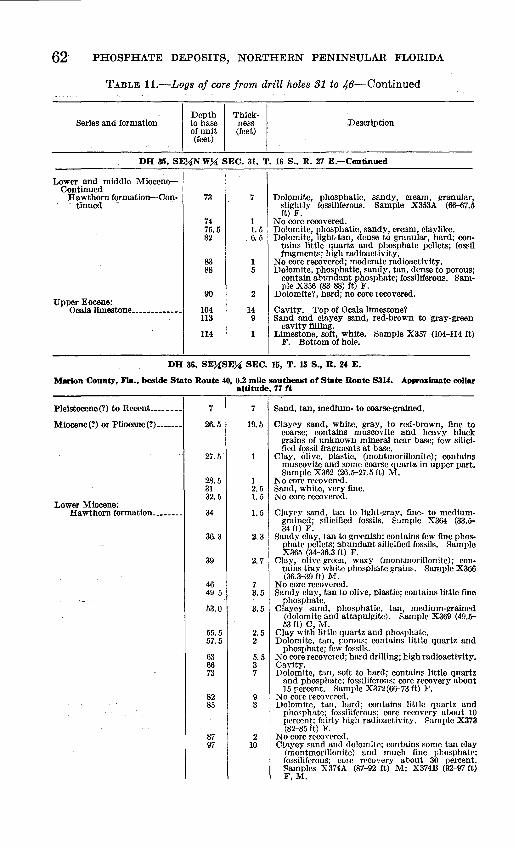
62 PHOSPHATE DEPOSITS, NORTHERN PENINSULAR FLORIDA
TABLE 11.-Logs of core from drill holes 31 to 46-Continued
Depth Thick-Series and formation to base ness Description
of unit (feet) (feet)
.
DH 35, SE~NW~ SEC. 31, T. 16 S., R. 2:1 E.-Continued
Lower and middle MioceneContinued
Hawthorn formation-Con-.- tinned - ·
Upper Eocene: Ocala limestone ____________ _
73
74 75.5 82
83 88
90
104 113
114
Dolomite, phosphatic, sandy, cream, granular, slightly fossiliferous. Sample X353A (66-67.5 ft) F.
1 No core recovered. 1. 5 Dolomite, phosphatic, sandy, cream, claylike. 6. 5 Dolomite, light-tan, dense to granular, hard; con
tains little quartz and phosphate pellets; fossil fragments; high radioactivity.
1 No core recovered; moderate radioactivity. 5 Dolomite, phosphatic, sandy, tan, dense to porous;
contain abundant phosphate; fossiliferous. Sample X356 (83-88) ft) F.
2 Dolomite?, hard; no core recovered.
14 Cavity. Top of Ocala limestone? 9 Sand and clayey sand, red-brown to gray-green
cavity filling. Limestone, soft, white. Sample X357 (104-114 ft)
F. Bottom of holP.
DH 36, SE~SE~ SEC. 15, T. 15 S., R. 24 E.
Marion County, Fla., beside State Route 40, 0.2 mile southeast or State Route S314. Approximate collar altitude, 77 rt
Pleistocene(?) to Recent ____ ----
Miocene(?) or Pliocene(?) ______ _
Lower Miocene: Hawthorn formation _______ _
7
26.5
27.5
28.5 31 32.5
34
36.3
39
46 49.5
53.0
55.5 57.5
63 66 73
82 85
87 97
7 Sand, tan, medium- to coarse-grained.
19. b Clayey sand, white, gray, to red-brown, fine to coarse; contains muscovite and heavy black grains of unknown mineral near base; few silicified fossil fragments at base.
Clay, olive, plastic, (montmorillonite); contains muscovite and some coarse quartz in upper part. Sample X362 (26.~27.5 ft) M.
1 No core recovered. · 2. 5 Sand, white, very fine. 1. 5 No core recovered.
1. 5 Clayey sand, tan to light-gray, fine- to mediumgrained; silicified fossils. Sample X364 (33.~ 34ft) F.
2. 3 Sandy clay, tan to greenish; contains few fine phosphate pellets; abundant silicified fossils. Sample X365 (34-36.3 ft) F.
2. 7 Clay, olive-green, waxy (montmorillonite); contains tiny white phosphate grains. Sample X366 (36.3-39 ft) M.
7 No core recovered. 3. 5 Sandy clay, tan to olive, plastic; contains little fine
phosphate. 3. 5 Clayey sand, phosphatic, tan, medium-grained
(dolomite and attapulgite). Sample X369 (49.~ 53ft) C, M.
2. 5 Clay with little quartz and phosphate. 2 Dolomite, tan, rorous; contains little quartz and
phosphate; few fossils. 5. 5 No core recovered; hard drilling; high radioactivity. 3 Cavity. 7 Dolomite, tan, soft to hard; contains little quartz
and phosphate; fossiliferous; core recovery about 15 percent. Sample X372(66-73 ft) F.
9 No core recovered. 3 Dolomite, tan, hard; contains little quartz and
phosphate; fossiliferous; core recovery about 10 percent; fairly high radioactivity. Sample X373 (82-85 ft) F.
2 No core recovered. 10 Clayey sand and dolomite; contains some tan clay
(montmorillonite) and much fine phosphate; fossiliferous; cme recovery about 30 percent. 'Samples X374A (87-92 ft) M; X374B (92-97 ft) F,M.
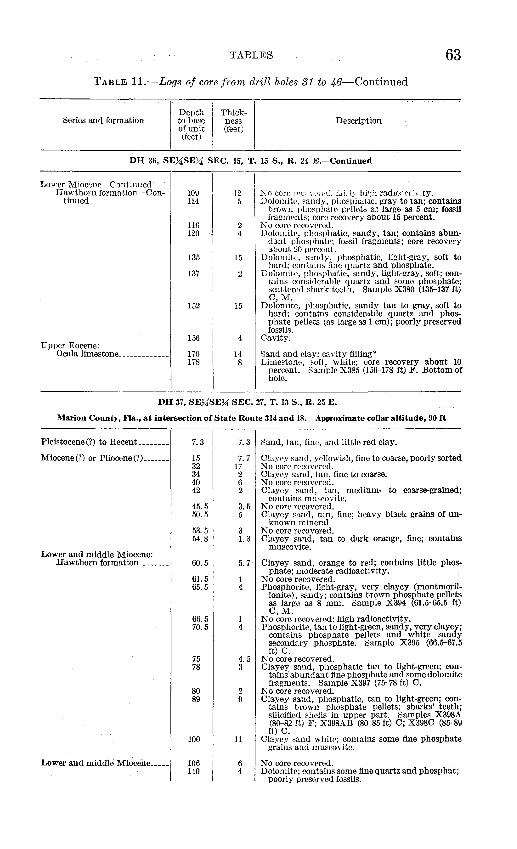
TABLES 63
TABLE 11.-Logs of core from drill holes 31 to 46-Continued
Series and formation Depth to base of unit (feet)
Thickness (feet)
Description
DH 36, SE?iSE?i SEC. 15, T. 15 S., R. 24 E.-Continued
Lower MiOCI~lH'-Continued Hawthorn formation-Con
tinued
Upper Eocene: Ocala limestone ____________ _
10!) 114
116 120
135
137
152
156
170 178
12 5
2 4
15
2
15
14 8
Ko core !'\'c'Cl\'l·red; tc~i: !~ hi·~'l radw:H·t:l-:ty. Dolomite, sandy, phosphutw. gray to tan; contains
brown phosphate pellets a~~ large as 5 em; fossil fragments; core recovery about 15 percent.
No core recovered. Dolomite, phosphatic, sandy, tan; contains abun
dant phosphate; fossil fragments; core recovery about 20 percent.
Dolomite, sandy, phosphatic, light-gray, soft to hard; contains fine quartz and phosphate.
Dolomite, phosphatic, sandy, light-gray, soft; contains considerable quartz and some phosphate; scattered shark teeth. Sample X380 (135-137 ft) C,M.
Dolomite, phosphatic, sandy tan to gray, soft to hard; contains considerable quartz and phosphate pellets (as large as 1 em); poorly preserved fossils.
Cavity.
Sand and clay; cavity filling? Limestone, soft, white; core recovery about 10
percent. Sample X385 (156-178 ft) F. Bottom of hole.
DH 37, SE?iSE?i SEC. 27, T. 13 S., R. 25 E.
Marion County, Fla., at intersection of State Route 314 and 18. Approximate collar altitude, 90ft
Pleistocene(?) to Recent_ ______ _
Miocene(?) or Pliocene(?) ______ _
Lower and middle Miocene: Hawthorn formation _______ _
Lower and middle Miocene ____ _
7.3
15 32 34 40 42
45.5 50.5
53.5 54.8
60.5
61.5 65.5
66.5 70.5
75 78
80 89
100
106 110
7. 3 Sand, tan, fine, and little red clay.
7. 7 Clayey sand, yellowish, fine to coarse, poorly sorted 17 No core re.covered. 2 Clayey sand, tan, fine to coarse. 6 No core recovered. 2 Clayey sand, tan, medium- to coarse-grained;
contains muscovite. 3. 5 No core recovered. 5 Clayey sand, tan, fine; heavy black grains of un-
known mineral. 3 No core recovered. 1. 3 Clayey sand, tan to dark orange, fine; contains
muscovite.
5. 7 · Clayey sand, orange to red; contains little phosphate; moderate radioactivity.
1 No core recovered. 4 Phosphorite, light-gray, very clayey (montmoril-
lonite), sandy; contains brown phosphate pellets as large as 8 mm. Sample X394 (61.5-65.5 ft) c, ]\-'[.
1 No core recovered; high radioactivity. 4 Phosphorite, tan to light-green, sandy, very clayey;
contains phosphate pellets and white sandy secondary phosphate. Sample X395 (66.5-67.5 ft) c.
4. 5 No core recovered. 3 Clayey sand, phosphatic tan to light-green; con-
tains abundant fine phosphate and some dolomite fragments. Sample X397 (75-78 ft) C.
2 No core recovered. 9 Clayey sand, phosphatic, tan to light-green; con-
tains brown phosphate pellets; sharks' teeth; silicified shells in upper part. Samples X398A (80-82 ft) F; X398AB (80-85 ft) C; X398C (85-89 ft) c.
11 Clayey sand white; contains some fine phosphate grains and muscovite.
6 No core recovered. 4 Dolomite; contains some fine quartz and phosphat;
poorly preserve<;l. fossils.
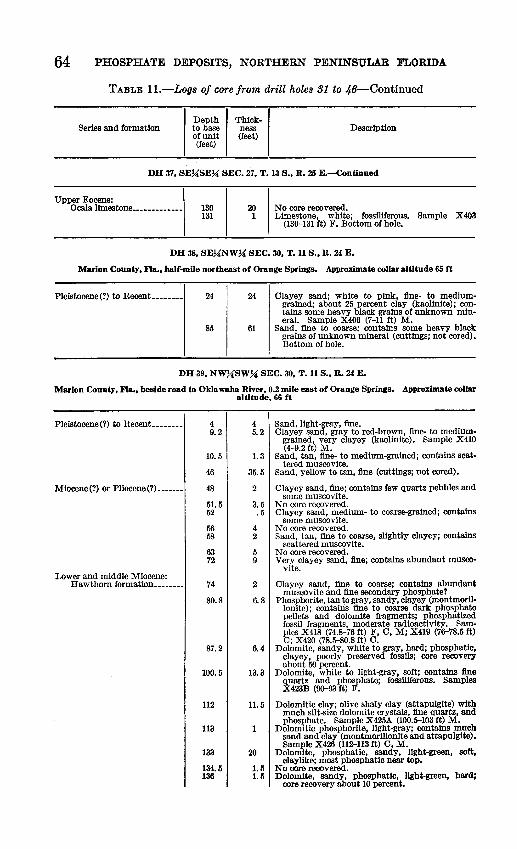
64 PHOSPHATE DEPOSITS, NORTHERN PENINSULAR FLORIDA
TABLE 11.-Logs of core from drill holes 31 to 46-Continued
Series and formation Depth Thick-to base ness Description of unit (feet) (feet)
DH 37, SE~SEU SEC. 27, T. 13 S., R. 25 E.-Continued
Upper Eocene: Ocala limestone ____________ _ 130
131 20 1
No core recovered. Limestone, white; fossiliferous. Sample X403
(130-131 ft) F. Bottom of hole.
DH 38, SE~NWU SEC. 30, T. 11 S., R. 24 E.
Marion County, Fla., half-mile northeast of Orange Springs. Approximate collar altitude 65ft
Pleistocene(?) to Recent •••••••• 24 24
85 61
Clayey sand; white to pink, fine- to mediumgrained; about 25 percent clay (kaolinite); contains some heavy black grains of unknown mineral. Sample X406 (7-11 ft) M.
Sand, fine to coarse; contains some heavy black grains of unknown mineral (cuttings; not cored). Bottom of hole.
DH 39, NWUSW~ SEC. 30, T. 11 S., R. 24 E.
Marion County, Fla., beside road to Oklawaha River, 0.2 mile east of Orange Springs. Approximate collar altitude, 66 ft
Pleistocene(?) to Recent. ______ _ 4 4 Sand, light-gray, fine. 9.2 5.2 Clayey sand, gray to red-brown, fine- to medium-
grained, very clayey (kaolinite). Sample X410 (4-9.2 ft) M.
10.5 1.3 Sand, tan, fine- to medium-grained; contains scat-tered muscovite.
46 35.5 Sand, yellow to tan, fine (cuttings; not cored).
Miocene(?) or Pliocene(?) ______ _ 48 2 Clayey sand, fine; contains few quartz pebbles and some muscovite.
51.5 3.5 No core recovered. 52 .5 Clayey sand, medium- to coarse-grained; contains
some muscovite. 56 4 No core recovered. 58 2 Sand, tan, fine to coarse, slightly clayey; contains
scattered muscovite. 63 5 No core recovered. 72 9 Very clayey sand, fine; contains abundant musco-
vite. Lower and middle Miocene:
Hawthorn formation _______ _ 74 2 Clayey sand, fine to coarse; contains abundant muscovite and fine secondary phosphate?
80.8 6.8 Phosphorite, tan to gray, sandy, clayey (montmoril-Ionite); contains fine to coarse dark phosphate pellets and dolomite fragments; phosphatized fossil fragments, moderate radioactivity. Sam-pies X418 (74.8-76 ft) F, C, M; X419 (76-78.5 ft) C; X420 (78.5-80.8 ft) C.
87.2 6.4 Dolomite, sandy, white to gray, hard; phosphatic, clayey, poorly preserved fossils; core recovery about 50 percent.
100.5 13.3 Dolomite, white to light-gray, soft; contains fine quartz and phosphate; fossiliferous. Samples X423B (90-93 ft) F.
112 11.5 Dolomitic clay; olive shaly clay (attapulgite) with much silt-size dolomite crystals, fine quartz, and phosphate. Sample X425A (100.5-103 ft) M.
113 Dolomitic phosphorite, light-gray; contains much sand and clay (montmorillonite and attapulgite). Sample X426 (112-113 ft) C, M.
133 20 Dolomite, phosphatic, sandy, light-green, soft, clay like; most phosphatic near top.
134.5 1.5 No core recovered. 136 1.5 Dolomite, sandy, phosphatic, light-green, hard;
core recovery about 10 percent.
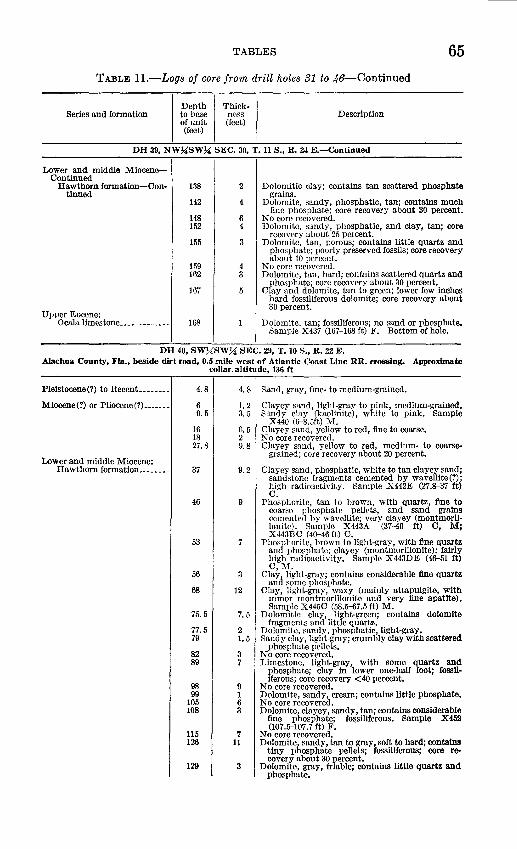
TABLES 65
TABLE 11.-Logs of core from drill holes 31 to 46-Continued
Series and formation Depth to base of unit (feet)
Thickness (feet)
Description
DH 39, NWUSWU SEC. 30, T. 11 S., R. 24 E.-Continued
Lower and middle MioceneContinued
Hawthorn formation-Continued
Upper Eocene: Ocala limestone ____________ _
138
142
148 152
155
159 162
167
168
2
4
6 4
4 3
Dolomitic clay; contains tan scattered phosphate grains.
Dolomite, sandy, phosphatic, tan; contains much fine phosphate; core recovery about 30 percent.
No core recovered. Dolomite, sandy, phosphatic, and clay, tan; core
recovery about 25 percent. Dolomite, tan, porous; contains little quartz and
phosphate; poorly preserved fossils; core recovery about 10 percent.
No core recovered. Dolomite, tan, hard; contains scattered quartz and
phosphate; core recovery about 30 percent. Clay and dolomite, tan to green; lower few inches
hard fossiliferous dolomite; core recovery about 30 percent.
Dolomite, tan; fossiliferous; no sand or phosphate. Sample X437 (167-168 ft) F. Bottom of hole.
DH 40, SW~SWU SEC. 29, T. 10 S., R. 22 E. Alachua County, Fla., beside dirt road, 0.5 mile west of Atlantic Coast Line RR. crossing. Approximate
collar. altitude, 136 ft
Pleistocene(?) to Recent. .•.•...
Miocene(?) or Pliocene(?) .. ____ _
Lower and middle Miocene: Hawthorn formation _______ _
4.8
6 9. 5
16 18 27.8
37
46
53
56
68
75.5
77.5 79
82 89
98 99
105 108
115 126
129
4.8
1.2 3. 5
6.5 2 9.8
9.2
9
7
3
12
7.5
2 1.5
3 7
9 1 6 3
7 11
3
Sand, gray, fine- to medium-grained.
Clayey sand, light-gray to pink, medium-grained. Sandy clay (kaolinite), white to pink. Sample
X440 (&-8.5ft) M. Clayey sand, yellow to red, fine to coarse. No core recovered. Clayey sand, yellow to red, medium- to coarse
grained; core recovery about 20 percent.
Clayey sand, phosphatic, white to tan clayey sand; sandstone fragments cemented by wavellite (?); high radioactivity. Sample X442E (27.8-37 ft) c.
Phosphorite, tan to brown, with quartz, fine to coarse phosphate pellets, and sand grains cemented by wavellite; very clayey (montmorillonite). Sample X443A (37--40 ft) C, M; X443BC (40--46 ft) C.
Phosphorite, brown to light-gray, with fine quartz and phosphate; clayey (montmorillonite); fairly high radioactivity. Sample X443DE (4&--51 ft) C,M.
Clay, light-gray; contains considerable fine quartz and some phosphate.
Clay, light-gray, waxy (mainly attapulgite, with minor montmorillonite and very fine apatite). Sample X445C (58.5-67.5 ft) M.
Dolomitic clay, light-green; contains dolomite fragments and little quartz.
Dolomite, sandy, phosphatic, light-gray. Sandy clay, light-gray; crumbly clay with scattered
phosphate pellets. No core recovered. Limestone, light-gray, with some quartz and
phosphate; clay in lower one-half foot; fossiliferous; core recovery <40 percent.
No core recovered. Dolomite, sandy, cream; contains little phosphate. No core recovered. Dolomite, clayey, sandy, tan; contains considerable
fine phosphate; fossiliferous. Sample X452 (107.5-107.7 ft) F.
No core recovered. Dolomite, sandy, tan to gray, soft to bard; contains
tiny phosphate pellets; fossiliferous; core recovery about 30 percent.
Dolomite, gray, friable; contains little quartz and phosphate.
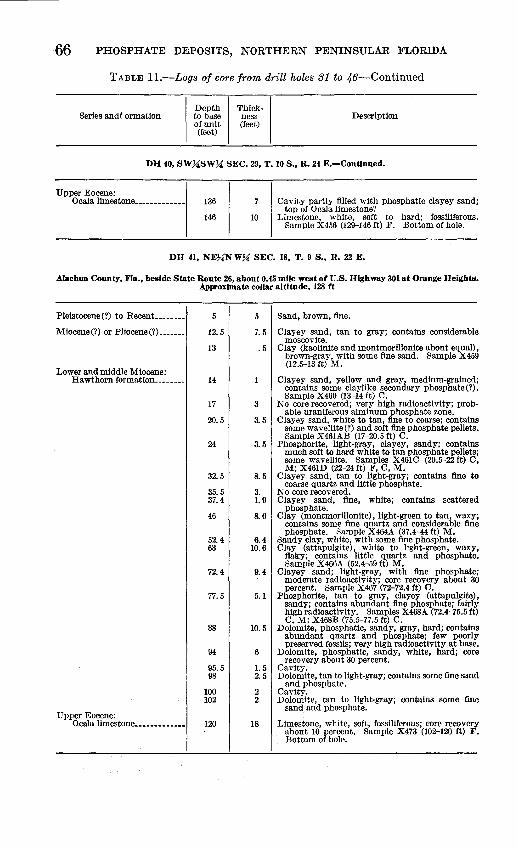
66 PHOSPHATE DEPOSITS, NORTHERN PENINSULAR FLORIDA
TABLE 11.-Logs of core from drill holes 31 to 46-Continued
Series and[ ormation Depth to base of unit (feet)
Thickness (feet)
Description
DH 40, SWUSWU SEC. 29, T. 10 S., R. 24 E.-Continued.
Upper Eocene: Ocala limestone ____________ _ 136
146 10
Cavity partly filled with phosphatic clayey sand; top of Ocala limestone?
Limestone, white, soft to hard; fossiliferons. Sample X456 (129--146 ft) F. Bottom of hole.
DH 41, NEUN WU SEC. 18, T. 9 S •• R. 22 E.
Alachua County, Fla., beside State Route 26, about 0.45 mile west of U.S. Highway 301 at Orange Heights.
Pleistocene(?) to Recent. ______ _
Miocene(?) or Pliocene(?) ______ _
Lower and middle Miocene: Hawthorn formation _______ _
Upper Eocene: Ocala limestone ____________ _
Approximate collar altitude, 128 ft
12.5
13
14
17
20.5
24
32.5
35.5 37.4
46
52.4 63
72.4
77.5
88
94
95.5 98
100 102
120
Sand, brown, fine.
7. 5 Clayey sand, tan to gray; contains considerable moscovite .
• 5 Clay (kaolinite and montmorillonite about equal), brown-gray, with some fine sand. Sample X459 (12.5--13 ft) M.
Clayey sand, yellow and gray, medium-grained; contains some claylike secondary phosphate(?). Sample X460 (13-14 ft) C.
3 No core recovered; very high radioactivity; prob· able uraniferous alminum phosphate zone.
3. 5 Clayey sand, white to tan, fine to coarse; contains some wavelllte(?) and soft fine phosphate pellets. Sample X461AB (17-20.5 ft) C.
3. 5 Phosphorite, light-gray, clayey, sandy; contains much soft to hard white to tan phosphate pellets; some wavellite. Samples X461C (20.5--22 ft) C, M; X461D (22-24 ft) F, C, M.
8. 5 Clayey sand, tan to light-gray; contains fine to coarse quartz and little phosphate.
3. No core recovered. 1. 9 Clayey sand, fine, white; contains scattered
phosphate. 8. 6 Clay (montmorillonite), light-green to tan, waxy;
contains some fine quartz and considerable fine phosphate. Sample X464A (37.4-44 ft) M.
6. 4 Sandy clay, white, with some fine phosphate. 10. 6 Clay (attapulgite), white to light-green, waxy,
flaky; contains little quartz and phosphate. Sample X466A (52.4-59 ft) M.
9. 4 Clayey sand; light-gray, with fine phosphate; moderate radioactivity; core recovery about 30 percent. Sample X467 (72-72.4 ft) C.
5.1 Phosphorite, tan to gray, clayey (attapulgite), sandy; contains abundant fine phosphate; fairly high radioactivity. Samples X 468A (72.4-75.5 ft) C, M; X468B (75.5--77.5 ft) C.
10. 5 Dolomite, phosphatic, sandy, gray, hard; contains ablli).dant quartz and phosphate; few poorly preserved fossils; very high radioactivity at base.
6 Dolomite, phosphatic, sandy, white, hard; core recovery about 30 percent.
1.5 Cavity. 2. 5 Dolomite, tan to light-gray; contains some fine sand
and phosphate. 2 Cavity. 2 Dolomite, tan to light-gray; contains some fine
sand and phosphate.
18 Limestone, white, soft, fossiliferons; core recovery about 10 percent. Sample X473 (102-120 ft) F. Bottom of hole.
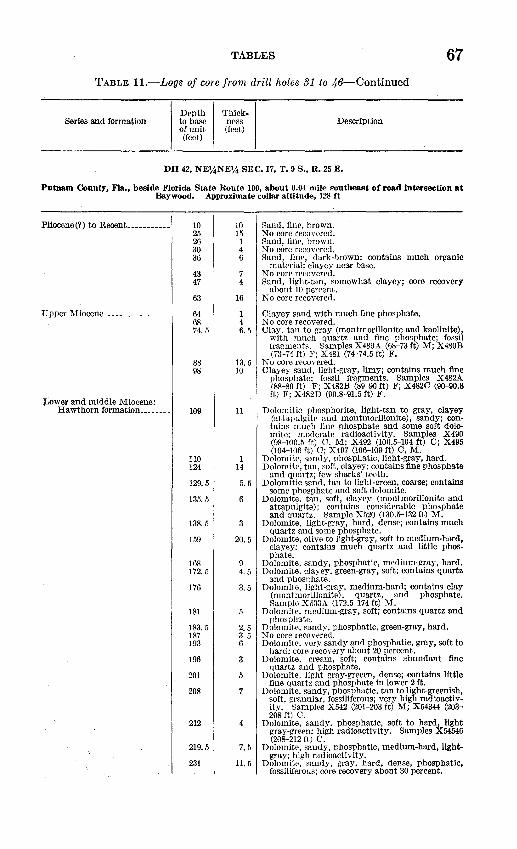
TABLES 67
TABLE 11.-Logs of core frorn drill holes 31 to 46-Continued
Series and formation Depth to base of unit (feet)
Thickness (feet)
Description
DH 42, NE~NE~ SEC. 17, T. 9 S., R. 25 E.
Putnam County, Fla., beside Florida State Route 100, about 0.04 mile southeast of road intersection at Baywood. Approximate collar altitude, 128 ft
Pliocene(?) to Recent __________ _
Upper Miocene ________________ _
Lower and middle Miocene: Hawthorn formation _______ _
10 25 26 30 36
43 47
63
64 68 74.5
88 98
109
110 124
129.5
135.5
138.5
159
168 172.5
176
181
183.5 187 193
196
201
208
212
219.5
231
10 Sand, fine, brown. 15 No core recovered. 1 Sand, fine, brown. 4 No core recovered. 6 Sand, fine, dark-brown; contains much organic
material; clayey near base. 7 No core recovere,d. 4 Sand, light-tan, somewhat clayey; core recovery
about 10 percent. 16 No core recovered.
1 Clayey sand with much fine phosphate. 4 No core recovered. 6. 5 Clay, tan to gray (montmorillonite and kaolinite),
with much quartz and fine phosphate; fossil fragments. Samples X480A (68-73 ft) M; X480B (73-74 ft) F; X481 (74-74.5 ft) F.
13. 5 No core recovered. 10 Clayey sand, light-gray, limy; contains much fine
phosphate; fossil fragments. Samples X482A (88-89 ft) F; X482B (89-90 ft) F; X482C (9Q-90.8 ft) F; X482D (90.8-91.5 ft) F.
11 Dolomitic phosphorite, light-tan to gray, clayey (attapulgite, and montmorillonite), sandy; contains much fine phosphate and some soft dolomite; moderate radioactivity. Samples X490 (98-100.5 ft) C, M; X492 (100.5-104 ft) C; X495 (104-106 ft) C; X497 (10&-109 ft) C. M.
1 Dolomite, sandy, phosphatic, light-gray, hard. 14 Dolomite, tan, soft, clayey; contains fine phosphate
and quartz; few sharks' teeth. 5. 5 Dolomitic sand, tan to light-green, coarse; contains
some phosphate and soft dolomite. 6 Dolomite, tan, soft, clayey (montmorillonite and
attapulgite); contains considerable phosphate and quartz. Sample X520 (130.5-132 ft) M.
Dolomite, light-gray, hard, dense; contains much quartz and some phosphate.
20. 5 Dolomite, olive to light-gray, soft to medium-hard, clayey; contains much quartz and little phosphate.
9 Dolomite, sandy, phosphatic, medium-gray, hard. 4. 5 Dolomite, clayey, green-gray, soft; contains quartz
and phosphate. 3. 5 Dolomite, light-gray, medium-hard; contains clay
(montmorillonite), quartz, and phosphate. Sample X533A (172.5-174 ft) M.
Dolomite, medium-gray, soft; contains quartz and phosphate.
2. 5 Dolomite, sandy, phosphatic, green-gray, hard. 3. 5 No core recovered. 6 Dolomite, very sandy and phosphatic, gray, soft to
hard; core recovery about 20 percent. 3 Dolomite, cream, soft; contains abundant fine
quartz and phosphate. Dolomite, light gray-greeen, dense; contains little
fine quartz and phosphate in lower 2 ft. Dolomite, sandy, phosphatic, tan to light-greenish,
soft, granular, fossiliferous; very high radioactivity. Samples X542 (201-203 ft) M; X54344 (203-208 ft) c.
4 Dolomite, sandy, phosphatic, soft to hard, light gray-green; high radioactivity. Samples X54546 (208-212 ft) 0.
7. 5 Dolomite, sandy, phosphatic, medium-hard, lightgray; high radioactivity.
11. 5 Dolomite, sandy, gray, hard, dense, phosphatic, fossiliferous; core recovery about 30 percent.
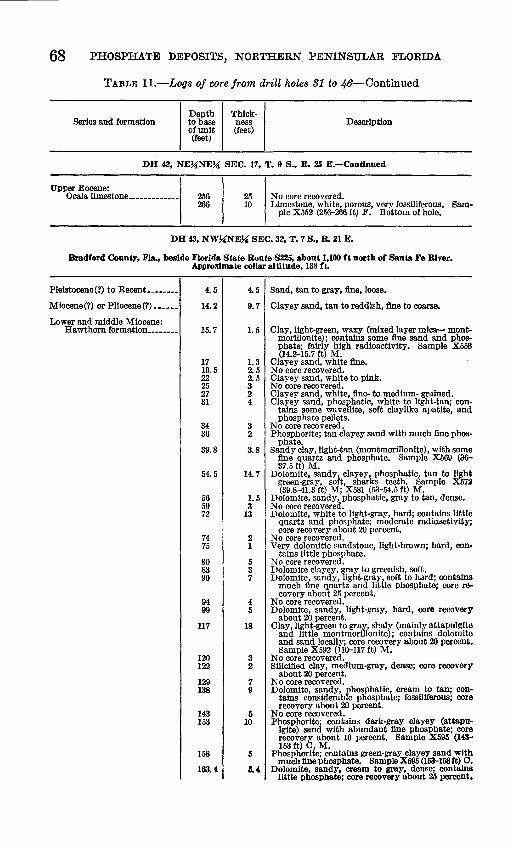
68 PHOSPHATE DEPOSITS, NORTHERN PENINSULAR FLORIDA
TABLE 11.-Logs of core from drill holes 31 to 46-Continued
Series and formation Depth Thick-to base ness Description of unit (feet) (feet)
DH 42, NE~NE~ SEC. 17, T. 9 S., R. 25 E.-Continued
Upper Eocene: Ocala limestone ____________ _ 256 266
25 10
No core recovered. Limestone, white, porous, very fossiliferous. Sam
ple X552 (256-266 ft) F. Bottom of hole.
DH 43, NWUNEU SEC. 32, T. 1 S., R. 21 E.
Bradford County, Fla., beside Florida State Route S225, about 1,100 ft north of Santa Fe River. Approximate eollar altitude, 138ft.
Pleistocene(?) to Recent •.•••••• 4.5 4.5 Sand, tan to gray, fine, loose.
Miocene(?) or Pliocene(?) •••••• 14.2 9. 7 Clayey sand, tan to reddish, fine to coarse.
Lower and middle Miocene: Hawthorn formation ________ 15.7 1. 5 Clay, light-green, waxy (mixed layer mica- mont-
morillonite); contains some fine sand and phos-phate; fairly high radioactivity. Sample X558 (14.2-15.7 ft) M.
17 1.3 Clayey sand, white fine. 19.5 2. 5 No core recovered. 22 2.5 Clayey sand, white to pink. 25 3 No core recovered. 27 2 Clayey sand, white, fine- to medium- grained. 31 4 Clayey sand, phosphatic, white to light-tan; con-
tains some wavellite, soft claylike apatite, and phosphate pellets.
34 3 No core recovered. 36 2 Phosphorite; tan clayey sand with much fine phos-
phate. 39.8 3.8 Sandy clay, light-tan (montmorillonite), with some
fine quartz and phosphate. Sample X569 (36-37.5 ft) M.
54.5 14.7 Dolomite, sandy, clayey, phosphatic, tan to light green-gray, soft, sharks teeth. Sample X572 (39.8-41.3 ft) M; X581 (53-54.5 ft) M.
56 1. 5 Dolomite, sandy, phosphatic, gray to tan, dense. 59 3 No core recovered. 72 13 Dolomite, white to light-gray, hard; contains little
quartz and phosphate; moderate radioactivity; core recovery about 20 percent.
74 2 No core recovered. 75 1 Very dolomitic sandstone, light-brown; hard, con-
tains little phosphate. 80 5 No core recovered. 83 3 Dolomite clayey, gray to greenish, soft. 90 7 Dolomite, sandy, light-gray, soft to hard; contains
much fine quartz and little phosphate; core re-
94 4 covary about 25 percent.
No core recovered. 99 5 Dolomite, sandy, light-gray, hard, core recovery
about 20 percent. 117 18 Clay, light-green to gray, shaly (mainly attapulgite
and little montmorillonite); contains dolomite and sand locally; core recovery about 20 percent.
120 3 Sample X592 (110-117 ft) M.
No core recovered. 122 2 Silicified clay, medium-gray, dense; core recovery
about 20 percent. 129 7 No core recovered. 138 9 Dolomite, sandy, phosphatic, cream to tan; con-
tains considerable phosphate; fossiliferous; core recovery about 20 percent.
143 5 No core recovered. 153 10 Phosphorite; contains dark-gray clayey (attapu-
lgite) sand with abundant fine phosphate; core recovery about 10 percent. Sample X595 (1~3-153ft) C, M.
158 ll Phosphorite; contains green-gray clayey sand with much fine phosphate. Sample X595 (153-158ft) 0.
163.4 s.~ Dolomite, sandy, cream to gray, dense; contains little phosphate; core recovery about 25 percent.
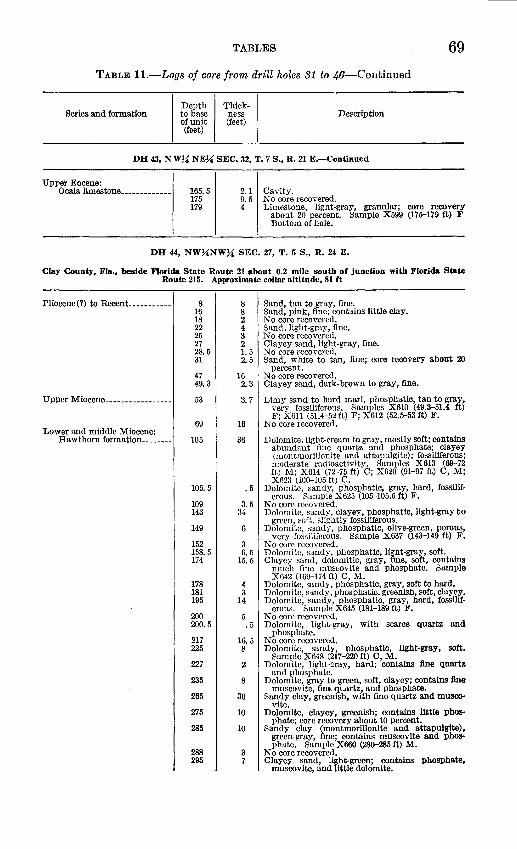
TABLES 69
TABLE 11.-Logs of core from drill holes 31 to 4-6-Couliinued
Depth Thick-Series and formation to base ness Description
of unit (feet) (feet)
DH 43, N WU NEU SEC. 32, T. 7 S., R. 21 E.-Continued
Upper Eocene: Ocala limestone ____________ _ 165.5
175 179
2.1 Cavity. 9. 5 No core_recovered. 4 Limestone, light-gray, granular; core recovery
about 20 percent. Sample X599 (175-179 ft) F Bottom of hole.
DH 44, NW%'NWU SEC. 27, T. 5 S., R. 24 E.
Clay County, Fla., beside Florida State Route 21 about 0.2 mile south of junction with Florida State Route 215. Approximate collar altitude, 81 ft
Pliocene(?) to Recent •••••...•..
Upper Miocene ________________ _
Lower and middle Miocene: Hawthorn formation _______ _
8 16 18 22 25 27 28.5 31
47 49.3
53
69
105
105.5
109 143
149
152 158.5 174
178 181 195
200 200.5
217 225
227
235
265
275
285
288 295
8 8 2 4 3 2 1.5 2.5
16 2.3
3. 7
16
36
• 5
3.5 34
6
3 6.5
15.5
4 3
14
5 .5
16.5 8
2
8
30
10
10
3 7
Sand, tan to gray, fine. Sand, pink, fine; contains little clay. No core recovered. Sand, light-gray, fine. No core recovered. Clayey sand, light-gray, fine. No core recovered. Sand, white to tan, fine; core recovery about 20
percent. No core recovered. Clayey sand, dark-brown to gray, fine.
Limy sand to hard marl, phosphatic, tan to gray, very fossiliferous. Samples X610 (49.3-51.4 ft) F; X611 (51.4-52 ft) F; X612 (52.5-53 ft) F.
No core recovered.
Dolomite, light-cream to gray, mostly soft; contains abundant fine quartz and phosphate; clayey (montmorillonite and attapulgite); fossiliferous; moderate radioactivity. Samples X613 (69-72 ft) M; X614 (72-75 ft) C; X620 (91-97 ft) C, M; X623 (100-105 ft) C.
Dolomite, sandy, phosphatic, gray, hard, fossiliferous. Sample X625 (105-105.5 ft) F.
No core recovered. Dolomite, sandy, clayey, phosphatic, light-gray to
green, soft, slightly fossiliferous. Dolomite, sandy, phosphatic, olive-green, poroUB,
very fossiliferous. Sample X637 (143-149 ft) F. No core recovered. Dolomite, sandy, phosphatic, light-gray, soft. Clayey sand, dolomitic, gray, fine, soft, contains
much fine muscovite and phosphate. Sample X642 (169-174 ft) C, M.
Dolomite, sandy, phosphatic, gray, soft to hard. Dolomite, sandy, phosphatic, greenish, soft, clayey. Dolomite, sandy, phosphatic, gray, hard, fossilif-
erous. Sample X645 (181-189 ft) F. No core recovered. Dolomite, light-gray, with scarce quartz and
phosphate. No core recovered. Dolomite, sandy, phosphatic, light-gray, soft.
Sample X648 (217-220 ft) C, M. Dolomite, light-gray, hard; contains fine quartz
and phosphate. Dolomite, gray to green, soft, clayey; contains fine
muscovite, fin~ qwu-tz, and phosphate. Sandy clay, grr;enish, with fine quartz and musco
vite. Dolomite, clayey, greenish; contains little phos
phate; core recovery about 10 percent. Sandy clay (montmorillonite and attapulgite),
green-gray, fine; contains muscovite and phosphate. Sample X660 (280-285 ft) M.
No core recovered. Clayey sand, light-green; contains phosphate,
muscovite, and little dolomite.
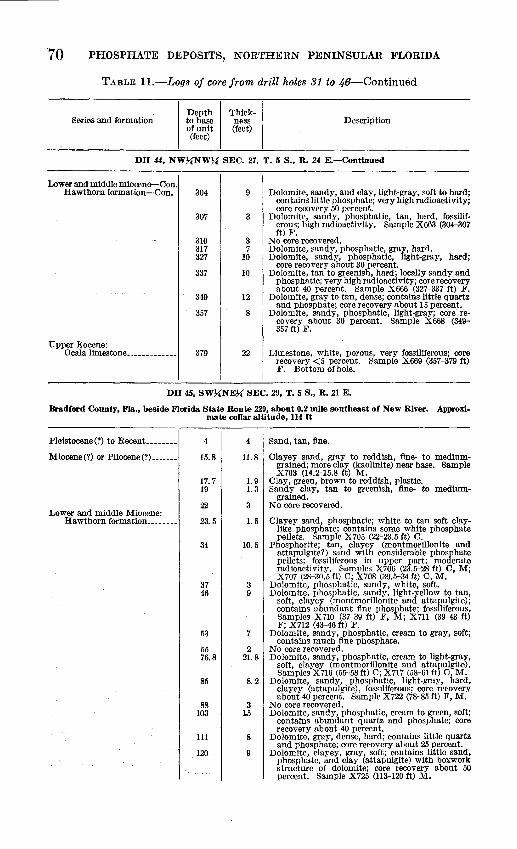
·70 PHOSPHATE DEPOSITS, NORTHERN PENINSULAR FLORIDA
TABLE 11.-Logs of core from drill holes 31 to 46__;Continued
Series and formation Depth to base of unit (feet)
Thicknoss (feet)
Description
DH 44, NW~NW~ SEC. 27, T. 5 S., R. 24 E.-Continued
Lower and middle miocene-Con. Hawthorn formation-Con.
Upper Eocene: Ocala limestone ____________ _
304
307
310 317 327
337
349
357
379
9
3
3 7
10
10
12
8
22
Dolomite, sandy, and clay, light-gray, soft to hard; contains little phosphate; very high radioactivity; core recovery 50 percent.
Dolomite, sandy, phosphatic, tan, hard, fossiliferous; high radioactivity. Sample X663 (304-307 ft) F.
No core recovered. Dolomite, sandy, phosphatic, gray, hard. Dolomite, sandy, phosphatic, light-gray, hard;
core recovery about 30 percent. Dolomite, tan to greenish, hard; locally sandy and
phosphatic; very high radioactivity; core recovery about 40 percent. Sample X666 (327-337 ft) F.
Dolomite, gray to tan, dense; contains little quartz and phosphate; core recovery about 15 percent.
Dolomite, sandy, phosphatic, light-gray; core recovery about 30 percent. Sample X668 (349-357ft) F.
Limestone, white, porous, very fossiliferous; core recovery <5 percent. Sample X669 (357-379 ft) F. Bottom of hole.
DH 45, SW~NE~ SEC. 29, T. 5 S., R. 21 E.
Bradford County, Fla., beside Florida State Route 229, about 0.2 mile southeast of New River. Approximate collar altitude, 114 ft
Pleistocene(?) to Recent_ ______ _
Miocene(?) or Pliocene(?) ______ _
Lower and middle Miocene: Hawthorn formation _______ _
4
15.8
17.7 19
22
23.5
34
37 46
53
55 76.8
85
88 103
111
120
4 Sand, tan, fine.
11. 8 Clayey sand, gray to reddish, fine- to mediumgrained; more clay (kaolinite) near base. Sample X703 (14.2-15.8 ft) M.
1. 9 Clay, green, brown to reddish, plastic. 1. 3 Sandy clay, tan to greenish, fine- to medium
grained. 3 No core recovered.
1. 5 Clayey sand, phosphatic; white to tan soft claylike phosphate; contains some white phosphate pellets. Sample X705 (22-23.5 ft) C.
10. 5 Phosphorite; tan, clayey (montmorillonite and attapulgite?) sand with considerable phosphate pellets; fossiliferous in upper part; moderate radioactivity. Samples X706 (23.5--28 ft) C, M; X707 (28-30.5 ft) C; X708 (30.5--34 ft) C, M.
3 Dolomite, phosphatic, sandy, white, soft. 9 Dolomite, phosphatic, sandy, light-yellow to tan,
soft, clayey (montmorillonite and attapulgite); contains abundant fine phosphate; fossiliferous. Samples X710 (37-39 ft) F, M; X711 (39-43 ft) F; X712 (43-46 ft) F.
Dolomite, sandy, phosphatic, cream to gray, soft; contains much fine phosphate.
2 No core recovered. 21. 8 Dolomite, sandy, phosphatic, cream to light-gray,
soft, clayey (montmorillonite and attapulgite). Samples X716 (55--58ft) C; X717 (58-61ft) C, M.
8. 2 Dolomite, sandy, phosphatic, light-gray, hard, clayey (attapulgite), fossiliferous; core recovery about 40 percent. Sample X722 (78-85 ft) F, M.
3 No core recovered. 1.5 Dolomite, sandy, phosphatic, cream to green, soft;
contains abundant quartz and phosphate; core recovery about 40 percent.
8 Dolomite, gray, dense, hard; contains little quartz and phosphate; core recovery about 25 percent.
9 Dolomite, clayey, gray, soft; contains little sand, phosphate, and clay (attapulgite) with boxwork structure of dolomite; core recovery about 50 percent. Sample X725 (113-120 ft) M.
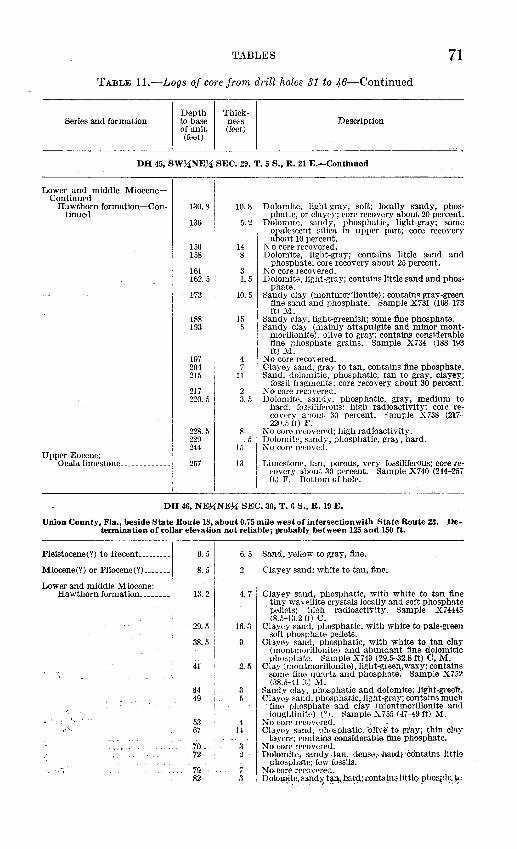
TABLES 71
TABLE 11.-Logs of core from drill holes 31 to 46-Continued
Series and formation Depth to base of unit (feet)
Thickness (feet)
Description
DH 45, SW~NE?i SEC. 29, T. 5 S., R. 21 E.-Continued
Lower and middle MioceneContinued
Hawthorn formation-Continued
Upper Eocene: Ocala limestone ____________ _
130.8
136
150 158
161 162.5
173
188 193
197 204 215
217 220.5
228.5 229 244
257
10.8 Dolomite, light-gray, soft; locally sandy, phosphatic, or clayey; core recovery about 20 percent.
5. 2 Dolomite, sandy, phosphatic, light-gray; some opalescent silica in upper part; core recovery about 10 percent.
14 No core recovered. 8 Dolomite, light-gray; contains little sand and
phosphate; core recovery about 25 percent. 3 No core recovered. 1. 5 Dolomite, light-gray; contains little sand and phos
phate. 10. 5 Sandy clay (montmorillonite); contains gray-green
fine sand and phosphate. Sample X731 (168-173 ft) M.
15 Sandy clay, light-greenish; some fine phosphate. 5 Sandy clay (mainly attapulgite and minor mont-
morillonite), olive to gray; contains considerable fine phosphate grains. Sample X734 (188-193 ft) M.
No core recovered. 7 Clayey sand, gray to tan; contains fine phosphate.
11 Sand, dolomitic, phosphatic; tan to gray, clayey; fossil fragments; core recovery about 30 percent.
2 No core recovered. 3. 5 Dolomite, sandy, phosphatic, gray, medium to
hard, fossiliferous; high radioactivity; core recovery about 30 percent. E'ample X738 (217·· 220.5 ft) F.
8 No core recovered; high radioactivity. . 5 Dolomite, sandy, phosphatic, gray, hard.
15 No core recovetl.
13 Limestone, tan, porous, very fossiliferous; core re-covery about 30 percent. Sample X740 (244-257 ft) F. Bottom of hole.
DH 46, NE~NE~ SEC. 30, T. 6 S., R.19 E.
Union County, Fla., beside State Route 18, about 0.75 mile west of intersection with State Route 23. Determination of collar elevation not reliable; probably between 125 and 150 ft.
Pleistocene(?) to Recent ________ _
Miocene(?) or Pliocene(?) ______ _ 8. 5
Lower and middle Miocene: Hawthorn formation _______ _ 13.2
29.5
38.5
41
44 49
53 67
70. .. 72
,., 7.!} 82
6. 5 Sand, yellow to gray, fine.
2 Clayey sand; white to tan, fine.
4. 7 Clayey sand, phosphatic, with white to tan fine tiny wavellite crystals locally and soft phosphate
· pellets; high radioactivity. Sample X74445 (8.5-13.2 ft) c.
16. 3 Clayey sand, phosphatic, with white to pale-green soft phosphate pellets.
Clayey sand, phosphatic, with white to tan clay (montmorillonite) and abundant fine dolomitic phosphate. Sample X749 (29.5-32.8 ft) C, M.
2. 5 Clay (montmorillonite), light-green, waxy; contains some fine qu1,rtz. and phosphate: Samp:e X752 (38.5-41 ft) M.
Sandy clay, phosphatic and dolomite; light-green. Clayey sand, phosphatic, light-gray; contains much ·fine phosphate. and clay (montmorillonite and loughlinite) ('!). Sample X755 (47-49 ft) .M.
4 No core recovered. . , . ··· 14 Clayey sand, phosphatic, olivil' to gray; thin clay
layers; contains considerable fine phosphate. 3 No core recovered. 2- · Dolomite; sandy. tan, dense,. bar4;-;oontains little
phosphate; few fossils. 7 No core recovered. 3 Dol~:r;n~~~ sg,ndY. t~n,}la~q;co_ntainslittlG phosph~~
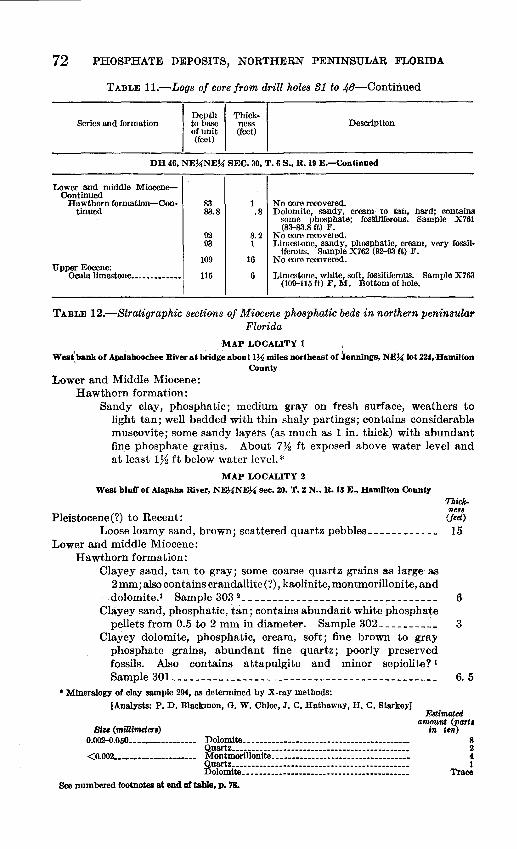
72 PHOSPHATE DEPOSITS, NORTHERN PENINSULAR FLORIDA
TABLE 11.-Logs of core from drill holes 31 to 46-Continued
Depth Thick-Series and formation to base ness Description
of unit (feet) (feet)
DH 46, NEUNEU SEC. 30, T. 6 S., R.19 E.-Continued
Low~ and middle MioceneContinued
Hawthorn formation-Continued
83 83.8
92 93
1 No core recovered. . 8 Dolomite, sandy, cream· to tan, nard; contains
some phosphate; fosslliferous. Sample X761 (83-83.8 ft) F.
8.2 No core recovered. 1 Limestone, sandy, phosphatic, cream, very fossil-
iferous. Sample X762 (92-93 ft) F. 16 No core recovered.
Upper Eocene: Ocala limestone ____________ _ 109
115 6 Limestone, white, soft, fossiliferous. Sample X763 (109-115 ft) F, M. Bottom of hole.
TABLE 12.-Stratigraphic sections of Miocene phosphatic beds in northern peninsular Florida
MAP LOCALITY 1
West)ank of Apajahoochee River at bridge about 1% miles northeast or Jennings, NEU lot 224,ilamilton County
Lower and Middle Miocene: Hawthorn formation:
Sandy clay, phosphatic; medium gray on fresh surface, weathers to light tan; well bedded with thin shaly partings; contains considerable muscovite; some sandy layers (as much as 1 in. thick) with abundant fine phosphate grains. About 7,% ft exposed above water level and at least 1}~ ft below water level.*
MAP LOCALITY 2
West blutror Alapaha River, NEUNEU sec. 20, T. 2 N., R.13 E., Hamilton County
Pleistocene(?) to Recent: Loose loamy sand, brown; scattered quartz pebbles ___________ _
Lower and middle Miocene: Hawthorn formation:
Clayey sand, tan to gray; some coarse quartz grains as large as 2mm; also contains crandallite(?), kaolinite, montmorillonite, and dolomite.l Sample 303 2 __ ------------------------------
Clayey sand, phosphatic, tan; contains abundant white phosphate pellets from 0.5 to 2 mm in diameter. Sample 302 _________ _
Clayey dolomite, phosphatic, cream, soft; fine brown to gray phosphate grains, abundant fine quartz; poorly preserved fossils. Also contains attapulgite and minor sepiolite? t Sample301---------------------------------------------
• Mineralogy of clay sample 294, as determined by .X-ray methods:
Thickness
(feet)
15
6
3
6. 5
(Analysts: P. D. Blackmon, G. W. Chloe, J. C. Hathaway, H. C. Starkey]
Size (millimeters)
Estimated amount (part1
O.OOH.OOO---------------- Dolomite.-_---------------------------------------Quartz. _________ ----------------------- __ ---------
<O.<l02------------------- Montmorillonite.----------------------------------Quartz ____ ------------------_--------_--.---------_ Dolomite.-._.-------------------------------------
See numbered footnotes at end of table, p. 78.
in ten) 8 2 4 1
Trace
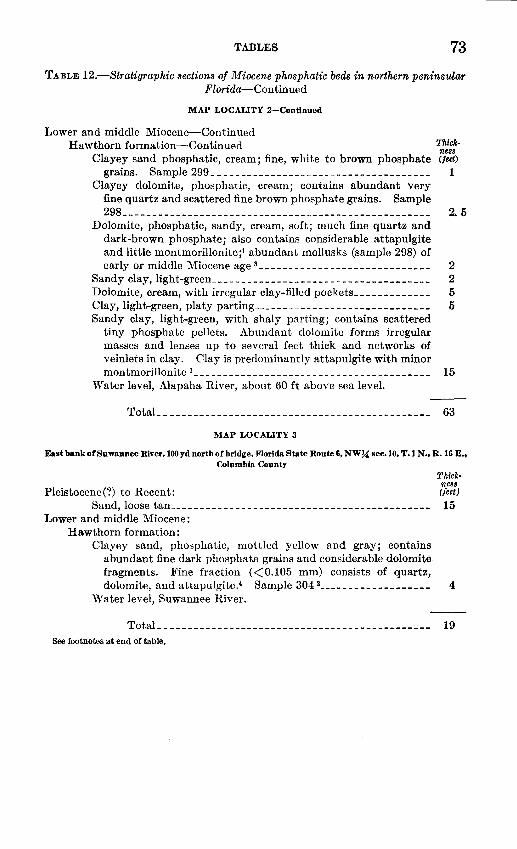
TABLES 73
TABLE 12.-Stratigraphic sections of Miocene phosphatic beds in northern peninsular Florida-Continued
MAP LOCALITY 2-Continued
Lower and middle Miocene-Continued Hawthorn formation-Continued
Clayey sand phosphatic, cream; fine, white to brown phosphate grains. Sample 299 ____________________________________ _
Clayey dolomite, phosphatic, cream; contains abundant very fine quartz and scattered fine brown phosphate grains. Sample 298----------------------------------------------------
Dolomite, phosphatic, sandy, cream, soft; much fine quartz and dark-brown phosphate; also contains considerable attapulgite and little montmorillonite;1 abundant mollusks (sample 298) of early or middle Miocene age 3-----------------------------
Sandy clay, light-green ___________________________ -_-_--- __ _ Dolomite, cream, with irregular clay-filled pockets ____________ _ Clay, light-green, platy parting _____________________________ _
Sandy clay, light-green, with shaly parting; contains scattered tiny phosphate pellets. Abundant dolomite forms irregular masses and lenses up to several feet thick and networks of veinlets in clay. Clay is predominantly attapulgite with minor montmorillonite 1 __________________________________ ------
Water level, Alapaha River, about 60ft above sea level.
Total----------------------------------------------
MAP LOCALITY 3
Thickness (feet)
1
2. 5
2 2 5 5
15
63
East bank or Suwannee River, 100 yd north or bridge, Florida State Route 6, NW% sec.10, T.1 N ., R. 16 E., Columbia County
Thick-ness
Pleistocene(?) to Recent: (feet)
Sand, loose tan-------------------------------------------- 15 Lower and middle Miocene:
Hawthorn formation: Clayey sand, phosphatic, mottled yellow and gray; contains
abundant.fine darkphosphate grains and considerable dolomite fragments. Fine fraction ( <0.105 mm) consists of quartz, dolomite, and attapulgite.4 Sample 304 2------------------- 4
Water level, Suwannee River.
Total---------------------------------------------- 19 See footnotes at end of table.
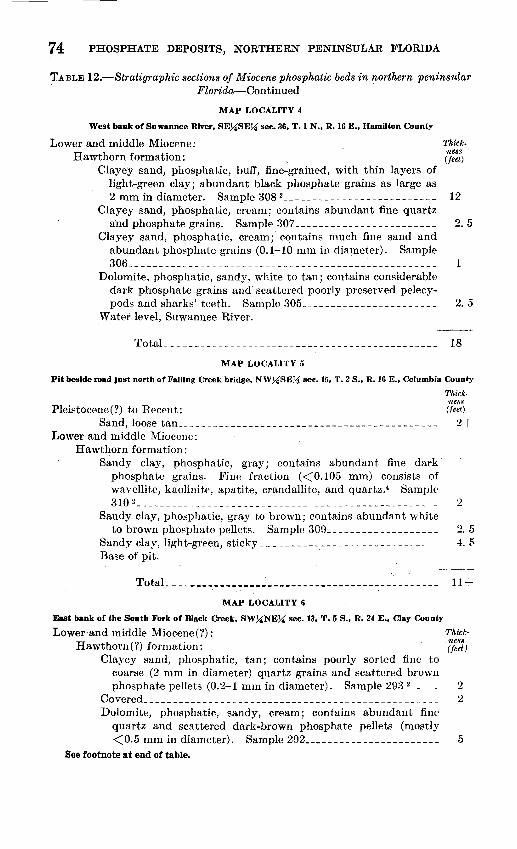
74 PHOSPHATE DEPOSITS, NORTHERN PENINSULAR FLORIDA
TABLE 12.-Stratigraphic sections of Miocene phosphatic beds in northern peninsular . . Florida-Continued
MAP LOCALITY 4
West bank of Suwannee River, SEUSE~ sec. 36, T. 1 N., R. 16 E., Hamilton County
Lower and middle Miocene: Hawthorn formation:
Clayey sand, phosphatic, buff, fine-grained, with thin layers of light-green clay; abundant black phosphate grains as large as 2 mm in diameter. Sample 308 2----------------.,.--------
Clayey sand, phosphatic, cream; contains abundant fine quartz and phosphate grains. Sample 307 _______________________ _
Clayey sand, phosphatic, cream; contains much fine sand and abundant phosphate grains (0.1-10 mm in diameter). Sample
306----------------------------------------~---~-------Dolomite, phosphatic, sandy, white to tan; contains considerable
dark phosphate grains and scattered poorly preserved pelecy-pods and sharks' teeth. Sample 305 ______________________ _
Water level, Suwannee River.
Total _____________________________________________ _
MAP LOCALITY 5
Thickness (feet)
12
2.5
1
2. 5
18
Pit beside road just north of Falling Creek bridge, NW74'SE!-4 sec. 15, T. 2 S., R. 16 E., Columbia County
Thick.
Pleistocene(?) to Recent: Sand, loose tan ________________________________ -_-----_----
Lower and middle Miocene: Hawthorn formation:
Sandy clay, phosphatic, gray; contains abundant fine dark phosphate grains. Fine fraction (<0.105 mm) consists of wavellite, kaolinite, apatite, crandallite, and quartz.4 Sample 310 2 __________________________________________________ _
Sandy clay, phosphatic, gray to brown; contains abundant white to brown phosphate pellets. Sample 309 __________________ _
Sandy clay, light-green, sticky ___________________________ _ Base of pit.
Total----------------~-----------------------------MAP LOCALITY 6
East bank of the South Fork of Black Creek, SW~NEU sec. 13, T. 5 S., R. 24 E., Clay County
Lower·and middle Miocene(?): Hawthorn(?) formation:
Clayey sand, phosphatic, tan; contains poorly sorted fine to coarse (2 mm in diameter) quartz grains and scattered brown phosphate pellets (0.2-1 mm in diameter). Sample 293 2 ____ _
Covered _________________________________________________ _
Dolomite, phosphatic, sandy, cream; contains abundant fine quartz and scattered dark-brown phosphate pellets (mostly <0.5 mm in diameter). Sample 292 ______________________ _
See footnote at end of table.
ness (feet)
2+
2
2. 5 4. .5
Thick. ness (feet)
2 2
5
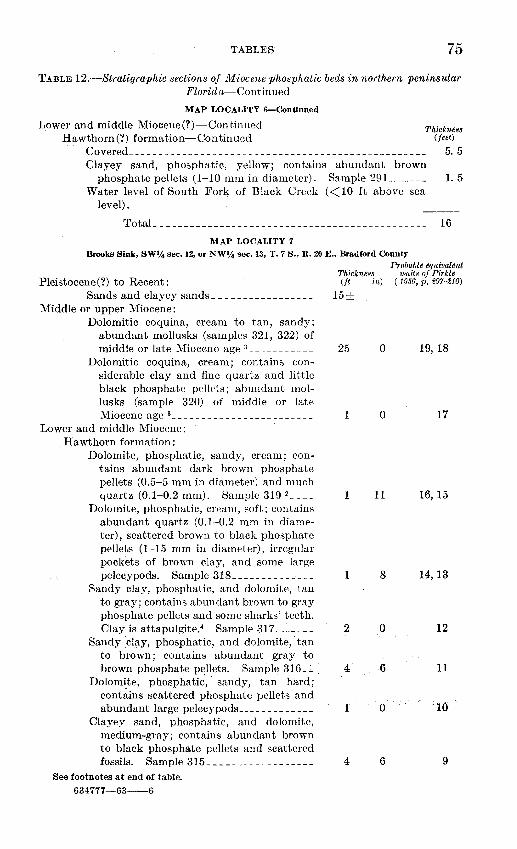
TABLES 75
TABLE 12.-Stratigraphic sections of JI;Jiocene phosphatic beds in northern peninsular Florid a-Continued
MAP LOCALITY 6-Continued
Lower and middle Miocene(?)-Continued Hawthorn(?) formation-Continued
Thickness (feet)
Covered _________________________________________________ _ 5. 5 Clayey sand, phosphatic, yellow; contains abundant brown
phosphate pellets (1-10 mm in diameter). Sample 29L______ 1. 5 'Vater level of South Fork of Black Creek ( < 10 ft above sea
level).
Total______________________________________________ 16
MAP LOCALITY 7
Brooks Sink, SW% sec. 12, or NW% sec. 13, T. 7 S., R. 20 E., Bradford County
Pleistocene(?) to Recent: Sands and clayey sands ________________ _
Middle or upper Miocene: Dolomitic coquina, cream to tan, sandy;
abundant mollusks (samples 321, 322) of middle or late Miocene age 3 __________ _
Dolomitic coquina, cream; contains considerable clay and fine quartz and little black phosphate pellets; abundant mollusks (sample 320) of middle or late Miocene age 3 _______________________ _
Lower and middle Miocene: Hawthorn formation:
Dolomite, phosphatic, sandy, cream; contains abundant dark brown phosphate pellets (0.5-5 mm in diameter) and much quartz (0.1-0.2 mm). Sample 319 2 ___ _
Dolomite, phosphatic, cream, soft; contains abundant quartz (0.1-0.2 mm in diameter), scattered brown to black phosphate pellets (1-15 mm in diameter), irregular pockets of brown clay, and some large pelecypods. Sample 318----------~---
Sandy clay, phosphatic, and dolomite, tan to gray; contains abundant brown to gray phosphate pellets and some sharks' teeth. Clay is attapulgite.4 Sample 317 ______ _
Sandy clay, phosphatic, and dolomite, tan to brown; contains abundant gray to brown phosphate pellets .. Sample 316 __
Dolomite, phosphatic, sandy, tan hard; contains scattered phosphate pellets and abundant large pelecypods ____________ _
Clayey sand, phosphatic, and dolomite, medium-gray; contains abundant brown to black phosphate pellets and scattered fossils. Sample 315 _________________ _
See footnotes at end of table. 6134777-63--6
Probable equivalent Thickness units of Pirkle (ft in) ( 1956, p. 207-210)
15±
25 0 19, 18
1 0 17
1 11 16, 15
1 8 14, 13
2 0 12
4 6 11
1 0 10
4 6 9
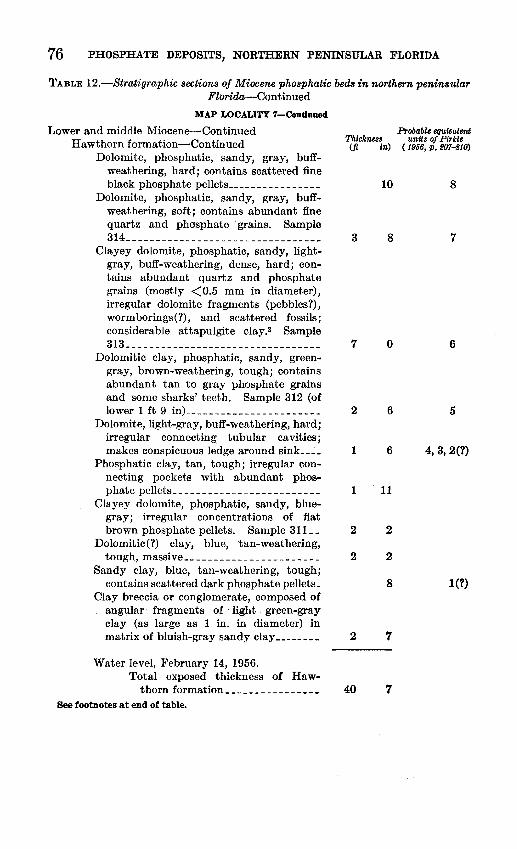
76 PHOSPHATE DEPOSITS, NORTHERN PENINSULAR FLORIDA
TABLE 12.-Stratigraphic sections of Miocene phosphatic beds in northern peninaular Florida-Continued
MAP LOCAUTY 7-Continued
Lower and middle Miocene--Continued Hawthorn formation-Continued
Dolomite, phosphatic, sandy, gray, buffweathering, hard; contains scattered fine black phosphate pellets _______________ _
Dolomite, phosphatic, sandy, gray, buffweathering, soft; contains abundant fine quartz and phosphate ·grains. Sample 314 ________________________________ _
Clayey dolomite, phosphatic, sandy, lightgray, buff-weathering, dense, hard; contains abundant quartz and phosphate grains (mostly <0.5 mm in diameter), irregular dolomite fragments (pebbles?), wormborings(?), and scattered fossils; considerable attapulgite clay.2 Sample 313 ________________________________ _
Dolomitic clay, phosphatic, sandy, greengray, brown-weathering, tough; contains abundant tan to gray phosphate grains and some sharks' teeth. Sample 312 (of lower 1ft 9 in) ______________________ _
Dolomite, light-gray, buff-weathering, hard; irregular connecting tubular cavities; makes conspicuous ledge around sink ___ _
Phosphatic clay, tan, tough; irregular connecting pockets with abundant phos-phate pellets ________________________ _
Clayey dolomite, phosphatic, sandy, bluegray; irregular concentrations of fiat brown phosphate pellets. Sample 311 __
Dolomitic(?) clay, blue, tan-weathering, tough, massive ______________________ _
Sandy clay, blue, tan-weathering, tough; contains scattered dark phosphate pellets_
Clay breccia or conglomerate, composed of angular fragments of light gr~en-gray
clay (as large as 1 in. in diameter) in matrix of bluish-gray sandy clay--------
Water level, February 14, 1956. Total exposed thickness of Haw-
thorn formation ________ --------See footnotes at end of table.
Probable equivalent Thickness units of Pirkle (ft in) ( 1956, p, Wl-S10)
10 8
3 8 7
7 0 6
2 6 5
1 6 4, 3, 2(?)
1 11
2 2
2 2
8 1(?)
2 7
40 7
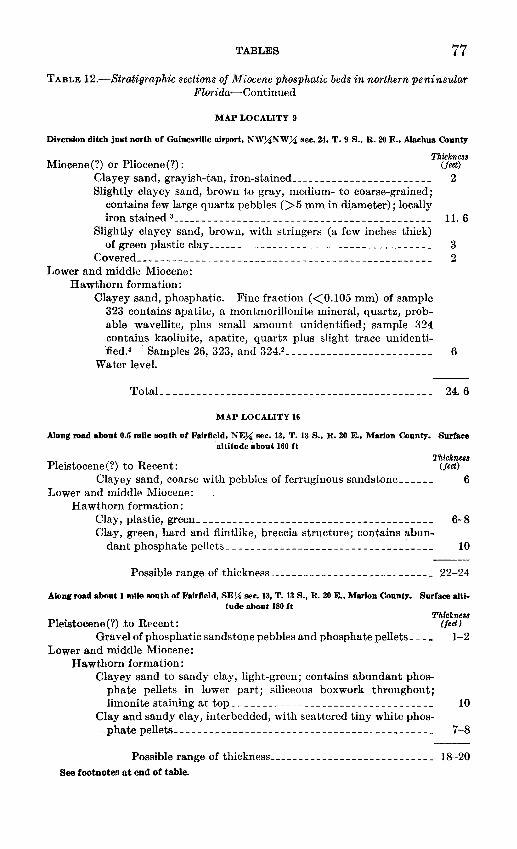
TABLES 77
TABLE 12.-Stratigraphic sections of Miocene phosphatic beds in northern peninsular Florida-Continued
MAP LOCALITY 9
Diversion ditch just north of Gainesville airport, NW~NW~ sec. 24, T. 9 S., R. 20 E., Alachua County
Miocene(?) or Pliocene(?): Thickness
(feet)
Clayey sand, grayish-tan, iron-stained _______________________ _
Slightly clayey sand, brown to gray, medium- to coarse-grained; contains few large quartz pebbles (>5 mm in: diameter); locally iron stained a ___________________________________________ _
Slightly clayey sand, brown, with stringers (a few inches thick) of green plastic clay _____________________________________ _
Covered _________________________________________________ _
Lower and middle Miocene: Hawthorn formation:
Clayey sand, phosphatic. Fine fraction (<0.105 mm) of sample 323 contains apatite, a montmorillonite mineral, quartz, probable wavellite, plus small amount unidentified; sample 324 contains kaolinite, apatite, quartz plus slight trace unidenti-
2
11. 6
3 2
·fied.4 Samples 26, 323, and 324.2_________________________ 6
Water level.
Total______________________________________________ 24.6
MAP LOCALITY 16
Along road about 0.5 mile south or Fairfield, NE~ sec. 13, T. 13 S., R. 20 E., Marion County. Surface ··altitude about 160ft
Pleistocene(?) to Recent: Thickne88
(feet)
Clayey sand, coarse with pebbles of ferruginous sandstone _____ _ 6 Lower and middle Miocene:
Hawthorn formation: Clay, plastic, green ___________________________________ ----_ 6-8
Clay, green, hard and flintlike, breccia structure; contains abun-dant phosphate pellets_ _ _ _ _ _ _ _ _ _ _ _ _ _ _ _ _ _ _ _ _ _ _ _ _ _ _ _ _ _ _ _ _ _ _ 10
Possible range of thickness ____________________________ 22-24
Along road about 1 mile south of Fairfield, SE}4 sec. 13, T. 13 S., R. 20 E., Marion. County. Surface altitude about 180 Ct
Pleistocene(?) to Recent: Thickness
(feet)
Gravel of phosphatic sandstone pebbles and phosphate pellets ___ _ Lower and middle Miocene:
Hawthorn formation: Clayey sand to sandy clay, light-green; contains abundant phos
phate pellets in lower part; siliceous boxwork throughout; limonite staining at top ___ -------------------------------
Clay and sandy clay, interbedded, with scattered tiny white phos-phate pellets ___________________________________________ _
1-2
10
7-8
Possible range of thickness ____________________________ 18-20
See footnotes at end of table.
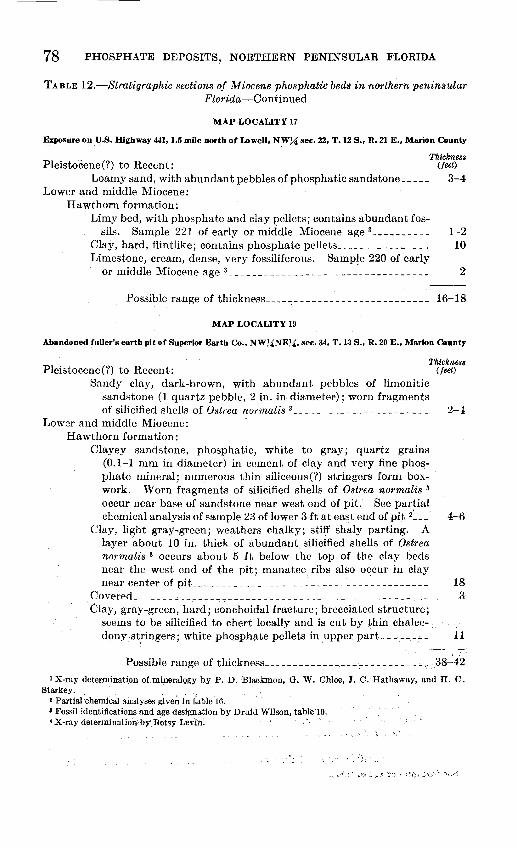
78 PHOSPHATE DEPOSITS, NORTHERN PENINSULAR FLORIDA
TABLE 12.-Stratigraphic sections of Miocene phosphatic beds in northern peninsular Florida-Continued
MAP LOCALITY 17
Exposure on U.S. Highway 441, 1.5 mile north of Lowell, NW~ see. 22, T. 12 S., .R. 21 E., Marion County
Pleistocene(?) to Recent: Thickness
(feet)
Loamy sand, with abundant pebbles of phosphatic sandstone ____ _ 3-4 Lower and middle Miocene:
Hawthorn formation: Limy bed, with phosphate and clay pellets; contains abundant fos-
sils. Sample 221 of early or middle Miocene age 3 _ _ _ _ _ _ _ _ _ _ 1-2 Clay, hard, fiintlike; contains phosphate pellets________________ 10 Limestone, cream, dense, very fossiliferous. Sample 220 of early
or middle Miocene age a__________________________________ 2
Possible range of thickness____________________________ 16-18
MAP LOCALITY 19
Abandoned fuller's earth pit of Superior Earth Co., NW~NE~. see. 34, T. 13 S., .R. 20 E., Marion County
Thicknesa Pleistocene(?) to Recent: (feet)
Sandy clay, dark-brown, with abundant pebbles of limonitic sand~Stone (1 quartz pebble, 2 in. in diameter); worn fragments of silicified shells of Ostrea normalis 3 _ _ _ _ _ _ _ _ _ _ _ _ _ _ _ _ _ _ _ _ _ _ _ 2--!-
Lower and middle Miocene: Hawthorn formation:
Clayey sandstone, phosphatic, white to gray; quartz grains (0.1-1 mm in diameter) in cement of clay and very fine phosphate mineral; numerous thin siliceous(?) stringers form boxwork. Worn fragments of silicified shells of Ostrea normalis 3
occur near base of sandstone near west end of pit. See partial chemical analysis of sample 23 of lower 3ft at east end of pit(__ 4-6
Clay, light gray-green; weathers chalky; stiff shaly parting. A layer about 10 in. thick of abundant silicified shells of Ostrea normalis 3 occurs about 5 ft below the top of the clay beds near the west end of the pit; manatee ribs also occur in clay near center of pit ___ .:_-____________________________________ 18
Covered _______ ~--~---~~------------------~~------------~- ~ Clay, gray-green, hard; conchoidal fracture; brecciated structure;
seems to be silicified to chert locally and is cut by thin chalce- .. dony stringers; white phosphate p~llets in upper part~ _ ~ __ _ :... _ 11
Possible range of thickness----------------:------------.,. 38_:42
1 X-ray determinat~on of mineralogy by P. D. Blackmon, G. W._ Chloe, J. C. Hathaway, and H. C. Starkey.
2 Partial-chemical analyses given i~ t'able 16. a Fossil identifications and age designation by Druid Wilson, table 10. • X-ray determination;byBetsy Levin. · ·
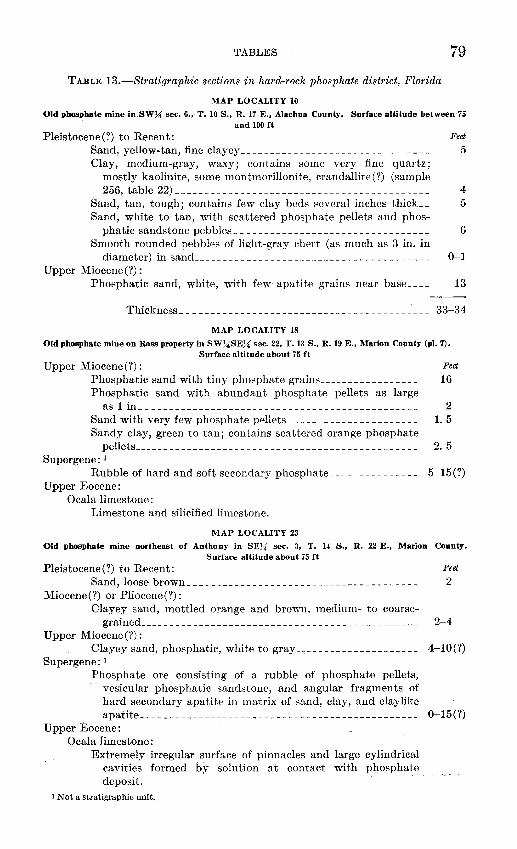
TABLES
TABLE 13.-Stratigraph£c sections in hard-rock phosphate district, Florida
MAP LOCALITY 10
79
Old phosphate mine in SWU sec. 6., T. 10 S., R. 17 E., Alachua County. Surface altitude between 75 and 100ft
Pleistocene(?) to Recent: Feet Sand, yellow-tan, fine clayey________________________________ 5 Clay, medium-gray, waxy; contains some very fine quartz;
mostly kaolinite, some montmorillonite, crandallite(?) (sample 256, table 22) _ _ _ _ _ _ _ _ _ _ _ _ _ _ _ _ _ _ _ _ _ _ _ _ _ _ _ _ _ _ _ _ _ _ _ _ _ _ _ _ _ _ _ 4
Sand, tan, tough; contains few clay beds several inches thick__ 5 Sand, white to tan, with scattered phosphate pellets and phos-
phatic sandstone pebbles __ ------------------------------- 6 Smooth rounded pebbles of light-gray chert (as much as 3 in. in
diameter) in sand________________________________________ 0-1 Upper Miocene(?):
Phosphatic sand, white, with few apatite grains near base____ 13
Thickness __________________________________________ 33-34
MAP LOCALITY 18
Old phosphate mine on Ross property in SWUSE%' sec. 22, ·r. 13 S., R. 19 E., Marion County (pl. 7). Surface altitude about 75ft
Upper Miocene(?): Feet Phosphatic sand with tiny phosphate grains_________________ 16 Phosphatic sand with abundant phosphate pellets as large
as 1 in _ _ _ _ _ _ _ _ _ _ _ _ _ _ _ _ _ _ _ _ _ _ _ _ _ _ _ _ _ _ _ _ _ _ _ _ _ _ _ _ _ _ _ _ _ _ _ 2
Sand with very few phosphate pellets_--------------------- 1. 5 Sandy clay, green to tan; contains scattered orange phosphate
pellets________________________________________________ 2. 5 Supergene: 1
Rubble of hard and soft secondary phosphate_______________ 5-15 (?) Upper Eocene:
Ocala limestone: Limestone and silicified limestone.
MAP LOCALITY 23
Old phosphate mine northeast of Anthony in SE%' sec. 3, T. 14 S., R. 22 E., Marion County. Surract: altitude about 75ft
Pleistocene(?) to Recent: Feet Sand, loose brown_ _ _ _ _ _ _ _ _ _ _ _ _ _ _ _ _ _ _ _ _ _ _ _ _ _ _ _ _ _ _ _ _ _ _ _ _ _ _ 2
Miocene(?) or Pliocene(?): Clayey sand, mottled orange and brown, medium- to coarse-
grained_______________________________________________ 2-4 Upper Miocene(?):
Clayey sand, phosphatic, white to gray _____________________ 4-10(?) Supergene: 1
Phosphate ore consisting of a rubble of phosphate pellets, vesicular phosphatic sandstone, and angular fragments of hard secondary apatite in matrix of sand, clay, and claylike apatite _____________________________________________ -_ 0-15 (?)
Upper Eocene : Ocala limestone:
Extremely irregular surface of pinnacles and large cylindrical cavities formed hy solution at contact with phosphate deposit.
1 Not a stratigraphic unit.
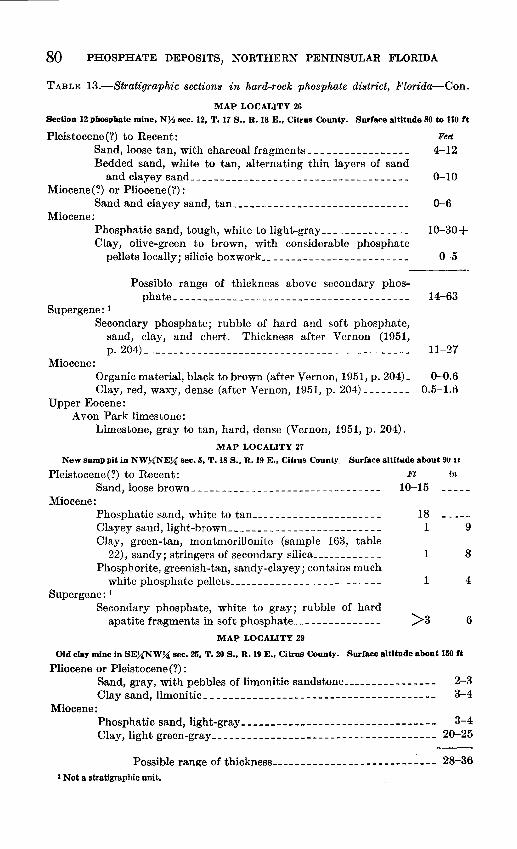
80 PHOSPHATE DEPOSITS, NORTHERN PENINSULAR FLORIDA
TABLE 13.-Stratigraphic sections in hard-rock phosphate district, Florida-Con.
MAP LOCALITY 26
Section 12 phosphate mine, N~ sec. 12, T. 17 S., R. 18 E., Citrus County. Surface altitude 80 to 110 ft
Pleistocene(?) to Recent: Sand, loose tan, with charcoal fragments ____________ - __ -_ Bedded sand, white to tan, alternating thin layers of sand
and clayey sand ____________________________________ _
Miocene(?) or Pliocene(?): Sand and clayey sand, tan ___________ ------- _____ -------
Miocene:
Feet
4-12
0-10
0-6
Phosphatic sand, tough, white to light-gray ______________ _ lQ-30+ Clay, olive-green to brown, with considerable phosphate
pellets locally; silicic boxwork ________________________ _
Possible range of thickness above secondary phos-phate _______________________________________ _
Supergene: 1
Secondary phosphate; rubble of hard and soft phosphate, sand, clay, and chert. Thickness after Vernon (1951, p. 204)---------------------------------------------
Miocene: Organic material, black to brown (after Vernon, 1951, p. 204)_ Clay, red, waxy, dense (after Vernon, 1951, p. 204) _______ _
Upper Eocene: A von Park limestone:
Limestone, gray to tan, hard, dense (Vern on, 1951, p. 204).
MAP LOCALITY 27
0-5
14-63
11-27
0-0.6 0.5-1.6
New sump pit in NWX'NEU sec. 5, T.18 S., R.19 E., Citrus CountY. Surface altitude about 9U u
Pleistocene(?) to Recent: Ft in Sand, loose brown _____________________________ --- 10-15
Miocene: Phosphatic sand, white to tan _____________________ _ 18 Clayey sand, light-brown ______________________ -· __ _ 1 Clay, green-tan, montmorillonite (sample 163, table
22), sandy; stringers of secondary silica ___________ _ 1 Phosphorite, greenish-tan, sandy-clayey; contains much
white phosphate pellets _____________________ --_-- 1 Supergene: 1
Secondary phosphate, white to gray; rubble of hard apatite fragments in soft phosphate _________ - __ --- >3
MAP LOCALITY 29
Old clay mine in SE%'NW74' sec. 25, T. 20 S., R.19 E., Citrus County. Surface altitude about 150 Ct
Pliocene or Pleistocene(?):
9
8
4
6
Sand, gray, with pebbles of limonitic sandstone________________ 2-3 Clay sand, limonitic _____________________ ------------------ 3-4
Miocene: Phosphatic sand, light-gray ______ ------ _____ ---------------- 3-4 Clay, light green-graY-------------------------------------- 20-25
Possible range of thickness---------------------------- 28-36 1 Not a stratigraphic unit.
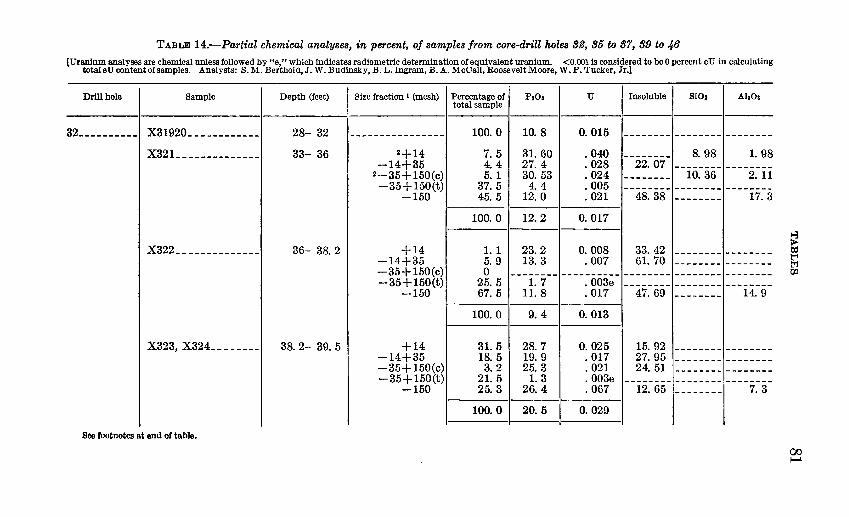
TABLE 14.-Partial chemical analyses, in percent, of samples from core-drill holes 32, 35 to 37, 39 to 4.6 [Uranium analyses are chemical unless followed by "e," which indicates radiometric determination of equivalent uranium. <0.001 is considered to be 0 percent e U in calculating
totaleU content of samples. Analysts: S.M. Berthold,J. W. Budinsky, B. L. Ingram, B.A. McCall, Roosevelt Moore, W. P. Tucker, Jr.]
Drill hole Sample Depth (feet) Size fraction 1 (mesh) Percentage of total sample
P20a u Insoluble SiOt AlaOa
32 __________ )(31920 ____________ 28- 32 ---------------- 100. 0 10.8 0.015 -------- -------- --------J{32l ______________
33- 36 2 +14 7.5 31. 60 . 040 -------- 8. 98 1. 98 -14+35 4.4 27.4 . 028 22.07 -------- --------
2-35+ 150(c) 5. 1 30. 53 . 024 -------- 10.36 2. 11 -35+150(t) 37. 5 4. 4 . 005 -------- -------- --------
-150 45. 5 12.0 • 021 48. 38 -------- 17.3
100. 0 12.2 0.017
)(322 ______________ 36-38.2 +14 1.1 23.2 0.008 33. 42 -------- --------
-14+35 5.9 13.3 . 007 61. 70 -------- ---------35+150(c) 0 -------- ---------- -------- -------- ---------35+150(t) 25.5 1. 7 . 003e -------- -------- --------
-150 67. 5 11. 8 . 017 47. 69 -------- 14.9
100.0 9.4 0.013
)(323, )(324_------- 38.2- 39.5 +14 31. 5 28.7 0.025 15.92 -------- ---------14+35 18. 5 19.9 . 017 27.95 -------- ---------35+150(c) 3.2 25.3 . 021 24.51 -------- ---------35+150(t) 21. 5 1.3 . 003e -------- -------- --------
-150 25.3 26.4 . 067 12. 65 -------- 7. 3
100.0 20. 5 0.029
See footnotes at end of table.
~ l:d t'i t'=J '('f).
00 1-4
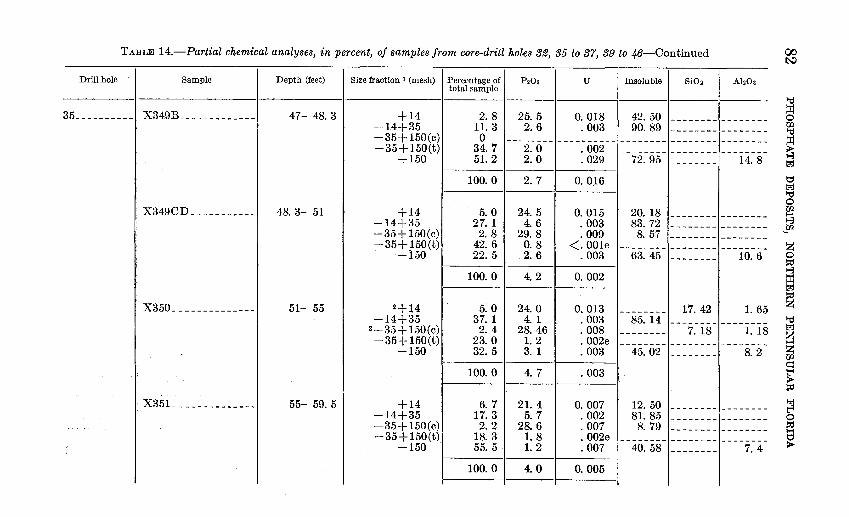
TABLE 14.-Partial chemical analyses, in percent, of samples from core-drill holes 32, 35 to 37, 39 to 46-Continued 00 t-.J
Drill hole l Sample I Depth (feet) I Size fraction I (mesh) I Percentage of I total sample
P205 I
u I Insoluble I Si02 I
AhOs
---- ~ 35 _________ _1 X349B ____________ _I 47- 48. 3 I +14 2.8 25.5 0.018 42. 50 -------- -------- 0 -14+35 11. 3 2. 6 . 003 90. 89 U1 -------- -------- 1-d -35+150(c) 0 -------- ---------- -------- -------- -------- ~ -35+150(t) 34.7 2.0 . 002 -------- -------- --------
-150 51. 2 2.0 . 029 72. 95 -------- 14. 8 1."'.1
100.0 2. 7 0.016 t:::l 1."'.1 1-d 0
X349CD _____ ------1 48. 3- 51 I' +14 5. 0 24.5 0.015 20. 18 -------- -------- re -14+35 27. 1 4. 6 . 003 83. 72 8 -------- -------- Ul -35.+ 150(c) 2. 8 29. 8 . 009 8. 57 "" -------- ---------35+150(t) 42. 6 0. 8 <. 001e -------- -------- -------- z
-i50 22. 5 2.6 . 003 63. 45 -------- 10. 6 0 ~
100. 0 0. 002 8
4.2 ~ 1."'.1 pj
X350 ____________ -_I 51- 55 I 2+14 5.0 24.0 0.013 17. 42 1. 65 z ---------14+35 37. 1 4. 1 . 003 85. 14 -------- -------- "d
2-35+ 150(c) 2. 4 28.46 . 008 7. 18 1. 18 1."'.1 -------- z -35+150(t) 23.0 1.2 . 002e -------- -------- -------- z -150 32. 5 3. 1 . 003 45.02 -------- 8.2 ~
100.0 4. 7 . 003 ~ pj
X351 ______________ l 55- 59. 5 I +14 6. 7 21. 4 0.007 12. 50 "":! -------- -------- t"l -14+35 17. 3 5. 7 . 002 81. 85 -------- -------- 0 -35+150(c) 2. 2 28.6 . 007 8. 79 -------- -------- pj
1-1 -35+150(t) 18. 3 1.8 . 002e -------- -------- -------- t:::l
-150 55.5 1.2 . 007 40. 58 7. 4 > --------100.0 4.0 0. 005
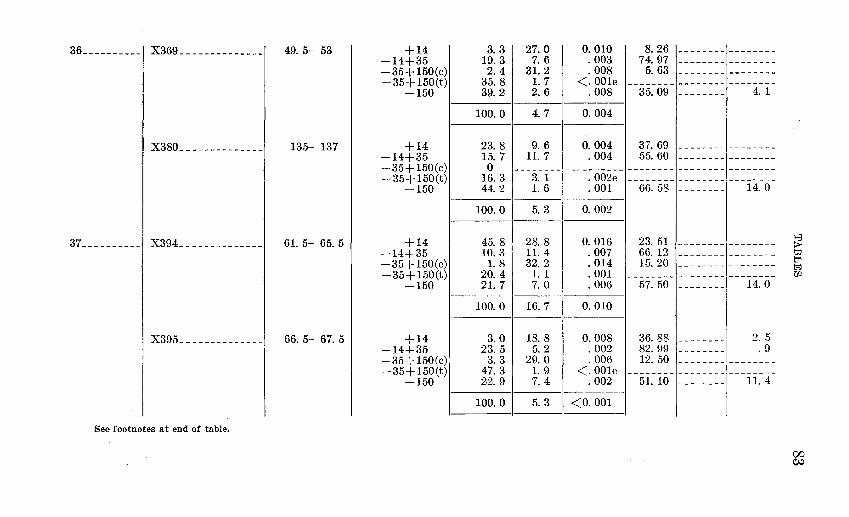
36 _________ _1 X369 ______________ l 49. 5- 53
X380 ______________ l 135- 137
37 __________ 1 X394 __ _ 61. 5- 65. 5
X395 __ _ 66. 5- 67. 5
See footnotes at end of table.
+14 -14+35 -35+150(c -35+150(t
-150
+14 -14+35
I
I
-35+150(c) I I -35+150(t)
-150
+14 -14+35 -35+150(c) I
I -35+150(t) -150
+14 -14+35 -35+150(c) -35+150(t)
-150
3.3 19. 3
2. 4 35.8 39.2
100. 0
23. 8 15.7 0
16. 3 44.2
100. 0
45.8 10. 3 1.8
20. 4 21. 7
100. 0
3.0 23. 5
3. 3 47. 3 22. 9
100. 0
27.0 7. 6
31. 2 1.7 2. 6
4. 7
9. 6 11. 7
--------3. 1 1.6
5. 3
28. 8 11. 4 32. 2
1. 1 7.0
16. 7
18. 8 5. 2
29.0 1.9 7. 4
5. 3
0.010 . 003 . 008
<. 001e . 008
0.004
0. 004 . 004
----------. 002e . 001
0. 002
0. 016 . 007 . 014 . 001 . 006
0.010
0.008 . 002 . 006
<. 001e . 002
<o. 001 -
~ ttl t:-1 tr_j U1
00 ~
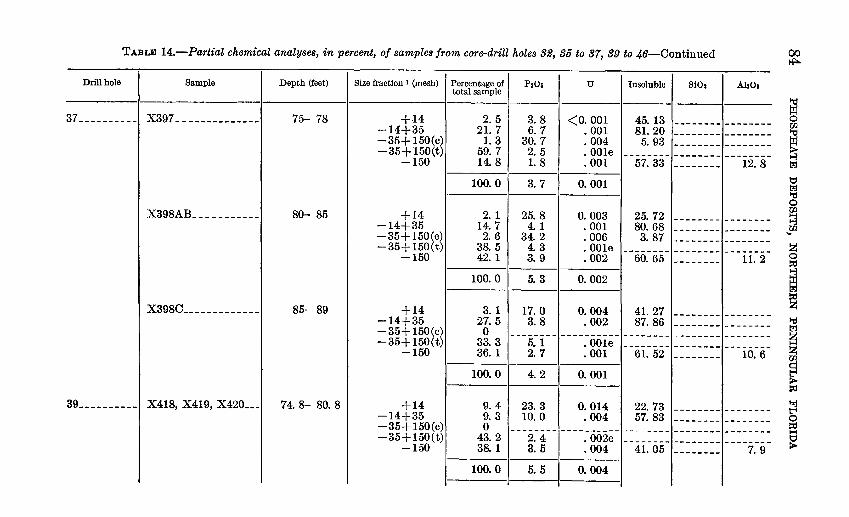
TABLE 14.-Partial chemical analyses, in percent, of samples from core-drill holes 82, 85 to 87, 89 to 46-Continued
Drill hole Sample Depth (feet) Size fraction 1 (mesh) Percentage of P20o u Insoluble Si02 total sample
37 __________ ](397 ______________ 75- 78 +14 2.5 3.8 <O. 001 45. 13 ---------14+35 21. 7 6. 7 . 001 81. 20 ---------35+ 150(c) 1.3 30.7 . 004 5.93 ---------35+150(t) 59. 7 2. 5 . 001e -------- ---------150 14. 8 1.8 . 001 57.33 --------
100.0 3. 7 0.001
2C398AB _____ ------ 80- 85 +14 2. 1 25. 8 0.003 25. 72 ---------14+35 14. 7 4. 1 . 001 80.68 ---------35+150(c) 2. 6 34.2 • 006 3. 87 ---------35+150(t) 38. 5 4. 3 . 001e -------- ---------150 42. 1 3.9 . 002 60. 65 --------100.0 5.3 0.002
X398C __ ------ _____ 85- 89 +14 3. 1 17.0 0.004 41. 27 ---------14+35 27.5 3.8 . 002 87.86 ---------35+150(c) 0 -------- ---------- -------- ---------35+150(t) 33.3 5.1 . 001e -------- ---------150 36. 1 2. 7 . 001 61. 52 --------100.0 4. 2 0.001
39 __________ X418, X419, X420 ___ 74.8- 80.8 +14 9. 4 23. 3 0.014 22. 73 ---------14+35 9. 3 10.0 . 004 57.83 ---------35+150(c) 0 -------- ---------- -------- ---------35+150(t) 43. 2 2. 4 . 002e -------- ---------150 38. 1 3. 5 . 004 41.05 --------
100.0 5. 5 0.004 -
AhOa
--------------------------------
12. 8
--------------------------------
11. 2
--------------------------------
10.6
--------------------------------
7. 9
00 ~
~ 0 Ul
~ t:;t
t:l t:;t '"d 0
~ ... rn
~ ~
~ ~ z '"d t:;t
~ ~ ~ ~ 0 ~
~
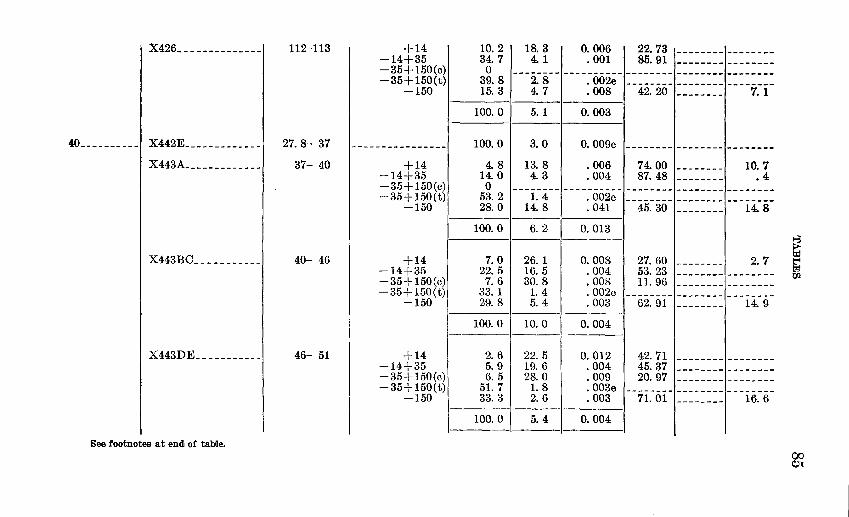
}(426 _____________ _
40 _______ ---1 X442E ____ -------- _
X443A _________ ----
X443BC __ -- _ ------
X443DE ___ ------- _
See footnotes at end of table.
112-113
27.8-37
37- 40
40- 46
46- 51
+14 -14+35 -35+150(c -35+150(t
-150
+14 -14+35 -35+150(c -35+150(t
-150
+14 -14+35 -35+150(c -35+150(t
-150
+14 -14+35 -35+150(c -35+150(t
; "'"' -J.uu
10.2 34. 7
) 0 ) 39. 8
15. 3
100.0
100.0
4.8 14.0
) 0 ) 53. 2
28.0
100.0
7. 0 22. 5
) 7. 6 ) 33. 1
29. 8
100.0
2. 6 5.9
) 6. 5 ) 51. 7
99 9
I
..,..,, ..,
100.0
18.3 4.1
--------2. 8 4.7
5. 1
3.0
13. 8 4.3
--------1. 4
14.8
6. 2
26. 1 16. 5 30.8 1.4 5. 4
10.0
22. 5 19. 6 28.0 1.8 2.6
5. 4
0.006 . 001
----------• 002e . 008
0.003
0.009e
. 006
. 004 ----------. 002e
. 041
0.013
0.008 . 004 . 008 . 002e . 003
0.004
0.012 . 004 . 009 . 003e . 003
0.004
22. 73 ,--------,--------85. 91 -------- --------
-42: 2o -[ :::: :::r---;;:i-
74. 00 1--------1 10. 7 87. 48 -------- • 4
-45: 3o -,:::::::: 1--- i 4: s-
42. 71 1- -------~--------45. 37 -------- --------20. 97 -------- --------
71. 01 16.6
~ ~ rJ).
00 Cl
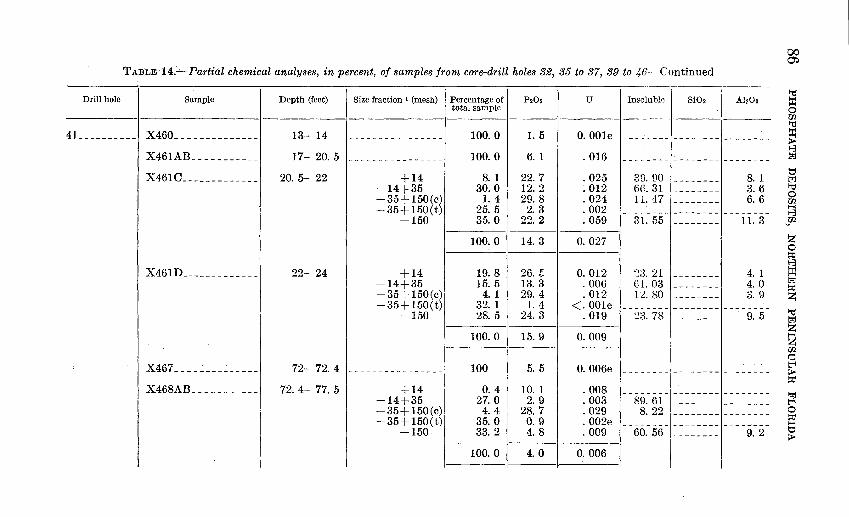
TABLE 14.-'--Partial chemical analyses, in percent, of samples from core-drill holes 32, 35 to 37, 39 to 46---Continued
Drill hole Sample Depth (feet) Size fraction 1 (mesh) Percentage of P20s u Insoluble Si02 total sample
41_ _________ JC460 ______________ 13- 14 ---------------- 100. 0 1.5 0.001e -------- --------JC461AB ___________ 17- 20. 5 ---------------- 100.0 6. 1 . 016 -------- --------JC461C _____________ 20. 5- 22 +14 8. 1 22. 7 . 025 30. 90 --------
-14+35 30.0 12. 2 . 012 66. 31 ---------35+ 150(c) 1.4 29. 8 . 024 11.47 ---------35+ 150(t) 25. 5 2. 3 . 002 -------- --------
-150 35.0 22. 2 . 059 31. 55 --------
100.0 14.3 0.027
JC461I> _____________ 22- 24 +14 19. 8 26. t: 0.012 ']3. 21 ----------14+35 15. 5 13. 3 . 006 Gl. 03 --------- 35+ 150(c) 4. 1 29. 4 . 012 1:2. 80 ---------35+150(t) 32. 1 1.4 <· 001e -------- --------
-150 28. 5 24. 3 . 019 :23. 78 --------
100.0 15. 9 0.009
)(467--------~----- 72- 72. 4 ---------------- 100 5. 5 0. 006e -------- --------
JC468AB ___________ 72. 4- 77. 5 +14 0. 4 10. 1 . 008 -------- ---------14+35 27.0 2. 9 . 003 89. 61 ---------35+150(c) 4. 4 28. 7 . 029 8. 22 ---------35+150(t) 35.0 0. 9 . 002e -------- --------
-150 33. 2 4. 8 . 009 60. 56 --------
100. 0 4. 0 0. 006 ----·
Ab03
--------
--------
8. 1 3.6 6. 6
--------11. 3
4. 1 4. 0 3. 9
--------9. 5
--------
--------------------------------
9. 2
00 ~
~ Ul 1-d
~ 8 trJ
t:l trJ 1-d 0 Ul 1-4 8 ~Ul
~ !;tl
~ trJ !;tl z 1-d t.:z:J
~ z ~ t"l > !;tl
~ t"l 0 !;tl 1-4 t:l >
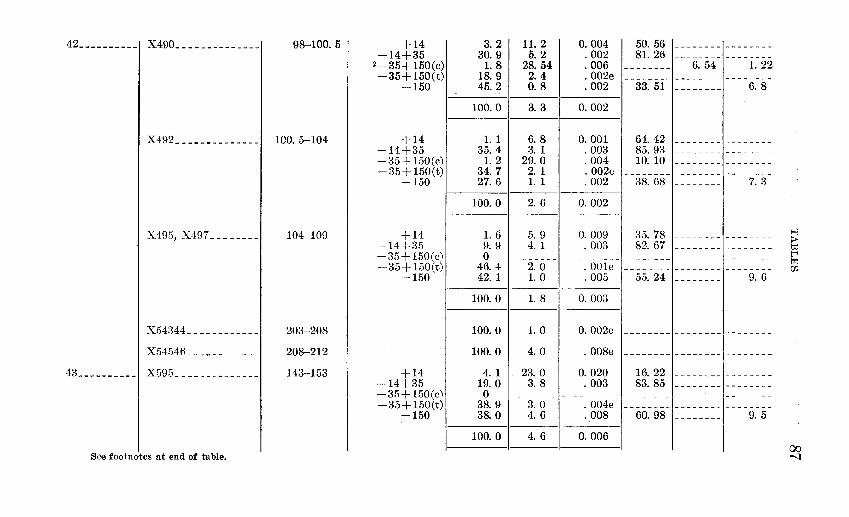
42 __________ ( X490 ______________ ( 98-100.5
X492 _____________ J 100. 5-104
X495, X497 _______ _
X54344 ___________ _
X54546 ___________ _
43 __________ 1 X595 ____ _
See footnotes at end of table.
104-109
203-208
208-212
143-153
+14 -14+35
2-35+ 150(c -35+ 150(t
-150
+14 -14+35
I I
-35+ 150(c) -35+ 150(t)
-150
+14 -14+35
I -35+150(c) I -35+ 150(t)
-150
+14 -14+35 -iUi-l-l.C)O(p,) I -35+i5o(t) I
-150
3. 2 30. 9 1.8
18.9 45.2
100.0
1. 1 35. 4
1.2 34. 7 27. 6
100. 0
1.6 9. 9 0
46. 4 42. 1
100. 0
100. 0
100. 0
4. 1 19. 0 0
38. 9 38. 0
100. 0
11. 2 5. 2
28. 54 2. 4 0. 8
3. 3
6. 8 3. 1
29. 0 2. 1 1. 1
2. 6
5. 9 4. 1
--------2. 0 1.0
1.8
1.0
4. 0
23.0 3. 8
------ --
3. 0 4. 6
4. 6
0.004 . 002 . 006 . 002e . 002
0.002
0. 001 . 003 . 004 . 002e . 002
0. 002
0. 009 . 003
----------. OOle . 005
0. 003
0. 002e
. 008e
0. 020 . 003
----- --
. 004e
. 008
0. 006 ----
50. 56 1- -------,- --= = = = = 81. 26 ---6.-54- --- 1. 22
33. 51 ,_ - - - - - - _I 6. 8
64. 42 85. 93 10. 10
38. 68 ,_ ------ _, 7. 3
35. 78 ,--------,--------82. 67 -------- --------
55. 24 ,_------ _, 9. 6
60. 98 ,_------ _, 9. 5
1-3 > td t:"l trJ [/).
00 -.:j
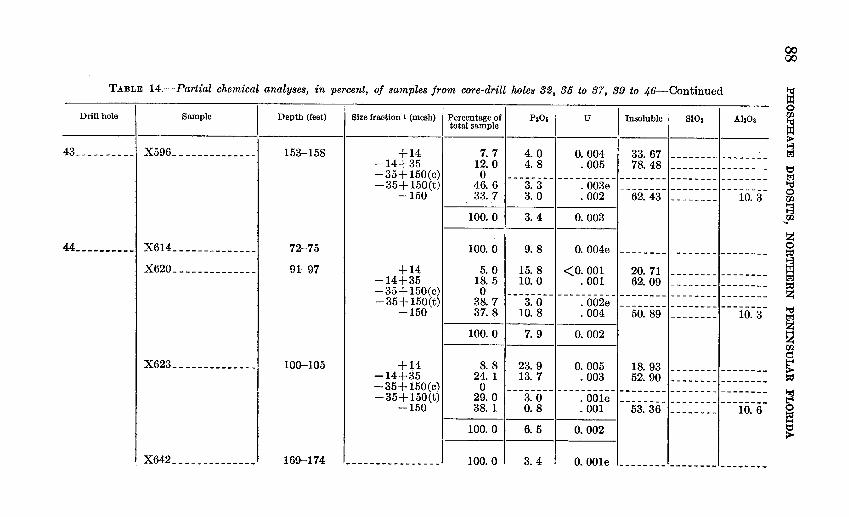
TABLE 14.-Partial chemical analyses, in percent, of samples from core-drill holes 321
35 to 37, 39 to 46-Continued
Drill hole Sample Depth (feet) Size fraction 1 (mesh) Percentage of total sample
P206 u Insoluble SiOs Ala03
43 __________ JC596 ______________ 153-158 +14 7. 7 4.0 0. 004 33. 67 -------- ---------14+35 12.0 4. 8 . 005 78. 48 -------- --------
-35+150(c) 0 -------- ---------- -------- -------- ---------35+150(t) 46.6 3. 3 . 003e -------- -------- --------
-150 33. 7 3. 0 . 002 62. 43 -------- 10. 3
100.0 3. 4 0.003
44 __________ JC614 ______________ 72-75 100.0 9. 8 0. 004e -------- -------- --------
JC620 ______________ 91-97 +14 5. 0 15.8 <O. 001 20.71 -------- ---------14+35 18.5 10. 0 . 001 62.09 -------- ---------35+150(c) 0 -------- ---------- -------- -------- ---------35+150(t) 38.7 3.0 . 002e -------- -------- ---------150 37. 8 10.8 . 004 50. 89 -------- 10. 3
100.0 7. 9 0.002
JC623 ______________ 10Q-105 +14 8. 8 23.9 0.005 18. 93 -------- ---------14+35 24. 1 13.7 . 003 52. 90 -------- ---------35+150(c) 0 -------- ---------- -------- -------- ---------35+150(t) 29.0 3.0 . 001e -------- -------- ---------150 38. 1 0.8 . 001 53.36 -------- 10. 6
100.0 6. 5 0.002
JC642 ______________ 169-174 ------------·--- 100. 0 3.4 0.001e -------- -------- ------
00 00
m U2
~ t"..
t:::l
~ 0
j ~ ~ t"..
~ "d t"..
~ rg f; ~
~ 0 ~ ..... ~
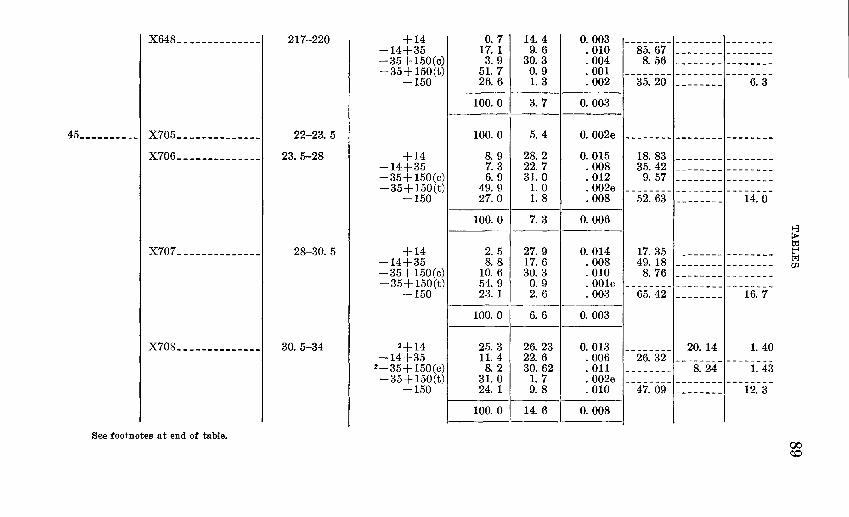
](648 _____________ _ 217-220
45 __________ 1 ](705 _____________ _ 22-23. 5
JC706_- ___________ _! 23. 5-28
JC707 _____________ _ 28-30. 5
](708 _____________ _ 30. 5-34
See footnotes at end of table.
+14 -14+35 -35+150(c) -35+ 150(t)
-150
+14 -14+35 -35+150(c) -35+150(t)
-150
+14 -14+35 -35+150(c) -35+150(t)
-150
2+14 -14+35
2-35+ 150(c) -35+150(t)
-150
0. 7 14.4 0. 003 17. 1 9. 6 . 010 3.9 30.3 . 004
51. 7 0. 9 . 001 26.6 1.3 . 002
100.0 3. 7 0. 003
100. 0 5. 4 0.002e
8. 9 28. 2 0. 015 7. 3 22. 7 . 008 6. 9 31. 0 . 012
49. 9 1.0 . 002e 27.0 1.8 . 008
100.0 7. 3 0. 006
2. 5 27. 9 0. 014 8. 8 17. 6 . 008
10. 6 30. 3 . 010 54. 9 0. 9 . 001e 23. 1 2. 6 . 003
100. 0 6. 6 0. 003
25.3 26.23 0. 013 11.4 22. 6 . 006
8. 2 30. 62 . 011 31. 0 1.7 . 002e 24. 1 9. 8 . 010
100. o 1 14. 6 1 o. 008
52. 63 !_ ______ _! 14.0
17.35 49. 18
8. 76
65. 42
26. 32 8. 24 I 1. 43
47. 09 , _______ _J 12. 3
I I
~ ~ t?i [/}.
00 ~
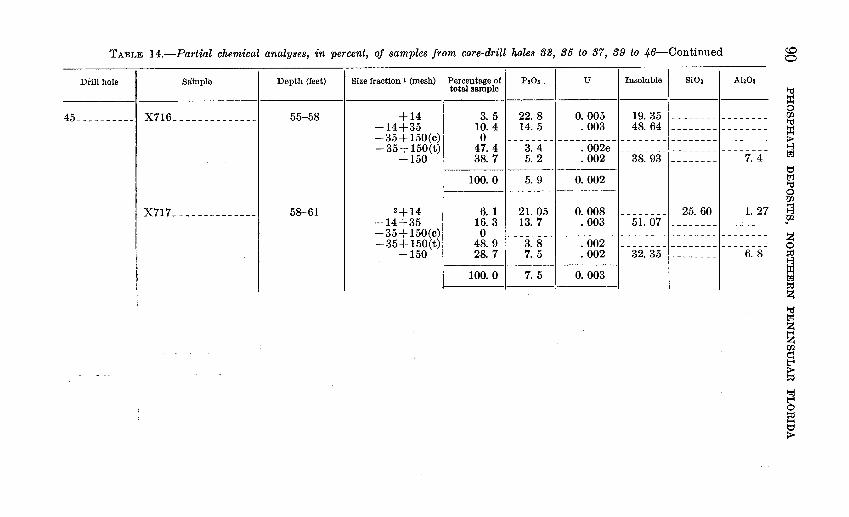
TABLE 14.-Partial chemical analyses, in percent, of samples from core-drill holes 32, 35 to 37, 39 to 46-Continued
Drill hole Sample Depth (feet) Size fraction I (mesh) Percentage of total sample
P206 u Insoluble Si02 Ah03
45 __________ )(716 ______________ 55-58 +14 3. 5 22. 8 0.005 19. 35 -------- ---------14+35 10. 4 14. 5 . 003 48. 64 -------- ---------35+ 150(c) 0 -------- ---------- -------- -------- ---------35+150(t) 47. 4 3. 4 . 002e -------- -------- --------
-150 38. 7 5. 2 . 002 38.93 -------- 7. 4
100. 0 5. 9 0. 002
JC717 ______________ 58-61 2+14 6. 1 21. 05 0. 008 -------- 25. 60 1. 27 -14+35 16.3 13. 7 . 003 51. 07 -------- ---------35+150(c) 0 -------- ---------- -------- -------- --------
I -35+150(t) 48. 9 3. 8 . 002 -------- -------- --------f -150 28.7 7. 5 . 002 32. 35 -------- 6. 8 i ,, i' 100.0 7. 5 0. 003
~ 0
~ 0 [/l
~ l"..1
t;j l"..1 t;;j 0 U2 ~
~ sn z 0 ~
~ l"..1
~ '"d l"..1
~ ~ ~ ~
1"'.1 t'4 0 ~ ~ t;j
>
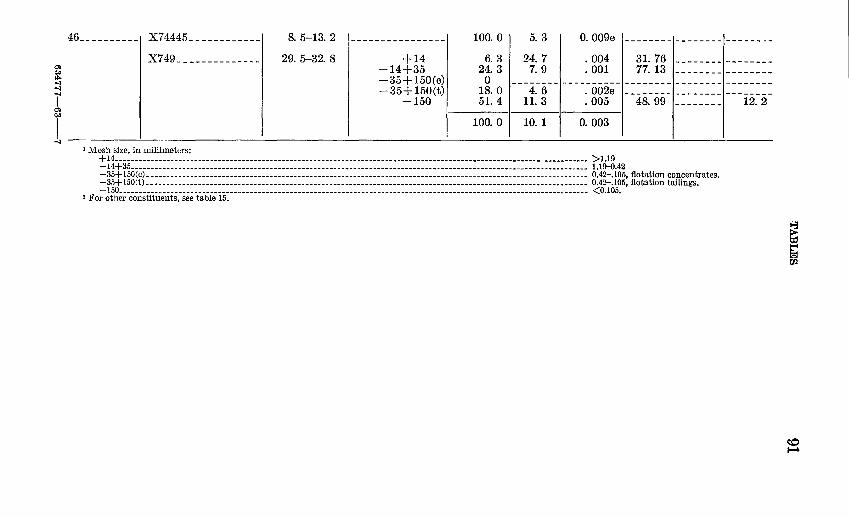
~ ~
""' ""' ""' T ~ ~
I -'1
46 __________ , }[74445 ____________ 8. 5-13. 2 ---------------- 100.0 5. 3
}[749 ______________ 29. 5-32. 8 +14 6. 3 24.7 -14+35 24. 3 7. 9 -35+150(c) 0 -35+150(t) 18. 0 4. 6
-150 51. 4 11. 3
100.0 10. 1 I 0. 003
1 Mesh size, in millimeters: + 14.---------------------------------------------------------------------------------------------------------------------- > 1.19 -14+35_----------- ------------------------------------------------------------------------------ ------------------------- 1.19--0.42 =~~t ~gg~~?:::::::::::: =: :::::::: =::::: ::::::::::::::::::::::::::::::::::::::::::::::::::::::::::::::::::::::::::::::::::: 8:~= :~8g; :g~:~~g~ ~~ft{i;~s~rates. -150.-------------------------------------------------------------- ---------------------- --------------------------------- <0.105.
2 For other constituents, see table 15.
~ ~ i'].l
co """'
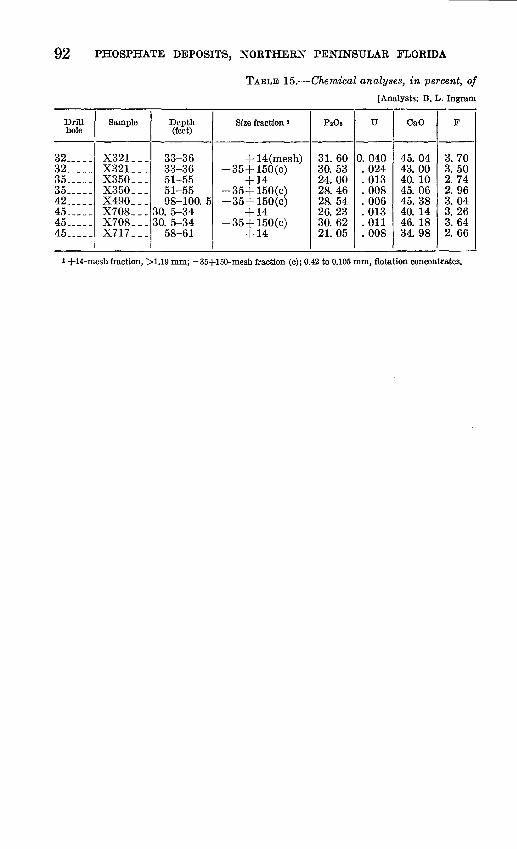
92 PHOSPHATE DEPOSITS, NORTHERN PENINSULAR FLORIDA
Drill Sample Depth hole (feet)
32 ___ -- X32l ___ 33-36 32 _____ X32L __ 33-36 35 _____ X350 ___ 51-55 35 _____ X350 ___ 51-55 42 ____ - X490 ___ 98-100. 5 45 ____ - X708 __ - 30. 5-34 45 ____ - X708 ___ 30. 5-34 45 ____ - X717 ___ 58-61
TABLE 15.-Chemical analyses, in percent, of
[Analysts: B. L. Ingram
Size fraction 1 P20s u CaO F
+ 14(mesh) 31. 60 0. 040 45.04 3. 70 -35+150(c) 30.53 . 024 43.00 3.50
+14 24.00 . 013 40. 10 2. 74 -35+ 150(c) 28. 46 . 008 45.06 2. 96 -35+ 150(c) 28.54 . 006 45. 38 3. 04
+14 26. 23 . 013 40. 14 3. 26 -35+150(c) 30. 62 . 011 46. 18 3. 64
+14 21. 05 . 008 34.98 2. 66
1 +14-mesh fraction, >1.19 mm; -35+150-mesh fraction (c); 0.42 to 0.105 mm, flotation concentrates.
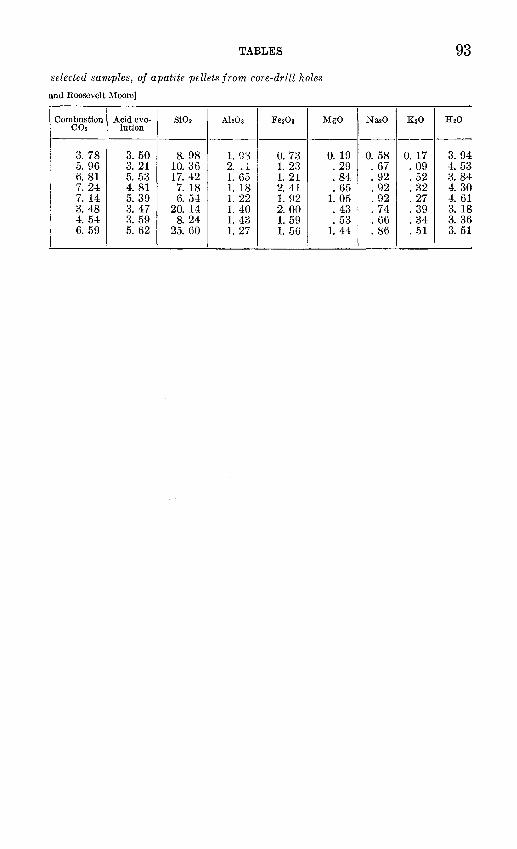
TABLES
selected samples, of apatite pellets from core-drill holes
and Roosevelt Moore]
Combustion Acid evo- Si02 Ah03 Fe203 C02 lution
3. 78 3. 50 8. 98 t ~s I 0. 73 5. 96 3. 21 10.36 2. ~l 1. 23 6. 81 5. 53 17. 42 1. 65 1. 21 7. 24 4. 81 7. 18 1. 18 2. 41 7. 14 5. 39 6. 54 1. 22 1. 92 3. 48 3. 47 20. 14 1. 40 2. 00 4. 54 3. 59 8. 24 1. 43 1. 59 6. 59 5. 62 25. 60 1. 27 1. 56
93
MgO Na20 K20 H20
---0. 19 0. 58 0. 17 3. 94 . 29 . 67 . 09 4. 53 . 84 . 92 . 52 3. 84 . 65 . 92 . 32 4. 30
1. 05 . 92 . 27 4. 61 . 43 . 74 . 39 3. 18 . 53 . 66 . 34 3. 36
1. 44 . 86 . 51 3. 51

TABLE 16.-Partial chemical analyses, in percent, of samples of phosphatic beds of the Hawthorn formation from exposures in northern peninsular Florida
[<0.001 is considered to be 0 percent eU in calculating total eU content of samples. Analysts: S.M. Berthold, J. W. Budinsky, G.J. Daniels, Glen Edgington, B. A. McCall, Roosevelt Moore, T. D. Murphy, Jr., R. E. Smith, Ann Sweeney, W. P. Tucker, Jr., J. L. Waring]
Sample Location of sample
A. SAMPLES FROM HAMILTON COUNTY
Distance above river level (feet)
Thickness I Size fraction tj Percentage (feet) (mesh) of total
sample P20s u eU Insoluble AbO a
-------1 I I I I I •---•---•---•---
303-------------------1 Map locality 2: West bank of Alapaha River, NE~NE~
sec. 20, T. 2 N., R. 13 E. 302 ________________________ do ________ -------- ___ ----- ______ ----------_ 30L _______________________ do ___________ ----- ______________ ------ ____ _ 299 ________________________ do ________________________________________ _ 298 ________________________ do __________________________ --- ___________ _ 298-303 combined __________ do ____________ -- ____________ ---------- ____ _
308 ___________________ Map locality 4: West bank of Suwannee River, 100 yd be
low Benton Bridge, SW~SW~ sec. 31, T.1N.,R.17E.
!8t =: == = =====::::: == t:: ==~~============= ========= ======= ::: ==== = ====
305-308 com bined ____ J _____ do _______ ---------- _________ ------- _______ _
42-48
39-42 32.5-39 31.5-32.5
29-31.5 29-48
6-18
3.5-6 2. 5-3.5
o- 2.5
Q-18
6
3
6. 5~--------------1 1 --------------2.5 --------------
19
12
2. 5~--------------1 1 --------------2.5 +14
-14+35 -35+150(c) -35+150(t)
-150
100.0
100.0 100.0 100.0 100.0 100.0
100.0
100.0 100.0 45.6 11.1 0
14.4 28.9
100.0
100.0
3. 7
3. 9 ----------3. 5 ----------
15.1 ----------7.8 ----------4.8 ----------
4. 8 ----------
"l········l 5. 8 ----------5. 3 0. 005 9.8 .003
5.3 .6
4.4
4.5
.001
.002
0.003
0.004
. ,., ~--·······r········ <. 001 ---------- ----------. 005 ---------- ----------
<. 001 ---------- ----------• 002 ---------- ----------
. 001 ·----------·----------
<. 001 r········r········ . 002 ---------- -------··--. 003 22.4 ----------. 002 ---------- ----------
~: ~~ ~-----isxr------6:8 0.002
0. 001 ·----------·----------
~ t+;:..
~ 0 w
~ t;j
~ t;j "'d 0 ~
}11
~ 0 p:j
~ ~ ~
I =:d
~ 0 =:d t3 1>-
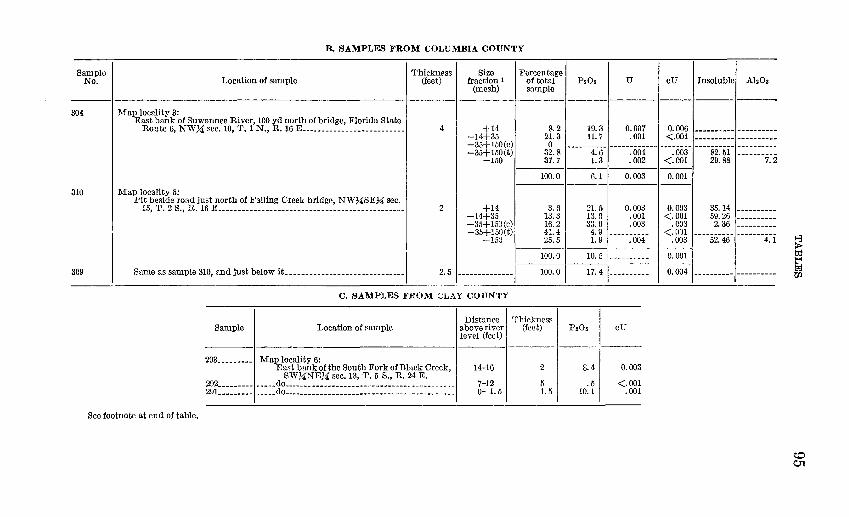
Sample No. Location of sample
B. SAMPLES !<'ROM COLUMBIA COUNTY
Thickness I Size (feet) fraction I
(mesh)
Percentage of total I P20s sample
u eU Insoluble! AbOs
---1 I I I I •---·---304
310
309
Map locality 3: East bank of Suwannee River, 100 yd north of bridge, Florida State
Route 6, NW74' sec. 10, 'r. 1 N., R. 16 E--------------------------
Map locality 5: Pit beside road just north of Falling Creek bridge, NW74'SEU sec.
15, 'r. 2 S., R. 16 E-----------------------------------------------
Smno'"' ""mple 310, end ju't below ''------------------------------1
4
2
2.5
+14 -14+35 -35+150(c) -35+150(t)
-150
+14 -14+35 -35+150(c) -35+150(t)
-150
8.2 21.3 0
32.8 37.7
100.0
3.6 13.3 16.2 41.4 25.5 --
100.0 --100.0
C. SAMPLES FROM CLAY COUNTY
See footnote at end of table.
Sample Location of sample
293 ________ -' Map locality 6: East bank of the South Fork of Black Creek,
SWUNE74' sec. 13, T. 5 S., R. 24 E.
~~i:: :::::::I::::: ~g::::: ::::::::::::::::::::::::::::::::::::::
Distance I 'rhi~kness above river (feet) level (feet)
14-16
7-12 0- 1. 5
2
5 1.5
19.3 11.7
------4~6-
1.3
6.1
21.5 13.0 33.9
4. 9 1.9
10.5
17.4
P20s
8.4
.5 10.1
0.007 .001
------------.004 .002
0.003 -----
0.003 .001 .003
----------.004
---------· ----------
eU
0.003
<.001 .001
.. .,. r·-------r·-------<.001 ---------- ----------
-~:&&r ----~r~r =======;~~ 0.001 ---
0.003 35.14 <.001 59.2G
.003 2.36 <.DOl ---------- ----------
.003 52.46 4.1
0.001
0.004 --- .. ------ ----------
~ t:d ~ t."'.. UJ
~ ~
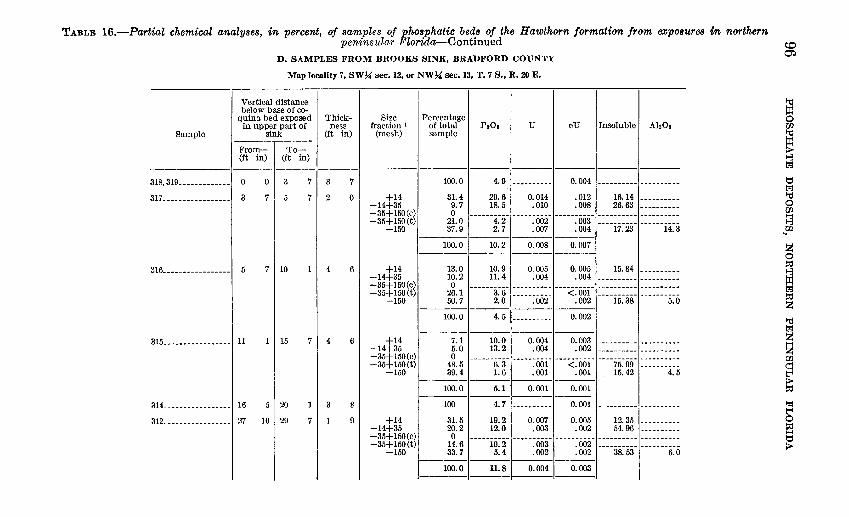
TABLE 16.-Partial chemical analyses, in percent, of samples of phosphatic beds of the Hawthorn formation from exposures in northern peninsular Florida-Continued
D. SAMPLES FROM BROOKS SINK, BRADFORD COUNTY
Map locality 7, SWU sec.12, or NW~ sec. 13, T. 7 S., R. 20 E.
Sample
I Vertical distance I below base of co-
q?ina bed expos~d Thickm upper part 01 I ness
sink (ft in)
From-1 To-(ft in) (ft in)
Size fraction 1
(mesh)
IPenwt,.el of total 1 P20s sample
u eU I Insoluble I AbOs
-------1 1---1---1-----1 I •---•---•----
315 _________________ , 11 1 I 15 7 4
3 314 _________________ 116 5120
312_________________ 27 10 29 7
6
8
+14 -14+35 -35+150(c) -35+150(t)
-150
91 +14 -14+35 -35+150(c) -35+150(t)
-150
4.9
20.6 18.5
0.014 .010
0.004
.012
.008 ~g: M 1:::::::::: 4.2 2. 7
.002
.007 ~ gg: ~----i7:2aT _____ i4:3
10.2 0.008 0.007 ___ , ____ , ____ , ___ _ 10.9 11.4
0.005 .004 0: gg~ '----~~~~-~=:::::::::
------a:6-l: :::::::::1---<:ooi -I:::::::::: 1:::::::::: 2. 0 . 002 • 002 15. 38 5. 0
--1----·----·----4.5 0.002
7.1 I 10.0 I 0. 004l 0. 003
1
__________
1
_________ _
ii:; -----~i~i- -----~iii- ---<~;;- ====Ig~~~= =======i~~ 100.0 I 5.1
1---- ·---·---100 4. 7
0.001 0.001
0.001
~: ~ 1-----~~~~-1--·-:~~~-1- ---:~ ~~~-1- ---~~~~~-1= = ======= = 14.6 10.2 .003 .002 ---------- ----------33. 7 5. 4 . 002 . 002 38. 53 6. 0
100.0 11.8 0.004 0.003
eo 0':1
1-d
~ [/1
~ l"'..
t::::1 l"'.. 1-d 0 ~ 1-3
... w
z 0 ~
~ l"'.. ~ z 1-d l"'..
~ z ~ > ~
~ 0 ~ 1-4 t::::1 >
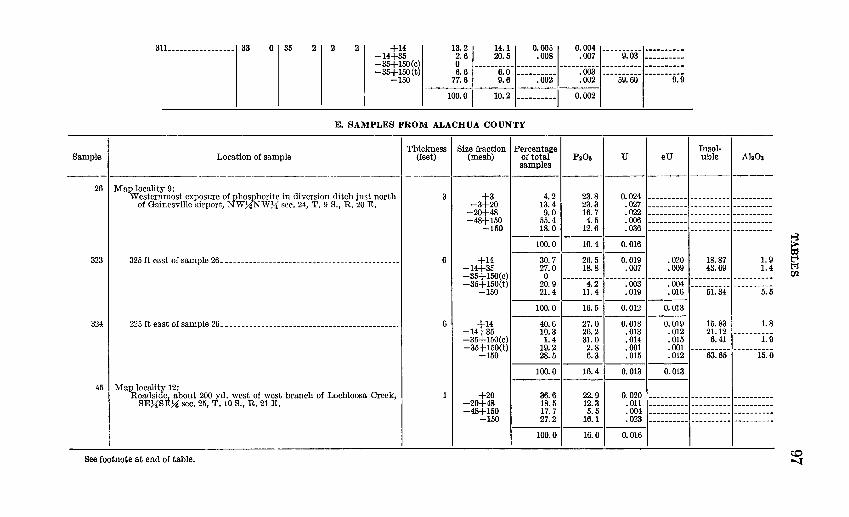
311 _________________ , 33 0 I 35 2 I 2 2 I +14 -14+35 -35+150(c) -35+150(t)
-150
13. 2l 14.1 I 0. 005
1
0. 004
1
__________
1
_________ _
5· 6 -----~:~- _____ :~~~- _____ :~~- -----~:~~- ========== 6. 6 6. 0 ---------- . 003 ---------- ----------
77. 6 9. 6 • 002 . 002 59. 60 9. 9 ----1 ·---·---
100.0 10.2 0.002
E. SAMPLES FROM ALACHUA COUNTY
Sample Location of sample
26 I Map locality 9: Westernmost exposure of phosphorite in diversion ditch just north
of Gainesville airport, NWJ4"NWJ4 sec. 24, T. 9 S., R. 20 E.
323 I 325ft east of sample 26---------------------------------------------l
324 I 225ft east of sample 26---------------------------------------------l
45 I Map locality 12: Roadside, about 200 yd. west of west branch of Lochloosa Creek,
SEJ4"SEJ4" sec. 25, '1'. 10 S., R. 21 E.
See footnote at end of table.
Thickness I Size fraction I Percentage (feet) (mesh) of total I P20a
samples
31 +3 4.2 23.8 -3+20 13.4 23.3
-20+48 9.0 16.7 -48+150 55.4 4.5
-150 18.0 12.6 -----100.0 10.4 -----
61 +14 30.7 26.5 -14+35 27.0 18.8 -35+150(c) 0 -35+150(t) 20.9 4.2
-150 21.4 11.4 ---
100.0 16.5
61 ---
+14 40.6 27.0 -14+35 10.3 26.2 -35+150(c) 1.4 31.0 -35+150(t) 19.2 2.8
-150 28.5 6.3 -----100.0 16.4 -----
+20 36.6 22.9 -20+48 18.5 12.3 -48+150 17.7 5. 5
-150 27.2 16.1 -----100.0 16.0 --------------
u
0.024 .027 .022 .006 .036
---0.016
---0.019 .007
-----~iiii3-
.019 ---
0.012 ---
0.018 • 013 .014 .001 .015
---0.013
---
eU Insoluble AbOs
---·---·---
---------- ---------- -------------------- ---------- -------------------- ---------- -------------------- ---------- -------------------- ---------- ----------
.020 18.87 1.9
.009 43.69 1.4
-----:oo4: ---------- ----------.016 51.34 5.5
---0.013 ----0.019 15.83 1.8 . 012 21.12 ----------.015 6.41 1.9 .001 ---------- ----------.012 63.65 15.0
----0.013
---o. 020 __________
1 _________ T _________
. 011 ---------- ---------- ----------
. 004 ---------- ---------- ----------
. 023 ---------- ---------- -------------0.016
I I I
~ t:d
~ Ul
c:o -4
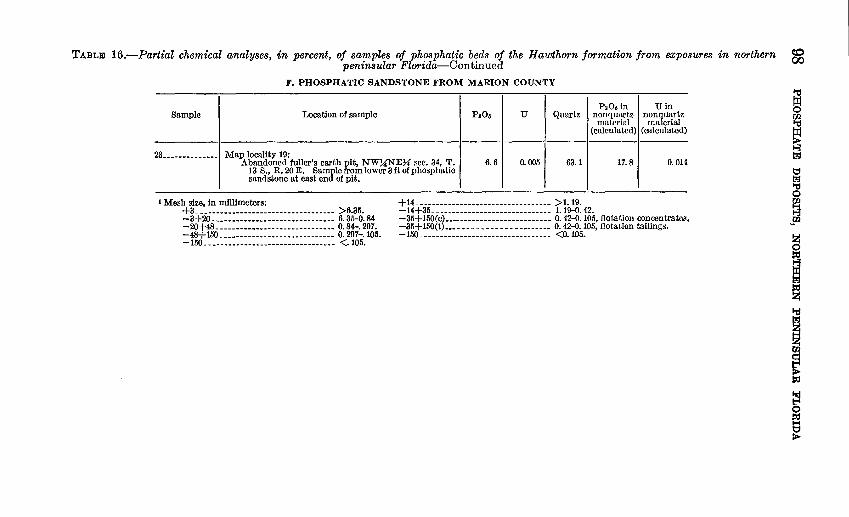
TABLE 16.-Partial chemical analyses, in percent, of samples of phosphatic beds of the Hawthorn formation from exposures in northern peninsular Florida-Continued
F. PHOSPHATIC SANDSTONE FROM MARION COUNTY
P205in Uin Sample Location of sample PsOa u Quartz nonquartz non quartz
material material (calculated) (calculated)
23 ______________ Map locality 19:
Abandoned fuller's earth pit, NW~NE~ sec. 34, T. 6.6 0.005 63.1 17.8 0.014 13 S., R. 20 E. Samte from lower 3ft of phosphatic sandstone at east en of pit.
t Mesh size, in millimeters: +14_ --------------------------------- >1.19. -14+35_ ----------------------------- 1.19-Q. 42. +3- ---------------------------------- >6.35.
-3+20- ------------------------------ 6. 35-Q. 84 -35+150(c) ___________________________ 0. 42-D. 105, flotation concentrates. -20+48_ ----------------------------- 0. 84-.297. -35+150(t)------------------------ 0. 42-{).105, flotation tailings. -48+150_ ---------------------------- 0. 297-.105. -150_ -------------------------------- <O. 105. -150_ -------------------------------- <. 105.
co 00
~ Ul
~ '=' l:lj "d 0 re }A
~
i ~ 1-d l:lj
~ @ ~ ~ 0 t:d 1-1
~
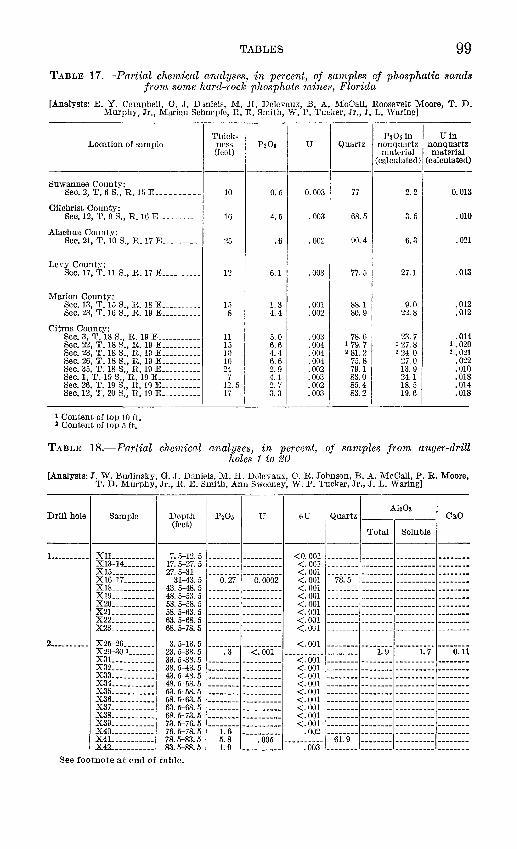
TABLES 99
TABLE 17.-Partial chemical analyses, in percent, of sam,ples of phosphatic sands from some hard-rock phosphate mines, Florida
[Analysts: E. Y. Campbell, G. J. Daniels, M. H. Delevaux, B. A. McCall, Roosevelt Moore, T. D. Murphy, Jr., Marian Schnepfe, R. E. Smith, W. P. Tucker, Jr., J. L. Waring]
Location of sample
Suwannee County: Sec. 2, T. 6 S., R. 15 E----------
Gilchrist County: Sec. 12, T. 9 S., R. 16 E ___________
Alachua County: Sec. 21, T. 10 S., R. 17 E_ _________
Levy County: Sec. 17, T. 11 S., R. 17 E __________
Marion County: Sec. 13, T. 15 S., R. 18 E __________ Sec. 23, T. 16 S., R. 19 E __________
Citrus County: Sec. 3, T. 18 S., R. 19 E ___________ Sec. 22, T. 18 S., R. 19 E __________ Sec. 23, T. 18 S., R. 19 E __________ Sec. 26, T. 18 S., R. 19 E __________ Sec. 35, T. 18 S., R. 19 E __________ Sec. 1, T. 19 S., R. 19 E ___________ Sec. 26, T. 19 S., R. 19 E __________ Sec. 12, 'I. 20 S., R. 19 E __________
1 Content of top 10 ft. 2 Content of top 5 ft.
Thick- I
ness P205 (feet)
----
10 0.5
16 4. 5
25 .6
12
I 6.1
I 15 I 1.3 8 4.4
11 5.0 15 6.6 10 4.4 10 6.6 24 2. 9
7 4.1 12.5 2. 7 17
I 3.3
P205in Uin u Quartz non quartz non quartz
material material (calculated) (calculated)
----
0.003 77 2.2 0.013
. 003 68.5 3. 5 .010
. oo:: 90.4 6.3 .021
-~I 77.5 27.1 .013
. 001 88.1 9.0 .012
.002 80.9 22.8 .012
. 003 78.6 23.7 .014
.004 1 79.7 I 27.8 1 .020
. 00,1 2 81.2 2 24.0 2 . 021
.004 75.8 27.0 .022
.002 79.1 13.9 .010
. 003 83.0 24.1 .018
. 002 85.4 18.5 .014
.003 83.2 19.6 .018 i
TABLE 18.-Partial chemical analyse~;, in percent, of samples from auger-drill holes 1 to 20
[Analysts: J. W. Budinsky, G. J. Daniels, M. II. Delevaux, C. R. Johnson, B. A. McCall, P.R. Moore, T. D. Murphy, Jr., R. E. Smith, Ann Sweeney, W. P. Tucker, Jr., J. L. Waring]
Drill hole Sample Depth (feet)
u Ah03
eU Quartz CaO
Total Soluble ----1------1-----1----- ---------------------
L--------- xu __________ _ X13-14 _______ _ X15 __________ _ XHH7 _______ _ XIS __________ _ Xl9 __________ _ X20 __________ _ X2L _________ _ X22 __________ _ X23 __________ _
2---------- X25-26 _______ _ X29-30 t ______ _ X3L _________ _ X32 __________ _ X33 __________ _ X34 __________ _ X35 __________ _ X36 __________ _ X37 __________ _ X38 __________ _ X39 __________ _ X40 __________ _ X4L ________ _ X42 __________ _
7. 5-12.5 17.5-27.5 27.5-31
31-43. 5 43.5-48.5 48.5-53. 5 53. 5-58. 5 58.5-63.5 63.5-68.5 68.5-78.5
3. 5-13. 5 23.5-33.5 33.5-38.5 38.5-43.5 43.5-48.5 48.5-53.5 53.5-58.5 58.5-63.5 63.5-68.5 68.5-73.5 73.5-76.5 76.5-78.5 78. 5-S.3. 5 83.5-88.5
See footnote at end of table.
o. 27 o. 0002
1.6 5. 8 • 005 1. 9
<0.001 <.001 <.001 <.001 <.001 <.001 <.001 <.001 <.001 <.001
<.001 <. 001 <.001 <.001 <.001 <.001 <.001 <.001 <.001
.002
78.5
---------- 61.9 -------- ---------- -------.003 -------- -------- ---------- --------
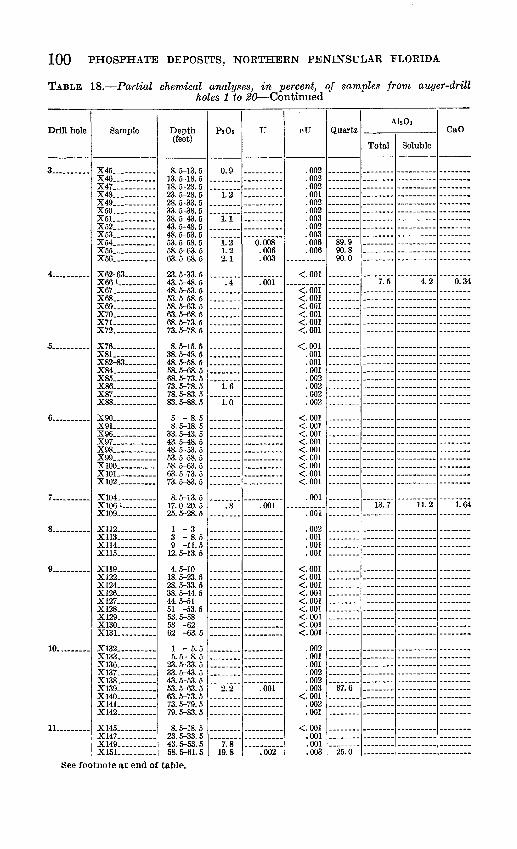
100 PHOSPHATE DEPOSITS, NORTHERN PENINSULAR FLORIDA
TABLE 18.-Partial chemical analyses, in percent, of samples from auger-drill holes 1 to 2G-Continued
Drill hole Sample Depth (feet)
u AbO a
eU Quartz CaO
Total Soluble ----1-------1-----1----1---- -----------------
3----------
4 _________ _
.') _________ _
6----------
X45 __________ _ X46 __________ _ X47 __________ _ X48 __________ _ X49 __________ _ X50 __________ _
X5L----------X52 __________ _ X53 __________ _ X54 __________ _ X55 __________ _ X56 __________ _
X62-63-------X66 '----------X67 __________ _ X68 __________ _ X69 __________ _ X70 __________ _
X7L.---------X72 __________ _
X76 __________ _
X8L---------X82-83--------X84 __________ _ X85 __________ _
X86.---------X87.----------X88 __________ _
X90 __________ _
X9L----------X96 __________ _ X97 __________ _ X98 __________ _ X99 __________ _ X100 _________ _
Xl01----------X102 _________ _
7---------- X104 _________ _ X106 '---------X109 _________ _
g__________ Xl12 _________ _ Xl13 _________ _ Xl14 _________ _ Xl15 _________ _
·9 _________ _ Xl19 _________ _ Xl22 _________ _ X124 _________ _ X126 _________ _
X127 ----------X128 _________ _ Xl29 _________ _ Xl30 _________ _
X13L---------10 ________ _ X132.---------X133 _________ _
X136 _________ _ Xl37 _________ _ Xl38 _________ _ X139 _________ _ Xl40 _________ _
X14L--------X142 _________ _
8. 5-13.5 13.5-18.5 18.5-23.5 23.5-28.5 28.5-33.5 33.5-38.5 38.5-43.5 43.5-48.5 48.5-53.5 53.5-58.5 58.5-63.5 63.5-68.5
23.5-33.5 43.5-48.5 48.5-53.5 53.5-58.5 58.5-63.5 63.5-68.5 68.5-73.5 73.5-78.5
8. 5-15.5 38.5-48.5 48.5-58.5 58.5-68.5 68.5-73.5 73.5-78.5 78.5-83.5 83.5-88.5
5 - 8. 5 8. 5-18.5
33.5-43.5 43.5-48.5 48.5-53.5 53.5-58.5 58.5-63.5 63.5-73.5 73.5-83.5
8. 5-13.5 17.o-20. 5 25.5-28.5
1 - 3 3 - 8. 5 9 -11.5
12.5-13.5
4. 5-10 18.5-23.5 28.5-33.5 38.5-44.5 44.5-51 51 -53.5 53.5-58 58 -62 62 -63.5
1 - 5.5 5.5-8.5
23. 5-.'~3. 5 33.5-43.5 43.5-53.5 53.5-63.5 63.5-73.5 73.5-79.5 79.5-83.5
u _________ X145__________ 8. 5-18.5 X147 ---------- 23.5-33. 5 X149__________ 43. 5-53.5 X15L--------- 58.5-61.5
See footnote at end of table.
0. 9 . 002 -------- -------- ---------- ---------------- ---------- . 002 -------- -------- ---------- ---------------- ---------- . 002 -------- -------- ---------- --------
1.2 ---------- • 001 -------- -------- ---------- ---------------- ---------- . 002 -------- -------- ---------- ---------------- ---------- . 002 -------- -------- ---------- --------
1. 1 ---------- . 003 -------- -------- ---------- ---------------- ---------- . 002 -------- -------- ---------- --------
---i~2-- ---o~oos·· : gg~ --89~9-- ======== ========== ======== 1.2 .006 .006 90.8 ------------------ --------2. 1 . 003 ---------- 90.0 -------- ---------- --------
-------- ---------- <- 001 -------- -------- ---------- --------. 4 . 001 ---------- -------- 7. 5 4. 2 0. 34
-------- ---------- <- 001 -------- -------- ---------- ---------------- ---------- <- 001 -------- -------- ---------- ---------------- ---------- <- 001 -------- -------- ---------- ---------------- ---------- <- 001 -------- -------- ---------- ---------------- ---------- <- 001 -------- -------- ---------- ---------------- ---------- <- 001 -------- -------- ---------- --------
1. 6 ----------
1. 0 ----------
2. 2 .001
7.8 19.8 • 002
<.001 .001 .001 .001 .002 .002 .002 .002
<.001 <.001 <.001 <.001 <.001 <.001 <.001 <.001 <.001
. 001
.002
.001
.001
. 001
<.001 <.001 <.001 <.001 <.001 <.001 <.001 <.001 <.001
.002
. 001
. 001
.002
.002
.003 <.001
.002 • 001
<.001 .001 .001 .003
87.6 -------- ---------- --------
25.0 -------- ---------- --------
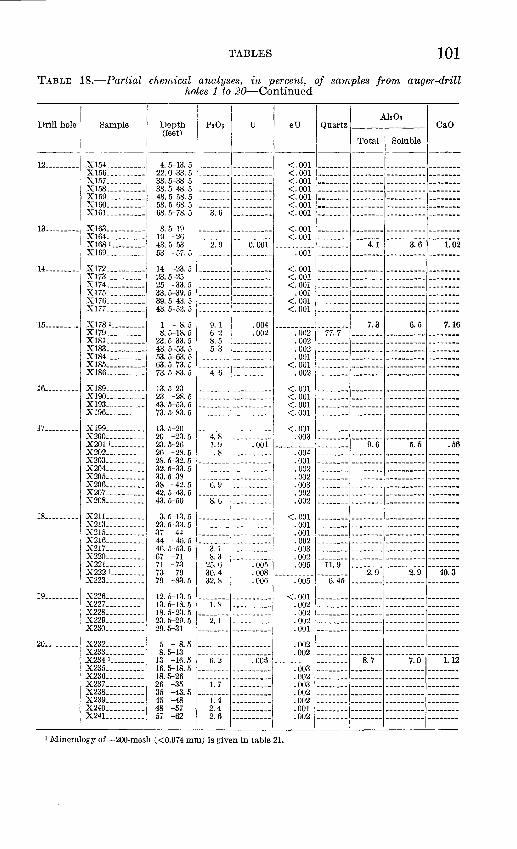
TABLES 101
TABLE 18.-Partial chernical analyses, in percent, of samples from auger-drill holes 1 to 20-Continued
AhOa Drill hole Sample u eU Quartz CaO
Total Soluble ----1------i-----1--- ---------------------12 ________ _ X154 _________ _
X156 _________ _ X157 _________ _ X158 _________ _ X159 _________ _ X160 _________ _ X16L _______ _
13--------- X163 _________ _ X164 _________ _ X168 t ________ _ X169 _________ _
14--------- X172 _________ _ X173 _________ _ X174 _________ _ X175 _________ _ X176 _________ _
X177 ----------
15 _______ -- X178 ! ________ _ X179 _________ _ X18L _______ _ X183 _________ _ X184 _________ _ X185 _________ _ X186 _________ _
4. 5-13.5 22. D--33. 5 33.5-38.5 38.5-48.5 48.5-58.5 58.5-68.5 68.5-78.5 3. 6 ----------
<.001 <.001 <.001 <.001 <.001 <.001 <.001
8. 5-19 -------- ---------- <. 001 -------- -------- ---------- --------19 -26 -------- ---------- <. 001 -------- -------- ---------- --------43. 5-53 2. 9 0. 001 ---------- -------- 4. 1 3. 6 1. 02 53 -57. 5 -------- ---------- . 001 -------- -------- ---------- --------14 -23. 5 I________ __________ <. oo1 _________________________________ _
~: ~~g: ~ I======== ========== ~Jgt ======== :::::=== ========== ======:: 39.5-43.5 ------------------ <.001 ----------------------------------43.5-52.5 -------- ---------- <. 001 -------- -------- ---------- -------·
1 - 8. 5 8. 5-18. 5
23.5-33.5 43.5-53.5 53. 5-63.5 63.5-73.5 73.5-83.5
9.1 6. 2 8.5 5. 3
. 004 ---------- -------- 7. 3 6. 5 7.16
. 002 . 002 77. 7 -------- ---------- --------.002 -------- -------- ---------- -------.002 -------- -------- ---------- -------.001 -------- -------- ---------- --------
-------- ---------- <. 001 -------- -------- ---------- --------4. 6 ---------- .002 -------- -------- ---------- --------
16_________ X189__________ 13. 5-23 X190__________ 23 -28.5 X193__________ 43. 5-53. 5 X196__________ 73. 5-83. 5
<.001 <.001 <.001 <.001
17--------- X199 _________ _ X200 _________ _ X2011 ________ _ X202 _________ _ X203 _________ _ X204 _________ _ X205 _________ _ X206 _________ _
X207 ----------X208 _________ _
18--------- X21l _________ _ X213 _________ _
: X215 _________ _ X216 _________ _
X217 ----------X220 _________ _ X22L ________ _ X222 1 ________ _ X223 _________ _
19--------- X226 _________ _ X227 _________ _ X228 _________ _ X229 _________ _ X230 _________ _
20--------- X232 _________ _ X233 _________ _ X234 t ________ _ X235 _________ _ X236 _________ _
X237 ----------X238 _________ _ X239 _________ _ X240 _________ _ X24L_ _______ _
13. 5-20 -------- ---------- <. 001 -------- --·----- ---------- --------20 -23. 5 4. 8 ---------- . 003 -------- -------- ---------- --------23. 5-26 1. 9 . 001 ---------- -------- 9. 6 5. 5 . 56 26 -28. 5 . 8 . 004 -------- -------- ---------- --------28.5-32.5 -------- ---------- . 001 -------- -------- ---------- --------32. 5-33.5 -------- ---------- . 002 -------- -------- ---------- --------33.5-38 -------- ---------- . 002 ________ , ________ ---------- --------38 -42. 5 6. 9 . 003 -------- -------- ---------- --------
!~: t~· 5 ---8:6-- ==========I : gg~ ======== ======== ========== ========
3. 5-13.5 --------'----------1 <. 001 -------- -------- ---------- -------·
~~- 5-~~- 51==================, : 88i ======== ======== :::::::::: :::::::: 44 -46. 5 -------- ---------- . 002 -------- -------- ---------- --------46. 5-53. 5 3. 1 ---------- . 003 -------- -------- ---------- --------67 -71 8. 3 ' . 002 -------- -------- ---------- --------71 -73 25. 6 . 005 . 005 11. 9 -------- ---------- --------73 -79 30. 4 . 008 ---------- -------- 2. 9 2. 9 40.3 79 -83. 5 32.8 . 006 . 005 6. 45 -------- ---------- --------
12.5-13.5 13.5-18.5 18.5-23.5 23.5-29.5 29.5-31
5 - 8.5 8. 5-13
13 -16.5 16.5-18.5 18.5-26 26 -35 35 -43.5 45 -48 48 -57 57 -62
1.8
2.1
<.001 .002 . 002 .002 . 001
-------- ---------- . 002 -------- -------- ---------- ---------------- ---------- . 002 -------- -------- ---------- --------
6.2 . 006 ---------- -------- 8. 7 7. 0 1.12 -------- ---------- . 003 -------- -------- ---------- -------· -------- ---------- . 002 -------- -------- ---------- --------
1.7 . 003 -------- -------- ---------- ------·--------- ---------- . 002 -------- -------- ---------- -------
1. 4 ----------1 2. 4 , _________ _
2. 6 ----------1 .002 -------- -------- ---------- -------.001 -------- -------- ---------- -------.002 -------- -------- ---------- --------
ll\iineralogy of -200-mesh ( <0.074 mm) is given in table 21.
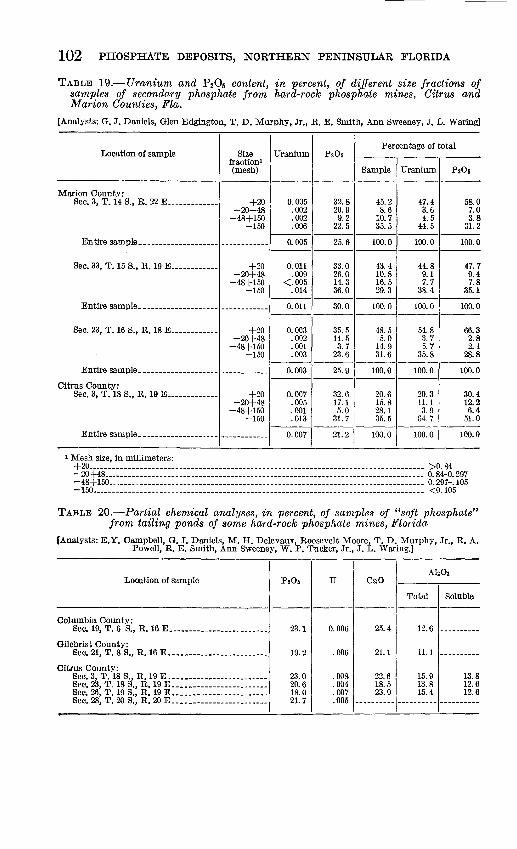
102 PHOSPHATE DEPOSITS, NORTHERN PENINSULAR FLORIDA
TABLE 19.-Uranium and P205 content, in percent, of different size fractions of samples of secondary phosphate from hard-rock phosphate mines, Citrus and Marion Counties, Fla.
[Analysts: G. J. Daniels, Glen Edgington, T. D. Murphy, Jr., R. E. Smith, Ann Sweeney, J. L. Waring]
Location of sample Size Uranium P20s Percentage of total
fraction! (mesh)
---------------1-----1----------------Marion County:
Sec. 3, T. 14 S., R. 22 E------------- +20 -20+48
-48+150 -150
Entire sample ____________________ ------------
Sec. 33, T. 15 S., R. 19 E------------ +20 -20+48
-48+150 -150
Entire sample ____________________ ------------
Sec. 23, T. 16 S., R. 18 E____________ +20 -20+48
-48+150 -150
Entire sample_------------------- -----------
Citrus County: Sec. 3, T. 18 S., R. 19 E------------- +20
-20+48 -48+150
-150
Entire sample ____________________ ------------
1 Mesh size, in millimeters:
0. 005 32.8 .002 20.9 .002 9. 2 .006 22.5
------0.005 25.6
------0.011 33.0
.009 26.0 <.005 14.3
.014 36.0 ------
0.011 30.0 ------
0.003 35.5 .002 14.5 .001 3. 7 .003 23.6
------0.003 25.9
------0.007 32.6
.005 17.1
.001 5.0
.013 31.7 ------
0.007 21.2
45.2 47.4 58.0 8.6 3.6 7.0
10.7 4. 5 3.8 35.5 44.5 31.2
---------100.0 100.0 100.0
----------43.4 44.8 47.7 10.8 9.1 9.4 16.5 7. 7 7.8 29.3 38.4 35.1
---------100.0 100.0 100.0
---------48.5 54.8 66.3 5.0 3. 7 2.8
14.9 5. 7 2.1 31.6 35.8 28.8
---------100.0 100.0 100.0
---------20.6 20.3 30.4 15.8 11.1 12.2 28.1 3.9 6.4 35.5 64.7 51.0
---------100.0 100.0 100.0
+20 ________ ------------------- _ ------------- _ --- _ -------- ___ ---- _ --- ____ --- _ ------- _ ___ _ >O. 84 -20+48 _______________ --------------------------------------- ·-·· ---------------.------- 0. 84--0. 297 -48+ 150 _____ --------------------------------------------------------------------------- 0. 297-. 105 -150. _____ -------------- __ -------------------------------------------- _ -------------- _ __ <O. 105
TABLE 20.-Partial chemical analyses, in percent, of samples of "soft phosphate" from tailing ponds of some hard-rock phosphate mines, Florida
[Analysts: E.Y. Campbell, G. J. Daniels, M. H. Delevaux, Roosevelt Moore, T. D. Murphy, Jr., R. A. Powell, R. E. Smith, Ann Sweeney, W. P. Tucker, Jr., J. L. Waring.]
Location of sample u CaO
Total Soluble -------------------1----------------Columbia County:
Sec. 19, T. 6 S., R. 16 E-------------------------
Gllchrist County: Sec. 21, T. 8 S., R. 16 E-------------------------
Citrus County: Sec. 3, T. 18 S., R.19 E------------------------Sec. 23, T. 18 S., R. 19 E-----------------------Sec. 26, T. 19 S., R. 19 E-----------------------Sec. 28, T. 20 S., R. 20 E------------------------
23.1
19.2
23.0 20.6 18.0 21.7
0.006
. 006
.008
.004
.007
.005
25.4
21.1
22.6 18.5 23.9
12.6
11.1
15.9 13.8 15.4
13.8 12.6 12.6
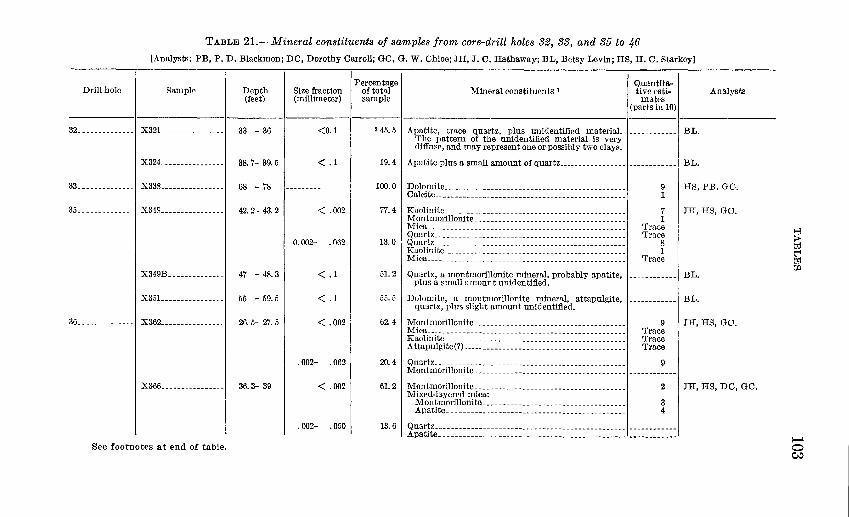
TABLE 21.-Mineral constituents of samples from core-drill holes 32, 33, and 35 to 46
[Analysts: PB, P. D. Blackmon; DC, Dorothy Carroll; GC, G. W. Chloe; JH, J. C. Hathaway; BL, Betsy Levin; HS, H. C. Starkey]
Drill hole Sample Depth (feet)
32 _____________ _1 X32L_ _____________ _i 33 - 36
X324 _______________ _j 38.7- 39.5
33--------------1 X338 _______________ _j 68 - 78
X34s ________________ l 42. 2- 43.2
X349B. -------------1 47 - 48.3
X35L ______________ _j 55 - 59.5
36 __ ------------1 X362 ________________ j 26.5- 27. 5
X366----------------1 36.3- 39
See footnotes at end of table.
Percentage Size fraction I of total (millimeter) sample
Mineral constituents t
<0.1
< .1
--
< .002
0. 002- .062
< .1
< .1
< .002
. 002- . 062
< .002
. 002- .050
2 45. 5 I Apatite, trace quartz, plus unidentified material. The pattern of the unidentified material is very diffuse, and may represent one or possibly two clays.
19.4 I Apatite plus a small amount of quartz ________________ _
100. 0 I Dolomite _____________________________________________ _
77. 4 ~:~:i:i-t~--~~~~~~~~~ ~~~~~~~ ~~~~~~ ~~~~~~~~~~~~~~ ~ ~~~ ~~~~~ Montmorillonite. ___________________________ ---- ___ ---Mica _________________________________________________ _
13. o I ~~:~i~================================================ Kaolinite _____________________________________________ _ Mica _________________________________________________ _
51. 2 Quartz, a montmorillonite mineral, probably apatite, plus a small amount unidentified.
55. 5 Dolomite, a montmorillonite mineral, attapulgite, quartz, plus slight amount unidentified.
62. 4 Montmorillonite ___________ ---------------------------Mica ___________ --- __ -_--------------------------------Kaolinite _____________________________________________ _ Attapulgite(?) ----- ___________________________________ _
::: I :::::~~~::: ::::====:== ::===::::::::=:=::::::::: Mixed-layered mica: Montmorillonite ___________________________________ _
Apatite ___ ------------------------------------------13.6 I Quartz _______________________________________________ _
Apatite ______________________________________________ _
Quantita-tive esti- I Analysts
mates (parts in 10)
1-BL.
BL.
9 HS, PB, GC. 1
7 JH, HS, GO. 1
Trace Trace
8 1
Trace
BL.
BL.
9 Trace
I JH, HS, GO.
Trace Trace
9
;---~ JTI, TIS, DO, GO.
3 4
----1
8 > td ~ trj lfl
1--L 0 c,..,
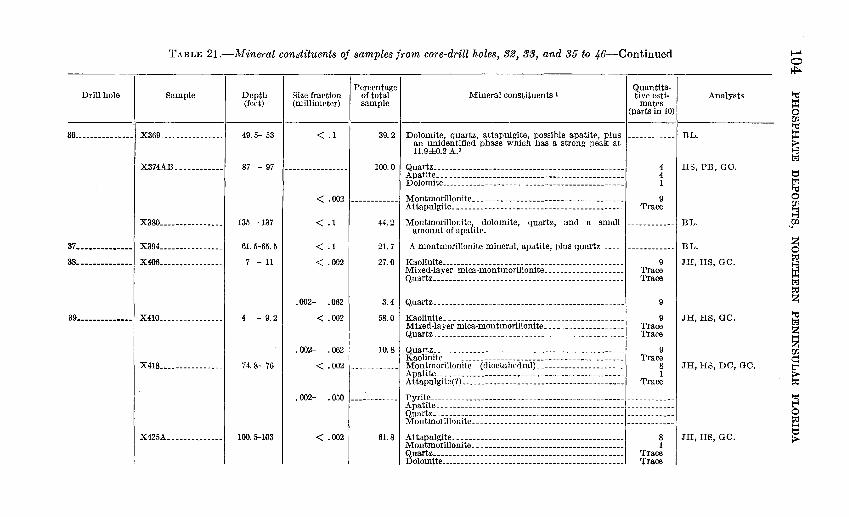
TABLE 21.-Mineral constituents of samples from core-drill holes, 32, 33, and 35 to 46-Continued
Drill hole I Sample I I Depth (feet)
36.--------------1 X369. __ .. -- _. _______ 49.5- 53
X374AB. ----------- 87 - 97
X380 _____ ----------- 135 -137
37 ··············I X394 .• ------------- _ 61.5-65.5
38.------------- X406. ------- ___ ---- _ 7 - 11
39 ••••••••••••• .1 X410 .... ___________ _ - 9.2
X418 ___________ ----- 74.8- 76
X425A •. ------------1 100.5-103
Size fraction (millimeter)
< .1
----------------I < .002
< .1 I
< .1 I < .002
.002- .062
< .002
Percentage of total sample
39.2
100.0
44.2
21.7
27.0
Mineral constituents 1 Quantitative esti
mates (parts in 10)
Dolomite, quartz, attapulgite, possible apatite, plus 1-----------an unidentified phase which has a strong peak at 11.9±0.2 A.a
Analysts
BL.
Quartz-----------------------------------------------Apatite __ .------------------------------------------ __
4 4 1
HS, PB, GO. Dolomite _____________________________________________ _
Montmorillonite. ____________________________________ _ 9 Attapulgite. ________ -- ___ ---- _____________________ --~ _ Trace
Montmorillonite, dolomite, quartz, and a small 1------------1 BL. amount of apatite.
A montmorillonite mineral, apatite, plus quartz ____ _ Kaolinite _____________________________________________ _ Mixed-layer mica-montmorillonite ___________________ _ Quartz _______________________________________________ _
------------1 BL.
9 Trace Trace
JH, HS, GO.
3.4 I Quartz 9
9 Trace Trace
58.0 Kaolinite. _________ . _______________ - _______________ --_ Mixed-layer mica-montmorillonite ___________________ _
JH, HS, GO.
Quartz _______________________________________________ _
. 002-- . 0621 10.81 Quartz·-----------------------------------------------ICaolinite ______________________________________________ _ < . 002 ------------ Montmorillonite (dioctahedral) _____________________ _ Apatite. _____________________________________________ _
9 Trace
8 1
Trace
JH, HS, DC, GO. A ttapulgite('?) __________ • _____________________________ _
. = .... I---- -------I i;~~~~i~~;~~::~:~~=~~ ~~~= ~=~=~~~~~~:~:~~~=~~=:~=I~~~~::~J < .002 61. 8 I Attapulgite ______ -------------------------------------
Montmorillonite. ________________________ -------------Quartz ____________________ ------------ ____ -------- ___ _ Dolomite .. ________________________________ ------ ___ • __
8 1
Trace Trace
JI-I, HS, GO.
1-1 0 !+>-
~ 0 Ul
~ l';j
t:;::j l';j 1-d 0 ~ t-3
Sll
z 0 ~
~ ~ 1-d l';j
~ gj ~ ~
"%j t-t 0 ~ ...... t:::l >
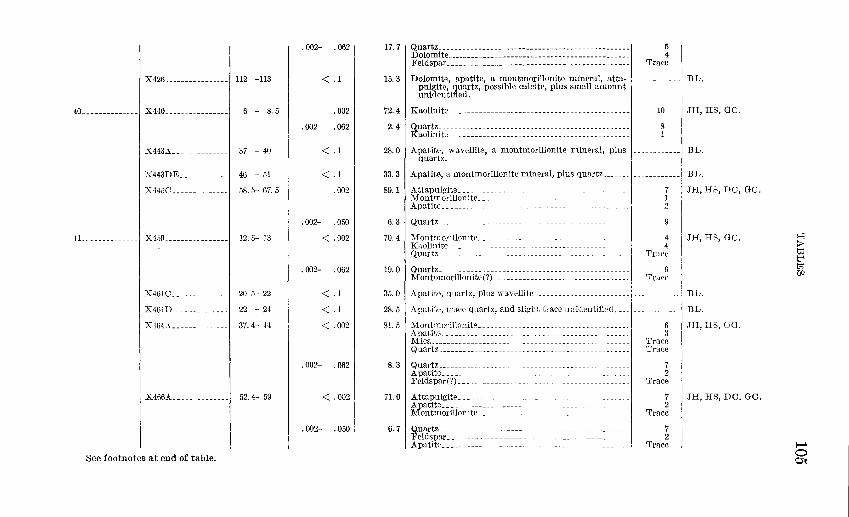
X426 _______________ _1 112 -113
40 __ • ------ ____ -' X440 _______________ _ 6 - 8. 5
X443A _____________ J 37 - 40
X443DE ____________ , 46 -51
X445C______________ 58.5- 67.5
X459 _______________ _J 12.5- 13
X461C __ ------------~ 20.5- 22
X461D______________ 22 - 24
X:164A __ ------------ 37.4- 44
.002- .062
< .1
. 002
.002- .062
< .1
< .1
.002
.002- . 050
< .002
. 002- .062
< .1
< .1
< .002
. 002- . 062
X466A _____________ J 52.4- 59 I < .002
.002- . 050
See footnotes at end of table.
17.7 1 Quartz------------------------------------------------Dolomite _________________________ -----_------ ________ _ Feldspar __ --------------------------------------------
15. 3 I Dolomite, apatite, a montmorillonite mineral, attapulgite, quartz, possible calcite, plus small amount unidentified.
72.4
5 4
Trace
10
2. 4 I Quartz ____________ -----------_------------------------~ 8
28.0 I :;::~::~c;a-;t~l~~;e-,-~-:r;~~~~~~~l~~~i~~-~~~~~~~:-~~~:- ______
1
____ 1
quartz.
BL.
JH, HS, GO.
BL.
:::: I ~:ta:~:;g:t:r:~~l~~~~~l~~~:~~-~~~~~~~1:-~lu:-~~~:·~z~~~~~~-----------1 BL.
Montmorillonite ______ ----------- _ --·--- -------------- _ Apatite ___________________ ------------------------ ___ _
7::: I ~::::wrUlonite ____ ----------------------- ----Kaolinite ___ _ Quartz _____ _
19.0
35. 0 I Apatitf\, quartz, plus
28.5
81.5 Montmorillonite ___________________ _ Apatit~ _____ _ Mica ___________________________________ _ Quartz _________________________________ _
8. 3 I Quartz _______ ------- _______________________ ·--- _______ _ Apatite ______________________________________________ _ Fcldsps.r('t) ___ - ---------------------------------------
71.0 I Attapulgite _____ -- ___________________________________ _ Aps.tite _______ ---- _____ --- --- _________________ -______ _ Montmorillonite _____________________________________ _
6. 1 1 ~~~s~a;~ === = ==== = = = = = === ==== = = = = == == === = = = = = =: = = = = = = = Apatite ____ _
7 1 2
4 4
Trs.ce
9 'rrace
6 3
'rrace Trace
2 Trace
7 2
Trace
7 2
Trace
HI, H8, DC, GO.
JH, HS, GC.
BL.
BL.
JII, ITS, CG.
JH, HS, DC, GO.
1-j
g; t'i trl Ul
~ 0 Cl
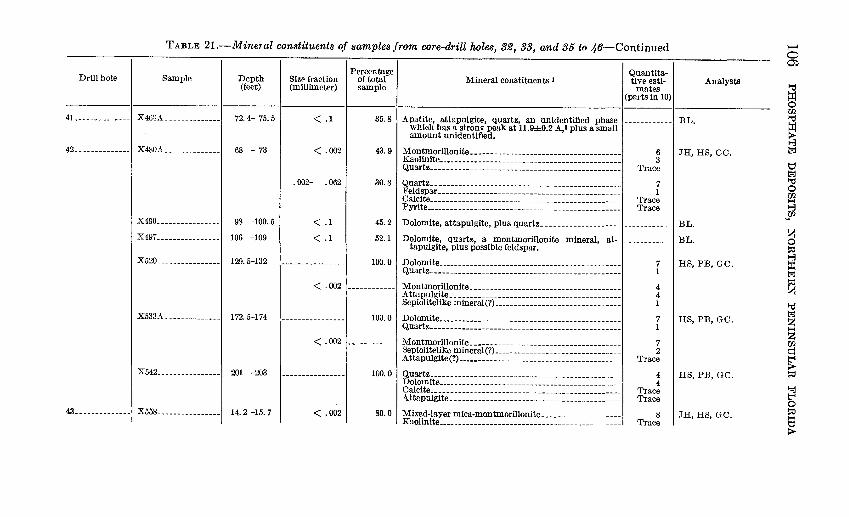
TABLE 21.-Mineral constituents of samples from core-drill holes, 32, 33, and 35 to 46-Continued
Drill hole Sample
4L--- ----------1 X46'3A_ -------------
42. _ ------------1 X480A __ ------------
X490. ---------------
X49i ----------------
X520_ ---------------
X533A. -------------
X542 __ ------ --------
43. ___ ----------1 X558 ____ ------------
Depth (feet)
i2. 4-- i5. 5
68 - 73
98 -100.5
106 -109
129.5-132
172.5-1i4
201 -203
14.2 -15. 7
SizP fraction (millimeter)
< .1
< .002
. 002- . 062
< .1
< .1
Percentage of total sample
35.8
43.9
30.8
45.2
52.1
100.0
< . 002 1------------1
100.0
Mineral constituents I Quantitative esti
mates (parts in 10)
Apatite, attapulgite, quartz, an unidentified phase 1------------1 which has a strong peak at 11.9±0.2 A,• plus a small amount unidentified.
Montmorillonite_------_--- __ -- __ -- __ --_- ___ -----_----Kaolinite _____________________________________________ _
Quartz ________ --_-------------------------------------
~~~;~ar:::=========================================== Calcite _______________ -- ______________________ ---------Pyrite _____________ ------------------------------------
6 3
Trace
7 1
Trace Trace
Analysts
BL.
JH, HS, CC.
Dolom~te, attapulgite, plus quartz--~-----~-----------~------------~ BL.
Dolomite, quartz, a montmorillomte mmeral, at- ------------ BL. tapulgite, plus possible feldspar,
Dolomite ________________________________ --------------Quartz _____________ -----------------------------------Montmorillonite ____________________________________ --
Attapulgite ___ ----------------------------------------Sepiolitelike mineral(?) ______________________________ --
Dolomite ____ ----- ____ -- ___________ -_-_-----_-_--------Quartz_-----------------------------------------------
7 1
4 4 1
7 1
HS, PB, GC.
liS, PB, GC.
< . 002'------------' Montmorillonite _____________________________________ _ 7 2 i1Y~~~1~A~;).~~~~~1!::==============================
100.0 Quartz_----_-------- __________________ --- ___ ---_------Dolomite _____________ ---- ____ ----_--------------------Calcite __ -------- _____________________________________ _
Attapulgite __ -----------------------------------------
< .002 80.0 Mixed-layer mica-montmorillonite ___________________ _ Kaolinite ___________________________ ---- __ -------------
Trace
4 4
Trace Trace
8 Trace
HS, PB, GC.
JH, HS, GC.
1--1 0 ~
~ 0 UJ.
~ 1:':1
!::' f::'j l'tl 0
~ ~Ul
z 0 ~
~ f::'j ~ z l'tl 1:':1
~ ~ ~
~ 0 ~ 1-1 !::' >
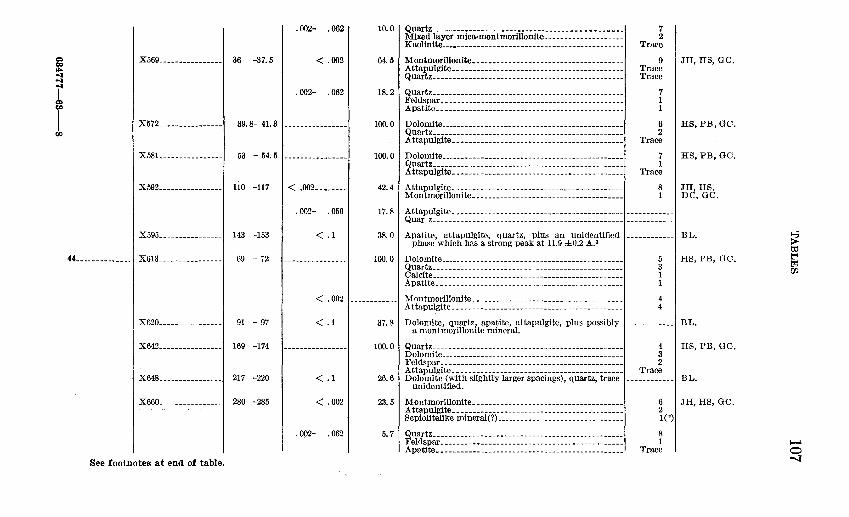
~ ""' ~ ~ r I
X569----------------1 36 -37.5
X572 ________________ j 39.8- 41.3
X58L---------------1 53 - 54.5
X592 ________________ j 110 -117
X595 _______________ J 143 -153
44--------··----1 X613 _______________ J 69 - 72
X620 __________ ------ 91 - 97
X642----- ----------- 169 -174
X648 ___ -- _______ ---- 217 -220
X660 ___ --- __________ 280 -285
See footnotes at end of table.
.002- .062 10.0
< .002 64.5
.002- .062 18.2
---------------- 100.0
---------- .. ----- 100.0
< .002 ________ 42.4
.002- .050 17.8
< .1 38.0
---------------- 100.0 I
< .002 ------------I < .1 37.8'
---------------- 100.0
< .1 26.6
< .002 23.5
.002- .062 5. 7
Quartz ________________ ------------------------------Mixed layer mica-montmorillonite ___________________ _ Kaolinite ______ -------------------------.--------------
Montmorillonite •• ----- ______ ---_---------- ___ .----- __ Attapulgite_ •• _______ ---------------------------------Quartz------------------------------------------------
QuartZ-----------------------------------------------Feldspar._--------------------------------------------Apatite. ____ ------------------------------------------
Dolomite----------------------------------------------Quartz _______________________________________________ _ Attapulgite •• - ___ ---- ___ ------------------------ _____ _
Dolomite----------------------------------------------Quartz _______________________________________________ _ Attapulgite. _. ____ ---- __ ------ __ ---------- __ ------- __ _
Attapulgite. _ ------ _ ------------- _____ -- ______ --------Montmorillonite .• ____________ --_------- _____________ _
7 2
Trace
9 Trace Trace
7 1 1
6 2
Trace
7 1
Trace
8 1
~~~?~~~~~~= = ===== == === ==== ======= == ==== = == = = = === ==== 1------------1 Apatite, attapulgite, quartz, plus an unidentified 1------------1
phase which has a strong peak at 11.9 ±0.2 A. a
JH, HS, GO.
HS, PB,GC.
HS, PB, GO.
JH,HS. DC, GO.
BL.
Dolomite ___________________ -- ____ -- __________________ _ 5 I HS, PB, oc. Quartz ___ - _____ --------------------------------------- 3 Calcite ___ • ___ ------ __ --------------------------------- 1 Apatite •• _______ •• ------------------------------------ 1
Montmorillonite_. ______________ -- ______ ----- ________ _ 4 Attapulgite. _________ -- __ -- ___ ------- ____ --------- __ -- 4
I Dolomite, quartz, apatite, attapulgite, plus possibly I------------I
a montmorillonite mineral. BL.
4 I HS, PB, GO. 3
QuartZ------------------------------------------------Dolomite _____________________________________________ _ 2
Trace BL.
Feldspar ___ -------------------------------------------Attapulgite. ___ -------- ______________________________ _ Dolomite (with slightly larger spacings), quartz, trace 1------------1
unidentified.
6 I JH, HS, GO. 2 1(?)
Montmorillonite. ____________________________________ _ Attapulgite. __ -------------------------- _ -------- ___ --Sepiolitelike mineral(?)--------------------------------Quartz _______________________________________________ _ 8
1 Trace r~~~f:~: = = = = = = =:: =: = = = = = = = = = = = = = = = = = = = = = = = = = = = = = = = = = =
~ t"l t':<j lfJ.
J-l 0 -.,:(
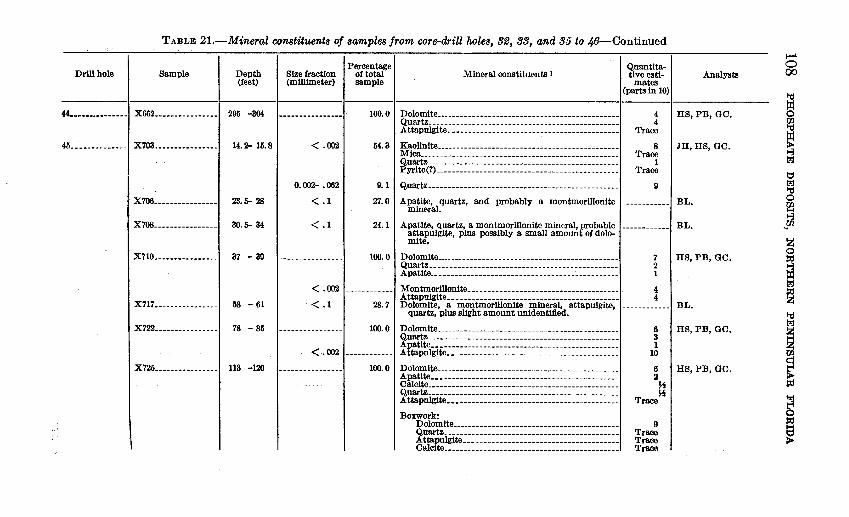
TABLE 21.-Mineral constituents of samples from core-drill holes, 82, 88, and 85 to ,46-Continued
Drill hole Sample Depth (feet)
44---------------1 X662----------------1 295 -304
45 ••••••••.•••• .1 X703 ••••••••••••••• -l 14.2- 15.8
X706 ••••.•••••••••• J 23.5- 28
x7os _______________ J 30. 5- 34
X7lo _______________ .J 37 - 39
X717·---------------' 58 - 61
X722----------------' 78 - 85
X725---------------.l 113 -120
Percentage Size fraction I of total (millimeter) sample
Mineral constituents 1
< .002
0.002- .062
< .1
< .1
< .002
< .1
--------
<-.002
100.0 I Dolomite _____________________________________________ _ Quartz_----------------------------------------------Attapulgi te •• ---------- _ ------------------------------
54.3 I Kaolinite _____________________________________________ _ Mica _________________________________________________ _
QuartZ------------------------------------------------Pyrite(?) _____________________________________________ _
;: ~ I ~:::~.--~~~;;:.--~~-~~~-~~~;~--~--~~~~~~~~~~-i~:-mineral.
24. 1 I Apatite, quartz, a montmorillonite min!'ral, probable attapulgite, plus possibly a small amount of dolomite.
100.0 I Dolomite _____________________________________________ _
28.7
100.0
-----------100.0
Quartz ______________________________________________ _
Apatite .•• --------------------------------------------Montmorillonite. __ -----_---- ________ --·_. ___________ _ Attapulgite •• ________________________________________ _ Dolomite, a montmorillonite mineral, attapulgite,
quartz, plus slight amount unidentifted. Dolomite _____________________________________________ _ QuartZ-----------------------------------------------Apatite ••• _---------.---------------------------------Attapulgite. _ _ __ -___________________________________ -1
Dolomite _____ --.--------------------------------------Apatite ••• __ ---- ______ --------------------------------Calcite _________________ • __ --- _______ ._. _______ ._. ____ _ Quartz. _____ -- ___ -- __ ---------------------------------A ttapulgite •••••• ___ • ______ • _________ • _______________ -
Boxwork: Dolomite _________________________________________ _ Quartz. __________________________ ---_-_------ ___ --
~!rcR~~~~~~=====================================
1-l 0 00
~ r:n
~ I:' 1?:1 "d 0
~ ... r:n
z 0
i ~ ~
~ ~ ~
~ 0
~
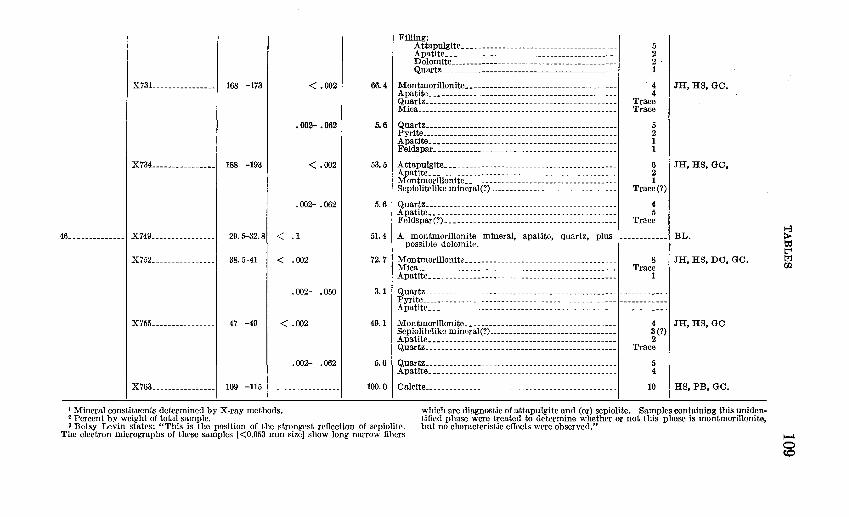
X73L _____________ _I 168 -173 < .002
.002- .062
X734----------------' 188 -193 < .002
. 002-.062
46 _____________ _1 X749 _______________ _1 29.5-32.81 < .1
X752 _______________ _1 38.5-41 I < . 002
.002- .050
X755 ________________ l 47 -49 < .002
X763----------------' 109 -115
t Mineral constituents determined by X-ray methods. 2 Percent by weight of total sample.
.002- .062
Filling: Attapulgite ••• _ ------ ___ --- ___ --------------- ____ _ 5 Apatite. __ ---------------------------------------- 2 Dolomite _________________________________________ _ 2 Quartz ___________________________________________ _
66.4 I Montmorillonite •• ------------------------------------Apatite. __ --------------------------------------------
1
4 I JH,HS, oc. 4 Quartz. ________________ --------- ________ --- __________ - Trace
Mica _____ ------------ ________________________________ - Trace
5. 6 I QuartZ------------------------------------------------ 5 Pyrite _____ -------------------------------------------- 2
~~~~~~r =: = = = = = = = = = = = = = = = = = = = = = = = = = = = = = = = = = = = = = = = = = = = = 53. 5 I Attapulgite ___ ----------------------------------------Apatite. ______________ --------- _____________________ --
Montmorillonite. __ ----------------------_------------
1 1
6 I JH,HS, oc. 2 1
Sepiolitelike mineral(?) ______ -- _______________________ _ Trace(?)
5. 6 I Quartz ____________________ ---------- __________ -------- 4 Apatite. __ -------------------------------------------- 5 Feldspar(?) ______ --------------------------- _________ _ Trace
51.4 I A montmorillonite mineral, apatite, quartz, plus 1------------1 possible. dolomite.
BL.
72.7 I Montmorillonite •• ------------------------------------Mica _________________________________________________ _ 8 I JH, HS, DC, oc. Trace
Apatite •• ________ ------------------------------------- 1
,:·: : ~~~~:;~: :=·. :::::.:: =::=:: :::=:: ·:: ::· ::= :=J=: :=::=:::=I 4 I JH, HS, GO Sepiolitelike mineral(?) _______________________________ _
Apatite. ______________ -------------------.------------Quartz. ______________ - _______________________________ _
5. 61 Quartz _________________ -----------------_------ ______ -
100. 0 ~:::::~~~~ ~~~~ ~~~~~~~~~~~~~~~~~~~~~~~~~~~~~~~~~ ~~~ ~~~ ~
3 (?) 2
Trace
5 4
10 HS, PB, GO.
a Betsy Levin states: "This is the position of the strongest reflection of sepiolite.
which are diagnostic of attapulgite and (or) sepiolite. Samples containing this unidentified phase were treated to determine whether or not this phase is montmorillonite, but no characteristic effects were observed."
The electron micrographs of these samples [ <0.053 mm size] show long narrow fibers
~ t:xS t_-4 t?=1 Ul
1-4 0 co
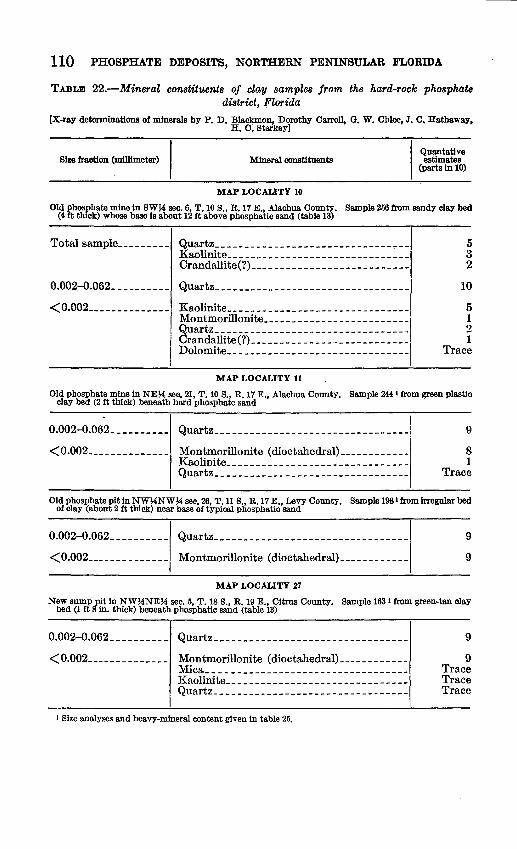
110 PHOSPHATE DEPOSITS, NORTHERN PENINSULAR FLORIDA
TABLE 22.-Mineral constituents of clay samples from the hard-rock phosphate district, Florida
[X-ray determinations of minerals by P. D. Blackmon, Dorothy Carroll, G. W. Chloe, 1. c. Hathaway, H. c; Starkey]
.... - (mmlmeler) 1 Mineml.,.,.,.Utuen ..
MAP LOCALITY 10
I Quantative estimates
(parts in 10)
Old phosphate mine in SW~ sec. 6, T. 10 S., R. 17 E., Alachua County. Sample 256 from sandy clay bed (4ft thick) whose base is about 12ft above phosphatic sand (table 13)
Total sample_________ Quartz ______ ---------------------------Jraolinite ______________________________ _ Crandallite(?) __________________ ---------
0.002-Q.062 ___ ------- Quartz ________________________________ _
<0.002 ______ ----- __ _ Jraolinite ______________________________ _ Montmorillonite ___________________ ------Quartz ________________________________ _ Cra.ndallite(?) _____________ -- ___ - _--- ----Dolomite __________ -_-------------------
MAP LOCALITY 11
5 3 2
10
5 1 2 1
Trace
Old phosphate mine in NE~ sec. 21, T. 10 s., R. 17 E., Alachua County. Sample 2441 from green plastic clay bed (2 ft thick) beneath hard phosphate sand
0.002-0.062 __________ Quartz ________________________________ _
<0.002______________ Montmorillonite (dioctahedral) ___________ _ Jraolini te __________________ - _ - - - - - - - - - - -Quartz ________________________________ _
9
8 1
Trace
Old phosphate pit in NW~NW~ sec. 26, T. 11 S., R. 17 E., Levy County. Sample 1981 from irregular bed of clay (about 2 ft thick) near base of typical phosphatic sand
0.002-Q.062 __________ Quartz ________________________________ _
< 0.002___ _ _ _ _ _ _ _ _ _ _ _ Montmorillonite ( dioctahedral) ___________ _
MAP LOCALITY 27
9
9
New sump pit in NW~NE~ sec. 5, T. 18 S., R. 19 E., Citrus County. Sample 163 l from green-tan clay bed (1ft 8 in. thick) beneath phosphatic sand (table 13)
0.002-0.062 ___ ------ _ Quartz __________________________ -_-----
<0.002_______ __ ___ __ Montmorillonite (diocta.hedral) ________ ----Mica _________________________________ _ Jraolinite ______________________________ -Quartz ________________________________ _
t Size analyses and heavy-mineral content given in table 25.
9
9 Trace Trace Trace
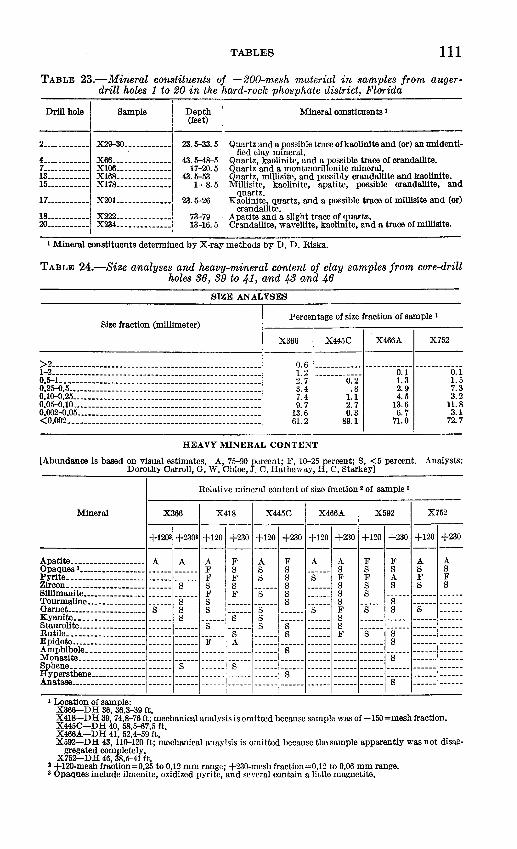
TABLES 111
TABLE 23.-Mineral constituents of -200-mesh material in samples from augerdrill holes 1 to 20 in the hard-rock phosphate district, Florida
Drill hole Sample Depth (feet)
Mineral constituents 1
2............ X29-30............ 23. 5-33.5
L.......... X66............... 43. 5-48-5
Quartz and a possible trace of kaolinite and (or) an unidenti-fied clay mineral.
7 •••••••••••• X106.............. 17-20.5 Quartz, kaolinite, and a possible trace of crandallite. Quartz and a montmorillonite mineral. Quartz, millisite, and possibly crandallite and kaolinite. Millisite, kaolinite, apatite, possible crandallite, and
13........... X168.............. 43.5-53 15........... X178.............. 1- 8. 5
17........... X20L............. 23.5-26 quartz.
Kaolinite, quartz, and a possible trace of millisite and (or) crandallite.
18........... X222 ••••..••...••• 20........... X234 ..•........•..
73-79 13-16.5
Apatite and a slight trace of quartz. Crandallite, wavellite, kaolinite, and a trace of millisite.
1 Mineral constituents determined by X-ray methods by D. D. Riska.
TABLE 24.-Size analyses and heavy-mineral content of clay samples from core-drill holes 36, 39 to 41, and 43 and 46
SIZE ANALYSES
Size fraction (millimeter)
>2 ... --------------------------------------------------1-2-----------------------------------------------------0,5-l_- -------------------------------------------------0.25-0.5 _____ -------------------------------- ------------0,1()...{),25 _______________________________________________ _
0.05-0.10 ____ ------------------------- -------------------0.002-0.05 ____ ----------- ------- -------------------------<0.002.-- ----------------------------------------------
Percentage of size fraction of sample t
X366 X445C X466A X752
~: g :::::::::::: --------o~i- ---------o~i 2. 7 0. 2 1. 3 1. 5 3. 4 . 8 2. 9 7. 3 7. 4 1. 1 4. 5 3. 2 9. 7 2. 7 13. 6 11. 8
13. 6 6. 3 6. 7 3. 1 61. 2 89. 1 71. 0 72. 7
HEAVY MINERAL CONTENT
[Abundance is based on visual estimates. A, 75-90 percent; F, 10-25 pe.rcent; S, <5 percent. Analysts: Dorothy Carroll, G. W. Chloe, J. C. Hathaway, H. C. Starkey}
Relative mineral content of size fraction 2 of sample 1
Mineral X366 X418 X445C X466A X592 X752
+1202 +2303 +120 +230 +120 +230 +120 +230 +120 +230 +120 +230 ----------1------------------------------------Apatite___________________ A A A F A F A A F F A A Opaques 3----------------- ------ ______ F s s S S S S S S Pyrite.------------------- ------ ------ F F S S S F F A F F Zircon ____________________ ------ S S S S S S S S S Sillimanite ••• _____________ ------ ------ F F S S S S ------ ------ ------Tourmaline _______________ ------ S S ------ ______ S ______ S ------ S ------ ------Garnet-------------------- S S S ______ S ______ S F S S S Kyanite................................................ ................. S ______ S S ____________ S ------ ------ ------ ------Staurolite _________________ ------ ------ S ______ S S S ------ ------ ------ ------Rutile ____________________ ------ ------ ------ S ------ S F S S ------ ------Epidote ___________________ ------ ------ F A -----· ------ ------ ------ ---··· S ------ ------Amphibole _______________ ------ ------ ______ ------ ------ S ------ ------ ------ ------ ------ ------Monazite _________________ ------ __________________________________________ ------ S ------ ------Sphene ___________________ ------ S ______ S ------ ------ ------ ------ ------ ------ ------ ------
~~rt~~~~~:::::::::::::: :::::: :::::: ::::::, ====== 1====== -~---- :::::: :::::: :::::: ·s---- :::::: :::::: 1 Location of sample:
X366-DH 36,36.3-39 ft. X418--DH 39, 74.8-76 ft; mechanical analysis is omitted because sample was of -150=mesh fraction. X445C-DH 40, 58.5-67.5 ft. X466A-DH 41, 52.4-59 ft. X592-DH 43, no-120ft; mechanical anaylsis is omitted because the sample apparently was not disag
gregated completely, X752-DH 46, 38.5-41 ft.
J +120-mesh fraction=0.25 to 0.12 mm range; +230-mesh fraction=0.12 to 0,06 mm range. a Opaques include ilmenite, oxidized pyrite, and several contain a little magnetite.
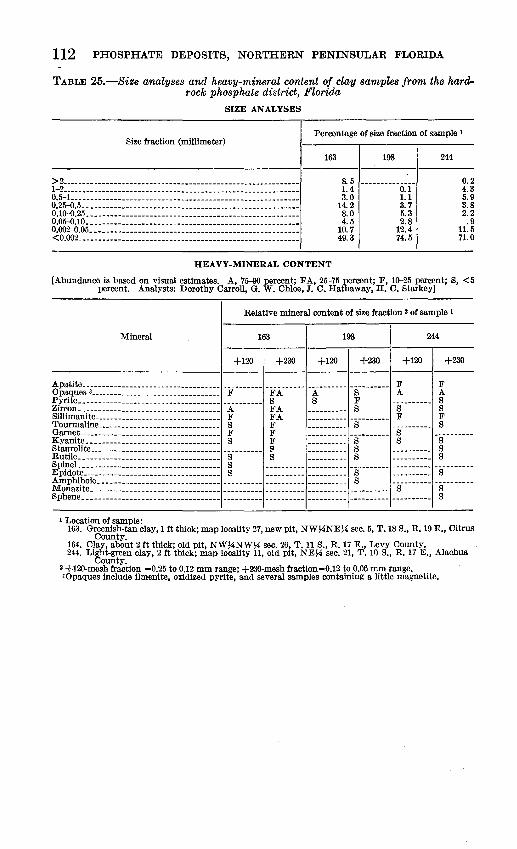
112 PHOSPHATE DEPOSITS, NORTHERN PENINSULAR FLORIDA
TABLE 25.-Size analyses and heavy-mineral content of clay samples from the hardrock phosphate district, Florida
SIZE ANALYSES
Percentage of size fraction of sample 1 Size fraction (millimeter)
> 2 ____ ----------------------------- ----------- ----------------1-2 ____ -. --- ---------------- -----------------------------------0.5-1_---------------------------------------------------------0.25-0,5_--- ---------------------------------------------------0 .1o-<l.25_-------------------------------------------- ---------0,05-0.10.-----------------------------------------------------0,002-{),05.---------------------------------------------------<0.002_ -------------------------------------------------------
163
HEAVY-MINERAL CONTENT
8. 5 1.4 3.0
14.2 8.0 4.5
10.7 49.3
198
0.1 1.1 3. 7 5.3 2.8
12.4 74.5
244
0.2 4.3 5.9 3.8 2.2 .9
11.5 71.0
[Abundance is based on visual estimates. A, 75--90 percent; FA, 25--75 percent; F, 10--25 percent; S, <5 percent. Analysts: Dorothy Carroll, G. W. Chloe, J. C. Hathaway, H. C.Starkey]
Relative mineral content of size fraction ' of sample 1
Mineral 163 198 244
+120 +120 +230 +120 +230 ---------------1------------------
~s~~~a::~~============================= ~~~~~~~~~ "fi ______ -~------- ·r·----- l ~ Zircon------------------------------------ A FA ---------- S S S Sillimanite________________________________ F FA ---------- ---------- F F Tourmaline_______________________________ S F ---------- S ---------- S Garnet------------------------------------ F F ---------- ---------- S Kyanite---------------------------------- S F ---------- S S S Staurolite _________________________________ ---------- S ---------- S ---------- S Rntile____________________________________ S S ---------- S ---------- S SpineL_---------------------------------- S ---------- ---------- ---------- ---------- ----------Epidote___________________________________ S ---------- ---------- S ---------- S
t:~E~Ift~~~~~============================= ========== ========== ========== -~-------- _s _________ s _______ _ Sphene •.• -------------------------------- ---------- ---------- ---------- ---------- ---------- 8
t Location of sample: 163. Greenish-tan clay, 1ft thick; map locality 27, new pit, NW!4NE~4 sec. 5, T. 18 S., R. 19 E., Citrus
County. 164. Clay, about 2ft thick; old pit, NW!4NW!4 sec. 26, T. 11 S., R. 17 E., Levy County. 244. Light-green clay, 2ft thick; map locality 11, old pit, NE!4 sec. 21, T. 10 S., R. 17 E., Alachua
County, 2 +120-mesh fraction =0.25 to 0.12 mm range; +230-mesh fraction=0.12 to 0.06 mm range. ~Opaques include ilmenite, oxidized pyrite, and several samples containing a little magnetite.
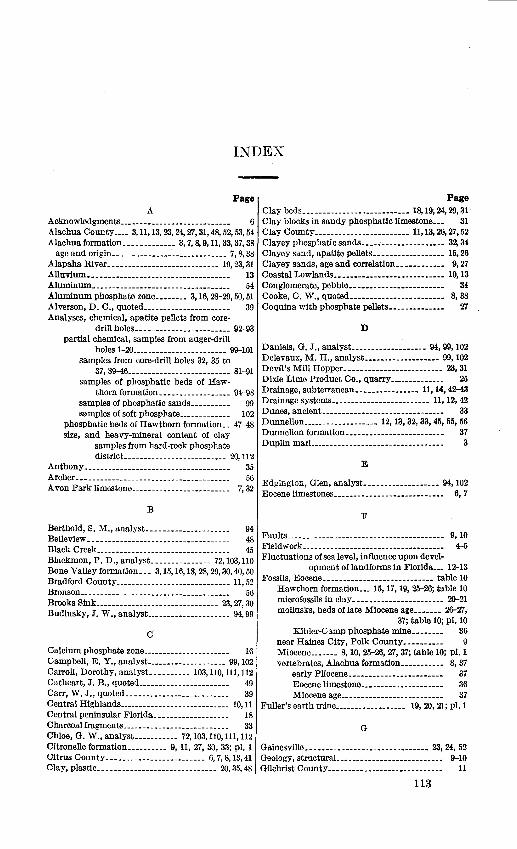
INDEX
Page Page A Clay beds ___ ------------------------ 18, 19, 24, 29,31
Acknowledgments____________________________ 6 Clay blocks in sandy phosphatic limestone___ 31 Alachua County ____ 3, 11, 13, 23, 24, Zl, 31, 48, 52, 53,54 Clay CountY------------------------ 11, 13, 26, Zl, 52 Alachua formation _____________ 3, 7, 8, 9, 11, 33, 37,38 Clayey phosphatic sands--------------------- 32,34
age and origin _____ ------------------------ 7, 8, 38 Clayey sand, apatite pellets---~-------------- 15,26 Alapaha River ____________________________ 19, 23,31 Clayey sands, age and correlation____________ 9, 27
Alluvium------------------------------------ 13 Coastal Lowlands---------------------------- 10,13 Aluminum___________________________________ 54 Conglomerate, pebble------------------------ 34 Aluminum phosphate zone ________ 3, 16,28-29,50,51 Cooke, C. W., quoted------------------------ 8, 38 Alverson, D. C., quoted______________________ 39 Coquina with phosphate pellets-------------- 27 Analyses, chemical, apatite pellets from core-
drill holes------------------------ 92-93 D partial chemical, samples from auger-drill
holes 1-20------------------------ 99-101 samples from core-drill holes 32, 35 to
37, 39-46-------------------------- 81-91 samples of phosphatic beds of Haw-
thorn formation __________________ 94--98
samples of phosphatic sands__________ 99 samples of soft phosphate_____________ 102
phosphatic beds of Hawthorn formation __ 47-48 size, and heavy-mineral content of clay
samples from hard-rock phosphate district-------------------------- 20,112
Daniels, G. J., analyst_ __________________ 94, 99, 102 Delevaux, M. H., analyst ___________________ 99, 102
Devil's Mill Hopper------------------------- 23,31 Dixie Lime Product Co., quarry______________ 25 Drainage, subterranean ________________ 11, 14, 42-43 Drainage systems _________________________ 11, 12, 42 Dunes, ancient.______________________________ 33 Dunnellon ___________________ 12, 13, 32, 33, 45, 55, 56 Dunnellon formation_________________________ 37
Duplin marL--------------------------------- 3
Anthony------------------------------------- 35 E
Archer--------------------------------------- 56 Edgington, Glen, analyst------------------- 94,102 A von Park limestone_________________________ 7, 32 Eocene limestones____________________________ 6, 7
B F
Berthold, S.M., analyst_____________________ 94 Belleview------------------------------------ 48 Faults---------------------------------------- 9, 10 Black Creek__________________________________ 45 Fieldwork ____ -------------------------------- 4-5 Blackmon, P. D., analyst_ ______________ 72, 103, 110 Fluctuations of sealevel, influence upon devel-Bone Valley formation ___ 3, 15, 16, 18, 28, 29, 30, 40, 50 opment oflandforms in Florida ___ 12-13 Bradford CountY----------------------------- 11, 52 Fossils, Eocene ____________________________ table 10
Bronson·------------------------------------- 56 Hawthorn formation ___ 15, 17, 19, 25-26; table 10 Brooks Sink _______________________________ 23, 27, 30 microfossils in clay----------------------- 20-21 Budinsky, J. w., analyst _____________________ 94, 99 mollusks, beds oflate Miocene age _______ 2~Zl,
c Calcium phosphate zone______________________ 16 Campbell, E. Y., analyst_ ___________________ 99, 102 Carroll, Dorothy, analyst_ _________ 103,110,111,112 Cathcart, J. B., quoted_______________________ 49 Carr, W. J., quoted__________________________ 39 Central Highlands ____________________________ 10,11 Central peninsular Florida___________________ 18 Charcoal fragments___________________________ 33 Chloe, G. W., analyst----------- 72,103,110,111, 112 Citronelle formation __________ 9, 11, Zl, 30, 33; pl. 1 Citrus County------------------------- 6, 7, 8, 13,41 Clay, plastic ____ -------------------------- 20, 35, 48
37; table 10; pl. 10 Kibler-Camp phosphate mine________ 36
near Haines City, Polk CountY---------- 9 Miocene _______ 8, 10, 25-26, Zl, 37; table 10; pl. 1 vertebrates, Alachua formation___________ 8, 37
early Pliocene________________________ 37 Eocene limestone_____________________ 36 Miocene age__________________________ 37
Fuller's earth mine __________________ 19, 20, 21; pl. 1
G
Gainesville------------------------------- 23, 24, 52 Geology, structuraL-------------------------- 9-10 Gilchrist CountY----------------------------- 11
113
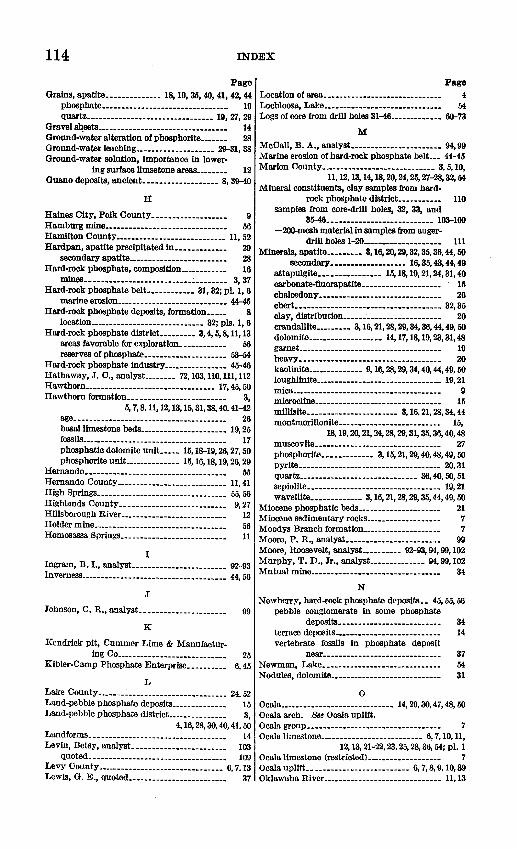
114 INDEX
Page Grains, apatite ______________ 18, 19, 35, 40, 41, 42, 44
phogphate-------------------------------- 19 quartZ-------------------------------- 19, Z'l, 29
Gravel sheets.-------------------------------- 14 Ground-water alteration of phosphorite_______ 28 Ground-water leaching ____________________ 29-31, 38
Ground-water solution, importance in lower-ing surface limsetone areas-------- 12
Guano deposits, ancient ___________________ 8, 39-40
H
Haines City, Polk CountY------------------- 9 Hamburg mine------------------------------- 56 Hamilton County---------------------------- 11, 52 Hardpan, apatite precipitated in------------- 29
secondary apatite.------------------------ 28 Hard-rock phosphate, composition____________ 16
mines------------------------------------ 3, 37 Hard-rock phosphate belt------------ 31, 32; PL 1, 6
marine erosion·--------------------------- 44-45 Hard-rock phogphate deposits, formation_____ 8
location _____________________________ 32; pis. 1, 6
Hard-rock phosphate district _________ 3, 4, 5, 8, 11, 13 areas favorable for exploration____________ 56 reserves of phosphate _____________________ 53-54
Hard-rock phosphate industry---------------- 45-46 Hathaway, J. C., analyst_ _______ 72, 103, 110,111, 112 Hawthorn--------------------------------- 17, 45, 50 Hawthorn formation •• __ --------------------- 3,
5, 7, 8, 11, 12, 13, 15, 31, 38, 40, 41-42 age_______________________________________ 26
basal limestone beds---------------------- 19,25 fossils_____________________________________ 17 phosphatic dolomite unit_ ____ 15, 18-19,26, 27, 50 phosphorite unit__ ____________ 15, 16, 18, 19, 26,29
Hernando.----------------------------------- 55 Hernando County---------------------------- 11,41 High Springs _________________________________ 55,56
Highlands CountY--------------------------- 9,27 Hillsborough River--------------------------- 12 Holder mine---------------------------------- 56 Homosassa Springs___________________________ 11
I Ingram, B. I., analyst ________________________ 92·-93
Inverness.------------------------------------ 44, 56
J Johnson, C. R., analyst_ ____________________ _ 99
K
Kendrick pit, Cummer Lime & Manufactur-
Page Location of area------------------------------ 4 Lochloosa, Lake •• ---------------------------- 54 Logs of core from drill holes 31-46------------- 60-73
M
McCall, B. A., analyst·---------------------- 94,99 Marine erosion of hard-rock phosphate belt ••• 44-45 Marion County----------------------------- 3, 5, 10,
11, 12, 13, 14, 18, 20, 24, 25, 27-28, 32, 54 Mineral constituents, clay samples from hard-
rock phosphate district___________ 110 samples from core-drill holes, 32, 33, and
35-46.-------------------------- 103-109 -200-mesh material in samples from auger-
drill holes 1-20------------------- 111 Minerals, apatite _________ 3, 16, 20, 29, 32, 35, 36, 44, 50
secondary------------------- 16, 35, 43, 44, 49 attapulgite ________________ 15, 18, 19, 21, 24, 31,40 carbonate-fluorapatite____________________ 15 chalcedony------------------------------- 20 chert ••• ---------------------------------- 32,35 clay, distribution------------------------- 20 crandallite _________ 3, 16, 21, 28, 29, 34, 36, 44, 49, 50 dolomite------------------· 14, 17, 18, 19, 23, 31,48 garnet __________ -------------------------- 19 heavy_----------------------------------- 20 kaolinite ______________ 9, 16, 28, 29, 34, 40, 44, 49, 50 lougblinite ________________________________ 19,21
mica·------------------------------------- 9 microcline ••••••••••••••••••••• ___________ 15
millisite ••• ---------·-----·---- 3,16, 21, 28, 34,44 montmorillonite-------------------------- 15,
18, 19, 20, 21, 24, 28, 29, 31, 35, 36, 40, 48 muscovite •••• ---------------------------- 27 phosphorite _____________ 3, 15, 21, 29, 40, 48, 49,50 pyrite ____________________________________ 20,31
quartz.----------------------------- 36,4-0, 50,51 sepiolite •• -------------------------------- 19,21 wavellite _____________ 3, 16, 21, 28, 29, 35, 44, 49, 50
Miocene phosphatic beds.-------------------- 21 Miocene sedimentary rocks___________________ 7 Moodys Branch formation____________________ 7 Moore, P. R., analyst________________________ 99 Moore, Roosevelt, analyst. _________ 92-93, 94, 99, 102 Murphy, T. D., Jr., analyst ______________ 94, 99,102
Mutual mine------------·---·---------------- 34
N
Newberry, hard-rock phosphate deposits •• 45, 55,56 pebble conglomerate in some phosphate
deposits.------------------------- 34 terrace deposits ••• ------------------------ 14 vertebrate fossils in phosphate deposit
ing Co____________________________ 25 near------------------------------ 37 54 31
Kibler-Camp Phosphate Enterprise__________ 6, 45 Newman, Lake-----------------------------
L Lake County--------------------------------- 24,52 Land-pebble phosphate deposits______________ 15 Land-pebble phosphate district_______________ 3,
4, 16, 28, 30, 40, 41, 50 Landforms ___ -------------------------------- 14 Levin, Betsy, analyst·----------------------- 103
quoted._--------------------------------- 109 Levy CountY-------------------------------- 6, 7, 13 Lewis, G. E., quoted.------------------------ 37
Nodules, dolomite •• --------------------------
0 Ocala·---------------------------- 14, 29, 30, 47, 48, 50 Ocala arch. See Ocala uplift. Ocala grouP---------------------------------- 7 Ocala limestone __________________________ 6, 7, 10,11,
12,13, 21-22,23,25,28, 36, 54; pl. 1 Ocala limestone (restricted)------------------- 7 Ocala uplift._------------------------ 6, 7, 8, 9, 10,39 Oklawaha River------------------------------ 11,13
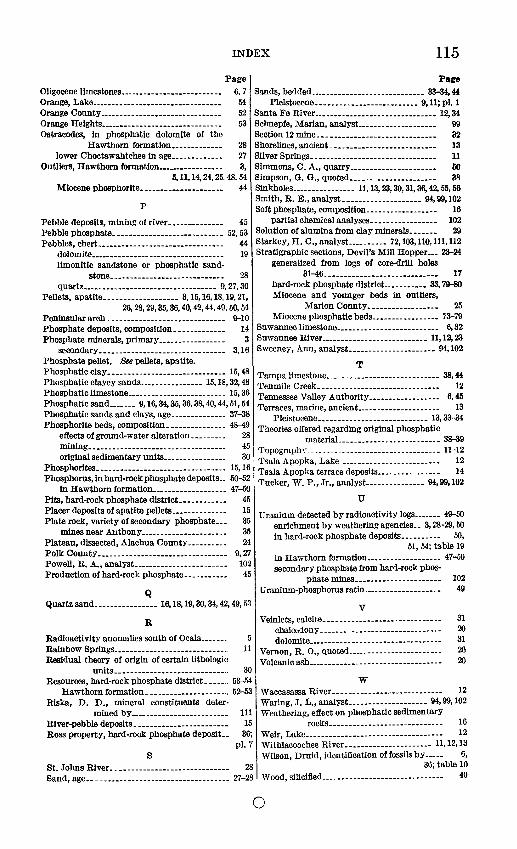
INDEX 115
Page Oligocene limestones__________________________ 6. 7
Page Sands, bedded·---------------------------- 33-34,44
Pleistocene __________________________ 9, 11; pl. 1 Orange, Lake·-------------------------------- 54 Orange County------------------------------Orange Heights ••••• --------------------------
52 Santa Fe River·------------------------------ 12,34 53 Schnepfe, Marian, analyst.------------------- 99
Ostracodes, in phosphatic dolomite of the Hawthorn formation_____________ 28
lower Choctawabtchee in age_____________ 27 Outliers, Hawthorn formation_________________ 3,
5,11, 14, 24, 25,. 48, 54 Miocene phosphorite.-------·------------ 44
p
Pebble deposits, mining of river-------------- 45 Pebble phosphate •• -------------------------- 52,53 Pebbles, chert.·------------------------------ 44
dolomite _______________ ------------------- 19 limonitic sandstone or phosphatic sand-
stone •. --------------------------. 28 quartz·--------------------------------- 9, 27,30
Pellets, apatite ___________________ 3,15, 16, 18, 19, 21, 26, 28, 29, 35, 36, 40, 42, 44, 49, 50, 54
Peninsular arch_----------------------------- 9-10 Phosphate deposits, composition.------------ 14 Phosphate minerals, primary_________________ 3
secondary.------------------------------- 3, 16 Phosphate pellet. See pellets, apatite. Phosphatic claY------------------------------ 15,48 Phosphatic clayey sands ________________ 15, 18, 32,48 Phosphatic limestone _________________________ 15,36 Phosphatic sand _______ 9, 16, 34, 35, 36, 38, 40, 44, 51,54 Phosphatic sands and clays, age ______________ 37-38 Phosphorite beds, composition_-------------- 48-49
effects of ground-water alteration_________ 28 mining _________ ·-------------------------- 45 original sedimentary units________________ 30
Phosphorites.-------------------------------- 15, 16 Phosphorus, in hard-rock phosphate deposits.. 50-52
in Hawthorn formation·------------------· 47-50 Pits, hard-rock phosphate district.----------- 45 Placer deposits of apatite pellets______________ 15 Plate rock, variety of secondary phosphate.... 35
mines near Anthony______________________ 35 Plateau, dissected, Alachua County---------· 24 Polk County---------------------------------· 9, 27 Powell, R. A., analyst. _______________________ , 102
Production of hard-rock phosphate----------·· 45
Q Quartz sand ________________ 16, 18, 19, 30, 34, 4l!, 49,53
R
Section 12 mine •• _--------------------------- 32 Shorelines, ancient.-------------------------- 13 Silver Springs·------------------------------- 11 Simmons, C. A., quarry______________________ 50 Simpson, G. G., quoted______________________ 38 Sinkholes ________________ 11, 13, 23, 30, 31, 36, 42, 55,56
Smith, R. E., analyst-------------------- 94, 99,102 Soft phosphate, composition.----------------- 16
partial chemical analyses_________________ 102 Solution of alumina from clay minerals_______ 29 Starkey, H. C., analyst_ _________ 72,103,110,111,112 Stratigraphic sections, Devil's Mill Hopper ••. 23-24
generalized from logs of core-drill holes 31-46.---------------------------- 17
hard-rock phosphate district ___________ 33,79-80 Miocene and younger beds in outliers,
Marion CountY------------------ 25 Miocene phosphatic beds _________________ 73-79
Suwannee limestone__________________________ 6, 32 Suwannee River·-------------------------- 11, 12,23 Sweeney, Ann, analyst---------------------- 94,102
T Tampa limestone·---------------------------- 38,44 Tenmile Creek·------------------------------ 12 Tennessee Valley Authority------------------ 6, 45 Terraces, marine, ancient.-------------------- 13
Pleistocene ____________________________ 13,33-34
Theories offered regarding original phosphatic materiaL·------------------------ 3S.39
Topograph~; __ -------------------------------- 11-12 Tsala Apopka, Lake ____ --------------------- 12 Tsala Apopka terrace deposits________________ 14 Tucker, W. P., Jr., analyst--------------- 94. 99,102
u Uranium detected by radioactivity logs _______ 49-50
enrichment by weathering agencies .• 3, 2s-29, 50 in hard-rock phosphate deposits__________ 50,
51, 54; table 19 in Hawthorn formation.------------------ 47-50 secondary phosphate from hard-rock phos-
phate mines ••• ------------------- 102 Uranium-phosphorus ratiO-------------------- 49
v Veinlets, calcite._ •• __ ------------------------
chalcedony_------------------------------dolomite _____ -----------------------------Radioactivity anomalies sonth of Ocala .••.....
Rainbow Springs .• --------------------------·· Residual theory of origin of certain lithologie
11 Vernon, R. 0., qnoted ..• ---------------------
31 20 31 26 20 Volcanic ash ..•• ------------------------------
units ______ ----- ____ --------_---... 30 w Resources, hard-rock phosphate district_----·· 53-54
Hawthorn formation.-------------------- 52-53 Waccasassa River---------------------------- 12 Waring, J. L., analyst.------------------- 94, 99,102
111 Weathering, effect on phosphatic sedimentary Risks, D. D., mineral constituents deter-
mined bY-------------------------River-pebble deposits.----------------------Ross property, hard-rock phosphate deposit ••
15 rocks----------------------------- 16 36; Weir, Lake.---------------------------------- 12
pl. 7 Withlacoochee River---------------------- 11, 12,13 S Wilson, Druid, identification of fossils by----- 6,
St. Johns River------------------------------ 28 36; table 10 Sand, age •. _--------------------------------- 27-28 Wood, silicified •.• ---------------------------- 40
0