Embed Size (px)
Citation preview
GEOLOGICAL AND OPERATIONAL SUMMARY
ST. GEORGE BASIN COST NO. 2 WELL
BERING SEA, ALASKA
Ronald F. Turner (Ed i t o r ) Col leen M. McCarthy
C. Drew Comer John A. Larson
J. G. Bolm Tabe 0. F l e t t A l len J. Adams
OCS Report MMS 84-0018
March 1984
UNITED STATES DEPARTMENT OF THE INTERIOR MINERALS MANAGEMENT SERVICE
Any use o f trade names i s f o r desc r ip t i ve purposes only and does not cons t i t u t e endorsement o f these products by t he i l i ne ra l s Management Service.

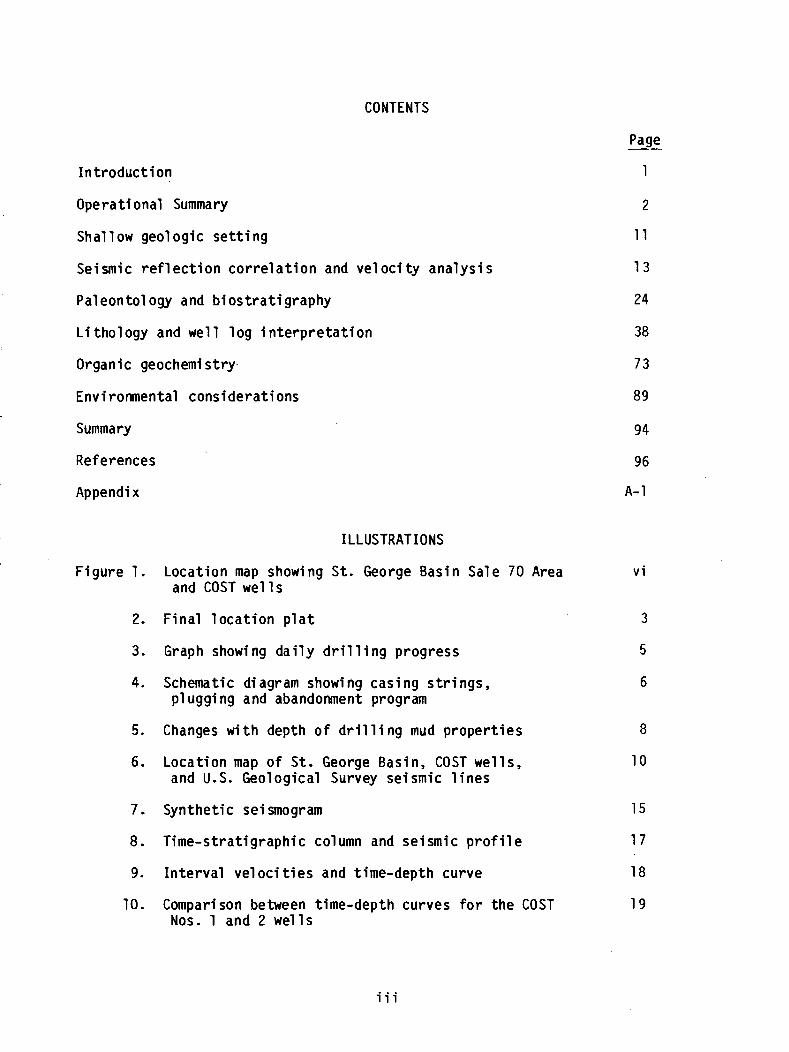
CONTENTS
In t roduc t ion
Page - 1
Operat ional Summary
Sha l l ow geologic s e t t i n g
Seismic r e f 1 e c t i o n c o r r e l a t i o n and ve l oc i ty ana lys i s
Pal eon to1 ogy and b i o s t r a t i graphy
L i tho1 ogy and we1 1 1 og i n t e r p r e t a t i o n
Organic geochemistry.
Environmental considerat ions
Summary
References
Appendix
ILLUSTRATIONS
F igure 1. Locat ion map showing St. George Basin Sale 70 Area and COST we1 1 s
2. F ina l l o c a t i o n p l a t
3. Graph showing d a i l y d r i l l i n g progress
4. Schematic diagram showing casing s t r i n g s , p l uggi ng and abandonment program
5. Changes w i t h depth o f d r i l li ng mud p roper t i es
6. Locat ion map o f St. George Basin, COST wel ls , and U.S. Geological Survey seismic l i n e s
7. Synthet ic seismogram
8. Time-strat igraphic column and seismic p r o f i l e
9. I n t e r v a l v e l o c i t i e s and time-depth curve
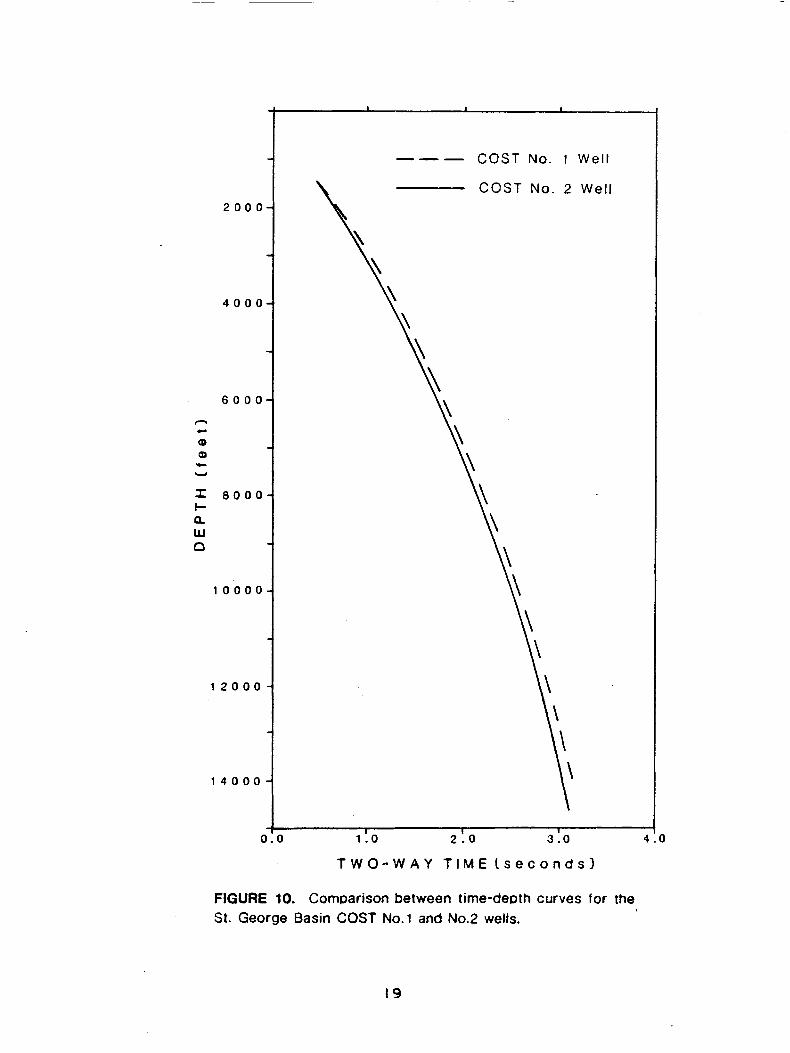
10. Comparison between time-depth curves f o r the COST Nos. 1 and 2 we1 1s
iii
ILLUSTRATIONS (cont . )
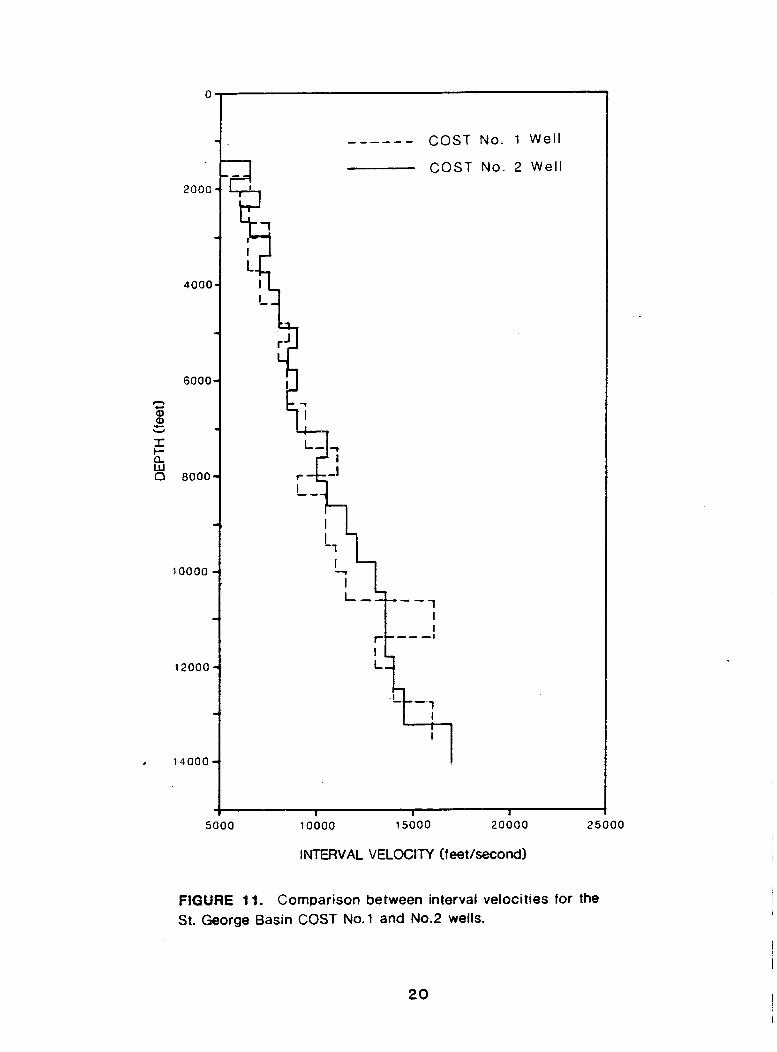
Compari son between i n t e r v a l ve l o c i t i e s f o r t h e COST Nos. 1 and 2 w e l l s
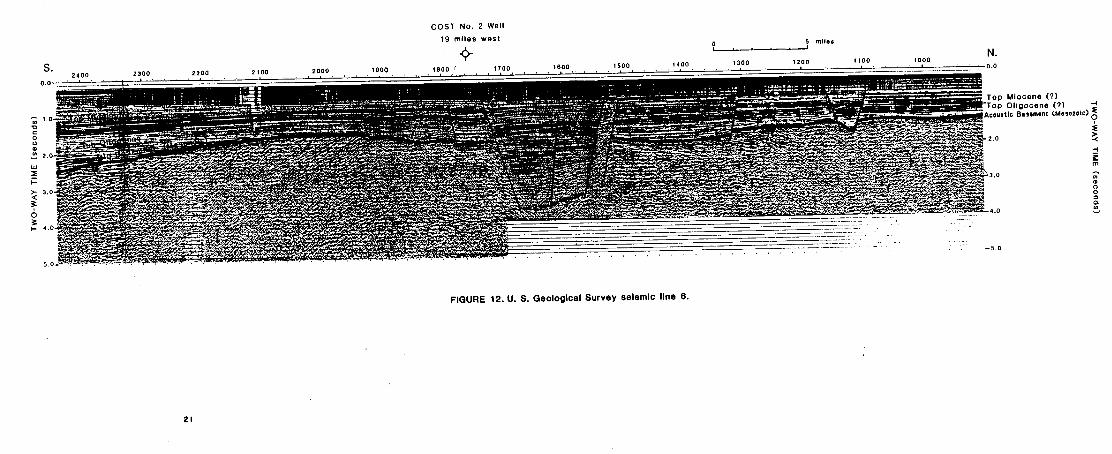
U.S. Geological Survey seismic l i n e 6
S t ra t i g raph ic summary, pa l eobathymetry , and c o r r e l a t i o n o f COST Nos. 1 and 2 w e l l s
Framework-clast composit ion o f sandstone samples from conventional cores
D i s t r i b u t i o n o f auth igenic minera ls i n conventional cores
Descr ip t ion o f conventional core 1
Descr ip t ion o f conventional co re 2
Descr ip t ion o f conventional core 3
Descr ip t ion o f conventional co re 4
Descr ip t ion o f conventional core 5
Descr ip t ion o f conventional co re 6
Descr ip t ion o f conventional core 7
Descr ip t ion o f conventional co re 8
Descr ip t ion o f conventional core 9
Descr ip t ion o f conventional core 10
Descr ip t ion o f conventional core 12
Descr ip t ion o f conventional core 13
Descr ip t ion o f conventional core 14
Descr ip t ion of conventional core 15
Descr ip t ion o f conventional core 16
Descr ip t ion o f conventional core 17
Page
20
ILLUSTRATIONS (cont. )
32. Plot of average porosity against depth fo r sandstone samples from conventional cores
33. Plot of average permeability against average porosi ty f o r sandstone sampl e s from conventional cores
34. High-resol ution thermometer data
35. Class i f icat ion of organic matter
36. Modified van Krevelen diagram
37. Selected indicators of thermal maturation from sidewall and conventional cores
38. Representative histograms of v i trini t e reflectance measurements
PLATES
Plate 1. Strat igraphic column and summary cha r t of geologic data
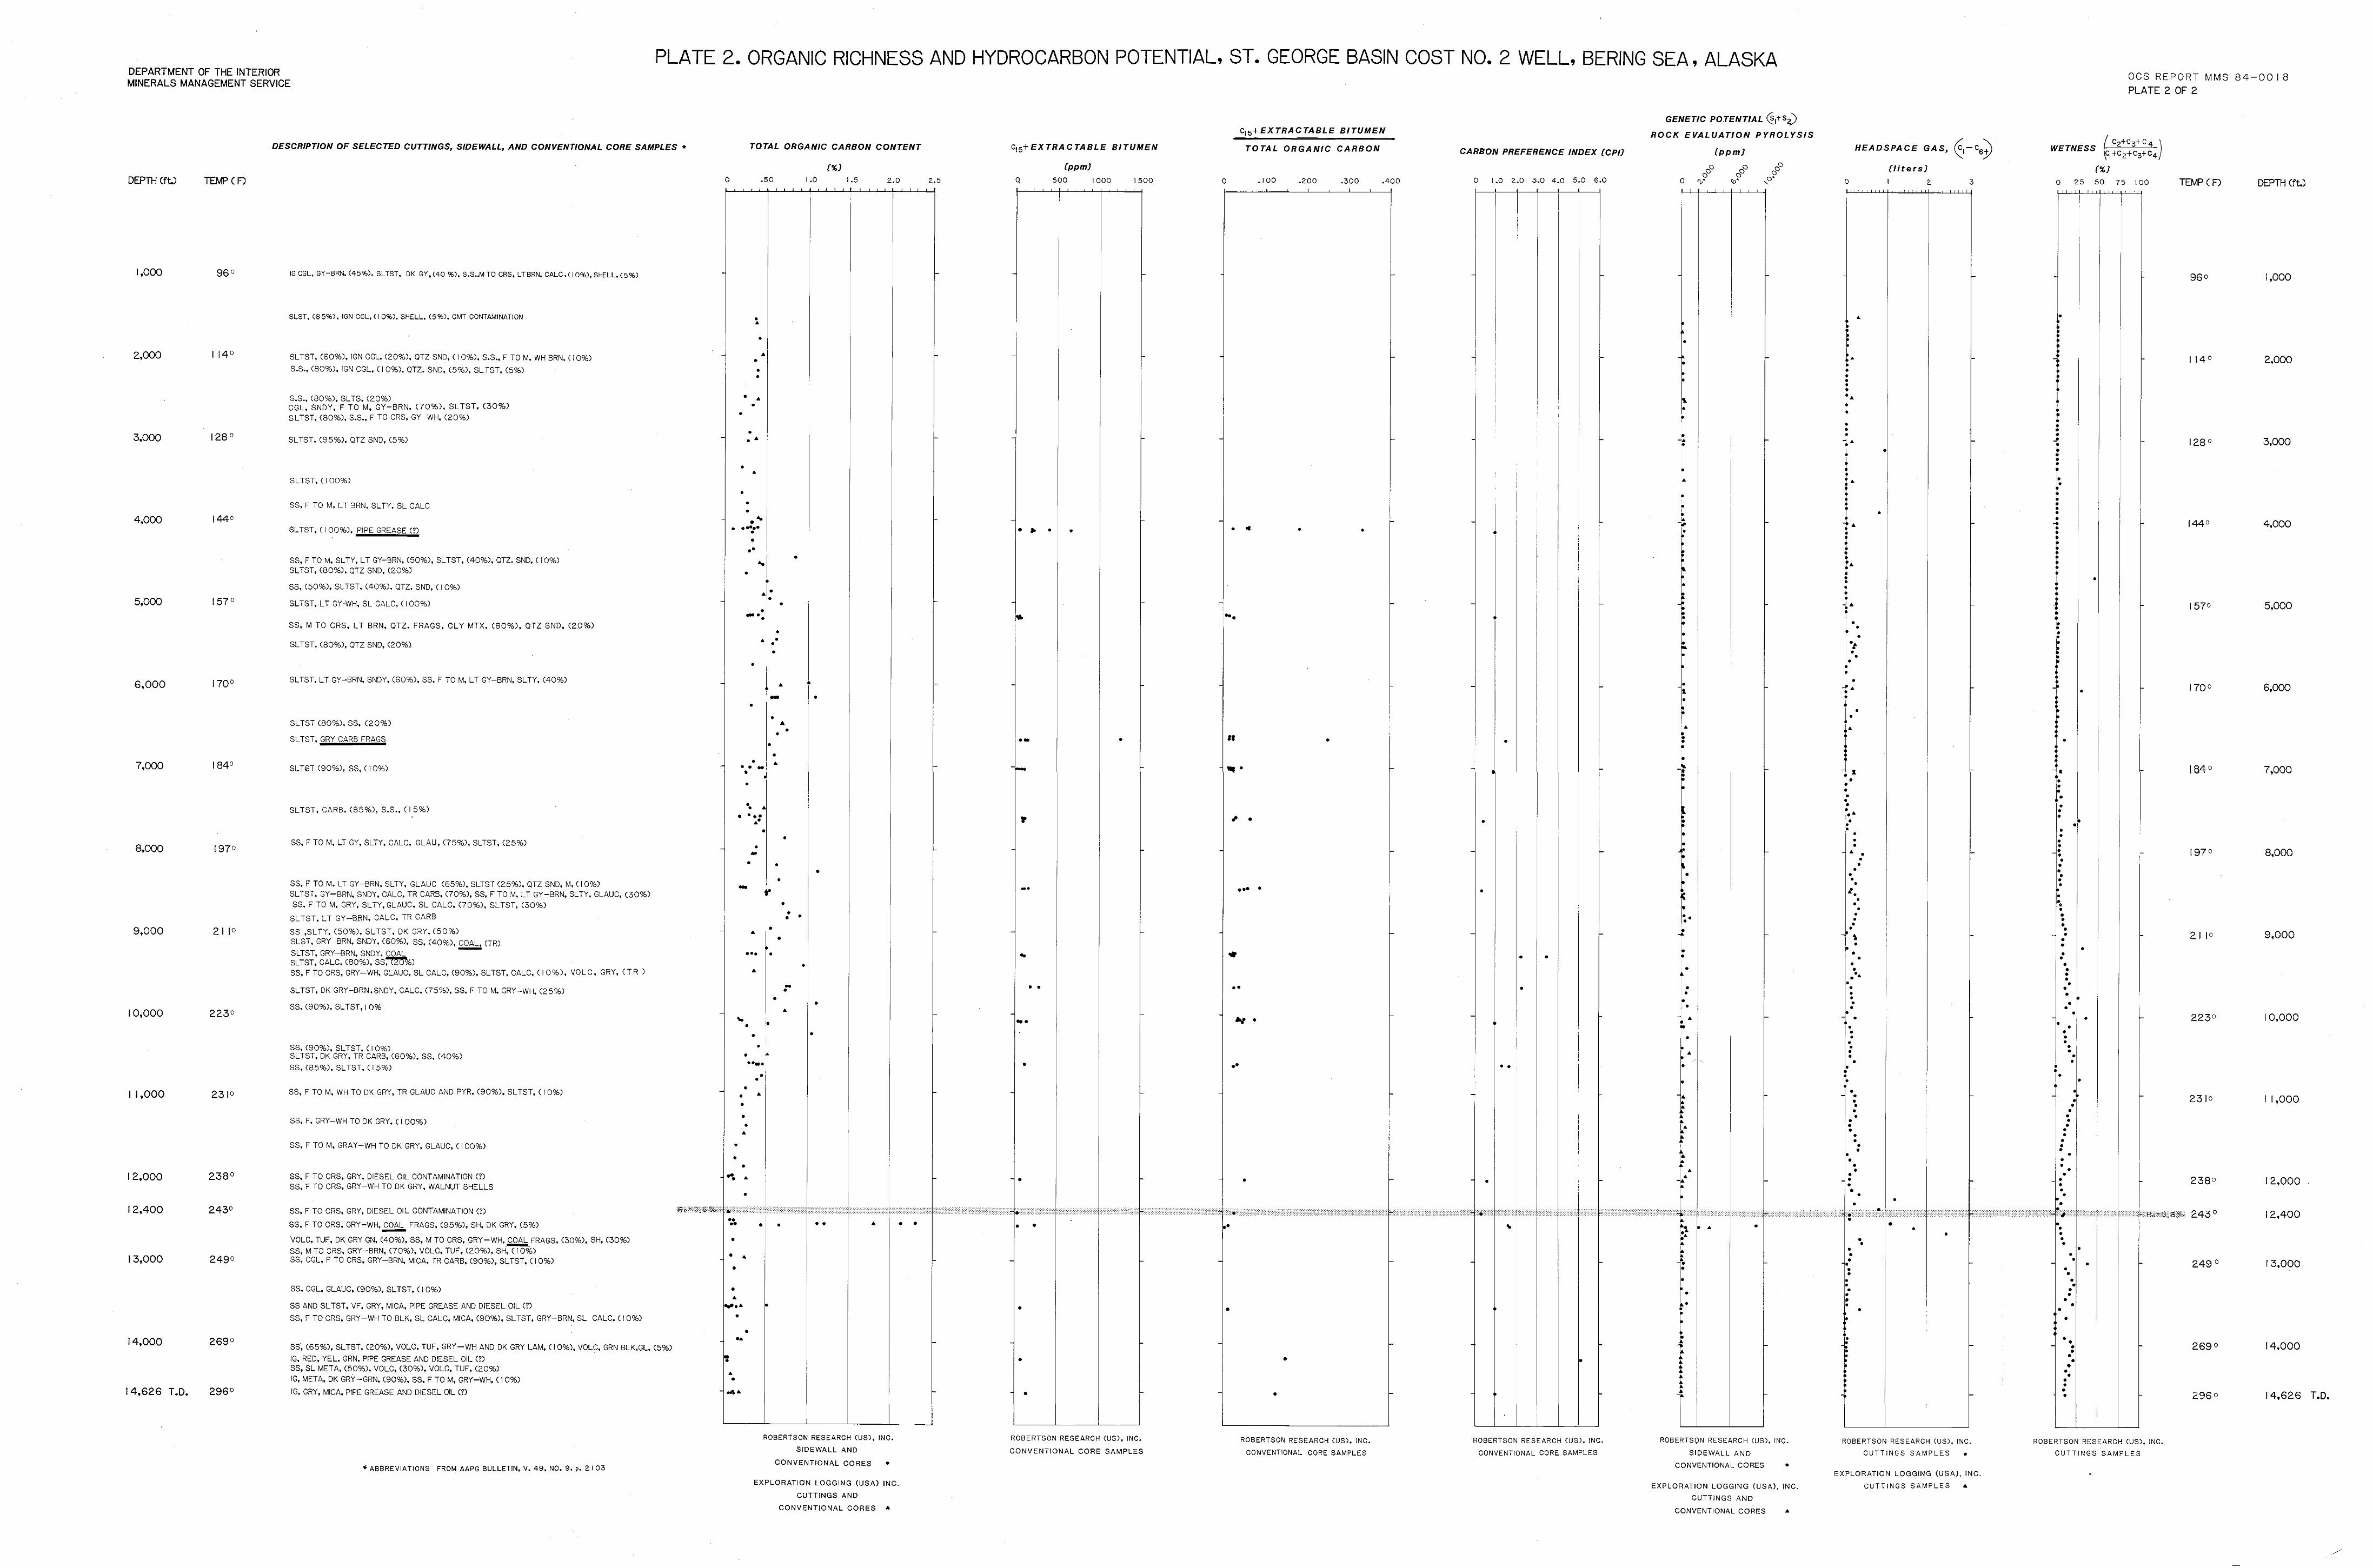
2. Organic richness and hydrocarbon potential
TABLES
Tab1 e 1. Conventional cores
2. Porosity and permeability
3. Samples containing more than 35 percent amorphous kerogen
4 . Conventional core samples w i t h high C15 + BIT r a t i o s --Tr-
5 . Suggested thresh01 d values f o r genetic potential (S1 + Sz) from pyrolysis.
6. Geochemical characteri s t i c s of Demai son's "type C" organic fac ies and analogous values from t h e COST No. 2 well
Page
6 2
6 3
EXPLANATION
< a 8 1 YOIY B A W eAU I. U . A - @cwr w u r
m x MAP OF ALASKA,
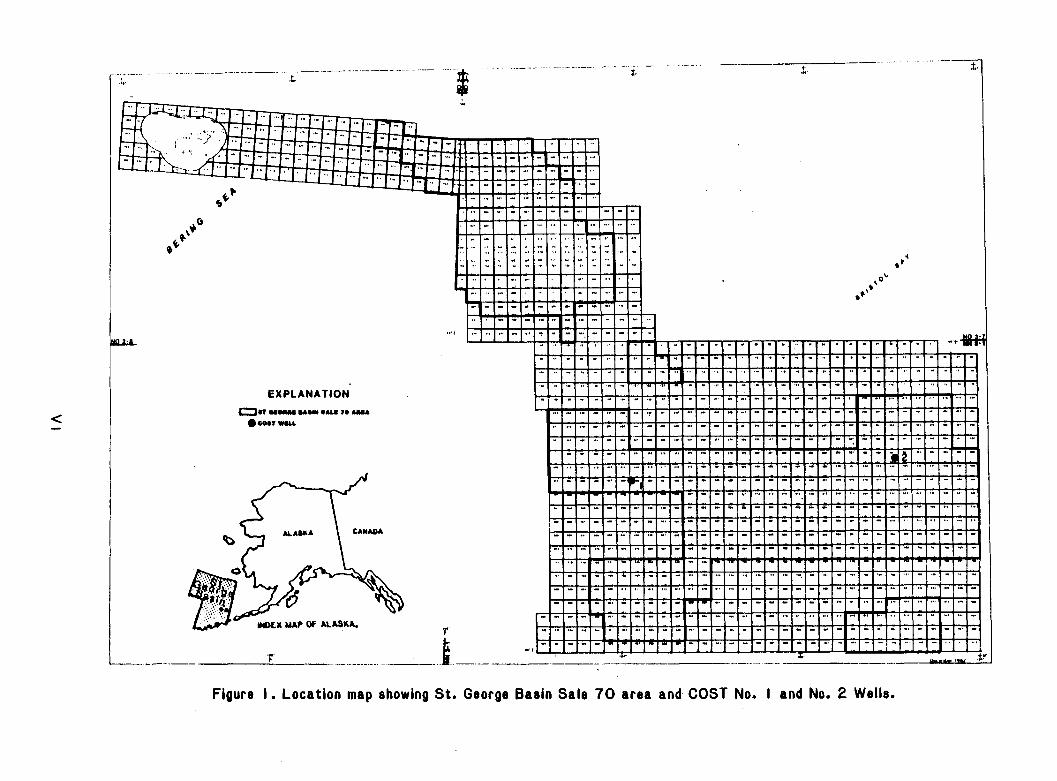
Figure I . Locat ion map showing St. George Basin Sa le 70 area and C O S T No. I and No. 2 Wells.
Geological and Operat ional Summary S t . George Basin COST No. 2 We1 1
Ber ing Sea, Alaska
Ronal d F. Turner, E d i t o r
INTRODUCTION
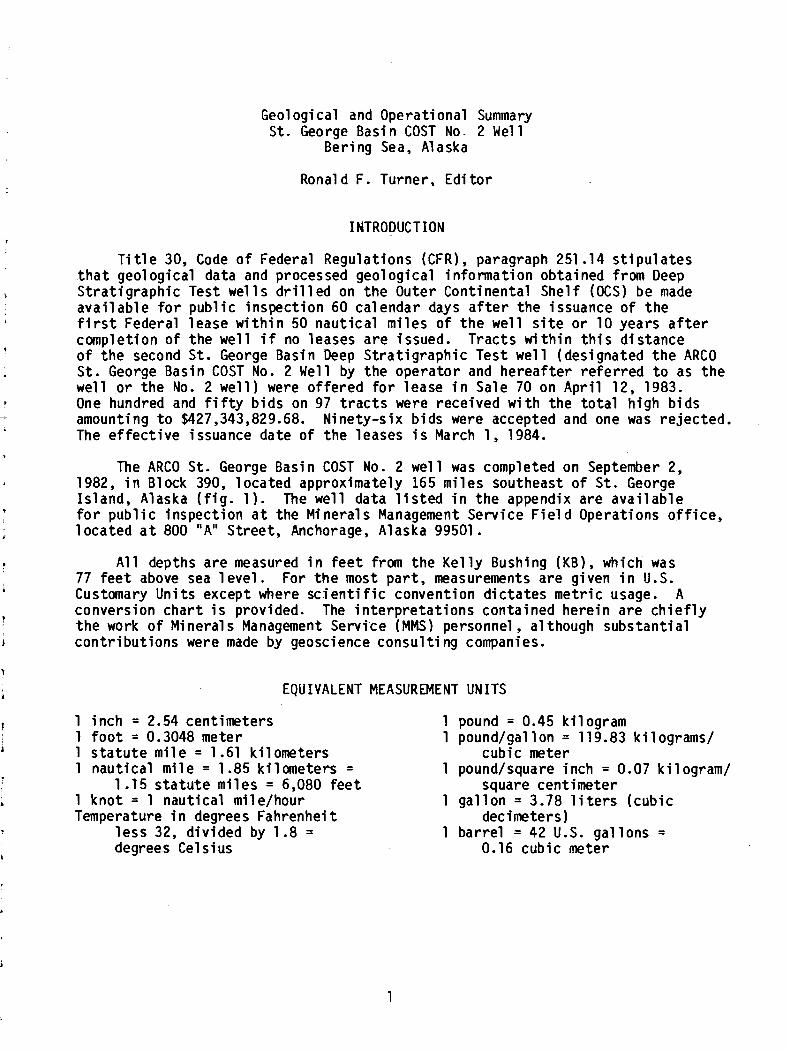
T i tl e 30, Code o f Federal Regulat ions (CFR) , paragraph 251 .14 s t i p u l a t e s t h a t geological data and processed geological i n fo rma t ion obtained from Deep S t r a t i g r a p h i c Test we l l s d r i l l e d on t h e Outer Cont inenta l She l f (OCS) be made a v a i l a b l e f o r p u b l i c inspect ion 60 calendar days a f t e r t h e issuance o f t h e f i r s t Federal lease w i t h i n 50 n a u t i c a l m i l e s o f t h e we l l s i t e o r 10 years a f t e r complet ion o f t h e we1 1 i f no leases a r e issued. T rac ts w i t h i n t h i s d is tance o f t h e second St. George Basin Deep S t r a t i g r a p h i c Test w e l l (designated t h e ARCO St. George Basin COST No. 2 Well by the opera tor and he rea f te r r e f e r r e d t o as t h e we1 1 o r t h e No. 2 we1 1 ) were o f f e r e d f o r 1 ease i n Sal e 70 on A p r i l 12, 1983. One hundred and f i f t y b i d s on 97 t r a c t s were received w i t h the t o t a l h igh b i d s amounting t o $427,343,829.68. N inety -s ix b ids were accepted and one was re jec ted . The e f f e c t i v e issuance date o f t h e leases i s March 1, 1984.
The ARCO St. George Basin COST No. 2 we l l was completed on September 2, 1982, i n Block 390, 1 ocated approximately 165 m i l e s southeast o f St. George Is land, Alaska ( f i g . 1 ) . The we l l data l i s t e d i n t h e appendix are a v a i l a b l e f o r pub1 i c inspect ion a t the M i nera l s Management Serv ice Fie1 d Operations o f f i c e , 1 ocated a t 800 "A" Street , Anchorage, Alaska 99501.
A l l depths a re measured i n f e e t from t h e K e l l y Bushing (KB), which was 77 f e e t above sea l e v e l . For t h e most p a r t , measurements are given i n U.S. Customary U n i t s except where s c i e n t i f i c convention d i c t a t e s m e t r i c usage. A conversion c h a r t i s provided. The i n t e r p r e t a t i o n s conta ined he re in are c h i e f l y t h e work o f Minerals Management Serv ice (MMS) personnel, al though substant ia l c o n t r i b u t i o n s were made by geoscience consu l t i ng companies.
EQUIVALENT MEASUREMENT UNITS
1 i n c h = 2.54 cent imeters 1 f o o t = 0.3048 meter 1 s t a t u t e m i l e = 1.61 k i lometers 1 naut ica l m i l e = 1.85 k i lometers =
1 .T5 s t a t u t e m i l e s = 6,080 f e e t 1 kno t = 1 naut ica l m i l e/hour Temperature i n degrees Fahrenheit
l e s s 32, d i v ided by 1.8 = degrees Cel s i us
1 pound = 0.45 k i logram 1 pound/gal 1 on = 119.83 k i 1 ograms/
cubic meter 1 pound/square inch = 0.07 k i logram/
square cent imeter 1 g a l l o n = 3.78 l i t e r s (cub ic
decimeters) 1 ba r re l = 42 U.S. ga l l ons =
0.16 cubic meter
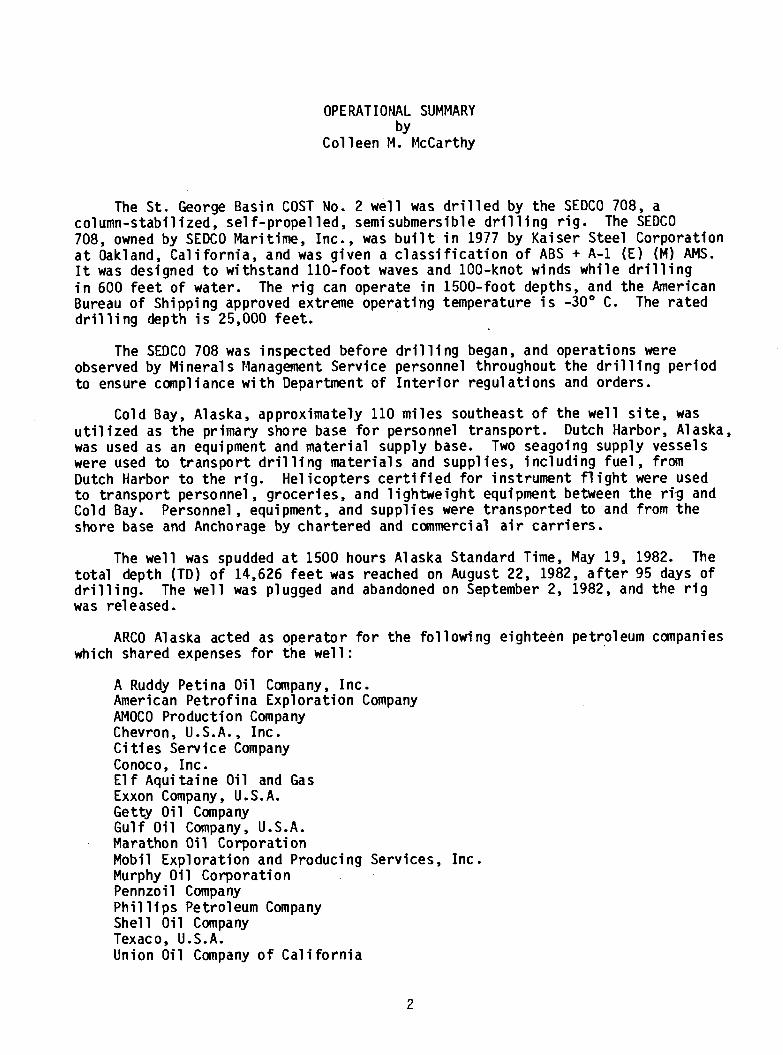
OPE RAT1 OFIAL SUMMARY by
Col 1 een M. McCarthy
The St. George Basin COST No. 2 we1 1 was d r i l l e d by t h e SEDCO 708, a c o l umn-stabil ized, se l f -propel led , semi submersibl e d r i l l i ng r i g . The SEDCO 708, owned by SEDCO Mari t ime, Inc., was b u i l t i n 1977 by Ka iser Steel Corporat ion a t Oakland, C a l i f o r n i a , and was g iven a c l a s s i f i c a t i o n o f ABS + A-1 (E) (M) AMS. It was designed t o w i ths tand 110-foot waves and 100-knot winds wh i l e d r i l l i n g i n 600 f e e t o f water. The r i g can operate i n 1500-foot depths, and the American Bureau o f Shipping approved extreme opera t ing temperature i s -30" C. The r a t e d d r i l l i n g depth i s 25,000 fee t .
The SEDCO 708 was inspected before d r i l l i n g began, and operat ions were observed by Mineral s Management Service personnel throughout t h e d r i l l i ng pe r iod t o ensure canpl i ance w i t h Department o f I n t e r i o r regul a t i ons and orders.
Cold Bay, Alaska, approximately 110 m i l e s southeast o f t h e we l l s i t e , was u t i l i z e d as t h e pr imary shore base f o r personnel t ranspor t . Dutch Harbor, Alaska, was used as an equipment and mate r ia l supply base. Two seagoing supply vessels were used to t ranspor t d r i l l i n g ma te r ia l s and suppl ies, i n c l u d i n g f u e l , from Dutch Harbor t o t h e r i g . He1 i c o p t e r s c e r t i f i e d f o r inst rument f l i g h t were used t o t ranspor t personnel , grocer ies, and l i g h t w e i g h t equipment between the rig and Cold Bay. Personnel , equipment, and supp l ies were t ranspor ted t o and from t h e shore base and Anchorage by char tered and canmercial a i r c a r r i e r s .
The we l l was spudded a t 1500 hours Alaska Standard Time, May 19, 1982. The t o t a l depth (TD) of 14,626 f e e t was reached on August 22, 1982, a f t e r 95 days o f d r i l l i n g . The we l l was plugged and abandoned on September 2, 1982, and t h e r i g was re1 eased.
ARC0 Alaska acted as opera tor f o r t h e f o l l o w i n g eighteen petroleum companies which shared expenses f o r t h e we1 1 :
A Ruddy Pet ina O i l Company, Inc . American Pe t ro f i na Exp lo ra t i on Company AMOCO Product ion Company Chevron, U.S.A., Inc. C i t i e s Serv ice Company Conoco, Inc. El f Aqui t a i ne O i l and Gas Exxon Company, U. S. A. Getty O i l Company Gul f O i l Company, U.S.A. Marathon O i 1 Corporat i on Mobil Exp lora t ion and Producing Services, Inc . Murphy O i l Corporat ion Pennzoi 1 Company P h i l l i p s Petroleum Company Shel l O i l Company Texaco, U.S.A. Union O i l Company o f C a l i f o r n i a
TERS
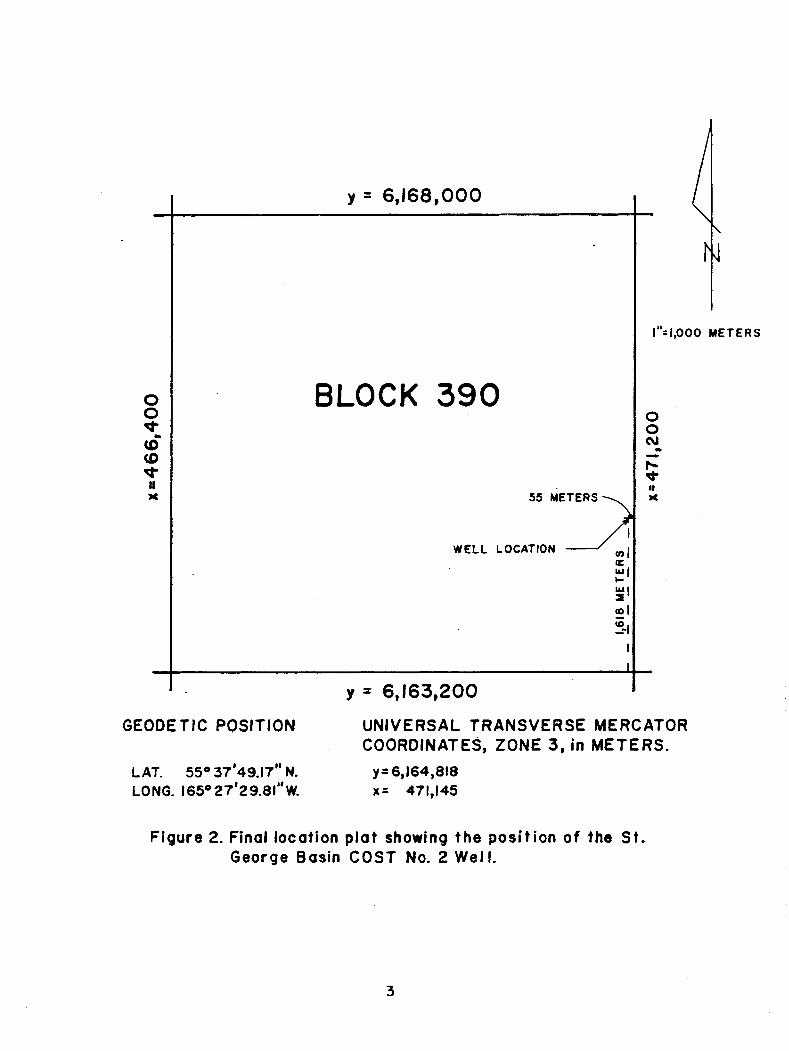
BLOCK 390
GEOOETIC POSITION UNIVERSAL TRANSVERSE MERCATOR COORDINATES, ZONE 3, in M E T E R S .
LAT. 550 37'49.17" N. y= 6,164,818 LONG. 165~27'29.81"~. x = 471,145
Figure 2. Final location p l a t showing t h e posi t ion o f the S t . George Basin C O S T No. 2 Wel I.
The w e l l l o c a t i o n was l a t 55O37'49.17" N., long 165O27'29.81" W., o r UTM coordinates (zone 3 ) X = 471,145 meters and Y = 6,164,818 meters. The f i n a l we l l s i t e was loca ted i n Block 390 ( f i g . 2). The water depth was 375 fee t . A l l measurements were made from t h e K e l l y Bushing (KB), which was 77 f e e t above sea l e v e l and 452 f e e t above the sea f l o o r . The w e l l was d r i l l e d w i t h l e s s than 1-degree dev ia t i on from normal t o a depth of 5000 fee t . A t 6479 fee t , t he angle increased t o 11 1/2 degrees, b u t was brought back t o 1 1/2 degrees i n the next thousand feet. A t 13,000 fee t , t h e dev ia t i on began inc reas ing again t o a f i n a l dev ia t i on o f 9 1/2 degrees a t TD.
D r i l l i ng s t i p u l a t i o n s requ i red t h e operator t o prov ide the Mineral s Management Service w i t h a1 1 wel l 1 ogs, samples, core slabs, and opera t iona l and techn ica l r e p o r t s a t t he same t ime as i n d u s t r y p a r t i c i p a n t s .
DRILLING PROGRAM
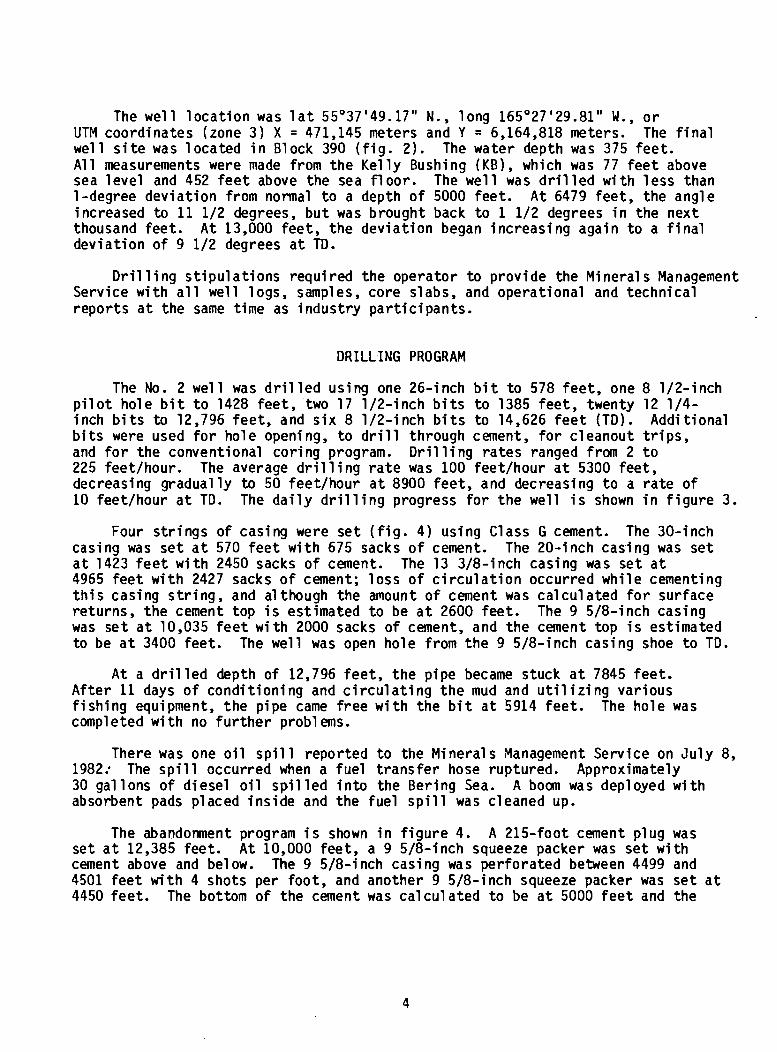
The No. 2 we1 1 was d r i l l e d us ing one 26-inch b i t t o 578 fee t , one 8 1/2- inch p i l o t ho le b i t t o 1428 fee t , two 17 1/2- inch b i t s t o 1385 fee t , twenty 12 1/4- inch b i t s to 12,796 fee t , and s i x 8 1/2- inch b i t s t o 14,626 f e e t (TD). Add i t iona l b i t s were used f o r ho le opening, t o d r i l l through cement, f o r c leanout t r i p s , and f o r t he conventional co r ing program. D r i l l i n g r a t e s ranged from 2 t o 225 feet/hour. The average d r i l l i n g r a t e was 100 feet /hour a t 5300 fee t , decreasing gradua l ly to 50 feet /hour a t 8900 fee t , and decreasing t o a r a t e o f 10 feet /hour a t TD. The d a i l y d r i l l i n g progress f o r t h e wel l i s shown i n f i g u r e 3.
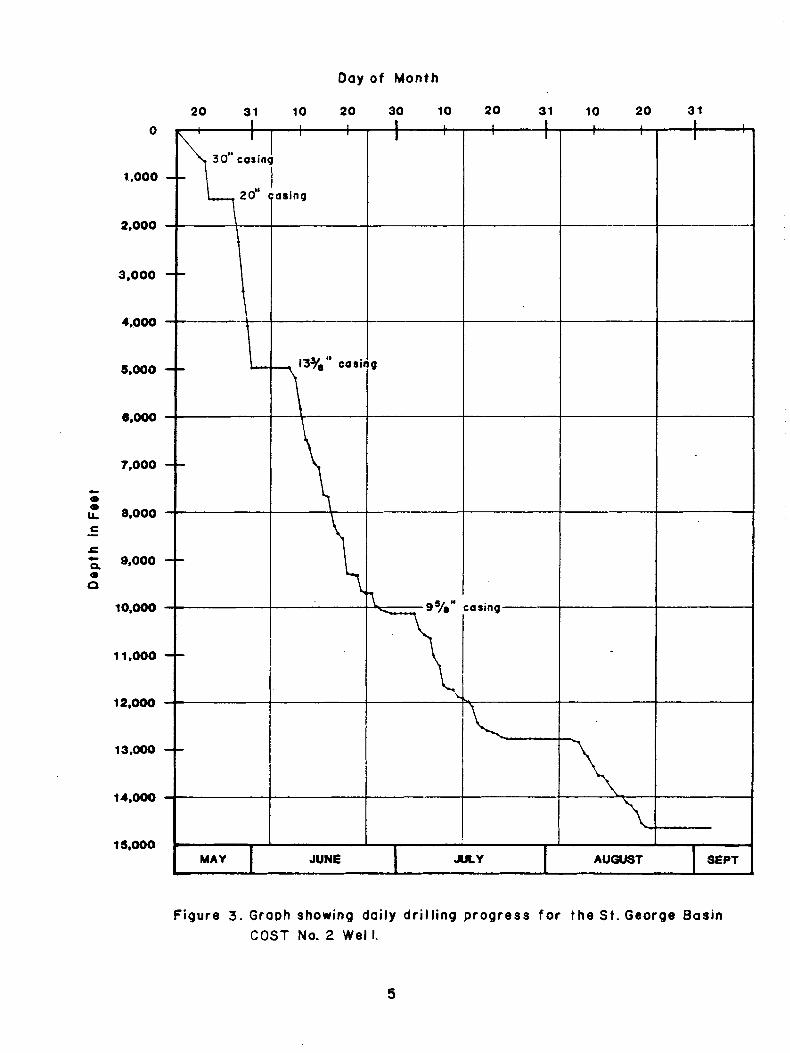
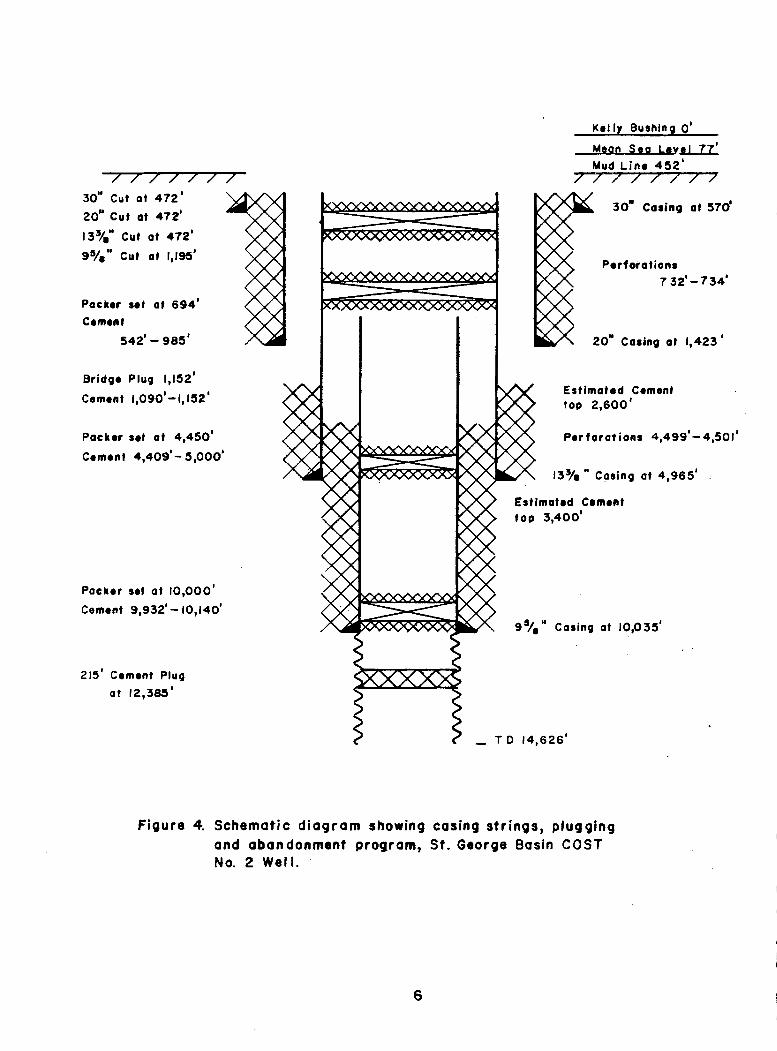
Four s t r i n g s o f casing were s e t ( f i g . 4) us ing Class G cement. The 30-inch casing was s e t a t 570 f e e t w i t h 675 sacks o f cement. The 20-inch casing was se t a t 1423 f e e t w i t h 2450 sacks o f cement. The 13 3/8-inch casing was s e t a t 4965 f e e t w i t h 2427 sacks o f cement; l o s s o f c i r c u l a t i o n occurred wh i l e cementing t h i s casing s t r i n g , and a1 though the amount o f cement was ca l cu la ted f o r sur face re turns , t h e cement top i s est imated t o be a t 2600 fee t . The 9 5/8- inch casing was s e t a t 10,035 f e e t w i t h 2000 sacks o f cement, and t h e cement top i s est imated t o be a t 3400 fee t . The we l l was open ho le from t h e 9 5/8- inch cas ing shoe t o TD.
A t a d r i l l e d depth o f 12,796 fee t , t h e p ipe became stuck a t 7845 fee t . A f t e r 11 days o f cond i t i on ing and c i r c u l a t i n g t h e mud and u t i l i z i n g var ious f i s h i n g equipment, t h e p ipe came f r e e w i t h t h e b i t a t 5914 fee t . The ho le was completed w i t h no f u r t h e r probl ems.
There was one o i l s p i l l reported t o the Minera ls Management Serv ice on J u l y 8, 1982: The s p i l l occurred when a f u e l t r a n s f e r hose ruptured. Approximately 30 ga l lons o f d iese l o i l s p i l l e d i n t o the Ber ing Sea. A boom was deployed w i t h absorbent pads placed i n s i d e and the f u e l s p i l l was cleaned up.
The abandonment program i s shown i n f i g u r e 4. A 215-foot cement p lug was se t a t 12,385 feet. A t 10,000 fee t , a 9 5/8-inch squeeze packer was s e t w i t h cement above and be1 ow. The 9 5/8-inch casing was pe r fo ra ted between 4499 and 4501 f e e t w i t h 4 shots per foo t , and another 9 5/8- inch squeeze packer was s e t a t 4450 fee t . The bottom o f the cement was ca l cu la ted t o be a t 5000 f e e t and the
Day of Month
Figure 3 . Graph showing daily dri l l ing progress f o r t h e S t . George Basin
COST No. 2 Wel I.
I I I I I I 1 I
--
--
--
--
--
I _j rn
I
SEPT
L
g5/." casing
I I
I
I
MAY JUNE X l t Y AUGUST
Ke l l y Bushing 0'
Mean Sea I
Mud L i n e 4 5 2 ' I / / / / / / /
30'' Cut a t 4 7 2 ' 30. Casing a t 570'
2oU Cut a t 472 '
13J/Iu Cut a t 472 '
95/." c u t a t I,ISS'
Packer set a t 6 9 4 '
Cement
Br idge Plug 1,152'
Cement 1,090'- I, 152'
Packer set a t 4,450'
Cement 4,409'- 5,000'
Packer set a t 10,000'
Cement 9,932'- 10,140'
215' Cement Plug
a t 12,385'
Es t imated Cement top 2,600'
P e r f o r a t ions 4,499'-4,501'
13y." Casing a t 4,965'
Es t lma t rd Cement
B 95/0U cas ing a t 10,035~
Figure 4. Schematic diagram showing casing strings, plugging and abandonment program, St. George Basin COST No. 2 Wel l .
top a t 4409 fee t . The 9 518-inch casing was c u t a t 1195 f e e t . A t 1152 fee t , a 13 318-inch br idge p lug was set. Per fora t ions were made i n t h e 13 318-inch casing between 732 and 734 fee t , and a squeeze packer was s e t a t 694 f e e t . The bottom o f the cement was ca l cu la ted t o be a t 985 f e e t and t h e top a t 542 f e e t . The 30-inch, 20-inch, and 13 318-inch casing s t r i n g s were a1 1 c u t a t 472 fee t .
DRILLING MUD
Changes i n selected d r i l l i n g mud p r o p e r t i e s a re shown i n f i g u r e 5. Sea- water was used as d r i l l i n g f l u i d f o r t h e f i r s t 1400 f e e t o f hole. A d r i l l i n g mud w i t h a weight o f 9.3 poundslgal l o n and a v i s c o s i t y o f 44 was int roduced a t 1400
l feet . Mud weight increased t o 9.8 pounds/gallon a t 9600 f e e t and decreased t o 9.7 poundslgal l o n a t TD. V iscos i ty was as low as 38 seconds a t 8000 f e e t and
I reached 50 seconds a t 13,750 fee t . Most v i s c o s i t y values were between 40 and 43 seconds. The i n i t i a l d r i l l i n g mud pH was 9.4. The pH increased to a maximum o f 13 a t 6600 fee t , then decreased t o 10.5 a t TD. The i n i t i a l c h l o r i d e concent ra t ion i n the mud was 3300 ppm, t h e h ighest va l ue f o r t he we1 1 . Chl o r i d e concent ra t ion was as low as 1200 ppm a t 9050 fee t , and t h e bottom ho le value was 1500 ppm. Mud- logging serv ices were provided by Exp lo ra t i on Logging from 1400 f e e t to TD.
SAMPLES AND TESTS
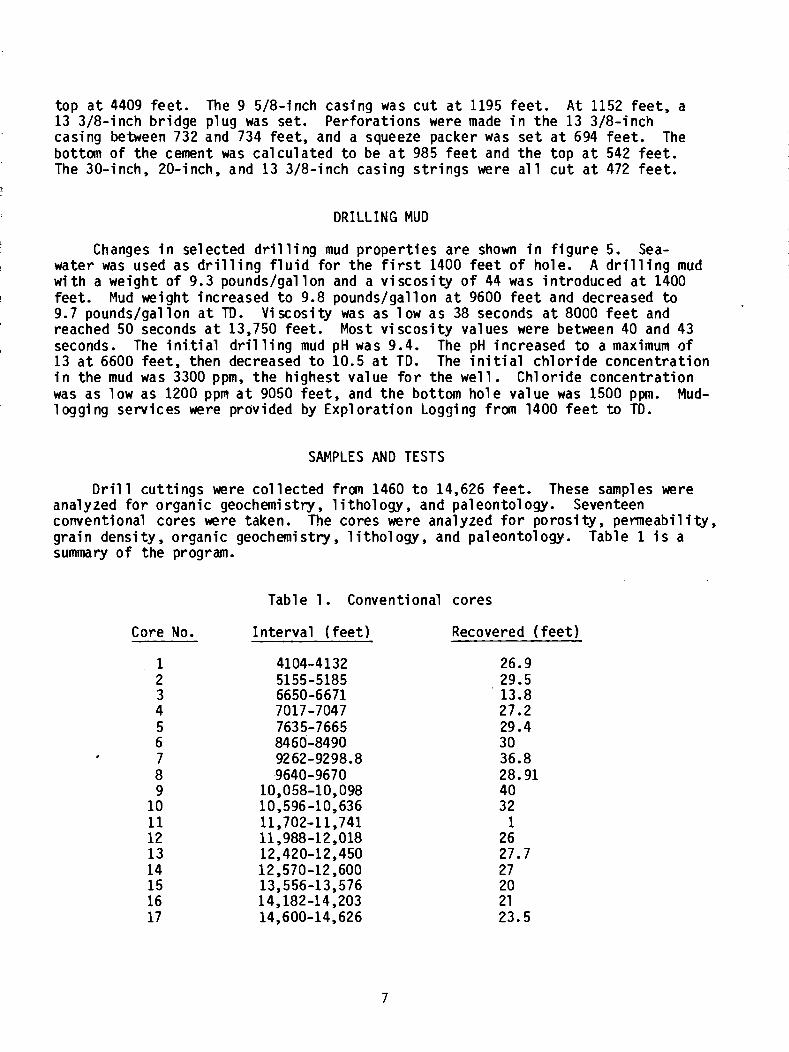
D r i l l c u t t i n g s were c o l l e c t e d from 1460 t o 14,626 fee t . These samples were analyzed f o r organic geochemi s t r y , 1 i tho1 ogy , and pal eonto l ogy. Seventeen conventional cores were taken. The cores were analyzed f o r po ros i t y , permeabil i ty, g ra in dens i ty , organic geochemistry, 1 i t h o l ogy, and paleontology. Table 1 i s a summary o f t he program.
Table 1 . Conventional cores
Core No. I n t e r v a l ( f e e t ) Recovered ( fee t )
26.9 29.5 13.8 27.2 29.4 3 0 36.8 28.91 4 0 32 1
2 6 27.7 2 7 2 0 2 1 23.5
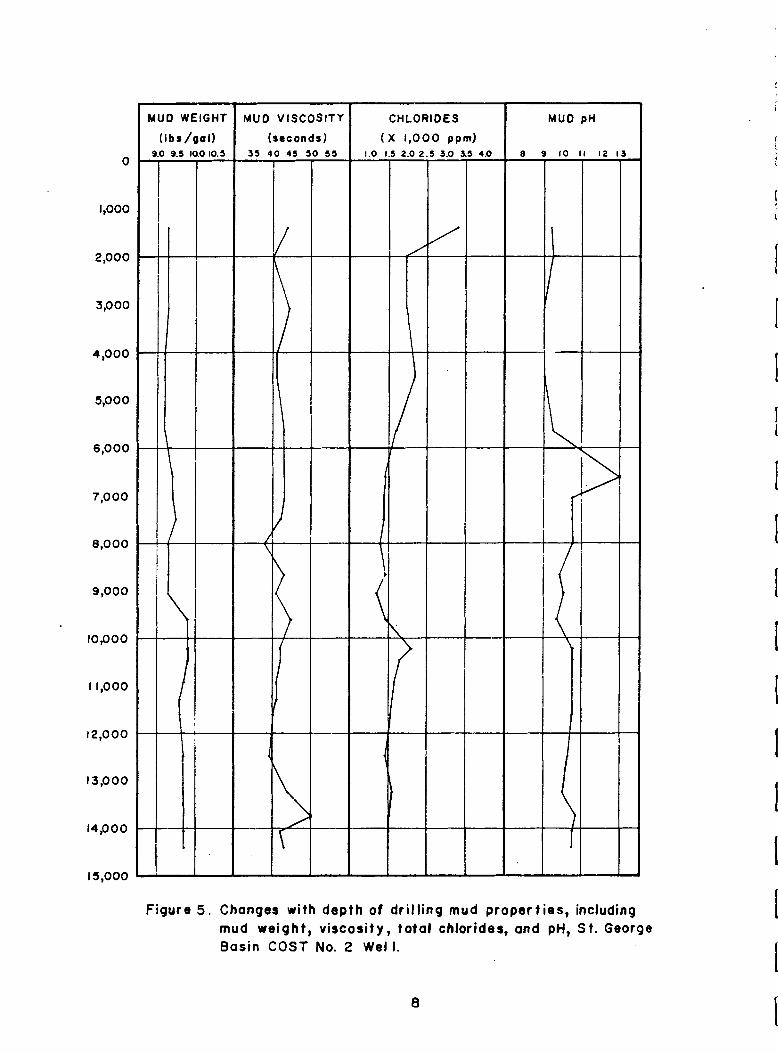
Figure 5 . Changes with depth of drill ing mud properties, including mud weight, viscosity, total chlorides, and pH, St . George Basin COST No. 2 Wel l .
Three ser ies o f s idewal l cores were shot. A t 4976 f e e t , 76 cores were recovered i n 90 attempts, w i t h 14 m i s f i r e d o r l o s t . A t 10,135 fee t , 153 cores were recovered i n 196 attempts, w i t h 36 m is f i res , 4 l o s t bul l e t s , and 3 empty b u l l e t s . A t 14,626 fee t , 108 cores were recovered i n 179 attempts, w i t h 14 m i s f i r e s , 50 l o s t b u l l e t s , and 7 empty bu l l e t s . Three hundred and th i r t y -seven successful s idewal l cores were obtained.
The types of l o g s and t h e i n t e r v a l s logged are as fol lows:
4976 t o 1422 f e e t Dual Induct ion Latera l Log Borehole Compensated Sonic LogIGamma RayISpontaneous
Potent i a1 /Cal i per Log Compensated Formation DensityICompensated Neutron Log Long Spaced Sonic Log D i pme t e r Proximi ty Micro l og Repeat Formation Tester
10,135 t o 4976 f e e t Dual Induct ion Latera l LogISpontaneous Po ten t i a1 /Gamma Ray Bulk Density LogINeutron Gamma Tool High Resolut ion Continuous D i pmeter Compensated Formation Densi tylcompensated Neutron LogINeutron Gamma
Tool Repeat Formation Tester Prox imi ty Micro l og Long Spaced Sonic Log Cement Bond Log Borehol e Compensated Sonic LogIGamma Ray Vel o c i ty Survey V e r t i c a l Seismic P r o f i l e
14,622 t o 10,135 f e e t Dual Induct ion Latera l LogIBorehole Compensated Sonic LogIGamma
RayISpontaneous Potent i a1 Long Spaced Sonic LogIGamma Ray Compensated Formation Density Log/Compensated Neutron LogINeutron
Gamma Tool Dipmeter Temperature Survey
There were no d r i l l stem t e s t s made on t h i s we1 1.
WEATHER
Weather cond i t ions were monitored from t h e middle o f May u n t i l t he end o f August 1982. Waves o f 10 f e e t o r more occurred on 15 days, and a maximum wave h e i g h t o f 17 f e e t was reached i n the l a t t e r p a r t s o f May and August. I n l a t e May and e a r l y June, wind speeds greater than 45 knots were recorded on 2 days. The maximum wind speed o f 54 knots was recorded i n e a r l y June. The temperature ranged from 30" F i n May t o 53O F i n August.
174 0 172 O 170' 1680 166' 164O 162'
5
e + \
540. e %
8
ExDlanation - zoo - Balhymelric contour
Depth in meters
Stajute M I I ~ ~ K~lometers - 520
1 1
174O 1
172' 17'0° 168 O 166' 1 1 I
164' 162'
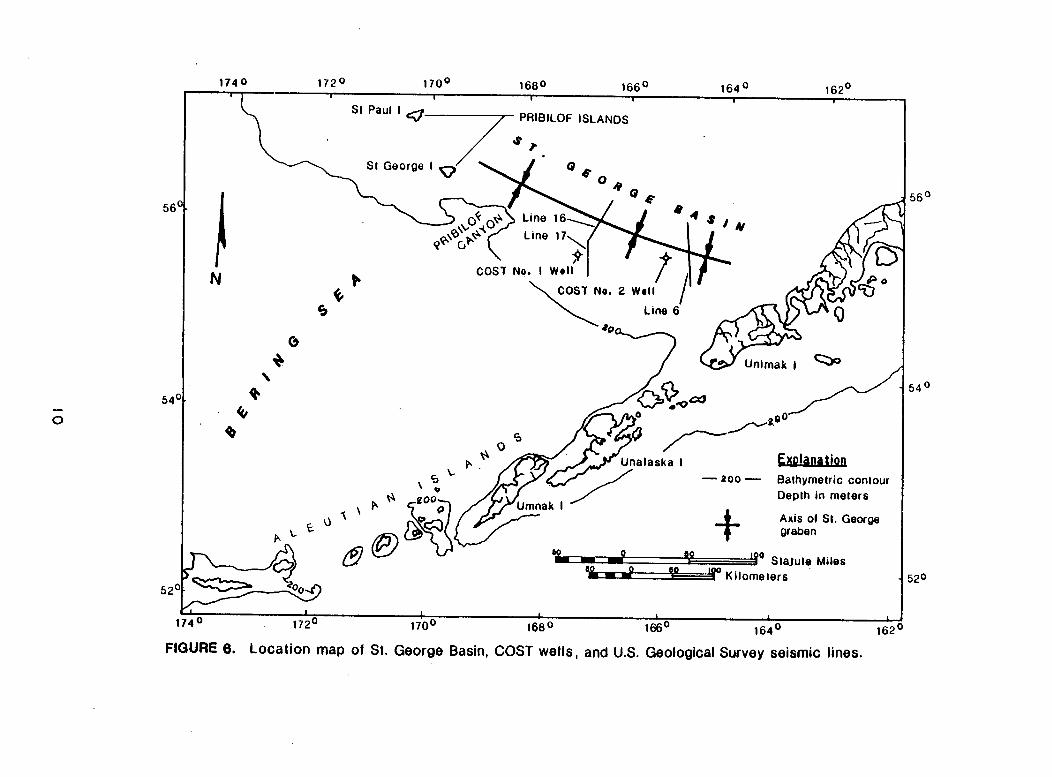
FIGURE 6. Location map of St. George Basin, COST wells, and U.S. Geological Survey seismic lines.
SHALLOW GEOLOGIC SETTING by
C. Drew Comer
The shal low geologic c h a r a c t e r i s t i c s of t h e d r i l l s i t e were i d e n t i f i e d i n a h igh- reso lu t ion geophysical survey (Nekton, Inc., 1980a). Th is study evaluated p o t e n t i a l d r i l l i n g hazards i n s h a l l ow sediments. A more d e t a i l e d d iscussion of t h e regional environmental geology i s inc luded i n the F ina l Environmental Impact Statement (U.S. Minerals Management Service, 19821, Gardner and o thers ( 1 979), and Comer ( i n press).
REGIONAL ENVIRONMENTAL GEOLOGY
The S t . George basin i s l oca ted on t h e Outer Continental She l f o f t h e Ber ing Sea i n water depths ranging from 340 t o 530 fee t . The sea f l o o r i s e s s e n t i a l l y f l a t and fea ture less w i t h an average reg iona l slope o f l e s s than one degree. According t o Gardner and o thers (19801, t h e s u r f i c i a l sediments c o n s i s t most ly o f unconsol idated s i l t and s i l t y sand w i t h small amounts o f vo lcan ic ash and diatoms and a re most ly r e l i c t from a pe r iod o f low sea l e v e l . Very l i t t l e recent sediment i s be ing t ranspor ted i n t o t h e area.
G lac ia l a c t i v i t y i n the P le is tocene caused lower sea l e v e l s and exposed much o f t h e she l f . The outer Ber ing Sea s h e l f probably f l u c t u a t e d between sediment-starved condi t ions, as a t present, and sediment-enriched cond i t ions , when lower sea 1 eve1 s made more sediment a v a i l ab le by exposing t h e i nne r and middle she1 f t o subaerial erosion. Sha l l ow s t r a t a on h igh - reso lu t i on seismic r e f l e c t i o n p r o f i l e s appear as r h y t h m i c a l l y interbedded l a y e r s o f continuous, ho r i zon ta l r e f l ec tors between incoherent, poo r l y r e f l e c t i v e zones. Thi s sequence may represent the low-stand/sediment-rich and high-stand/sediment-starved re1 a t i onsh i p o f Pleistocene deposi t ion.
The main s t r u c t u r a l f ea tu re o f t h e bas in i s t h e St. George graben,.a la rge, f a u l t-bounded depression ( f i g . 6). Numerous f a u l t s occur i n t h e area, most ly a long the margin o f t he graben. These f a u l t s a r e high-angle, down-to-the-basin normal f a u l t s t h a t usual 1y c o r r e l a t e w i t h acoust ic basement o f f s e t s (Marl ow and Cooper, 1980). Many o f the f a u l t s r u p t u r e near-surface sediments and some c u t the sea f l o o r (Comer, i n press). Surface o f f s e t s o f 3 t o 6 f e e t are apparent on some seismic r e f l e c t i o n p r o f i l e s . Some o f f s e t s may be due t o d i f f e r e n t i a l sediment compaction r a t h e r than t o recen t t e c t o n i c movement. The area i s se i sm ica l l y ac t ive , however. Davies (1982) repor ted th ree earthquakes i n the range o f 6.5 t o 7.5 on t h e R ich ter scale and numerous smaller events i n t h e St. George bas in area since 1925. He ca lcu la ted a 10 percent p r o b a b i l i t y f o r ground acce lera t ion t o exceed 0.2 g a t an a r b i t r a r y s i t e w i t h i n t h e bas in i n a 40-year period.
The presence o f gas i n the St. George bas in i s i n f e r r e d from acoust ic anomalies on seismic r e f l e c t i o n p r o f i l e s . These anomalies may be due t o e i t h e r gas-charged sediment o r conf ined gas accumulations. Shallow gas-charged sediment i s under normal t o near-normal pressure and poses l e s s o f a r i s k t o d r i l l i n g operat ions than conf ined gas accumulations, which may occur i n zones w i t h possib le abnormal pressure.
SITE-SPECIFIC ENVIRONMENTAL GEOLOGY
The s i t e survey performed by Nekton, Inc., i n d i c a t e d t h a t t h e sea f l o o r a t t h e w e l l s i t e i s e s s e n t i a l l y f l a t and fea ture less . It i s under la in by probable Ple is tocene s t r a t a t h a t roughly p a r a l l e l t h e sea f loor . Two normal growth f a u l t s s t r i k i n g roughly northwest-southeast c u t these s t r a t a i n the v i c i n i t y o f t h e we l l , b u t do n o t o f f s e t t he sea f l o o r . The v e r t i c a l displacement o f these f a u l t s i s l e s s than 30 fee t . S t r a t a w i t h i n 75 f e e t o f t he sea f l o o r a re af fected. The presence o f shal low gas-charged sediments a t t h e proposed d r i l l s i t e was i n f e r r e d from acoust ic anomalies on seismic p r o f i l e s . The gas i s probably o f biogenic o r i g i n and under normal t o near-normal pressure. A1 though such gas-charged sediments pose f a r l e s s r i s k than conf ined gas accumulations o f thermogenic o r i g i n , t h e operator e lec ted t o move t h e we1 1 s i t e northwest t o an area w i t h no acoust ic anomalies. Shallow gas d i d no t prove t o be a problem dur ing d r i l l i n g a c t i v i t i e s .
SEISMIC REFLECTION CORRELATION AND
VELOCITY ANALYSIS by
C. Drew Comer
The seismic s t ra t i g raphy o f t he S t . George Basin COST No. 2 we l l was developed from r e f l e c t i o n data c o l l e c t e d by the USGS i n 1976, and a syn the t i c seismogram generated from the acoust ic l o g by MMS personnel. Por t ions o f two seismic r e f l e c t i o n p r o f i l e s submitted w i t h the a p p l i c a t i o n f o r permi t t o d r i l l , 1976 S e i s c m Del ta l i n e s 27 and 62, were a lso u t i l ized. V e l o c i t y data from t h e No. 2 we1 1 were compared w i t h the No. 1 we1 1 . The 1 ocat ions o f the we1 1 s and the USGS 1 ines i n r e l a t i o n t o the ax i s o f St. George bas in are shown i n f i g u r e 5 .
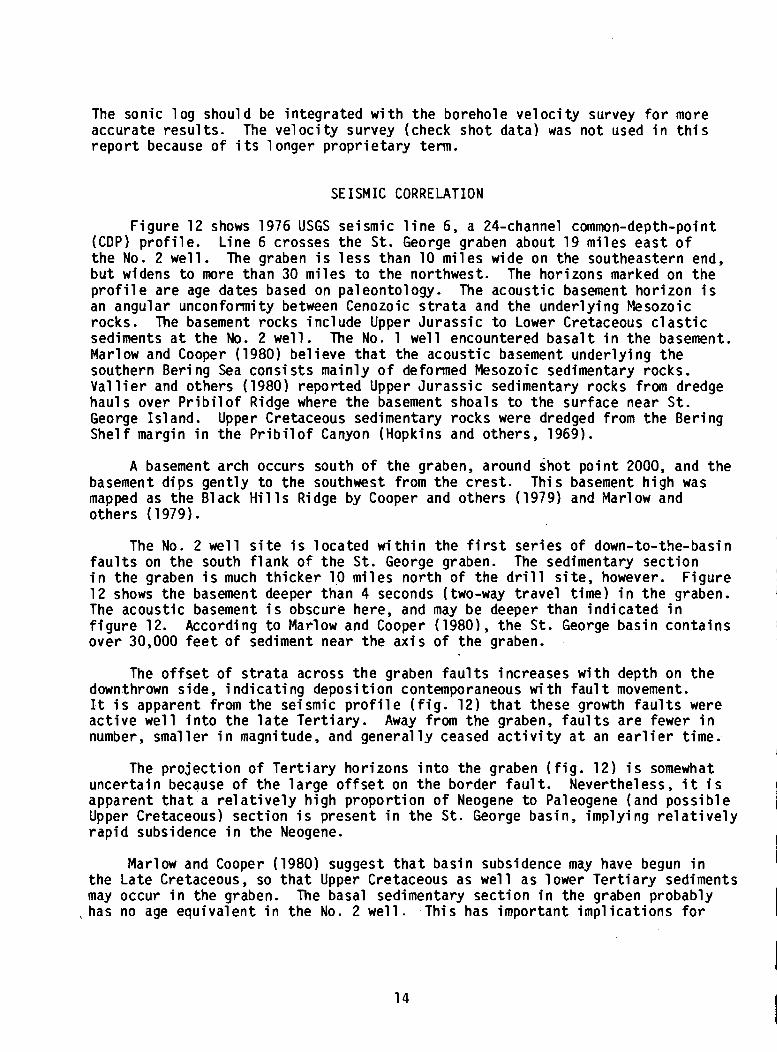
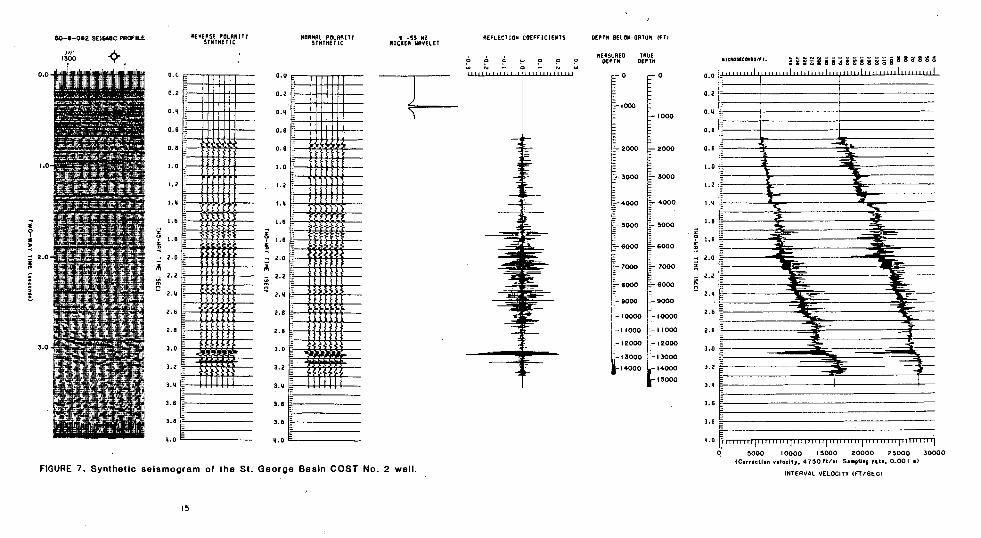
The synthet ic seismogram ( f i g . 7 ) was generated from t h e borehole- compensated sonic log. The l o g was d i g i t i z e d and t h e data were entered i n t o a computer program t h a t produced a synthet ic seismogram w i thou t mu1 t i p 1 es. The program assumes constant densi ty , ho r i zon ta l s t r a t a , and i n c i d e n t waves t h a t a r e normal t o the r e f l e c t i n g sur face and have p lanar wave f ron ts . The r e f 1 e c t i o n c o e f f i c i e n t s ca l cu l a ted by t h e program were convol ved w i t h a standard Ricker wave1 e t having a frequency range o f 8 t o 55 Hz. The syn the t i c seismogram i s d isplayed i n both normal and reverse p o l a r i t y . The seismic r e f l e c t i o n p r o f i l e d isplayed w i t h the synthet ic seismogram i s 1976 S e i s c m De l ta l i n e 62. F igure 8 i s a t ime-s t ra t i g raph ic column o f t he No. 2 wel l based on paleontology.
VELOCITY ANALYSIS
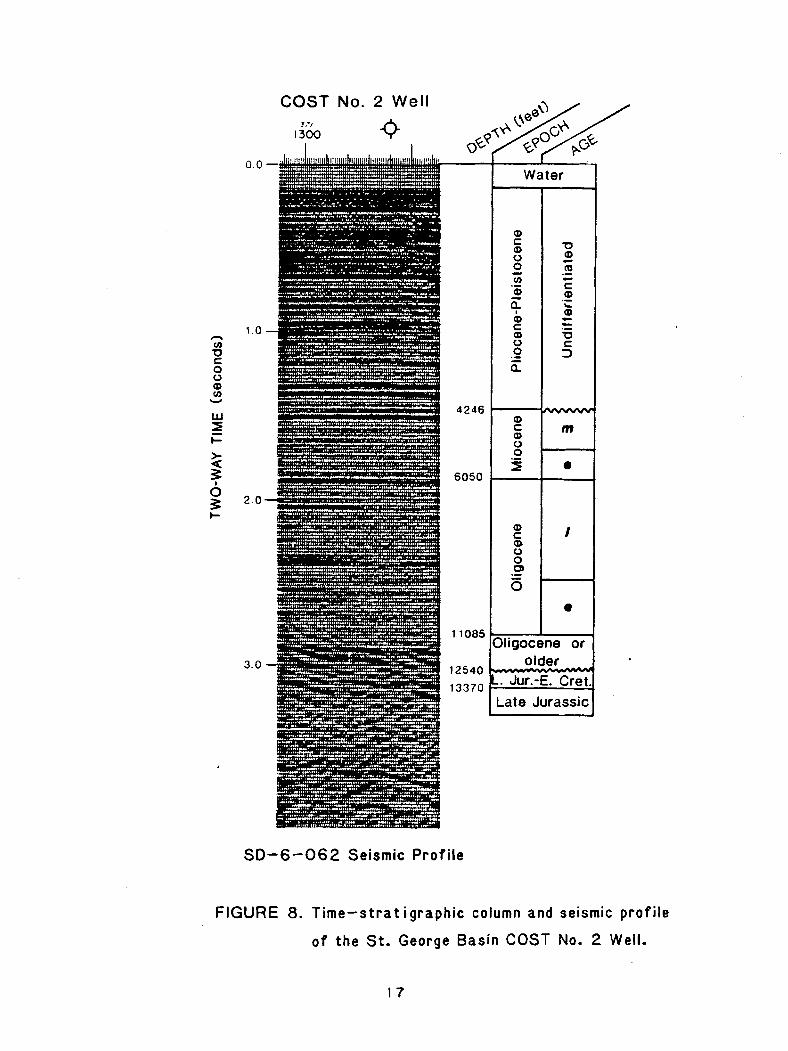
I n t e r v a l v e l o c i t i e s and a time-depth curve ( f i g . 9 ) were ca l cu la ted from t h e sonic log. The i n t e r v a l v e l o c i t i e s increase gradua l ly w i t h depth w i t h no s i g n i f i c a n t reversa ls o r major breaks throughout t h e Cenozoic sect ion. The vel oc i t y o f the f i r s t i n t e r v a l i n the Mesozoic basement (12,550 t o 13,275 f e e t ) i s unusual ly low. This i s probably due t o poor sonic-1 og data caused by extensive washouts i n the w e l l bore above 12,800 f e e t . The next lower i n t e r v a l , 13,275 t o 14,125 fee t , has a much h igher i n t e r v a l v e l o c i t y (17,000 feet/second), which i s cons is ten t w i t h t h a t expected from t h e acoust ic basement.
F igure 10 i s a comparison o f time-depth curves generated from the sonic 1 ogs o f the Nos. 1 and 2 we1 1s. The curve o f the No. 2 we1 1 i s steeper than t h a t o f t he No. 1 we1 1 , i n d i c a t i n g a h igher average v e l o c i t y f o r t he No. 2 we l l . F igure 11 i s a comparison o f i n t e r v a l v e l o c i t i e s , which are a lso genera l ly h igher i n the No. 2 we l l .
It should be pointed out t h a t v e l o c i t i e s de r i ved from sonic logs are sub jec t t o d r i f t e r r o r because o f i r r e g u l a r i t i e s w i t h i n the borehol e (Tucker, 1982). A1 so, because the shal lowest p a r t o f t he we1 1 was n o t logged, t h e sonic l o g and the syn the t i c seismogram generated from i t are somewhat incomplete.
The sonic 1 og should be in teg ra ted w i t h t h e borehole v e l o c i t y survey f o r more accurate r e s u l t s . The v e l o c i t y survey (check shot data) was no t used i n t h i s r e p o r t because o f i t s 1 onger p r o p r i e t a r y term.
SEISMIC CORRELATION
F igu re 12 shows 1976 USGS seismic 1 i n e 6, a 24-channel common-depth-point (CDP) p r o f i l e . L ine 6 crosses t h e S t . George graben about 19 mi les e a s t o f t h e No. 2 we l l . The graben i s l e s s than 10 m i l e s wide on the southeastern end, b u t widens t o more than 30 m i les t o t h e northwest. The hor izons marked on t h e p r o f i l e a re age dates based on paleontology. The acoust ic basement hor izon i s an angular unconformity between Cenozoic s t r a t a and t h e under ly ing Mesozoic rocks. The basement rocks i nc lude Upper Jurass ic t o Lower Cretaceous c l a s t i c sediments a t t he No. 2 we1 1. The No. 1 we1 1 encountered b a s a l t i n t h e basement. Marl ow and Cooper (1980) be1 ieve t h a t t he acoust ic basement under ly ing t h e southern Ber i ng Sea consi s t s main ly o f deformed Mesozoic sedimentary rocks. V a l l i e r and others (1980) repor ted Upper Jurass ic sedimentary rocks from dredge haul s over P r i b i l o f Ridge where t h e basement shoals t o the sur face near S t . George I s1 and. Upper Cretaceous sedimentary rocks were dredged from t h e B e r i ng She l f margin i n t h e P r i b i l o f Canyon (Hopkins and others, 1969).
A basement arch occurs south of t h e graben, around shot p o i n t 2000, and t h e basement d ips gent ly t o t h e southwest from t h e c r e s t - Th is basement h i g h was mapped as t h e Black Hi1 1s Ridge by Cooper and others (1979) and Marl ow and o the rs ( 1 979).
The No. 2 we1 1 s i t e i s l oca ted w i t h i n t h e f i r s t se r ies o f down-to-the-basin f a u l t s on t h e south f l a n k of t h e St. George graben. The sedimentary sec t i on i n t h e graben i s much t h i c k e r 10 m i l es n o r t h o f t he d r i l l s i t e , however. F igu re 12 shows t h e basement deeper than 4 seconds (two-way t r a v e l t ime) i n t h e graben. The acoust ic basement i s obscure here, and may be deeper than i n d i c a t e d i n f i g u r e 12. According t o Marlow and Cooper (1980), t h e S t . George bas in conta ins over 30,000 f e e t o f sediment near t h e a x i s o f t h e graben.
The o f f s e t o f s t r a t a across t h e graben f a u l t s increases w i t h depth on t h e downthrown side, i n d i c a t i n g depos i t ion contemporaneous w i t h f a u l t movement. It i s apparent from t h e seismic p r o f i l e ( f i g . 12) t h a t these growth f a u l t s were a c t i v e w e l l i n t o t h e l a t e T e r t i a r y . Away from t h e graben, f a u l t s a r e fewer i n number, smal ler i n magnitude, and genera l l y ceased a c t i v i t y a t an e a r l i e r t ime.
The p r o j e c t i o n o f T e r t i a r y hor izons i n t o the graben ( f i g . 12) i s somewhat uncer ta in because o f t h e l a r g e o f f s e t on t h e border f a u l t . Nevertheless, i t i s apparent t h a t a r e l a t i v e l y h igh p ropor t i on o f Neogene t o Paleogene (and poss ib le I
Upper Cretaceous) sec t ion i s present i n t h e St. George basin, imp ly ing r e l a t i v e l y r a p i d subsidence i n the Neogene. I
Marlow and Cooper (1980) suggest t h a t bas in subsidence may have begun i n I
t h e Late Cretaceous, so t h a t Upper Cretaceous as we l l as lower T e r t i a r y sediments may occur i n the graben. The basal sedimentary sec t i on i n the graben probably !
, has no age equ iva lent i n t h e No. 2 w e l l . Th is has important imp l i ca t i ons f o r i
8 0 - 6 - 0 6 2 SEISMIC PRaFlLE IEV~ISL PP~RIIIII S I I I W E I I C
WPRIIRL PPLRRI I I s l n l n E T l c
8 -55 I t 2 I I C K L I U R l L l E l
REFLECllaY COEFFICIEYIS OErlW BELPY ORIUPI IF11
FIGURE 7. Synthetic seismogram of the St.
e Y.0
Qeorge Basln COST N o. 2 well.
8 8 ,
P O P U P ? ?
4.0 04000 ( C o r r r ~ t l @ n w.I@clly. 4 7 5 0 1tl.r S..plln# rat.. 0 . 0 0 1 .)
INTERVAL VELOCITY ( f T I 6 E C I
S O - 6 - 0 6 2 Seismic P r o f i l e
FIGURE 8. T i m e - s t r a t ig raph ic column and seismic pro f i l e
o f t h e St. George B a s i n C O S T No. 2 Well.
10000 15000 20000
INTERVAL VELOCITY (feet/secondl
FIGURE 9. Interva l velocities and time-depth curve
from t h e sonic log o f the St. George Basin C O S T
No. 2 Well.
-
I I 1
--- COST No. 1 Well
COST No. 2 Well 2 0 0 0 -
-
4 0 0 0 -
-
6 0 0 0 -
h c.
0 - 0 C
V
8 0 0 0 - I- a W D -
1 0 0 0 0 -
-
1 2 0 0 0 -
1 4 0 0 0
0 . 0 1 . o 2 . 0 3 .o 4 .o
T W O - W A Y T I M E l s e c o n d s l
FIGURE 10. Comparison between time-depth curves for the St. George Basin COST No. 1 and No.2 wells.
INTERVAL VELOCITY I f eet/secondl
FIGURE 11. Comparison between interval velocities for the St. George Basin COST No.1 and No.2 wells.
COST Na. 2 Wel l
19 miles west
FIGURE 12. U. S. Geoloqlcal Survey eelsmic line 6.
b o t h t h e source rock and r e s e r v o i r rock p o t e n t i a l o f t h e graben sediments. The area ou ts ide t h e graben was probably s u b a e r i a l l y exposed i n t h e La te Cretaceous and e a r l y T e r t i a r y ; consequent ly, t h e 1 owennost graben sediments may have accumulated i n a r e s t r i c t e d bas in w i t h good p o t e n t i a l f o r o rgan ic p reser - va t i on . Marl ow and Cooper (1980) be1 i eve t h a t coarse c l a s t i c s and te r r i genous d e b r i s may have been shed i n t o t h e graben from the surrounding h igh lands d u r i n g l a t e Mesozoic o r e a r l i e s t T e r t i a r y t ime. I f so, t h e r e s e r v o i r rock p o t e n t i a l i n t h e graben may be b e t t e r than t h a t o f t h e rocks encountered i n t h e No. 2 w e l l . Basement rocks such as t h e Upper Ju rass i c t o Lower Cretaceous sediments encountered i n t h e lower 2100 f e e t o f t h e w e l l may have prov ided a source f o r c l a s t i c debr is . These c l a s t i c s , when exposed t o an a d d i t i o n a l c y c l e o f eros ion, t r anspo r t , and redepos i t ion , may have been winnowed o f f i n e and chemical ly uns tab le m a t e r i a l and thus be more minera l og i ca l l y mature.
PALEONTOLOGY AND BIOSTRATIGRAPHY by
John A. Larson
Paleoecol ogy and b ios t ra t i g raphy f o r t h e S t . George Basin COST No. 2 we1 1 were determined by d e t a i l e d analyses of m i c r o f o s s i l assemblages contained i n samples recovered from t h e we1 1 . These samples inc lude r o t a r y d r i l l b i t c u t t i n g s ( d i t c h samples), s idewal l cores (SWC) , and conventional cores. D i t c h samples were recovered a t 30-foot i n t e r v a l s between the uppermost sample a t 1460 f e e t and t h e lowermost sample a t t h e t o t a l depth o f t he w e l l (14,626 f e e t ) . Numerous s idewal l cores and 17 conventional cores were a l so taken i n t h e w e l l . The m i c r o f o s s i l assemblages examined inc lude Foraminifera, diatoms and s i l i c o - f l agel 1 ates, calcareous nannopl ankton, pol 1 en and spores, and d i nocysts ( d i no- f l a g e l l a t e cys ts ) . Rad io la r ia were very r a r e and o f 1 i ttl e b i o s t r a t i g r a p h i c use. The p r i n c i p a l sources o f data f o r m i c r o f o s s i l i d e n t i f i c a t i o n , abundance, d i s t r i bu t ion , and environmental imp1 i cat ions a re the consul t a n t r e p o r t s prepared f o r t h e COST we1 1 p a r t i c i p a n t s ( B i o s t r a t i g r a p h i c s , 19821, t h e consu l tan t r e p o r t on a nearby s h a l l ow corehole (Anderson, Warren, and Associates, Inc., 1976a), and t h e author 's suppl emental i d e n t i f i c a t i o n o f Foramini fera from s i g n i f i c a n t s t r a t i g r a p h i c i n t e r v a l s . Discrepancies between the b ios t ra t i g raphy o f t h i s r e p o r t and t h e consu l tan t ' s conclus ions may be due t o minor i n t e r p r e t a t i v e d i f f e rences o r to d i f f e rences i n emphasis on the var ious groups o f b i o s t r a t i g r a p h i c i nd i ca to rs . Analys is and eva luat ion o f foramini f e r a l data, i n t e r p r e t a t i o n o f data, and synthesis were done by the author. S i l i ceous m i c r o f o s s i l data were i n t e r p r e t e d by Donald L. Olson.
The b ios t ra t i g raphy o f t he w e l l i s discussed i n the order t h a t s t r a t a were penetrated. Fol 1 owi ng t h e conventional p r a c t i c e f o r b i o s t r a t i graphy i n we1 1 s , t h i s r e p o r t l i s t s h ighes t and lowest f o s s i l occurrences because references t o f i r s t and l a s t occurrences are p o t e n t i a l l y confusing. Samples from cores are g iven somewhat more weight than those from c u t t i n g s because cores can be more p r e c i s e l y l oca ted and a re l e s s sub jec t t o contamination. The No. 2 we l l i s c o r r e l a t e d w i t h the St. George Basin COST No. 1 we1 1 a t the conclus ion o f t h i s repo r t .
B i o s t r a t i g r a p h i c and pal eoenvi ronmental determi nat ions a re based on the e n t i r e micro foss i l and macrofossi l su i tes . The b ios t ra t i g raphy o f t he P l iocene and Miocene p a r t s o f the we1 1 i s based p r i m a r i l y on diatoms. Calcareous nannofossi 1 s and d i nocysts a re most impor tant be1 ow the Miocene. Forami n i f e r a cor robora te the b ios t ra t i g raphy ddveloped from these m i c r o f o s s i l groups. Pal eoenvi ronments r e f e r r e d t o as con t inen ta l (nonmari ne) inc lude f l u v i a1 , I 1 a c u s t r i ne, and pal udal . Transi t i o n a l environments inc lude brack i sh es tua r ies 1 and hypersal i n e and hyposal i n e 1 agoons. For sediments deposited i n marine env i ronmeots, t h e pal eoenvi ronment i s expressed i n terms o f bathymetry. These I
pa l e o b a t h y m t r i c determinat ions are based p r i m a r i l y on evidence from foramini f e r a l i populat ions, b u t d i n o f l agel l a t e s , c a l careous nannofossi l s, molluscs, echinoderms, and o the r marine organisms are used as we l l . The d i v i s i o n s o f t h e marine environment inc lude inne r n e r i t i c ( 0 t o 60 f e e t ) , middle n e r i t i c (60 t o 300 I
I f e e t ) , ou ter n e r i t i c (300 t o 600 f e e t ) , upper bathyal (600 t o 1500 f e e t ) , middle I bathyal (1500 t o 3000 f e e t ) , and lower bathyal (3000 t o 6000 f e e t ) . Abundances
I I
o f m i c r o f o s s i l s, where expressed, a r e given i n t e n s o f numbers o f specimens per sample: i n f requen t o r very ra re , 1 per sample; ra re , 2 t o 10 per sample; frequent, 11 t o 32 pe r sample; common, 33 t o 100 pe r sample; abundant, 101 t o 320 per sample; and very abundant, g reater than 320 per sample. Paleo- c l ima to log ica l i n t e r p r e t a t i o n s are based on diatom assemblages and on pol l e n and. spore assembl ages.
PLIOCENE-PLEISTOCENE
Grab samples and shal low corehole samples taken near the No. 1 we1 1 i n d i c a t e t h a t beneath a t h i n veneer o f Holocene sediments, t h e upper several hundred f e e t o f sec t ion i n the No. 2 wel l i s probably Ple is tocene i n age. No paleonto logy samples were recovered above 1450 f e e t i n the No. 2 we1 1, and the re i s no in format ion a v a i l able f o r f u r t h e r d e f i n i t i o n o f t he Ple is tocene sect ion. The i n t e r v a l from j u s t be1 ow sea f l o o r (452 f e e t ) t o 1450 f e e t i s t he re fo re assigned a P I iocene-Pl e i stocene age. Deposi t ional environments f o r t h i s i n t e r v a l a re undetermined .
PLIOCENE
The Pl iocene sec t idn (1460 t o 4246 f e e t ) i s de f ined p r i n c i p a l l y on t h e bas is o f diatom d i s t r i b u t i o n s . Even though e a r l y and l a t e Pl iocene zones can be recognized, the re are numerous instances o f broken and reworked Miocene diatoms as we1 1 . P y r o l y s i s data and v i t r i n i t e r e f 1 ectance data a1 so i n d i c a t e poss ib le reworking o f sediments i n t h e Pl iocene sect ion.
The i n t e r v a l f r a n 1460 t o 2980 f e e t i s considered t o be probable l a t e Pl iocene i n age (Dent icu lops is seminae var. f o s s i l i s Zone). Two o f t he species used to de f ine t h i s zone, Tha lass ios i ra ant iqua (20g0 f e e t ) and Stephanopyxis ho r r i dus (1640 f e e t ) , a1 ong w i t h Cosci n o ~ p u s t u l atus (1 640 f e e t ) range h i g h i n the i n t e r v a l . Other key species present i nc lude Act inocyclus oculatus, Cosci nodi scus s t e l 1 a r i s, Dent icu l opsi s semi nae, Den t i cu l opsi s semi nae var. - f o s s i l i s , Rhizosolenia a la ta , and Thalassios i r a gravida. The upper p a r t of t h i s i n t e r v a l , from 1 4 6 0 1 6 4 0 fee t , l acks d i s t i n c t i v e marker diatoms and may be i n p a r t Ple is tocene i n age. However, t h e canplete lack o f d i s t i n c t i v e Ple is tocene diatoms such as Rhizdsol enia c u r v i r o s t r i s prompts t h e i n c l us ion o f t h e upper p a r t o f t h i s sec t ion i n the l a t e Pl iocene.
Possib le e a r l y 1 a t e Pl iocene s t r a t a o f t h e Dent icu l ops i s kamtschatica- Dent icu lops is seminae var. f o s s i l i s Zone occur from 2720 t o 2980 f e e t . The zone i s d e f i n e T 3 j i T F e over lap o t t h e ranges o f t he two above-named species. Re1 a t i v e l y f requent numbers o f Dent icu l opsi s kamtschati ca range upward t o 2720 feet , wh i l e Dent icu lops is seminae var. f o s s i l i s disappears be1 ow 2980 fee t .
The sec t ion from 2980 t o 4246 f e e t i s considered t o be e a r l y Pl iocene i n age, i n t h e upper p a r t o f t h e Dent icu lops is kamtschatica Zone ( t h a t i s , t h e Dent icu lops is kamtschatica "b" and "c" Subzones). Key species i nc lude C l adogramma c a l i forn ica , Coscinodi scus robustus, and the s i l i c o f l age1 1 a t e D i stephanus bo l i v i ensi s.
The- i n t e r v a l from 2980 t o 3620 f e e t i s considered t o be poss ib le l a t e e a r l y P l iocene, o r i n t h e Dent icu lopsi s kamtschatica "c" Subzone. The uppermost occurrence o f Cosmiodiscus i n s i g n i s , which i s used t o de f ine the base o f t h i s zone, i s a t 3620 feet . Other species i n t h e i n t e r v a l i nc lude Cosmiodiscus in te rsec tus , Coscinodiscus symbalophorus, and Tha lass ios i ra punctata.
The i n t e r v a l from 3620 t o 4246 f e e t may be w i t h i n t h e e a r l y Pl iocene Dent icu lops is kamtschatica "b" Subzone. Pl iocene species such as Stephanopyxis dimorpha are present i n t h e 1 owermost samples o f t h e i n t e r v a l . 01 der species which woul d i n d i c a t e the 1 a t e s t Miocene Dent icu l o ~ s i s kamtschatica "a" Subzone. such as Rouxia c a l i f o r n i c a and N i t zsch ia r e i n h o l d i i , were n o t detected. A s i q n i f i c ~ c r e a s e i n diatom and s i l i c o f l aqel l a t e D O D U ~ a t i ons occurs a t t he ba ie o f t h i s i n t e r v a l . No s i l iceous m i c r o f o i s i l s were' detected i n the s idewal l core a t 4246 fee t .
Foramini fera ~ r e s e n t from 1460 t o 2980 f e e t ( l a t e P l iocene) i nc lude Buccel l a f r i g i d a , Buccel l a tenerrima, Cassidul i n a c a l i f o r n i c a , Cassidul i n a t e r e t i s , Denta l ina sp., t l ph id ium b a r t l e t t i , E l phidium clavatum, Glandul i n a l a e v i g a t a , Non ione l la 1 abradorica, Pro toe l p h i d i Z K F E Z 3 are, Uv iqer ina juncea, and - - V i r g u l i n e l l a pertussa.
The foramini fera1 assemblage from 2980 t o 3110 f e e t (poss ib le l a t e e a r l y t o e a r l y l a t e Pl iocene) i s very sparse. The species present i nc lude Bucce l la tenerr ima , Cassi dul i na c a l i fo rn i ca , G l andul i na 1 aevigata, Me1 on i s pompi 1 i o i des , T r i f a r i n a angulosa, and Uv iger ina juncea.
I n the remainder o f t he e a r l y Pl iocene p a r t o f t he sec t ion (3110 t o 4246 f e e t ) , Forami n i f e ra a r e very sparse t o absent. Those species present ( i n c l ud i ng Epi stomi nel 1 a bradyana, Cassi dul i na c a l i forn i ca , and T r i f a r i na angul osa) a r e very rare.
D i nocysts present from 1460 t o 2180 f e e t i nc lude Lejeunia spp., Opercul od i nium sp., and Tectatodinium pe l l i t um. Reworked Cretaceous and Jurass ic forms a re a1 so present. brom 2180 t o 3928 feet, t h e d inocys t assemblage inc ludes Le jeun ia sp., Lejeunia sp. PC, and ?Operculodinium sp. 2, which i s considered by t h e consu l tan ts t o i n d i c a t e a-P l iocene age. The d inocys t assemblage i s s i m i l a r , b u t somewhat l e s s abundant, from 3928 t o 4246 fee t . Lejeunia paratenel l a i s present a t 3928 f e e t (SWC) and be1 ow.
The po l l en and spore assemblage i n t h e Pl iocene sec t ion inc ludes A1 nip01 1 en i t e s sp., sparse T i 1 i aepol 1 e n i t e s sp. , Tsugaepol 1 en i t e s sp., Betu l aceae, sporadic Composi tae, sparse, scat te red t r icaceae, Laevi gatospor i t es sp. , Lycopodi umspori t e s sp. , and Sphagnumspori t e s sp. Onagraceae a re present be1 ow 2 4 5 0 R u g a e p o l l i s t r a g i l l i s , a species described from t h e Miocene- P l iocene sec t ion o f southern Alaska (Hedl und and Engel h a r d t , 1970). i s present from 2180 t o 2270 fee t . Below 3928 fee t , ~ r i c a c e a e - a r e more cons is ten t l y represented, Onagraceae l e s s so, and sca t te red Composi t ae and Ma1 vaceae a r e present i n some s idewal l cores. Juglanspol l e n i t es sp. i s a1 so present i n s idewal l cores be1 ow 3928 f e e t .
The P l iocene i n t e r v a l contained no c a l careous nannofossi l s.
Envi ronment
Forami ni fera present in the Pl iocene section i ndicate that deposi tional environments were probably outer neritic between 1460 and 2900 feet . Between 2900 and 31 10 feet , the environment was outer neri t i c t o upper bathyal . A1 t hough Foraminifera are quite sparse between 3110 and 4246 feet , consistent occurrences of dinocysts and diatoms indicate marine (neri t i c ? ) conditions.
The pollen and spore assemblage indicates temperate conditions for the Pl iocene. Sl i ghtly warmer temperate conditions may be indicated be1 ow 3928 feet. Plots of abundance-weighted percentages of warm-water versus col d-water diatoms indicate generally warm (temperate) conditions with sporadic, brief cool i ng intervals, and a gradual, s l ight cooling trend from early through l a t e Pliocene.
MIOCENE
The interval from 4246 to 6050 feet i s considered to be Miocene in age. Age determinations are derived primarily from diatom da t a . Calcareous nanno- fossil d a t a are used to determine the base of the early Miocene.
Sil iceous microfossil assembl ages over the interval from 4246 (SWC) t o 4441 feet (SWC) are very poorly preserved and nondiagnostic. This section contains no definitive Pliocene species and i s here termed Miocene undifferenti- ated. This interval may reflect a low depositional rate or erosion during the 1 ate Miocene.
The interval from 4441 (SWC) t o 5240 feet i s tentatively assigned to the middle Miocene. Diatoms present include Melosira aff . M. sulcata, poorly
P preserved Stephanopyxi s spp., Stephanopyxi s spi nosi ssimx, a n d p h a n o p y x i s superba. Poorly preserved Stephanopyxi s grunowi i occur-el ow ?I90 feet. m a g n o s t i c forms are not present.
The interval from 5240 to 6050 feet i s considered to be early Miocene on the basis of poorly preserved specimens of Actinoptychus heliopelta (Abbott, 1978; Andrews, 1978) between 5240 and 5690 feet. The lower part of the interval i s characterized by abundant Stephanopyxis tu r r i s var. intermedia. Other species present include Acti noptychus perisetosus, Melosi ra aff. M. sulcata, Stephanopyxis grunowi i , Stephanopyxis cf .rbsuperba, t ic tod~scus - ki ttoni anus.
Calcareous nannofossils are not present above 5600 feet in the well. The calcareous nannofossils present from 5600 to 5690 feet support a probable early Miocene age. These include Dictyococci tes m i nutus, ~ e t i c u l ofenestra dictyoda ,- and S~henol i thus mori f o r m i s . T h e s e s indicate this interval i s ~ a r t of the ~riquetorhabdul us cari natus zone,' probably the Cycl icargol i t h i s abi sectus Subzone. The base of the early Miocene i s placed a t the highest occurrence of 01 igocene cal careous nannofossil s a t 6050 feet .
Dinocyst assemblages i n the Miocene section are sparse and nondiagnostic from 4246 to 4441 feet. A sparse dinocyst assemblage present from 4441 to 5240 feet i s similar to t h a t seen above in the early Pliocene. The sparse dinocyst population between 5240 and 6050 feet i s a1 so similar, except that Operculodinium sp. i s no longer present.
The Miocene p o l l e n and spore assemblage i s s i rn i l a r t o t h a t o f the e a r l y P l i ocene , a1 though Onagraceae are sparse be1 ow 5240 f e e t . J ugl anspol 1 en i t e s sp. and Ericaceae are more cons is ten t l y present i n s idewal l cores i n the Miocene sec t ion than i n the Pliocene.
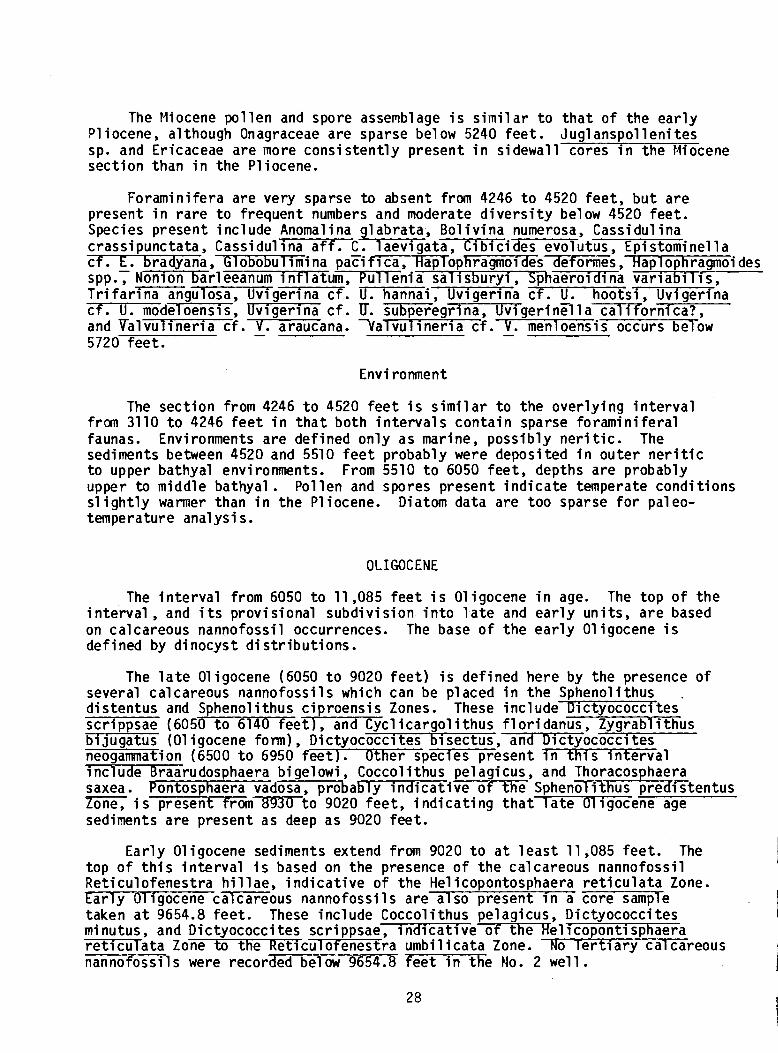
Foramini fera are very sparse to absent from 4246 t o 4520 f e e t , b u t a re present i n r a r e t o f requent numbers and moderate d i v e r s i t y below 4520 fee t . Species present inc lude Anomal i n a g l abrata, Bol i v i n a numerosa, Cassidul i n a c r a s s i ~ u n c t a t a . Cassidul i n a a f f . C. 1 aeviaata. C i b i c i des evolutus. ED^ stominel l a
# . . c f . - t . bradyana, Globobul i m i na paFi f i ca, Hap1 ophragmoi des deformes, Haplophragmoi des spp. , Nonion bar1 eeanum i n f l atum, P u l l en ia sa l i sbury i , Sphaeroi d i na v a r i a b i 1 i s , T r i f a r i n a angulosa, Uvi g e r i na c f . U. hannai , Uvi g e r i na c f . U. hoo ts i , Uvi g e r i na c f . U. model oensi s , U v i g e r i na c f . U. subperegr i na, Uvi g e r i n a 1 a-EZITorni ca? , and V a l v u l i n e r i a c f . - V. araucana. -a-f. - V. menloensis occurs below 5720 fee t .
Envi ronrnent
The sec t ion from 4246 t o 4520 f e e t i s s i m i l a r t o t h e o v e r l y i n g i n t e r v a l from 3110 t o 4246 f e e t i n t h a t bo th i n t e r v a l s con ta in sparse fo ramin i fe ra1 faunas. Environments are def ined on ly as marine, poss ib l y n e r i t i c . The sediments between 4520 and 5510 f e e t probably were deposited i n ou te r n e r i t i c t o upper bathyal environments. From 5510 t o 6050 fee t , depths are probably upper to middle bathyal . Pol len and spores present i n d i c a t e temperate cond i t i ons s l i g h t l y warmer than i n t h e Pliocene. Diatom data are too sparse f o r paleo- temperature analys i s.
OLIGOCENE
The i n t e r v a l from 6050 t o 11,085 f e e t i s Oligocene i n age. The top o f t h e i n t e r v a l , and i t s p rov is iona l subd iv i s ion i n t o l a t e and e a r l y u n i t s , a r e based on calcareous nannofossil occurrences. The base o f t h e e a r l y Oligocene i s def ined by d inocys t d i s t r i b u t i o n s .
The l a t e Oligocene (6050 t o 9020 f e e t ) i s def ined here by t h e presence of several calcareous nannofossi l s which can be placed i n t h e Sphenol i thus . d i s tentus and Sphenol i thus c ip roens i s Zones. These i n c l ude Dictyococci t e s scr ippsae ( 6 0 5 ~ f ; o ~ c l i c a r g o l i thus f l o r i danus, Zygrabl i thus b i jugatus (01 igocene form), D i c t y o c m tes b isectus, and Dictyococci t e s neogammation (6500 t o 6950 feet). Other species present i n t h i s i n t e r v a l i n c l ude Braarudosphaera b i gel owi , Coccol i thus pel agicus , and Thoracosphaera saxea . P o n t o s p h a e r a d p r o b a b l y i n d i c a t i v e Sphenol i thus p red i s tentus Zone, i s present f r o m T B 3 T t o 9020 fee t , i n d i c a t i n g t h a t l a t e 01 igocene age sediments a re present as deep as 9020 fee t .
Ea r l y Oligocene sediments extend from 9020 t o a t l e a s t 11,085 feet. The top o f t h i s i n t e r v a l i s based on t h e presence of t h e calcareous nannofossi l Ret icu lo fenest ra h i l l a e , i n d i c a t i v e o f t he Helicopontosphaera r e t i c u l a t a Zone. t a r l y Oligocene calcareous nannofossi ls are a l so present i n a core sample taken a t 9654.8 fee t . These inc lude Coccol i thus pel agicus, Dictyococci t e s m i nutus, and Dictyococci t es s c r i ppsae, i n ~ e ~ e l h p o n t i sphaera r e t i c u r a t a Zone to the Ret icu lo fenest ra umb i l i ca ta Zone. 70 T e r t i a r y calcareous nannofossi ls were recorded be1 ow 9654.8 f e e t i n t h e No. 2 we l l .
The po l len , spore, and d inocys t assemblages present i n the upper p a r t (6050 t o 6860 f e e t ) o f t he l a t e Oligocene sec t ion are s i m i l a r t o t h e assemblage present i n t h e e a r l y Pl iocene and t h e Miocene sect ions. From 6860 t o 9020 f e e t , a inore recognizable 01 igocene ( t o Miocene) palynol og ica l assembl age i s present. The d inocys t assemblage i s r a t h e r poor l y developed, b u t conta ins Lejeunia spp. and S p i n i f e r i t e s sp. Also present i s a species o f Cannosphaeropsis, a Cretaceous t o Eocene genus, which according t o the consu l tan ts commonly ranges up i n t o t h e mid-Ter t ia ry i n t h e Ber ing Sea area. The po l l en assemblage i s charac ter ized by cons is ten t occurrences o f Jug1 anspol l en i t e s and by sporadic occurrences o f Pterocaryapol l en i t es sp. , T i 1 i a e p o l l en i tes sp., Ericaceae, and Ma1 vaceae.
The d inocys t assemblage below 9020 f e e t inc ludes species t h a t have been i n t e r p r e t e d t o denote Oligocene age s t r a t a i n t h e Ber ing Sea area. These i n d i c a t e t h a t e a r l y Oligocene sediments extend t o a t l e a s t 11,085 fee t . The assembl age i s character ized by Para1 e c a n i e l l a indentata, which i s present from 9267.7 f e e t ( co re sample) downward. Other species present inc lude Cannosphaeropsis sp., Heteraulacysta sp., and Tuberculodinium vancampoae. D i nocyst d i ve rs i ' t y drops appreciably i n s idewal l cores be1 ow 11,085 f e e t . The po l l en assemblage from 9020 t o 9267.7 f e e t (core) i s s i m i l a r t o t h a t o f t h e l a t e Oligocene i n t e r v a l from 6860 t o 9020 f e e t . Below 9267.7 fee t , t h e r e i s a more cons is tent populat ion o f T i l i a e p o l l e n i t e s sp., wh i l e Momipites sp., Faguspol l e n i t es sp., L i q u i dambarpol l e n i t e s sp., and Ulmipol l e n i t e s are s p o r a d i c a l l y p r e s e n t . - A u t i o n o f Juglanspol l e n i t es sp. cont inues throughout the Oligocene.
Diatom d i s t r i b u t i o n i s sporadic i n the 01 igocene sect ion, and f requencies a r e very r a r e t o rare . The occurrence o f stephanopyxis marginata a t 6673 f e e t (SWC) supports a l a t e Oligocene age f o r t he upper p a r t o f t he sect ion. Other diatom species present i nc l ude Coscinodi scus marginatus, Stephanopyxi s grunowi i , Stephanopyxis t u r r i s var. i ntermedia, and Melosi r a a f f . M. su l cata. The diatom popu la t ion b e c ~ n c r e a s i ng ly sparse downward, and no aiatoms were recovered below 7035 fee t .
Forami n i f e r a present i n the 6050- t o 9020-foot i n t e r v a l support an 01 i gocene age, al though some o f t he species a l so range i n t o t h e Miocene. An Oligocene ( t o e a r l y Miocene) age i s i nd i ca ted by the presence o f Pseudoglandul i n a i n f l a t a (6650 t o 6680 and 7910 t o 7940 f e e t ) and Porosoro ta l ia c f . P. c l a r k i (/I- 7730 and 8540 t o 8600 f e e t ) . Other species present i n the T n t ~ i n c l u d e Anomal i na g l abrata, Bol i v i n a c f . B . numerosa, Cassidul i na c rass i punctata, Cassi dul i na c f . C. 1 aevi gata, ElpEi d e l l a c f . E. s i b i r i ca, Epi stomi n e l l a c f . - E. bradyana , G l obob i l i m i na paci f ica , Hapl ophragmzi des spp . , Hapl ophragmoi des ob l i qui roc- m a r l e e a n u r n , T r i f a r i na angulosa, Uvi g e r i na c f . - 'II. hannai , U v i g e r m . - U. F o o t s i , and Uv iger ina c f . - U. modeloensis.
An 01 igocene age i s a l so supported by the Foramini fera present from 9020 t o 11,085 fee t , a1 though some o f t he species may have ranges extending as h i g h as t h e e a r l y Miocene. The fo ramin i fe ra1 assemblage i s s i m i l a r t o t h a t o f t h e l a t e 01 igocene sec t ion j u s t above, except t h a t Epi stomi n e l l a c f . E. bradyana and Noni on c f . N. bar1 eeanum a re absent. D i s t i n c t i ve species pr'esent i nc lude R o t a l i a c f .A. beccar i i , o c c u r r i ng a t 941 7 f e e t (SWC) and from 9590 f e e t w d . PoFosorotal i a c f . P. c l a r k i from 91 10 t o 10,060 f e e t . and Gaudryina
alazanensis from 10,480 t o 10,540 f e e t . Add i t iona l species present i nc lude Buccel la c f . B. oregonense, Cribrononion spp., Denta l ina spp., E l p h i d i e l l a c f . t . s i b i r i c a , El ph i dium spp., Haplophragmoides becki , and Haplophragmoides ae f ormes .
Environment
The i n t e r p r e t a t i o n o f Oligocene depos i t iona l environments i s based p r i m a r i l y on the d i v e r s i t y and abundance o f forami n i f e r a l assemblages. The uppermost p a r t o f t h e sec t ion (6050 t o 6110 f e e t ) i s i n t e r p r e t e d t o represent depos i t ion a t upper to middle bathyal depths. Ind ica ted environments are shal lower from 6110 t o 7725 fee t , where outer n e r i t i c t o upper bathyal cond i t i ons were present. Deposi t i o n a l envi ronments were upper t o middle bathyal between 7725 and 8570 fee t . Outer n e r i t i c t o upper bathyal cond i t i ons p reva i l ed i n t h e 8570- t o 9350-foot i n t e r v a l , w i t h undi f f e r e n t i ated n e r i t i c cond i t ions present from 9350 t o 9417 feet . Faunas present from 9417 t o 9980 f e e t i n d i c a t e i nne r t o middle n e r i t i c condi t ions. Outer n e r i t i c assemblages a re present from 9980 t o 10,150 fee t , and inne r t o middle n e r i t i c cond i t i ons from 10,150 t o 10,450 fee t . Outer n e r i t i c cond i t ions are present from 10,450 t o 10,720 fee t .
Foramini fera are r a r e from 10,720 t o 11,085 fee t , b u t d inocysts are present. A poss ib le t r a n s i t i o n a l t o i nne r n e r i t i c environment i s i n d i c a t e d f o r t h i s i n t e r v a l .
The p o l l e n and spore assemblages present suggest temperate t o warm-temperate c l imates d u r i ng t h e 01 igocene.
OLIGOCENE OR OLDER (POSSIBLE EOCENE)
01 igocene o r o l d e r (poss ib le Eocene) sediments are present i n the i n t e r v a l from 11,085 t o 12,540 f e e t . M ic ro foss i l s w i t h i n the i n t e r v a l a re sparse. The base o f t h e i n t e r v a l i s determined from t h e f i r s t occurrences o f Mesozoic calcareous nannofossi l s and from li tho1 ogic evidence. Th is i n t e r v a l may be c o r r e l a t i v e w i t h t h e Eocene s t r a t a occu r r i ng from 8410 t o 10,380 f e e t i n t h e St. George Basin COST No. 1 we1 1 .
The top o f the Oligocene o r o lde r sec t ion i s based on the abrupt decrease i n d inocyst d i v e r s i t y below 11,085 fee t . Sporadic r a r e t o yery r a r e S p i n i f e r i t e s spp., Spi n i f e r i t e s c r a s s i p e l l i s , Opercul od i nium centrocarpum, Para lecan ie l l a indenteta, and Nematosphaeropsis sp. occur below t h i s l e v e l , b u t they are no t present i n s idewal l cores be1 ow 11,680 f e e t .
T e r r e s t r i a l l y der ived palynomorphs are r a r e t o very r a r e and are spo rad ica l l y d i s t r i b u t e d . I r r e g u l a r occurrences o f Juglanspol l e n i t e s sp. span the e n t i r e i n t e r v a l . Momi p i t e s sp. occurs on ly a t 12,535 f e e t ( S K I , and T i 1 i a e p o l l en i t e s sp. occurs o n l y from 12,300 t o 12,390 fee t .
Foramini fera are a l so r a r e t o absent i n t h i s art o f t h e sect ion. S ~ e c i e s present i nc lude Haplophragrnoi des spp., ~ a ~ l o ~ h r a g m o i d e s becki , Rota1 i a cf: - R. becca r i i , and G l obobul i m i na paci f i c a . borami n i f e r a a re - t i a n y s e n t be1 ow 1 T,350 fee t .
Environment
The deposi t ional environment from 11,085 t o 11,350 f e e t i s t r a n s i t i o n a l t o i nne r n e r i t i c based on the presence o f very sparse, low d i v e r s i t y fo ramin i fe ra1 faunas and re1 a t i v e l y 1 ow d i v e r s i t y d i nocyst assembl ages. Cont inenta l t o t r a n s i t i o n a l condi t i o n s predominate from 11,350 t o 12,000 fee t , where Forarni n i f e ra are essent i a1 l y absent, bu t sparse d i nocyst assembl ages are present. From 12,000 t o 12,540 f e e t , on l y r a r e po l l en and spores are present, i n d i c a t i n g poss ib le cont inenta l condi t ions.
The p o l l e n and spore evidence suggests temperate t o wan-temperate cond i t ions . This i s no t i ncons is ten t w i t h paleobotanical evidence presented by Wolfe (1977) and Wolfe and Poore (1982) i n d i c a t i n g t h a t t h e Eocene c l ima te o f t h e Gul f o f Alaska reg ion t o the southeast appears t o have been temperate ( l a t e Eocene) to warm-temperate (middle Eocene).
EARLY CRETACEOUS TO LATE JURASSIC
E a r l y Cretaceous to Late Jurassic age s t r a t a are present from 12,540 t o 13,370 feet . The top o f t h i s i n t e r v a l i s placed a t a l i t h o l o g i c change character ized by gray-brown s i l t s tone and coal fragments. Age i n t e r p r e t a t i o n s are based on t h e d i s t i n c t i v e palynomorph assembl age and on calcareous nannofossi l s.
Ea r l y Cretaceous t o Late Jurass ic age palynomorphs present i nc lude Deltoidospora sp., Osmundacidites sp., Lycopodiumsporites sp., Concavispori tes j u r i e n s i s , Rogal ska i spor i t e s c i ca t r i cosus , N e o r a i s t r i c k i a t runcata, and ?Taurocuspori t e s segmentatus. ?lo indigenous d i nocysts were recorded i n t h i s i n t e r v a l .
Poor ly preserved fragments o f t h e calcareous nannofossi l Watznaueria? sp. a t 12,608 f e e t (SWC) support a Mesozoic, probably Cretaceous t o Jurass ic , age f o r the i n t e r v a l .
Indigenous Foramin i fe ra were n o t recovered from t h i s p a r t o f t he sect ion.
Envi ronment
The absence o f Foramini fera and d i nocysts suggests poss ib le cont inenta l ' cond i t i ons from 12,540 t o 13,110 fee t . The presence o f t h e calcareous nannofossi l Uatznaueria? sp. a t 12,608 f e e t , however, i n d i c a t e s poss ib le i n t e r m i t t e n t t r a n s i t i o n a l t o n e r i t i c condi t ions. Be1 ow t h i s depth, r a r e t o f requent she1 1' fragments (presumably marine) suggest a t r a n s i t i o n a l t o poss ib le i nne r n e r i t i c environment from 13,110 t o 13,370 f e e t .
LATE JURASSIC
Late Jurassic age sediments are present from 13,370 t o 14,626 f e e t (TD). The d i n o f l age1 l a t e S i rmiodi nium gross i , i n d i c a t i v e o f a Late Jurass ic t o Ear l y Cretaceous age, i s present trom 13,370 f e e t (SWC) t o TD. More s t r o n g l y i n d i c a t i v e
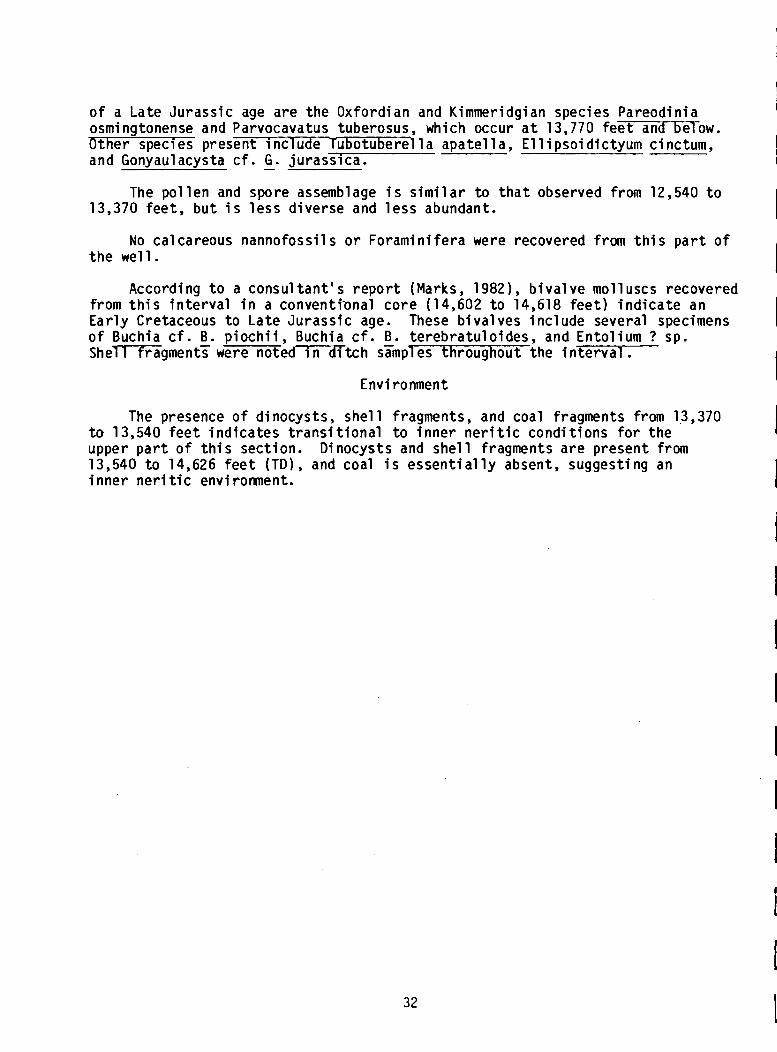
o f a Late Jurass ic aae are the Oxford ian and Kimmeridaian s ~ e c i e s Pareodinia osmi ngtonense and ~a rvocava tus tuberosus, which occur-at 13; 770 fee t and be1 ow. Other species present i nc lude Tubotuberel l a apate l l a , E l 1 ipso id ic tyum cinctum. and ~ o n y a u l acysta c f . G . ju rass ica .
- -
The p o l l e n and spore assemblage i s s i m i l a r t o t h a t observed from 12,540 t o 13,370 fee t , b u t i s l e s s d iverse and l e s s abundant.
No calcareous nannofossi ls o r Foramini fera were recovered from t h i s p a r t o f t h e we1 1 .
According t o a consul t a n t ' s r e p o r t (Marks, 19821, b i v a l ve mo l l uscs recovered from t h i s i n t e r v a l i n a conventi'onal co re (14,602 t o 14,618 f e e t ) i n d i c a t e an Ear l y Cretaceous t o Late Jurass ic age. These b iva lves i n c l ode several specimens o f Buchia c f . B. p i o c h i i , Buchia c f . B. te rebra tu lo ides , and Ento l ium ? sp. ~ h e m g m e n t ? were n o t e d m t c h szmpl es throughout the i n t e r v a l .
Envi ronment
The presence o f d inocysts, s h e l l fragments, and coal fragments from 13,370 t o 13,540 f e e t i nd i ca tes t r a n s i t i o n a l t o i n n e r n e r i t i c cond i t ions f o r t h e upper p a r t o f t h i s sect ion. Dinocysts and s h e l l fragments a r e present from 13,540 t o 14,626 f e e t (TD) , and coal i s essent i a1 l y absent, suggest ing an i n n e r n e r i t i c envi romen t .
CORRELATION
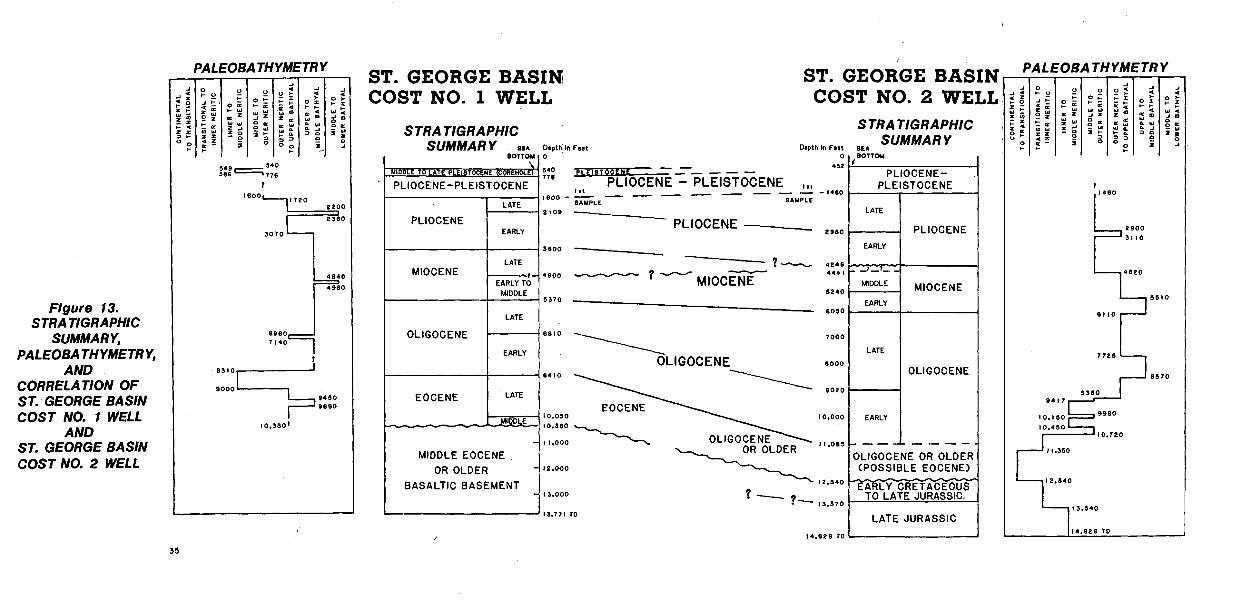
The s t r a t a i n the upper p a r t of t he No. 1 and No. 2 we l l s can be c o r r e l a t e d b i o s t r a t i g r a p h i c a l l y ( f i g . 13). S t ra ta represent ing t ime-equival e n t u n i t s (epochs) are of roughly equal th ickness i n t h e two we l l s w i t h the except ion o f t h e Oligocene, which i s considerably t h i c k e r i n the No. 2 w e l l , and the u n d i f f e r e n t i a t e d Pl iocene-Pleistocene sect ion, which a l so may be t h i c k e r i n t h e No. 2 we l l . I n general, deposi t ional env i romen ts appear to have been somewhat deeper i n t h e No. 1 we1 1 .
Late Mesozoic age sediments i n the 1 ower p a r t o f t h e 140. 2 we1 1 are matched by a t h i c k sequence o f b a s a l t i c rocks o f uncer ta in age i n t h e No. 1 we l l .
Hol ocene
A shal low corehole near t h e No. 1 wel l penetrated 9 f e e t o f Holocene sediments be fo re encountering mater ia l o f Ple is tocene age. Comparable i n fo rma t ion i s n o t a v a i l ab le f o r t he No. 2 wel l , b u t i t i s probable t h a t Holocene sediments a l so form a s i m i l a r veneer i n t h a t area.
Ple is tocene
The s h a l l ow corehol e near the No. 1 we1 1 penetrated 1 a te and middle Ple is tocene age sediments between 9 and 236 fee t . Paleodepths were i nne r t o middle n e r i t i c i n the l a t e s t Pleistocene, deepening t o middle to outer n e r i t i c below 46 fee t . Paleocl imates were cool , w i t h a s l i g h t warming t rend between 46 and 116 f e e t and between 195 and 217 fee t . No Ple is tocene age samples were a v a i l a b l e from t h e No. 2 we l l .
P I iocene-PI e i stocene
The base o f t h e Pleistocene i n each o f t h e we1 1 s i s an undetermined d is tance above the f i r s t samples a t 1600 f e e t i n the No. 1 we1 1 and a t 1460 f e e t i n the No. 2 we1 1 ( f i g . 13). The sec t ion above the uppermost samples i s t h e r e f o r e r e f e r r e d t o as P l iocene-Pl e i stocene.
P l i ocene
The f i r s t samples recovered i n each o f t h e we1 1 s are o f probable 1 a t e Pl iocene age. Pl iocene sediments a re present from 1600 t o 3600 f e e t i n the No. 1 wel l and from 1460 t o 4246 f e e t i n t h e No. 2 wel l . The sec t i on can be p rov i s iona l l y subdivided i n t o l a t e and e a r l y Pl iocene i n t e r v a l s a t 2109 f e e t i n t h e No. 1 we1 1 and a t 2980 f e e t i n t h e No. 2 we1 1 .
The Pl iocene pal eoenvi romnent i s general l y middle t o outer n e r i t i c i n t h e No. 2 we1 1 . The pal eodepths f o r t he same i n t e r v a l i n t h e No. 1 we1 1 a r e outer n e r i t i c to bathyal . A b r i e f deepening t r e n d a t t he top o f the e a r l y Pl iocene i s present i n both wel ls . The ind i ca ted paleocl imate i n bo th we l l s i s temperate, w i t h b r i e f coo l ing i n t e r v a l s. Pol l e n evidence suggests w a n e r temperate cond i t i ons i n the e a r l i e s t p a r t o f t h e Pl iocene i n both we l ls , and diatom data from t h e No. 2 we1 1 suggest gradual coo l ing throughout the Pliocene. S l i g h t l y h igher percentages o f warmer water diatoms are present throughout the Pl iocene i n the No. 1 w e l l .
Miocene
Miocene sediments a r e present from 3600 t o 5370 f e e t i n the No. 1 well and from 4246 t o 6050 f e e t i n the No. 2 we1 1 . Figure 13 shows a t en ta t ive zonation of t he Miocene. Late Miocene age sediments a r e present t o a depth of 4600 f e e t i n the No. 1 we1 1 , b u t they a r e missing o r a r e 1 i m i ted t o a 195-foot- thick undif ferent ia ted in terval between 4246 and 4441 f e e t i n the No. 2 well. T h i s suggests an unconfonabl e surface o r nondeposi t ional interval i n the 1 a t e Miocene a t the No. 2 well location. The abrupt disappearance of s i l i ceous microfossi ls below the base of the l a t e Miocene i n the No. 1 well may a l so represent an unconformity o r hiatus. Middle Miocene s t r a t a a r e present from 4441 to 5240 f e e t and ear ly Miocene from 5240 t o 6050 f e e t i n the No. 2 well . In the No. 1 well , ear ly t o middle Miocene age sediments extend from 4600 t o 5370 f e e t .
Marine paleodepths were n e r i t i c to upper and middle bathyal i n the No. 2 we1 1 , and middle and 1 ower bathyal i n t h e No. 1 we1 1 . Pal eocl imates were temperate, possibly sl ightl y warmer than i n the P l iocene.
01 igocene
01 igocene age s t r a t a comprise the th ickes t kec t ion i n the two wells , amounting t o m r e than a t h i r d of the sediments i n each. T h i s in terval extends from 5370 t o 8410 f e e t (3040 f e e t of sect ion) i n the No. 1 wel l , and from 6050 t o 11,085 f e e t (5035 f e e t of sect ion) i n t h e No. 2 well. The boundary between the ea r ly and l a t e 01 igocene is placed a t 6810 f e e t i n the No. 1 and a t 9020 f e e t i n the No. 2 well. The l a t e 01 igocene in terval is appreciably th icker than the ear ly 01 igocene i n the No. 2 we1 1 .
Paleoenvironrnental t rends fo r t h i s in terval a r e s imi la r i n both wel ls , each being deepest i n the l a t e Oligocene and shallowest a t the base of the ear ly Oligocene. Paleoenvironments range from upper and middle bathyal t o t r ans i t iona l and inner neri t i c i n the No. 2 we1 1 . They a r e sl ight l y deeper i n the No. 1 we1 1 , ranging from upper and middle bathyal t o inner and middle neri t i c . Conglomeratic sands between 7720 and 7870 f e e t i n the No. 1 well may represent e i t h e r shel f - edge s l ump deposits o r high-energy , shal l ow-water deposi ts o r an unconformi t y . Pollen and spore assemblages suggest temperate to warm-temperate conditions fo r the 01 igocene i n both we1 1s.
Eocene
Eocene age sediments a r e present from 8410 t o 10,380 f e e t i n the No. 1 wel l , w i t h l a t e Eocene age sediments from 8410 t o 10,050 f e e t , and middle Eocene sediments from 10,050 t o 10,380 fee t . A d e f i n i t e age could not be I assigned to the apparently equivalent in terval i n the No. 2 we1 1 (11,085 t o 12,540 f e e t ) because the continental t o t r ans i t iona l environments the re yielded I l i t t l e i n the way of age-diagnostic microfossi ls . T h i s interval i n the No. 2 well i s re fe r red t o a s 01 igocene o r 01 der.
I
Flgure 13. STRATIGRAPHIC
SUMMARY, PA LEOBA TH YMETR Y,
AND CORRELATION OF ST. GEORGE BASIN COST NO. 1 WELL
AND ST. GEORGE BASIN COST NO. 2 WELL
PA LEOBA THYMETRY ST. GEORGE BASIN COST NO. 1 WELL
STRA TIGRA PHIC SUMMARY SEA ~ e p t h a ~ e e t
I BOTTOM I 0
ST. GEORGE BASIN COST NO. 2 WELL
STRATIGRAPHIC
Depth In Fer t ~ E A SUMMARY
"0 PLE - -- - - - PLIOCENE- PLIOCENE - PLEISTOCENE ,,, - - - - - - - - - I 4 8 0
PLEISTOCENE 1600 - -
SAMPLE SAMPLE 2109
PLIOCENE b EARLY PLIOCENE -2 z9eo PLIOCENE
3800 EARLY
LATE MIOCENE 4800 - ? - ___c
MIDDLE MIOCENE
5 2 4 0 5 3 7 0 EARLY
6050
I OLIGOCENE //681°
EARLY
I EOCENE I LATE I 1 1.000
MIDDLE EOCENE OR OLDER ~e.ooo I BASALTIC BASEMENT
13.000
1 OLIGOCENE
EOCENE
OR OLDER
? - ?-
7000
LATE
6000 OLIGOCENE
OLIGOCENE OR OLDER (POSSIBLE EOCENE)
12.840
13.370
PALEOBA THYMETRY
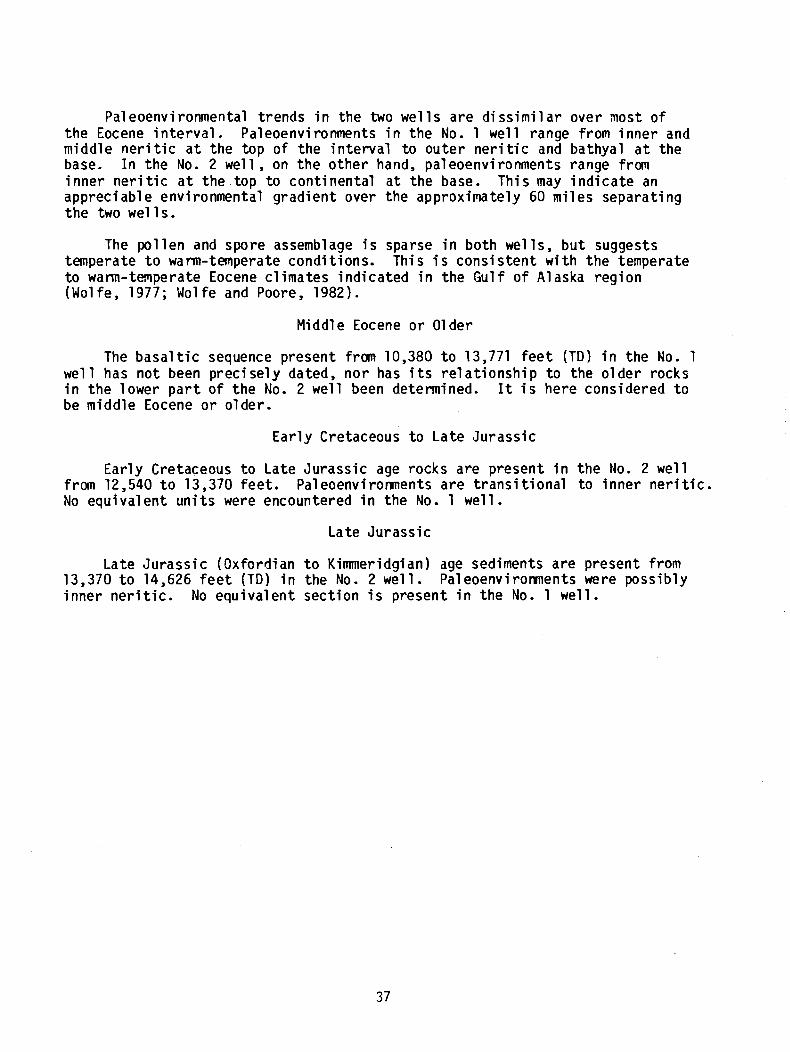
Paleoenviromnental trends in the two we1 1s are dissimilar over most of the Eocene interval. Paleoenvi ronments in the No. 1 we1 1 range from inner and middle neri t i c a t the t o p of the interval t o outer neritic and bathyal a t the base. In the No. 2 well, on the other hand, paleoenvironments range from inner neri t ic a t the top t o continental a t the base. This may indicate an appreciable environmental gradient over the approximately 60 miles separati ng the two we1 1 s.
The pollen and spore assemblage i s sparse in b o t h wells, b u t suggests temperate t o warm-temperate conditions. This i s consistent with the temperate t o warm-tmperate Eocene climates indicated in the Gulf of Alaska region (Wol f e y 1977; Wol fe and Poore, 1982).
Middle Eocene or Older
The basaltic sequence present from 10,380 t o 13,771 feet (TD) i n the No. 1 well has n o t been precisely dated, nor has i t s relationship t o the older rocks i n the lower part of the No. 2 well been determined. I t i s here considered t o be middle Eocene or older.
Early Cretaceous t o Late Jurassic
Early Cretaceous to Late Jurassic age rocks are present i n the No. 2 well from 12,540 to 13,370 feet. Paleoenvirorments are transitional to inner neritic. No equivalent units were encountered in the No. 1 well.
Late Jurassic
Late Jurassic (Oxfordian to Kimmeridgian) age sediments are present from 13,370 to 14,626 feet ( T D ) in the No. 2 well. Paleoenvirorments were possibly inner neritic. No equivalent section i s present i n the No. 1 well.
LITHOLOGY AND WELL LOG INTERPRETATION by
J. G. Bolm
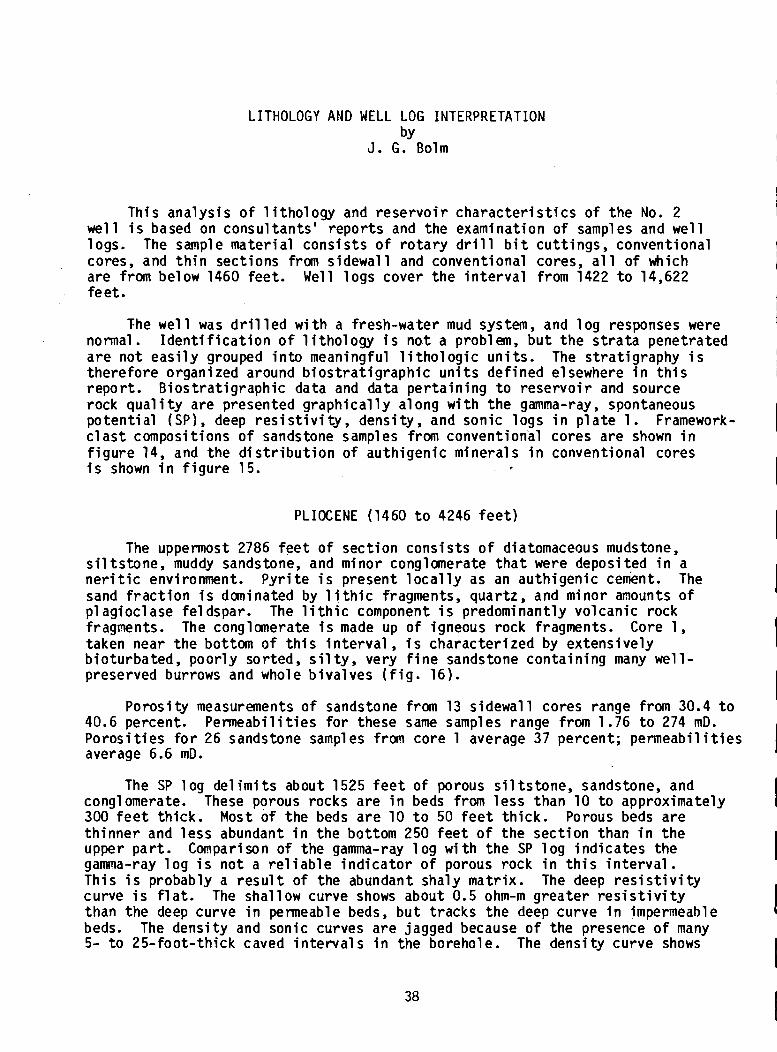
This ana lys is o f 1 i t h o l o g y and r e s e r v o i r c h a r a c t e r i s t i c s o f t h e No. 2 w e l l i s based on consu l tan ts ' repo r t s and the examination o f samples and we l l logs. The sample mater ia l cons is t s o f r o t a r y d r i l l b i t cu t t i ngs , conventional cores, and t h i n sect ions from s idewal l and conventional cores, a l l o f which are from below 1460 fee t . Well l ogs cover t h e i n t e r v a l from 1422 t o 14,622 f e e t .
The we1 1 was d r i l l e d w i t h a fresh-water mud system, and l o g responses were normal. I d e n t i f i c a t i o n o f 1 i t h o l o g y i s n o t a prob l em, b u t t h e s t r a t a penetrated a r e no t e a s i l y grouped i n t o meaningful l i t h o l o g i c u n i t s . The s t ra t i g raphy i s the re fo re organized around b i o s t r a t i g r a p h i c u n i t s def ined elsewhere i n t h i s repo r t . B ios t ra t i g raph ic data and data p e r t a i n i n g t o r e s e r v o i r and source rock qua1 i ty are presented g r a p h i c a l l y a1 ong w i t h t h e gamma-ray, spontaneous p o t e n t i a l (SP), deep r e s i s t i v i t y , densi ty , and sonic l ogs i n p l a t e 1. Framework- c l a s t compositions of sandstone samples from conventional cores are shown i n f i g u r e 14, and the d i s t r i b u t i o n o f au th igen ic mineral s i n conventional cores i s shown i n f i g u r e 15.
PLIOCENE (1460 t o 4246 fee t )
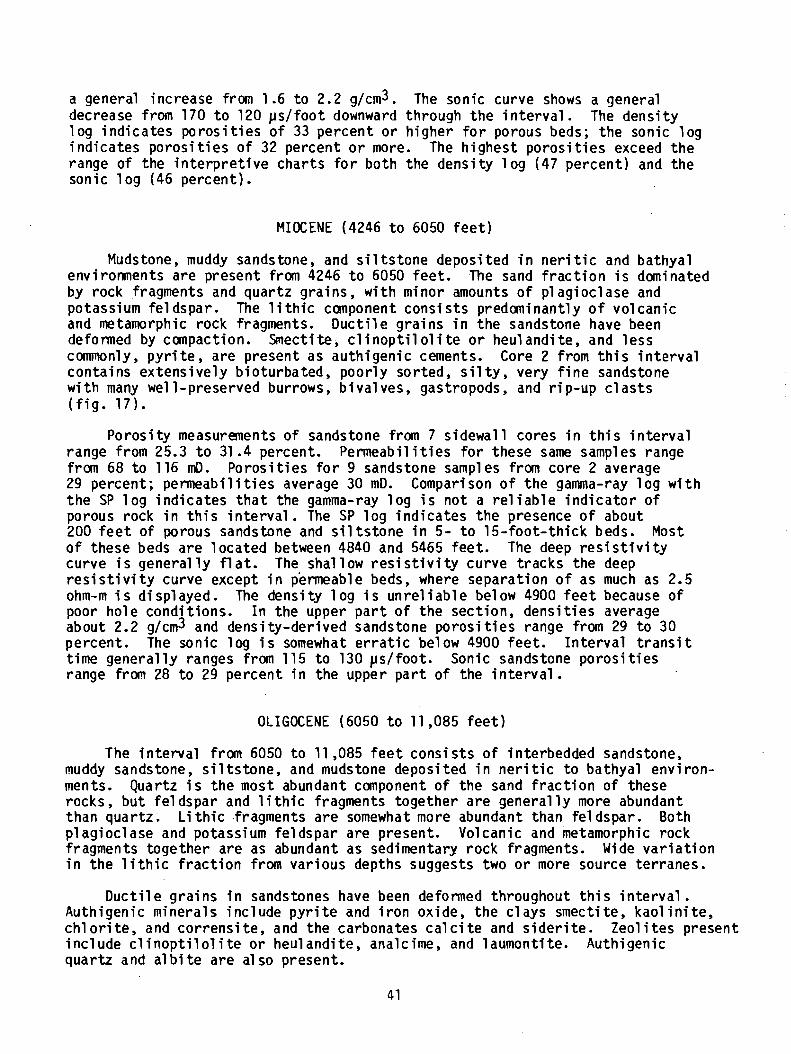
The uppermost 2786 f e e t o f sec t ion cons is t s o f diatomaceous mudstone, s i l t s t o n e , muddy sandstone, and minor conglanerate t h a t were deposited i n a n e r i t i c environment. P y r i t e i s present l o c a l l y as an auth igen ic cenient. The sand f r a c t i o n i s daninated by 1 i t h i c fragments, quartz, and minor amounts of p lag ioc lase fe ldspar. The l i t h i c component i s predominantly volcanic rock fragments. The conglanerate i s made up o f igneous rock fragments. Core 1, taken near t h e bottom o f t h i s i n t e r v a l , i s charac ter ized by ex tens ive ly b io turbated, poo r l y sorted, s i l ty , very f i n e sandstone conta in ing many we1 l- preserved burrows and whole b i va l ves ( f i g . 16).
Poros i ty measurements o f sandstone from 13 s idewal l cores range from 30.4 t o 40.6 percent. Permeabi l i t ies f o r these same samples range from 1.76 t o 274 mD. P o r o s i t i e s f o r 26 sandstone samples from core 1 average 37 percent; permeabil i t i e s average 6.6 mD.
The SP l o g d e l i m i t s about 1525 f e e t o f porous s i l ts tone, sandstone, and conglomerate. These porous rocks are i n beds from l e s s than 10 t o approximately 300 f e e t t h i ck . Most o f t he beds a r e 10 t o 50 f e e t t h i c k . Porous beds a re t h i n n e r and l e s s abundant i n t h e bottom 250 f e e t of t h e sec t ion than i n t h e upper p a r t . Comparison o f t he gamma-ray l o g w i t h t h e SP l o g i nd i ca tes the gama-ray l o g i s n o t a re1 i a b l e i n d i c a t o r o f porous rock i n t h i s i n t e r v a l . Th is i s probably a r e s u l t o f the abundant shaly ma t r i x . The deep r e s i s t i v i t y curve i s f l a t . The shal low curve shows about 0.5 ohm-m greater r e s i s t i v i t y than the deep curve i n permeable beds, b u t t racks t h e deep curve i n impermeable beds. The dens i ty and sonic curves a re jagged because o f t he presence o f many 5- t o 25- foo t - th ick caved i n t e r v a l s i n the borehole. The dens i ty curve shows
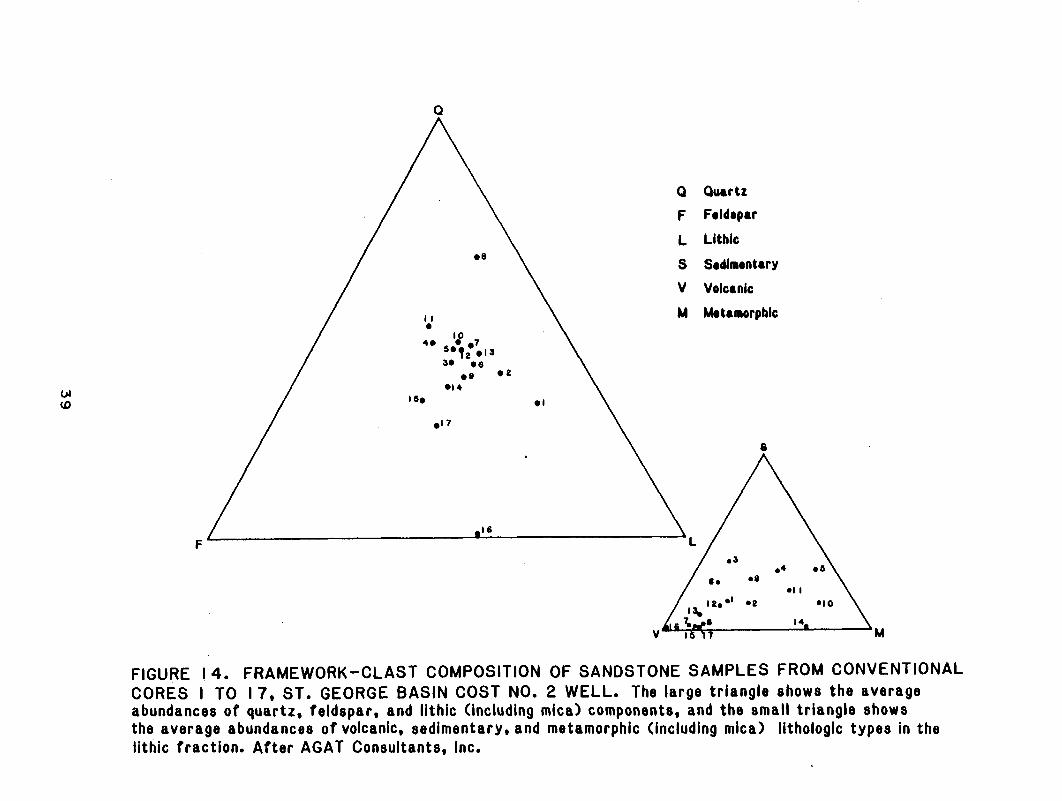
Q Quartz
F Feldrpar
L Lithic
S Sedimentary
V Volcanic
M k t rnorph lc
FIGURE 14. FRAMEWORK-CLAST COMPOSITION OF SANDSTONE SAMPLES FROM CONVENTIONAL CORES I TO 17, ST. GEORGE BASIN COST NO. 2 WELL. The large t r iangle shows the average abundance8 o f quartz, feldspar, and l i thic (including mica) components, and the small t r iangle shows the average abundance8 of volcanic, sedimentary, and metamorphic (including mica) lithologic types in the l i thic fract ion. A f t e r AGAT Consultants, Inc.
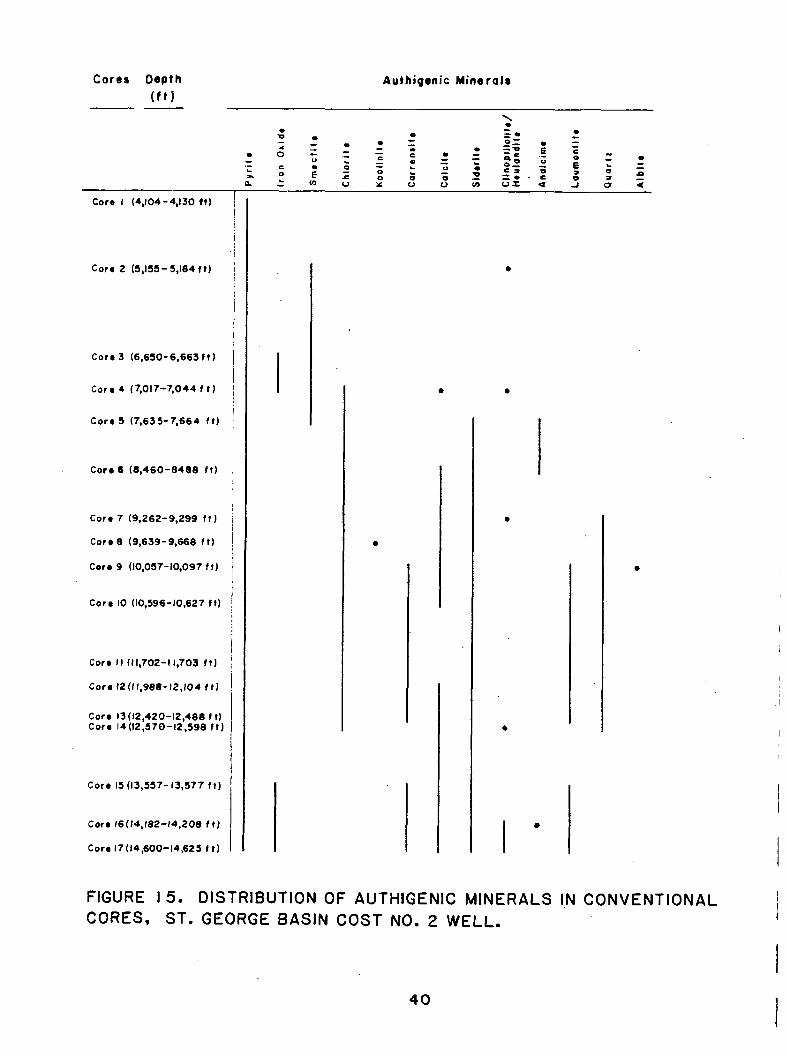
C o r e r Depth
( f t l --
FIGURE 15. DISTRIBUTION OF AUTHlGENlC MINERALS l,N CONVENTIONAL CORES, ST. GEORGE BASIN COST NO. 2 WELL.
Authigenic Mine ra l r
\ r
r - r = r -0 r - - r = r z = - r -0
,o= r - - 0 0 - = - - ~ - 5 : = ~ 3 $ ~ r - 0 : - - 5 = ; c r o - - 0
o b - = a 0 5 0' = I
Core 1 (4,104-4.130 f t ) ! I
I I
Core 2 (5,155- 5,184 t t ) i I
i I
I
Core 3 (6.650-6.663t t ) I I I
Core 4 (7,017-7,044 t t I
Core 5 (7,6357,664 11)
Core 6 (8,460-8488 t t )
I
Core 7 (9,262-9.299 t t ) , i
Cor e 8 (9,639- 9,668 11) I I ;
Core 9 (10,057-10,097 t t ) I i 8
Core 10 (10,596-10,627 t t )
I
Core 1 1 (11,702-1 1,703 t t ) '
Core 12 (1 1,988-12,104 t 1 ) I
Core 13(12,420-12,488 t t ) Core 14(12,570-12,598 t t ) j
i I
Core 15 (13,557- 13,577 t t )
Core 16(14,182-14,208 t t )
Core 17(14,600-14,625 t t )
i I
= O E 0 0 0 - O = r . c p a 5 o ~ ~ ~ x o o m u ~ a ~ o r
a general increase from 1.6 t o 2.2 g/cm3. The sonic curve shows a general decrease from 170 t o 120 p s l f o o t downward through the i n t e r v a l . The dens i t y l o g i nd i ca tes p o r o s i t i e s o f 33 percent o r h igher f o r porous beds; the sonic l o g i nd i ca tes p o r o s i t i e s o f 32 percent o r more. The h ighes t p o r o s i t i e s exceed t h e range o f the i n t e r p r e t i v e cha r t s fo r bo th the dens i ty 1 og (47 percent ) and the sonic l o g (46 percent) .
MIOCENE (4246 t o 6050 f e e t )
Mudstone, muddy sandstone, and s i l t s t o n e deposi ted i n n e r i t i c and bathyal env i romen ts are present from 4246 t o 6050 fee t . The sand f r a c t i o n i s dominated by rock fragments and quar tz gra ins, w i t h minor amounts o f p lag ioc lase and potassium f e l dspar. The 1 i t h i c canponent cons is t s predominantly o f vo lcan ic and metamorphic rock fragments. D u c t i l e g ra ins i n the sandstone have been deformed by canpact ion. Smectite, c l i n o p t i l o l i t e o r heul andi te , and l e s s commonly, p y r i t e , are present as auth igen ic cements. Core 2 from t h i s i n t e r v a l conta ins ex tens ive l y b ioturbated, poo r l y sorted, s i l t y , very f i n e sandstone
. w i t h many we1 1 -preserved burrows, b i v a l ves, gastropods, and- r i p-up c l as ts ( f i g . 17).
Poros i ty measurements o f sandstone from 7 s idewal l cores i n t h i s i n t e r v a l range from 25.3 t o 31.4 percent. Permeabil i t i e s f o r these same samples range from 68 t o 116 mD. Poros i t i es f o r 9 sandstone samples from core 2 average 29 percent; pe rmeab i l i t i es average 30 mD. Comparison o f t h e gamma-ray l o g w i t h t h e SP l o g i n d i c a t e s t h a t the gamma-ray l o g i s n o t a r e l i a b l e i n d i c a t o r o f porous rock i n t h i s i n t e r v a l . The SP l o g i nd i ca tes the presence o f about 200 f e e t o f porous sandstone and s i l t s t o n e i n 5- t o 15- foo t - th ick beds. Most o f these beds are l oca ted between 4840 and 5465 fee t . The deep r e s i s t i v i t y curve i s general l y f l a t . The s h a l l ow r e s i s t i v i t y curve t racks the deep r e s i s t i v i t y curve except i n p'ermeable beds, where separat ion of as much as 2.5 ohm-m i s d isplayed. The densi ty l o g i s u n r e l i a b l e below 4900 f e e t because o f poor ho le condi t ions. I n the upper p a r t o f t h e sect ion, dens i t i es average about 2.2 g/cm3 and densi ty-der ived sandstone p o r o s i t i e s range from 29 t o 30 percent. The sonic l o g i s somewhat e r r a t i c below 4900 fee t . I n t e r v a l t r a n s i t t ime genera l ly ranges from 115 t o 130 p s l f o o t . Sonic sandstone p o r o s i t i e s range from 28 t o 29 percent i n the upper p a r t o f the i n t e r v a l .
OLIGOCENE (6050 t o 11,085 f e e t )
The i n t e r v a l from 6050 t o 11,085 f e e t cons is t s o f interbedded sandstone, muddy sandstone, s i 1 ts tone, and mudstone deposited i n n e r i t i c t o bathyal envi ron- ments. Quartz i s the most abundant component o f the sand f r a c t i o n o f these rocks, b u t f e l dspar and 1 i t h i c fragments together are general l y more abundant than quartz. L i t h i c fragments are somewhat more abundant than f e l dspar. Both p l ag ioc l ase and potassium fe ldspar are present. Volcanic and metamorphic rock fragments together are as abundant as sedimentary rock fragments. Wide v a r i a t i o n i n the l i t h i c f r a c t i o n from var ious depths suggests two o r more source terranes.
D u c t i l e g ra ins i n sandstones have been deformed throughout t h i s i n t e r v a l . Authigenic minerals inc lude p y r i t e and i r o n oxide, t h e c lays smecti t e , kaol i n i te , ch l o r i t e , and cor rens i t e , and the carbonates c a l c i t e and s i d e r i t e . Zeol i tes present i n c l ude c l i n o p t i l o l i t e o r heul andi t e , analcime, and 1 aumonti te . Authigenic quar tz and a1 b i t e are a lso present.
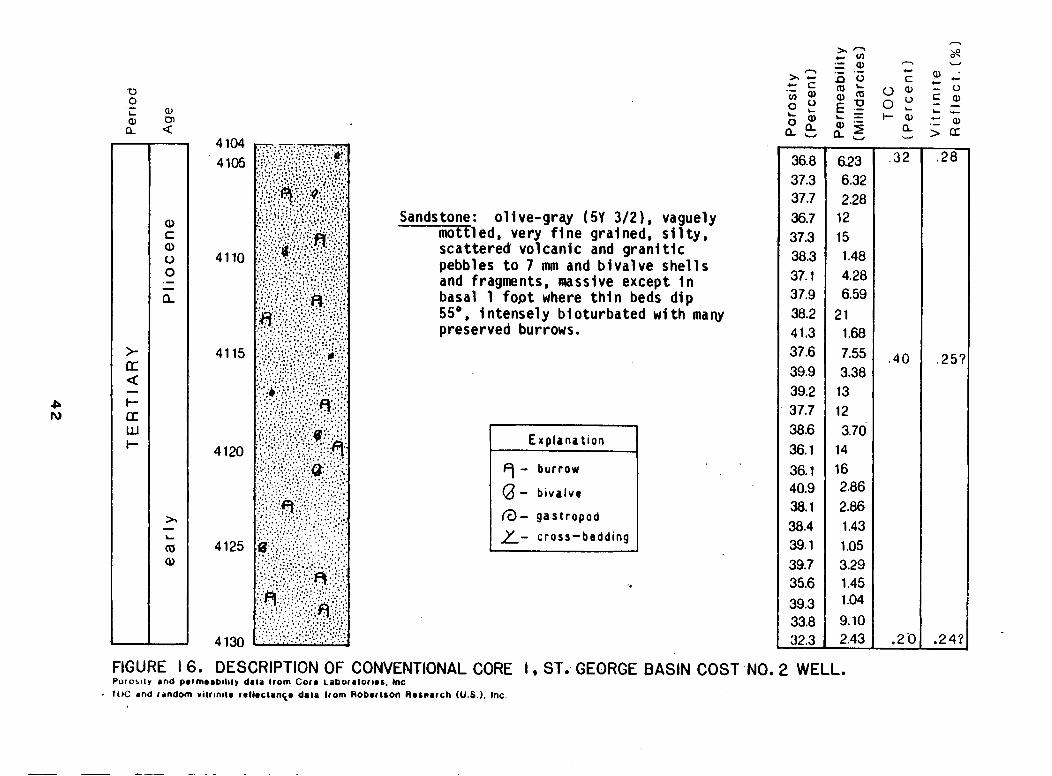
Sandstone: 01 i ve-gray ( 5Y 3/21, vaguely mott led, very f i n e grained, s i l t y , s c a t t e r e d volcanic and g r a n i t i c pebbles t o 7 mm and b i v a l v e s h e l l s and fragments, massive except i n basal 1 f o p t where t h i n beds d ip 55', i ntensely b i oturbated w i t h maw preserved burrows.
E x p l a n a t i o n
F) - b u r r o w
a - b i v a l v e
n- g a s t r o p o d
Y - c r o s s - b e d d i n g
FIGURE 1 6. DESCRIPTION OF CONVENTIONAL CORE I , ST, GEORGE BASIN COST NO. 2 WELL. POIOSI~Y and p*rm*ablhly dala lrom Core Laboratorl*c. Inc 1OC and rdndom wltrlnil* r*lleclante dala lrom Rob*rlcon R*raarch (U.S.). Inc
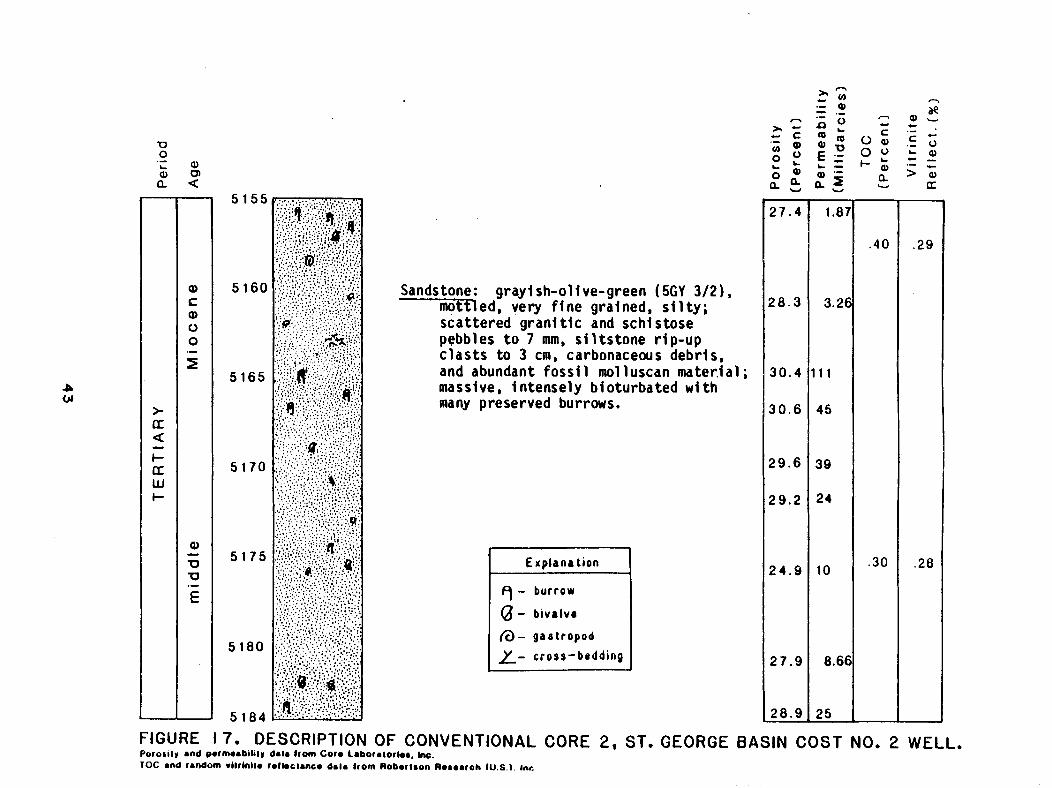
Sandstone: grayi sh-01 i ve-green (5GY 3/21, motfled, very fine grained, s i l ty ; scattered granitic and schi stose pebbles to 7 mm, s i l tstone rip-up c lasts to 3 cm, carbonaceous debris, and abundant fossi 1 moll uscan mater,ial ; massive, intensely bioturbated with many preserved burrows.
E x p l a n a t i o n
n- g a s t r o p o d
L- cross-bedding
FIGURE 17. DESCRIPTION OF CONVENTIONAL CORE 2, ST. GEORGE BASIN COST NO. 2 WELL. Porowlr and potmoabll~ly data ltom Core Laboralorlor. hc. TOC and random rllrlnllo rolloclanco 6.1. lrom Robortron R08oaroh iU.S.1 r n ~
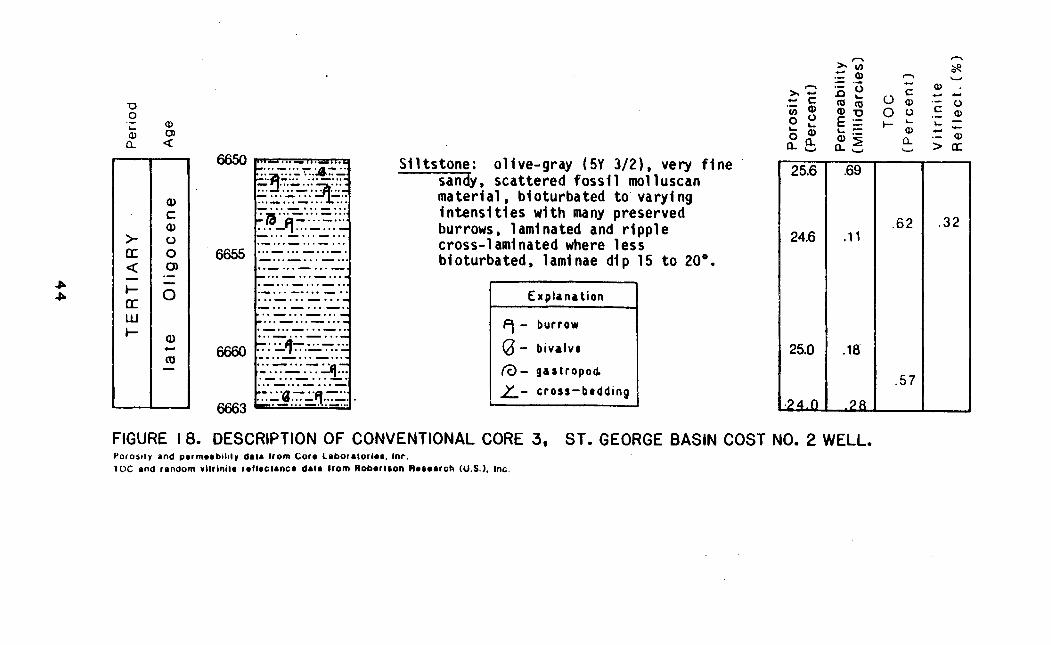
S l l tstone: ol ive-gray (5Y 3/21, very f i n e sandy, scat tered f o s s i l moll uscan ma t e r i a1 , b i oturba ted to ' vary1 ng i n t e n s i t i e s w i t h many preserved burrows, 1 am1 nated and r i p p l e cross-1 am1 nated where l e s s bioturbated, lam1 nae dl p 15 t o 20'.
- E x p l a n a t i o n
PI - burrow
0 - b i v a l v e
n- g a s t r o p o d
z- cross-bedd ing
n
8 U
Q , . & c1
FIGURE 18. DESCRIPTION OF CONVENTIONAL CORE 3, ST. GEORGE BASIN COST NO. 2 WELL. Poros~ly and parmaabbl~ly dala lrom Cora Laboralorlac. Inr. 1 0 C and random vllrlnilr rallaclanca dala lrom Robarlcon Racaarch (U.S.). Inc
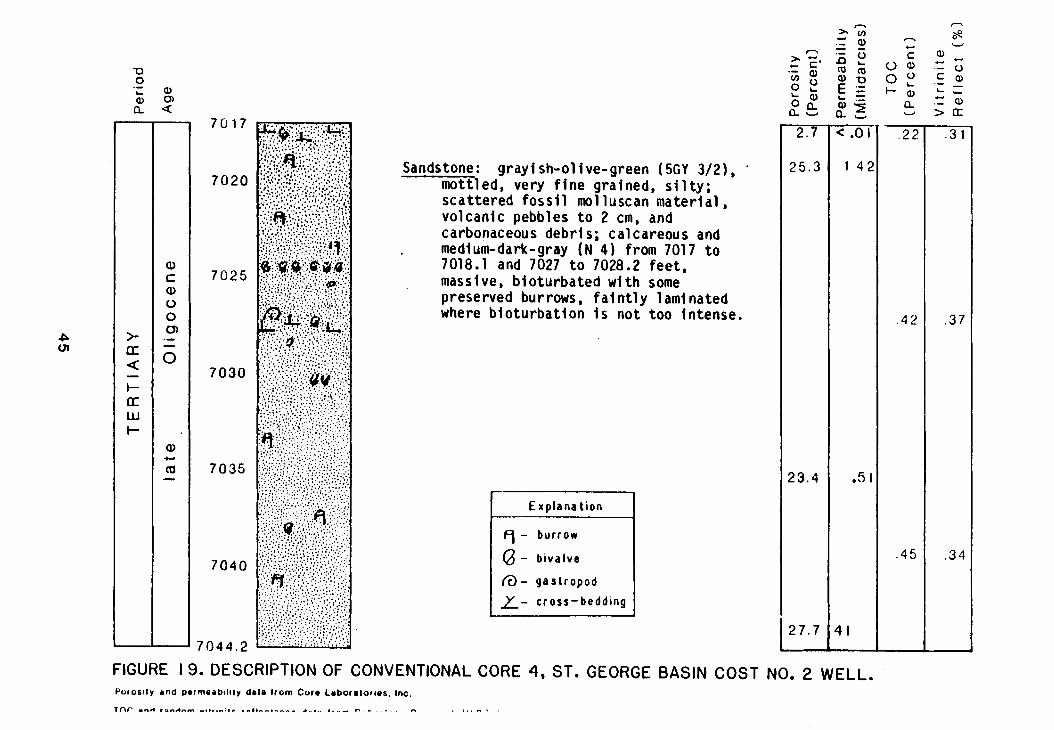
Sandstone: gray1 sh-01 ive-green ( 5GY 3/21, '
mottled, very f i ne grained, s i l t y ; scattered foss i l molluscan mater ia l , volcanic pebbles t o 2 cm, and carbonaceous debr i s; calcareous and
, medium-dark-gray ( N 4 ) from 7017 t o 7018.1 and 7027 t o 7028.2 feet , massive, b ioturbated w i t h some preserved burrows, f a i n t l y 1 ami nated where b io tu rba t ion i s not too intense.
- b i v a l v e
n- g a s t r o p o d
z- c r o s s - b e d d i n g
7 0 4 4 . 2
FIGURE 19. DESCRIPTION OF CONVENTIONAL CORE 4, ST. GEORGE BASIN COST NO. 2 WELL. Poros~ly an0 omrmeab~l~ly data lrom Core Lmboraloc~es. Inc.
~ n r ' -,.,A .un~..... r....r..- .- r e - . . . ---. A -... .--- .- L . . .- . C. . ,,. .. . .
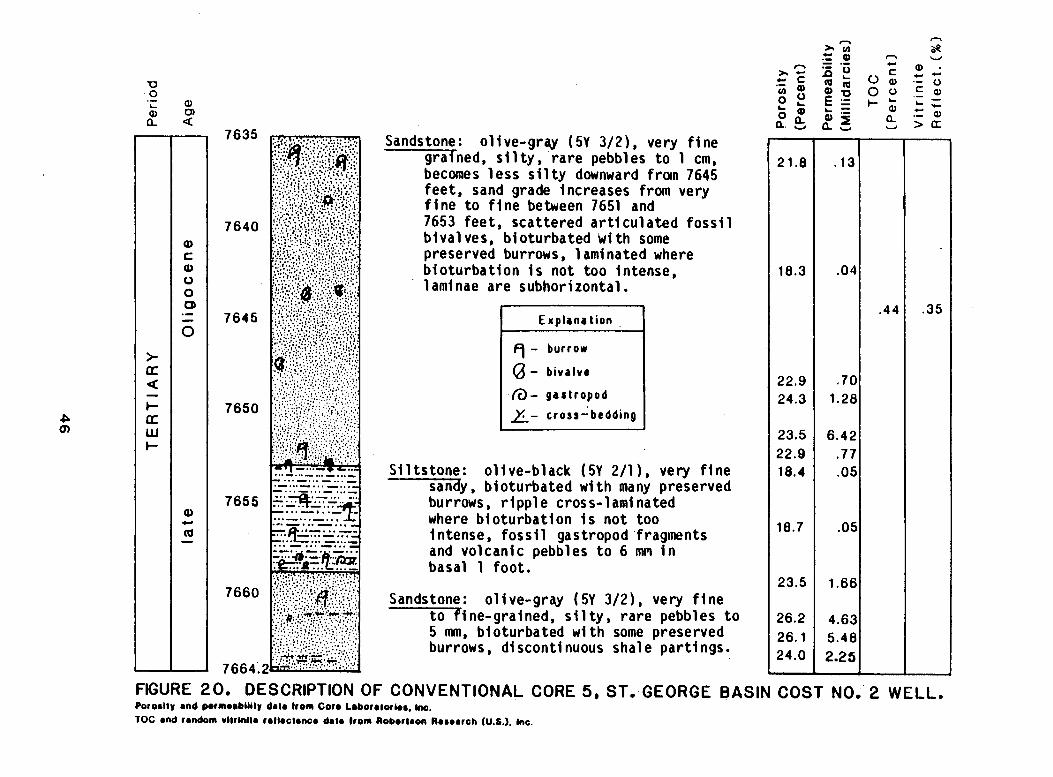
E xplana l i o n ,
q - burrow
0 - b i v a l v r
0- g a s t r o p o d
E- cross- bedding
n n
A m n 8 .= al - u
n .= .- 0) • A E n y w
= - - -0 .- 0 0) .-
m a :" 0
- 0 .- L 0)
e e E g z t ) . E O ) Z Q, 0 0 2 & S .= 0) n a a, u > a:
Sandstone: o l ive-gray (5Y 3/21, very f i n e grafned, s i l t y , r a r e pebbles t o 1 cm, becomes l e s s s i l t y downward f r a n 7645 feet , sand grade increases from very f l n e t o f l n e between 7651 and 7653 feet , scat tered a r t i c u l a t e d f o s s i l b i v a l ves, b i oturbated hi t h some preserved burrows, 1 ami nated where b i o t u r b a t i o n i s not too intense, 1 ami nae are subhorizontal.
7655
7660
FIGURE 20. DESCRIPTION OF CONVENTIONAL CORE 5 , ST. GEORGE BASIN COST N0.'2 WELL. Poro~lly and pormoablllly dala lrom Core Laboralorbor. k. TOC and random vllrInlla rallaclanca dola lrom Roberaaon Ra~oarch (U.S.). Inc.
...-...- ...-..._ -...- ...-...- .-...-... -..._ -..._ ..._ ..._ =.*.--=; ...-.. -.,.
- . . a - . . .- ...- ...-.. . ...-..._... =. q2- -7: -...-...- ...- ...-...-...- :-a .* .--.. . - . . . ~ k % :,.:.!.. ... :.,.'.:':";'.':.. ,...; :;:.;: ..y, :.:. .: ... : ;T ;!ii::<:;:',#.: "":,'.".': ' '
. : : ?::.'.:,:..,..,?::, ,.. ,:::..:, :..: ; ::,r$.; ,..*.*...: ,&.+.; ..:..c..;2r::::.::....::::.:.: :::..: .... ..:.: :>;;;::?:!:::$.;; !.:i,i.::::;:::~:.:. ,...::.::...:. ,...; :i:;.:::::;..-,.. .: :,. ...+ +:-. 7,-::.:,.:., . :::..::.*:m.,+:<....:j 7664;2p'.+...::::::'''.. ::.*'.,
S i l tstone: o l ive-b lack (5Y 2/11, very f i n e sandy, b io turbated w i t h many preserved burrows, r i ppl e cross-1 ami na ted where b i o t u r b a t i o n i s no t too intense, f o s s i l gastropod 'fragments and volcanic pebbles t o 6 mm i n basal 1 foo t .
Sandstone: 01 ve-gray ( 5Y 3/21 , very f 1 ne t o f ine-grained, s l l t y , r a r e pebbles t o 5 mm, bio turbated w i t h some preserved burrows, dlscontinuous shale part ings.
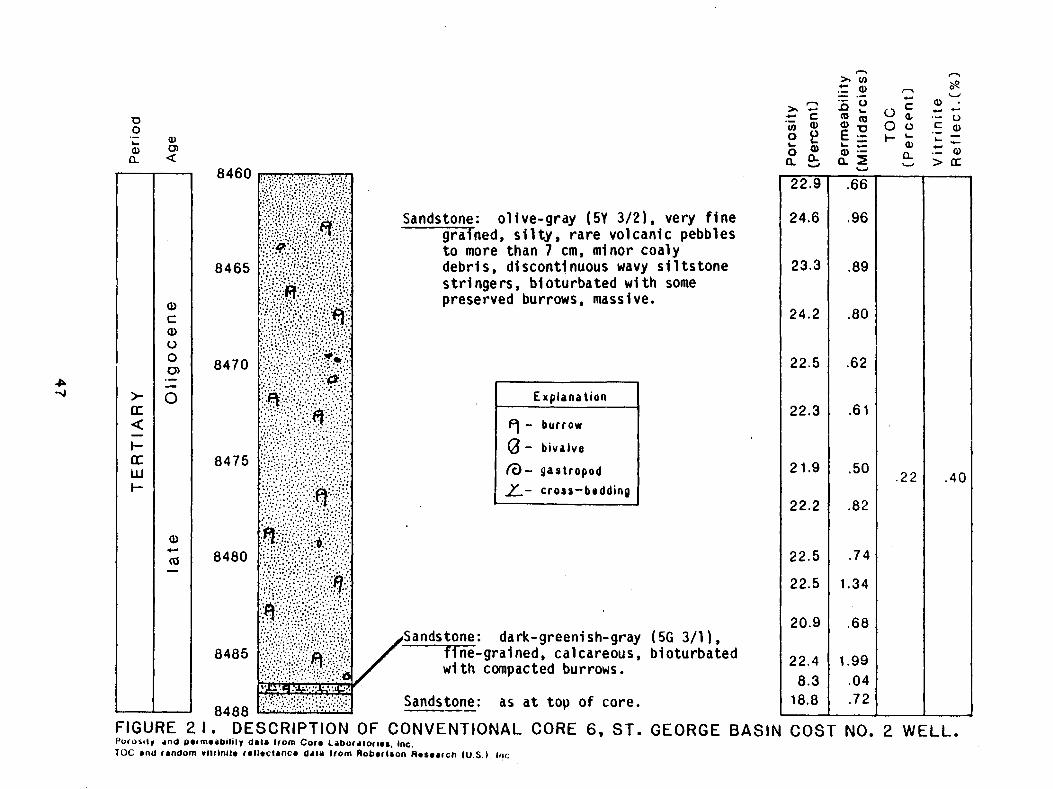
I Explana l i o n I
h
). U) n
.f= a n 8 - ,- .- C U
) . f O e a . C C -
tJ - C m a .- . - 0 0 . - 0 0 .- c a - L a 2 g $ 2 +; - - a m a < 0 , am- G o ,
a, a > a
Sandstone: ol ive-gray (5Y 3/21, very f i n e grained, s i l t y , r a r e volcanic pebbles t o more than 7 cm, minor coaly debris , d i scontl nuous wavy s i 1 tstone s t r i ngers , b l oturbated w i t h some preserved burrows, massive.
- burrow
- bivalve
Sandstone: dark-greeni sh-gray ( 5 G 3/1) , f ine-grained, calcareous, bioturbated w i t h compacted burrows.
Sandstone: as a t toy o f core. ---
63- gastropod
FIGURE 2 1 . DESCRIPTION OF CONVENTIONAL CORE 6, ST. GEORGE BASIN COST NO. 2 WELL. Poror~ lv r n d ~mfmmrbili lv dale lrom Corm Laborrlor~me. Inc. 1OC and random vllrln~lm r*limclancm l a l u l rom Aobcrl&on Rmsmurch IU.S ) , lor.
21'9
22.2
22.5
22.5
20.9
22.4 8.3
18.8
'50
.82
.74
1.34
.68
1.99 .04 .72
2 2 .40
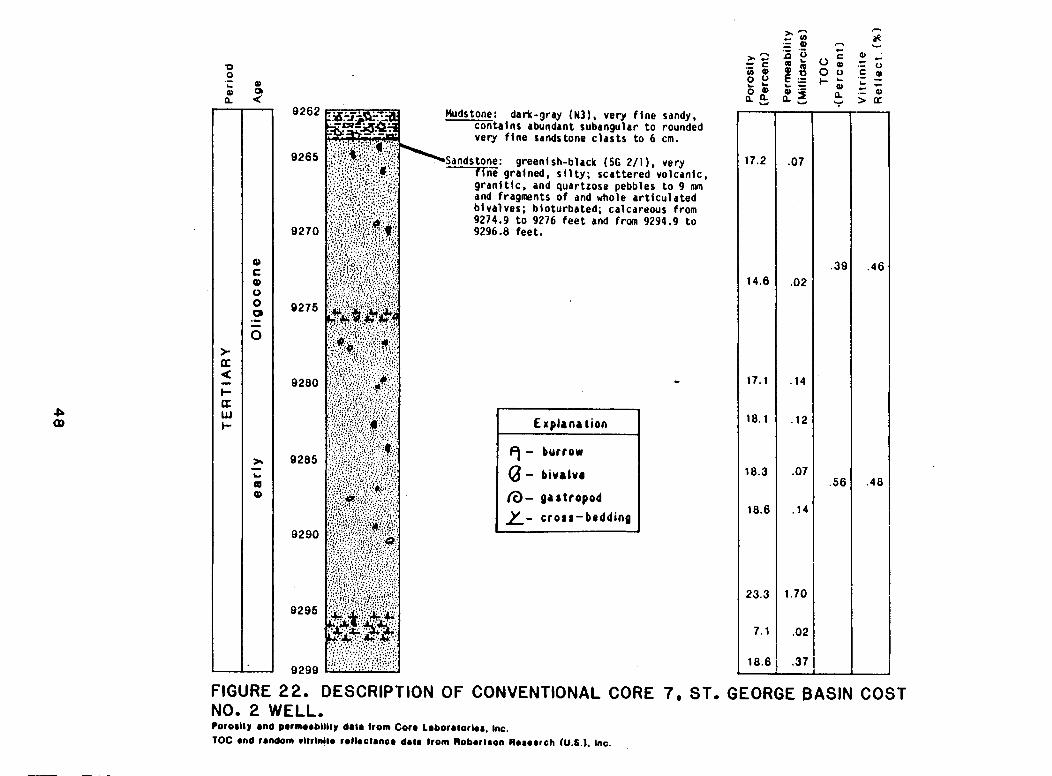
Mudstone: dark-gray (N31, very f l n e sandy. contslns abundant subangular t o rounded very f l ne sandstone c l r s t s t o 6 cm.
\Sands ton+: green1 sh-black ( 5 G 2/11, very y e grslned, s l l t y ; scattered volcanlc,
g r a n l t l c , and quartzose pebbles t o 9 m and fragments of and whole a r t l c u l ated b lv r l ves ; b lo turbr ted; calcareous from 9274.9 t o 9276 fee t and f roa 9294.9 t o 9296.8 feet.
- b i v r l v o
n- g a r t r o p o d z- c r o s s - b e d d i n g
FIGURE 22. DESCRIPTION OF CONVENTIONAL CORE 7, ST. GEORGE BASIN COST NO. 2 WELL. Poro6llp an0 Dormrabllllu data from Cora Lrborrtorloa. Inc. TOC end random rllrlnllo rolloclrnor d r t r trom Roborlaon Rerearch (U.S.1. lno.
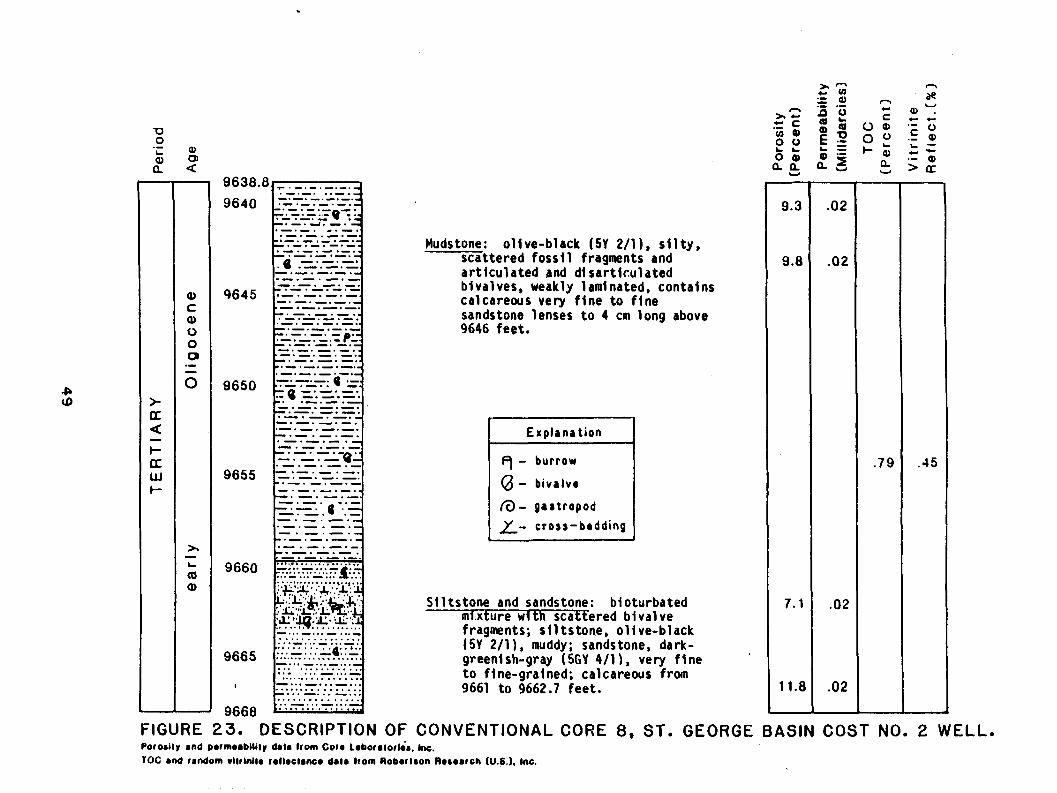
Mudstone: 011 ve-black ( 5 Y 211 1, s l l ty , scattered fossil fragments and articulated and dl sartlculated blval ves, weakly lam1 nated, contalns calcareous very fine to fine sandstone lenses t o 4 cm long above 9646 feet.
Explanat ion I I - burrow I
L- cross-bedding
Sll tstone and sandstone: bioturbated mixture with scattered bivalve fragments; s l l ts tone, olive-black ( 5 Y 211), muddy; sandstone, dark- greenish-gray ( 5 G Y 4/11, very fine to flne-grained; calcareous from 9661 to 9662.7 feet.
BASIN COST NO. 2 WELL. FIGURE 2 3 . DESCRIPTION OF CONVENTIONAL CORE 8, ST. GEORGE Pot orilv and p r rmr rb l l i l ~ Oblb (tom Cora l r b o r r l o r ~ a . &. TOC and random vblrbnllr f r l l r c l r n o dblb tfom Robrrlaon Rrrrbrch (U.6.). Inc.
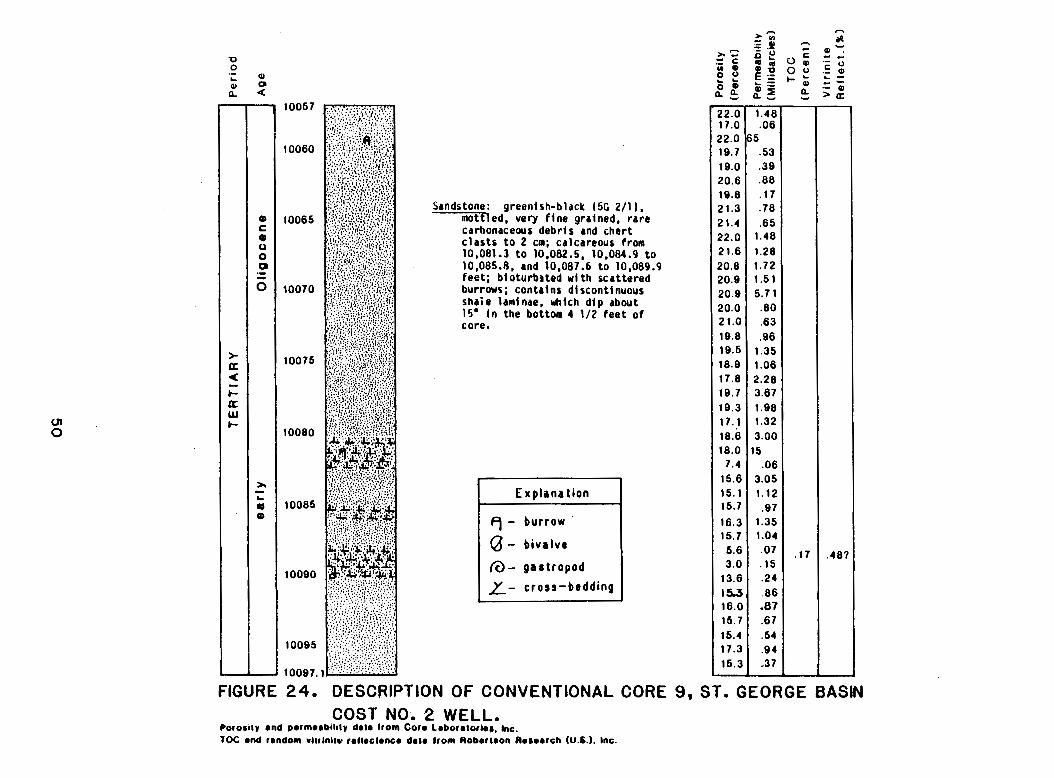
Sandstone: green1 sh-black ( 5 C 2/1 I . mottled, very f lne gralned, rare carbonaceous debrf s and chert c las ts t o 2 ca; calcareous from 10,081.3 t o 10.082.5, 10,084.9 t o lO,OBS.R, rnd 10,087.6 t o 10.089.9 feet; bloturb3ted w l t h scattered burrows; contalns d l scontf nuous shaie lamlnae, bhlch d lp about 15. I n the bottom 4 1/2 fee t of core.
E x p l a n a t i o n
@- gast ropod
x- cross-bedding
10097.1
FIGURE 24. DESCRIPTION OF CONVENTIONAL CORE 9, ST. GEORGE BASIN COST NO, 2 WELL,
POIOSII~ and ~ a r m a a b i l ~ t ~ data lrom Cora Labormlorla@, Ins. TOC and random vllrlnllv rallaclanca dale lrom Robarlaon Iamaarch (U.6.). Ins.
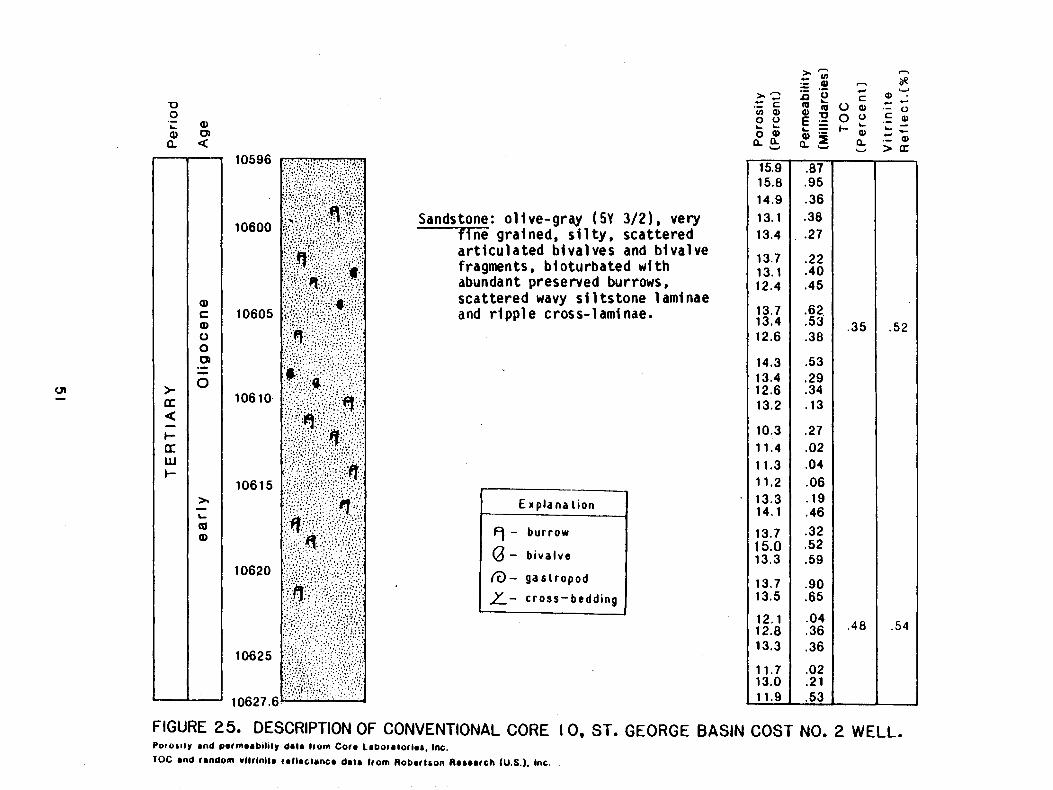
Sandstone: olive-grsy ( 5Y 3 / 2 ) , very fine grained, s i l ty , scattered articulated bivalves and bivalve fragments, b i oturbated with abundant preserved burrows, scattered wavy si 1 tstone 1 ami nae and ripple cross-1 ami nae.
E xp lana l i o n L=J u r r o w
- b i v a l v e
1 15- g a r l r o p o d I z- cross-bedd ing
FIGURE 25. DESCRIPTION OF CONVENTIONAL CORE 10, ST. GEORGE BASIN COST NO. 2 WELL. P o i o r ~ l v and permeabtl~lv dala Irom Core L~Dote lor lar . lnc. IOC end random rllrlnlte rellec8rnca date trom Robertcon Rerearch (U.S.1. Inc.
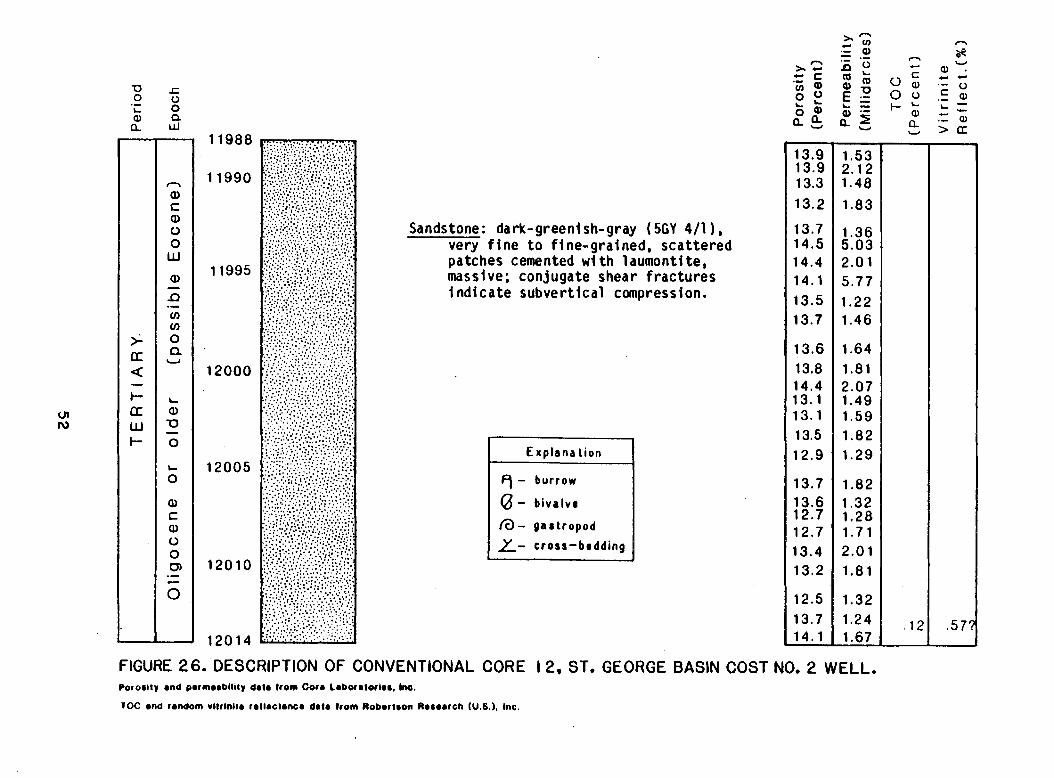
Sandstone : dark-greeni sh-gray ( 5GY 4 /1 ) , very f i n e t o f i ne-grai ned, scattered patches cemented w i t h laumontite, massive; conjugate shear f rac tures i n d i c a t e subvert ical compression.
E xp lana l i o n
q - burrow
- b i v a l v e
n- g a r l r o p o d
z- cross-brdd ing
12014
FIGURE 26. DESCRIPTION OF CONVENTIONAL CORE 12, ST* GEORGE BASIN COST NO* 2 WELL. Pororllv and parmaabllllv data tram Cora Laboratorbar, (no.
7 0 C and random vbtrbnlla r~IlOClOnC0 data horn Robartron Raraarch (U.6.1, Inc.
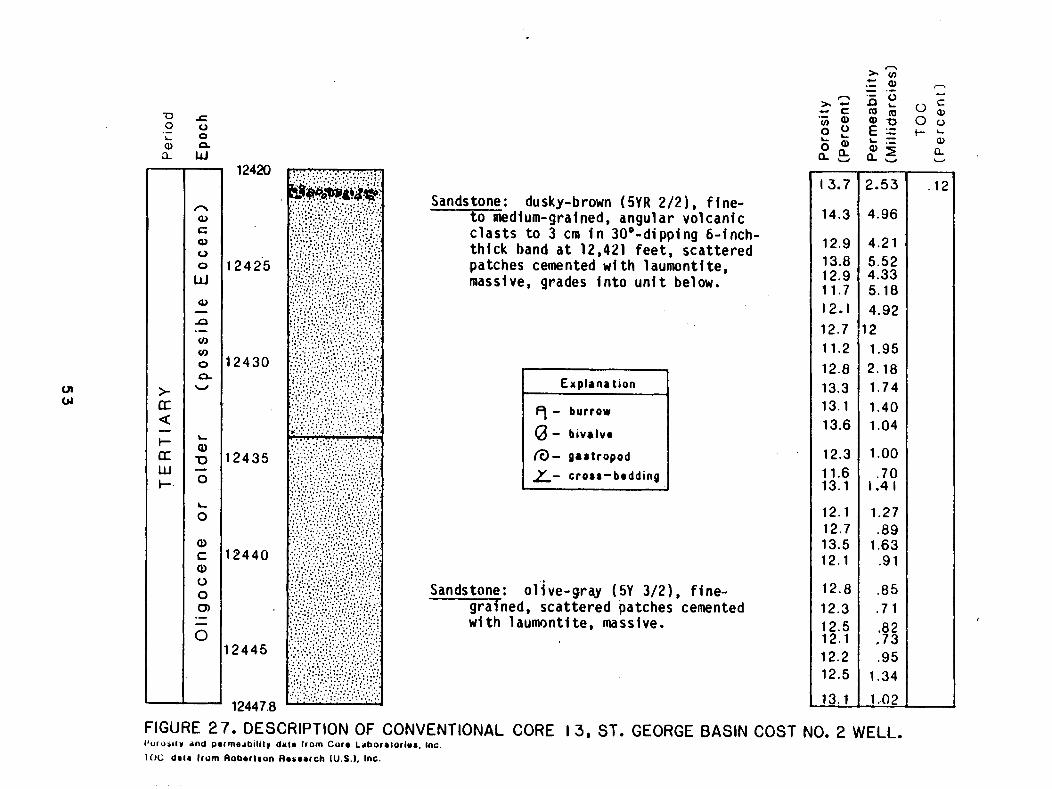
q - burrow
- b i v r l v r
% G C . Q, - .- n
n '- -
r,- n 2 C - c a m 0 ,
-0 c .- 0 0
O Q , Q , u 0 0 . - E s t - L L 0 a) 0 Q,
L.- Q)
a u a & d Z u a
1 n- g r 8 t r o p o d
z- cross-bedding I
UI W
111 grained, scattered patches cemented w i t h laurnonti t e , massive. I
12445
12447.8
FIGURE 2 7 , DESCRIPTION OF CONVENTIONAL CORE 13, ST. GEORGE BASIN COST NO. 2 WELL, I ' o r ~ r ~ l v And Derme~b~l l ly dale lrom Core L~boralorlur. Inc
IOC data lrum Robertaon Rebearch (U S.). InC.
t w [I:
a - ' - : [I: W - k
n O)
C a o o W
0) - P . - V)
V)
o n
D
O
L
0
Q, c Q, 0
1 12420
Sands tone: dusky-brown ( 5YR 2/21, f ine- t o medium-grained, angular volcanic c l a s t s to 3 cm i n 30'-di pping 6-inch- th ick hand a t 12,421 f e e t , scattered
12425 patches cemented w i t h 1 aumonti t e , massive, grades i n t o u n i t below.
12430
12435
12440
Sandstone: 01 i ve-gray ( 5Y 3/21, fine-
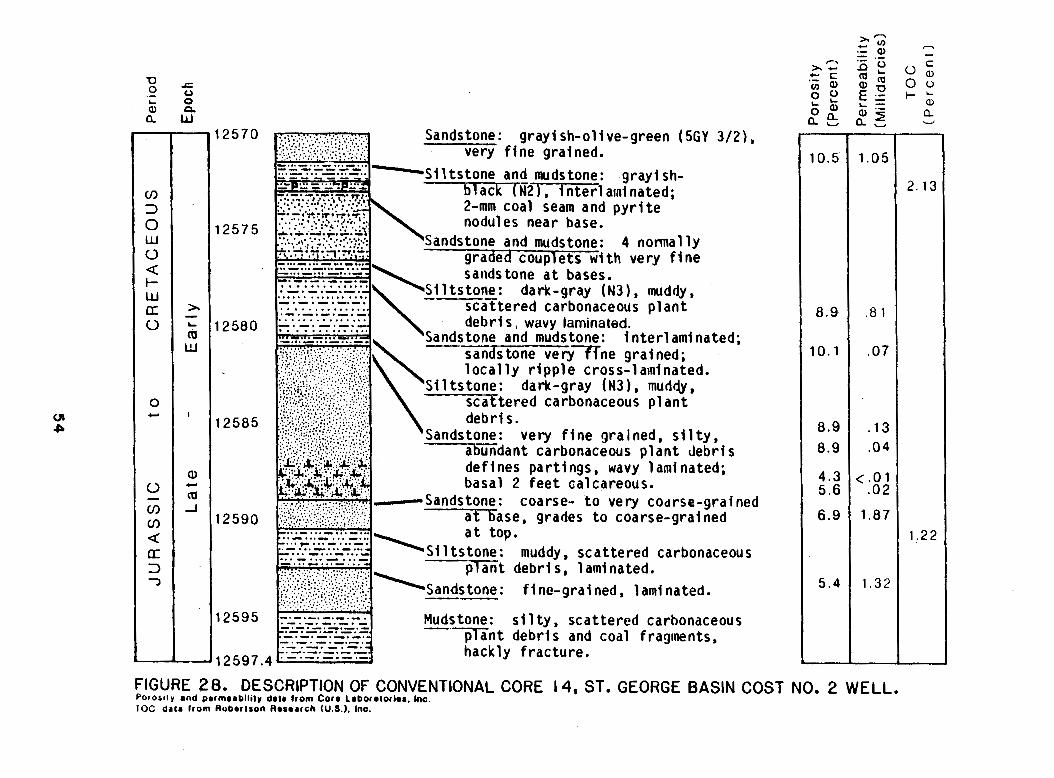
Sandstone: gray ish-o l ive-green ( 5 G Y 3/2 very f i n e grained.
- deb r i s , wavy laminated. Sandstone and mudstone: i nte r l am i nated; ---
~ a n - G y T n e grained; l o c a l l y r i p p l e cross-1 a~ninated.
S i l ts tone: dark-gray ( N 3 ) , mud*, sca t te red carbonaceous p l a n t
Sandstone: very f i n e g ra l ned, s i 1 t y , a b u n d a n t carbonaceous p l a n t deb r i s
de f ines par t ings , wavy 1 ami nated; basal 2 f e e t calcareous.
Mudstone: s i l t y , sca t te red carbonaceous -. p l a n t deb r i s and coal fracr~nents.
hack ly f r ac tu re . -
FIGURE 28. DESCRIPTION OF CONVENTIONAL CORE 14. ST. GEORGE BASIN COST NO. 2 WELL. Porosily and pormrrbilily dalr lrom Cora Laborbtorlos. lnc. 10C drla lrom Ruborlson Rbsbrrch (U.S.1. Inc.
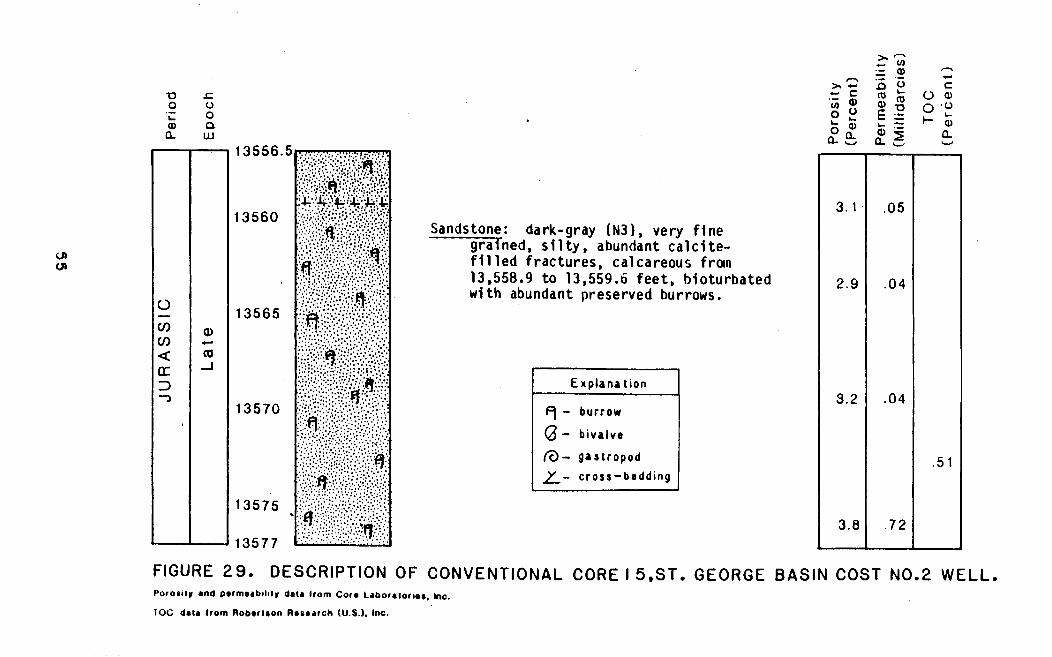
Sandstone: dark-gray (N3) , very f i n e grained, s i l t y , abundant c a l c i t e - f i l l e d f ractures, calcareous froin 13,558.9 t o 13,559.6 f e e t , b ioturbated w i t h abundant preserved burrows.
E x p l a n a t i o n
q - burrow
0 - b i v a l v e
n- g a s t r o p o d
Y - cross-bedd ing
FIGURE 2 9 - DESCRIPTION OF CONVENTIONAL CORE I 5 , S T , GEORGE BASIN COST N0.2 WELL* Poros~lv and permbrbllllv data lrom Corb L d b o r a l o r ~ a ~ , ("0.
1 0 ~ d a ~ a lrom R o b e r l ~ o n R b s b r r ~ h (U.S.). Inc.
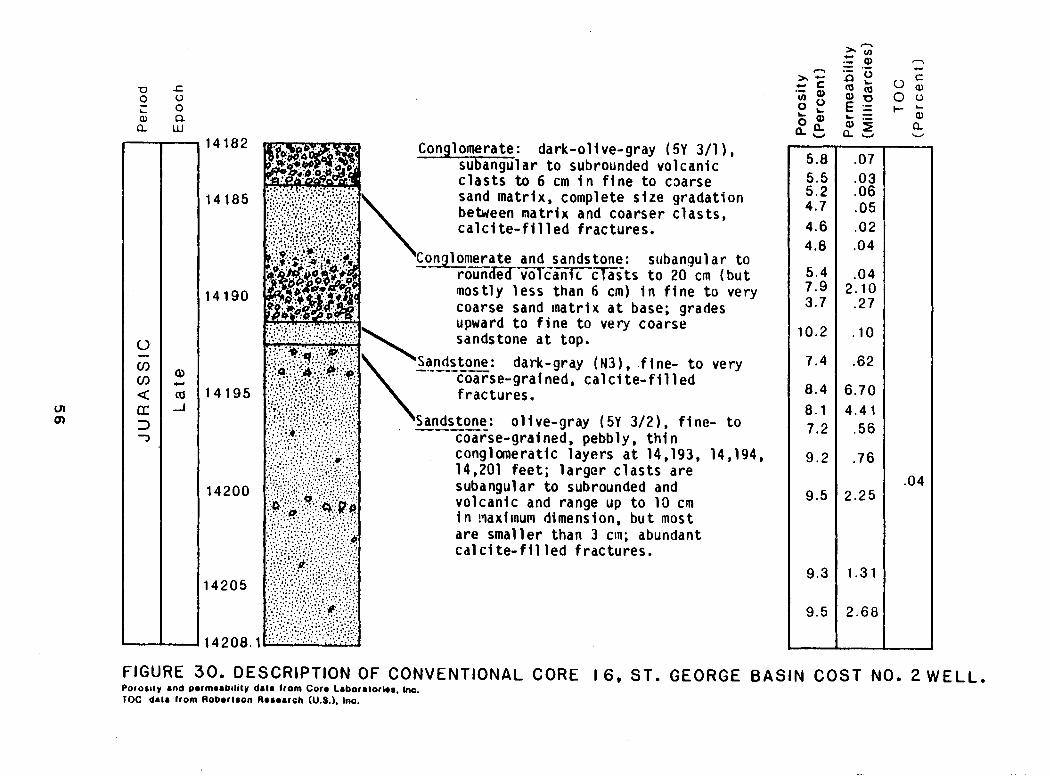
Con lomerate: dark -o l i ve -g ray (5Y 311 ) , --e-6 su angu la r t o subrounded vo l can i c c l a s t s to 6 cm i n f i n e t o caarse sand ma t r i x , complete s l z e g rada t i on between m a t r i x and coarser c l a s t s , c a l c i t e - f i l l e d f r ac tu res .
'Conglonerate - and sandstone: subangul a r t o r ozde -d -G-TCan i ccTS ts t o 20 cm ( b u t - . -
most l y l e s s than 6 cm) i n f i n e t o very coarse sand m a t r i x a t base; grades upward t o f i n e t o very coarse sandstone a t top.
'sandstone: -.--.---- dark-gra$ (N3), f (ne- t o very coarse-g ra i ned, c a l c i t e - f il l e d ...... ... ........ : . i . [s~~~,:;.:~~;..~~~:;~:;2;~;:::~.:j] 1 fractu res . ... ...... :..::v;...::> :.':::::'. : ':',;.I: ................. "'
; . ,......,: ::$;;?.:. ;:,: . . ?;::: ..:;;;;j:;::::; .... :::.:: ;:t.;;;j ,. , . ..~.e~f.:.::.;,.;,.:~~i,~.:r:~:
\Sandstone: . ------ o l i ve -g ray (5Y 3/2), f i n e - t o :\:::.:I:::,; . . . . . . ::: . . ....:.:i... ;. .;,:. ....... .; .... v , : , : : . : : : : .
coarse-gra i ned, pebbly, t h i n b~~:;~;;;:2~;;.:,:.:~~~~~,,.;.:: conglomerat ic l aye rs a t 14,193, 14,194, :::.:..;::;,;,.,; ,::,:?:.:::'::,:: ::..;:. ;... 14,201 f e e t ; l a r g e r c l a s t s a re ............................... ......: ......:'....:. ;:..<.. . ......... ..:>::.... :.. .. :;... """. . . . . . . . . . . . . . . . :"' " :,,:; :.; :.,::.. ..:.. : .....:..... .:': ,):b/!;{:.;',*;;;..:.: :;:;:.: .::;
subangul a r t o subrounded and
y,.:,;.;6::~;:;;:~.~.P:q, . . vo l can i c and range up t o 10 cm ;fi;;..,;;.;;;; ;.::;.. . :y. : :. :: ... ..:.':i::' i n ! lax i inum dimension, b u t most ....... . . . . . . . .::.;: ..... :..:;.::.:. ... ::::.,>::::.:.: " .......... ............... :.... : : .:.:$ a r e sma l l e r than 3 cln; abundant . ...: .:.: ..';'.:: ......... ,: : :,:. ... ;. ........... : .. ,,...! I.2,.y~;~,.~:.::,~;~:::: c a l c i t e - f i l l e d f r a c t u r e s .
FIGURE 30. DESCRIPTION OF CONVENTIONAL CORE 16, ST. GEORGE BASIN COST NO* 2 WELL. POIOSIIV and ~brmbabllily dala lrom Core LaboratorIra. h. IOC dala lrom Robbrlron Rbrbarch (U.S.). Ino.
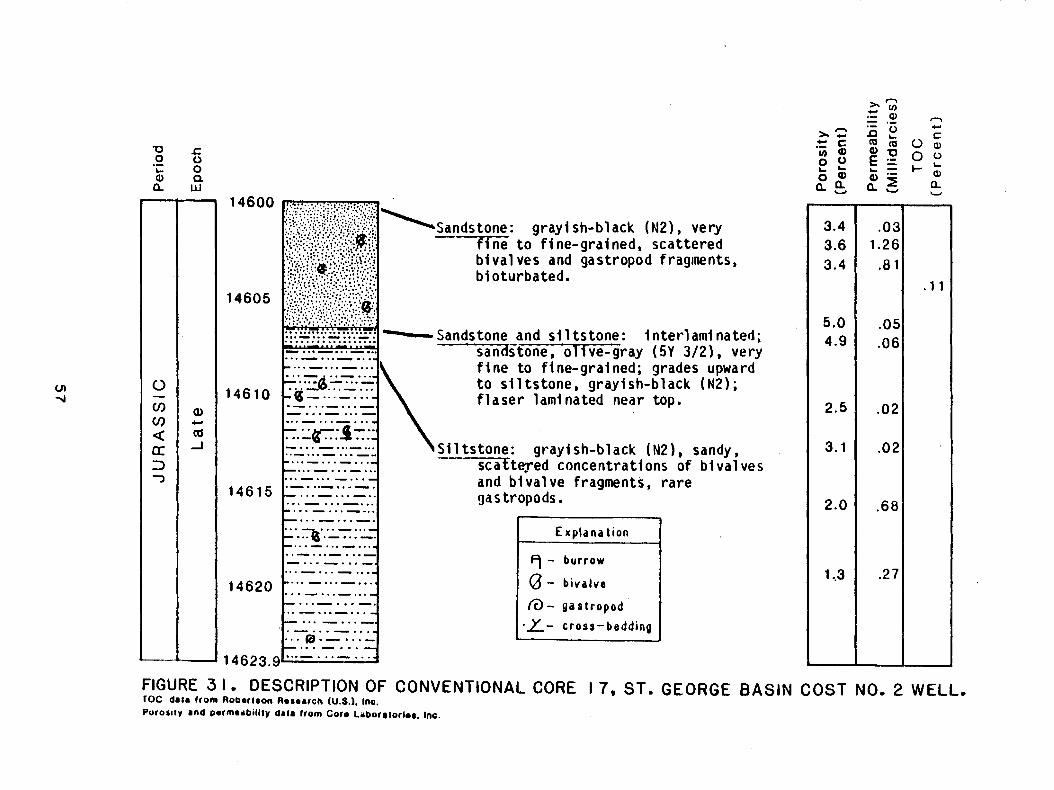
- b i v a l v e
a- g a s t r o p o d
.Y- cross -bedd ing
2% .- (I) - .- n .- CI
n o c . = c m Z O a
-rJ c 0 0 .- " l a f E o o - L. 0 2 L -
Q, ' P k- ; 0 0 , a s
a w a a, u
1 4 6 00
1 4 6 0 5
y;<:;;.;:;;:.:,!::j;j;;j::;::; .
.......... ,..: .;.., :;: .:.::!.::;::?;.::::;;' j~~,;:,;.;~.';~;;i;:;I'i.: .a,..
F:?.. .... ..~.-..:;:p$$ \Sandstone: - gray1 sh-black (821, very :;*., .,:.j$.q.'~:;:::;;, . ,. .a*...... :.::a ........ .'.'.'...' .; :.:.:>
-fine t o f i ne-grad ned, sca t te red .... ... ....... .,.. \ '.'.<i ; :!.$i: ; <;*:;:;:.:.::>.,::.:. b i va l ves and gastropod fragments, ........... c$.;'y.; .;:.>...:;::;+;; . : . . : . : . : . . . b io tu rba ted .
:.;$;?.; ;$;;;;,j!;&; .... 1 .... :?:;;,.:::y.: ..a;.. ,; :..* ::::.. ,. . . .:.:.,:,.;: .". . .... . . . ..................... -- .................. ...- : - Sandstone and s i 1 ts tone: i nter lami nated; -- -... -...-... _. .._ .. ._ sandstone, 01 ive-gray (5Y 3/21, very ... f i n e t o f i ne-grai ned; grades upward
...-... t o s i l t s tone, gray ish-b lack ( ~ 2 ) ; .-...-...- f l a s e r laminated near top. - . a * - ...- -..-...-...- -.a. - . a * - . . . .._..._ ... _.. S i 1 ts tone: g ray i sh-bl ack (NZ), sandy,
m e . . - . . . - ...- -- -...-...-... s 3 t q e d concent ra t ions o f b i va1 ves ...-... -., . -
14615 .-...-.. .-. and b i va1 ve fragments, r a r e
- a * . - . . . - . . ...__.._... gaslropods . -... -...-... -.. . -... -. ....-a. .. -... ' - .-.*.-. -... -...-...- ..-...-. ..- -...-...-. I . . _ . . . - ...- ...-...-... . ... ... 1 4 6 2 0 :. - - :
- . . a - . . . - . ... - ...-... - -...-...-. . - ..-... ... @j. - ... -- -..* - . . .- .. . . 1 4623.9 ...-. -.
FIGURE 3 1. DESCRIPTION OF CONVENTIONAL CORE 17, ST. GEORGE BASIN COST NO* 2 WELL* rOC d.1. from Robarlron Raraarch (U.S.). Inc. Porostlv and permaubilitv dale lrom Core Laboratorler. Inc.
Cores 3 t o 10 from t h i s i n t e r v a l are described i n f i g u r e s 18 t o 25. Extensively b io turbated, poor ly sor ted s i l t s t o n e and sandstone w i t h many wel l-preserved burrows, b ivalves, and gastropods a re common and i n d i c a t e marine .
she1 f deposi t ion.
Poros i ty measurements o f sandstone from 44 s idewal l cores range from 17.5 t o 30.3 percent. Permeabil i t i e s f o r these same samples range from 3.72 t o 104 mD. Average p o r o s i t i e s o f s.andstone from conventional cores range from 25 percent f o r core 3 (6650 t o 6664 f e e t ) down t o 13 percent f o r core 10 (10,596 t o 10,628 f e e t ) . There i s a general decrease i n average po ros i t y w i t h increas ing depth f o r conventional cores. Average permeabil i t i e s o f conventional core samples range from l e s s than 1 t o 12 mD. There i s no d i scernabl e re1 a t i onsh i p between average permeabil i t y and depth o r average po ros i t y .
The SP l o g i n d i c a t e s the presence o f about 1630 f e e t o f porous sandstone and s i l t s t o n e . These beds range from 5 t o 120 f e e t t h i c k and are t h i c k e r and more abundant be1 ow 7850 fee t . Comparison o f t he SP and gamma-ray l o g s i n d i c a t e s t h a t t h e gamma-ray l o g i s no t a r e l i a b l e i n d i c a t o r o f porous rock i n t h i s i n t e r v a l . The deep r e s i s t i v i t y curve i s general l y f l a t and records a gradual increase i n r e s i s t i v i t y downward. The s h a l l ow r e s i s t i v i t y curve t racks t h e deep r e s i s t i v i t y curve i n impermeable beds, b u t t he two curves a re general l y separated by 2 t o 3 ohm-m i n permeable beds. The dens i t y l o g was s t r o n g l y a f fec ted by extensive cavi ng i n t h i s i n t e r v a l . Re1 i a b l e dens i ty measurements range from 2.3 t o 2.5 g/cm3, and re1 i a b l e densi t y -de r i ved sandstone p o r o s i t i e s range from 17 t o 27 percent. The sonic l o g was l e s s a f fec ted by ho le cond i t ions than was t h e dens i t y log. I n t e r v a l t r a n s i t t imes decrease from 115 t o 72 p s / f o o t downward through t h i s i n t e r v a l . Sonic p o r o s i t i e s range from 12 t o 29 percent.
OLIGOCENE OR OLDER (11,085 t o 12,540 f e e t )
The i n t e r v a l from 11,085 t o 12,540 f e e t cons is t s o f interbedded sandstone and s i l t s tone deposited i n nearshore marine o r nonmarine environments. The composition o f t h e sand f r a c t i o n i s s i m i l a r t o t h a t o f t h e o v e r l y i n g Oligocene sect ion. D u c t i l e g ra jns i n the sandstones have been deformed i n the sane fashion as i n t h e shal lower i n t e r v a l s. Authigenic cements i nc lude p y r i t e , ca l c i t e , s i d e r i t e , quartz, laumont i te, c h l o r i t e , co r rens i te , and poss ib l y kaol i n i te .
Cores 11 t o 13 a r e from t h i s i n t e r v a l . Only 1 f o o t o f sandstone was recovered from core 11, which i s no t described. The o the r cores are described i n f i g u r e s 26 and 27. ~ h e k e are no sedimentary s t r u c t u r e s present t h a t a re i n d i c a t i v e o f any s p e c i f i c depos i t iona l environment. M i nor g l a~rcon i t e i n core 12 (11,988 t o 12,014 f e e t ) a)pp i n s idewal l cores from 11,468, 11,740, and 12,267 f e e t suggests depos i t i i n a marine s h e l f environment, al though t h e absence o f f o s s i l s and from t h e c e r t a i n t y o f t h a t i n t e r p r e t a t i o n .
Po ros i t y measurements o f sdndstone from 10 s idewal l cores range from 19.1 t o 26.1 percent. P e r m e a b i l i t i e s ' f o r these same samples range from 16 t o 121 mD. Average p o r o s i t i e s o f sandstone from conventional cores range from 12
percent f o r cores 11 and 13 t o 13.5 percent f o r core 12. Average perneabi l i t i e s o f sandstone from conventional cores range from l e s s than 1 t o 2.5 mD. There i s no apparent r e l a t i o n s h i p between average permeabi l i t y and depth o r average poros i ty .
The SP l o g i n d i c a t e s the presence of about 220 f e e t o f porous sandstone. These beds range from 10 t o 60 f e e t t h i c k . Comparison o f the SP and gamna-ray l o g s i nd i ca tes t h a t the gamma-ray l o g i s no t a r e l i a b l e i n d i c a t o r of porous
I rock i n t h i s i n t e r v a l . The deep r e s i s t i v i t y curve i s f l a t , and the shal low curve fo l l ows the deep curve w i t h a d i f f e r e n c e o f about 1 ohm-m between the two. The densi t y 1 og i s unrel i abl e be1 ow about 11,360 f e e t because o f poor ho le condi t ions. Dens i t ies range from 2.50 t o 2.55 g/cm3 i n the upper p a r t o f t h e i n t e r v a l . No porous beds are def ined by t h e SP l o g above 11,360 fee t , b u t the densi ty l o g i nd i ca tes p o r o s i t i e s o f 6 t o 11 percent f o r any sandstone t h a t may be present. The sonic l o g was n o t af fected as much by washouts as was the densi ty l og . I n t e r v a l t r a n s i t t imes decrease from 75 t o 70 ps / foo t downward through t h e i n t e r v a l , and sonic p o r o s i t i e s range from 11 t o 15 percent.
LATE JURASSIC TO EARLY CRETACEOUS (12,540 t o 13,370 f e e t )
The i n t e r v a l from 12,540 t o 13,370 f e e t cons is t s o f sandstone, conglomerate, s i l ts tone, and minor amounts o f shal e. Coal i s present i n c u t t i n g s from t h e top 60 fee t . These rocks were deposited i n f l u v i a l o r d e l t a i c and poss ib ly marine she1 f envi rorments.
The sand f r a c t i o n o f these rocks cons is t s o f subequal amounts o f p lag ioc lase and potassium fe ldspar, quartz, and rock fragments. Both metamorphic and volcanic rock fragments are present. The conglanerates are made up o f vo lcan ic , sandstone, and s i l t s t o n e c l a s t s i n a sandstone matr ix . D u c t i l e g r a i n deformation i s canmon i n the sandstones. Py r i t e , quartz , smect i te , c h l o r i t e , c a l c i t e , s i d e r i t e , c l i n o p t i l o l i t e o r heul andi t e , and laurnonti t e are present as auth igen ic cements.
Core 14 i s from t h e top o f t h i s i n t e r v a l and i s described i n f i g u r e 28. The graded bedding and p a r a l l e l , wavy, and r i p p l e 1 aminat ion seen i n t h i n beds i n the core are cons is ten t w i t h d e l t a i c po in t -bar and crevasse-spl ay deposi t ion. However, minor g laucon i te i n sandstone deeper i n t h e sec t i on suggests t h a t a t l e a s t p a r t o f the i n t e r v a l may have been deposited i n a marine environment.
Poros i ty measurements o f sandstone samples from 5 s idewal l cores range from 20.9 t o 26.1 percent. Permeabi l i ty measurements, obta ined from on ly two o f these samples, a re 29 and 79 mD. Poros i ty measurements o f 9 sandstone samples from core 14 average 7.6 percent. Permeabi l i ty measurements f o r these same samples average l e s s than 1 mD. The h igher p o r o s i t y and permeabil i t y values from s idewal l cores a re probably a r e s u l t o f f a b r i c d i s r u p t i o n caused by percussion.
The SP curve i s f l a t w i t h minor undulat ions i n t h i s i n t e r v a l . This i s probably due t o low po ros i t y con t ras ts between 1 i tho1 ogies. The gamma-ray 1 og suggests the presence o f about 250 f e e t of nonporous sandstone o r conglanerate
in 40- t o 100-foot-thick beds. The deep resist ivi ty curve i s blocky above 1 2 , 8 0 O a n d b e l o w 1 3 , 2 0 0 f e e t . F r o m 1 2 , 8 0 0 t o 1 3 , 2 0 0 f e e t t h e c u r v e i s v a r i a b l y undulating o r jagged over a range of about 30 ohm-m. The shallow resist ivi ty curve foll ows the deep resist ivi ty curve with separations of up t o 20 ohm-m ( b u t less than 5 ohm-m in most cases). There i s no apparent correlation between the separation of the two curves and the presence of sandstone o r conglomerate suggested by the gamma-ray 1 og . Extensive washouts above 12,800 feet make the density log unusable in the upper 260 feet. Local washouts i n the lower part of the interval are reflected by many sharp excursions of the density curve to low values. The average rock density i n uncaved parts of th is interval i s 2.5 g/cm3, which indicates a sandstone porosity of about 8 percent. The sonic log i s erratic above 12,800 feet. Be1 ow tha t depth, interval t rans i t times generally range from 60 t o 65 ys/foot, which indicates sandstone porosities of 3 to 7 percent.
LATE JURASSIC (13,370 to 14,626 feet )
The interval from 13,370 t o 1$,626 feet consists of sandstone, s i l ts tone, and conglanerate deposited in a marine environment.
Fel dspar and rock fragments are present i n roughly equal amounts in the sand fraction of rocks f r m th i s interval. The quartz content ranges from zero to almost a t h i r d of the sand fraction. Both plagioclase and potassium feldspar are present. The rock fragments in the sandstone are almost exclusively volcanic. The conglomerates are made u p of large volcanic c las ts in a sandstone matrix. Ductile grain deformation i s canmon. Pyrite, i r o n oxide, ca lc i te , s ideri te , corrensi t e , cl inoptilol i t e or heul andi t e , analcime, and 1 aumonti t e are present as authigenic cements.
Cores 15, 16, and 17 are from th i s interval and are described in figures 29, 30 and 31. The extensively bioturbated, poorly sorted, very fine sandstone w i t h preserved burrows seen i n core 15 suggests deposition in a marginal marine environment. The sandstone and conglomerate of core 16 are similar in aspect to facies A of M u t t i arid Ricci Lucchi (1972) and may have been deposited in submarine channels. The bioturbated, laminated and cross-laminated, fine-grained rocks of core 17, a i c h contain many whole and fragmented bivalves and gastropods, were probably deposited i n a marine shelf environment.
Sandstone porosity measurements from 8 sidewall cores range from 15.1 to 26.5 percent. Permeabilities, obtained for only three of these samples, range from 36 t o 164 mD. Sandstone porosities average 3 percent i n the 4 samples from core 15 and in the 9 samples from core 17. Porosities of 18 sandstone samples from core 16 average 7 percent. Penneabil i t i e s average 1.23 mD for the 18 samples from core 16 b u t are much 1 ower for samples from the other cores. Penneabil i t ies average 0.21 mD for the 4 samples from core 15 and 0.36 mD f o r the 9 samples from core 17.
The SP curve undulates gently, probably because of 1 ow porosity contrast among 1 i tho1 ogies in the interval. The gamma-ray 1 og does not exhibit any character that would permi t lithologic interpretation. Extensive washouts in the uppermost 60 feet made the resist ivi ty, density, and sonic logs unreliable
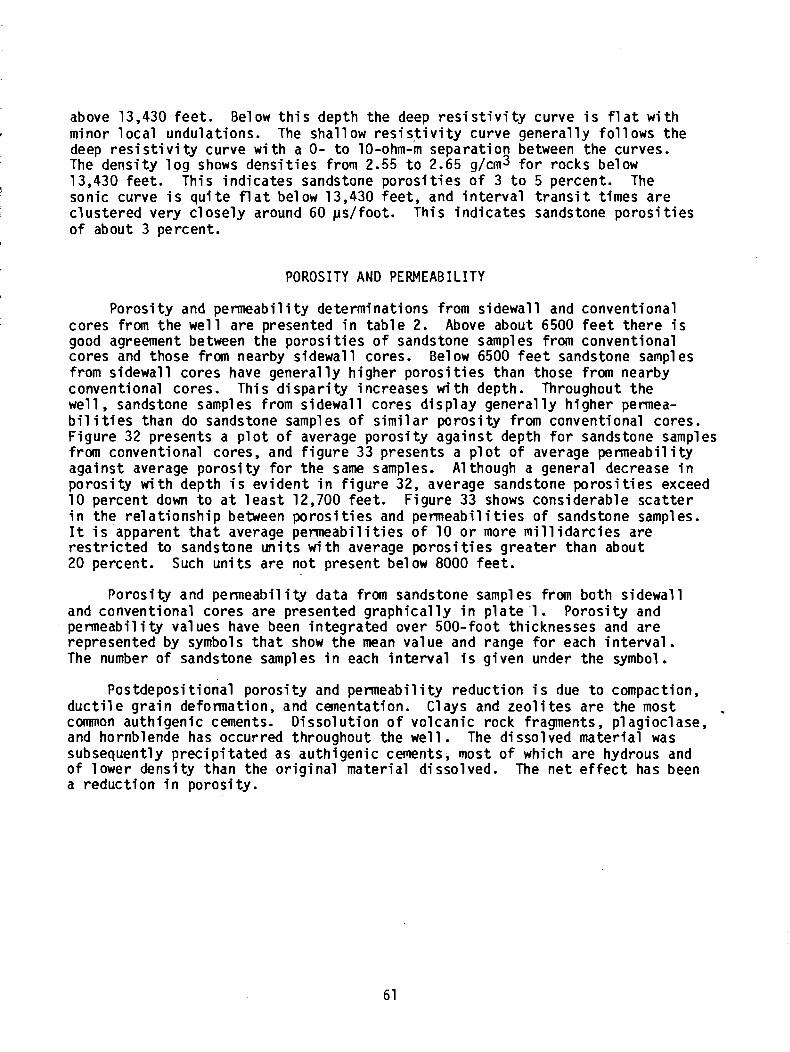
above 13,430 f e e t . Below t h i s depth the deep r e s i s t i v i t y curve i s f l a t w i t h , minor 1 ocal undulat ions. The sha l l ow r e s i s t i v i t y curve genera l ly f o l l ows the
deep r e s i s t i v i t y curve w i t h a 0- t o 10-ohm-m separa t ion between the curves. The dens i ty l o g shows dens i t i es from 2.55 t o 2.65 g/cm3 f o r rocks below 13,430 feet . This i nd i ca tes sandstone p o r o s i t i e s o f 3 t o 5 percent. The sonic curve i s q u i t e f l a t below 13,430 fee t , and i n t e r v a l t r a n s i t t imes a re c lus te red very c l o s e l y around 60 ps / foo t . This i n d i c a t e s sandstone p o r o s i t i e s o f about 3 percent.
POROSITY AND PERMEABILITY
Poros i ty and permeabi l i t y determinat ions from s idewal l and conventional cores from t h e we1 1 are presented i n t a b l e 2. Above about 6500 f e e t there i s good agreement between t h e p o r o s i t i e s o f sandstone samples from conventional cores and those from nearby s idewal l cores. Below 6500 f e e t sandstone samples from s idewal l cores have genera l ly h igher p o r o s i t i e s than those from nearby conventional cores. Thi s d i spar i ty increases w i t h depth. Throughout t h e we1 1 , sandstone samples from s idewal l cores d i s p l ay general l y h igher permea- b i l i t i e s than do sandstone sampl es of s i m i l a r p o r o s i t y from conventional cores. F igure 32 presents a p l o t o f average p o r o s i t y aga ins t depth f o r sandstone samples from conventional cores, and f i g u r e 33 presents a p l o t o f average permeabi l i t y against average po ros i t y f o r t he same samples. Although a general decrease i n p o r o s i t y w i t h depth i s ev iden t i n f i g u r e 32, average sandstone p o r o s i t i e s exceed 10 percent down t o a t l e a s t 12,700 feet . F igure 33 shows considerable s c a t t e r i n t h e re1 a t i o n s h i p between p o r o s i t i e s and penneabil i t i e s o f sandstone sampl es. It i s apparent t h a t average permeabil i t i e s of 10 o r more m i l l i d a r c i e s are r e s t r i c t e d to sandstone u n i t s w i t h average p o r o s i t i e s g rea te r than about 20 percent. Such u n i t s are no t present below 8000 fee t .
Poros i ty and permeabil i ty data from sandstone sampl es from both s idewal l and conventional cores are presented g raph ica l l y i n p l a t e 1. Poros i ty and penneabil i t y values have been in teg ra ted over 500-foot thicknesses and are represented by symbols t h a t show t h e mean value and range f o r each i n t e r v a l . The number o f sandstone sampl es i n each i n t e r v a l i s g iven under the symbol .
Postdeposi t i o n a l po ros i t y and permeabil i ty reduct ion i s due t o compaction, d u c t i l e g r a i n deformation, and cementation. Clays and z e o l i t e s are the most common auth igen ic cements. D isso lu t i on o f vo lcan ic rock fragments, p l ag ioc l ase, and hornblende has occurred throughout the we1 1 . The dissolved mate r ia l was subsequently p r e c i p i t a t e d as auth igen ic cements, most of which are hydrous and of lower densi ty than the o r i g i n a l mater ia l d issolved. The n e t e f f e c t has been a reduc t ion i n poros i ty .
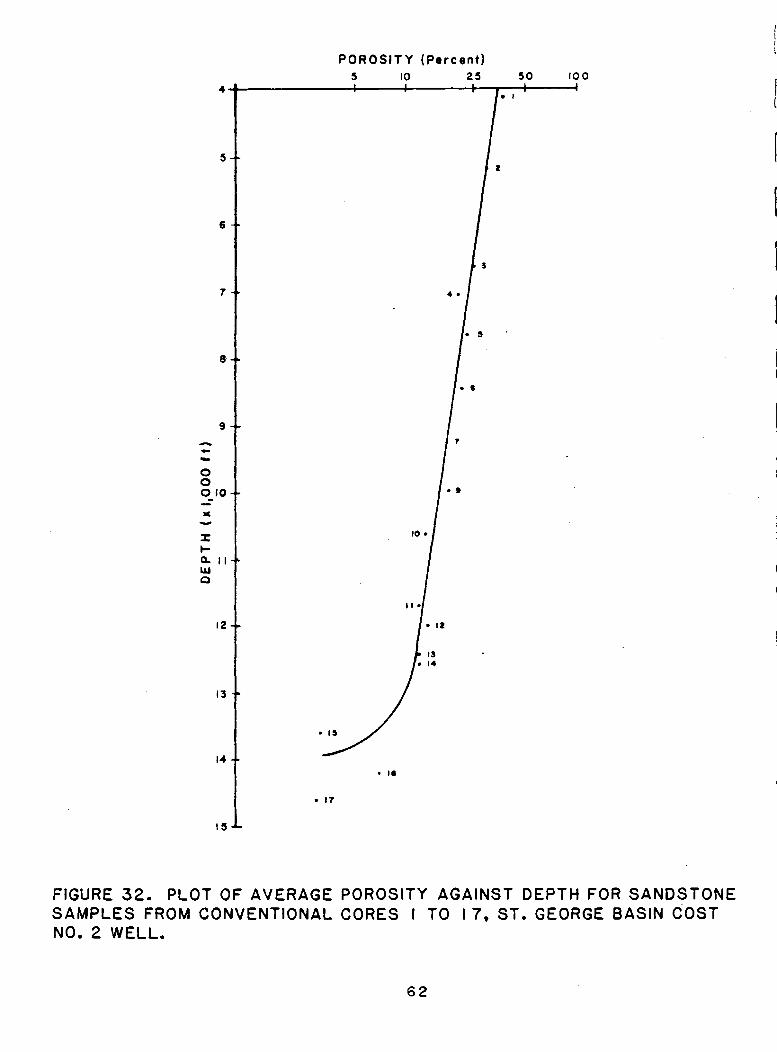
P O R O S I T Y ( P e r c e n t )
FIGURE 32. PLOT OF AVERAGE POROSITY AGAINST DEPTH FOR SANDSTONE SAMPLES FROM CONVENTIONAL CORES I TO 17, ST. GEORGE BASIN COST NO. 2 WELL.
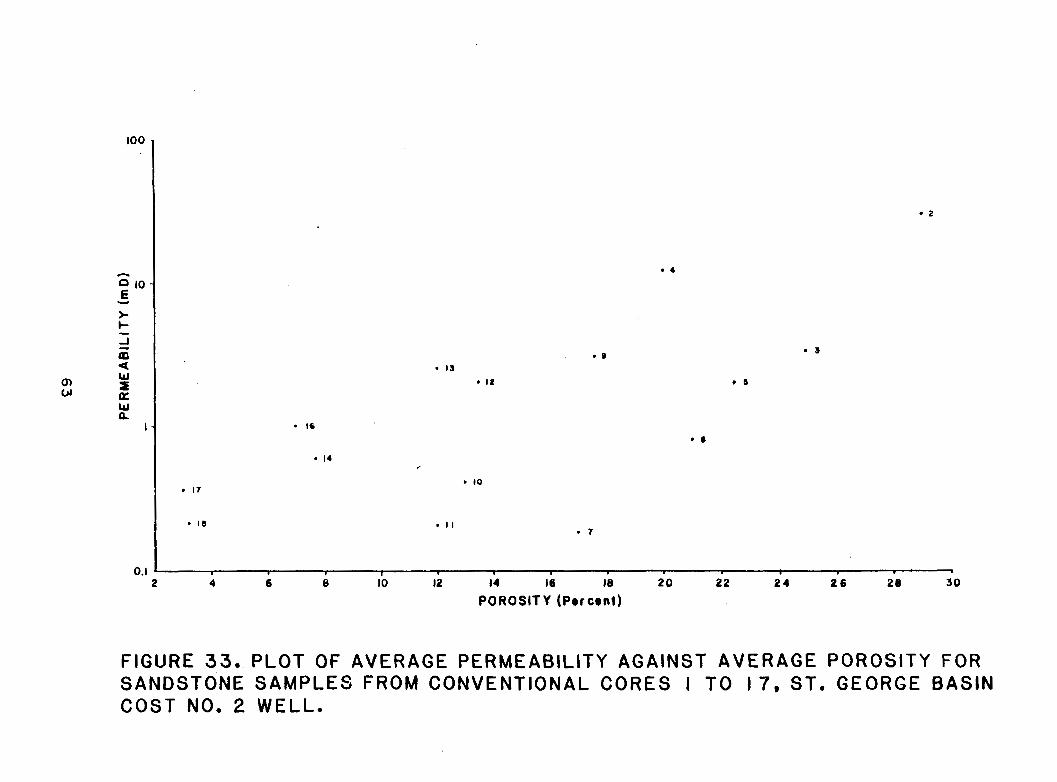
POROSITY (Porcont)
FIGURE 33. PLOT OF AVERAGE PERMEABILITY AGAINST AVERAGE POROSITY FOR SANDSTONE SAMPLES FROM CONVENTIONAL CORES I TO 17. ST. GEORGE BASIN COST NO. 2 WELL.
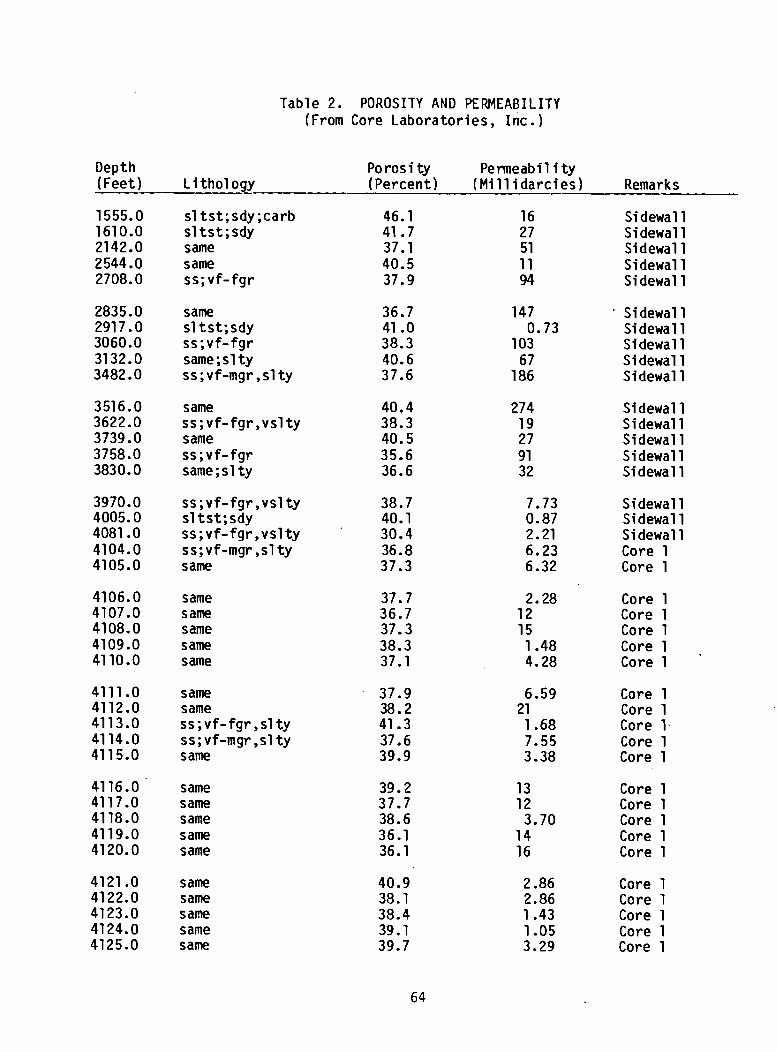
Table 2. POROSITY AND PERMEABILITY (From Core Laboratories, Inc . )
Depth (Feet L i tho1 oav
sl tst;sdy ;carb sl tst; sdy same same ss; vf-fgr
same sl tst;sdy ss;vf-fgr same;sl ty ss;vf-mgr ,sl ty
same ss;vf-fgr,vsl ty same ss;vf-fgr same;sl ty
ss;vf-fgr,vsl ty sl tst;sdy ss;vf-fgr,vsl ty ss;vf-mgr ,sl ty same
same same same same same
same same ss;vf-fgr ,sl ty ss;vf-mgr ,sl ty same
same same same same same
same same same same same
Porosi ty Peneabil i ty (Percent) (Mi 1 1 i darcies) Remarks
46.1 16 Si dewall 41.7 2 7 Sidewall 37.1 51 Sidewall 40.5 1 1 Sidewall 37.9 94 Sidewall
36.7 147 Si dewall 41 .O 0.73 Si dewall 38.3 103 Si dewall 40.6 6 7 Si dewall 37.6 186 Si dewall
40.4 274 Si dewall 35.3 19 Sidewall 40.5 27 Si dewall 35.6 91 Sidewall 36.6 32 Si dewall
7.73 Sidewall 0.87 Si dewall 2.21 Si dewall 6.23 Core 1 6.32 Core 1
37.7 2.28 Core 1 36.7 12 Core 1 37.3 15 Core 1 38.3 1.48 Core 1 37.1 4.28 Core 1
6.59 Core 1 21 Core 1 1.68 Core 1. 7.55 Core 1 3.38 Core 1
13 Core 1 12 Core 1 3.70 Core 1
14 Core 1 16 Core 1
2.86 Core 1 2.86 Core 1 1.43 Core 1 1.05 Core 1 3.29 Core 1
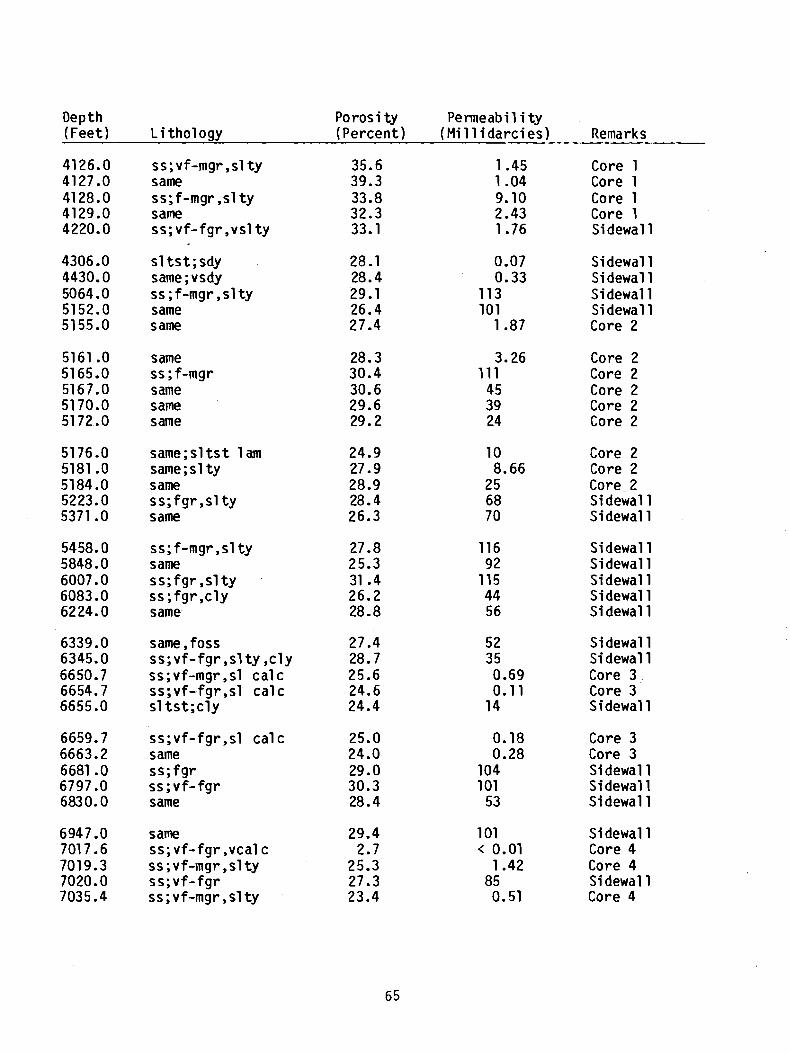
Depth (Feet)
Po ros i ty Permeabil i ty (Percent) (Millidarcies) Remarks Lithology
ss;vf-mgr,sl ty same ss;f-mgr ,sl ty same ss;vf-fgr,vsl ty
Core 1 Core 1 Core 1 Core 1 Sidewall
sl tst;sdy same ; vsdy ss ; f -mgr , sl ty same same
Sidewall Si dewall Sidewall Si dewall Core 2
Core 2 Core 2 Core 2 Core 2 Core 2
same ss ; f-mgr same same same
same;sltst lam same;sl ty same ss;fgr,sl ty same
Core 2 Core 2 Core. 2 Si dewall Sidewall
Sidewall Sidewall Sidewall Sidewall Sidewall
ss; f-mgr ,sl ty same ss;fgr,sl ty ss;fgr ,cly same
same, foss ss;vf-fgr ,sl ty ,cly ss;vf-mgr,sl calc ss;vf-fgr,sl cal c sl tst;cly
Sidewall Si dewall Core 3 Core 3 Si dewall
ss;vf-fgr,sl calc same ss; f gr ss; vf-fgr same
Core 3 Core 3 Si dewall Sidewall Sidewall
Sidewall Core 4 Core 4 Si dewall Core 4
same ss; vf-fgr ,vcal c ss; vf-mgr ,sl ty ss;vf-fgr ss;vf-mgr,sl ty
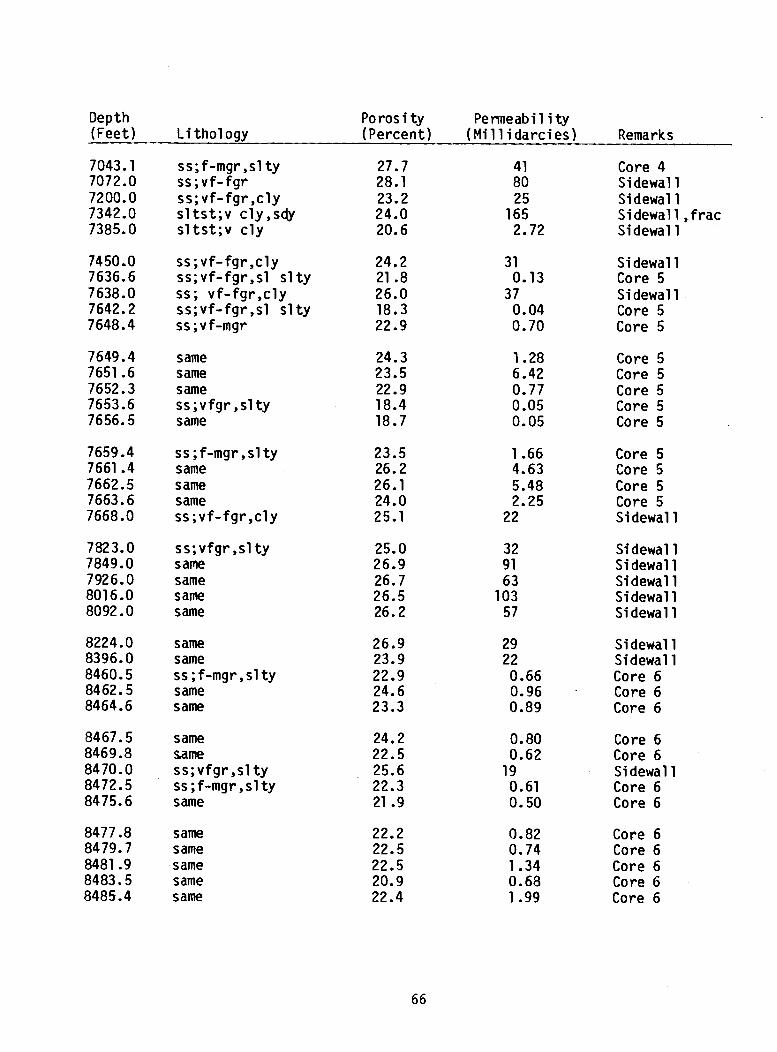
Depth (Feet)
Po ros i ty Permeabil i ty Li tho1 ogy (Percent) (Mil 1 idarcies) Remarks
ss;f-mgr,sl ty 27.7 4 1 Core 4 ss;vf-fgr 28.1 80 Si dewall ss; vf-fgr ,cly 23.2 25 Sidewall sl tst;v cly,sdy 24.0 165 Si dewall , frac s1tst;v cly 20.6 2.72 Sidewall
ss;vf-fgr ,cly 24.2 3 1 Si dewall ss;vf-fgr,sl sl ty 21 .8 0.13 Core 5 ss; vf-fgr,cly 26.0 3 7 Si dewall ss;vf-fgr ,sl sl ty 18.3 0.04 Core 5 ss ;vf-mgr 22.9 0.70 Core 5
same same same ss;vfgr ,sl ty same
24.3 1.28 Core 5 23.5 6.42 Core 5 22.9 0.77 Core 5 18.4 0.05 Core 5 18.7 0.05 Core 5
ss ;f-mgr ,sl ty 23.5 1.66 Core 5 same 26.2 4.63 Core 5 same 26.1 5.48 Core 5 same 24.0 2.25 Core 5 ss;vf-fgr,cly 25.1 22 Si dewall
ss;vfgr ,sl ty 25.0 32 Sidewall s a m 26.9 91 Si dewall same 26.7 6 3 Sidewall same 26.5 103 Si dewall same 26.2 5 7 Sidewall
same 26.9 29 Sidewall same 23.9 2 2 Sidewall ss ; f-mgr , sl ty 22.9 0.66 Core 6 same 24.6 0.96 . Core 6 same 23.3 0.89 Core 6
same 24.2 0.80 Core 6 same 22.5 0.62 Core 6 ss;vfgr,sl ty . 25.6 19 Si dewall ss;f-mgr,sl ty 22.3 0.61 Core 6 same 21.9 0.50 Core 6
same same same same same
0.82 Core 6 0.74 Core 6 1.34 Core 6 0.68 Core 6 1.99 Core 6
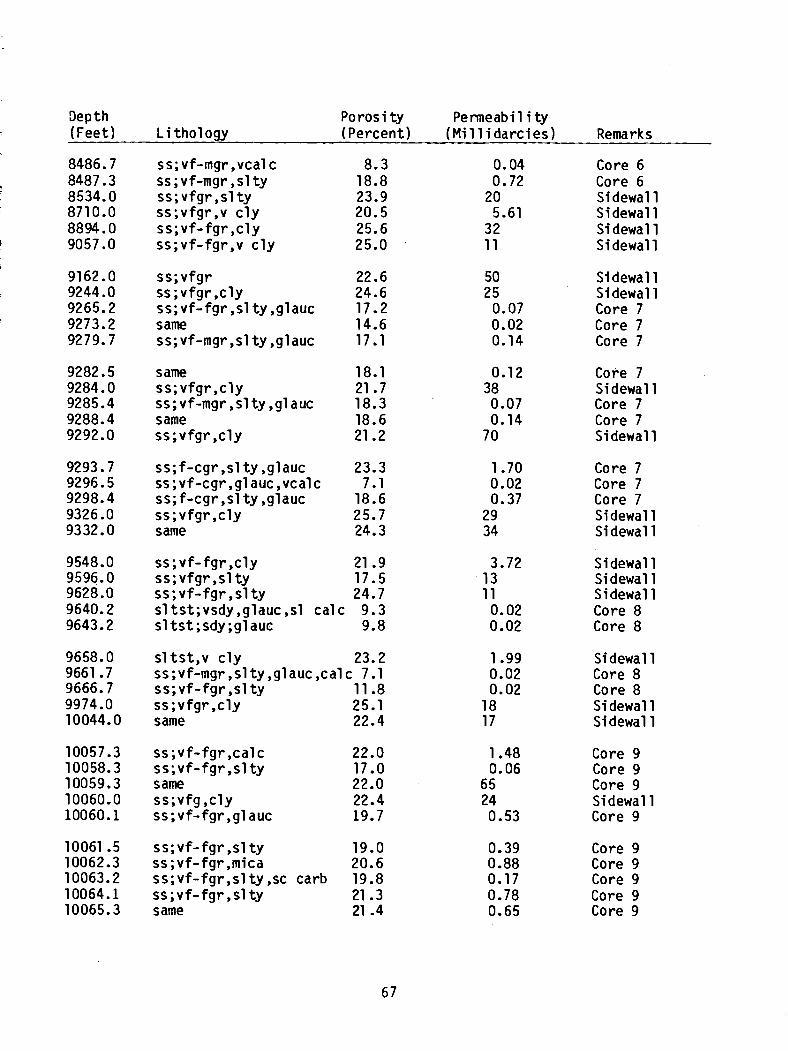
Depth (Feet)
Po ros i ty Permeabil i ty L i tho1 ogy (Percent) (Mil 1 idarcies)
ss;vf-mgr,vcal c 8.3 0.04 ss ; vf-mgr , sl ty 18.8 0.72 ss;vfgr,sl ty 23.9 20 ss;vfgr,v cly 20.5 5.61 ss;vf-fgr ,cly 25.6 32 ss;vf-fgr,v cly 25.0 . 1 1
ss;vfgr 22.6 50 ss ;vfgr ,cly 24.6 25 ss;vf-fgr ,sl ty ,glauc 17.2 0.07 same 14.6 0.02 ss;vf-mgr ,sl ty ,glauc 17.1 0.14
same 18.1 0.12 ss;vfgr,cly 21 .7 38 ss;vf-mgr ,sl ty ,glauc 18.3 0.07 same 18.6 0.14 ss;vfgr ,cly 21.2 70
ss;f-cgr,sl ty ,glauc 23.3 1.70 ss;vf-cgr ,gl auc,vcalc 7.1 0.02 ss;f-cgr,sl ty ,glauc 18.6 0.37 ss;vfgr ,cly 25.7 2 9 same 24.3 34
ss;vf-fgr ,cly 21.9 3.72 ss;vfgr,sl ty 17.5 13 ss;vf-fgr ,sl ty 24.7 1 1 sltst;vsdy,glauc,sl calc 9.3 0.02 sl tst ;sdy ;gl auc 9.8 0.02
sltst,v cly 23.2 1.99 ss;vf-mgr,slty,glauc,calc 7.1 0.02 ss;vf-fgr ,sl ty 11.8 0.02 ss;vfgr ,cly 25.1 18 same 22.4 17
ss;vf-fgr ,cal c 22.0 1.48 ss;vf-fgr,sl ty 17.0 0.06 same 22.0 65 ss;vfg ,cly 22.4 2 4 ss;vf-fgr,gl auc 19.7 0.53
ss;vf-fgr ,sl ty 19.0 0.39 ss;vf-fgr ,mica 20.6 0.88' ss;vf-fgr,sl ty ,sc carb 19.8 0.17 ss;vf-fgr,slty 21.3 0.78 same 21 .4 0.65
Remarks
Core 6 Core 6 Sidewall Sidewall Si dewall Si dewall
Si dewall Si dewall Core 7 Core 7 Core 7
Core 7 Sidewall Core 7 Core 7 Si dewall
Core 7 Core 7 Core 7 Si dewall Si dewall
Sidewall Sidewall S i dewall Core 8 Core 8
Si dewall Core 8 Core 8 Si dewall Sidewall
Core 9 Core 9 Core 9 Sidewall Core 9
Core 9 Core 9 Core 9 Core 9 Core 9
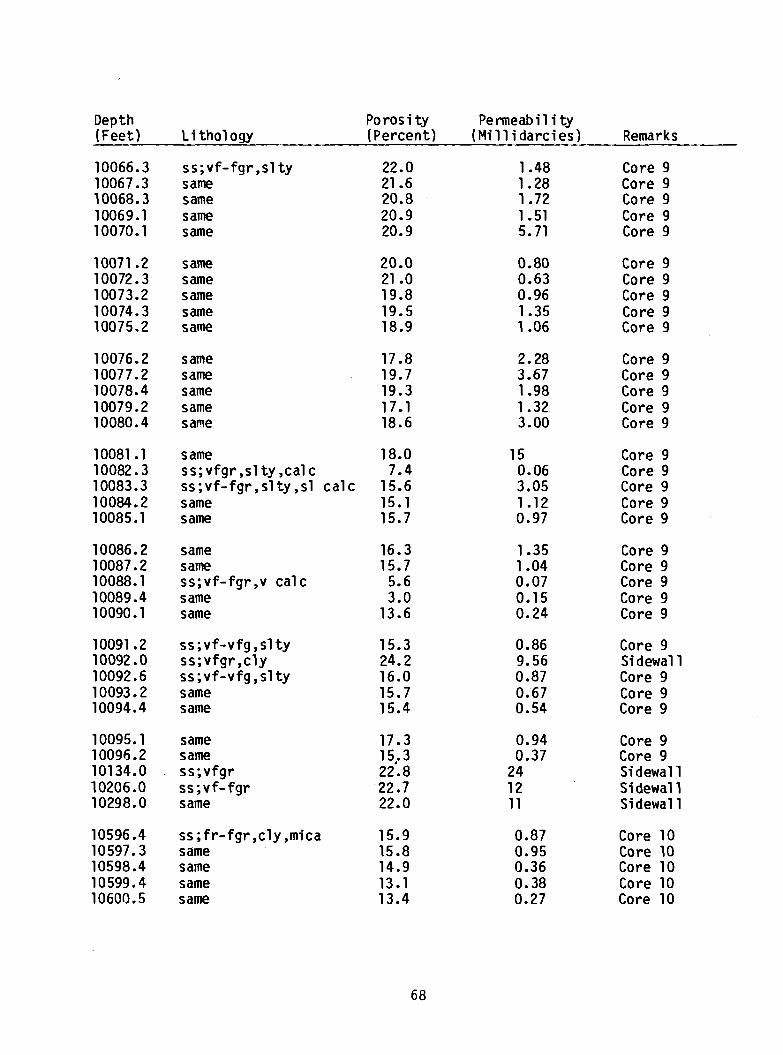
Depth Po ros i ty Permeabil i ty (Feet) L i tho1 ogy (Percent) (Mi 1 1 i darcies) Remarks
ss;vf-fgr,sl ty same same same same
Core 9 Core 9 Core 9 Core 9 Core 9
Core 9 Core 9 Core 9 Core 9 Core 9
s a m same s ame same same
same same same same same
Core 9 Core 9 Core 9 Core 9 Core 9
Core 9 Core 9 Core 9 Core 9 Core 9
s ame ss;vfgr,sl ty,calc ss;vf-fgr,slty,sl calc same same
same same ss;vf-fgr ,v cal c same same
Core 9 Core 9 Core 9 Core 9 Core 9
ss;vf-vfg ,sl ty ss;vfgr ,cly ss;vf-vfg ,sl ty same same
Core 9 Si dewall Core 9 Core 9 Core 9
Core 9 Core 9 Si dewall Si dewall Sidewall
same same ss;vfgr ss;vf- fgr same
ss ;fr-fgr ,cly ,mica same same same same
Core 10 Core 10 Core 10 Core 10 Core 10
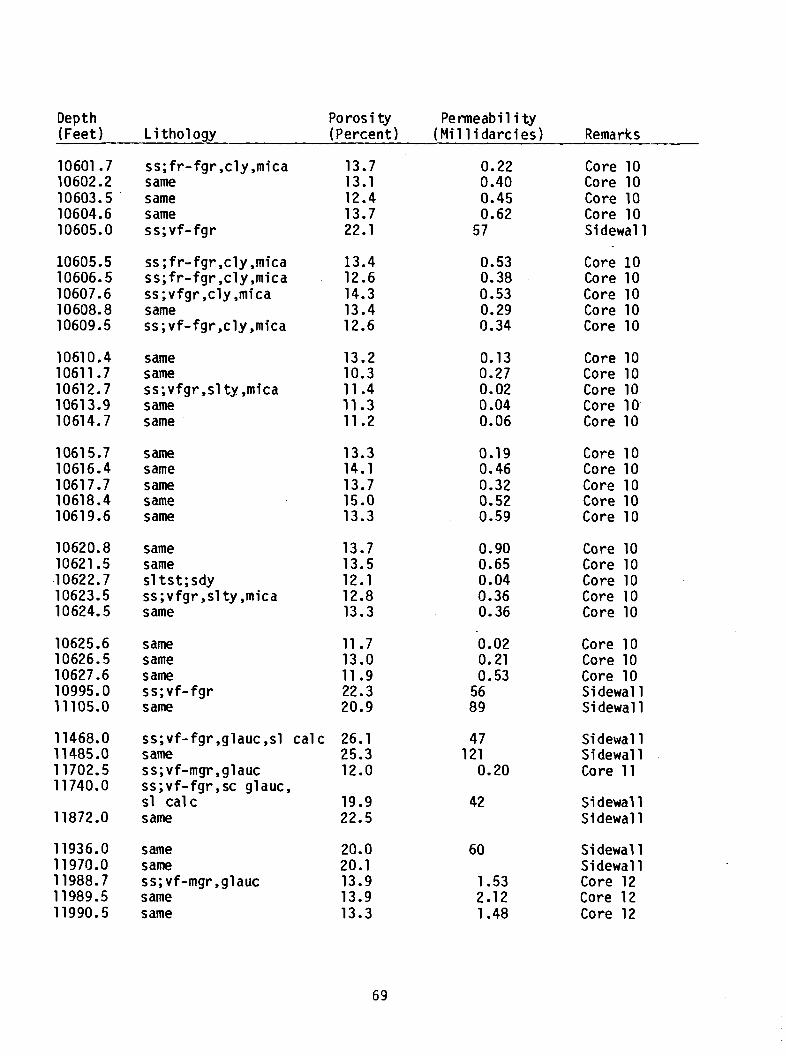
Depth (Feet 1
Po ros i ty Permeabil i ty (percent) (Mi 1 1 i darcies) Remarks
ss;fr-fgr ,cly,mica same same same ss;vf-fgr
Core 10 Core 10 Core 10 Core 10 Sidewall
Core 10 Core 10 Core 10 Core 10 Core 10
ss ;fr-fgr,cly,mica ss;fr-fgr,cly,mica ss;vfgr ,cly ,mica same ss;vf-fgr,cly ,mica
Core 10 Core 10 Core 10 Core 10' Core 10
same s ame ss;vfgr,sl ty ,mica same same
Core 10 Core 10 Core 10 Core 10 Core 10
s ame same same same same
Core 10 Core 10 Core 10 Core 10 Core 10
same same sl tst;sdy ss;vfgr ,sl ty ,mica same
same same same ss;vf-fgr same
Core 10 Core 10 Core 10 Si dewall Si dewall
ss;vf-fgr,glauc ,sl cal c same ss;vf-mgr,glauc ss;vf-fgr,sc glauc, sl cal c same
Sidewall Si dewall Core 1 1
Si dewall Sidewall
Si dewall Sidewall Core 12 Core 12 Core 12
same same ss;vf-mgr,glauc same same
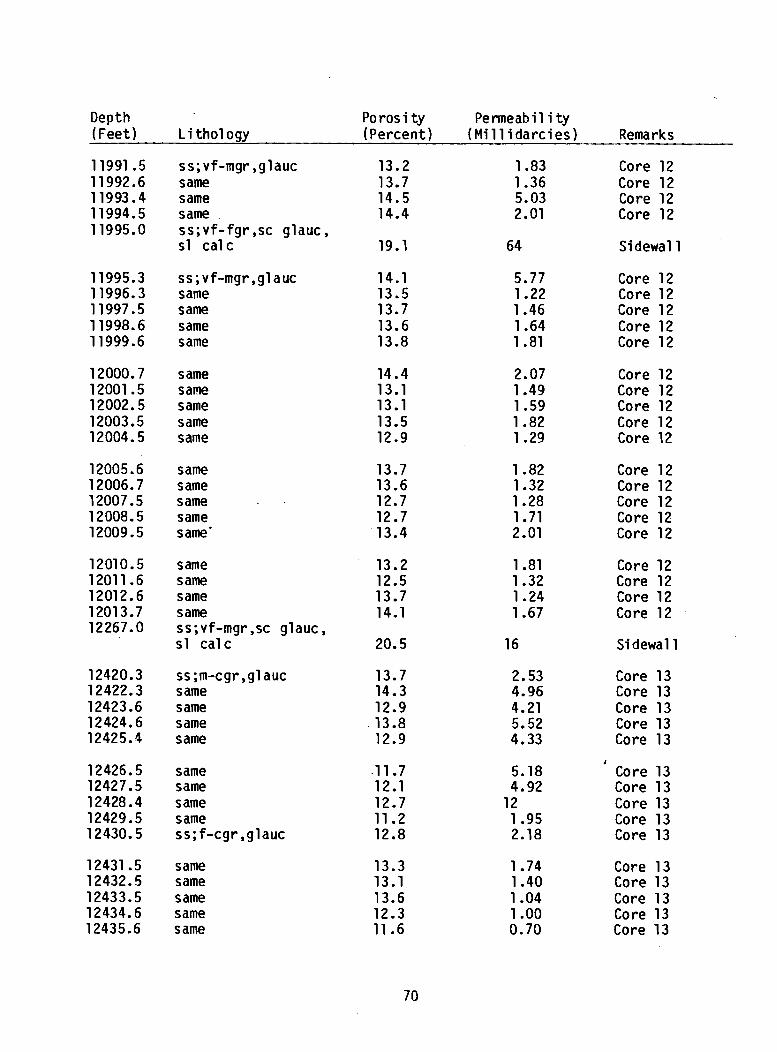
Depth Po ros i ty Permeabil i ty (Feet) L i tho1 ogy (Percent) (Mi 1 1 i darci es) Remarks
11991.5 ss;vf-mgr ,glauc 13.2 1.83 Core 12 11992.6 same 13.7 1.36 Core 12 11993.4 same 14.5 5.03 Core 12 11994.5 same 14.4 2.01 Core 12 11995.0 ss;vf-fgr ,sc glauc,
sl calc 19.1 64 Sidewall
11995.3 ss;vf-mgr,glauc 14.1 11996.3 same 13.5 11997.5 same 13.7 11998.6 same 13.6 11999.6 same 13.8
5.77 Core 12 1.22 Core 12 1.46 Core 12 1.64 Core 12 1.81 Core 12
same same same same same
Core 12 Core 12 Core 12 Core 12 Core 12
Core 12 Core 12 Core 12 Core 12 Core 12
same same same same same'
same s ame same same ss;vf-mgr ,sc glauc, sl cal c
Core 12 Core 12 Core 12 Core 12
Sidewall
ss;m-cgr ,gl auc same same same same
Core 13 Core 13 Core 13 Core 13 Core 13
I
Core 13 Core 13 Core 13 Core 13 Core 13
same same same same ss;f-cgr ,glauc
same same same same same
Core 13 Core 13 Core 13 Core 13 Core 13
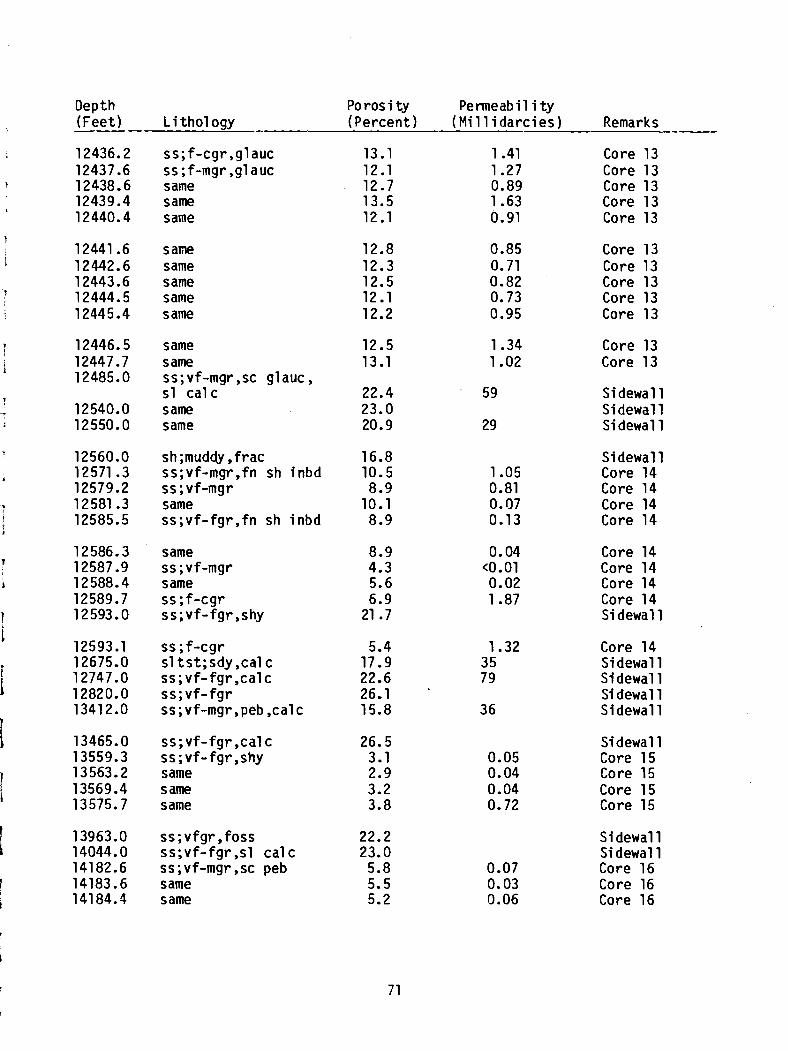
Depth (Feet)
Po ros i ty Pemeabil i ty Li tho1 ogy (Percent) (Mil 1 idarcies)
ss;f-cgr,glauc 13.1 1.41 ss;f-mgr,gl auc 12.1 1.27 same 12.7 0.89 same 13.5 1.63 same 12.1 0.91
s a m same same same s ame
same 12.5 1.34 s a m 13.1 1.02 ss;vf-mgr,sc glauc , sl cal c 22.4 5 9 same 23.0 same 20.9 29
sh;muddy ,frac 16.8 ss;vf-mgr,fn sh inbd 10.5 1.05 ss; vf-mgr 8.9 0.81 same 10.1 0.07 ss;vf-fgr,fn sh inbd 8.9 0.13
same 8.9 0.04 ss;vf-mgr 4.3 <O. 01 same 5.6 0.02 ss ; f -cgr 6.9 1.87 ss;vf-fgr,shy 21 .7
ss ; f-cgr 5.4 1.32 sl tst;sdy ,cal c 17.9 3 5 ss;vf-fgr ,cal c 22.6 79 ss;vf-fgr 26-1 ss;vf-mgr ,peb ,cal c 15.8 36
ss;vf-fgr,cal c 26.5 ss;vf-fgr ,shy 3.1 0.05 same 2.9 0.04 s ame 3.2 0.04 same 3.8 0.72
ss;vfgr,foss 22.2 ss;vf-fgr ,sl cal c 23.0 ss;vf-mgr,sc peb 5.8 0.07 same 5.5 0.03 same 5.2 0.06
Remarks
Core 13 Core 13 Core 13 Core 13 Core 13
Core 13 Core 13 Core 13 Core 13 Core 13
Core 13 Core 13
Sidewall Si dewall Si dewall
Si dewall Core 14 Core 14 Core 14 Core 14
Core 14 Core 14 Core 14 Core 14 Si dewall
Core 14 Si dewall Sidewall Si dewall Sidewall
Sidewall Core 15 Core 15 Core 15 Core 15
Si dewall Si dewall Core 16 Core 16 Core 16
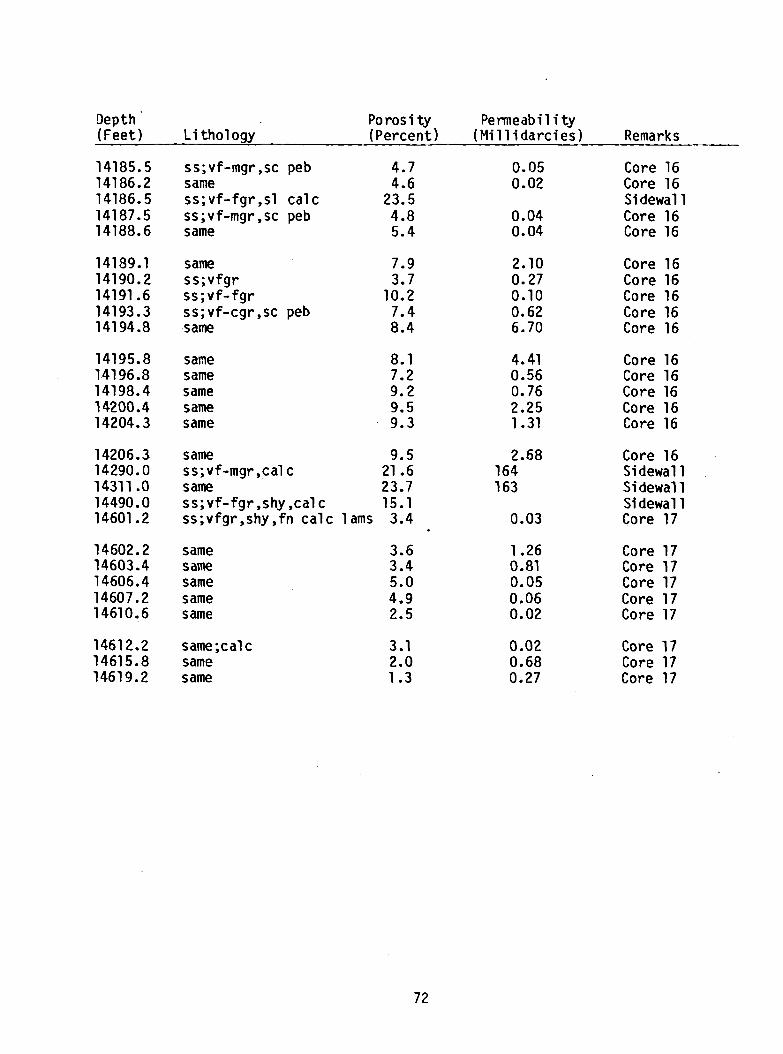
Depth ' (Feet)
Porosj ty Permeabil i ty L i tho1 ogy (Percent) ( M i l l i d a r c i e s ) Remarks
ss;vf-mgr,sc peb 4.7 0.05 Core 16 same 4.6 0.02 Core 16 ss;vf-fgr,sl ca l c 23.5 S i dewal l ss;vf-mgr,sc peb 4.8 0.04 Core 16 same 5.4 0.04 Core 16
same 7.9 2.10 Core 16 ss;vfgr 3.7 0.27 Core 16 ss ;v f - fg r 10.2 0.10 Core 16 ss; vf-cgr ,sc peb 7.4 0.62 Core 16 same 8.4 6.70 Core 16
same same same s ame same
8.1 4.41 Core 16 7.2 0.56 Core 16 9.2 0.76 Core 16 9.5 2.25 Core 16 9.3 1.31 Core 16
same 9.5 2.68 Core 16 ss;vf-mgr,cal c 21.6 164 Sidewal l s ame 23.7 163 S i dewall ss;vf-fgr,shy,cal c 15.1 S i dewal l ss;vfgr,shy,fn c a l c 1 ams 3.4 0.03 Core 17
same s ame same same same
same;cal c same same
3.6 1.26 Core 17 3.4 0.81 Core 17 5.0 0.05 Core 17 4.9 0.06 Core 17 2.5 0.02 Core 17
3.1 0.02 Core 17 2.0 0.68 Core 17 1.3 0.27 Core 17
ORGANIC GEOCHEMISTRY BY
Tabe 0. F l e t t
I NTROD UCT ION
The organic geochemical program f o r the S t . George Basin COST No. 2 we1 1 was designed t o evaluate the petroleum po ten t ia l o f rocks i n the eastern reg ion o f the S t . George Basin. A deta i led ana ly t ica l program was recanmended and ca r r i ed ou t by Robertson Research (U.S.), Inc., and was approved, w i th modi f i ca t ions , by At1 an t i c R ich f ie l d Company (ARCO) , who acted as operator on behal f o f the par t ic ipants . ARCO also authorized a prel iminary geochemical evaluat ion t h a t was performed by Explorat ion Logging (USA), Inc. (Exlog). A l l organic geochemical analyses reported f o r the No. 2 wel l are summarized by Dow (1982) and by Russ (1982). A l l depths are measured r e l a t i v e to the Ke l l y Bushing, which was 77 f ee t above mean sea 1 eve1 and 452 f ee t above the sea f l o o r .
Samples selected by ARCO and sent to Robertson Research (U.S. ) , Inc., included canned cu t t ings co l lec ted a t 60-foot in te rva ls , sidewall cores taken a t approximately 100-foot i n t e r va l s, and representat ive p l ugs and chips from 16 conventional cores. Robertson Research d i d no t receive any samples from core 11 (1 1,702 t o 11,741 feet ) , from which there was 1 i ttl e recovery.
Headspace gas from canned cu t t ings was analyzed f o r C1-Cg+. The cu t t i ngs were then washed, described, and a representat ive sample analyzed f o r t o t a l organic carbon (TOC). Samples w i th a TOC o f greater than 0.3 weight percent were analyzed wi th Rock-Eva1 py ro lys i s (hereaf ter re fe r red t o as py ro lys is ) . Sidewall and conventional core samples were also analyzed f o r TOC and w i t h pyro lys is . F i n a l l y , sampl es were selected from cut t ings, sidewall cores, and conventional cores a t approximately 300-foot i n t e r va l s f o r kerogen is01 at ion, v i t r i n i t e re f lec tance (Ro), spore co lo ra t ion index (SCI 1 , and e l emental analysis. Soxhl e t extract ion, e l u t i o n chromatography, and saturate- f rac t ion gas chromatography were performed upon conventional core samples.
The study completed by Explorat ion Logging (USA), Inc., inc luded TOC and py ro l ys i s analyses o f cut t ings, conventional cores, and mud samples to the t o t a l depth o f 14,626 feet . Headspace gas was analyzed t o 9620 feet . The resu l t s o f these analyses agree favorably w i th data obtained by Robertson Research. Explorat ion Logging data are p l o t t e d ( p l . 2) a t about 500-foot i n t e r v a l s t o ind ica te the rep roduc ib i l i t y o f the measurements.
GEOTHERMAL GRADIENT
The apparent mean geothermal gradient f o r the No. 2 wel l , 1.47OF per 100 feet , was computed from raw data co l lec ted during l og run 3 by Schlumberger, Ltd., on August 23, 1982, and i s p l o t t ed i n f i g u r e 34. This average value i s canputed f o r the in te rva l between 1000 and 14,626 feet , where the maximum recorded temperature was 1 ogged 10.5 hours a f t e r cessation o f c i r cu l a t i on .
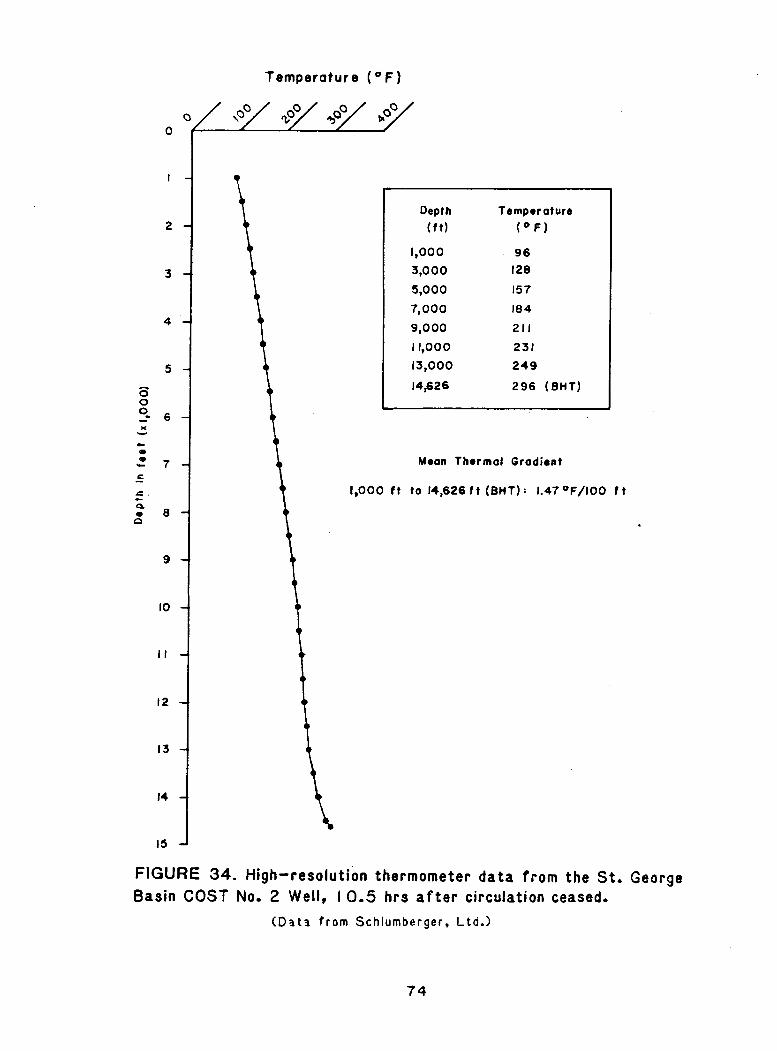
Temperature (OF)
Depth Temporoture
( f t ) ( O F )
1,000 9 6
3,000 128
5,000 157
7,000 184
9,000 211
11,000 231
13,000 249
14,626 296 ( B H T )
FIGURE 34. High-resolution thermometer d a t a f rom the St. George Basin COST No. 2 Well, 1 0.5 hrs a f t e r circulation ceased.
(Data f r o m Schlumberger , Ltd.1
ORGANIC CARBON
Total organic carbon content from s idewal l and conventional cores i s recorded on p l a t e 2 a1 ong w i t h sample descr ip t ions . TOC values f o r c u t t i n g s as wel l as s idewal l and conventional cores appear on p l a t e 1 . Organic carbon i s n o t abundant i n the No. 2 we1 1 . TOC values are general l y 1 ess than 0.5 percent w i t h the exception o f the i n t e r v a l s between 5000 and 7000 f e e t and between 7800 and 10,500 fee t , where TOC i s f requen t l y between 0.5 and 1.0 percent and i n a few instances i n excess o f 1.0 percent. The h igher values tend t o occur i n s i l t s t o n e and occasional l y i n f i ne-grained sandstones.
A minimum organic carbon content o f 0.5 percent i n shales i s genera l ly regarded as necessary t o generate o i l f o r a commercial accumulation (Hunt, 1979; T i s s o t and We1 te , 1978). Values i n excess o f 1 percent a re much b e t t e r because most rocks con ta in recycled organic mater ia l which i s carbonized and cannot produce petroleum. Also, a c r i t i c a l amount o f hydrocarbons must be present be fo re expu ls ion i s poss ib le because the s p e c i f i c adsorpt ion capac i ty o f t he source rock must f i r s t be s a t i s f i e d . F i n a l l y , s u f f i c i e n t hydrocarbons f o r movement o f a pressure-driven hydrocarbon phase have to be ava i lab le . The amount o f o rgan ic mat ter present i n the sec t ion penetrated by the No. 2 w e l l suggests t h a t the rocks a t t h i s l o c a t i o n are u n l i k e l y t o be a source f o r commerical amounts o f p e t r o l eum.
DESCRIPTION OF KEROGEN
Kerogen was examined i n r e f l e c t e d and t ransmi t ted l i g h t . Resul ts o f t h e re f l ec ted -1 i g h t petrography and t h e hydrogen-to-carbon r a t i o (H/C) from chemical analyses of t he kerogen are depicted i n f i g u r e 35.
Three petrographic classes o f kerogen, p l u s amorphous mate r ia l , a subgroup w i t h i n t h e e x i n i t e o r l i p t i n i t e category, are repor ted i n t h i s study. They are:
1 . Amorphous (a1 gal o r s t ruc tu re less c o l l o i d a l mat ter ) 2. Ex in i t e (herbaceous, 1 i p i d - r i c h re1 i c s ) 3. V i t r i n i t e (woody and humic components) 4. I n e r t i n i t e (hard, carbon-r ich, nonreact ive, b r i t t l e p a r t i c l e s )
Most o f t he kerogen examined from t h e No. 2 w e l l contained about 50 percent v i t r i n i t e . The experience of Robertson Research has been t h a t samples con ta in ing l e s s than 35 v isua l percent o f amorphous mate r ia l p l u s e x i n i t e genera l ly y i e l d o n l y d ry gas and t h a t o i l sources u s u a l l y con ta in over 65 percent o f these maceral types (Dow and O'Connor, 1982). Only one sample, con ta in ing coal , exceeded t h e 65 percent thresh01 d, and th ree add i t i ona l samples contained more than 35 percent o f t he amorphous kerogen alone. These samples are l i s t e d i n t a b l e 3. A l l are derived. from s i l t s tone o r sandstone, and a1 1 possess r e l a t i v e l y 1 ow organic carbon contents except f o r the coa l - bear ing s idewal l sample from 12,555 feet .
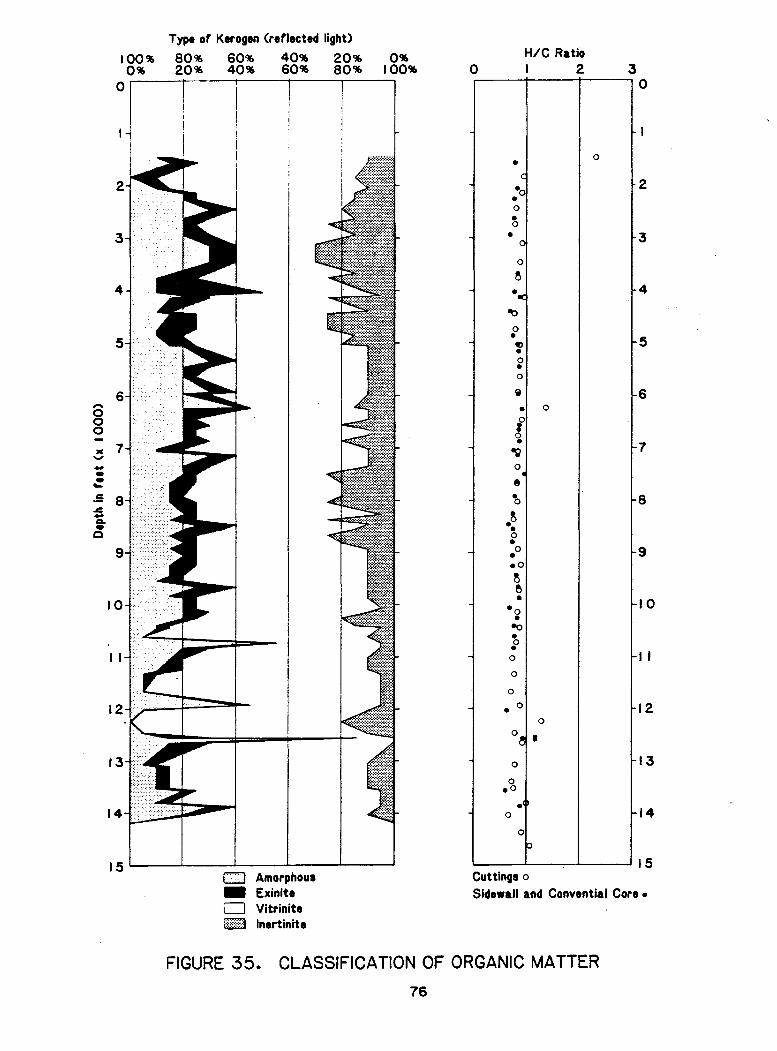
Type of Kerogsn (reflected light)
100% 80% 60% 40% 20% 0% 0% 20% 40% 60% 80% 100
H/C Ratio 0 I 2 3
2 - Amorphour Exinite
i Vitrinite I nert init e
Cuttings o
Sidewall and Convential Core
FIGURE 35. CLASSIFICATION OF ORGANIC MATTER
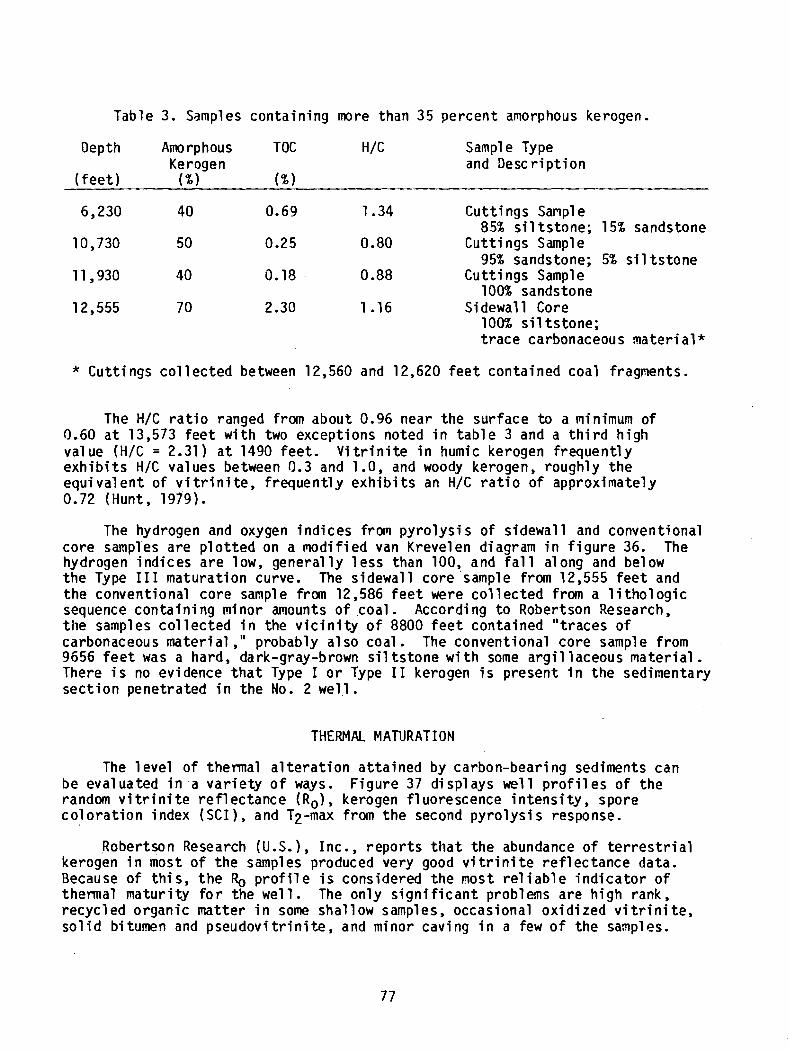
Table 3. Samples containing more than 35 percent amorphous kerogen.
Depth Amorphous T OC H/C Sainple Type Kerogen and Description
( f e e t ) ( % I ( % I
6,230 40 0.69 1.34 Cuttings Sanple 85% s i l tstone; 15% sandstone
10,730 50 0.25 0.80 Cuttings Sample 95% sandstone; 5% s i l t s t o n e
11,930 40 0.15 0.88 Cuttings Sample 100% sandstone
12,555 7 0 2.30 1.16 Si dewall Core 100% s i l t s tone; t race carbonaceous material*
* Cuttings col lected between 12,560 and 12,620 f e e t contained coal fragments.
The H/C r a t i o ranged from about 0.96 near the surface to a m i n i m u m of 0.60 a t 13,573 f ee t with two exceptions noted i n t ab le 3 and a t h i rd high value ( H / C = 2.31) a t 1490 f ee t . Vi t r in i te i n humic kerogen frequently exhibi ts H/C values between 0.3 and 1 . O , and woody kerogen, roughly the equivalent of v i trini t e , frequently exhib i t s an H/C r a t i o of approximately 0.72 ( H u n t , 1979).
The hydrogen and oxygen indices from pyrolysis of sidewall and conventional core samples a re plotted on a modified van Krevel en diagram i n f igure 36. The hydrogen indices a r e low, generally 1 ess than 100, and fa1 1 along and below the Type I11 maturation curve. The sidewall core sample from 12,555 f e e t and the conventional core sample from 12,586 f e e t were col lected from a l i tho log ic sequence containi ng m i nor amounts of coal . Accordi ng t o Robertson Research, the samples collected i n the vic ini ty of 8800 f e e t contained " t races of carbonaceous materi a1 ," probably a1 so coal. The conventional core sample from 9656 f e e t was a hard, dark-gray-brown s i l t s t o n e w i t h some argil laceous material . There i s no evidence t h a t Type I o r Type I1 kerogen i s present i n the sedimentary sect ion penetrated i n the No. 2 we1 1 .
THERMAL MATURATION
The 1 eve1 of thermal a l te ra t ion a t ta ined by carbon-bearing sediments can be evaluated i n a variety of ways. Figure 37 displays well profi l e s of the random v i trini t e ref1 ectance ( R o ) , kerogen f l uorescence intensi ty , spore colorat ion index (SCI) , and T2-max from the second pyrolysis response.
Robertson Research (U.S.), Inc., repor ts t h a t the abundance of t e r r e s t r i a l kerogen in most of the samples produced very good v i t r i n i t e reflectance data. Because of this, t h e R, prof i le is considered the most re1 i ab l e indicator of thermal maturity f o r the we1 1. The only s ign i f ican t problems are high rank, recycled organic matter i n some shall ow samples, occasional oxidized v i trini t e , so l id bitumen and pseudovi t r i n i t e , and minor caving i n a few of the samples.
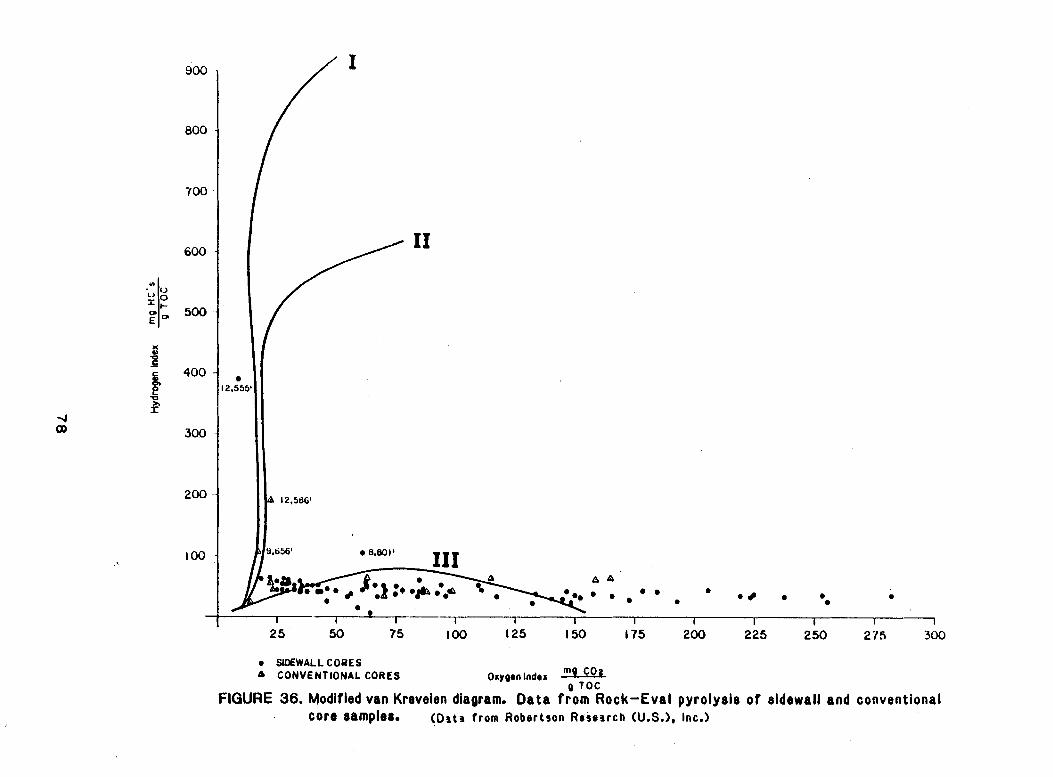
SDEWALL CORES a CONVENTIONAL CORES Oxyoan lndrx Cog
a T O C FIGURE 36. Modified van Kreveien diagram. D a t a f r o m Rock-Eval pyrolysis o f sidewall and conventional
Core 8 8 ~ ~ 1 8 8 . ( D a t a from Robertson Research (U.S.), Inc.)
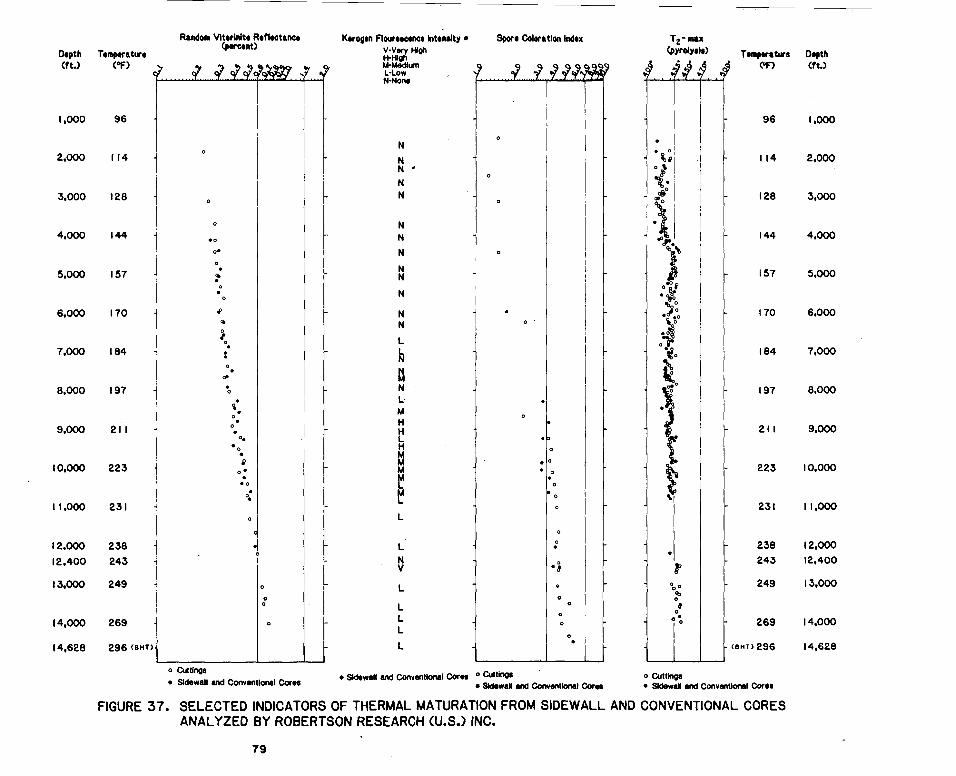
v-very Hl* H W q h KMQdlun
Oapth (tt.1
Oapth (tt.1
0 CuItlngB Sldewall and Conventlml Caes m w a l t and ~onvmt~onr~ cuu O Cult1w8 0 ~utttnga
SWwaY and Convmtknal Can Sldawal and Conventlonrl Cora8
FIGURE 37. SELECTED INDICATORS OF THERMAL MATURATION FROM SIDEWALL AND CONVENTIONAL CORES ANALYZED BY ROBERTSON RESEARCH (U.S.) INC.
It i s l i k e l y t h a t &, values from t h i s we l l do, i n f a c t , c o n s t i t u t e the most re1 i able i n d i c a t o r s o f t h e n a l ma tu r i t y , p a r t i c u l a r l y between 5000 and 11,000 feet . Data from t h i s i n t e r v a l , when p l o t t e d on a we1 1 p r o f i l e , produce a reasonably 1 i n e a r curve t h a t p r o j e c t s t o a minimal value of 1.8 o r 2.0 percent a t t he surface, which one would expect i f t h e e n t i r e sec t i on was deposited under cond i t ions o f e s s e n t i a l l y cont inuous depos i t i on w i t h no s i g n i f i c a n t per iods o f e ros ion (Dow, 1977). Representat ive Ro histograms f o r the i n t e r v a l s from the sur face t o 5000 fee t , from 5000 t o 11,000 fee t , and from 11,000 t o 14,010 f e e t a re reproduced i n f i g u r e 38.
The Ro measurement from the shal lowest sample p l o t t e d on f i g u r e 37 i s from c u t t i n g s c o l l e c t e d a t 1850 fee t . F igure 38a shows t h a t on l y two 4 measurements were ava i l ab le a t t h i s data po in t . They were apparent ly assumed t o represent two separate modes, and on ly t h e 1 ower val ue (0.23 percent ) was p lo t ted . Th is value agrees favorably w i t h t h e segments o f t h e Ro p r o f i l e p l o t t e d from more re1 i a b l e data. More observat ions were genera l ly a v a i l abl e f o r the o the r p o i n t s p lo t ted . Many mean R, values observed from t h e sur face t o 5000 f e e t were too h igh and were n o t p lo t ted . These samples probably c o n t a i n l a r g e amounts o f recyc led v i t r i n i t e .
The s idewal l core f r a n 8565 f e e t i s a textbook example o f excel l e n t Ro data ( f i g u r e 38b). The mean value p l o t t e d on the R0 p r o f i l e from t h i s popu la t ion i s 0.43 percent. F i f t y observat ions were made and t h e popu la t ion i s unimodal. A minimum o f 50 observat ions i s des i rab le f o r a s t a t i s t i c a l l y re1 i a b l e sample, b u t un for tunate ly the re i s o f t e n n o t enough v i t r i n i t e i n a kerogen sample t o y i e l d t h a t many observat ions.
The c u t t i n g s sample from 14,010 f e e t y i e l ded the deepest recorded va l ue f o r t he No. 2 w e l l ( f i g u r e 38c). Samples from greater depths were s tud ied by Robertson Research, b u t the mean !+, values f o r these samples are anomalously h i g h and probably represent recyc led ma te r ia l . The sample from 14,010 f e e t represents o n l y 18 observat ions, o f which 11 are be l i eved t o represent primary kerogen. The mean 4 value f o r these 11 values i s 0.73 percent. The broadening o f the histogram, t h a t i s t o say, t h e increase i n the standard dev ia t i on f o r t he populat ion, i s c h a r a c t e r i s t i c o f more mature kerogen. However, t h i s normal ly begins to occur a t an Ro o f 1 percent o r more (Hunt, 1979). The h igher 4 va l ues i n the popu la t ion may represent recycled mater ia l i n t h i s case, o r they cou ld represent a few members o f a s t a t i s t i c a l l y inadequate popu la t ion t h a t possesses a h ighe r mean value. Such an increase i n 4 cou ld be produced by the unconformi ty i n d i c a t e d on p l a t e 1 a t approximately 12,540 feet .
!+, values reach 0.6 percent, t h e . general l y recognized thresh01 d o f commercial o i l generat ion (Hunt, 19791, a t about 12,400 f e e t . The maximum mean value observed was 0.73 percent a t 14,010 fee t , we l l below t h e 1.35 percent th resho ld where l i q u i d hydrocarbons are be l ieved t o d e t e r i o r a t e t o gaseous hydrocarbons a t a s i g n i f i c a n t r a t e (Dow, 1982).
I n the No. 2 we1 1 , t h e i n t e n s i t y o f kerogen fl uorescence under r e f 1 ected l i g h t increases toward t h e t o p o f t h e o i l -genera t i on m a t u r i t y zone. This increase i s never very great , apparent ly because o f t he very poor o i l conver t i b i l i ty o f t h e kerogen. Higher 1 eve1 s o f f l uorescence i n t e n s i t y seem t o occur genera l l y where coal o r carbonaceous fragments have been observed i n the samples.
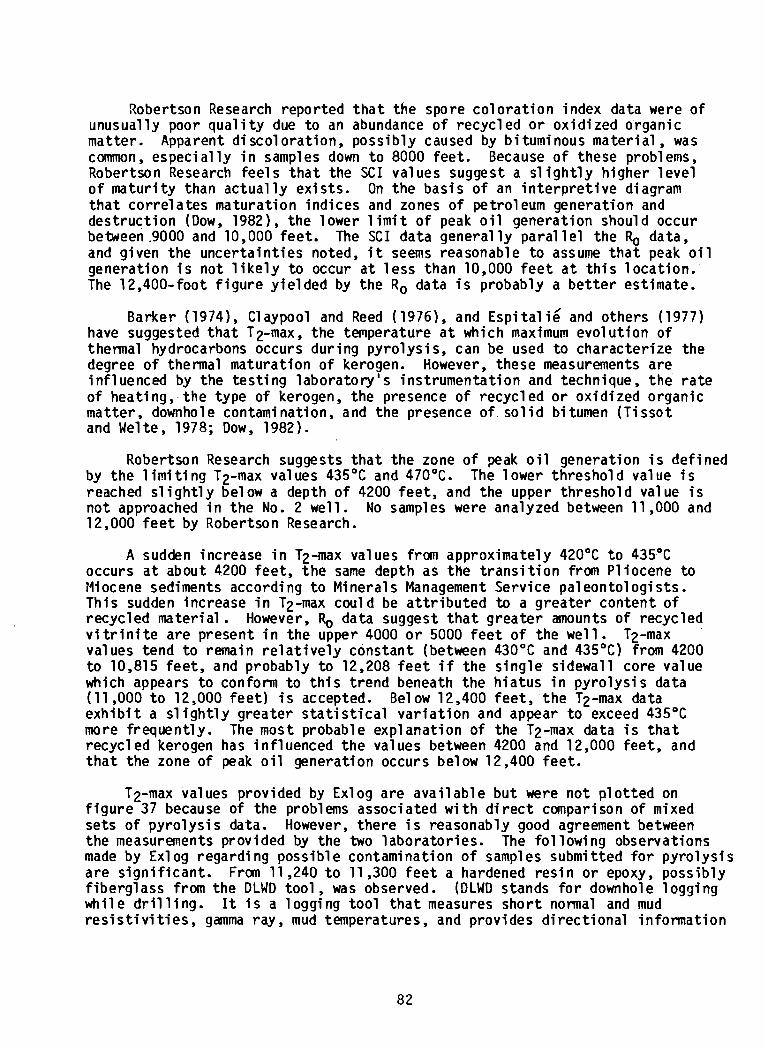
Robertson Research reported tha t the spore coloration index data were of unusually poor quality due to an abundance of recycled or oxidized organic matter. Apparent discoloration, possibly caused by bituminous material , was common, especially i n samples down to 8000 feet . Because of these problems, Robertson Research feels tha t the SCI values suggest a sl ightly higher level of maturity than actually exists. On the basis of an interpret ive diagram tha t correl a tes maturation indices and zones of petrol eum generation and destruction (Dow, 1982), the lower 1 imit of peak o i l generation should occur between -9000 and 10,000 fee t . The SCI data general ly para1 1 el the R, data, and given the uncertainties noted, i t seems reasonable to assume tha t peak o i l generation i s not l ike ly to occur a t l e s s than 10,000 f e e t a t t h i s location. The 12,400-foot figure yielded by the Ro data is probably a be t te r estimate.
Barker (19741, Claypool and Reed (1976), and Espital ie' and others (1977) have suggested tha t T2-max, the temperature a t which maximum evolution of thermal hydrocarbons occurs during pyrolysis, can be used to characterize the degree of thermal maturation of kerogen. However, these measurements are i nfl uenced by the t e s t i n g laboratory's instrumentation and technique, the ra te of heating, the type of kerogen, the presence of recycled o r oxidized organic matter, downhole contamination, and the presence of sol i d bitumen ( T i s so t and We1 t e , 1978; Dow, 1982).
Robertson Research suggests tha t the zone of peak o i l generation i s defined by the 1 i m i t i ng T2-max values 435°C and 470°C. The 1 ower thresh01 d value i s reached s l ight ly below a depth of 4200 f e e t , and the upper threshold value i s not approached i n the No. 2 well. No samples were analyzed between 11,000 and 12,000 f e e t by Robertson Research.
A sudden increase i n T2-max values from approximately 420°C t o 435OC occurs a t about 4200 fee t , the same depth as the t ransi t ion from Pliocene to Miocene sediments according to Minerals Management Service paleontologists. T h i s sudden increase i n T2-max could be at t r ibuted to a greater content of recycled material. However, data suggest t ha t greater amounts of recycled v i t r i n i t e a re present i n the upper 4000 o r 5000 f e e t of the well. T2-max values tend to remain relat ively constant (between 430°C and 435°C) from 4200 to 10,815 f e e t , and probably to 12,208 f e e t i f the single sidewall core value which appears to conform to t h i s trend beneath the hiatus i n pyrolysis data (11,000 to 12,000 f e e t ) is accepted. Below 12,400 f e e t , the T2-max data exhibit a sl ightly greater s t a t i s t i c a l variation and appear to exceed 435°C more frequently. The most probable explanation of the T2-max data i s t h a t recycled kerogen has influenced the values between 4200 and 12,000 fee t , and tha t the zone of peak o i l generation occurs below 12,400 fee t .
T2-max values provided by Exlog are available b u t were not plotted on f igure 37 because of the problems associated w i t h d i r ec t comparison of mixed se ts of pyrolysis data. However, there i s reasonably good agreement between the measurements provided by the two 1 aboratories. The fol 1 owi ng observations made by Ex1 og regardi ng possible contamination of sarnpl es submitted for pyrolysis a re significant. Fran 11,240 t o 11,300 f e e t a hardened resin or epoxy, possibly fiberglass from the DLWD tool , was observed. (DLWD stands for downhole logging w h i l e dr i l ling. I t i s a 1 oggi ng tool tha t measures short normal and mud r e s i s t i v i t i e s , gamma ray, mud temperatures, and provides directional information
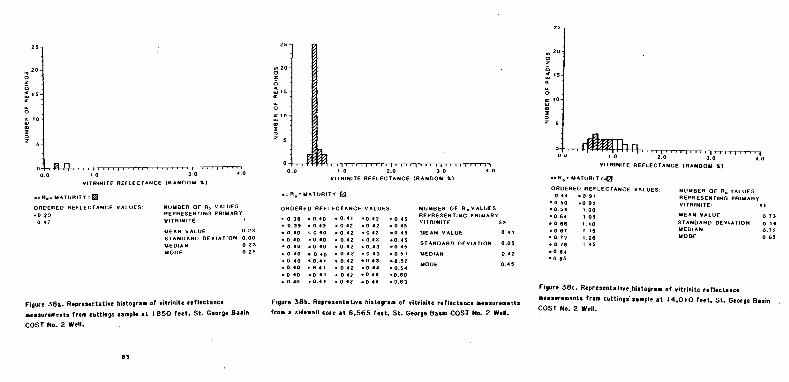
O R D E R E D R E F L E C T A N C E Y A L U E S N U M B E R O F R, VALUES rO 23 REPRESENTING P R I U A R Y
0 1 7 V l T R l l l l T E
U E A W V A L U E 0 . 2 1 STAWOARO D E V I A T I O N 0 00 M E D I A N 0 23 M O D E 0 25
Figure 381 . Representative histogram o f r i t r i n i t c re f lec tance
mcatursmentr from cut t ings sample a t 1 8 5 0 feet, St . George Basin
COST No. 2 Well.
O R D E R E D R E F L E C T A N C E Y A L U E S N U M B E R O F R . Y A L U E S . 0 3. . O 10 r 0 I l '0 12 - 0 15 PR'uAR"
- 0 3 9 ,040 ~ 0 1 2 ~ 0 1 2 - 0 1 5 v'TR'N'TE 50 . 0 10 s 0 10 0 12 - 0 12 -0 1 5 I E A W V A L U E 0 4 3
- 0 10 - 0 10 . 0 12 - 0 4 3 SO 45 . 0 4 0 .O I0 - 0 42 . ,, 13 -0 45 D E v ' A T ' O * O 5 . 0 40 . 0 10 . 0 12 - 0 13 - 0 5 1 M E D I A N 0 12 * 0 . 0 'el, ,042 . 0 . 3 - 0 5 2 - 0 1 0 r e e l . 0 1 z - 0 1 1 - 0 5 4
M O D E 0 45
- 0 40 r O I l - 0 . 2 -011 - 8 6 0
Figure 38). R rp r c r cn t s t o re histogram of v i t r i n i t c re f lec tance measurements
from a aidcwall core a t 8 , 565 feet. St. George Basin COST No. 2 Well.
. - VITRIN ITE R E F L E C T A N C E ( R A N D O M 51
.=R-= U I T U R I T I ~
O R D E R E D R E F L E C T A N C E YALUES NUMBER 06 R. VALUES 0 11 - 0 9 1
- 0 SO -0 92 R E P R E S E N T I N G PRIMARY .0 5 4 100 YlTRlMlTE - 0 64 105 M E A N V A L U E 0 11
.066 1 1 0 S T A N D A R D D E V I A T I O N 0 1 4
- 0 61 1 19 M E D I A N M O D E
0 72
- 0 72 1 26 0 65 - 0 78 1 45 r0 14 -0 15
Figure 3 8 c . Rep re rm ta t~ re ,h i r t og ram o f r i t r i n i t e re f lec tance
mearuremrnt r f rom c u t t i n o i r a m p l t a t 14 .010 fret. St. George B a r i n . COST No. 2 Well.
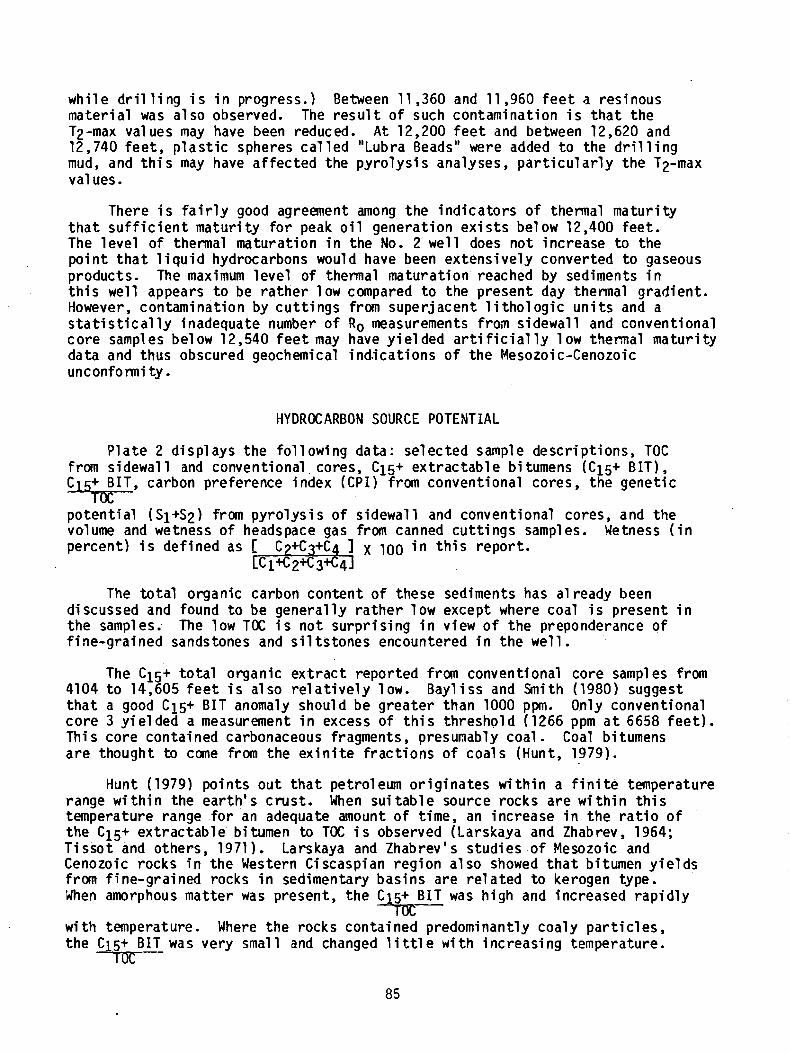
w h i l e d r i l l i n g i s i n progress.) Between 11,360 and 11,960 f e e t a resinous ma te r ia l was a1 so observed. The r e s u l t of such contaminat ion i s t h a t t h e T2-max val ues may have been reduced. A t 12,200 f e e t and between 12,620 and 12,740 f e e t , p l a s t i c spheres c a l l e d "Lubra Beads" were added t o the d r i l l i n g mud, and t h i s may have a f f e c t e d the p y r o l y s i s analyses, p a r t i c u l a r l y t h e T2-max va l ues.
There i s f a i r l y good agreement among t h e i n d i c a t o r s o f thermal m a t u r i t y t h a t s u f f i c i e n t m a t u r i t y f o r peak o i l generat ion e x i s t s below 12,400 fee t . The l e v e l o f thermal matura t ion i n t he No. 2 w e l l does n o t increase to the p o i n t t h a t l i q u i d hydrocarbons would have been ex tens i ve l y conver ted t o gaseous products. The maximum l e v e l o f thermal matura t ion reached by sediments i n t h i s we l l appears t o be r a t h e r low compared t o the present day thermal gradient . However, contaminat ion by c u t t i n g s from super jacent l i t h o l o g i c u n i t s and a s t a t i s t i c a l l y inadequate number o f Ro measurements froin s idewal l and convent ional co re samples be1 ow 12,540 f e e t may have y i e l ded a r t i f i c i a l l y 1 ow thermal m a t u r i t y data and thus obscured geochemical i n d i c a t i o n s o f t h e Mesozoic-Cenozoic unconformi ty .
HYDROCARBON SOURCE POTENTIAL
P l a t e 2 d i sp l ays t h e f o l l owing data : se lec ted sample descr ip t ions , TOC from s idewal l and convent ional cores, Cis+ e x t r a c t a b l e bitumens (Cis+ BIT) , C + BIT, carbon preference index (CPI) from convent ional cores, t h e genet ic + p o t e n t i a l (Sl+S2) from p y r o l y s i s o f s idewal l and convent ional cores, and t h e volume and wetness o f headspace gas from canned c u t t i n g s samples. Yetness ( i n percent ) i s de f ined as x 100 i n t h i s repo r t .
The t o t a l organic carbon content o f these sediments has a1 ready been discussed and found t o be genera l l y r a t h e r l o w except where coal i s present i n t h e samples. The low TOC i s n o t s u r p r i s i n g i n view o f t h e preponderance o f f i ne -g ra ined sandstones and s i l t s t o n e s encountered i n t h e w e l l .
The C15+ t o t a l organic e x t r a c t repor ted from convent ional core samples from 4104 t o 14,605 f e e t i s a lso r e l a t i v e l y 1 ow. Bay1 i s s and Smith (1980) suggest t h a t a good Cis+ BIT anomaly should be g rea te r than 1000 ppm. gn ly convent ional co re 3 y i e l ded a measurement i n excess o f t h i s thresh01 d (1266 ppm a t 6658 f e e t ) . Th i s core conta ined carbonaceous fragments, presumably coal . Coal bitumens a r e thought to cane from t h e e x i n i t e f r a c t i o n s o f coa ls (Hunt, 1979).
Hunt (1979) p o i n t s o u t t h a t petroleum o r i g i n a t e s w i t h i n a f i n i t e temperature range w i t h i n the ea r th ' s c rus t . When s u i t a b l e source rocks a re w i t h i n t h i s temperature range f o r an adequate amount o f t ime, an increase i n t h e r a t i o o f t h e C15+ e x t r a c t a b l e bitumen to TOC i s observed (Larskaya and Zhabrev, 1964; T i s s o t and others, 1971). Larskaya and Zhabrev's s tud ies o f Mesozoic and Cenozoic rocks i n t h e Western Ciscaspian reg ion a l s o showed t h a t bitumen y i e l d s from f ine-gra ined rocks i n sedimentary bas ins are re1 a ted t o kerogen type. When amorphous mat te r was present, t h e Cis+ BIT was h igh and increased r a p i d l y
TDC w i t h temperature. Where t h e rocks conta ined predominant ly coa ly p a r t i c l e s , t h e C 5+ BIT was very smal l and changed l i t t l e w i t h i nc reas ing temperature. 1
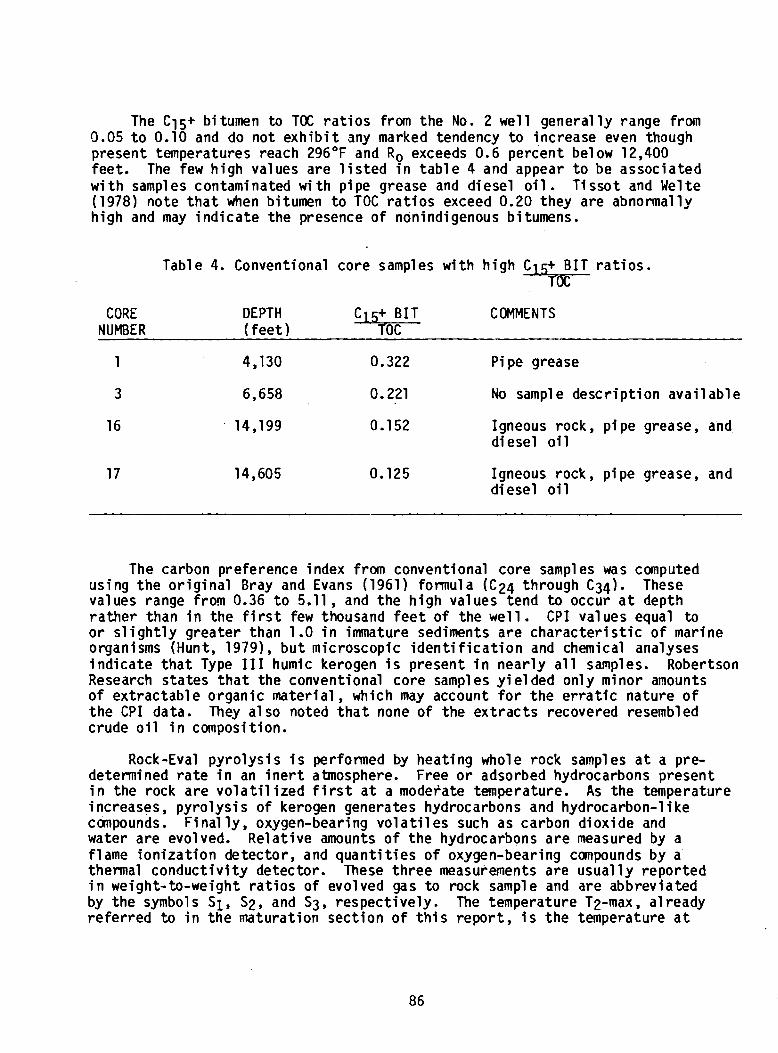
The C15+ bitumen t o TOC r a t i o s from the No. 2 we l l general ly range from 0.05 t o 0.10 and do not e x h i b i t any marked tendency t o increase even though I
present temperatures reach 296°F and Ro exceeds 0.6 percent below 12,400 feet . The few h igh values are l i s t e d i n t a b l e 4 and appear t o be associated w i t h samples contaminated w i t h pipe grease and diesel o i l . T i ssot and We1 t e I (1978) note t h a t when bitumen t o TOC r a t i o s exceed 0.20 they are abnormally h igh and may i nd i ca te the presence o f nonindigenous bitumens. 1
Table 4. Conventional core samples w i th h igh Cis+ BIT r a t i o s . TOC
CORE DEPTH COMMENTS NUMBER ( f e e t )
1 4,130 0.322 Pipe grease
6,658 0.221 No sample descr ip t ion ava i lab le
14,199 0.152 Igneous rock, p ipe grease, and diesel a i l
14,605 0.125 Igneous rock, p ipe grease, and diesel o i l
The carbon preference index from conventional core samples was computed using the o r i g i n a l Bray and Evans (1961) formula (C24 through C34). These values range from 0.36 t o 5.11 , and the h igh values tend t o occur a t depth ra ther than i n the f i r s t few thousand f e e t o f the we1 1 . C P I val ues equal t o o r s l i g h t l y greater than 1.0 i n immature sediments are cha rac te r i s t i c o f marine organisms (Hunt, 19791, b u t microscopic i d e n t i f i c a t i o n and chemical analyses ind ica te t h a t Type 111 humic kerogen i s present i n near ly a l l samples. Robertson Research states t h a t the conventional core samples y i e l ded only minor amounts o f ex t rac tab le organic mater ia l , which may account f o r the e r r a t i c nature o f the C P I data. They also noted t h a t none o f the ex t rac ts recovered resembled crude o i l i n composition.
Rock-Eva1 py ro l ys i s i s performed by heat ing whole rock samples a t a pre- determined r a t e i n an i n e r t atmosphere. Free o r adsorbed hydrocarbons present i n the rock are v o l a t i l i zed f i r s t a t a moderate temperature. As the temperature I
increases, py ro lys is o f kerogen generates hydrocarbons and hydrocarbon-like I
canpounds. Final l y , oxygen-bearing vol a t i l es such as carbon dioxide and water are evolved. Rela t ive amounts o f the hydrocarbons a re measured by a I
flame i on i za t i on detector, and quan t i t i e s o f oxygen-bearing canpounds by a I I
thermal conduc t i v i t y detector. These three measurements are usual ly reported i n weight-to-weight r a t i o s o f evolved gas t o rock sample and are abbreviated by the symbols S1, S2, and S3, respect ive ly . The temperature T2-max, a1 ready I r e fe r red t o i n t he maturat ion sect ion o f t h i s repor t , i s the temperature a t 1
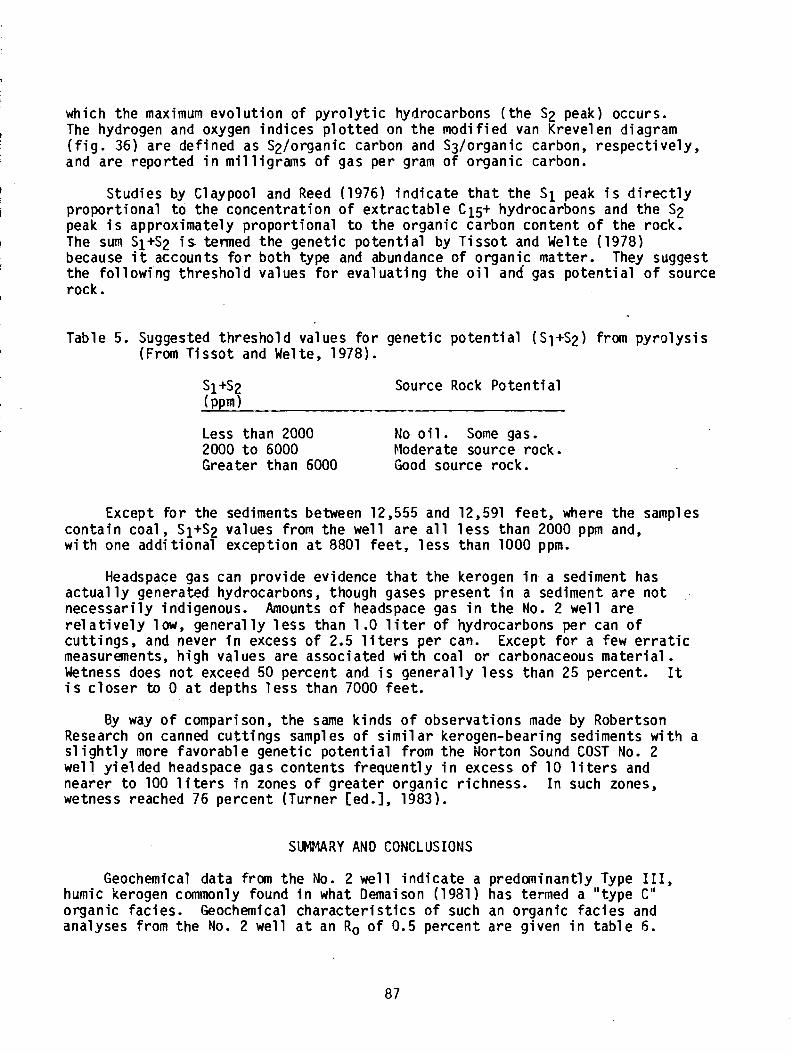
which the maximum e v o l u t i o n o f p y r o l y t i c hydrocarbons ( t h e S2 peak) occurs. k The hydrogen and oxygen ind ices p l o t t e d on t h e modif ied van Krevel en diagram
( f i g . 36) are defined as S21organic carbon and S31organ i c carbon, respec t i ve l y , and are reported i n m i l 1 igrams of gas per gram o f organic carbon.
I Studies by C l aypool and Reed (1976) i n d i c a t e t h a t t he S 1 peak i s d i r e c t l y
I p ropor t iona l t o t h e concent ra t ion o f ex t rac tab le Cis+ hydrocarbons and t h e S2 peak i s approximately propor t iona l t o t h e organic carbon content o f the rock.
I The sum S1+S2 i s termed t h e genet ic p o t e n t i a l by T i s s o t and We1 t e (1978)
I because i t accounts f o r bo th type and abundance of organic mat ter . They suggest the f o l l o w i n g th resho l d values f o r eva luat ing t h e o i l and gas p o t e n t i a l o f source rock.
I
Table 5. Suggested th resho l d values f o r genetic p o t e n t i a l (Sl+S2) from p y r o l y s i s I (From T i s s o t and Welte, 1978).
s1 +s2 Source Rock Po ten t i a1 ( P P ~
Less than 2000 No o i l . Some gas. 2000 t o 6000 Moderate source rock. Greater than 6000 Good source rock.
Except f o r the sediments between 12,555 and 12,591 fee t , where the samples con ta in coal, S1+S2 values from the we1 1 are a1 1 1 ess than 2000 ppm and, w i t h one add i t iona l exception a t 8801 fee t , l e s s than 1000 ppm.
Headspace gas can provide evidence t h a t t h e kerogen i n a sediment has a c t u a l l y generated hydrocarbons, though gases present i n a sediment are no t necessar i l y indigenous. Amounts o f headspace gas i n t h e No. 2 we l l are re1 a t i v e l y 1 ow, general l y 1 ess than 1.0 1 i t e r o f hydrocarbons per can o f cu t t i ngs , and never i n excess o f 2.5 l i t e r s per can. Except f o r a few e r r a t i c measurements, h i g h values are associated w i t h coal o r carbonaceous mate r ia l . Wetness does n o t exceed 50 percent and i s genera l ly l e s s than 25 percent. It i s cToser t o 0 a t depths Tess than 7000 fee t .
By way of comparison, the same k inds o f observat ions made by Robertson Research on canned c u t t i n g s samples o f s i m i l a r kerogen-bearing sediments w i t h a s l i g h t l y more favorab le genetic p o t e n t i a l from t h e Norton Sound COST No. 2 we1 1 y i e l d e d headspace gas contents f requen t l y i n excess o f 10 l i t e r s and nearer t o 100 l i t e r s i n zones o f g reater organic r ichness. I n such zones, wetness reached 76 percent (Turner [ed.], 1983).
SUMMARY AND CONCLUSIOt4S
GeochemicaT data from the No. 2 we l l i n d i c a t e a predominantly Type 111, hurnic kerogen commonly found i n what Demai son (1 981 ) has termed a " type C" organic fac ies. Geochemical c h a r a c t e r i s t i c s o f such an organic f a c i e s and analyses from the No. 2 we l l a t an Ro o f 0.5 percent a re given i n t a b l e 6.
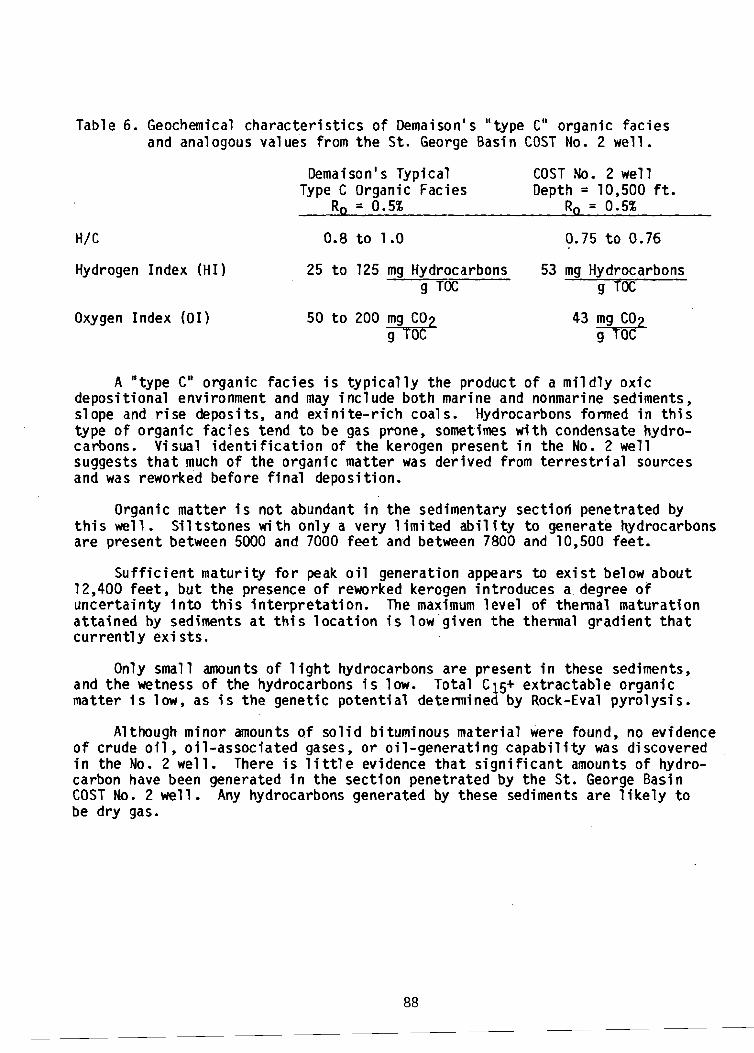
Table 6. Geochemical c h a r a c t e r i s t i c s o f Demaison's " type C" organic fac ies and analogous val ues from t h e S t . George Basin COST No. 2 we1 1.
Demaison' s Typical COST No. 2 we l l Type C organic' Facies Depth = 10,500 ft.
Ro = 0.5% Ro = 0.5%
Hydrogen Index (HI) 25 t o 125 mg Hydrocarbons 53 mg Hydrocarbons g TOC TOC
Oxygen Index (01)
A "type C" organic fac ies i s t y p i c a l l y the product o f a m i l d l y ox ic deposi t ional environment and may inc lude both marine and nonmarine sediments, slope and r i s e deposits, and e x i n i t e - r i c h coal s. Hydrocarbons formed i n t h i s type o f organic fac ies tend t o be gas prone, sometimes w i t h condensate hydro- carbons. Visual i d e n t i f i c a t i o n o f the kerogen present i n the No. 2 we l l suggests t h a t much o f the organic mat ter was der ived from t e r r e s t r i a l sources and was reworked before f i n a l deposit ion.
Organic matter i s no t abundant i n t h e sedimentary sect ior l penetrated by t h i s we l l . S i l ts tones w i t h on ly a very l i m i t e d a b i l i t y t o generate hydrocarbons are present between 5000 and 7000 f e e t and between 7800 and 10,500 feet .
S u f f i c i e n t m a t u r i t y f o r peak o i l generat ion appears t o e x i s t below about 12,400 fee t , b u t the presence o f reworked kerogen int roduces a degree o f uncer ta in ty i n t o t h i s i n t e r p r e t a t i o n . The maximum l e v e l o f thermal maturat ion a t ta ined by sediments a t t h i s l o c a t i o n i s 1 ow given the thermal grad ient t h a t c u r r e n t l y e x i s t s .
Only small amounts o f 1 i g h t hydrocarbons a re present i n these sediments, and t h e wetness o f the hydrocarbons i s low. Total C15+ ex t rac tab le organic mat ter i s 1 ow, as i s t h e genetic po ten t i a1 determined by Rock-Eva1 py ro lys i s .
Although minor amounts o f s o l i d bituminous mate r ia l were found, no evidence o f crude o i l , o i l -assoc ia ted gases, o r o i l - g e n e r a t i ng capabi l i ty was d i scovered i n the No. 2 we1 1. There i s 1 i ttl e evidence t h a t s i g n i f i c a n t amounts o f hydro- carbon have been generated i n the sect ion penetrated by t h e S t . George Basin COST No. 2 we1 1. Any hydrocarbons generated by these sediments are 1 i k e l y t o be dry gas.
ENVIRONMENTAL CONSIDERATIONS by
A l l e n J. Adams
ARC0 Exp lo ra t i on Company, as opera tor f o r i t s e l f and o ther p a r t i c i p a n t s , submit ted a l e t t e r t o t h e Minera ls Management Serv ice ( f o r m e r l y t h e Conservat ion D iv i s i on , USGS) dated June 18, 1981, f o r t h e proposed d r i l l i n q o f a Deep S t r a t i g r a p h i c Test we l l i n t h e St . George Basin area o f t h e A1 aska Outer Cont inenta l She l f . Documents submit ted i n support o f t h i s proposal inc luded a D r i l l i n g Plan, an Environmental Report, an O i l - S p i l l Contingency Plan, and a Coastal Zone Consistency C e r t i f i c a t i o n . A s i t e - s p e c i f i c b i o l o g i c a l survey and a geohazards survey at t h e pr imary and a l t e r n a t e s i t e s were requ i red t o i n v e s t i g a t e environmental cond i t i ons be fore approval o f t h e Geologica l and Geophysical (G&G) Permi t a p p l i c a t i o n f o r t h e Deep S t r a t i g r a p h i c Test we1 1. The app l i can t f o l l owed 30 CFR Par t 251 i n submission o f t h e G&G Permi t app l i ca t i on .
A Deep S t r a t i g r a p h i c Test we l l i s intended f o r t h e a c q u i s i t i o n o f geo log i ca l and engineer ing da ta t o determine t h e potent i a1 f o r hydrocarbon accumulation w i t h i n a proposed sa le area. It i s commonly d r i l l e d o f f - s t r u c t u r e and i t i s no t in tended t h a t any hydrocarbon accumulations be found. The St. George Basin COST No. 2 we l l was d r i l l e d o f f - s t r u c t u r e . The i n fo rma t i on gathered f rom t h i s t e s t we l l was used t o f u r t h e r eva lua te the hydrocarbon p o t e n t i a l o f t he area covered by OCS Lease Sale No. 70 ( S t . George Basin) h e l d on A p r i l 12, 1983.
As p a r t o f t h e permi t a p p l i c a t i o n review, FMS prepared an Environmental Assessment (EA). The EA serves as a decision-making document t o determine i f t h e proposed a c t i o n i s o r i s not a major Federal a c t i o n s i g n i f i c a n t l y a f f e c t i n g t h e q u a l i t y o f t h e human environment i n t h e sense o f t h e Nat iona l Environmental P o l i c y Act (NEPA), Sect ion 102(2)(C). An EA addresses and i nc ludes t h e f o l l o w i n g : a d e s c r i p t i o n o f t h e proposed act ion, a d e s c r i p t i o n o f t h e a f f ec ted env i ronment , environment a1 consequences, . a l t e r n a t i v e s t o t h e proposed act ion, unavoidable adverse environmental e f f e c t s , and c o n t r o v e r s i a l issues.
On the bas i s o f e x i s t i n g da ta and regu la t i ons , FPI1S took s p e c i f i c environment a1 cond i t i ons under adv i sement be fore approv i ng the d r i 1 1 i ng p l an and moni tored these cond i t i ons du r i ng d r i l l i n g w e r a t i o n s . Inc luded were geo log ica l (see Shal low Geologic S e t t i n g chapter ) , meteoro log ica l , oceanographic, b i o l o g i c a l , c u l t u r a l , and economic cons idera t ions .
METEOROLOGICAL AND OCEANOGRAPHIC DATA
Most o f t h e Ber ing Sea l i e s i n suba rc t i c l a t i t u d e s , and c y c l o n i c atmospheric c i r c u l a t i o n predominates i n t he region. Cloudy sk ies,
moderately heavy p r e c i p i t a t i o n , and s t rong s u r f ace winds cha rac te r i ze t h e marine weather. Storms are more f requent i n t he f a l l than i n t h e summer.
There are two dominant cu r ren t p a t t e r n s i n t h e S t . George Basin area: a counter-c lockwise eddy over t h e western A l e u t i a n Basin and a c lockwise eddy i n t h e v i c i n i t y o f Rat I s l and . Wave he igh ts g rea ter than 10 f e e t are common less than 10 percent o f t h e t ime i n June, Ju ly , and August, bu t may be common 12 t o 14 percent o f t h e t ime i n May and September. No problems w i t h supers t ruc tu re i c i n g occurred.
Sea i c e cond i t i ons observed i n t h e St . George Basin area c o n s i s t p r i m a r i l y o f h i g h l y mobi le b e l t s and patches t h a t have broken away f rom t h e Kuskokwim Bay area t o t h e nor theast . Windrowed s t r i ngs , b e l t s , and patches are the normal s ta te . I n ext remely c o l d years, patches o f s lush may form b r i e f l y du r i ng February o r March i n t h e presence o f i c e f rom ou ts ide t h e area.
Because l i m i t e d meteoro log ica l and oceanographic da ta were ava i lab le , t h e MMS issued t h e Guide1 i nes f o r Col l e c t i o n of Meteoro loa ica l . Oceanoara~hic and ., . Performance Data and requ i red the opera tor t o c o l l e ~ t ~ r n e t e ~ r o l o ~ i c a l i n fo rma t i on t o a i d i n f u t u r e operat ions w i t h i n t h e St . Georqe Basin. Dur inq setup and operat ion, c l imat i c and sea s t a te cond i t i ons were'moni t o r e d t o en iu re t h a t l o c a l cond i t i ons d i d no t exceed r i g to le rances or jeopard ize human sa fe ty . Winds, barometr ic pressure, a i r and water temperatures, waves, currents, and i c e cond i t i ons were monitored. A l l environmental .data c o l l e c t e d du r i ng t h e d r i l l i n g o f t h i s we l l are a v a i l a b l e t o t h e p u b l i c .
BIOLOGICAL DATA
The Ber ing Sea, and e s p e c i a l l y t h e B r i s t o l Bay Region, i s one o f t h e most b i o l o g i c a l l y p roduc t i ve o f f sho re areas i n t h e Un i ted States. Several o f t he wor ld 's 1 argest known concent ra t ions o f comnerci a1 f i s h , marine mammals, and marine b i r d popu la t ions are found i n t h i s area. Current est imates i n d i c a t e about 27 m i l l i o n marine b i r d s are seasona l ly present, w i t h severa l co lon ies con ta in ing over a h a l f m i 11 i o n i n d i v i d u a l s .
A s i t e - s p e c i f i c marine b i o l o g i c a l survey was designed by MMS i n concer t w i t h o the r Federal and S t a t e agencies t o p rov ide b i o l o g i c a l da ta a t proposed Deep S t r a t i g r a p h i c Test s i t e s . Through t h e use o f underwater v ideo and photographic documentation, p lankton tows, i n fauna l sampling, and t r a w l ing, ARC0 (Nekton, 1980b) determined the r e l a t i v e abundance and types o f organisms present i n var ious h a b i t a t s . These s tud ies were conducted f rom August 8 t o August 11, 1980. The r e s u l t s are summarized as fo l l ows :
1. F i sh were t h e dominant component o f t he t r a w l catch at both t he pr imary and a l t e r n a t e s i t e s and accounted f o r at l e a s t 90 percent o f t h e t o t a l i n d i v i d u a l s and 90 percent o f t h e t o t a l weight o f each t r a w l . The
f 1 athead so le (Hippoglossoides e l assodon) and the wal leye p o l l o c k (Theragra chalcogramma) were the most abundant f l a t f i s h and round f i sh a t both s i t e s .
2. Ep ibenth ic i nve r teb ra tes were taken i n ve ry low numbers a t bo th s i t e s . The commercial ly impor tant Tanner crab was c o l l e c t e d i n low numbers a t t h e a l t e r n a t e s i t e s , bu t was no t present a t t he pr imary s i t e .
3. Demersal f i s h and ep ibenth ic i nve r teb ra tes observed on v ideo record ings were s i m i l a r a t both s i t e s , w i t h zoarc ids and round f i sh the most abundant organisms a t t he pr imary s i t e , and Tanner crabs the most abundant a t t h e a l t e r n a t e s i t e . The ep ibenth ic community, bottom composit ion, and topography are g e n e r a l l y s i m i l a r a t and between t h e s i t e s .
4. Taxonomic d i v e r s i t y and d e n s i t y were h igher a t the a l t e r n a t e s i t e . Polychaete annel ids were numer ica l l y dominant a t both s i t e s , f o l l owed bv echinoderms, mol luscs, and arthropods.
5. The r e l a t i v e abundance, t o t a l number o f organisms per cubic meter, and species composit ion o f t he p lankton were s i m i l a r a t the two s i t e s . Copepods were t h e most abundant p lank ton i c organism at both s i t e s .
On the bas i s o f t h e b i o l o g i c a l survey conducted by Nekton, t he area supported no unique h a b i t a t s o r species t h a t would r e q u i r e r e j e c t i o n o r m o d i f i c a t i o n o f t h e d r i l l i n g program. No a d d i t i o n a l b i o l o g i c a l resources were d iscovered du r i ng t h e d r i l l i n g operat ions. No adverse impacts on e x i s t i n g b i o l o g i c a l resources were apparent f rom d r i 11 i n g a c t i v i t i e s .
Mar i ne M m a l s and Endangered Speci es
Several endangered whale species are present i n t h e S t . George Basin area on an occasional o r r e g u l a r basis . These i nc lude t h e bowhead, P a c i f i c r i g h t , f i n , se i , blue, humpback, gray, and sperm whales. A c o n s u l t a t i o n w i t h t h e Nat iona l Marine F i s h e r i e s Serv ice (NMFS) was requested pursuant t o Sec t ion 7 o f t h e Endangered Species Act o f 1973, and a response p r o v i d i n g a nonjeopardy op in ion was issued by NMFS on A p r i l 28, 1981. On the bas is o f i n fo rma t i on rece ived f rom a l l i n t e r e s t e d p a r t i e s and an MMS evaluat ion, i t was determined t h a t approval o f t he proposed ac t i on would no t af fect any endangered species o r c r i t i c a l h a b i t a t .
F i s h e r i e s
Unalaska i s t h e pr imary p o r t f o r t h e A l e u t i a n Is lands-Ber inq Sea management area, which inc ludes A leu t i an I s l ands waters west o f Scotch Cap on Unimak I s l a n d and a l l waters o f t h e Ber ing and Chukchi seas t o t he east o f t h e Un i ted StatesIRussian Convention L i n e o f 1867. Present f i s h e r i e s a c t i v i t y cen ters around t h e e x p l o i t a t i o n and processing o f k i n g and Tanner crab, p l u s comparat ive ly minor amounts o f salmon, h a l i b u t , Dungeness crab, Korean crab, shrimp, and groundf ish. Employment i n seafood processinq has grown d r a m a t i c a l l y over t h e past 10 years as a r e s u l t of t he westward movement o f
she1 l f i s h e x p l o i t a t i o n by U .S. f ishermen. There are 16 shore-based ~ r o c e s s i n g p lan ts loca ted i n t h e Unalaska area.
Major f o r e i g n f i s h i n g areas f o r groundf ish and f lounders w i t h i n the S t . George Basin are loca ted along the 100-fathom contour from Unimak Pass t o and beyond t h e P r i b i l o f I s 1 ands. A t l e a s t one - th i rd o f t h e groundf ish f i s h i n g e f f o r t i n t h e Ber ing Sea occurs w i t h i n t h e proposed S t . George Basin lease area. The pr imary U.S. a c t i v i t y cons i s t s o f pot f i s h e r i e s f o r k i n g and Tanner crabs.
CULTURAL RESOURCES
It was determined t h a t c u l t u r a l and archeological surveys would not be requ i red f o r the S t . George Basin t e s t we l l s i t e s , as they were located i n l o w - p r o b a b i l i t y areas f o r c u l t u r a l resources. I f t h e TV t ransec ts and side-scan sonar surveys had i nd i ca ted unexplained anomalies, a rev iew by a qua1 i f i e d marine archeo log is t would have been performed. No such anomal i e s were detected. No c u l t u r a l resources were i d e n t i f i e d dur inq d r i l l i n g operat ions.
DISCHARGES INTO THE MARINE ENVIRONMENT
The app l icant disposed o f d r i l l c u t t i n g s and waste d r i l l i n g mud i n t o t h e ocean i n compl i ance w i t h e x i s t i n g orders.
Past s tud ies on t h e f a t e and e f f e c t s o f r o u t i n e discharges i n t o the marine environment from o f f s h o r e o i l and gas a c t i v i t i e s i nd i ca ted t h a t such discharges are not l i k e l y t o s i g n i f i c a n t l y a f f e c t t he marine environment. Bentoni te i s a conti,nuous a d d i t i v e t o the d r i l l i n g mud, whereas b a r i t e i s added as necessary f o r inc reas ing mud weight. Benton i te and b a r i t e are inso lub le , nontox ic , and i n e r t . Other add i t i ves were used i n minor concentrat ions, and most were used o n l y under speci a1 cond i t ions . These add i t i ves e i t h e r were nontox ic o r would chemica l ly n e u t r a l i z e i n the mud o r upon contact w i t h seawater. No o i l -based mud was used.
Some excess cement was in t roduced i n t o the marine environment wh i l e cementing shal low casing s t r i n g s up t o t h e sea f l o o r .
L i q u i d wastes, i n c l u d i n g o i l from t h e o i l l w a t e r separator, were t ranspor ted from t h e d r i l l i n g vessel by supply boats and disposed o f i n approved onshore l oca t i ons . S o l i d wastes were compacted and s i m i l a r l y t ranspor ted t o an approved onshore d isposa l s i t e .
CONTINGENCY PLANS FOR OIL SPILLS
Plans f o r prevent ing, repo r t i ng , and c lean ing up o i l s p i l l s were addressed i n t h e O i 1 -Spi 11 Contingency P l an (OSCP) , which was a p a r t o f t he
D r i 11 i n g Plan. The OSCP 1 i s t e d the equipment and ma te r ia l avai 1 able t o the permi t tee and described the capabi 1 i t i es of such equipment under d i f f e r e n t sea and weather cond i t ions . The p lan a lso inc luded a d iscussion o f l o g i s t i c a l support and i d e n t i f i e d s p e c i f i c i n d i v i d u a l s and t h e i r r e s p o n s i b i l i t i e s i n implementing t h e OSCP. Two response l e v e l s were organized: an o n s i t e o i l - s p i l l team and an onshore support o rgan iza t ion . The o n s i t e o i l - s p i l l team was s t ruc tu red t o p rov ide immediate containment and cleanup c a p a b i l i t y f o r opera t iona l s p i l l s , such as may r e s u l t f rom t h e t rans fe r of f u e l o i l , and t o i n i t i a t e c o n t r o l act ions f o r l a r g e uncontained s p i l l s . The onshore support o rgan iza t i on was s t ruc tu red t o prov ide a d d i t i o n a l equipment and manpower t o c lean up l a r g e s p i l l s .
One thousand f e e t o f containment boom, an o i l - s p i l l skimmer, sorbents, o i l storage conta iners, dispersants, c o l lec tan ts , and hand chemical appl i c a t i o n equipment were loca ted on the d r i 11 i n g vessel. Several o i 1 - s p i l l t r a i n i n g d r i l l s were conducted t o ensure f a m i l i a r i z a t i o n w i t h t h i s equipment by t h e o n s i t e o i l - s p i l l team. The opera t ion a lso had access t o a d d i t i o n a l o i l - s p i l l response equipment loca ted a t onshore s tag ing po in t s . The OSCP a lso i d e n t i f i e d add i t i ona l equipment t h a t was ava i l ab le from o ther response organ iza t ion sources, agreements t o commit these resources, and requirements f o r o b t a i n i n g t h e equipment.
Dur ing the d r i l l i n g operat ion, a f u e l t r a n s f e r l i n e rup tu red and approximately 30 ga l l ons o f d iese l f u e l were s p i l l e d i n t o t h e water. The o n s i t e o i l - s p i l l team deployed the containment boom and cleaned up the s p i l l e d f u e l w i t h sorbent pads. There were no o ther s p i l l s r e s u l t i n g from t h i s d r i l l i n g operat ion.
The p r o b a b i l i t y o f encounter ing hydrocarbons t h a t cou ld cause a blowout at any depth was minimized i n t h i s case by l o c a t i n g the we l l o f f - s t r u c t u r e . The operator d r i l l e d the we l l according t o t h e OCS Orders and u t i l i z e d standard we1 1 con t ro l equipment and procedures. The casing and cementing programs (OCS Order No. 2) and subsequent abandonment requirements (OCS Order No. 3) were designed t o prevent leakage o r contaminat ion of f l u i d s w i t h i n a permeable zone.
The s i t e was c leared of a l l p ipe and o the r ma te r i a l on or above the ocean f l o o r upon complet ion o f t he we l l .
As p a r t o f t h e EA process, t he proposed program was submitted f o r comnents t o the appropr ia te Federal and Sta te agencies, as we l l as t o i n t e r e s t e d p a r t i e s . Responses were inc luded as p a r t of t he EA. On t h e basis o f EA No. AK-81-3, t h e Conservation Manager, A1 aska Region, signed a F ind ing o f No S i g n i f i c a n t Impact (FONSI) on October 26, 1981, f o r ARCO's proposed ac t i on and determined t h a t an Envi ronment a1 Impact Statement was not requ i red . A n o t i c e was issued t o t h a t e f f e c t . MMS consequently issued a l e t t e r t o ARC0 approving t h e i r proposed ac t ion . The EA and t h e FONSI documents are a v a i l a b l e f o r rev iew i n the p u b l i c f i l e i n t h e o f f i c e o f t h e Regional Supervisor, F i e l d Operations, Minera ls Management Service, 800 A Street , Anchorage, Alaska 99501.
SUMMARY
The ARCO S t . George Basin COST No. 2 we l l was d r i l l e d t o a measured depth o f 14,626 f e e t . The K e l l y Bushing was 77 f e e t above sea l e v e l and 452 f e e t above mud1 ine. The water depth was 375 fee t . The wel l s i t e was approximately 110 m i l e s northwest o f Cold Bay, Alaska. The w e l l was d r i l l e d from t h e SEDCO 708, a s e l f - p r o p e l l e d semisubmersible d r i l l i n g r i g . D r i l l i n g c m e n c e d on May 19, 1982, and t h e we1 1 was canpl eted on September 2, 1982. Four s t r i n g s o f cas ing were s e t dur ing d r i l l i n g : 30-inch cas ing a t 570 fee t , 20-inch cas ing a t 1423 fee t , 13 3/8- i nch casing a t 4965 fee t , and 9 5/8-inch casing a t 10,035 feet . The d r i l l i n g f l u i d f o r t h e f i r s t 1400 f e e t was 'seawater; t h e d r i l l i n g mud va r ied from 9.3 t o 9.8 pounds/gallon t h e r e a f t e r .
Logging runs were made a t depths o f 4976 feet, 10,135 fee t , and 14,622 fee t . The types o f we l l logs run are l i s t e d i n the Operational Summary chapter . No d r i l l stem t e s t s were made.
Seventeen conventional cores, 337 s idewal l cores, and we1 1 c u t t i n g s c o l l e c t e d a t 30- foo t i n t e r v a l s ( f rom 1460 t o 14,626 f e e t ) were analyzed f o r po ros i t y , permeabi l i t y , 1 i thology, organic geochemistry, and paleontology.
As requ i red by 30 CFR 251, t h e opera tor (ARCO) f i l e d a D r i l l i n g Plan, Envi rormental Report, O i l - S p i l l Contingency Pl an, and Coastal Zone Consistency C e r t i f i c a t i o n . I n add i t ion , t h e MMS ( fo rmer l y USGS, Conservation D i v i s i o n ) requ i red a geohazards survey, geotechnical survey, and s i t e -spec i f i c b i o l o g i c a l survey. The zooplankton, infauna, ep i fauna, v a g i l e benthos, and pel agic fauna were c o l l e c t e d and analyzed. P a r t i c u l a r emphasi s was p l aced on p r o t e c t i ng 1 ocal and migra tory marine mammal s and av i fauna. Waste discharges i n t o t h e envirorment were minimal, nontoxic , and i n compliance w i t h Federal envirormental p r o t e c t i o n regu la t ions .
S t r a t i g r a p h i c u n i t s i n the No. 2 w e l l were def ined on the bas is o f m i c r o f o s s i l content , 1 i tho1 og ica l and 1 og c h a r a c t e r i s t i c s , c o r r e l a t i o n w i t h t h e No. 1 we1 1 , seismic character, and absolute da t ing techniques. The s t r a t a encountered i n t h e No. 2 we1 1 were u n d i f f e r e n t i a t e d Pl io-Pl e i stocene t o 1460 fee t , P l iocene to 4246 f e e t , Miocene to 6050 fee t , 01 igocene t o 11,085 fee t , poss ib le Eocene t o 12,540 fee t , E a r l y Cretaceous o r Late Jurass ic t o 13,370 feet, and Late Jurass ic to 14,626 f e e t (TD).
The Cenozoic sedimentary sec t i on cons is t s o f interbedded sandstone, s i l t - stone, mudstone, diatomaceous mudstone, and conglomerate. These sediments are predan inant ly from volcanic source terranes. Mi neral og ica l l y , t h e sediments are p h y s i c a l l y and chemical ly unstable. Po ros i t y and pe rmeab i l i t y have been reduced by d u c t i l e g r a i n deformation, cementation, and authigenesi s. Permeabil i t i e s a re lower than might be expected f o r given po ros i t i es .
The Mesozoic sedimentary sec t i on cons is t s o f sandstone, s i l ts tone, shale, conglomerate, and minor amounts o f coal . P o r o s i t i e s and permeabil i t i e s a re 1 ow.
Three seismic horizons i n the No. 2 we1 1 were mapped and co r re la ted across the St. George graben: the basement unconformity between Cenozoic and Hesozoic s t ra ta , t h e top o f t he Oligocene, and the top o f the Miocene. The time-depth curve ca l cu la ted from t h e sonic l o g i s l e s s steep i n the No. 1 we1 1 than i n t h e No. 2 we1 1, and i n t e r v a l v e l o c i t i e s a re lower i n the No. 1 we1 1 than i n the No. 2 we l l .
Geochemical analyses show a predominantly type 111, humic kerogen. The sec t i on i s low i n t o t a l organic carbon. S i l t s t o n e s w i t h a very 1 i m i t e d p o t e n t i a l f o r generat ing hydrocarbons are present be1 ow 5100 fee t . Thermal matura t ion i s low. S u f f i c i e n t m a t u r i t y f o r peak o i l generat ion may e x i s t below 12,400 fee t . The sedimentary sec t i on penetrated appears t o be gas prone a t best.
It i s probable t h a t s t r a t a w i t h b e t t e r source rock and r e s e r v o i r c h a r a c t e r i s t i c s than those encountered i n the No. 2 w e l l are present i n o the r p a r t s o f t h e basin, p a r t i c u l a r l y along t h e f l anks o f t h e graben.
REFERENCES
Abbott, W. H., 1978, Cor re la t i on and zonat ion o f Miocene s t r a t a along t h e At1 a n t i c margin o f North America using diatoms and s i l i c o f l agel l a t e s : Marine Micropaleontology, v. 3, no. 1, p. 15-34.
Anderson, Warren, and Associates, Inc., 1976a, ARCO S t . George Basin COST No. 1, s h a l l ow core hole, Ber ing Sea, Alaska OCS: San Diego, Ca l i f . , unpublished repor t , 4 p ts .
------ 1976b, ARC0 S t . George Basin COST No. 1 , Ber ing Sea, Alaska OCS, b i o s t r a t i g r a p h i c repor t : San Diego, Cal i f . , unpublished repor t , 2 v.
Andrews, G. W., 1978, Marine diatom sequence i n Miocene s t r a t a o f t he Chesapeake Bay region, Naryland: Micropaleontology, v. 24, no. 4, p. 371-406, p l s . 1-6.
ARCO Alaska, Inc., 1981, D r i l l i n g Plan, S a i n t George Basin COST Well No. 2: Anchorage, Alaska, unpublished repor t , 38. p.
Barker, Col in, 1974, Py ro l ys i s techniques f o r source-rock eva luat ion : American Associat ion o f Petroleum Geologists B u l l e t i n , v. 58, no. 11, p. 2349-2361.
Barron, J. A., 1980, Lower Miocene to Quaternary diatom b ios t ra t i g raphy o f Leg 57, o f f nor theastern Japan, Deep Sea D r i l l i n g Pro jec t , i n I n i t i a l Reports o f t he Deep Sea D r i l l i n g P ro jec t , v. 56-57, p t . 2: Tash ing ton , D. C., Nat ional Science Foundation, p. 641-685.
Barron, J. A. , 1981 , Late Cenozoic diatom b ios t ra t i g raphy and pal eoceanography o f t h e m idd le - la t i t ude eastern North P a c i f i c , Deep Sea D r i l l i n g P r o j e c t Leg 63, i n I n i t i a l Reports o f t he Deep Sea D r i l l i n g Pro jec t , v. 63: Washi n g t z , D.C . , Nat ional Science Foundation, p. 507-538.
Bay1 i ss, G. S. , and hi t h y M. R., 1980, Source rock eva lua t ion reference manual: Houston, Tex., Geochem Laborator ies, Inc., 80 p.
Bergen, F. W., and O'Neil , P., 1979, D i s t r i b u t i o n o f Holocene Foramini fera i n t h e Gu l f o f Alaska: Journal o f Paleontology, v. 53, no. 6, p. 1267-1292.
B ios t ra t i g raph ics , 1982, ARCO S t . George Basin COST No. 2, Bering Sea, Alaska: San Diego, Cal i f . , unpubl i shed repor t , 6 v.
Bray, E. E., and Evans, E. D., 1961, D i s t r i b u t i o n o f n -pa ra f f i ns as a c lue to recogn i t i on o f source beds: Geochim Cosmochim Acta, v. 22, p. 2-15. I
Bukry , David, 1975, Coccol i t h and s i l i c o f l agel l a t e s t ra t i g raphy , Northwestern I
Pac i f i c Ocean, Deep Sea D r i l l i n g P r o j e c t Leg 32, i n I n i t i a l Reports o f t he I Deep Sea D r i l l i n g Pro jec t , v. 32: Washington, D.C., Nat ional Science Foundation, p. 677-701 .
C l aypool , G. E., and Reed, P. R. , 1976, Thermal -ana lys i s technique f o r source rock evaluat ion: Q u a n t i t a t i v e es t imate of organic r i chness and e f f e c t s o f 1 i tho log ic v a r i a t i o n : American Assoc ia t ion o f Petroleum Geologists B u l l e t i n , v. 60, no. 4, p. 608-626.
Comer, C. D., 1984, Map showing shal low f a u l t s and acoust ic anomalies, S t . George Basin, Alaska: U.S. Minerals Management Serv ice Map Series, 1 oversized sheet, sca le 1:250,000 ( i n press).
Cooper, A. K., Marlow, M. S., Parker, A. W., and Chi lds, J. R., 1979, Structure-contour map on acoust ic basement i n the Bering Sea: U.S. Geol og ica l Survey M i s c e l l aneous Fie1 d Studies Map MF-1165, 1 overs ized sheet, sca le 1:2,500,000.
Davies, J. N., 1982, P la te- tec ton ic s e t t i n g and earthquake p o t e n t i a l o f t he St. George basin, Be r i ng shel f, A1 aska (abs. ): Western A1 aska Geol ogy and Resource Potent ia l , A1 aska Geological Society Symposi um, Anchorage, A1 aska , 1982, Program and abst rac ts , p. 12.
Demaisan, G. J., 1981, S t r a t i g r a p h i c aspects o f source bed occurrence, t h e organic fac ies concept, i n AAPG geochemi s t r y f o r Geol og i s t s (Short Course Notes) : Dal las, Tex., *rican Assoc ia t ion o f Petroleum Geologists, p. 108.
Dow, W. G., 1977, Kerogen s tud ies and geological i n t e r p r e t a t i o n s : Journal o f Geochemical Explorat ion, v. 7, no. 2, p. 79-99.
Dow, W. G., 1982, Geochemical ana lys i s o f St. George Basin, COST No. 2 we l l , Alaska: Houston, Robertson Research (U. S. ) , Inc., 240 p.
Dow, W. G., and O'Connor, D. I., 1982, Kerogen m a t u r i t y and type by r e f l e c t e d 1 i g h t microscopy app l i ed t o petroleum exp lora t ion , i n How t o assess matura t ion and pal eotemperatures : Society o f Econflc Pal eonto l ogi s t s and ?4ineralogists, Short Course No. 7, p. 133-157.
Echols, R. J., and Armentrout, J. M., 1980, Holocene foramini fera1 d i s t r i b u t i o n pa t te rns on t h e s h e l f and slope, Yakataga-Yakutat area, nor thern Gul f o f Alaska, i n Bouma, A. H., Colburn, I. P., Douglas, R. G., F i e l d , M. E., and I n g l c J:C., eds., Quaternary depos i t iona l environments o f t he P a c i f i c coast: P a c i f i c Section, Society o f Economic Pal eon to log is t s and f l i nera l og i s ts , P a c i f i c Coast Pal eogeography Symposi um 4, Los Angel es , Ca l i f . , p. 281-303.
~ s p i t a l i 6 , J., Laporte, J. L., Madec, M., Marquis, F.> Leplat , P., Paulet, J., and Boutefeu, A., 1977, ~ 6 t h o d e rap ide de c a r a c t e r i s a t i o n des roches m6res, de l e u r p o t e n t i e l p g t r o l i e r e t de l e u r degre' d 'e'vol u t i on : Revue de 1 ' I n s t i t u t e Franqai s Pe'trol i e r , v . 32, no. 1 , p. 23-42.
Gardner, J. V., Dean, W. E., and Val l i e r , T. L., 1980, Sedimentol ogy and geochemistry o f sur face sediments, ou te r con t inen ta l shel f, southern Bering Sea: Marine Geology, v. 35, no. 4, p.: 299-329.
Gardner, J. V., Val l i e r , T. L., Dean, W. E., Kvenvolden, K. A., and Redden, G. D., 1979, Sedimentology and geochemistry o f sur face sediments and t h e d i s t r i b u t i o n o f f a u l t s and p o t e n t i a l l y uns tab le sediments, S t . George bas in reg ion o f t h e Outer Cont inenta l Shelf , southern Ber ing Sea: U.S. Geological Survey Open-File Report 79-1562, 89 p.
Hedlund, R. W., and Engelhardt, D. W., 1970, Rugaepol l is f r a g i l i s sp. nov. from t h e T e r t i a r y o f Kachemak Say, A1 aska: Po l len e t Spores, v. 12, no. 2, p . 173-176.
Hopkins, D. M., Sho l l , D. W., Addicot t , W. O., Pierce, R. L., Smith, P. B., Wolfe, J., Gershenovich, D., Kotenev, B., Lohrman, K. E., Lipps, J. H., Obradovich, J., 1969, Cretaceous, T e r t i a r y , and e a r l y Ple is tocene rocks from t h e con t inen ta l margin i n t h e Ber ing Sea: Geological Society o f America B u l l e t i n , v. 80, p. 1471-1486.
Hunt, J. M., 1979, Petroleum geochemistry and geology: San Francisco, Ca l i f . , W. H. Freeman, 617 p.
Ing le , J. C., Jr., 1980, Cenozoic pal eobathymetry and deposi t ional h i s t o r y o f se lec ted sequences w i t h i n t h e southern Cal i f o r n i a con t inen ta l border1 and: Cushman Foundation f o r Forami n i f e r a l Research, Special Pub1 i c a t i o n no. 19, p. 163-195.
Koizumi, I t a r u , 1973, The l a t e Cenozoic diatoms o f s i t e s 183-193, Leg 19, Deep Sea D r i l l i n g Pro jec t , i n I n i t i a l Reports o f t h e Deep Sea D r i l l i n g Pro jec t , v. 19: Wash ingtonD. C., Nat ional Science Foundation, p. 805-855.
------ 1975, Late Cenozoic diatom b i o s t r a t i g r a p h y i n t h e c i rcum North P a c i f i c Region: Geological Society o f Japan Journal , v. 81, no. 10, p. 611-627.
Larskaya, Y. S., and Zhabrev, D. H., 1964, E f f e c t s o f s t r a t a l temperatures and pressures on the canposi i o n o f dispersed organic mat ter ( f rom t h e example o f t h e Mesozoic-Cenozoic depos i ts o f t h e western Ciscaspian reg ion) : Dokl . Akad. Nauk SSSR, v. 157, no. 4, p. 135-139.
Ling, H. Y., 1977, Late Cenozoic s i l i c o f l a g e l l a t e s and ebr id ians from.the eastern North Pac i f i c : Proceedings o f the F i r s t I n te rna t iona l Congress on P a c i f i c Neogene Strat igraphy, Tokyo (Kaiyo Shuppan) , p. 205-233.
Loebl ich, A. R. , Jr., and Tappan, H., 1953, Studies o f A r c t i c Foramini fera: Smithsonian Miscellaneous Co l lec t ions , v. 121, no. 7, p. 1-150, p l s . 1-24.
Marks, J. G., 1982, Molluscan f o s s i l s i n core samples from a w e l l i n Alaska: ARC0 O i l and Gas Company, unpublished repor t , 6 p .
Marlow, M. S., and Cooper, A. K., 1980, Mesozoic and Cenozoic s t r u c t u r a l t rends under southern Ber ing Sea she l f : American Associat ion o f Petroleum Geologists B u l l e t i n , v. 64, no. 12, p. 2139-2155.
Marlow, M. S., Cooper, A. K., Parker, A. W., and Chi lds, J. R., 1979, Isopach map o f s t r a t a above acoust ic basement i n t h e Ber ing Sea: U.S. Geological Survey M i see1 laneous Fie1 d Studies Map MF-1164, 1 overs ized sheet, scal e 1:2,500,000.
M i t c h e l l , J. G., and Maher, J. C., 1957, Suggested abbrev ia t ions f o r l i t h o l o g i c descr ip t ions : American Associat ion o f Petroleum Geologists B u l l e t i n , v. 41 , no. 9, p. 2103-2107.
M u t t i , E., and R i c c i Lucchi, F., 1972, Le t o r b i d i ti del 'Appennino s e t t e n t r i o n a l e: In t roduzione a1 1 'anal i s i d i fac ies : ilemorie d e l l a Societa Geol ogica I t a l i a n a , v. 11, p. 161-199.
Nekton, Inc., 1980a, Sha l l ow D r i l l i ng Hazards Survey, Proposed Continental Offshore S t ra t i g raph ic Test No. 2, S t . George Basin, Alaska, ARCO O i l and Gas Company COST we1 1 program: San Diego, Cal i f. , 61 p., p la tes .
Nekton, Inc . , 1980b, B i o l o g i c a l Survey, Proposed Cont inenta l Offshore S t ra t i g raph ic Test No. 2, S t . George Basin, Alaska, ARCO O i l and Gas Company COST we1 1 program: San Diego, Ca l i f . , 171 p.
Okada, Hisatake, and Bukry, David, 1980, Supplementary m o d i f i c a t i o n and i n t r o d u c t i o n o f code numbers t o t h e low-1 a t i t u d e coccol i t h b i o s t r a t i g r a p h i c - . zonat ion (Bukry, 1973; 1975): Marine Micropaleontology, v. 5, no. 3, p. 321 -32 5.
Postuma, J. A., 1971 , Manual o f p lank ton ic Foramini fera: Amsterdam, El sevier , 420 p.
Russ, T., Gurvis, R., Roche, J., and Ayers, D., 1982, Geochemical f i n a l w e l l repor t , ARCO Exp lora t ion Company, S t . George Basin COST tlo. 2, June 6, 1982-August 26, 1982 : Anchorage, A1 aska , Expl o r a t i o n Loggi ng ( USA) I n c . , p. 39.
Schrader, H. J., 1973, Cenozoic diatoms from t h e nor theast P a c i f i c , Leg 18, i n I n i t i a l Reports o f t he Deep Sea D r i l l i n g Pro jec t , v. 18: 'vlashington, K C . , Nat ional Science Foundation, p. 673-798.
S ta in for th , R. M., Lamb, J. L., Luterbacher, 'Hanspeter, Beard, J. H., and Jeffords, R. M., 1975, Cenozoic p lank ton ic forami n i f e r a l zonat ion and c h a r a c t e r i s t i c s o f index forms: U n i v e r s i t y o f Kansas Pal eonto log ica l Contr ibut ions, A r t i c l e 62: Lawrence, Kans., U n i v e r s i t y o f Kansas Paleonto logical I n s t i t u t e , 2 v., 425 p.
Stover, L. E., and E v i t t , W . R., 1978, Analyses o f pre-Pleistocene organic- wal led d ino f l age l l a tes : Stanford, Ca l i f . , S tanford Un ive rs i t y Pub l ica t ions , Geological Sciences, v. 15, 300 p.
T issot , B. P., and Welte, D. H., 1978, Petroleum format ion and occurrence, new approach to o i l and gas exp lora t ion : New York, N. Y., Springer-Verlag, 538 p.
Tisso t , B. , Califet-Debyser, Y . , Oeroo, G . , and Oudin, J . L . , 1971, Origin and evolut ion of hydrocarbons i n e a r l y Toarci an sha les , P a r i s Basin, France : American Association of Petroleum Geol ogi sts Bull e t i n , v . 55, no. 12 , p. 2177-2193.
Todd, R u t h , and Low, Doris, 1967, Recent Foraminifera from t h e Gulf of Alaska and southeastern Alaska: U.S. Geological Survey Professional Paper 573 A , p. 1-45, p l s . 1-5.
Tucker, P. M . , 1982, P i t f a l l s r ev i s i t ed : Tulsa, Okla., Society of Exploration Geophysicists, 19 p.
Turner, R. F. ( ed . ) , 1983, Geological and operat ional summary, Norton Sound COST No. 2 we1 1 , Norton Sound, A1 aska: U. S. Geological Survey Open-Fil e Report 83-557, 154 p.
U.S. Mineral s Management Service, 1981 , OCS Envi rormental Assessment, EA No. AK-81-3: Anchorage, Alaska, unpublished repor t , 20 p., appendixes.
U. S. Mineral s Management Service, 1982, Final environmental impact s tatement, proposed Outer Continental Shelf o i l and gas l e a s e s a l e 70, S t . George Basin: Anchorage, A1 aska, 1 v .
Va l l i e r , T. L . , Underwood, M. B . , Jones, D. L . , Gardner, J . V . , 1980, Petrography and geologic s ign i f i cance of Upper J u r a s s i c rocks dredged near P r ib i l of Is1 ands, southern Bering Sea cont inenta l she1 f : American Association of Petroleum Geologists B u l l e t i n , v . 64, no. 6, p. 945-950.
Voloshinova, N. A . , Kuznetsova, V. N . , and Leonenko, L. S., 1970, Forami n i fe ry Neogenovi k h o t l ozheni t Sakhal i n a (Neogene Forami ni f e r a of Sakhalin): Neftinogo Nauchno-Issledovatelskogo Geologoraz-vedochnogo I n s t i t u t a , Trudy, vyp. 284, 303 p.
Williams, G. L., and Brideaux, W . W . , 1975, Palynologic analyses of Upper Mesozoic and Cenozoic rocks of the Grand Banks, At lan t i c Continental Margin: Geological Survey of Canada Bulletin 236, p. 1-1 62.
Wolfe, J. A., 1977, Pal eogene f l o r a s from the Gulf of Alaska Region: U.S. Geological Survey Professional Paper 997, 108 p., 30 pl s.
Wolfe, J . A., and Poore, R. Z. , 1982, Ter t i a ry marine and normarine c l ima t i c t r ends , i n Climate i n Earth History: Washington, D.C., U.S. National R e s e a r c h ~ o u n c i l Study Committee, National Academic Press, p. 154-1 58.
Woodward-Clyde Consul t a n t s , 1981 a , Environmental Report f o r S t . George Basin COST No. 2, prepared f o r ARCO A1 aska, Inc.: San Francisco, Cal i f . , 45 p.
Woodward-Clyde Consultants, 1981 b, O i l s p i l l Contingency Plan f o r S t . George Basin COST Projec t No. 2: prepared f o r ARCO Alaska, Inc.: San Francisco, C a l i f . , 132 p.
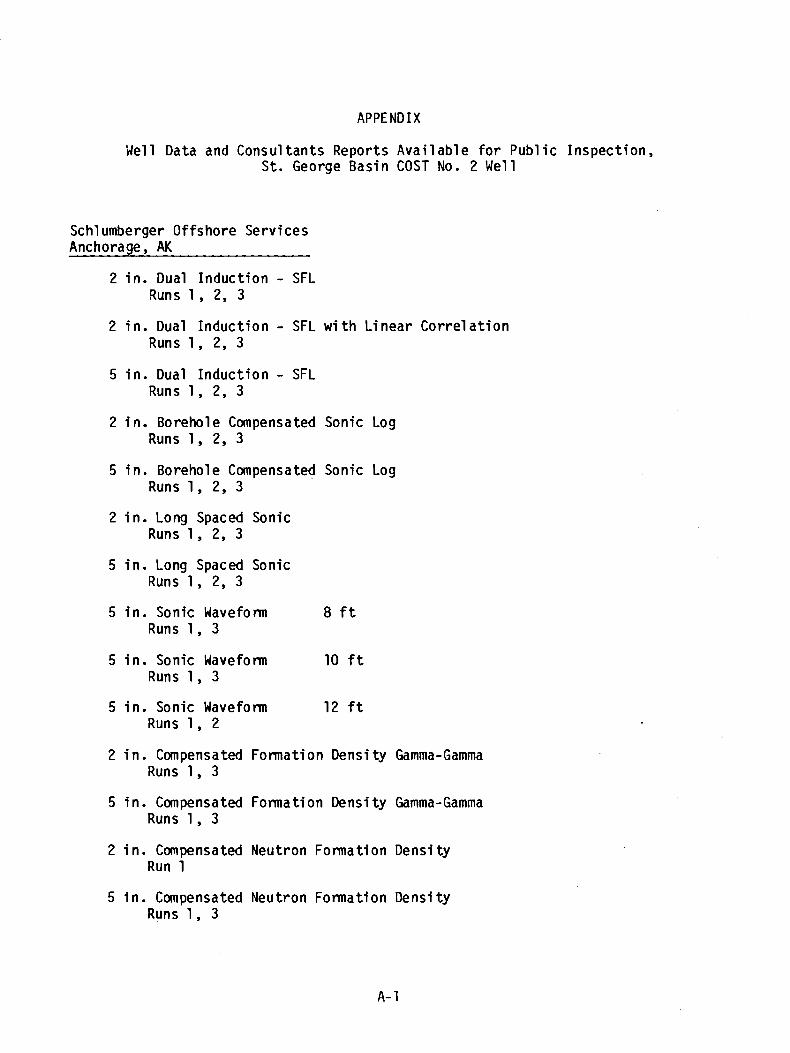
APPEND I X
We1 1 Data and Consul t a n t s Reports Avai 1 abl e f o r Pub1 i c Inspect ion, S t . George Basin COST No. 2 We1 1
Schl umberger Offshore Services Anchorage, AK
2 i n . Dual Induct ion - SFL Runs 1 , 2, 3
2 i n . Dual I nduc t ion - SFL w i t h L inear C o r r e l a t i o n Runs 1, 2, 3
5 i n . Dual I nduc t ion - SFL Runs 1, 2, 3
2 i n . Borehole Compensated Sonic Log Runs 1, 2, 3
5 i n . Borehole Compensated Sonic Log Runs 1, 2, 3
2 i n . Long Spaced Sonic Runs 1, 2, 3
5 i n . Long Spaced Sonic Runs 1, 2, 3
5 i n . Sonic Waveform 8 f t Runs 1, 3
5 i n . Sonic Waveform 10 f t Runs 1, 3
5 i n . Sonic Waveform 12 f t Runs 1, 2
2 i n . Compensated Formation Density Gamma-Gamma Runs 1, 3
5 i n . Compensated Formation Density Gamma-Gamma Runs 1, 3
2 i n . Compensated Neutron Formation Density Run 1
5 i n . Compensated Neutron Formation Densi ty Runs 1, 3
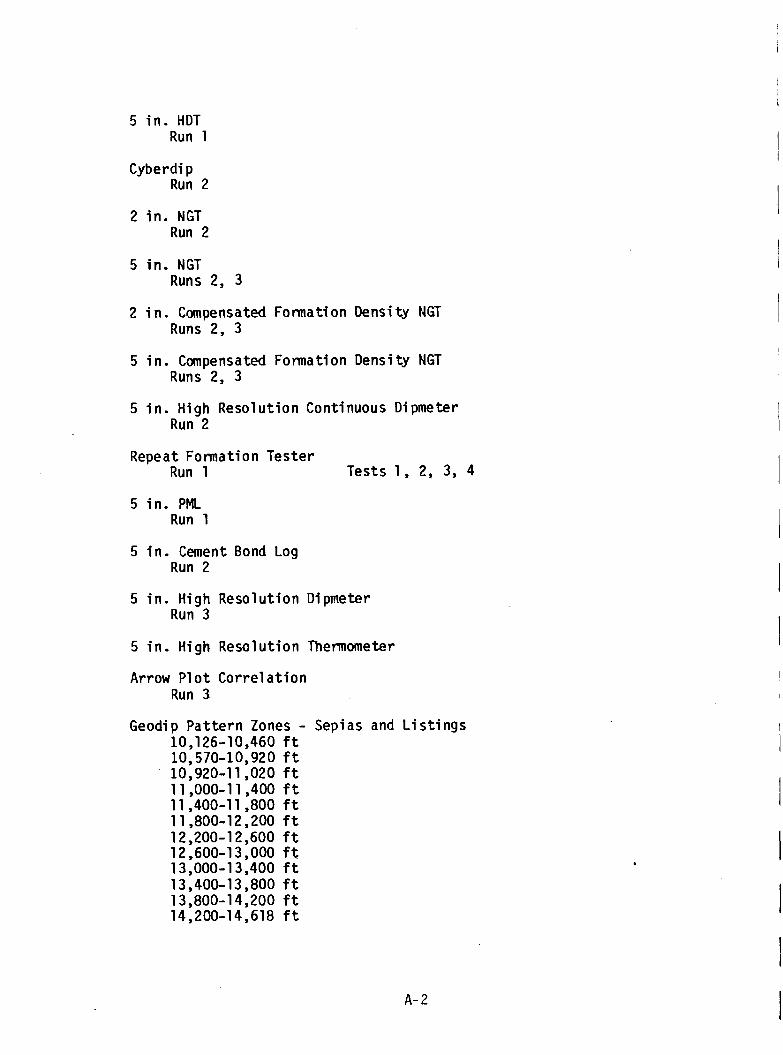
5 i n . HDT Run 1
Cyberdi p Run 2
2 i n . NGT Run 2
5 in . NGT Runs 2, 3
2 i n . Compensated Formation Density NGT Runs 2, 3
5 i n . Compensated Formation Density NGT Runs 2, 3
5 i n . High Resolut ion Continuous D i pmeter Run 2
Repeat Formation Tester Run 1 Tests 1, 2, 3, 4
5 i n . PML Run 1
5 i n . Cement Bond Log Run 2
5 i n . High Resolut ion Dipmeter Run 3
5 i n . High Resolut ion Thermometer
Arrow P l o t Cor re la t ion Run 3
Geodip Pat tern Zones - Sepias and L i s t i n g s 10,126-10,460 f t 10,570-10,920 f t 10,920-1 1,020 f t 11,000-1 1,400 f t 11,400-11,800 f t 11,800-12,200 f t 12,200-12,600 f t 12,600-13,000 f t 13,000-13,400 f t 13,400-13,800 f t 13,800-14,200 f t 14,200-14,618 f t
ExLog Anchorage, AK
1
Formation Eval u a t i o n Log D r i l l i ng Data Pressure Log Temperature Data Log Pressure Eval ua t i on Log Mud R e s i s t i v i t y Log Geochemical Eval ua t i on Log End o f We1 1 Repo rt Geochemical F i n a l Well Report
Core Laborator ies Dal las, TX
C o r r e l a t i o n Coregraphs Thin Sections 2 Boxes Core Analys is Report 2 Sect ions Speci a1 Core Anal y s i s Study
AGAT Consultants Denver. CO
Reservoir Qua1 i t y Study 5 Volumes
ARCO Alaska Inc. Anchoraae. AK
L i tho1 ogy Log Core Descr ipt ions Cores 1-17 Sidewal l Sample Descr ipt ions 4900-14,560 f t
Robertson Research Houston, TX
Geochemical Anal ys i s F i nal Report
Woodward-Cl yde Consul t a n t s San Francisco, CA
Pal eomagnetic Data 3 Vol umes
ARCO Exp lora t ion Company
V e r t i c l e Seismic P r o f i l e 2.5 s / i n V e r t i c l e Seismic P r o f i l e 5 s / i n
Biost ra t igraphics San Diego, CA
Biost ra t igraphic Summary S i l iceous Microfoss i l Report Cal careous Nannofossil Report Radi 01 a r i a Report Pal ynol ogy Report Foraminifera Report
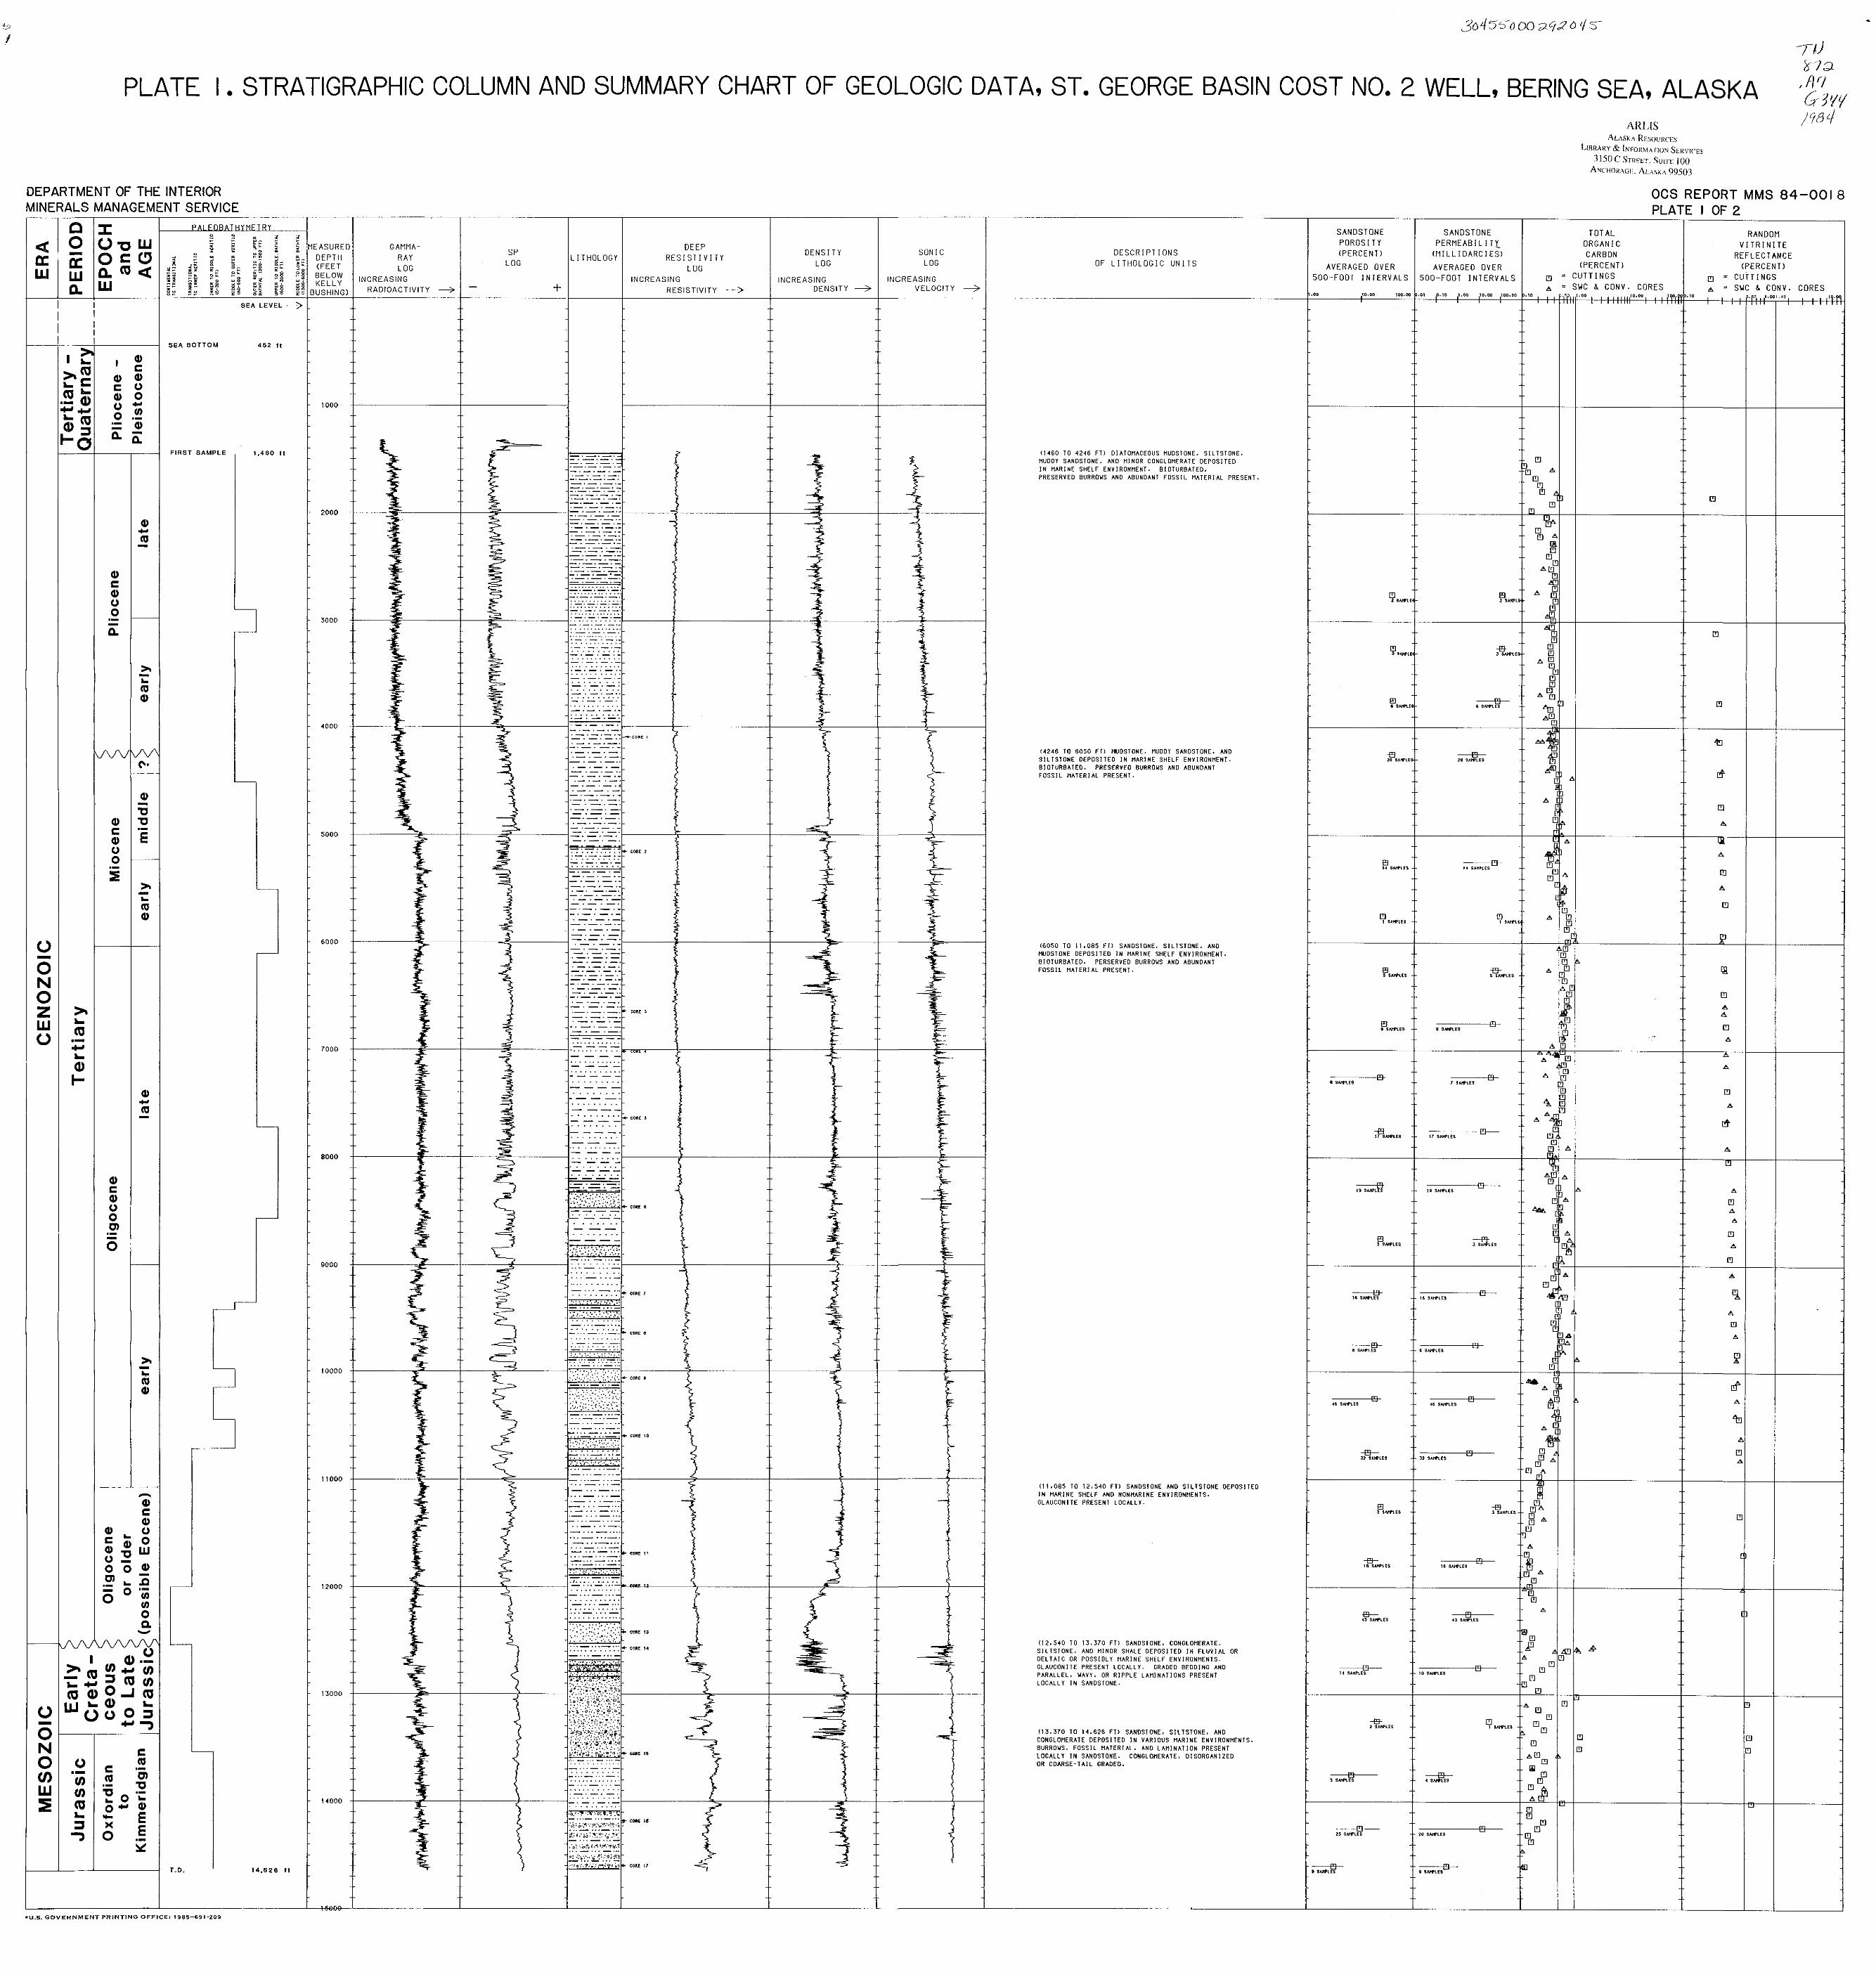
PLATE I . STRATIGRAPHIC COLUMN AND SUMMARY CHART OF GEOLOGIC DA
DEPARTMENT OF THE INTERIOR MINERALS MANAGEMENT SERVICE
PA1 F O B A T H Y M E T B Y " "
- * - O L m - - rn- :a - - w n a , :. L F ",z ",- t - ; 5 9 ;: 5 ; Srn t o 2 -
I I S E A L E V E L - I I I I
I I I
12 Q)
*a ' c
L C g : a .- Q) Q) 0
G tr? .- 0 . -
a E :a - "
Q) * m -
Q) c Q) 0 0 .- - P
* - L m al
em - - --
Q) - u
Q) u 5 mi 0 0 --- .- 5 * -
L
m Q)
* L a .- CI L
Q) I-
Q) * rn -
Q) c Q) 0 0 0 .- - 0 -
* - % Q)
--- -- h
al C Q)
Q) 0 C Z O Q ) u w 0 -
0 0 , .z L a - 0 'G O '0
0 P u
-
I v Q) .- - mC, V)
" a z m s LC,
a a 0 - J a L Q)
w O O O ; - 7
c m 0 ,, . -
V) .- a : T o m i a 04-Q)
r , E = * E 7 0 .-
Y
S E A BOTTOM 452 f t
+U.S. GOVERNMENT PRlNTlNG OFFICE: 1985-691-209
- -2
$ MEASURED GAMMA- S P
D E E P % D E P T H RAY L I T H O L O G Y R E S I S T I V I T Y
D E N S I T Y SON1 C
5 : ( F E E T L O G L O G
L O G L O G LOG
0 0
- P I N C R E A S I N G ", . ~8 K E L L Y
I N C R E A S I N G INCREASING I N C R E A S I N G
;2 BUSHING] + R A D I O A C T I V I T Y + - R E S I S T I V I T Y D E N S I T Y 3 V E L O C I T Y 4 t
TA, ST. GEORGE BASIN COST NO. 2 WELL, BERING SEA, ALASKA ,fiq G ~ Y V
D E S C R I P T I O N S OF L l T H O L O G l C U N I T S
1 1 4 6 0 TO 4 2 4 6 F T ) DIATOMACEOUS MUOSTONE. S ILTSTONE. MUDDY SANDSTONE. AND MINOR CONGLOMERATE DEPOSITED I N MARINE SHELF ENVIRONMENT. BIOTURBATED. PRESERVEO BURROWS AND ABUNDANT F O S S I L MATERIAL PRESENT.
1 4 2 4 6 TO 6 0 5 0 F T I MUOSTONE. MUDDY SANDSTONE. AND S ILTSTONE DEPOSITED I N MARINE SHELF ENVIRONMENT. BIOTURBATED. PRESERVEO BURROWS AND ABUNDANT F O S S I L MATERIAL PRESENT.
I 6 0 5 0 TO 1 1 . 0 8 5 F T I SANOSTONE. S ILTSTONE. AN0 MUDSTONE DEPOSlTEO I N MARINE SHELF ENVIRONMENT BIOTURSATED. PERSERVED BURROWS AND ABUNDANT F O S S I L MATERIAL PRESENT.
( 1 1 . 0 8 5 TO 1 2 . 5 4 0 FT) SANDSTONE AND S ILTSTONE DEPOSITED I N MARINE SHELF AND NONMARINE ENYIRONMENTS. GLAUCONITE PRESENT LOCALLY.
( 1 2 1 5 4 0 TO 1 3 . 3 7 0 F T ) SANDSTONEl CONGLOMERATE. S ILTSTONE. AND MINOR SHALE DEPOSITED I N F L U V I A L OR D E L T A I C OR POSSIBLY MARINE SHELF ENVIRONMENTS. GLAUCONITE PRESENT LOCALLY. GRADEO BEDDING AND PARALLEL . WAVY. OR R I P P L E LAMINATIONS PRESENT LOCALLY I N SANDSTONE.
( 1 3 . 3 7 0 TO 1 4 . 6 7 6 FT) SANDSTONE. S ILTSTONE. AN0 CONGLOMERATE OEPOSITED I N VARIOUS MARINE ENVIRONMENTS. BURROWS. F O S S I L MATERIAL. AN0 L A M I N A T I O N PRESENT LOCALLY I N SANDSTONE. CONGLOHERATE, OISORGANIZED OR COARSE-TAIL GRADED.
OCS REPORT MMS 84-001 8 PLATE I OF 2
SANDSTONE P O R O S I TY (PERCENT)
AVERAGED OVER 5 0 0 - F O O T I N T E R V A L S
7 . m 10 w 1w.m
SANDSTONE P E R M E A B l L l T r
( M I L L I D A R C I E S )
AVERAGED OVER 5 0 0 - F O O T I N T E R V A L S
3 .0 , ?.,O 8.00 1o.w ,oo.oo
--
..
L
TGs-
S W W C ,
- I O U P L E P
- -+
s s~rnrr
T O T A L O R G A N I C CARBON
( P E R C E N T )
[11 = C U T T I N G S A = SWC b CONV. CORES
I
, , ,.,o
-" A
LII
RANDOM V I T R I N I T E
R E F L E C T A N C E (PERCENT)
[I] = C U T T I N G S A = SWC b CONV. CORES
-- -
; ; P , ' 0 , I , , , I . p&l .Oo
1 : A
LII
IW'.'O
A,, [I]
-- 4 s m r s
..
- * ..
-- ZO - S M L S S
-- EzP-
&
'I
[I]
--A III
[I] -- a [I]
[I]
A m [I]
-- [I] - 0
A " 8 [I] [I]
el -- I3 .. h
81
3
II]
3
[I]
LII
U