Embed Size (px)
Citation preview
Geologic Studies of the Lower Cook Inlet COST No.1 Wei Alaska Outer Contine tal Shelf

GEOLOGIC STUDIES OF THE LOWER COOK INLET COST NO.1 WELL,
ALASKA OUTER CONTINENTAL SHELF
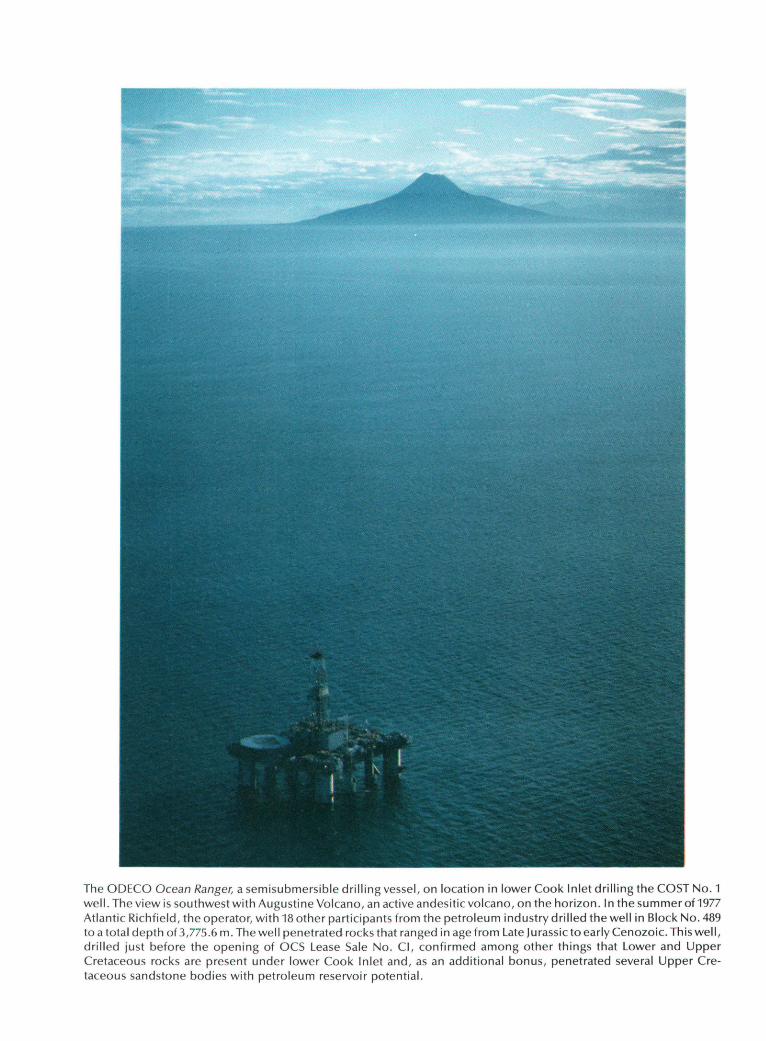
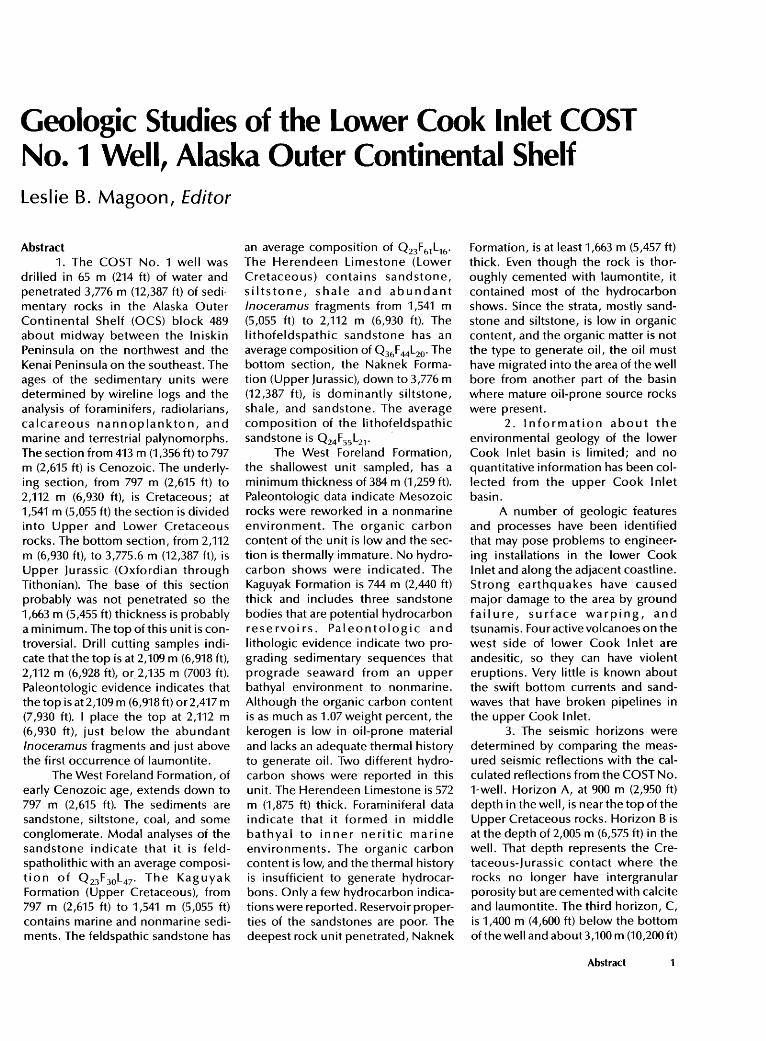
The ODECO Ocean Ranger, a semisubmersible drilling vessel, on location in lower Cook Inlet drilling the COST No.1 well. The view is southwest with Augustine Volcano, an active andesiticvolcano, on the horizon.ln the summerof1977 Atlantic Richfield , the operator, with 18 other participants from the petroleum industry drilled the well in Block No. 489 to a total depth of 3,775 .6 m. The well penetrated rocks that ranged in age from Late Jurassic to early Cenozoic. This well, drilled just before the opening of OCS Lease Sale No. Cl, confirmed among other things that Lower and Upper Cretaceous rocks are present under lower Cook Inlet and, as an additional bonus , penetrated several Upper Cretaceous sandstone bodies with petroleum reservoir potential.
Geologic Studies of the Lower Cook Inlet COST No.1 Well, Alaska Outer Continental Shelf
Leslie B. Magoon, Editor
U.S. GEOLOGICAL SURVEY BULLETIN 1596
DEPARTMENT OF THE INTERIOR
DONALD PAUL HODEL, Secretary
U.S. GEOLOGICAL SURVEY
Dallas l. Peck, Director
UNITED STATES GOVERNMENT PRINTING OFFICE 1986
For sale by the Books and Open-File Reports Section U.S. Geological Survey Federal Center, Box 25425 Denver, CO 80225
Library of Congress Cataloging-in-Publication Data
Geologic studies of the Lower Cook Inlet COST No. 1 well, Alaska Outer Continental Shelf.
(U.S. Geological Survey Bulletin 1596) Includes bibliographies. Supt. of Docs. No.: I 19.3: 1596 1. Geology-Alaska-Cook Inlet. 2. Borings
Alaska-Cook Inlet. I. Magoon, Leslie B., 1941-11. Series: Geological Survey Bulletin; 1596.
QE75.B9 no. 1596 [QE84.C69]
557.3 s [557.98'3]
86-600086
CONTENTS Abstract 1 Introduction, by Leslie B. Magoon 5 Environmental geology, by Arnold H. Bouma and Monty A. Hampton 11 Stratigraphic units of the COST No. 1 well, by Leslie B. Magoon 17 Correlation of the COST No. 1 well data and the marine seismic data, by Michael A. Fisher 23 Paleontology and biostratigraphy of the COST No. 1 well, by Ronald F. Turner 29 Petroleum geochemistry, by George E. Claypool 33 Present-day geothermal gradient, by Leslie B. Magoon 41 Sandstone petrography, by Hugh McLean 47 Sandstone diagenesis, by John G. Balm and Thane H. McCulloh 51 Plutonism and provenance-implications for sandstone compositions, by Travis Hudson 55 Petrography, provenance, and tectonic significance of Middle and Upper Jurassic
sandstone from Tuxedni Bay, by Robert M. Egbert 61 Framework geology and sandstone composition, by Leslie B. Magoon and Robert M. Egbert 65 Conclusions, by Leslie B. Magoon 91 References 93
FIGURES Frontispiece. The ODECO Ocean Ranger, drilling the COST No. 1 well in lower Cook
Inlet.
1-3. Maps showing: 1. Area of report and important features 6 2. Bathymetry of lower Cook Inlet 12 3. Geomorphology of lower Cook Inlet 14
4. Stratigraphic chart showing wireline well-log curves, lithology, and rock units in COST No. 1 well 18
5. Diagram showing age and depositional environment of sediments from COST No. 1 well 19
6. Ternary diagrams and graphs showing grain size, porosity, and permeability of stratigraphic units penetrated in COST No. 1 well 20
7. Graphs showing organic geochemistry of stratigraphic units penetrated in COST No. 1 well 21
8. Map showing location of COST No. 1 well and seismic lines 24 9. Graphs showing seismic velocity curves 24
10. Graphs showing relation between well-log and seismic data 25 11. Seismic line 7 52 26 12. Cross section B-B' 27
13-19. Graphs showing: 13. Gas chromatographic analyses of saturated hydrocarbons 34 14. Summary and comparison of analyses of organic carbon and
hydrocarbon contents of rocks in COST No. 1 well 36 15. Summary and comparison of H/C ratio, o 13C data, and pyrolytic
hydrocarbon yield 37 16. Summary and comparison of indicators of thermal history 38
Contents V
17. Temperature data 42 18. Homer temperature plot 43 19. Temperature increase at total depth 44
20. Geothermal gradient map of Cook Inlet 45 21. Graph showing "fossil" laumontite field 46 22. Graph showing cross reference of the TAl scale to vitrinite reflectance 46 23. Q-F-L ternary diagram 49
24--26. Photographs showing: 24. Authigenic clay 51 25. Laumontite filling in pore space 52 26. Oil in laumontite-lined fractures 52
27. Map showing principal plutonic rocks in southern Alaska 56 28. Ternary diagrams showing percentage of Q-K-P for groups of plutonic
rocks 57 29. Ternary diagrams showing influence of provenance on modal framework
composition of sandstone 59 30. Graph showing evolutionary trends of framework grain ratios 59 31. Ternary Q-F-L diagrams and compositional data for sandstone from Tuxedni
Bay 62 32. Map showing geographic names and geomorphic features in Cook Inlet and
adjacent areas 66 33. Q-F-L diagrams for sandstones in the Cook Inlet-Shelikof Strait area 68 34. Generalized geologic map of Cook Inlet, Shelikof Strait. and adjacent areas 72 35. Geologic cross sections 74 36. Major terrane boundaries in the Cook Inlet region 75 37. Time-stratigraphic chart through COST No. 1 well 78 38. Tertiary correlation chart for the Cook Inlet forearc basin 84
TABLES 1. Selected information from "Well Completion and Recompletion Report and
Log" 7 2. Type and depth interval of well logs run in COST No. 1 well 7 3. Conventional cores acquired from COST No. 1 well 8 4. Petroleum industry participants and contractors in COST No. 1 well 8 5. Wells drilled in lower Cook Inlet outer continental shelf to 1980 9 6. Petrophysical properties of sandstone, COST No. 1 well 21 7. Organic carbon content of rock units penetrated in COST No. 1 well 22 8. Hydrocarbon indications reported in the COST No. 1 well 22 9. Late Cretaceous (Maestrichtian) foraminifers found between 1 ,402-1 ,539 m in
the COST No. 1 well 30 10. Early Cretaceous (Hauterivian into Barremian) foraminifers found between
1,585 to 2,106 min the COST No. 1 well 31 11. Conventional source rock analysis of extractable organic matter and kerogen in
core samples from COST No. 1 well 33 12. Thermal analysis of organic matter in the core samples from COST No. 1
well 35 13. Log runs for COST No. 1 well in 1977 42 14. Temperature data for COST No. 1 well 43 15. Sandstone petrography of COST No. 1 well 48 16. Petrography of sandstone samples from northwest of Border Ranges fault 70 17. Petrography of sandstone samples from southeast of Border Ranges fault 71 18. Magmatic arcs, stratigraphic terranes, and accreted terranes of Cook Inlet
Shelikof Strait area 88
VI Contents
Geologic Studies of the Lower Cook Inlet COST No. 1 Well, Alaska Outer Continental Shelf Leslie B. Magoon, Editor
Abstract 1. The COST No. 1 well was
drilled in 65 m (214 ft) of water and penetrated 3,776 m (12,387 ft) of sedi· mentary rocks in the Alaska Outer Continental Shelf (OCS) block 489 about midway between the lniskin Peninsula on the northwest and the Kenai Peninsula on the southeast. The ages of the sedimentary units were determined by wireline logs and the analysis of foraminifers, radiolarians, calcareous nannoplankton, and marine and terrestrial palynomorphs. The section from 413 m (1 ,356ft) to 797 m (2,615 ft) is Cenozoic. The underlying section, from 797 m (2,615 ft) to 2,112 m (6,930 ft), is Cretaceous; at 1,541 m (5,055 ft) the section is divided into Upper and Lower Cretaceous rocks. The bottom section, from 2,112 m (6,930 ft), to 3,775.6 m (12,387 ft), is Upper Jurassic (Oxfordian through Tithonian). The base of this section probably was not penetrated so the 1,663 m (5,455 ft) thickness is probably a minimum. The top of this unit is controversial. Drill cutting samples indicate that the top is at 2,109 m (6,918 ft), 2,112 m (6,928 ft), or2,135 m (7003 ft). Paleontologic evidence indicates that the top is at2,109 m (6,918 ft) or2,417 m (7,930 ft). I place the top at 2,112 m (6,930 ft), just below the abundant Inoceramus fragments and just above the first occurrence of laumontite.
The West Foreland Formation, of early Cenozoic age, extends down to 797 m (2,615 ft). The sediments are sandstone, siltstone, coal, and some conglomerate. Modal analyses of the sandstone indicate that it is feldspatholithic with an average composition of Q 23F30L4r The Kaguyak Formation (Upper Cretaceous), from 797 m (2,615 ft) to 1,541 m (5,055 ft) contains marine and nonmarine sediments. The feldspathic sandstone has
an average composition of Q23F61 L16•
The Herendeen Limestone (Lower Cretaceous) contains sandstone, siltstone, shale and abundant Inoceramus fragments from 1,541 m (5,055 ft) to 2,112 m (6,930 ft). The lithofeldspathic sandstone has an average composition of Q 36F 44L20 . The bottom section, the Naknek Formation (Upper jurassic), down to 3,776 m (12,387 ft), is dominantly siltstone, shale, and sandstone. The average composition of the lithofeldspathic sandstone is Q 24F55L21 •
The West Foreland Formation, the shallowest unit sampled, has a minimum thickness of 384m (1 ,259ft). Paleontologic data indicate Mesozoic rocks were reworked in a nonmarine environment. The organic carbon content of the unit is low and the section is thermally immature. No hydrocarbon shows were indicated. The Kaguyak Formation is 744 m (2,440 ft) thick and includes three sandstone bodies that are potential hydrocarbon reservoirs. Paleontologic and lithologic evidence indicate two prograding sedimentary sequences that prograde seaward from an upper bathyal environment to nonmarine. Although the organic carbon content is as much as 1.07 weight percent, the kerogen is low in oil-prone material and lacks an adequate thermal history to generate oil. Two different hydrocarbon shows were reported in this unit. The Herendeen Limestone is 572 m (1 ,875 ft) thick. Foraminiferal data indicate that it formed in middle bathyal to inner neritic marine environments. The organic carbon content is low, and the thermal history is insufficient to generate hydrocarbons. Only a few hydrocarbon indications were reported. Reservoir properties of the sandstones are poor. The deepest rock unit penetrated, Naknek
Formation, is at least 1,663 m (5,457 ft) thick. Even though the rock is thoroughly cemented with laumontite, it contained most of the hydrocarbon shows. Since the strata, mostly sandstone and siltstone, is low in organic content, and the organic matter is not the type to generate oil, the oil must have migrated into the area of the well bore from another part of the basin where mature oil-prone source rocks were present.
2. Information about the environmental geology of the lower Cook Inlet basin is limited; and no quantitative information has been collected from the upper Cook Inlet basin.
A number of geologic features and processes have been identified that may pose problems to engineering installations in the lower Cook Inlet and along the adjacent coastline. Strong earthquakes have caused major damage to the area by ground failure, surface warping, and tsunamis. Four active volcanoes on the west side of lower Cook Inlet are andesitic, so they can have violent eruptions. Very little is known about the swift bottom currents and sandwaves that have broken pipelines in the upper Cook Inlet.
3. The seismic horizons were determined by comparing the measured seismic reflections with the calculated reflections from the COST No. 1-well. Horizon A, at 900 m (2,950 ft) depth in the well, is near the top of the Upper Cretaceous rocks. Horizon B is at the depth of 2,005 m (6,575 ft) in the well. That depth represents the Cretaceous-jurassic contact where the rocks no longer have intergranular porosity but are cemented with calcite and laumontite. The third horizon, C, is 1,400 m (4,600 ft) below the bottom ofthe well and about 3,100 m (10,200 ft)
Abstract
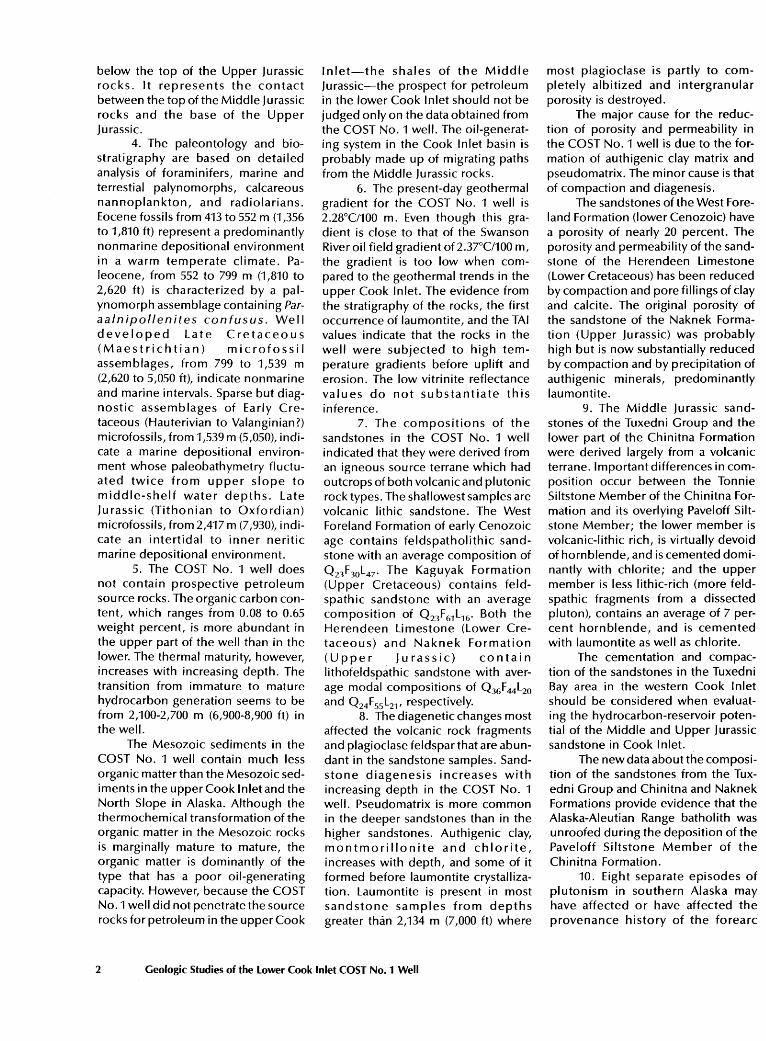
below the top of the Upper jurassic rocks. It represents the contact between the top of the Middle Jurassic rocks and the base of the Upper Jurassic.
4. The paleontology and biostratigraphy are based on detailed analysis of foraminifers, marine and terrestial palynomorphs, calcareous nannoplankton, and radiolarians. Eocene fossils from 413 to 552 m (1 ,356 to 1,810 ft) represent a predominantly nonmarine depositional environment in a warm temperate climate. Paleocene, from 552 to 799 m (1 ,810 to 2,620 ft) is characterized by a palynomorph assemblage containing Paraalnipollenites confusus. Well developed late Cretaceous (Maestrichtian) microfossil assemblages, from 799 to 1,539 m (2,620 to 5,050 ft), indicate nonmarine and marine intervals. Sparse but diagnostic assemblages of Early Cretaceous (Hauterivian to Valanginian?) microfossils, from 1,539 m (5,050), indicate a marine depositional environment whose paleobathymetry fluctuated twice from upper slope to middle-shelf water depths. late Jurassic (Tithonian to Oxfordian) microfossils, from 2,417 m (7,930), indicate an intertidal to inner neritic marine depositional environment.
5. The COST No. 1 well does not contain prospective petroleum source rocks. The organic carbon content, which ranges from 0.08 to 0.65 weight percent, is more abundant in the upper part of the well than in the lower. The thermal maturity, however, increases with increasing depth. The transition from immature to mature hydrocarbon generation seems to be from 2,100-2,700 m (6,900-8,900 ft) in the well.
The Mesozoic sediments in the COST No. 1 well contain much less organic matter than the Mesozoic sediments in the upper Cook Inlet and the North Slope in Alaska. Although the thermochemical transformation of the organic matter in the Mesozoic rocks is marginally mature to mature, the organic matter is dominantly of the type that has a poor oil-generating capacity. However, because the COST No.1 well did not penetrate the source rocks for petroleum in the upper Cook
Inlet-the shales of the Middle Jurassic-the prospect for petroleum in the lower Cook Inlet should not be judged only on the data obtained from the COST No. 1 well. The oil-generating system in the Cook Inlet basin is probably made up of migrating paths from the Middle Jurassic rocks.
6. The present-day geothermal gradient for the COST No. 1 well is 2.28°C/100 m. Even though this gradient is close to that of the Swanson River oil field gradient of2.37°C/100 m, the gradient is too low when compared to the geothermal trends in the upper Cook Inlet. The evidence from the stratigraphy of the rocks, the first occurrence of laumontite, and the TAl values indicate that the rocks in the well were subjected to high temperature gradients before uplift and erosion. The low vitrinite reflectance values do not substantiate this inference.
7. The compositions of the sandstones in the COST No. 1 well indicated that they were derived from an igneous source terrane which had outcrops of both volcanic and plutonic rock types. The shallowest samples are volcanic lithic sandstone. The West Foreland Formation of early Cenozoic age contains feldspatholithic sandstone with an average composition of Q 23 F30 l 47 . The Kaguyak Formation (Upper Cretaceous) contains feldspathic sandstone with an average composition of Q 23F 61 l 16• Both the Herendeen limestone (lower Cretaceous) and Naknek Formation (Upper Jurassic) contain lithofeldspathic sandstone with average modal compositions of Q36F 44 l 20
and Q24F55 l 211 respectively. 8. The diagenetic changes most
affected the volcanic rock fragments and plagioclase feldspar that are abundant in the sandstone samples. Sandstone diagenesis increases with increasing depth in the COST No. 1 well. Pseudomatrix is more common in the deeper sandstones than in the higher sandstones. Authigenic clay, montmorillonite and chlorite, increases with depth, and some of it formed before laumontite crystallization. laumontite is present in most sandstone samples from depths greater than 2,134 m (7,000 ft) where
2 Geologic Studies of the Lower Cook Inlet COST No. 1 Well
most plagioclase is partly to completely albitized and intergranular porosity is destroyed.
The major cause for the reduction of porosity and permeability in the COST No.1 well is due to the formation of authigenic clay matrix and pseudomatrix. The minor cause is that of compaction and diagenesis.
The sandstones of the West Foreland Formation (lower Cenozoic) have a porosity of nearly 20 percent. The porosity and permeability of the sandstone of the Herendeen limestone (lower Cretaceous) has been reduced by compaction and pore fillings of clay and calcite. The original porosity of the sandstone of the Naknek Formation (Upper Jurassic) was probably high but is now substantially reduced by compaction and by precipitation of authigenic minerals, predominantly laumontite.
9. The Middle Jurassic sandstones of the Tuxedni Group and the lower part of the Chinitna Formation were derived largely from a volcanic terrane. Important differences in composition occur between the lonnie Siltstone Member of the Chinitna Formation and its overlying Paveloff Siltstone Member; the lower member is volcanic-lithic rich, is virtually devoid of hornblende, and is cemented dominantly with chlorite; and the upper member is less lithic-rich (more feldspathic fragments from a dissected pluton), contains an average of 7 percent hornblende, and is cemented with laumontite as well as chlorite.
The cementation and compaction of the sandstones in the Tuxedni Bay area in the western Cook Inlet should be considered when evaluating the hydrocarbon-reservoir potential of the Middle and Upper Jurassic sandstone in Cook Inlet.
The new data about the composition of the sandstones from the Tuxedni Group and Chinitna and Naknek Formations provide evidence that the Alaska-Aleutian Range batholith was unroofed during the deposition of the Paveloff Siltstone Member of the Chinitna Formation.
10. Eight separate episodes of plutonism in southern Alaska may have affected or have affected the provenance history of the forearc
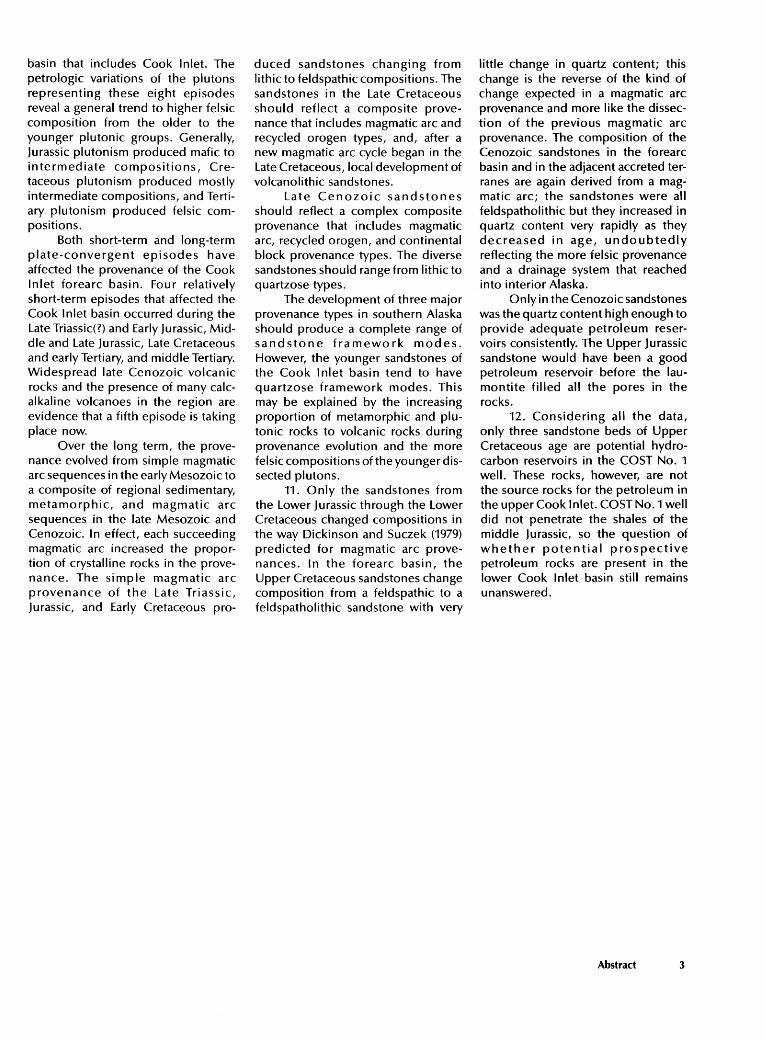
basin that includes Cook Inlet. The petrologic variations of the plutons representing these eight episodes reveal a general trend to higher felsic composition from the older to the younger plutonic groups. Generally, Jurassic plutonism produced mafic to intermediate compositions, Cretaceous plutonism produced mostly intermediate compositions, and Tertiary plutonism produced felsic compositions.
Both short-term and long-term plate-convergent episodes have affected the provenance of the Cook Inlet forearc basin. Four relatively short-term episodes that affected the Cook Inlet basin occurred during the Late Triassic(?) and Early jurassic, Middle and Late Jurassic, Late Cretaceous and early Tertiary, and middle Tertiary. Widespread late Cenozoic volcanic rocks and the presence of many calcalkaline volcanoes in the region are evidence that a fifth episode is taking place now.
Over the long term, the provenance evolved from simple magmatic arc sequences in the early Mesozoic to a composite of regional sedimentary, metamorphic, and magmatic arc sequences in the late Mesozoic and Cenozoic. In effect, each succeeding magmatic arc increased the proportion of crystalline rocks in the provenance. The simple magmatic arc provenance of the Late Triassic, jurassic, and Early Cretaceous pro-
duced sandstones changing from lithic to feldspathic compositions. The sandstones in the Late Cretaceous should reflect a composite provenance that includes magmatic arc and recycled orogen types, and, after a new magmatic arc cycle began in the Late Cretaceous, local development of volcanolithic sandstones.
Late Cenozoic sandstones should reflect a complex composite provenance that includes magmatic arc, recycled orogen, and continental block provenance types. The diverse sandstones should range from lithic to quartzose types.
The development of three major provenance types in southern Alaska should produce a complete range of sandstone framework modes. However, the younger sandstones of the Cook Inlet basin tend to have quartzose framework modes. This may be explained by the increasing proportion of metamorphic and plutonic rocks to volcanic rocks during provenance evolution and the more felsic compositions of the younger dissected plutons.
11. Only the sandstones from the Lower jurassic through the Lower Cretaceous changed compositions in the way Dickinson and Suczek (1979) predicted for magmatic arc provenances. In the forearc basin, the Upper Cretaceous sandstones change composition from a feldspathic to a feldspatholithic sandstone with very
little change in quartz content; this change is the reverse of the kind of change expected in a magmatic arc provenance and more like the dissection of the previous magmatic arc provenance. The composition of the Cenozoic sandstones in the forearc basin and in the adjacent accreted terranes are again derived from a magmatic arc; the sandstones were all feldspatholithic but they increased in quartz content very rapidly as they decreased in age, undoubtedly reflecting the more felsic provenance and a drainage system that reached into interior Alaska.
Only in the Cenozoic sandstones was the quartz content high enough to provide adequate petroleum reservoirs consistently. The Upper jurassic sandstone would have been a good petroleum reservoir before the laumontite filled all the pores in the rocks.
12. Considering all the data, only three sandstone beds of Upper Cretaceous age are potential hydrocarbon reservoirs in the COST No. 1 well. These rocks, however, are not the source rocks for the petroleum in the upper Cook Inlet. COST No.1 well did not penetrate the shales of the middle jurassic, so the question of whether potential prospective petroleum rocks are present in the lower Cook Inlet basin still remains unanswered.
Abstract 3

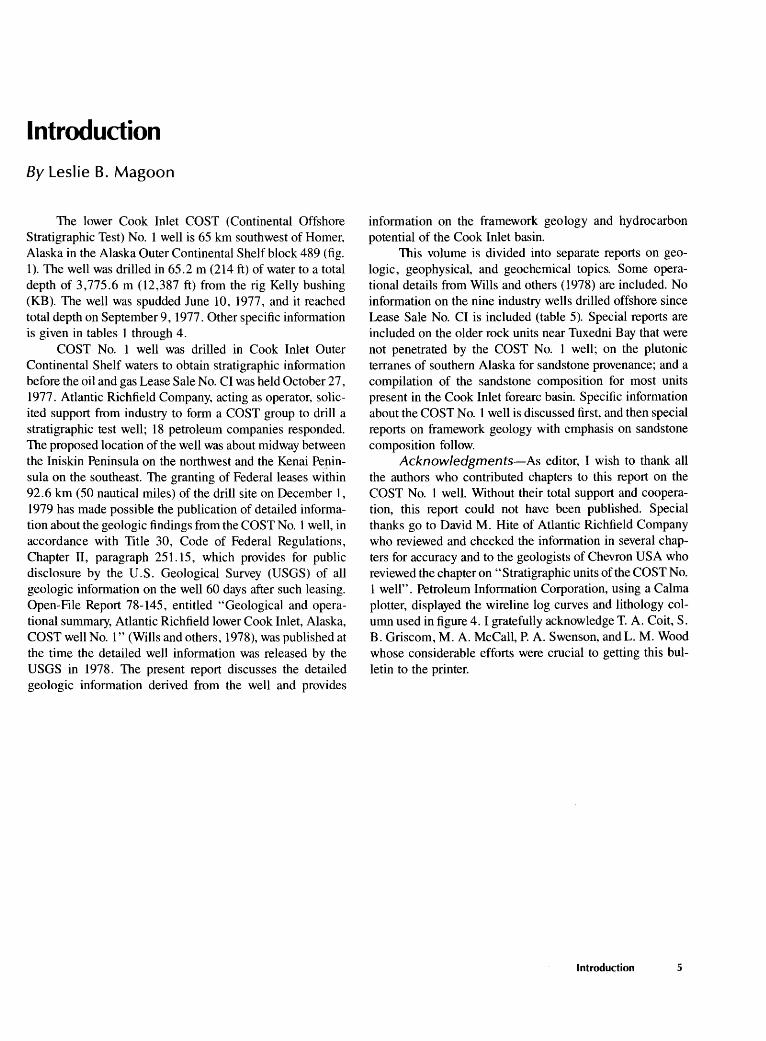
Introduction
By Leslie B. Magoon
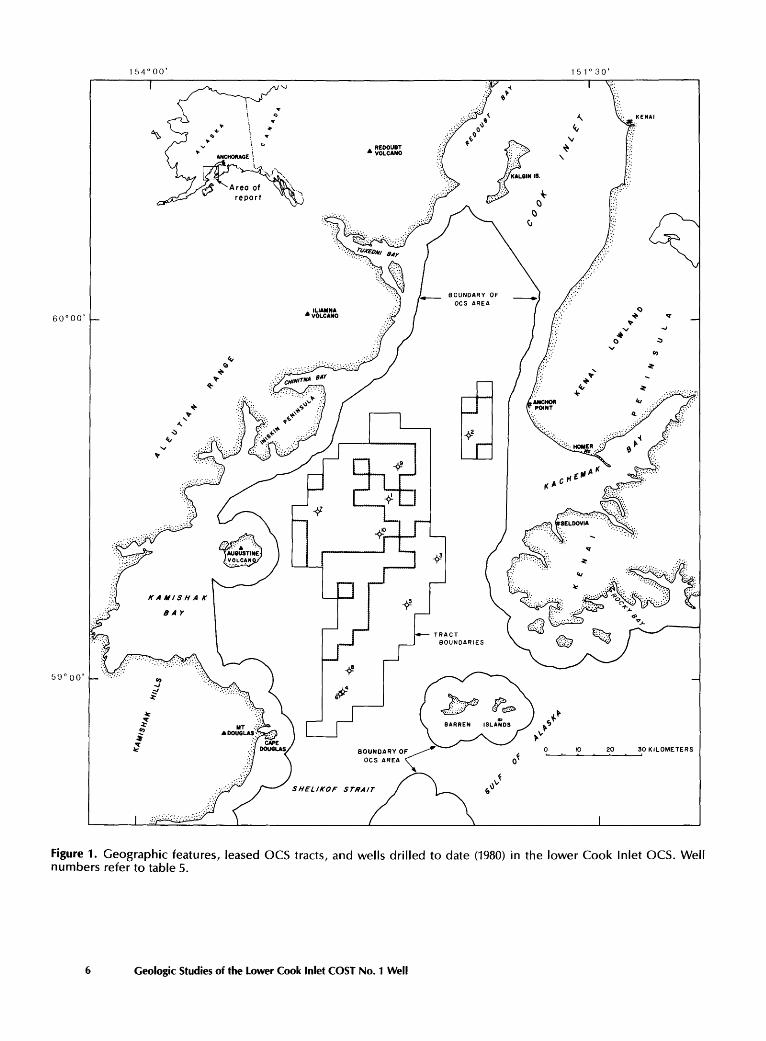
The lower Cook Inlet COST (Continental Offshore Stratigraphic Test) No. 1 well is 65 km southwest of Homer, Alaska in the Alaska Outer Continental Shelf block 489 (fig. 1). The well was drilled in 65.2 m (214ft) of water to a total depth of 3,775.6 m (12,387 ft) from the rig Kelly bushing (KB). The well was spudded June 10, 1977, and it reached total depth on September 9, 1977. Other specific information is given in tables 1 through 4.
COST No. 1 well was drilled in Cook Inlet Outer Continental Shelf waters to obtain stratigraphic information before the oil and gas Lease Sale No. CI was held October 27, 1977. Atlantic Richfield Company, acting as operator, solicited support from industry to form a COST group to drill a stratigraphic test well; 18 petroleum companies responded. The proposed location of the well was about midway between the Iniskin Peninsula on the northwest and the Kenai Peninsula on the southeast. The granting of Federal leases within 92.6 km (50 nautical miles) of the drill site on December 1, 1979 has made possible the publication of detailed information about the geologic findings from the COST No. 1 well, in accordance with Title 30, Code of Federal Regulations, Chapter II, paragraph 251.15, which provides for public disclosure by the U.S. Geological Survey (USGS) of all geologic information on the well 60 days after such leasing. Open-File Report 78-145, entitled "Geological and operational summary, Atlantic Richfield lower Cook Inlet, Alaska, COST well No. 1" (Wills and others, 1978), was published at the time the detailed well information was released by the USGS in 1978. The present report discusses the detailed geologic information derived from the well and provides
information on the framework geology and hydrocarbon potential of the Cook Inlet basin.
This volume is divided into separate reports on geologic, geophysical, and geochemical topics. Some operational details from Wills and others (1978) are included. No information on the nine industry wells drilled offshore since Lease Sale No. CI is included (table 5). Special reports are included on the older rock units near Tuxedni Bay that were not penetrated by the COST No. 1 well; on the plutonic terranes of southern Alaska for sandstone provenance; and a compilation of the sandstone composition for most units present in the Cook Inlet forearc basin. Specific information about the COST No. 1 well is discussed first, and then special reports on framework geology with emphasis on sandstone composition follow.
Acknowledgments-As editor, I wish to thank all the authors who contributed chapters to this report on the COST No. 1 well. Without their total support and cooperation, this report could not have been published. Special thanks go to David M. Hite of Atlantic Richfield Company who reviewed and checked the information in several chapters for accuracy and to the geologists of Chevron USA who reviewed the chapter on "Stratigraphic units of the COST No. 1 well". Petroleum Information Corporation, using a Calma plotter, displayed the wireline log curves and lithology column used in figure 4. I gratefully acknowledge T. A. Coit, S. B. Griscom, M. A. McCall, P. A. Swenson, and L. M. Wood whose considerable efforts were crucial to getting this bulletin to the printer.
Introduction 5
154°00'
60° 00'
59° oo·
.
J N IS.
0*:: 0
BOUNDARY OF OCS AREA
IJ
0
151° 30'
KENAI
10 20 30 KILOMETERS ~~~--~~~~
Figure 1. Geographic features, leased OCS tracts, and wells drilled to date (1980) in the lower Cook Inlet OCS. Well numbers refer to table 5.
6 Geologic Studies of the Lower Cook Inlet COST No. 1 Well
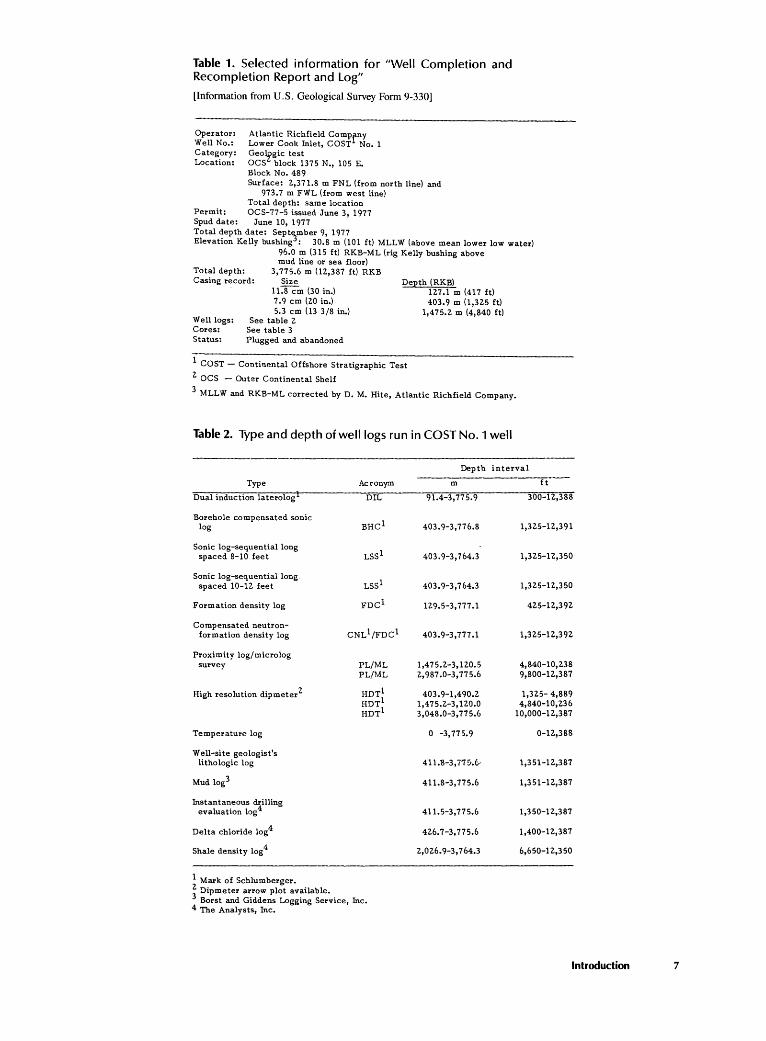
Table 1. Selected information for "Well Completion and Recompletion Report and Log"
[Information from U.S. Geological Survey Form 9-330]
Operator: Atlantic Richfield CompF.y Well No.: Lower Cook Inlet, COST No. 1 Category: Geot,~.>gic test Location: OCS block 1375 N., 105 E.
Block No. 489 Surface: 2,371.8 m FNL (from north line) and
973.7 m FWL (from west line) Total depth: same location
Permit: OCS-77-5 issued June 3, 1977 Spud date: June 10, 1977 Total depth date: Sept~mber 9, 1977 Elevation Kelly bushing : 30.8 m (101 ft) MLLW (above mean lower low water)
96.0 m (315 ft) RKB-ML (rig Kelly bushing above mud line or sea floor)
Total depth: 3,775.6 m (12,387 ft) RKB Casing record: Size
ll-:8"7m (30 in.) 7.9 em (20 in.)
Depth (RKB)
Well logs: Cores: Status:
5.3 em (13 3/8 in.) See table 2
See table 3 Plugged and abandoned
1 COST - Continental Offshore Stratigraphic Test 2 OCS - Outer Continental Shelf
127.1 m (417ft) 403.9 m (1,325 ft)
1,475.2 m (4,840 ft)
3 MLLW and RKB-ML corrected by D. M. Hite, Atlantic Richfield Company.
Table 2. Type and depth of well logs run in COST No.1 well
Type
Dual induction laterologl
Borehole compensated sonic log
Sonic log-sequential long spaced 8-10 feet
Sonic log-sequential long. spaced 10-12 feet
Formation density log
Compensated neutronformation density log
Proximity log/microlog survey
High resolution dipmeter2
Temperature log
Well-site geologist's lithologic log
Mud log3
Instantaneous drilling evaluation log4
Delta chloride log4
Shale density log4
1 Mark of Schlumberger.
Acronym
DIL
PL/ML PL/ML
HDT1
HDT1
HDT1
2 Dipmeter arrow plot available. 3 Borst and Giddens Logging Service, Inc. 4 The Analysts, Inc.
Depth interval
m ft
91.4-3,775.9 300-12,388
403.9-3,776.8 1,325-12,391
403.9-3,764.3 1,325-12,350
403.9-3,764.3 1,325-12,350
129.5-3,777.1 425-12,392
403.9-3,777.1 1,325-12,392
1,475.2-3,120.5 4,840-10,238 2,987.0-3,775.6 9,800-12,387
403.9-1,490.2 1,325- 4,889 1,475.2-3,120.0 4,840-10,236 3,048.0-3,775.6 10,000-12,387
0 -3,775.9 0-12,388
411.8-3, 7'7 :i.C.. 1,351-12,387
411.8-3,775.6 1,351-12,387
411.5-3,775.6 1,3 50-12,387
426.7-3,775.6 1,400-12,387
2,026. 9-3,764.3 6,650-12,350
Introduction 7
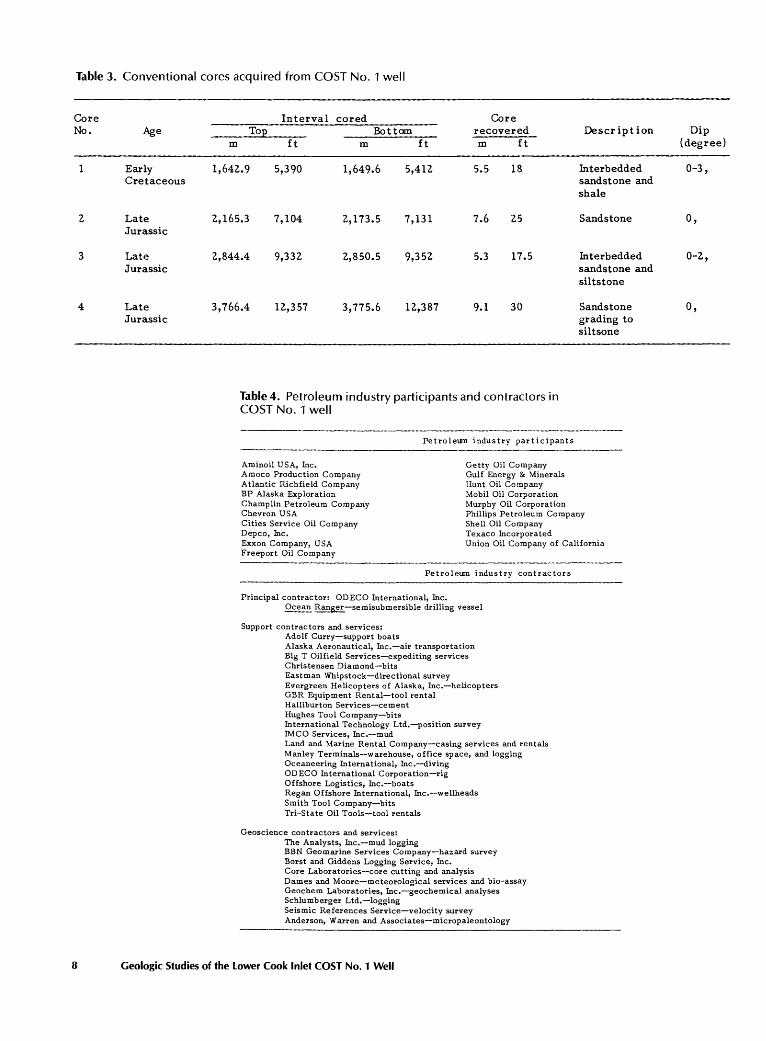
Table 3. Conventional cores acquired from COST No. 1 well
Core No.
1
2
3
4
8
Age
Early Cretaceous
Late Jurassic
Late Jurassic
Late Jurassic
Interval cored Core Top Bottom recovered Description
m ft m ft m ft
1,642.9 5,390 1,649.6 5,412 5.5 18 Interbedded
2,165.3 7,104 2,173.5 7,131 7.6 25
2,844.4 9,332 2,850.5 9,352 5.3 17.5
3, 766.4 12,357 3,775.6 12,387 9.1 30
Table 4. Petroleum industry participants and contractors in COST No.1 well
Aminoil USA, Inc.
Petroleum industry participants
Getty Oil Company Gulf Energy & Minerals Hunt Oil Company
sandstone and shale
Sandstone
Interbedded sandstone and siltstone
Sandstone grading to siltsone
Amoco Production Company Atlantic Richfield Company BP Alaska Exploration Champlin Petroleum Company Chevron USA Cities Service Oil Company Depco, Inc.
Mobil Oil Corporation Murphy Oil Corporation Phillips Petroleum Company Shell Oil Company
Exxon Company, USA Freeport Oil Company
Texaco Incorporated Union Oil Company of California
Petroleum industry contractors
Principal contractor: ODECO International, Inc. Ocean Ranger-semisubmersible drilling vessel
Support contractors and services: Adolf Curry-support boats Alaska Aeronautical, Inc.-air transportation Big T Oilfield Services-expediting services Christensen Diamond-bits Eastman Whipstock-directional survey Evergreen Helicopters of Alaska, Inc.-helicopters GBR Equipment Rental-tool rental Halliburton Services-cement Hughes Tool Company-bits International Technology Ltd.-position survey IMCO Services, Inc.-mud Land and Marine Rental Company-casing services and rentals Manley Terminals-warehouse, office space, and logging Oceaneering International, Inc.-diving ODECO International Corporation-rig Offshore Logistics, Inc.--boats Regan Offshore International, Inc.-wellheads Smith Tool Company-bits Tri-State Oil Tools-tool rentals
Geoscience contractors and services: The Analysts, Inc.-mud logging BBN Geomarine Services Company-hazard survey Borst and Giddens Logging Service, Inc. Core Laboratories-core cutting and analysis Dames and Moore-meteorological services and bio-assay Geochem Laboratories, Inc.-geochemical analyses Schlumberger Ltd.-logging Seismic References Service-velocity survey Anderson, Warren and Associates-micropaleontology
Geologic Studies of the lower Cook Inlet COST No. 1 Well
Dip (degree)
0-3,
o,
0-2,
o,
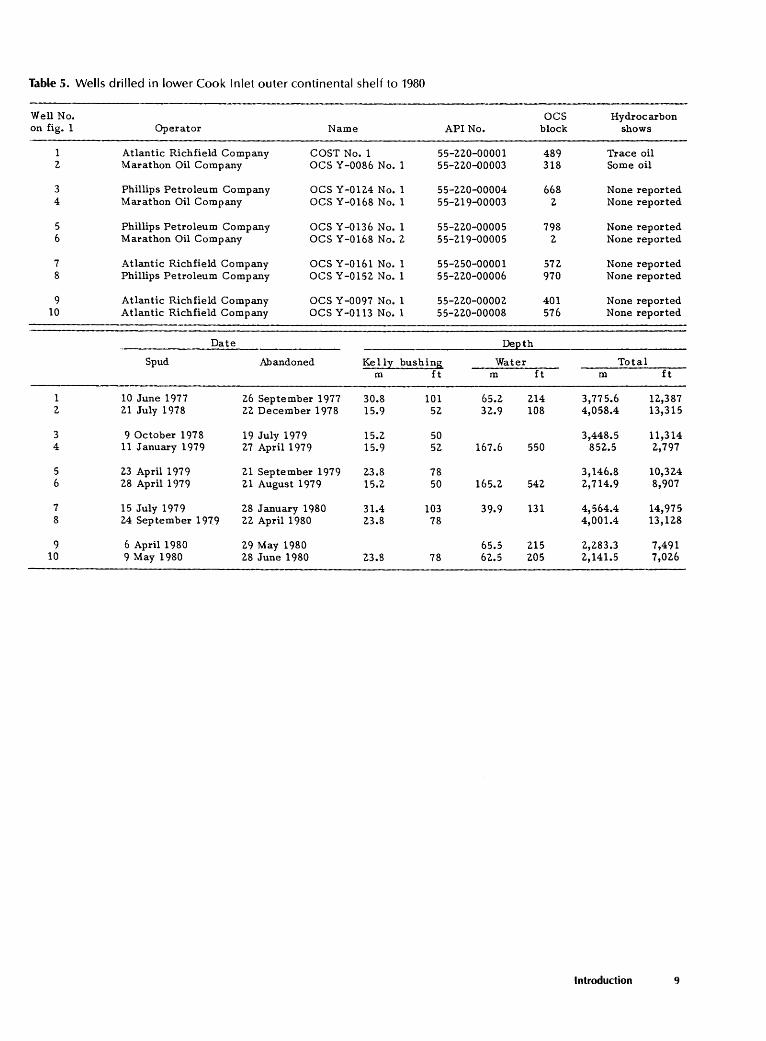
Table 5. Wells drilled in lower Cook Inlet outer continental shelf to 1980
Well No. ocs Hydrocarbon on fig. 1 Operator Name API No. block shows
1 Atlantic Richfield Company COST No.1 55-220-00001 489 Trace oil 2 Marathon Oil Company OCS Y -0086 No. 1 55-220-00003 318 Some oil
3 Phillips Petroleum Company OCS Y-012.4 No. 1 55-220-00004 668 None reported 4 Marathon Oil Company OCS Y-0168 No. 1 55-219-Q0003 2 None reported
5 Phillips Petroleum Company OCS Y -0136 No. 1 55-220-00005 798 None reported 6 Marathon Oil Company OCS Y-0168 No.2 55-219-00005 2 None reported
7 Atlantic Richfield Company OCS Y-0161 No. 1 55-250-00001 572 None reported 8 Phillips Petroleum Company OCS Y-0152 No.1 55-220-00006 970 None reported
9 Atlantic Richfield Company OCS Y -0097 No. 1 55-220-00002 401 None reported 10 Atlantic Richfield Company OCS Y -0113 No. 1 55-220-00008 576 None reported
Date De th
Spud Abandoned Kelly bushing Water Total m ft m ft m ft
1 10 June 1977 26 September 1977 30.8 101 65.2 214 3,775.6 12,387 2 21 July 1978 22 December 1978 15.9 52 32.9 108 4,058.4 13,315
3 9 October 1978 19July1979 15.2 50 3,448.5 11,314 4 11 January 1979 27 April 1979 15.9 52 167.6 550 852.5 2,797
5 23 April 1979 21 September 1979 23.8 78 3,146.8 10,324 6 28 April 1979 21 August 1979 15.2 50 165.2 542 2,714.9 8,907
7 15 July 1979 28 January 1980 31.4 103 39.9 131 4,564.4 14,975 8 24 September 1979 22 April 1980 23.8 78 4,001.4 13,128
9 6 April 1980 29 May 1980 65.5 215 2,283.3 7,491 10 9 May 1980 28 June 1980 23.8 78 62.5 205 2,141.5 7,026
Introduction 9

Environmental Geology
By Arnold H. Bouma1 and Monty A. Hampton
INTRODUCTION
Information about the environmental geology of the lower Cook Inlet is limited. Oceanographic studies and a monitoring program were conducted while the COST No. 1 well was being drilled (Miller and others, 1978). The semisubmersible, Ocean Ranger, was moored at lat 59° 31' 06.3445" N. and long 152 38' 36.6037" W. in lease block No. 489 in a water depth of 65.2 m (214ft). Also the U.S. Geological Survey made cruises to the lower Cook Inlet in 1976-79. Data on sand waves and other bedforms were obtained from high-resolution seismic-reflection profiling, side-scan sonar surveying, bottom television and camera observations, bottom sampling, a limited number of vertical current profiles, and a few longer term current measurements. From these data and other published information, a number of geologic features and processes have been identified that may pose problems to engineering installations in lower Cook Inlet and along the adjacent coastline. Strong earthquakes (14 have occurred since 1920) have caused major damage to the area by ground failure, surface warping, and tsunamis. The four active volcanoes on the west side of lower Cook Inlet are andesitic; therefore they can have relatively violent eruptions. The most recent eruption was in 1979. Swift bottom currents and sand waves are known to break pipelines. Very little is known about their characteristics.
Oil and gas have been produced for several years in the upper Cook Inlet, but little quantitative information has been accumulated that can be applied to the lower Cook Inlet.
BATHYMETRY AND MORPHOLOGY
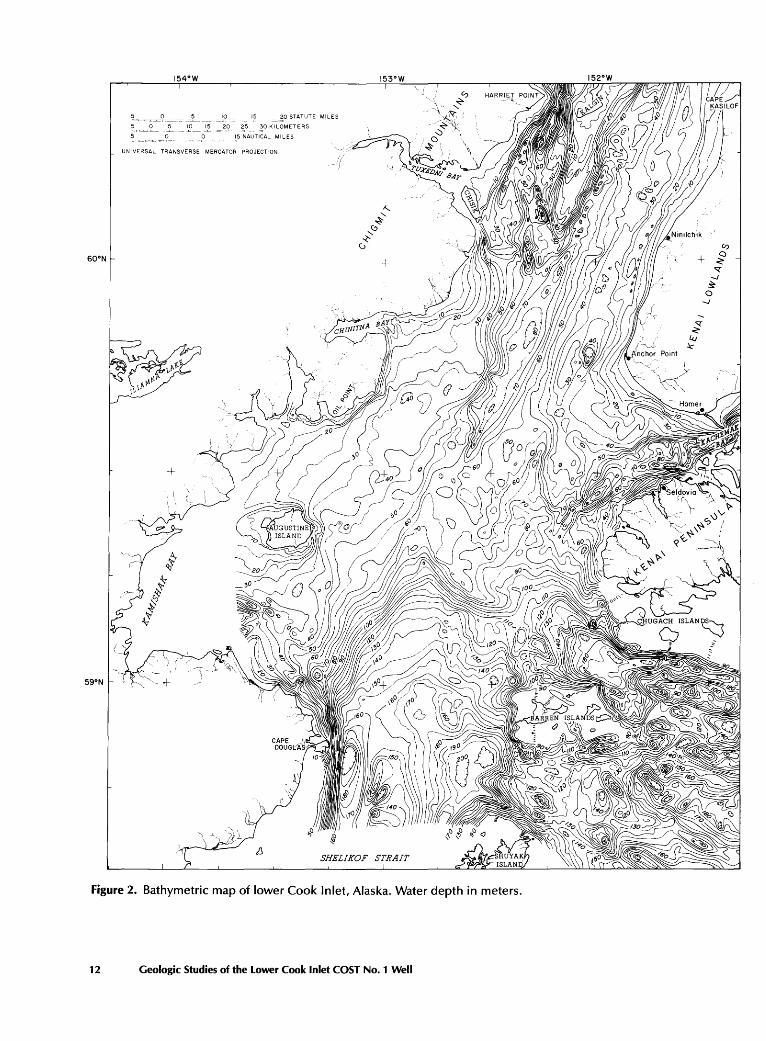
The bathymetry of lower Cook Inlet is complex (Bouma and others, 1978b). A boomerang-shaped ramp at about lat 59° 20' N. divides the area into a northern part that generally is shallower than 70 m (230 ft) and a southern part that is deeper than 120 m (394 ft) (fig. 2). In the northern part, a central axial depression (Cook Trough) is flanked by shallow shelflike areas. A relatively deep trough parallels the northeast shore of the Kenai Peninsula and ends in Kachemak Bay. The southern part is marked by local closed depressions. Water depth increases from south of the ramp into Shelikof Strait. Under Kennedy and Stevenson Entrances on either side of the Barren Islands, the sea floor has a complex morphology of ridges and troughs.
1 Gulf Corporation.
HAZARDS
Water Currents
The circulation of water in the lower Cook Inlet is affected by several factors. Water entering the inlet from the Gulf of Alaska is pushed by the counterclockwise Alaskan gyre through the Kennedy and Stevenson Entrances. Strong tidal effects are superimposed on the currents (Muench and others, 1978). Most of the water flows along the ramp and down into Shelikof Strait; the rest of the water flows up the inlet along the east side into Kachemak Bay. Cross currents move part of this water westward. The west side of the inlet is dominated by ebb tides (Burbank, 1977).
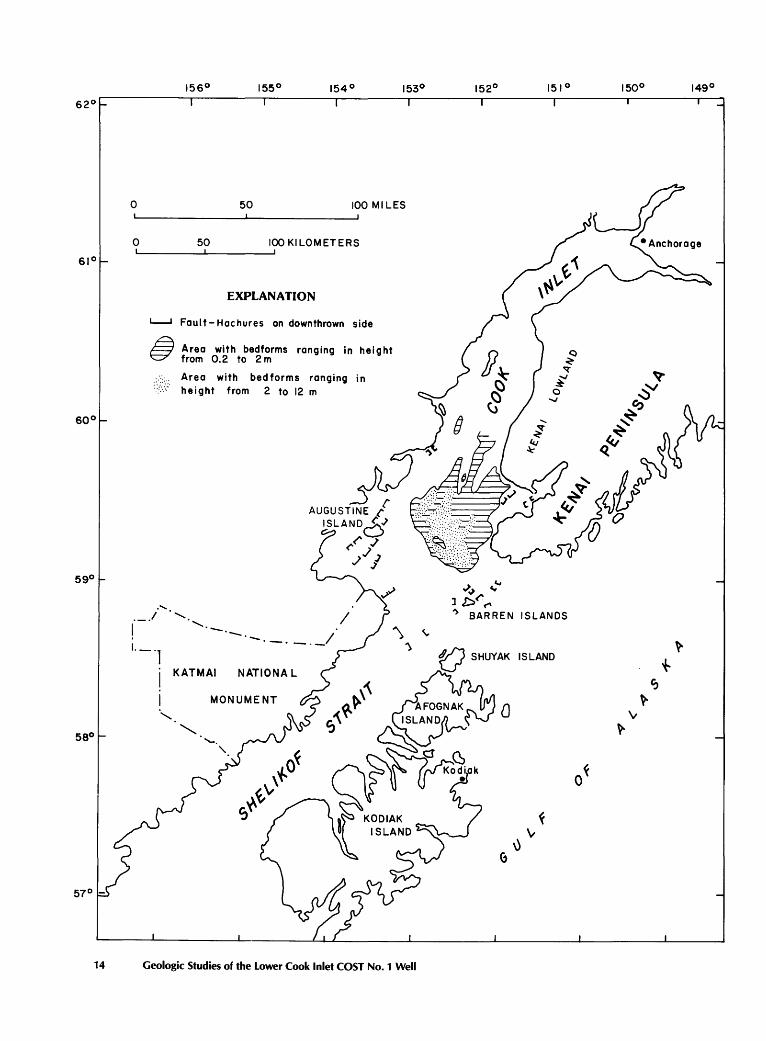
Sand waves and other bedforms cover the sea floor off the coast of the Kenai Lowland and Kenai Peninsula. The area is roughly 50 km (80 mi) in diameter (fig. 3) and the bedforms range in height from 0.2 to 12m (0. 7-40ft). Swift bottom currents formed these bedforms in the past; how active the bottom currents are at present is unknown.
Seismic Activity
Since 1920, 14 earthquakes of magnitude 6 or greater have occurred within the lower Cook Inlet area. Earthquakes of this size typically can produce major damage to manmade structures, either directly by ground shaking, surface faulting, and surface warping, or indirectly by ground failure, sediment consolidation, and tsunamis (seismic sea waves).
Tsunamis can be considered hazardous in the lower Cook Inlet area. They caused more loss of life than any other effect of the 1964 earthquake. They also caused damage along the east coast of the inlet, at Rocky Bay and Seldovia, but not along the west coast of the inlet.
Tsunamis are generated when large volumes of water are suddenly displaced, either by tectonic displacement of the sea floor or by large rockfalls or landslides. The narrow, elongate geometry of Cook Inlet and its narrow entrances reduce the chance that a tsunami generated outside the inlet will propagate significant destructive energy into it. Nevertheless, local tsunamis can be exceptionally large; for example, a surge of water ran 530 m (1, 750ft) up the wooded slopes of Lituya Bay in the Gulf of Alaska during the southeastern Alaska earthquake in 1958.
Sediment consolidation and its resulting subsidence can be another hazard in the lower Cook Inlet. This seismicrelated hazard causes flooding along coastlines and con-
Environmental Geology 11
20 2,5 ~0 KILOMETERS
10 15 NAUTICAL MILES
UNIVERSAL TRANSVERSE MERCATOR PROJECTION
+
+
SHELIKOF STRAIT
Figure 2. Bathymetric map of lower Cook Inlet, Alaska. Water depth in meters.
12 Geologic Studies of the Lower Cook Inlet COST No. 1 Well
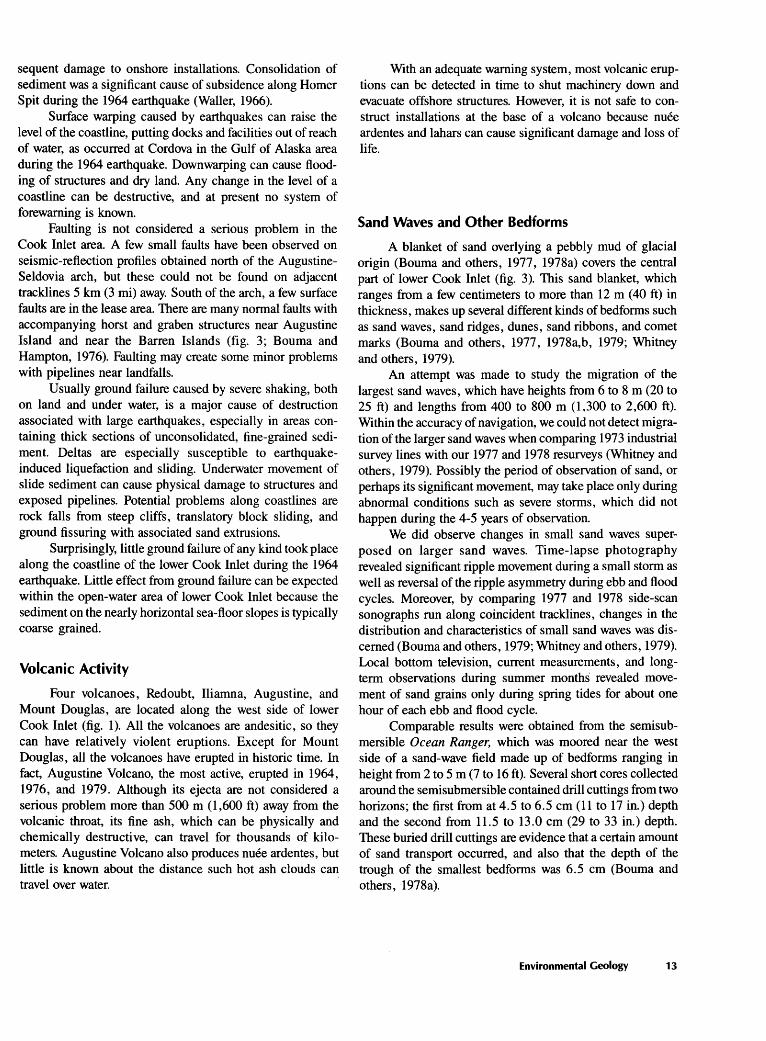
sequent damage to onshore installations. Consolidation of sediment was a significant cause of subsidence along Homer Spit during the 1964 earthquake (Waller, 1966).
Surface warping caused by earthquakes can raise the level of the coastline, putting docks and facilities out of reach of water, as occurred at Cordova in the Gulf of Alaska area during the 1964 earthquake. Downwarping can cause flooding of structures and dry land. Any change in the level of a coastline can be destructive, and at present no system of forewarning is known.
Faulting is not considered a serious problem in the Cook Inlet area. A few small faults have been observed on seismic-reflection profiles obtained north of the AugustineSeldovia arch, but these could not be found on adjacent tracklines 5 km (3 mi) away. South of the arch, a few surface faults are in the lease area. There are many normal faults with accompanying horst and graben structures near Augustine Island and near the Barren Islands (fig. 3; Bouma and Hampton, 1976). Faulting may create some minor problems with pipelines near landfalls.
Usually ground failure caused by severe shaking, both on land and under water, is a major cause of destruction associated with large earthquakes, especially in areas containing thick sections of unconsolidated, fine-grained sediment. Deltas are especially susceptible to earthquakeinduced liquefaction and sliding. Underwater movement of slide sediment can cause physical damage to structures and exposed pipelines. Potential problems along coastlines are rock falls from steep cliffs, translatory block sliding, and ground fissuring with associated sand extrusions.
Surprisingly, little ground failure of any kind took place along the coastline of the lower Cook Inlet during the 1964 earthquake. Little effect from ground failure can be expected within the open-water area of lower Cook Inlet because the sediment on the nearly horizontal sea-floor slopes is typically coarse grained.
Volcanic Activity
Four volcanoes, Redoubt, Iliamna, Augustine, and Mount Douglas, are located along the west side of lower Cook Inlet (fig. 1). All the volcanoes are andesitic, so they can have relatively violent eruptions. Except for Mount Douglas, all the volcanoes have erupted in historic time. In fact, Augustine Volcano, the most active, erupted in 1964, 1976, and 1979. Although its ejecta are not considered a serious problem more than 500 m (1 ,600 ft) away from the volcanic throat, its fine ash, which can be physically and chemically destructive, can travel for thousands of kilometers. Augustine Volcano also produces nuee ardentes, but little is known about the distance such hot ash clouds can travel over water.
With an adequate warning system, most volcanic eruptions can be detected in time to shut machinery down and evacuate offshore structures. However, it is not safe to construct installations at the base of a volcano because nuee ardentes and lahars can cause significant damage and loss of life.
Sand Waves and Other Bedforms
A blanket of sand overlying a pebbly mud of glacial origin (Bouma and others, 1977, 1978a) covers the central part of lower Cook Inlet (fig. 3). This sand blanket, which ranges from a few centimeters to more than 12m (40ft) in thickness, makes up several different kinds of bedforms such as sand waves, sand ridges, dunes, sand ribbons, and comet marks (Bouma and others, 1977, 1978a,b, 1979; Whitney and others, 1979).
An attempt was made to study the migration of the largest sand waves, which have heights from 6 to 8 m (20 to 25 ft) and lengths from 400 to 800 m (1,300 to 2,600 ft). Within the accuracy of navigation, we could not detect migration of the larger sand waves when comparing 1973 industrial survey lines with our 1977 and 1978 resurveys (Whitney and others, 1979). Possibly the period of observation of sand, or perhaps its significant movement, may take place only during abnormal conditions such as severe storms, which did not happen during the 4-5 years of observation.
We did observe changes in small sand waves superposed on larger sand waves. Time-lapse photography revealed significant ripple movement during a small storm as well as reversal of the ripple asymmetry during ebb and flood cycles. Moreover, by comparing 1977 and 1978 side-scan sonographs run along coincident tracklines, changes in the distribution and characteristics of small sand waves was discerned (Bouma and others, 1979; Whitney and others, 1979). Local bottom television, current measurements, and longterm observations during summer months revealed movement of sand grains only during spring tides for about one hour of each ebb and flood cycle.
Comparable results were obtained from the semisubmersible Ocean Ranger, which was moored near the west side of a sand-wave field made up of bedforms ranging in height from 2 to 5 m (7 to 16ft). Several short cores collected around the semisubmersible contained drill cuttings from two horizons; the first from at 4.5 to 6.5 em (11 to 17 in.) depth and the second from 11.5 to 13.0 em (29 to 33 in.) depth. These buried drill cuttings are evidence that a certain amount of sand transport occurred, and also that the depth of the trough of the smallest bedforms was 6. 5 em (Bouma and others, 1978a).
Environmental Geology 13
59°
58°
0 50 100 Ml LES
0 50 100 KILOMETERS
I
EXPLANATION
'---J Fault-Hochures an downthrown side
Q Area with bedforms ranging in height S;t from 0.2 to 2m
....... ._.1
Area with bed forms ranging in height from 2 to 12 m
AUGUSTINE ({ ISLAND8
('I' .) ..;./J
.)
1._.1
I KATMAI NATIONAL
I MONUMENT ·,
14 Geologic Studies of the Lower Cook Inlet COST No.1 Well
..,.>~ 4.tc...
l D~f" ~ BARREN ISLANDS
ISLAND
0
0~
Movement of sand waves and other bedforms can cause severe problems to offshore installations by undermining or burying fixed structures, anchors, semisubmersibles (when pontoons are close to the bottom), and pipelines. This kind of damage commonly occurs to the pipelines in the upper Cook Inlet (Visser, 1969). There, pipelines rupture repeatedly over several years; however others may remain intact for a long time (F. Duthweiler, oral commun., 1978). Environmental data has not been collected continuously in the upper Cook Inlet so there is no quantitative information that can be applied to the problems in the lower Cook Inlet.
Figure 3. Geomorphology of lower Cook Inlet. Surface faults that may be active are shown in two areas (1) Augustine Island and (2) around the Barren Islands.
Environmental Geology 15

Stratigraphic Units of the COST No. 1 Well By Leslie B. Magoon
INTRODUCTION
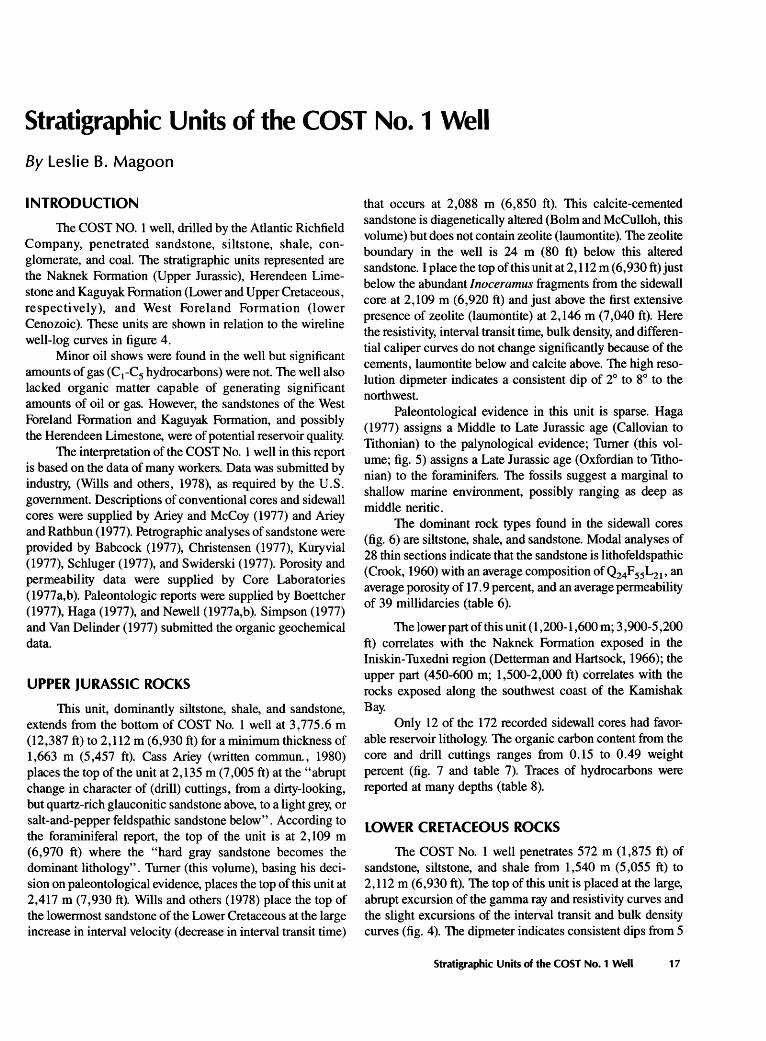
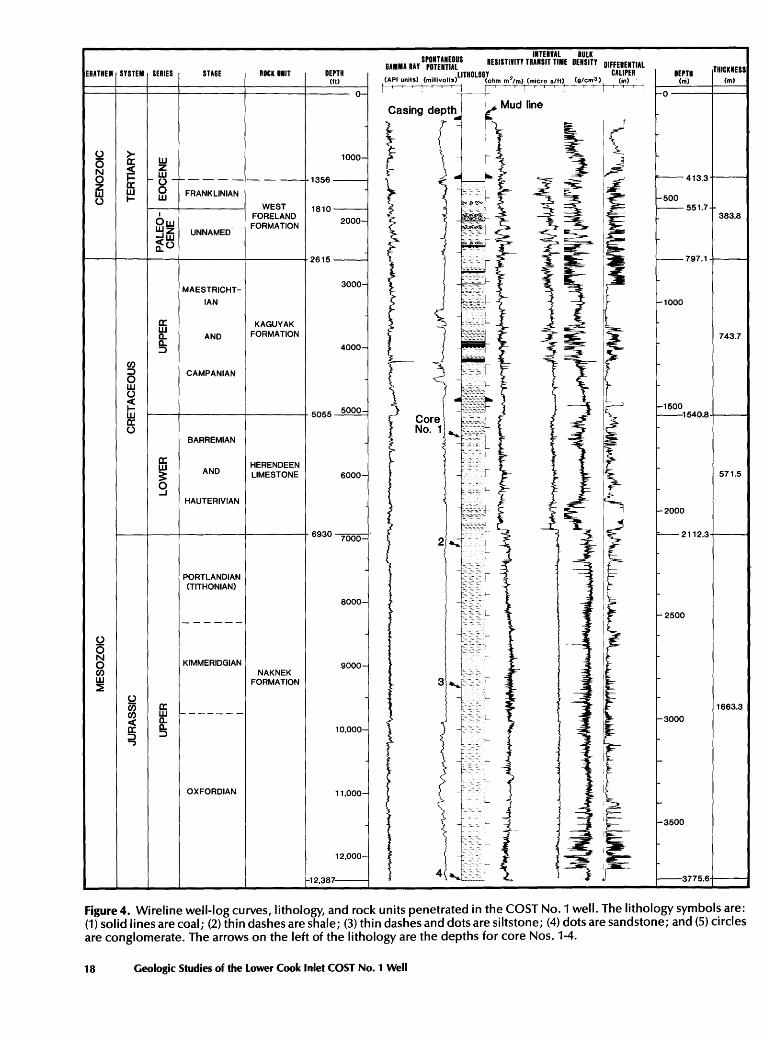
The COST NO. 1 well, drilled by the Atlantic Richfield Company, penetrated sandstone, siltstone, shale, conglomerate, and coal. The stratigraphic units represented are the Naknek Formation (Upper Jurassic), Herendeen Limestone and Kaguyak Formation (Lower and Upper Cretaceous, respectively), and West Foreland Formation (lower Cenozoic). These units are shown in relation to the wire line well-log curves in figure 4.
Minor oil shows were found in the well but significant amounts of gas (CcC5 hydrocarbons) were not. The well also lacked organic matter capable of generating significant amounts of oil or gas. However, the sandstones of the West Foreland Formation and Kaguyak Formation, and possibly the Herendeen Limestone, were of potential reservoir quality.
The interpretation of the COST No. 1 well in this report is based on the data of many workers. Data was submitted by industry, (Wills and others, 1978), as required by the U.S. government. Descriptions of conventional cores and sidewall cores were supplied by Arley and McCoy ( 1977) and Arley and Rathbun (1977). Petrographic analyses of sandstone were provided by Babcock (1977), Christensen (1977), Kuryvial (1977), Schluger (1977), and Swiderski (1977). Porosity and permeability data were supplied by Core Laboratories ( 1977 a, b). Paleontologic reports were supplied by Boettcher (1977), Haga (1977), and Newell (1977a,b). Simpson (1977) and Van Delinder (1977) submitted the organic geochemical data.
UPPER JURASSIC ROCKS
This unit, dominantly siltstone, shale, and sandstone, extends from the bottom of COST No. 1 well at 3,775.6 m (12,387 ft) to 2,112 m (6,930 ft) for a minimum thickness of 1,663 m (5,457 ft). Cass Arley (written commun., 1980) plact;!S the top of the unit at 2,135 m (7 ,005 ft) at the "abrupt change in character of (drill) cuttings, from a dirty-looking, but quartz-rich glauconitic sandstone above, to a light grey, or salt-and-pepper feldspathic sandstone below". According to the foraminiferal report, the top of the unit is at 2, 109 m (6,970 ft) where the "hard gray sandstone becomes the dominant lithology". Turner (this volume), basing his decision on paleontological evidence, places the top of this unit at 2,417 m (7,930 ft). Wills and others (1978) place the top of the lowermost sandstone of the Lower Cretaceous at the large increase in interval velocity (decrease in interval transit time)
that occurs at 2,088 m (6,850 ft). This calcite-cemented sandstone is diagenetically altered (Bolm and McCulloh, this volume) but does not contain zeolite (laumontite). The zeolite boundary in the well is 24 m (80 ft) below this altered sandstone. I place the top of this unit at 2,112 m (6,930 ft) just below the abundant Inoceramus fragments from the sidewall core at 2,109 m (6,920 ft) and just above the first extensive presence of zeolite (laumontite) at 2,146 m (7,040 ft). Here the resistivity, interval transit time, bulk density, and differential caliper curves do not change significantly because of the cements, laumontite below and calcite above. The high resolution dipmeter indicates a consistent dip of 2° to 8° to the northwest.
Paleontological evidence in this unit is sparse. Haga (1977) assigns a Middle to Late Jurassic age (Callovian to Tithonian) to the palynological evidence; Turner (this volume; fig. 5) assigns a Late Jurassic age (Oxfordian to Tithonian) to the foraminifers. The fossils suggest a marginal to shallow marine environment, possibly ranging as deep as middle neritic.
The dominant rock types found in the sidewall cores (fig. 6) are siltstone, shale, and sandstone. Modal analyses of 28 thin sections indicate that the sandstone is lithofeldspathic (Crook, 1960) with an average composition ofQ24F55L21 , an average porosity of 17.9 percent, and an average permeability of 39 millidarcies (table 6).
The lower part of this unit (1 ,200-1 ,600 m; 3, 900-5 ,200 ft) correlates with the Naknek Formation exposed in the Iniskin-Tuxedni region (Detterman and Hartsock, 1966); the upper part (450-600 m; 1,500-2,000 ft) correlates with the rocks exposed along the southwest coast of the Kamishak Bay.
Only 12 of the 172 recorded sidewall cores had favorable reservoir lithology. The organic carbon content from the core and drill cuttings ranges from 0.15 to 0.49 weight percent (fig. 7 and table 7). Traces of hydrocarbons were reported at many depths (table 8).
LOWER CRETACEOUS ROCKS
The COST No. 1 well penetrates 572 m (1,875 ft) of sandstone, siltstone, and shale from 1,540 m (5,055 ft) to 2,112 m (6,930 ft). The top of this unit is placed at the large, abrupt excursion of the gamma ray and resistivity curves and the slight excursions of the interval transit and bulk density curves (fig. 4). The dipmeter indicates consistent dips from 5
Stratigraphic Units of the COST No. 1 Well 17
ERATHEM SYSTEM SERIES
Q 0
~ w (.)
w z w -u 0 w I
Ow wz -.Jw ~(.)
STAGE
FRANKLINIAN
UNNAMED
ROCK UNIT
WEST FORELAND FORMATION
1356
1810
~--r--r--~----~-----+2615
Q 0 N 0 en w ::E
en ::::> 0 w (.)
~ w a: (.)
a: w 3: 0 ...J
MAESTRICHT
IAN
AND
CAMPANIAN
BARREMIAN
AND
HAUTERIVIAN
PORTLANDIAN (TITHONIAN)
KIMMERIDGIAN
OXFORDIAN
KAGUYAK FORMATION
HERENDEEN LIMESTONE
NAKNEK FORMATION
12,387
SPONTANEOUS INTERVAL BULK GAMMA RAY POTENTIAL RESISTIVITY TRANSIT TIME DENSITY DIFFERENTIAL
(API units) (millivolts)LITHOLOG[ohm m2/m) (micro sift) (g/cm3J CA~i~ER ~--r---;-~
DEPTH <nil
THICKNESS (m)
o---+-----1
413.3
551.7 383.8
--797.1 +-----1
1000
743.7
1500 1540.8+----1
571.5
2000
2112.3+------1
2500
1663.3
3775.6-1-------1
Figure 4. Wireline well-log curves, lithology, and rock units penetrated in the COST No.1 well. The lithology symbols are: (1) solid lines are coal; (2) thin dashes are shale; (3) thin dashes and dots are siltstone; (4) dots are sandstone; and (5) circles are conglomerate. The arrows on the left of the lithology are the depths for core Nos. 1-4.
18 Geologic Studies of the Lower Cook Inlet COST No. 1 Well
Summarized age
(thia report)
Lithology Summarized Foraminiferal Paleontologic Palynologic bathymetry
(Arley and McCoy, 1977;
Arley and Rathbun, 1977)
Age Bathymetry Age Bathymetry .. Age Bathymetry
FEET
2000
4000
6000
8000
0,000
2,000
<Boettcher, 1977; Newell, I 977)
No data
Maestrichtian
and
Campanian
Barremian
and
Hauterivian
-----Valanginian(?)
No data
Middle(?)
and
Late(?)
Jurassic
I I I I
~
'"I ~ >
~
(Turner, this report)
Eocene
Paleocene
Maestrichtian
Barremian
and
Hauterivian
Valanginian(?)
Tithonian
to
Oxfordian
·~ e
.. ::::E
Increasing abundanc ~
e
L
(Haga, 1977)
Eocene
Paleocene
Maestrichtian
Barremian
and
Hauterivian
------Valanginian(?)
Neocomlan and
Late Jurassic
Tithonian
to
Callovian
METERS c .. I"" ..... ~~ +> ~ c .. 0 +> o.!:
I I
II
I 1000
I
2000
~
,..
g ~; 3000
.. ... c .. a:
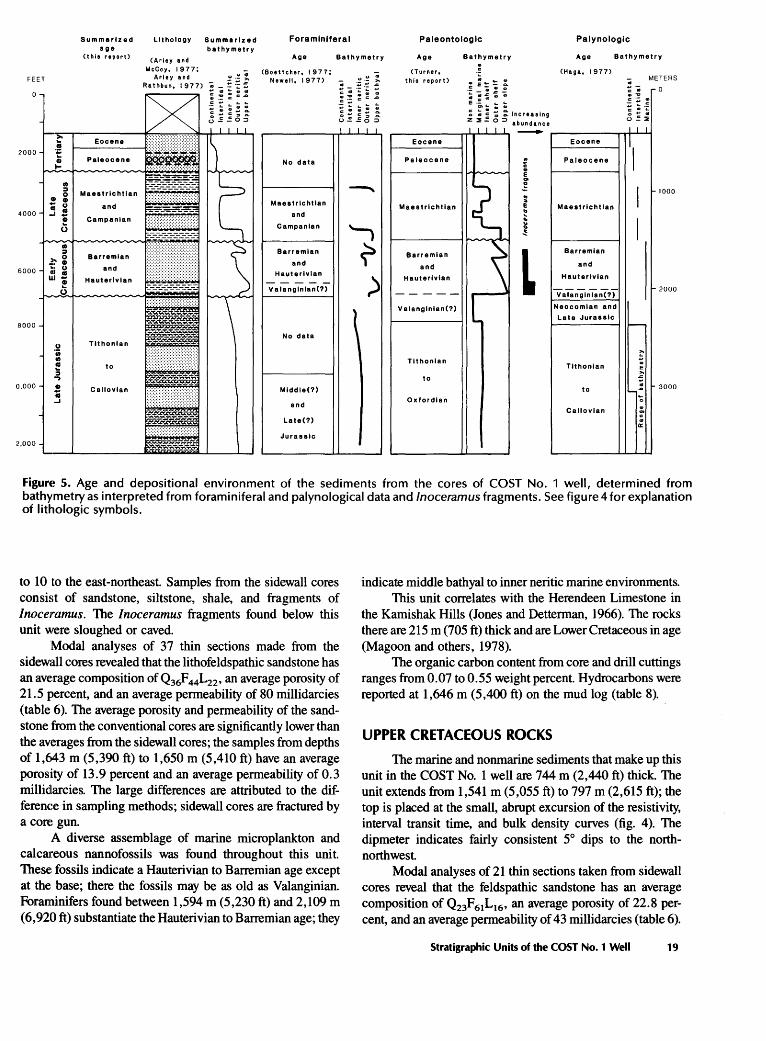
Figure 5. Age and depositional environment of the sediments from the cores of COST No. 1 well, determined from bathymetry as interpreted from foraminiferal and palynological data and Inoceramus fragments. See figure 4 for explanation of lithologic symbols.
to 10 to the east-northeast. Samples from the sidewall cores consist of sandstone, siltstone, shale, and fragments of Inoceramus. The Inoceramus fragments found below this unit were sloughed or caved.
Modal analyses of 37 thin sections made from the sidewall cores revealed that the lithofeldspathic sandstone has an average composition of Q36F 44L22 , an average porosity of 21.5 percent, and an average permeability of 80 millidarcies (table 6). The average porosity and permeability of the sandstone from the conventional cores are significantly lower than the averages from the sidewall cores; the samples from depths of 1,(j43 m (5,390 ft) to 1,650 m (5,410 ft) have an average porosity of 13.9 percent and an average permeability of 0.3 millidlarcies. The large differences are attributed to the differem:e in sampling methods; sidewall cores are fractured by a core gun.
A diverse assemblage of marine microplankton and calcareous nannofossils was found throughout this unit. These fossils indicate a Hauterivian to Barremian age except at the: base; there the fossils may be as old as Valanginian. Foraminifers found between 1,594 m (5,230 ft) and 2,109 m (6,920 ft) substantiate the Hauterivian to Barremian age; they
indicate middle bathyal to inner neritic marine environments. This unit correlates with the Herendeen Limestone in
the Kamishak Hills (Jones and Detterman, 1966). The rocks there are 215m (705ft) thick and are Lower Cretaceous in age (Magoon and others, 1978).
The organic carbon content from core and drill cuttings ranges from 0.07 to 0.55 weight percent. Hydrocarbons were reported at 1,646 m (5,400 ft) on the mud log (table 8).
UPPER CRETACEOUS ROCKS
The marine and nonmarine sediments that make up this unit in the COST No. 1 well are 744 m (2,440 ft) thick. The unit extends from 1,541 m (5,055 ft) to 797 m (2,615 ft); the top is placed at the small, abrupt excursion of the resistivity, interval transit time, and bulk density curves (fig. 4). The dipmeter indicates fairly consistent 5° dips to the northnorthwest.
Modal analyses of 21 thin sections taken from sidewall cores reveal that the feldspathic sandstone has an average composition of Q23F61L16, an average porosity of 22.8 percent, and an average permeability of 43 millidarcies (table 6).
Stratigraphic Units of the COST No. 1 Well 19
Q
F l
F l
F l
METERS
Total depth 3776 m
5
...
...
Porosity Permeability
(%) (mD)
15 25 <10 1 102 103
:~ ~~ '=-=-:: ;~
~7
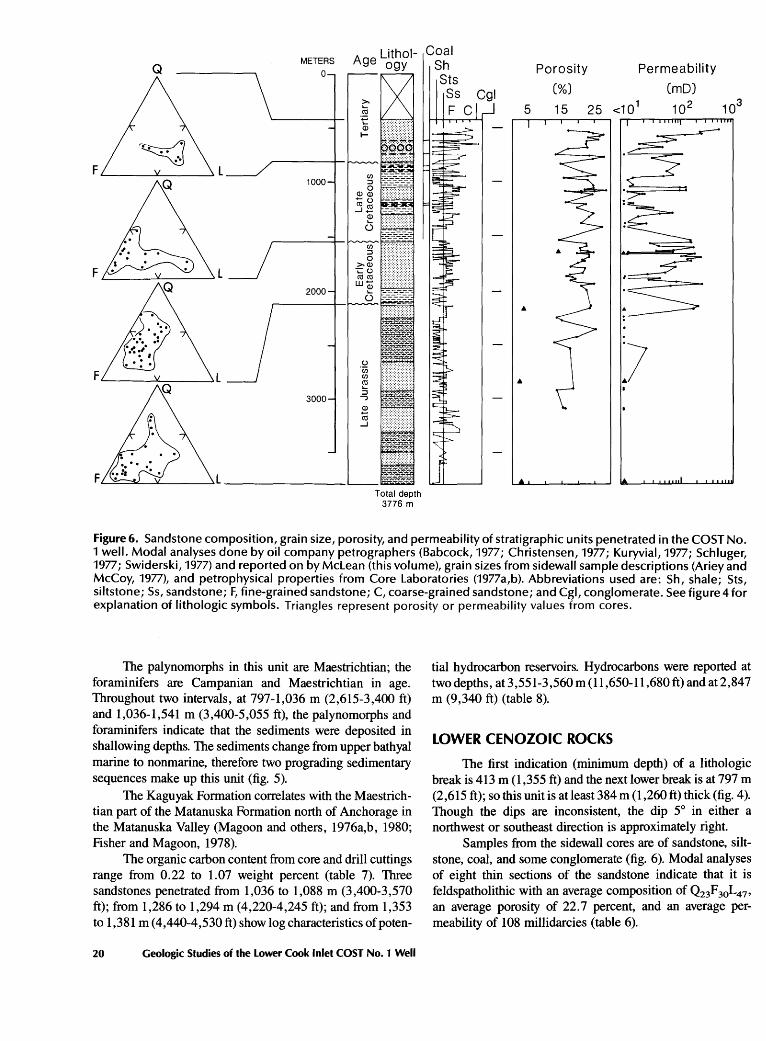
Figure 6. Sandstone composition, grain size, porosity, and permeability of stratigraphic units penetrated in the COST No. 1 well. Modal analyses done by oil company petrographers (Babcock, 1977; Christensen, 1977; Kuryvial, 1977; Schluger, 1977; Swiderski, 1977) and reported on by Mclean (this volume), grain sizes from sidewall sample descriptions (Ariey and McCoy, 1977), and petrophysical properties from Core Laboratories (1977a,b). Abbreviations used are: Sh, shale; Sts, siltstone; Ss, sandstone; F, fine-grained sandstone; C, coarse-grained sandstone; and Cgl, conglomerate. See figure 4 for explanation of lithologic symbols. Triangles represent porosity or permeability values from cores.
The palynomorphs in this unit are Maestrichtian; the foraminifers are Campanian and Maestrichtian in age. Throughout two intervals, at 797-1,036 m (2,615-3,400 ft) and 1,036-1,541 m (3,400-5,055 ft), the palynomorphs and foraminifers indicate that the sediments were deposited in shallowing depths. The sediments change from upper bathyal marine to nonmarine, therefore two prograding sedimentary sequences make up this unit (fig. 5).
The Kaguyak Formation correlates with the Maestrichtian part of the Matanuska Formation north of Anchorage in the Matanuska Valley (Magoon and others, 1976a,b, 1980; Fisher and Magoon, 1978).
The organic carbon content from core and drill cuttings range from 0. 22 to 1. 07 weight percent (table 7). Three sandstones penetrated from 1,036 to 1,088 m (3,400-3,570 ft); from 1,286 to 1,294 m ( 4,220-4,245 ft); and from 1,353 to 1,381 m ( 4,440-4,530 ft) show log characteristics of poten-
20 Geologic Studies of the Lower Cook Inlet COST No. 1 Well
tial hydrocarbon reservoirs. Hydrocarbons were reported at two depths, at3,551-3,560m (11,650-11,680ft) and at2,847 m (9,340 ft) (table 8).
LOWER CENOZOIC ROCKS
The first indication (minimum depth) of a lithologic break is 413 m (1 ,355ft) and the next lower break is at 797 m (2,615 ft); so this unit is at least 384m (1 ,260ft) thick (fig. 4). Though the dips are inconsistent, the dip 5° in either a northwest or southeast direction is approximately right.
Samples from the sidewall cores are of sandstone, siltstone, coal, and some conglomerate (fig. 6). Modal analyses of eight thin sections of the sandstone indicate that it is feldspatholithic with an average composition of Q23F30L47 ,
an average porosity of 22.7 percent, and an average permeability of 108 millidarcies (table 6).
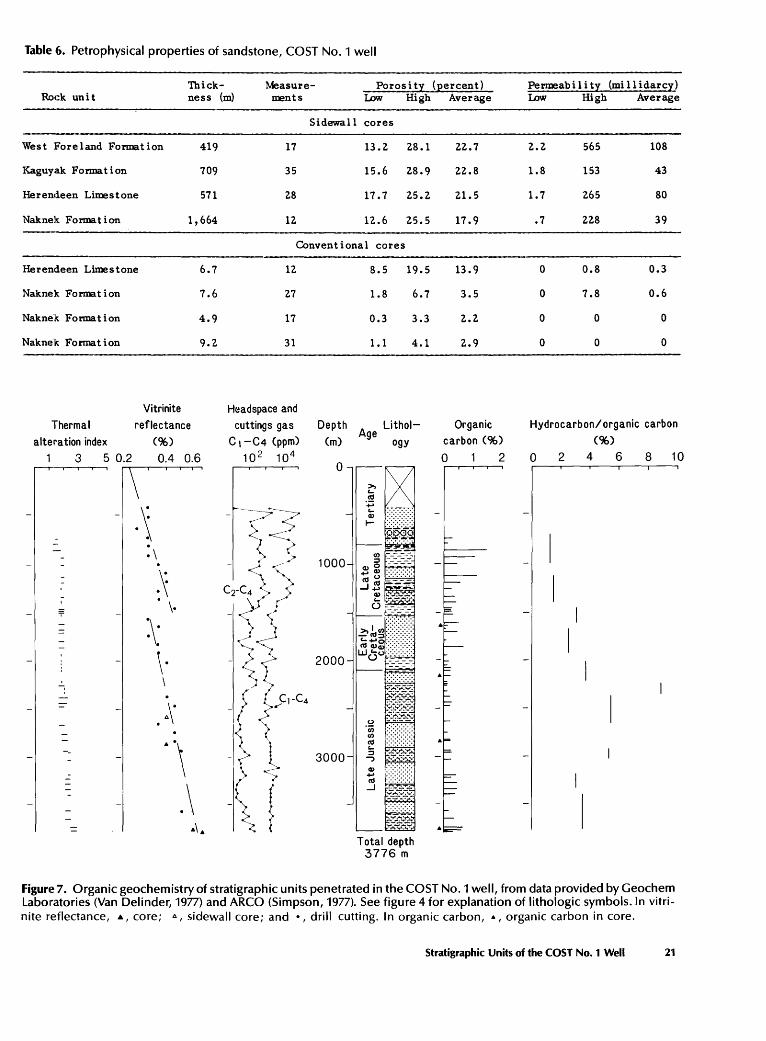
Table t5. Petrophysical properties of sandstone, COST No.1 well
Thick- Measure- Porosity (Eercent) PenDeability (millidarcy) Roc:k unit ness (m) ments Low High Average Low High Average
Sidewall cores
West Fore land Format ion 419 17 13.2 28.1 22.7 2.2 565 108
Kaguyak Formation 709 35 15.6 28.9 22.8 1.8 153 43
Herencieen Limestone 571 28 17.7 25.2 21.5 1.7 265 80
Naknek Formation 1,664 12 12.6 25.5 17.9 .7 228 39
COnventional cores
Herendeen Limestone 6.7 12 8.5 19.5 13.9 0 0.8 0.3
Naknek Format ion 7.6 27 1.8 6.7 3.5 0 7.8 0.6
Naknek Formation 4.9 17 0.3 3.3 2.2 0 0 0
Naknek Formation 9.2 31 1.1 4.1 2.9 0 0 0
Vitrinite Headspa~ and
Thermal reflectance cuttings gas Depth Age
Lithol- Organic Hydrocarbon/ organic carbon
alteration index (96) C 1 -C4 (ppm) (m) ogy carbon (96) (96)
3 5 0.2 0.4 0.6 10 2 104 0
0 1 2 0 2 4 6 8 10
=
·\ z:~ I :,
- \< 1000
:~ I CrC4 , ? \· -Y~ I :\ ~ I
\· ~1; 2000
. 6\ . f ___ c,-c •
.
=
. \ t 3000
-\ r I .\
I ·'· Total depth 3776 m
Figure 7. Organic geochemistry of stratigraphic units penetrated in the COST No.1 well, from data provided by Geochem Laboratories (Van Delinder, 1977) and ARCO (Simpson, 1977). See figure 4 for explanation of lithologic symbols. In vitri,nite reflectance, •, core; 6 , sidewall core; and •, drill cutting. In organic carbon, •, organic carbon in core.
Stratigraphic Units of the COST No. 1 Well 21
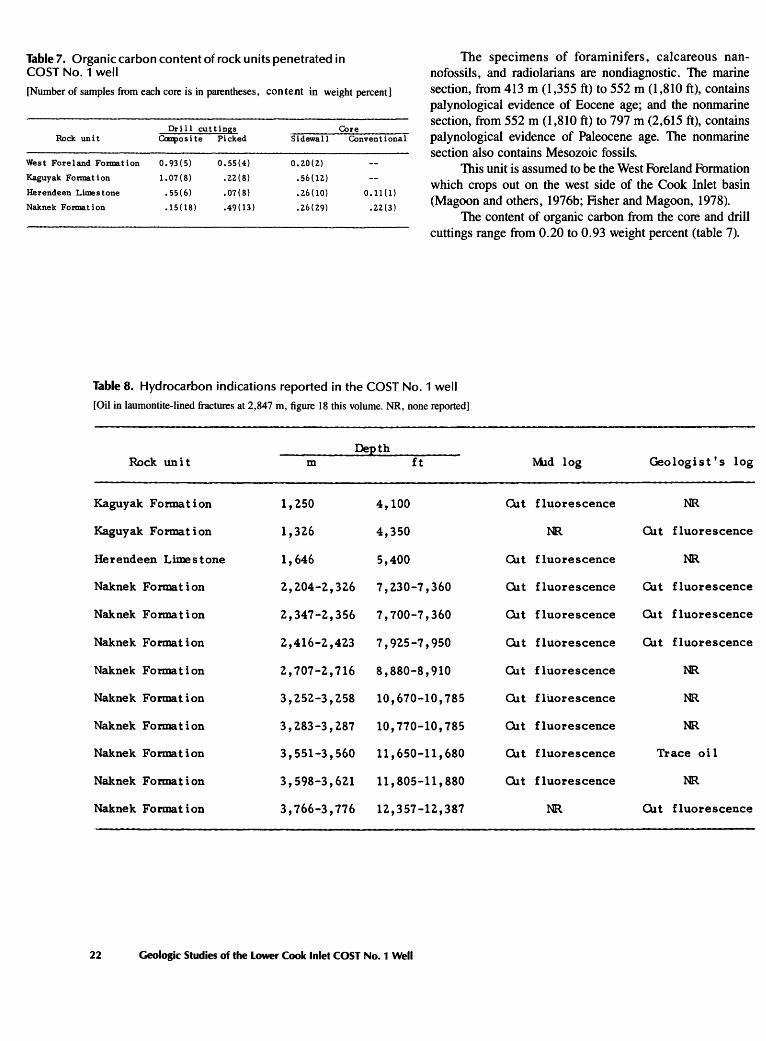
Table 7. Organic carbon content of rock units penetrated in COST No.1 well
[Number of samples from each core is in parentheses, content in weight percent]
The specimens of foraminifers, calcareous nannofossils, and radiolarians are nondiagnostic. The marine section, from 413 m (1 ,355ft) to 552 m (1 ,810ft), contains palynological evidence of Eocene age; and the nonmarine section, from 552 m (1 ,810ft) to 797 m (2,615 ft), contains palynological evidence of Paleocene age. The nonmarine section also contains Mesozoic fossils.
Dri 11 cuttings Rock unit Caq>osite Picked
~est Foreland Fonnation 0.93(5) 0.55(4)
Kaguyak Fonnation 1.07(8) .2.2.(8)
Herendeen Lbnestone .55(6) .07(8)
Naknek Fonnation .15 ( 18) • 49(13)
·sidewall
0.2.0(2.)
.56(12.)
.2.6(10)
.2.6(2.9)
Core Conventional
0.11 (1)
.2.2.(3)
This unit is assumed to be the West Foreland Formation which crops out on the west side of the Cook Inlet basin (Magoon and others, 1976b; Fisher and Magoon, 1978) .
The content of organic carbon from the core and drill cuttings range from 0.20 to 0.93 weight percent (table 7).
Table 8. Hydrocarbon indications reported in the COST No. 1 well
[Oil in laumontite-lined fractures at 2,847 m, figure 18 this volume. NR, none reported]
DeEth Rock unit m ft Mld log Geologist's log
Kaguyak Fonnation 1,250 4,100 Olt fluorescence NR
Kaguyak Fonnation 1,326 4,350 NR Cut fluorescence
Herendeen Limestone 1,646 5,400 Cut fluorescence NR
Naknek Fonnation 2,204-2,326 7,230-7,360 Cut fluorescence Cut fluorescence
Naknek Fonnat ion 2,347-2,356 7,700-7,360 Cut fluorescence Cut fluorescence
Naknek Fonnation 2,416-2,423 7,925-7,950 Cut fluorescence Cut fluorescence
Naknek Fonnation 2,707-2,716 8,880-8,910 Cut fluorescence NR
Naknek Fonnation 3,252-3,258 10,670-10,785 Cut fluorescence NR
Naknek Fonnation 3,283-3,287 10,770-10,785 Cut fluorescence NR
Naknek Fonnation 3,551-3,560 11,650-11,680 Cut fluorescence Trace oi 1
Naknek Fonnation 3,598-3,621 11,805-11,880 Cut fluorescence NR
Naknek Fonnation 3,766-3,776 12,357-12,387 NR Cut fluorescence
22 Geologic Studies of the Lower Cook Inlet COST No. 1 Well
Correlation of the COST No. 1 Well Data and the Marine Seismic Data By Michael A. Fisher
INTRODUCTION
The purpose of this report is to compare the velocity information from COST No. 1 well with the velocity information from multichannel seismic data and to determine the ages of prominent seismic horizons by correlating the measured seismic reflections with the reflections calculated from the well data.
The COST No. 1 well is 7 km (4.3 mi) southwest of seismic line 752 and about midway between seismic lines 756 and 757 (fig. 8). The well location, when projected perpendicularly onto seismic line 752, is closest to shot point 830. The direction of the projection is parallel to the regional struc1tural fabric of the basin which strikes northeast.
Sonic velocity data are derived from the interval-transit time of the sonic logs (fig. 9). By integrating sonic velocity data, converting depth to two-way time, RMS (root-meansquare) velocities can be computed from the equation:
where
( 1 J 2 112
vrms = - v dt) t son
V rms RMS velocity, vson sonic velocity, and
t two-way time.
Stacking velocities are computed during the stacking of multichannel reflection data. From the stacking velocities, interval velocities are calculated by using the equation:
where
v;tk2 t2- v;tk1t1112
t2 -tl
vint interval velocity, vstk stacking velocity, and
t two-way time.
Sonic velocities can be compared to interval velocities, and RMS velocities can be compared to stacking velocities.
These velocities may compare poorly for several reasons. Dip of strata causes stacking velocities to vary whereas RMS velocities are unaffected. Different frequencies of
sound waves are used to measure the velocities. Sonic velocities are measured with a 20 kHz wavelet over a distance of 2.4 m (8 ft) to 3. 7 m (12ft), whereas interval velocities are measured with frequencies between 5 and 50 Hz over a distance typically as large as 100m (300ft). Sonic logs may record higher velocities than those recorded by the seismic method because of frequency-dependent velocity dispersion.
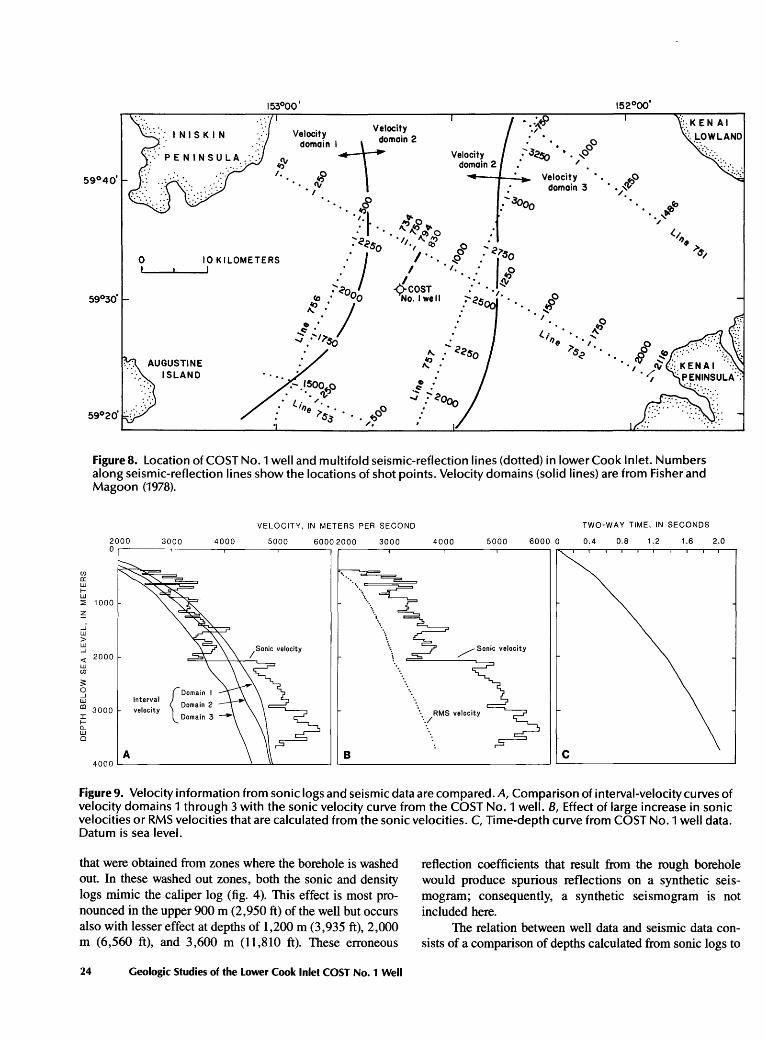
Fisher and Magoon (1978) computed interval-velocity curves at 22 locations in the lower Cook Inlet basin and grouped the curves having similar values. Four sets of interval-velocity curves resulted, and the geographic area that contained one set of curves was called a velocity domain (fig. 8). An average of all interval-velocity curves in each set was used to convert reflection time to depth in each of the velocity domains. The COST No. 1 well is in domain 2.
Although the interval-velocity curve of domain 1 is close to the average of its sonic velocity curve, the interval velocity curve of domain 2 has lower values, about 15 percent, than the sonic velocity curve of COST No. 1 well (fig. 9A). This 15 percent difference between the interval velocity curve of domain 2 and the sonic velocity curve of the well means that the structure contour map of horizon C (Fisher and Magoon, 1978) gives depths in domain 2 that are too shallow by at most 15 percent. This difference can be expected because sonic logs give inherently higher velocities than interval velocities.
The abrupt increase in sonic velocity from 3,500 m/s to 4,500 m/s at just below the 2,000-m (6,560-ft) depth (fig. 9A) was evident in the sonic velocity curve but not in the interval velocity curve before averaging. The reason for the discrepancy is shown on the RMS velocity curve in figure 9Bthe abrupt increase in sonic velocities causes only a slight inflection in the RMS velocity curve. The resolution of the stacking velocity data apparently is too poor to discriminate between such subtle features; hence, the interval velocities do not show the same abrupt increase as the sonic velocities.
RELATION BETWEEN WELL LOG AND SEISMIC DATA
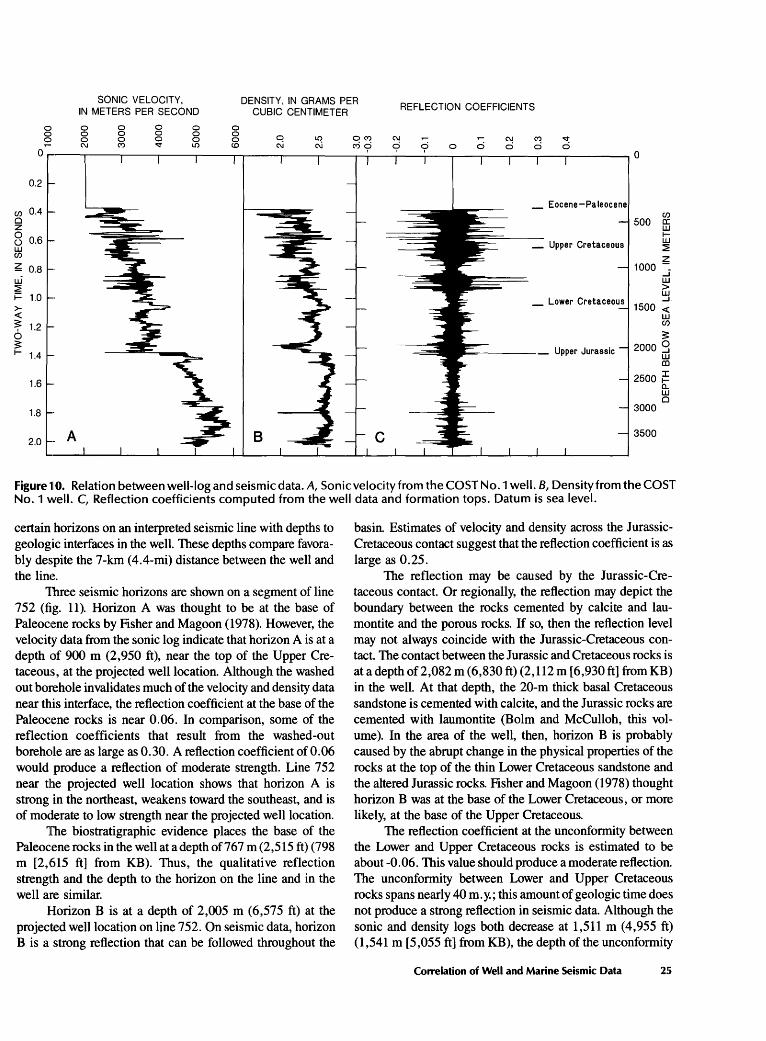
Reflection coefficients were calculated from the sonic and density logs (fig. 10C). Some of the largest reflection coefficients result from erroneous velocity and density data
Correlation of Well and Marine Seismic Data 23
(/)
a: UJ 1-UJ :2:
~ _j UJ > UJ ..J
<( UJ en
3: 0 ..J UJ
0
IN IS KIN Velocity Velocit.y ·.·'#
•/ . . ~
domain l~domam 2
'·. ~ 1'\i
Velocity domain 3
10 KILOMETERS I
• I
··· .. §. . '·I "' . ~~"' : • • • 1\. 0) 0 '< .,, I\, . · <s0 ·, ~ o ... : J I .... ~ : <l"'so
,' I '·. : ~ . I ··. ~
:"<o -QcosT : · . ," ! :' /Oo No.I well .:: ... <s · ..... ~o " ,' • I • • 0 ~ . . ~ ~ .·' 1~"s0 1..; 11 • • • '
.- .lsoo.._o ·. 1?
• 1..; , •• 118 7' • • 0o
$3 ...... ~
8 /" I, $<
• b . ·. $'
/
Figure 8. Location of COST No.1 well and multifold seismic-reflection lines (dotted) in lower Cook Inlet. Numbers along seismic-reflection lines show the locations of shot points. Velocity domains (solid lines) are from Fisher and Magoon (1978).
2000 3000 4000 0
1000
2000
VELOCITY, IN METERS PER SECOND
5000
··· •.•. ......
\
3000
\\
\. \ .....
TWO-WAY TIME, IN SECONDS
4000 5000 6000 0 0.4 0.8 1.2 1.6 2.0
co 3000 \ RMS velocity I 1- ··./ [J_
UJ 0
8 c 4000
Figure 9. Velocity information from sonic logs and seismic data are compared. A, Comparison of interval-velocity curves of velocity domains 1 through 3 with the sonic velocity curve from the COST No.1 well. 8, Effect of large increase in sonic velocities or RMS velocities that are calculated from the sonic velocities. C, Time-depth curve from COST No.1 well data. Datum is sea level.
that were obtained from zones where the borehole is washed out. In these washed out zones, both the sonic and density logs mimic the caliper log (fig. 4). This effect is most pronounced in the upper 900 m (2,950 ft) of the well but occurs also with lesser effect at depths of 1,200 m (3,935 ft), 2,000 m (6,560 ft), and 3,600 m (11,810 ft). These erroneous
24 Geologic Studies of the Lower Cook Inlet COST No. 1 Well
reflection coefficients that result from the rough borehole would produce spurious reflections on a synthetic seismogram; consequently, a synthetic seismogram is not included here.
The relation between well data and seismic data consists of a comparison of depths calculated from sonic logs to
SONIC VELOCITY, IN METERS PER SECOND
DENSITY, IN GRAMS PER CUBIC CENTIMETER REFLECTION COEFFICIENTS
0 0 0 0 0 0 0 0
~ 0 0 0 C\J ('I) v
0 0 0 LO
0 0 0 CD
0('1) C\J C\J 0
0 c09 9 9 0 0
r----r--~r----r----,----..---~----.----.~---r--~--.---.---~--r--,------~0
0.2
CJ) 0.4 0 z 8 0.6 l.U CJ)
~ 0.8 ui :::2: ~ 1.0 >-<(
$: 1.2 6 $: 1- 1.4
1.6
1.8
2.0
_ Eocene-Paleocene
A
CJ)
500 ffi 1-l.U :::2: z
1000 --:. ....J l.U > l.U ....J
1500 <( l.U CJ)
$: 2000 g
l.U OJ
2500 ~ a.. l.U 0
3000
3500
Figure 110. Relation between well-log and seismic data. A, Sonic velocity from the COST No.1 well. 8, Density from the COST No. 1 well. C, Reflection coefficients computed from the well data and formation tops. Datum is sea level.
certain horizons on an interpreted seismic line with depths to geologic interfaces in the well. These depths compare favorably despite the 7-km (4.4-mi) distance between the well and the line.
lhree seismic horizons are shown on a segment of line 752 (fig. 11). Horizon A was thought to be at the base of Paleocene rocks by Fisher and Magoon (1978). However, the velocity data from the sonic log indicate that horizon A is at a depth of 900 m (2,950 ft), near the top of the Upper Cretaceous, at the projected well location. Although the washed out borehole invalidates much of the velocity and density data near this interface, the reflection coefficient at the base of the Paleocene rocks is near 0. 06. In comparison, some of the reflection coefficients that result from the washed-out borehole are as large as 0. 30. A reflection coefficient of 0. 06 would produce a reflection of moderate strength. Line 752 near the projected well location shows that horizon A is strong in the northeast, weakens toward the southeast, and is of moderate to low strength near the projected well location.
The biostratigraphic evidence places the base of the Paleoc:ene rocks in the well at a depth of767 m (2,515 ft) (798 m [2,615 ft] from KB). Thus, the qualitative reflection strength and the depth to the horizon on the line and in the well are similar.
Horizon B is at a depth of 2,005 m (6,575 ft) at the projected well location on line 752. On seismic data, horizon B is a strong reflection that can be followed throughout the
basin Estimates of velocity and density across the JurassicCretaceous contact suggest that the reflection coefficient is as large as 0.25.
The reflection may be caused by the Jurassic-Cretaceous contact. Or regionally, the reflection may depict the boundary between the rocks cemented by calcite and laumontite and the porous rocks. If so, then the reflection level may not always coincide with the Jurassic-Cretaceous contact. The contact between the Jurassic and Cretaceous rocks is at a depth of2,082 m (6,830 ft) (2,112 m [6,930ft] fromKB) in the well. At that depth, the 20-m thick basal Cretaceous sandstone is cemented with calcite, and the Jurassic rocks are cemented with laumontite (Bolm and McCulloh, this volume). In the area of the well, then, horizon B is probably caused by the abrupt change in the physical properties of the rocks at the top of the thin Lower Cretaceous sandstone and the altered Jurassic rocks. Fisher and Magoon (1978) thought horizon B was at the base of the Lower Cretaceous, or more likely, at the base of the Upper Cretaceous.
The reflection coefficient at the unconformity between the Lower and Upper Cretaceous rocks is estimated to be about -0.06. This value should produce a moderate reflection. The unconformity between Lower and Upper Cretaceous rocks spans nearly 40 m. y.; this amount of geologic time does not produce a strong reflection in seismic data. Although the sonic and density logs both decrease at 1,511 m (4,955 ft) (1,541 m [5,055 ft] from KB), the depth of the unconformity
Correlation of Well and Marine Seismic Data 25
(f)
0 z 0
~ 2 (f)
~
uJ ~ i= z 0 i= 3 u w _J LL w 0:
0 1 KILOMETER NORTHWESr
Slraligrapby In COST wall
Eocene and
Paleocene
I Upper Cretaceous
+ Lower Cretaceous
+ Upper Jurassic
Totall3776 m depth
SOUTHEAST
~--------------------------------------0
2
3
4
5
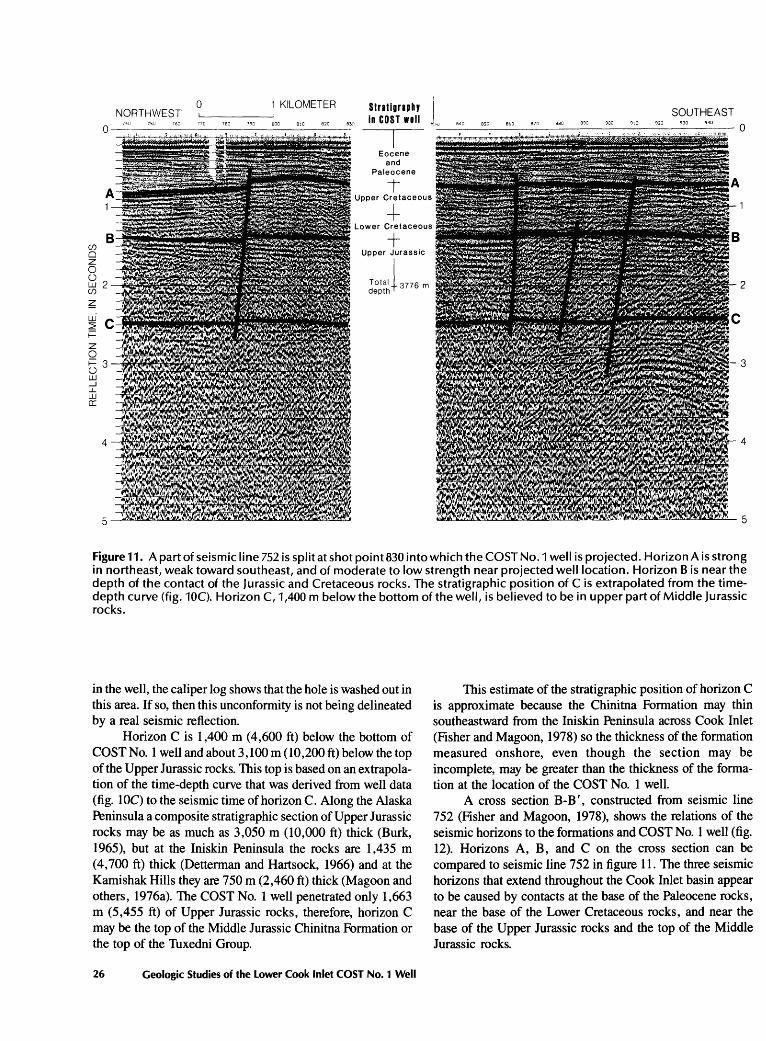
Figure 11. A part of seismic line 752 is split at shot point830 into which the COST No.1 well is projected. Horizon A is strong in northeast, weak toward southeast, and of moderate to low strength near projected well location. Horizon B is near the depth of the contact of the Jurassic and Cretaceous rocks. The stratigraphic position of Cis extrapolated from the timedepth curve (fig. 10C). Horizon C, 1,400 m below the bottom of the well, is believed to be in upper part of Middle Jurassic rocks.
in the well, the caliper log shows that the hole is washed out in this area. If so, then this unconformity is not being delineated by a real seismic reflection.
Horizon C is I ,400 m ( 4,600 ft) below the bottom of COST No. 1 well and about 3,100 m (10,200 ft) below the top ofthe Upper Jurassic rocks. This top is based on an extrapolation of the time-depth curve that was derived from well data (fig. 10C) to the seismic time of horizon C. Along the Alaska Peninsula a composite stratigraphic section of Upper Jurassic rocks may be as much as 3,050 m (10,000 ft) thick (Burk, 1965), but at the Iniskin Peninsula the rocks are 1 ,435 m (4,700 ft) thick (Detterman and Hartsock, 1966) and at the Kamishak Hills they are 750 m (2,460 ft) thick (Magoon and others, 1976a). The COST No. 1 well penetrated only 1,663 m (5,455 ft) of Upper Jurassic rocks, therefore, horizon C may be the top of the Middle Jurassic Chinitna Formation or the top of the Tuxedni Group.
26 Geologic Studies of the Lower Cook Inlet COST No. 1 Well
This estimate of the stratigraphic position of horizon C is approximate because the Chinitna Formation may thin southeastward from the Iniskin Peninsula across Cook Inlet (Fisher and Magoon, 1978) so the thickness of the formation measured onshore, even though the section may be incomplete, may be greater than the thickness of the formation at the location of the COST No. 1 well.
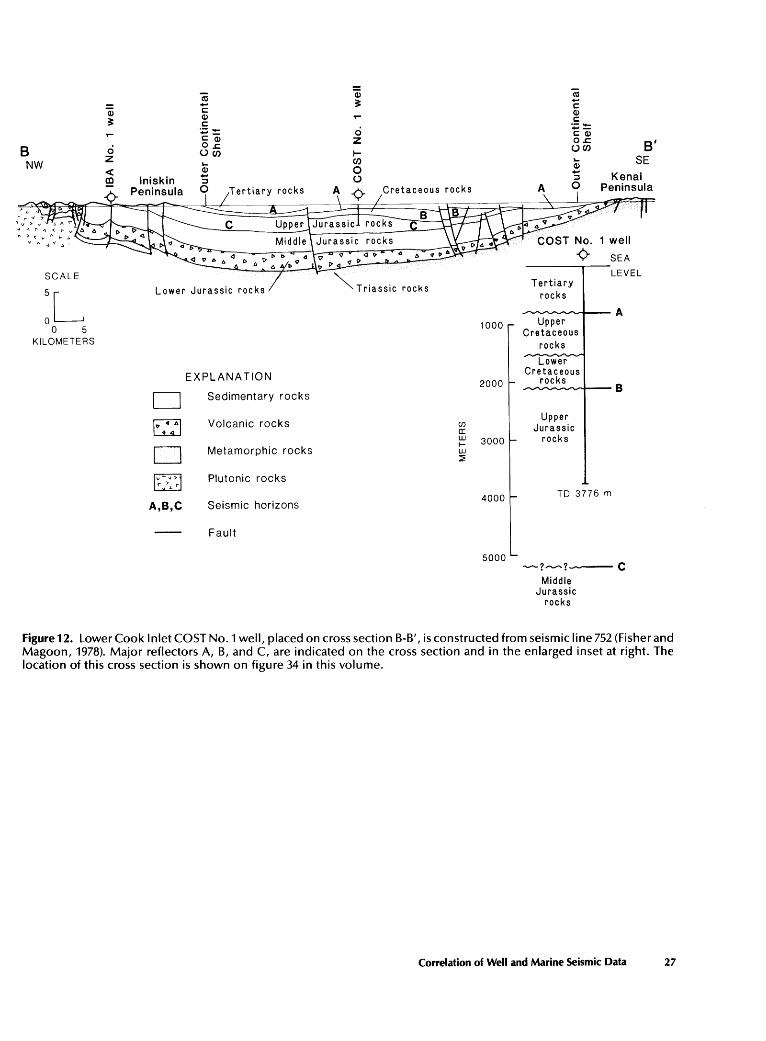
A cross section B-B', constructed from seismic line 752 (Fisher and Magoon, 1978), shows the relations of the seismic horizons to the formations and COST No. 1 well (fig. 12). Horizons A, B, and C on the cross section can be compared to seismic line 752 in figure 11. The three seismic horizons that extend throughout the Cook Inlet basin appear to be caused by contacts at the base of the Paleocene rocks, near the base of the Lower Cretaceous rocks, and near the base of the Upper Jurassic rocks and the top of the Middle Jurassic rocks.
ca Q) t\1 - ~ 'E Q) c: Q)
~ Q) c: c: ·--:;:~ ci --C:Q) c: Q) z o.c B' B ci O.c (.)fl) UW
NW z ..... ..... SE
! Q)
<C "S Kenai ~ ::l
0 A 0 Peninsula
1 well
SEA
SCALE LEVEL
Lower Jurassic rocks Tertiary :L rocks
A 1000 Upper
0 5 Cretaceous KILOMETERS rocks
Lower
EXPLANATION Cretaceous
rocks 2000 8
D Sedimentary rocks
~ Volcanic rocks C/) Upper
a: Jurassic w 3000 rocks t-
D Metamorphic rocks w ~
rn Plutonic rocks r
4000 TO 3776 m A,B,C Seismic horizons
Fault
5000 -?-----? c
Middle Jurassic
rocks
Figure 12. Lower Cook Inlet COST No.1 well, placed on cross section B-B', is constructed from seismic line 752 (Fisher and Magoon, 1978). Major reflectors A, B, and C, are indicated on the cross section and in the enlarged inset at right. The location of this cross section is shown on figure 34 in this volume.
Correlation of Well and Marine Seismic Data 27

Paleontology and Biostratigraphy of the COST No. 1 Well By Ronald F. Turner2
INTRODUCTION
Biostratigraphic and paleoenvironmental interpretations of the COST No. 1 well are based on the detailed analysis of assemblages of foraminifers, marine and terrestrial palynomorphs, calcareous nannoplankton, and radiolarians. Well cuttings from 413 m (1,356 ft) to 3,776 m (12,837 ft) collected at 30 ft intervals were disaggregated by treatment with mineral spirits or by boiling in Quatemary-0 industrial detergent and washed over a 200 mesh (75 micron) screen. Conventional cores and material taken from sidewall cores were prepared and examined in the same manner.
Palynological slides, calcareous nannoplankton slides, and biostratigraphic reports prepared for the industry participants by Anderson, Warren and Associates (Boettcher, 1977; Haga, 1977; Newell, 1977a,b) were analyzed, interpreted, and integrated with the foraminiferal analysis. Radiolarian identifications were based on the work of Pessagno (1977) and Mickey (oral commun., 1978). Palynological identifications and interpretations generally follow Haga (1977), although the dinoflagellate taxonomy has been updated to conform with the systematics proposed by Stover and Evit (1978). Calcareous nannoplankton interpretations are based on Newell (1977a). Foraminiferal identifications and interpretations are based on the work of Bandy (1951 ), Bartenstein and Bettenstaedt (1962), Boettcher (1977), Church (1968), Dailey (1973), Martin (1964), Mayne (1973), McGugan (1964), Scott (1974), Sliter (1968, 1973), Sliter and Baker (1972), and Trujillo (1960). Ostracode identifications are from Holden (1964). and Swain (1973).
Examination of paleontologic samples from wells is usually from top to bottom, so the biostratigraphic units are discussed from youngest to oldest. A summary of my interpretation is on figure 5.
BIOSTRATIGRAPHY
Eocene
The interval from 413 m (1,356 ft, first sample) to 552 m (1,810 ft) represents a predominately nonmarine depositional environment. A warm temperate paleoclimate is indicated by a microfloral assemblage characterized by species of
2 Minerals Management Service (Dept. of the Interior).
Alnus, Carya, Ulmus, Tilia, Nyssa, Fagas, and !lex. Coal is present in most samples. No foraminifers are present. Calcareous nannoplankton are quite rare and poorly preserved in this interval, although specimens with affinities to Markalius sp. and Cyclococcolithina sp. support a Paleogene age. Rare reworked Inoceramus prisms were present in the first sample.
Paleocene
The nonmarine interval from 552 m (1,810 ft) to 799 m (2,620 ft) is characterized by a palynomorph assemblage containing Paraalnipollenites confusus associated with Alnus, Carya, and Tilia. Reworked specimens of Cretaceous and Jurassic palynomorphs occur sporadically throughout this interval. No foraminifers, calcareous nannoplankton, or siliceous microfossils were observed.
Late Cretaceous
The interval between 799 m (2,620 ft) and 1,539 (5,050 ft) is Maestrichtian in age: A well developed microflora containing specimens of Aquilapollenites striatus, Aquilapollenites bertillonites, Cranwellia striata, Kurtzipites tripissatus, Sympolcacites sibiricus, and Wodehouseia spinata is present in a nonmarine coal-bearing sandstone section from 799 m (2,620 ft) to 963 m (3, 160 ft).
A Late Cretaceous marine microfossil assemblage of foraminifers, ostracodes, dinoflagellates, coccoliths, and molluscan fragments is present from 963 m (3,160 ft) to 1,036 m (3,400 ft). Rare specimens o(the dinoflagellate Palaeocystodinium cf. P. golzowense and the calcareous nannoplanktons Arkhangelskiella cymbiformis and Chiastozygus initialis at 963 m (3, 160 ft) presage the appearance of the relatively diverse Maestrichtian assemblage. The foraminiferal fauna is characterized by Gavelinella whitei, G. cf. G. stephensoni, Cribrostomoides cretaceus, C. trifolium, Haplaphragmoides kirki, H. excavatus, Trochammina cf. T. texana, Bathysiphon vitta, Gyroidinoides cf. G. nitidus, Praebulimina sp., and P. kickapooensis. Rare trachylebrid ostracodes are present. Deposition probably occurred in an outer shelf to upper slope environment (100 to 600 m water depth). A dinoflagellate assemblage containing relatively rare specimens of Isabelidinium cooksoniae, Palaeocystodinium cf. P. golzowense,
Paleontology and Biostratigraphy 29
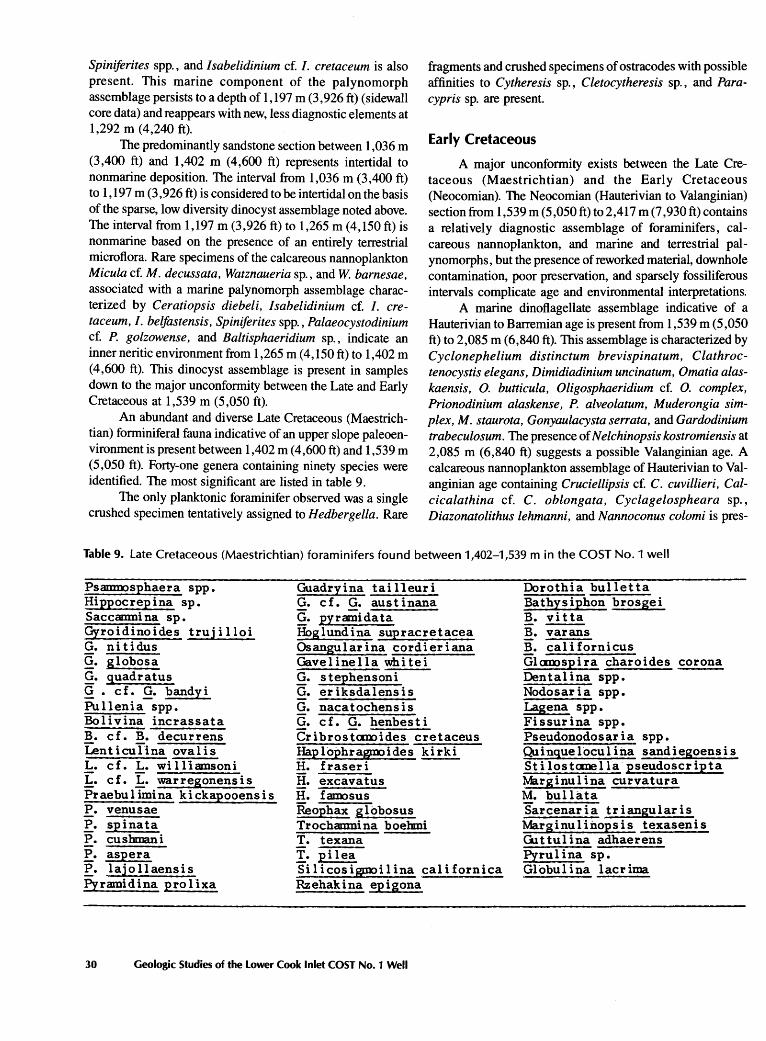
Spiniferites spp., and Isabelidinium cf. /. cretaceum is also present. This marine component of the palynomorph assemblage persists to a depth of 1,197 m (3,926 ft) (sidewall core data) and reappears with new, less diagnostic elements at 1,292 m (4,240 ft).
The predominantly sandstone section between 1,036 m (3,400 ft) and 1,402 m (4,600 ft) represents intertidal to nonmarine deposition. The interval from 1 ,036 m (3 ,400 ft) to 1,197 m (3,926 ft) is considered to be intertidal on the basis of the sparse, low diversity dinocyst assemblage noted above. The interval from 1,197 m (3,926 ft) to 1,265 m (4,150 ft) is nonmarine based on the presence of an entirely terrestrial microflora. Rare specimens of the calcareous nannoplankton Micula cf. M. decussata, Watznaueria sp., and W. barnesae, associated with a marine palynomorph assemblage characterized by Ceratiopsis diebeli, Isabelidinium cf. /. cretaceum, I. belfastensis, Spiniferites spp., Palaeocystodinium cf. P. golzowense, and Baltisphaeridium sp. , indicate an inner neritic environment from 1 ,265 m ( 4,150 ft) to 1,402 m (4,600 ft). This dinocyst assemblage is present in samples down to the major unconformity between the Late and Early Cretaceous at 1,539 m (5,050 ft).
An abundant and diverse Late Cretaceous (Maestrichtian) forminiferal fauna indicative of an upper slope paleoenvironment is present between 1,402 m (4,600 ft) and 1,539 m (5,050 ft). Forty-one genera containing ninety species were identified. The most significant are listed in table 9.
The only planktonic foraminifer observed was a single crushed specimen tentatively assigned to Hedbergella. Rare
fragments and crushed specimens of ostracodes with possible affinities to Cytheresis sp., Cletocytheresis sp., and Paracypris sp. are present.
Early Cretaceous
A major unconformity exists between the Late Cretaceous (Maestrichtian) and the Early Cretaceous (Neocomian). The Neocomian (Hauterivian to Valanginian) section from 1,539 m(5,050 ft) to2,417 m (7 ,930ft) contains a relatively diagnostic assemblage of foraminifers, calcareous nannoplankton, and marine and terrestrial palynomorphs, but the presence of reworked material, downhole contamination, poor preservation, and sparsely fossiliferous intervals complicate age and environmental interpretations.
A marine dinoflagellate assemblage indicative of a Hauterivian to Barremian age is present from 1,539 m (5,050 ft) to 2,085 m (6,840 ft). This assemblage is characterized by Cyclonephelium distinctum brevispinatum, Clathroctenocystis elegans, Dimidiadinium uncinatum, Omatia alaskaensis, 0. butticula, Oligosphaeridium cf. 0. complex, Prionodinium alaskense, P. alveolatum, Muderongia simplex, M. staurota, Gonyaulacysta serrata, and Gardodinium trabeculosum. The presence of Nelchinopsis kostromiensis at 2,085 m (6,840 ft) suggests a possible Valanginian age. A calcareous nannoplankton assemblage of Hauterivian to Valanginian age containing Cruciellipsis cf. C. cuvillieri, Calcicalathina cf. C. oblongata, Cyclagelospheara sp., Diazonatolithus lehmanni, and Nannoconus colomi is pres-
Table 9. late Cretaceous (Maestrichtian) foraminifers found between 1,402-1,539 min the COST No.1 well
PsmDOOOsphaera spp. Hippocrepina sp. Saccamnina sp. Gyroidinoides trujilloi G. ni tidus g. globosa Q. quadratus Q • cf • .Q. bandyi Pul1enia spp. Bolivina incrassata B. cf. B. decurrens LenticuTina ovalis L. cf. L. willimnsoni 1:· cf. ~· wa.rregonensis Praebulbnina kickapooensis P. venusae P. spinata P. cuslmani P. aspera ~· lajollaensis Pyramid ina pro llxa
Guadryina tailleuri G. cf. G. austinana :Q. pyramidata HOglundina supracretacea ~angularina cordieriana Ga.velinella whitei G. stephensoni G. eriksdalensis G. nacatochensis G. cf. G. henbesti Cribrostarnoides cretaceus !Japlophragxmides kirki H. fraseri H. excavatus H. faxoosus ~ophax globosus Trochamnina boebmi T. texana I· pi lea Silicosigmoilina californica Rzehakina epigona
30 Geologic Studies of the Lower Cook Inlet COST No. 1 Well
Dorothia bulletta Bathysiphon brosgei B. vitta ----B. varans B. cali fornicus Glarnospira charoides corona Dentalina spp. Nodosaria spp. Lagena spp. Fissurina spp. Pseudonodosaria spp. ~inqueloculina sandiegoensis Stilostamella pseudoscripta Marginulina curvatura M. bullata Sarcenaria triangularis Ma.rginullnopsis texasenis Guttulina adhaerens Pyrulina sp. Globulina lacrima
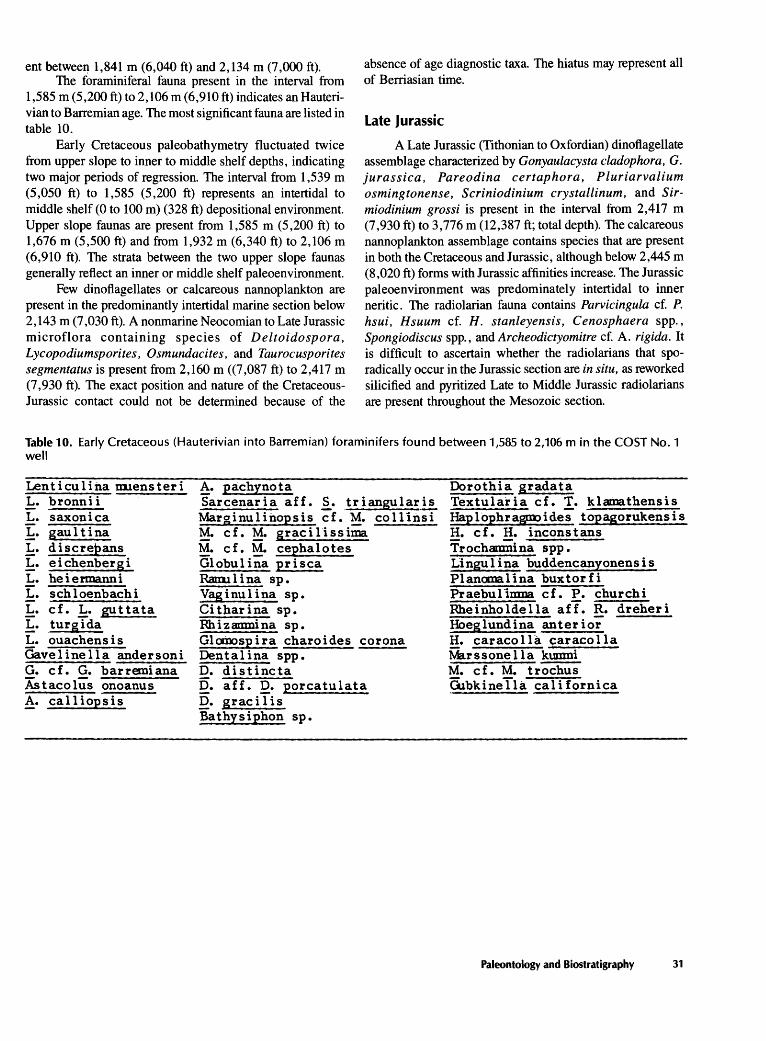
ent between 1,841 m (6,040 ft) and 2,134 m (7,000 ft). The foraminiferal fauna present in the interval from
1,585 m (5,200 ft) to 2,106 m {6,910 ft) indicates an Hauterivian to Barremian age. The most significant fauna are listed in table 10.
Early Cretaceous paleobathymetry fluctuated twice from upper slope to inner to middle shelf depths, indicating two major periods of regression. The interval from 1,539 m (5,050 ft) to 1,585 (5,200 ft) represents an intertidal to middle shelf (0 to 100m) (328 ft) depositional environment. Upper slope faunas are present from 1,585 m (5 ,200 ft) to 1,676 m (5,500 ft) and from 1,932 m (6,340 ft) to 2,106 m (6,910 ft). The strata between the two upper slope faunas generally reflect an inner or middle shelf paleoenvironment.
Few dinoflagellates or calcareous nannoplankton are present in the predominantly intertidal marine section below 2,143 m (7 ,030 ft). A nonmarine Neocomian to Late Jurassic microflora containing species of Deltoidospora, Lycopodiumsporites, Osmundacites, and Taurocusporites segmentatus is present from 2,160 m ((7 ,087 ft) to 2,417 m (7, 930 ft). The exact position and nature of the CretaceousJurassic contact could not be determined because of the
absence of age diagnostic taxa. The hiatus may represent all of Berriasian time.
Late Jurassic
A Late Jurassic (Tithonian to Oxfordian) dinoflagellate assemblage characterized by Gonyaulacysta cladophora, G. jurassica, Pareodina certaphora, Pluriarvalium osmingtonense, Scriniodinium crystallinum, and Sirmiodinium grossi is present in the interval from 2,417 m (7 ,930ft) to 3, 776 m (12,387 ft; total depth). The calcareous nannoplankton assemblage contains species that are present in both the Cretaceous and Jurassic, although below 2,445 m (8,020 ft) forms with Jurassic affinities increase. The Jurassic paleoenvironment was predominately intertidal to inner neritic. The radiolarian fauna contains Parvicingula cf. P. hsui, Hsuum cf. H. stanleyensis, Cenosphaera spp., Spongiodiscus spp., and Archeodictyomitre cf. A. rigida. It is difficult to ascertain whether the radiolarians that sporadically occur in the Jurassic section are in situ, as reworked silicified and pyritized Late to Middle Jurassic radiolarians are present throughout the Mesozoic section.
Table 10. Early Cretaceous (Hauterivian into Barremian) foraminifers found between 1,585 to 2,106 m in the COST No.1 well
Lent i cu 1 ina tDlens ter i L. bronni i L. saxonica L. gaul tina L. discrepans L. eichenbergi L. heiermanni L. sch 1 oenbach i L. cf. L. guttata L. turgida L. ouachensis Gavelinella andersoni G. c f. G. bar remi ana AStacolus onoanus A. calliopsis
!!_. pachynota Sarcenaria aff. §_ • . triangular_is Marginu 1 inops is c f. M. co 11 ins i M· c f. M. graci llss ima M. c f. M· cephalotes Globulina prisca Ram! li na sp. Vaginulina sp. Ci thar ina sp. Rhizamnina sp. Glarnospira charoides corona Dentalina spp. D. di st incta D. aff. ~· porcatulata D. graci 1 is Bathysiphon sp.
Dbrothia gradata Textularia cf. T. klaooathensis Haplophrasrnoides topagorukensis H. c f. H. incons tans Trochamnina spp. Lingulina buddencanyonensis Planama1ina buxtorfi Praebuliuma cf. P. churchi Rheinholdel1a aff. R. dreheri HDeglundina anterio; H. caracolla caraco1la ~rssonella kummi M. cf. M. trochus GUbkinella californica
Paleontology and Biostratigraphy 31

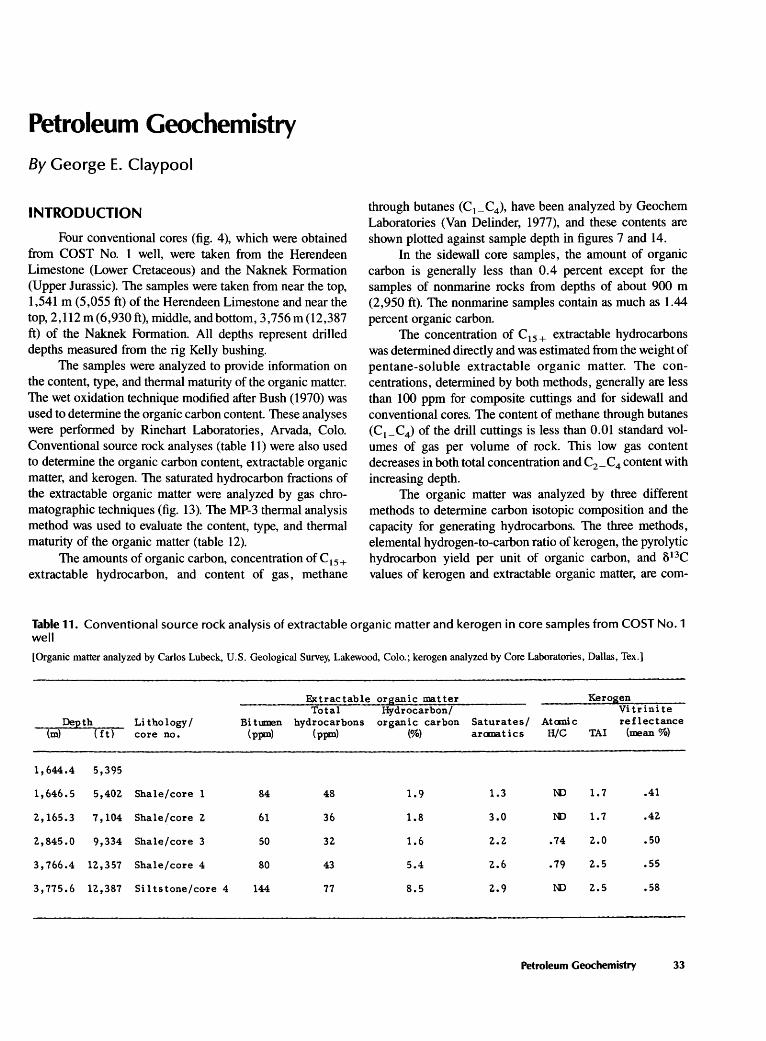
Petroleum Geochemistry
By George E. Claypool
INTRODUCTION
Four conventional cores (fig. 4), which were obtained from COST No. 1 well, were taken from the Herendeen Limestone (Lower Cretaceous) and the Naknek Formation (Upper Jurassic). The samples were taken from near the top, 1,541 m (5,055 ft) of the Herendeen Limestone and near the top, 2,112 m (6,930 ft), middle, and bottom, 3,756m (12,387 ft) of the Naknek Formation. All depths represent drilled depths measured from the rig Kelly bushing.
The samples were analyzed to provide information on the content, type, and thermal maturity of the organic matter. The wet oxidation technique modified after Bush (1970) was used to determine the organic carbon content. These analyses were performed by Rinehart Laboratories, Arvada, Colo. Conventional source rock analyses (table 11) were also used to determine the organic carbon content, extractable organic matter, and kerogen. The saturated hydrocarbon fractions of the extractable organic matter were analyzed by gas chromatographic techniques (fig. 13). The MP-3 thermal analysis method was used to evaluate the content, type, and thermal maturity of the organic matter (table 12).
The amounts of organic carbon, concentration of C15 +
extractable hydrocarbon, and content of gas, methane
through butanes (C1_C4 ), have been analyzed by Geochem Laboratories (Van Delinder, 1977), and these contents are shown plotted against sample depth in figures 7 and 14.
In the sidewall core samples, the amount of organic carbon is generally less than 0.4 percent except for the samples of nonmarine rocks from depths of about 900 m (2,950 ft). The nonmarine samples contain as much as 1.44 percent organic carbon.
The concentration of C15 + extractable hydrocarbons was determined directly and was estimated from the weight of pentane-soluble extractable organic matter. The concentrations, determined by both methods, generally are less than 100 ppm for composite cuttings and for sidewall and conventional cores. The content of methane through butanes (C1_C4) of the drill cuttings is less than 0.01 standard volumes of gas per volume of rock. This low gas content decreases in both total concentration and C2 _C4 content with increasing depth.
The organic matter was analyzed by three different methods to determine carbon isotopic composition and the capacity for generating hydrocarbons. The three methods, elemental hydrogen-to-carbon ratio of kerogen, the pyrolytic hydrocarbon yield per unit of organic carbon, and &13C values of kerogen and extractable organic matter, are com-
Table 11. Conventional source rock analysis of extractable organic matter and kerogen in core samples from COST No.1 well
[Organic matter analyzed by Carlos Lubeck, U.S. Geological Survey, Lakewood, Colo.; kerogen analyzed by Core Laboratories, Dallas, Tex.]
Extractable organic matter Kerogen Total Hydrocarbon/ Vitrinite
De)2th Litho logy I Bitumen hydrocarbons organic carbon Saturates/ Atcmic reflectance (m) (ft) core no. (ppm) (ppm) (%) aranatics H/C TAl (mean%)
1,644.4 5,395
1,646.5 5,402 Shale/core 1 84 48 1.9 1.3 NO 1.7 .41
2,165.3 7' 104 Shale/core 2 61 36 1.8 3.0 NO 1.7 .42
2,845.0 9,334 Shale/core 3 50 32 1.6 2.2 .74 z..o .so
3,766.4 12,357 Shale/core 4 80 43 5.4 2.6 .79 2.5 .55
3,775.6 1Z,387 Siltstone/core 4 144 77 8.5 2.9 NO 2.5 .58
Petroleum Geochemistry 33
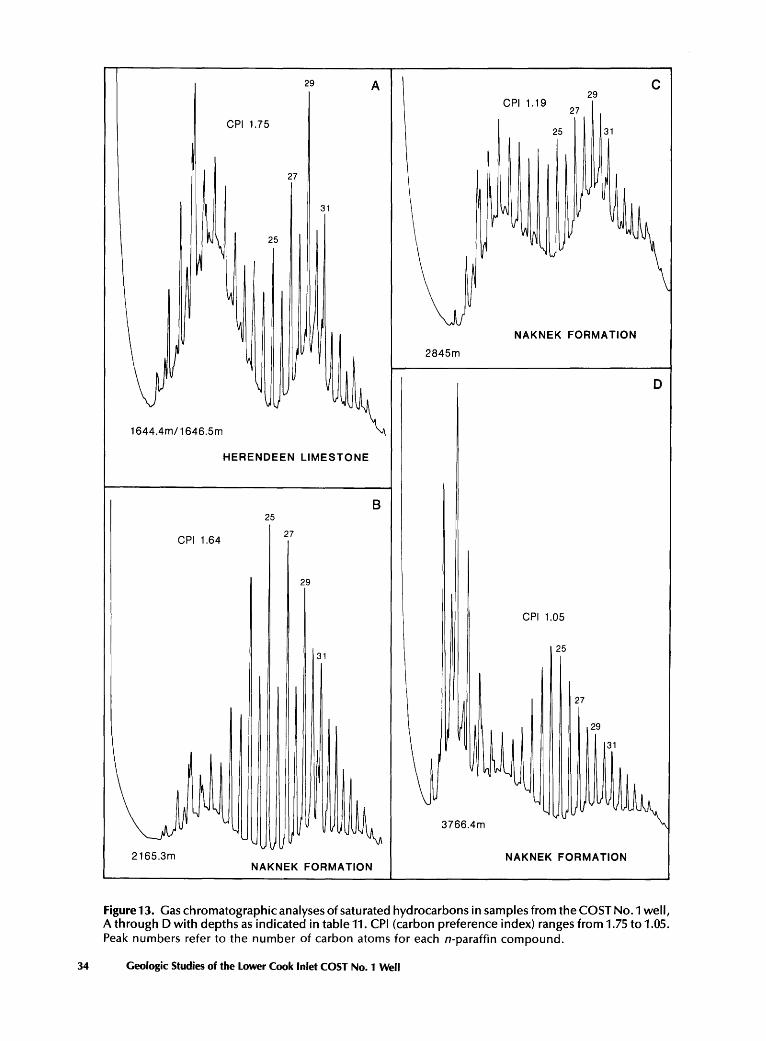
/ 1644.4m/ 1646.5m
CPI 1.64
2165.3m
CPI 1.75
27
25
v vl/
29
31
HERENDEEN LIMESTONE
25
27
29
31
v lJ
A
8
NAKNEK FORMATION
c 29
CPI 1.19 27
25 31
u
NAKNEK FORMATION
2845m
D
CPI 1.05
25
27
29
31
NAKNEK FORMATION
Figure 13. Gas chromatographic analyses of saturated hydrocarbons in samples from the COST No.1 well, A through D with depths as indicated in table 11. CPI (carbon preference index) ranges from 1.75 to 1.05. Peak numbers refer to the number of carbon atoms for each n-paraffin compound.
34 Geologic Studies of the Lower Cook Inlet COST No. 1 Well
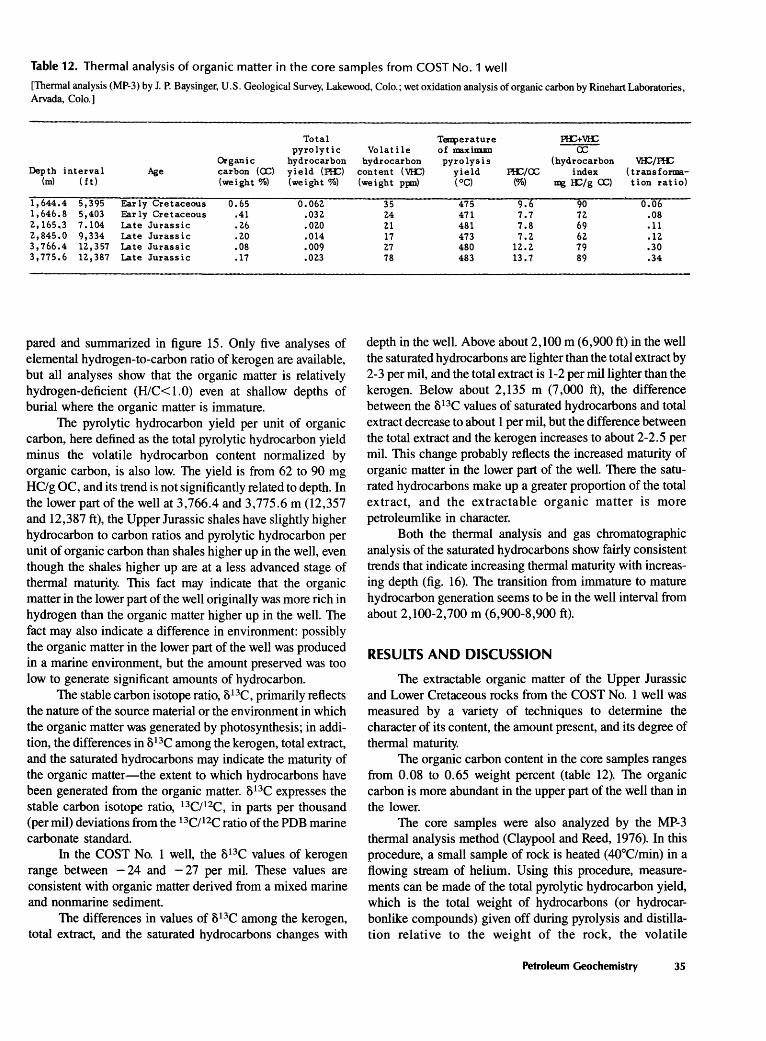
Table 12. Thermal analysis of organic matter in the core samples from COST No.1 well
[Thermal analysis (MP-3) by J.P. Baysinger, U.S. Geological Survey, Lakewood, Colo.; wet oxidation analysis of organic carbon by Rinehart Laboratories, Arvada, Colo.]
Total pyrolytic
Organic hydrocarbon Depth interval Age carbon (OC) yield (:I'IC)
(m) ( ft) (weight%) (weight%)
1,644.4 5,395 Early Cretaceous 0.65 0.062 1,646.8 5,403 Early Cretaceous .41 .032. 2,165.3 7.104 Late Jurassic .26 .020 2,845.0 9,334 Late Jurassic .20 .014 3,766.4 12,357 Late Jurassic .08 .009 3,775.6 12,387 Late Jurassic .17 .023
pared and summarized in figure 15. Only five analyses of elemental hydrogen-to-carbon ratio of kerogen are available, but all analyses show that the organic matter is relatively hydrogen-deficient (HIC<l.O) even at shallow depths of burial where the organic matter is immature.
The pyrolytic hydrocarbon yield per unit of organic carbon, here defined as the total pyrolytic hydrocarbon yield minus the volatile hydrocarbon content normalized by organic carbon, is also low. The yield is from 62 to 90 mg HC/g OC, and its trend is not significantly related to depth. In the lower part of the well at 3,766.4 and 3,775.6 m (12,357 and 12,387 ft), the Upper Jurassic shales have slightly higher hydrocarbon to carbon ratios and pyrolytic hydrocarbon per unit of organic carbon than shales higher up in the well, even though the shales higher up are at a less advanced stage of thermal maturity. This fact may indicate that the organic matter in the lower part of the well originally was more rich in hydrogen than the organic matter higher up in the well. The fact may also indicate a difference in environment: possibly the organic matter in the lower part of the well was produced in a marine environment, but the amount preserved was too low to generate significant amounts of hydrocarbon.
The stable carbon isotope ratio, 813C, primarily reflects the nature of the source material or the environment in which the organic matter was generated by photosynthesis; in addition, the differences in 813C among the kerogen, total extract, and the saturated hydrocarbons may indicate the maturity of the organic matter-the extent to which hydrocarbons have been generated from the organic matter. 813C expresses the stable carbon isotope ratio, 13C/12C, in parts per thousand (per mil) deviations from the 13C/12C ratio of the PDB marine carbonate standard.
In the COST No. 1 well, the 813C values of kerogen range between - 24 and - 27 per mil. These values are consistent with organic matter derived from a mixed marine and nonmarine sediment.
The differences in values of 813C among the kerogen, total extract, and the saturated hydrocarbons changes with
Ten\)erature :I'IC+V!C Volatile 0 f JlBX iiiUll --oc-
hydrocarbon pyrolysis (hydrocarbon VIC/:I'IC content (VIC) yield :I'IC/OC index (transforma-(weight ppm) (OC) (%) a:g lt::/g OC) tion ratio)
35 475 9.6 90 0.06 24 471 7.7 7Z .08 21 481 7.8 69 .11 17 473 7.2 62 .12 27 480 12.2 79 .30 78 483 13.7 89 .34
depth in the well. Above about 2,100 m (6,900 ft) in the well the saturated hydrocarbons are lighter than the total extract by 2-3 per mil, and the total extract is 1-2 per mil lighter than the kerogen. Below about 2,135 m (7 ,000 ft), the difference between the 813C values of saturated hydrocarbons and total extract decrease to about 1 per mil, but the difference between the total extract and the kerogen increases to about 2-2.5 per mil. This change probably reflects the increased maturity of organic matter in the lower part of the well. There the saturated hydrocarbons make up a greater proportion of the total extract, and the extractable organic matter is more petroleumlike in character.
Both the thermal analysis and gas chromatographic analysis of the saturated hydrocarbons show fairly consistent trends that indicate increasing thermal maturity with increasing depth (fig. 16). The transition from immature to mature hydrocarbon generation seems to be in the well interval from about 2,100-2,700 m (6,900-8,900 ft).
RESULTS AND DISCUSSION
The extractable organic matter of the Upper Jurassic and Lower Cretaceous rocks from the COST No. 1 well was measured by a variety of techniques to determine the character of its content, the amount present, and its degree of thermal maturity.
The organic carbon content in the core samples ranges from 0.08 to 0.65 weight percent (table 12). The organic carbon is more abundant in the upper part of the well than in the lower.
The core samples were also analyzed by the MP-3 thermal analysis method (Claypool and Reed, 1976). In this procedure, a small sample of rock is heated ( 40°C/min) in a flowing stream of helium. Using this procedure, measurements can be made of the total pyrolytic hydrocarbon yield, which is the total weight of hydrocarbons (or hydrocarbonlike compounds) given off during pyrolysis and distillation relative to the weight of the rock, the volatile
Petroleum Geochemistry 35

ORGANIC CARBON,
IN WEIGHT PERCENT
0 2 3 0
2
3 0 0
1-w w 4 LL
LL
0 CJ)
0 z 5 <( CJ) ::)
0 I 6 1-
~
I 1-0.. 7 w 0
8
9
10
c9 0
1 1 8
12
Total
depth
12,387 ft
C 15+ HYDROCARBONS,
IN WEIGHT
PARTS PER MILLION
0 0
1 -
2 -
0
3 -
4 -
6 .0
0
7 -0 0
0
8 -0
9 -0 0 0
10 -0
1 1 -
0 12 -
~
500 1000
I
C 1-C4 HYDROCARBONS,
VOLUME GAS/VOLUME ROCK
0.0001 0.001 0.01 0.1 0
2
3
4
5
6
7
8
9
10
11
1 2
Figure 14. Summary and comparison of anatyses of organic carbon and hydrocarbon contents of rocks in the COST No.1 well. Data are from Van Delinder (1977).
36 Geologic Studies of the Lower Cook Inlet COST No. 1 Well

1-L.U L.U u.. u.. 0 (/) 0 z <( (/) :::> 0 :I: 1-
~
:r: 1-a.. L.U 0
ATOMIC H/C OF KEROGEN
0 0.5 1.0 0....----~~---........
1 1- -
0
2 - -
0
3 - -
4 - o-
5 - -
6 - -
7 1- -
8- -
9 - -
0
10 1- -
11 t-- -
12 1- -0
I
Total depth 12,387 ft
-30
• •
813
C PER 1000
-29 -28 -27 -26
• 0 e---------;:::r
• • 0
• o-o 0 0
• 0 0
0 0
• 0
• 0
• 0 0
• 0 0 «) 0
• 0 0
• 0 0
• 0 0
• 0
• 0
~
• 0--D
• 0
• 0 0
~
~
e-o
• 0 0
«) 0
• 0 0
~
•• 0 0
0
EXPLANATION
81 3
C values
• Saturated hydrocarbons
0 Total extract (bitumen)
0 Kerogen
-25 -24
0
CD
0
0
0
0
0
0
PYROLYSIS YIELD/ ORGANIC CARBON,
IN mg HC/g OC
0 100 200 I
1- -
- -
1- -
1- -
- -
- -
1- -
r- -
- -
r- -
- -
- -
PHC/OC VHC/OC
Figure 15. Summary and comparison of kerogen atomic hydrogen/carbon (H/C) ratios (Core Lab and Geochem data) as determined by COST No.1 well group participant (Phillips Petroleum), 8 nc values of kerogen and extractable organic matter, and pyrolytic hydrocarbon yield normalized by organic carbon (USGS data, table 12) in rocks of the COST No. 1 well. 813C expresses the stable carbon isotope ratio, 13Cf12C, in parts per thousand deviations from the 13Cf12C ratio of the PDB marine carbonate standard. PHC, pyrolytic hydrocarbon; VHC, volatile hydrocarbon; OC, organic carbon.
Petroleum Geochemistry 37
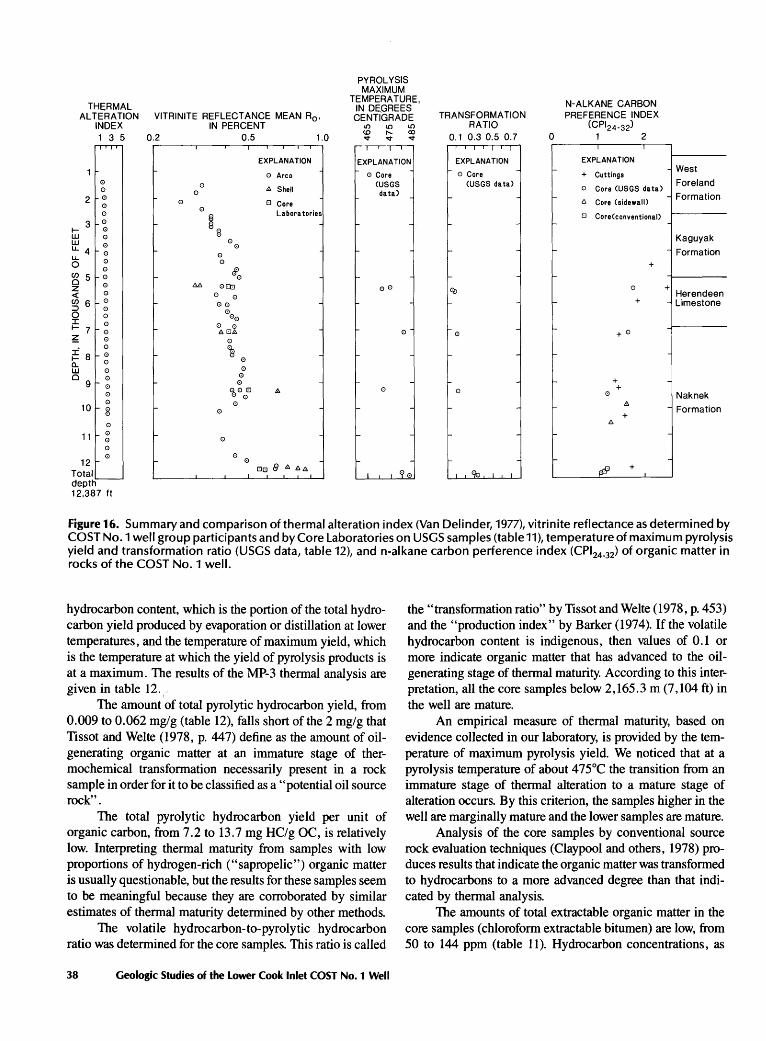
PYROLYSIS MAXIMUM
TH~RMAL TEMPERATURE, N-ALKANE CARBON
PREFERENCE INDEX CCP124-32)
ALTERATION VITRINITE REFLECTANCE MEAN R0 , IN DE.GREES
TRANSFORMATION CENTIGRADE RATIO INDEX IN PERCENT LO LO LO
1 3 5 0.2 0.5 1.0 <D ,..._ <X)
0.1 0.3 0.5 0.7 ..,. ..,. ..,. 0 1 2 I I I I I I I
EXPLANATION EXPLANATION EXPLANATION EXPLANATION
o Arco o Core o Core 0 0 <USGS <USGS data) 0 0 A Shell data)
2 0 0
0 0
D Core 0
~ Laboratories
3 0 r-f- 0 8 UJ 0 UJ 0
0 0
LL 4 0 0 -LL 0 0 0
0 8. ~ 5 0 0 r-
0 AA 0Q;J z 00 Q> <( 0 0 0
~ 6 0
00 0 0 0 0 00
J: 0 0 0 f- 7 -0 ADA 0 0 ~ 0 0
+ Cuttings West
0 Core <USGS data) Foreland
-A Core (sidewall)
Formation
0 CoreCconventional)
Kaguyak
Formation +
-0
+ Herendeen ~
+ Limestone
+0
:i 0
~ f- 8 0 0
-a_ 0
UJ 0 0
D 0 0
9 0 0 - -
0 0 0 A 0 0 0 0 0
r-
r- + -+
0 Naknek 10
0 0
8 0 - - r- A - Formation
+
0 A
11 0 - -0 0
r-
0 0 0
0 12 I Do 8 A AA
-Total I 00 I <;b 1 I
t-pSJ +
depth 12,387 ft
Figure 16. Summary and comparison of thermal alteration index (Van Delinder, 1977), vitrinite reflectance as determined by COST No.1 well group participants and by Core Laboratories on USGS samples (table11), temperature of maximum pyrolysis yield and transformation ratio (USGS data, table 12), and n-alkane carbon perference index (CPI24_32) of organic matter in rocks of the COST No.1 well.
hydrocarbon content, which is the portion of the total hydrocarbon yield produced by evaporation or distillation at lower temperatures, and the temperature of maximum yield, which is the temperature at which the yield of pyrolysis products is at a maximum. The results of the MP-3 thermal analysis are given in table 12.,
The amount of total pyrolytic hydrocarbon yield, from 0.009 to 0.062 mg/g (table 12), falls short of the 2 mg/g that Tissot and Welte (1978, p. 447) define as the amount of oilgenerating organic matter at an immature stage of thermochemical transformation necessarily present in a rock sample in order for it to be classified as a "potential oil source rock".
The total pyrolytic hydrocarbon yield per unit of organic carbon, from 7.2 to 13.7 mg HC/g OC, is relatively low. Interpreting thermal maturity from samples with low proportions of hydrogen-rich ("sapropelic") organic matter is usually questionable, but the results for these samples seem to be meaningful because they are corroborated by similar estimates of thermal maturity determined by other methods.
The volatile hydrocarbon-to-pyrolytic hydrocarbon ratio was determined for the core samples. This ratio is called
38 Geologic Studies of the Lower Cook Inlet COST No. 1 Well
the "transformation ratio" by Tissot and Welte (1978, p. 453) and the "production index" by Barker (197 4 ). If the volatile hydrocarbon content is indigenous, then values of 0.1 or more indicate organic matter that has advanced to the oilgenerating stage of thermal maturity. According to this interpretation, all the core samples below 2, 165. 3 m (7, 104 ft) in the well are mature.
An empirical measure of thermal maturity, based on evidence collected in our laboratory, is provided by the temperature of maximum pyrolysis yield. We noticed that at a pyrolysis temperature of about 475°C the transition from an immature stage of thermal alteration to a mature stage of alteration occurs. By this criterion, the samples higher in the well are marginally mature and the lower samples are mature.
Analysis of the core samples by conventional source rock evaluation techniques (Claypool and others, 1978) produces results that indicate the organic matter was transformed to hydrocarbons to a more advanced degree than that indicated by thermal analysis.
The amounts of total extractable organic matter in the core samples (chloroform extractable bitumen) are low, from 50 to 144 ppm (table 11). Hydrocarbon concentrations, as
determined by elution chromatography, range from 32 to 77 ppm. Vassoevich and others (1967) found that hydrocarbon concentrations in shales commonly average about 180 ppm. Therefore the hydrocarbon concentrations of the core samples of COST No. 1 well are below average for shales. The hydrocarbon content relative to organic carbon content in all ofthe core samples is greater than 1% or 10 mg HC/g OC, so that organic carbon has been transformed to hydrocarbons to an advanced degree.
The kerogen analyses generally substantiate the results of the thermal analyses. The atomic H/C ratios of less than 1 (table 11) confirm that the organic matter in the rocks at 2,845.0 m (9,334 ft) and 3,766.4 m (12,357 ft) are lacking in hydrogen.
The thermal alteration index and the vitrinite reflectance both increase consistently with increasing depth from 1,644.4 m (5,395 ft) to 3,775.6 m (12,387 ft). This is consistent with the increasing degree of thermal maturity with depth.
The alkane distributions of saturated hydrocarbon fractions of the extractable organic matter was determined by gas chromatography. Samples from shallower depths in the well have a distinct odd-numbered n-alkane predominance (figs. 13A and 13B). This feature is greatly reduced or absent in samples deeper in the well. This pattern is consistent with a transition from thermally immature to mature organic matter. The carbon preference index decreases with increasing depth,
from 1.75 to 1.05 (fig. 13). This index, which Bray and Evans (1961) based on peak heights ofn-alkanes with from 24 to 32 carbon atoms, also indicates a change from thermal immaturity to maturity.
CONCLUSIONS
The fine-grained Lower Cretaceous and Upper Jurassic rocks in COST No. 1 well contain a very low amount of organic matter compared to fine-grained rocks of this age worldwide, which average about 1 percent organic carbon. Moreover, the Mesozoic shales in this well contain much less organic matter than the Mesozoic sediments in the upper Cook Inlet, the North Slope, and in the other petroleumproducing areas of Alaska.
The section penetrated by COST No. 1 well does not contain prospective petroleum source rocks. Although the thermochemical transformation of the organic matter in the Mesozoic rocks is marginally mature to mature, the organic matter is dominantly of the type that has a poor oil-generating capacity. However, the prospect for petroleum of the lower Cook Inlet should not be judged on the data obtained from the COST No. 1 well alone. This well did not penetrate the shales of the Middle Jurassic-the source rocks for petroleum in the upper Cook Inlet (Magoon and Claypool, 1979, 1981). Migration paths from the Middle Jurassic rocks are crucial to the oil-generating system in the Cook Inlet basin.
Petroleum Geochemistry 39

Present-Day Geothermal Gradient By Leslie B. Magoon
INTRODUCTION
By extrapolating from present-day subsurface temperatures, the threshold temperatures for various stages of hydrocarbon generation and sediment diagenesis can be approximated. Knowing the constant heat flux, burial depth at its historical maximum, and the known ages of the rock units, the past threshold temperatures for various stages of hydrocarbon generation and sediment diagenesis can be extrapolated from the present geothermal gradient. Unfortunately, the unique set of geologic and thermal conditions rarely occur in nature, and reliable temperature data is difficult to obtain. Even if this ideal situation occurs, the presentday geothermal gradient is an approximation.
Most borehole temperatures from exploratory wells are disequilibrium temperatures. Bottom-hole temperatures (BHT) are acquired when a well is logged; the BHT temperature is generally lower than the rock formation temperature because the drilling mud is uncirculated for only a few hours to a day or so while the well is logged. Other types of temperature data from exploratory wells, such as drill-stem test temperatures or temperature logs, may be more representative of rock formation temperatures than BHT temperatures because the drilling mud may be uncirculated for a longer period of time. More accurate temperature measurements are acquired after a hydrocarbon accumulation is discovered because of longer shut-in times.
Even if reliable subsurface temperatures are acquired, this data cannot be directly projected into the geologic past. The problem of how to determine the variations of the temperature gradient below lower Cook Inlet through geologic time still remains unsolved.
The problems in determining the present-day geothermal gradient of COST No. 1 well are complicated. In the COST No. 1 well, the Mesozoic section has many unconformities representing significant amounts of time. The COST No. 1 well is located off structure, north of the Augustine-Seldovia Arch, approximately 140 km (87 mi) southwest of Kenai and is drilled in a structural low and not in a structural high as most wells are. Moreover, the early Tertiary rocks penetrated near the surface in the well indicate that the geologic record for the Cenozoic is incomplete in the lower Cook Inlet basin. Therefore, the rocks in this area are no longer at maximum burial depth and have probably cooled since reaching their highest temperature. In the upper Cook Inlet just north of Kenai, a complete section of Late Cenozoic rocks is present, and it is probable that the entire Mesozoic
and Cenozoic sections are very close to maximum burial depth.
In spite of these difficulties, I will try to determine (1) the present -day geothermal gradient for COST No. 1 well using well log data, (2) whether the geothermal gradient of COST No. 1 well in lower Cook Inlet basin compares favorably with the gradients in the upper Cook Inlet basin, and (3) how present subsurface temperatures in COST No. 1 well compare to the first occurrence of laumontite, the vitrinite reflectance data, and the thermal alteration index.
PRESENT-DAY TEMPERATURES
The temperature log data for the COST No. 1 well and the BHT for each log run are shown in figure 17. The four log runs, as recorded on the log headers (table 13), were made on June 12, June 27, August 20-21, and September 17-19, 1977. The temperature data is plotted in figure 17 and listed in table 14.
If the BHT and time since last mud circulation are recorded correctly on the well headers, then there is no difficulty in reconstructing the sequence of log runs and the BHT's. Unfortunately, not all the data was recorded for COST No. 1 well, so the data on the log headers do not agree with the data in table 14. The correct data, given to me by the log analyst, Forrest Baker, who witnessed the last log run, is given in table 14.
Bottom-hole Temperature
The first log run covered the well interval from 91 m (300ft) to 405 m (1 ,327ft) (table 13). The BHT for both runs was 19.4°C (67°F) (table 14). The second log run covered the intervalfrom404m (1,325 ft) to 1,489 m(4,885 ft) (table 13). The three BHT's were for 43.9°C (ll1°F) (table 14).
The BHT's for both log runs one and two do not increase even though the time since mud circulation stopped does increase. Two explanations are possible: (1) the temperature of the mud is in thermal equilibrium with the formation temperature, or more likely (2) because of the size of the well hole, 26 in. and 17.5 in. , there is too much mud in the hole to come to thermal equilibrium with the rocks in the formation in the short periods between mud circulation.
The BHT's of the third log run, for the interval from 1,475 m (4,840 ft) to 3,120 m (10,236 ft), ranged from 66.1°C (151°F) to 71.1°C (160°F). The BHT's for the first
Present-Day Geothermal Gradient 41
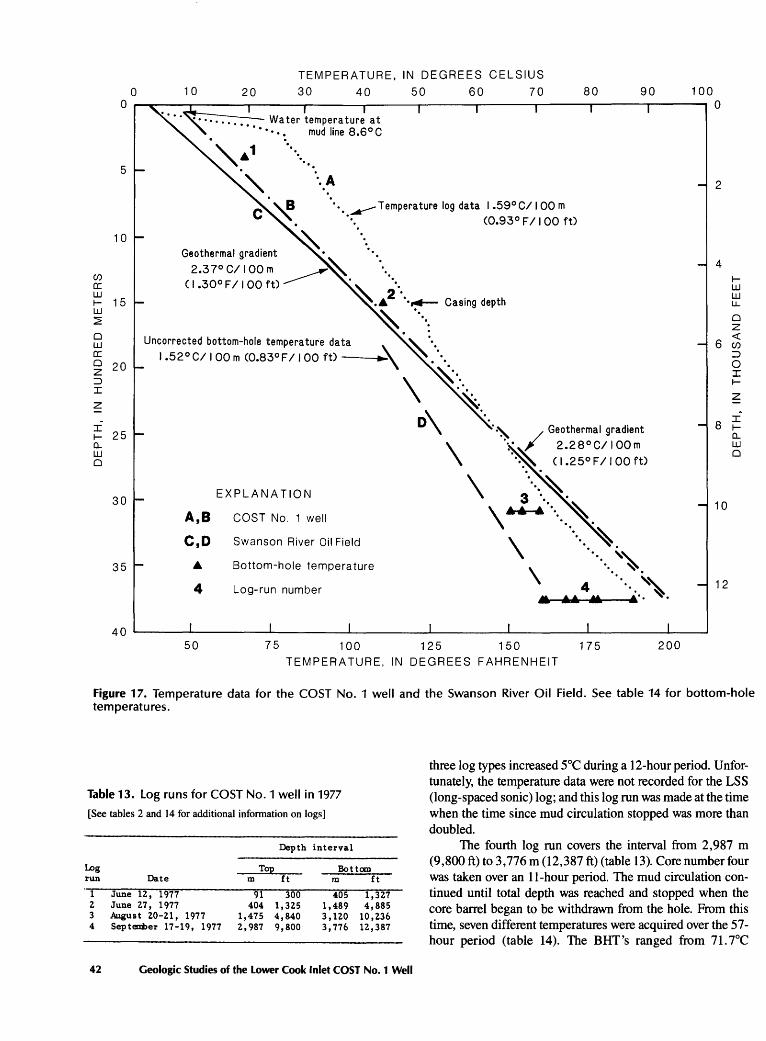
(j)
0: w
0 10 20 TEMPERATURE, IN DEGREES CELSIUS
30 40 50 60 70 80 90 100 0 0 ~~--~------~-------r-------r------~------r-------r------.-------.------~
5 ·.A 2
• •• ......--Temperature log data 1.59°CI I 00 m • •• (0.93° F I I 00 ft)
10 ·. Geothermal gradient
2.3 7° Cl I 00 m ____...~ · ••• 4
1- 15 w
( I .30° F I I 00 ft) . ~ ... . A 2 . · .,..._ Casing depth
~ ·· ..
1-w w u..
~ 0 z
Uncorrected bottom-hole temperature data :\,. ••
1.52°CI I 00 m <0.83°FI 100ft)---~ "" :· ••
0 w 6 ~ 0: 0 20 z :::> I
z
i: 25 a.. w 0
30
35
A,B C,D
4
EXPLANATION
COST No. 1 well
Swanson River Oil Field
Bottom-hole temperature
Log-run number
\ ~:-~ o\
\ ~ / Geothermal gradient
:· 2.28°CI I OOm ·.~ ( 1.25°FI I 00 ft)
\ ·· .. ~ 3 . ~
\~-... .. ~~ \ · .. ,, ·. ~
\ 4 ··· ... ''\. .... ........, .... __. . ..,___,,. .. ·. ~ .
:::> 0 I 1-
z
8 i:
10
12
a.. w 0
40 ~----_.--------~~--------~--------~--------~--------~--------~----~ 50 75 100 125 150 175 200
TEMPERATURE, IN DEGREES FAHRENHEIT
Figure 17. Temperature data for the COST No. 1 well and the Swanson River Oil Field. See table 14 for bottom-hole temperatures.
Table 13. log runs for COST No.1 well in 1977
[See tables 2 and 14 for additional information on logs]
Depth interval
Log TOJ2 Bottan run Date m ft m ft
1 June iz, 1977 91 300 405 1 ,3Z7 z June Z7, 1977 404 1,3ZS 1,489 4,885 3 August ZO-Z1, 1977 1,475 4,840 3,1ZO 10,236 4 Septeoober 17-19, 1977 Z,987 9,800 3,776 12,387
42 Geologic Studies of the Lower Cook Inlet COST No.1 Well
three log types increased 5°C during a 12-hour period. Unfortunately, the temperature data were not recorded for the LSS (long-spaced sonic) log; and this log run was made at the time when the time since mud circulation stopped was more than doubled.
The fourth log run covers the interval from 2,987 m (9,800 ft) to 3, 776 m (12,387 ft) (table 13). Core number four was taken over an 11-hour period. The mud circulation continued until total depth was reached and stopped when the core barrel began to be withdrawn from the hole. From this time, seven different temperatures were acquired over the 57-hour period (table 14). The BHT's ranged from 71. 7°C
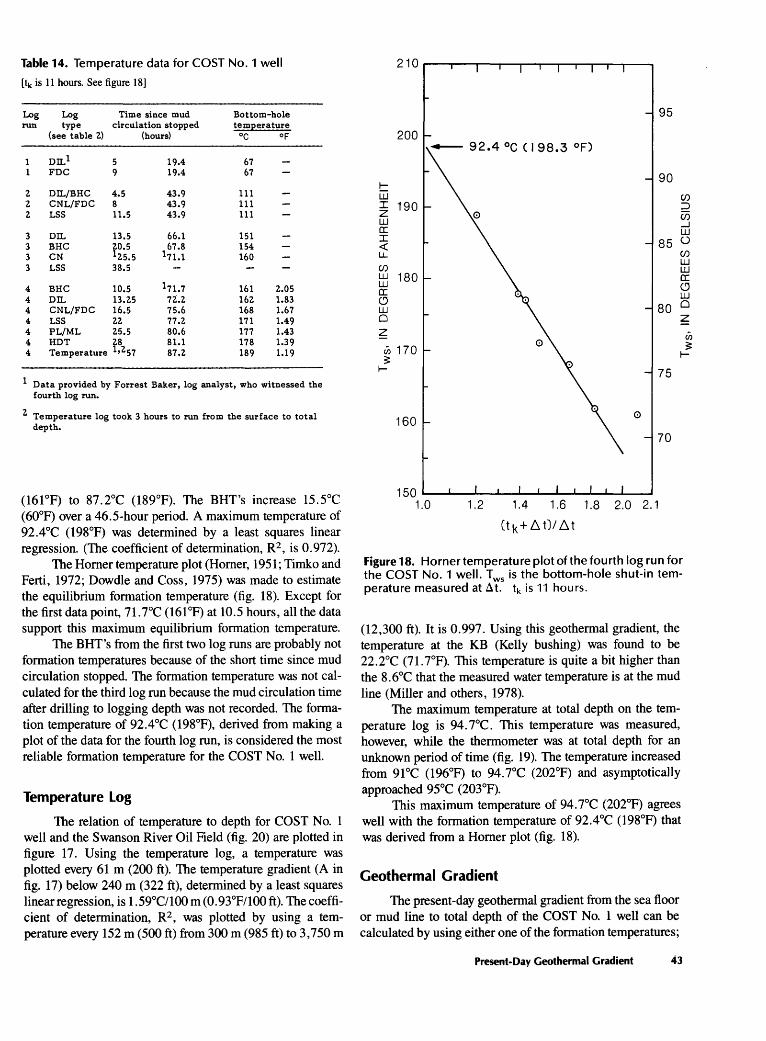
(161°F) to 87.2°C (189°F). The BHT's increase 15.5°C (60°F) over a 46.5-hour period. A maximum temperature of 92.4°C (198°F) was determined by a least squares linear regression. (The coefficient of determination, R2 , is 0.972).
The Horner temperature plot (Horner, 1951; Timko and Ferti, 1972; Dowdle and Coss, 1975) was made to estimate the equilibrium formation temperature (fig. 18). Except for the first data point, 71. 7°C (161 °F) at 10.5 hours, all the data support this maximum equilibrium formation temperature.
The BHT's from the first two log runs are probably not formation temperatures because of the short time since mud circulation stopped. The formation temperature was not calculated for the third log run because the mud circulation time after drilling to logging depth was not recorded. The formation temperature of 92.4°C (198°F), derived from making a plot of the data for the fourth log run, is considered the most reliable formation temperature for the COST No. 1 well.
Temperature Log
The relation of temperature to depth for COST No. 1 well and the Swanson River Oil Field (fig. 20) are plotted in figure 17. Using the temperature log, a temperature was plotted every 61 m (200ft). The temperature gradient (A in fig. 17) below 240 m (322 ft), determined by a least squares linear regression, is 1.59°CI100 m (0.93°F/100 ft). The coefficient of determination, R 2 , was plotted by using a temperature every 152m (500ft) from 300m (985ft) to 3,750 m
150~~----~--~~--~~----~
1.0 1.2 1.4 1.6 1.8 2.0 2.1
(tk+6t)/6t
Figure 18. Horner temperature plot of the fourth log run for the COST No.1 well. Tws is the bottom-hole shut-in temperature measured at ~t. tk is 11 hours.
(12, 300 ft ). It is 0. 997. Using this geothermal gradient, the temperature at the KB (Kelly bushing) was found to be 22.2°C (71. 7°F). This temperature is quite a bit higher than the 8. 6°C that the measured water temperature is at the mud line (Miller and others, 1978).
The maximum temperature at total depth on the temperature log is 94. 7°C. This temperature was measured, however, while the thermometer was at total depth for an unknown period of time (fig. 19). The temperature increased from 91°C (196°F) to 94.7°C (202°F) and asymptotically approached 95°C (203°F).
This maximum temperature of 94. 7°C (202°F) agrees well with the formation temperature of 92.4°C (198°F) that was derived from a Horner plot (fig. 18).
Geothermal Gradient
The present -day geothermal gradient from the sea floor or mud line to total depth of the COST No. 1 well can be calculated by using either one of the formation temperatures;
Present-Day Geothermal Gradient 43
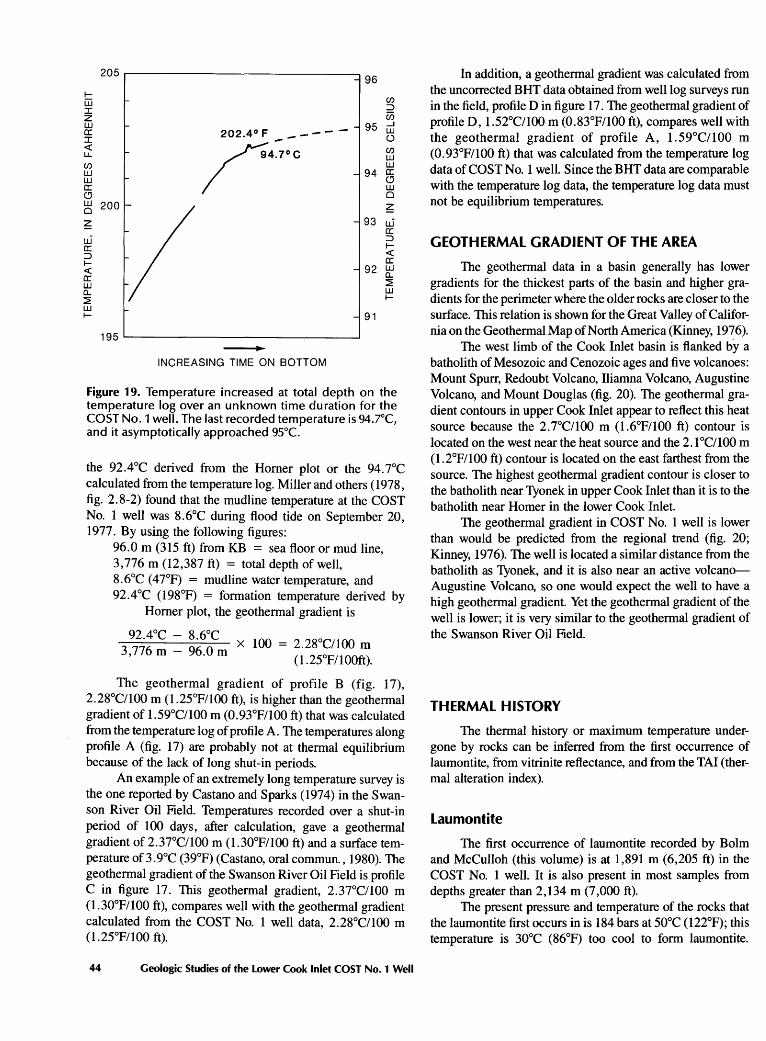
205 96
1-C/) [ij ::::> I Ci5 z
UJ 95 _J
a: 202.4° F --- LU -- 0 I r4;.c <( C/) LL. UJ C/) UJ UJ 94 a: UJ CJ a: LU CJ 0 LU 200 ~ 0
~ 93 ui a:
ui ::::> 1-a: <( ::::> a: 1-
92 UJ <( a.. a: ::2: UJ a.. LU ::2: 1-LU 1- 91
195
INCREASING TIME ON BOTTOM
Figure 19. Temperature increased at total depth on the temperature log over an unknown time duration for the COST No.1 well. The last recorded temperature is 94.7°C, and it asymptotically approached 95°C.
the 92.4°C derived from the Horner plot or the 94.7°C calculated from the temperature log. Miller and others (1978, fig. 2.8-2) found that the mudline temperature at the COST No. 1 well was 8.6°C during flood tide on September 20, 1977. By using the following figures:
96.0 m (315 ft) from KB = sea floor or mud line, 3,776 m (12,387 ft) = total depth of well, 8. 6°C ( 4 7°F) = mudline water temperature, and 92.4°C (198°F) = formation temperature derived by
Horner plot, the geothermal gradient is
92.4oC - 8·6oc x 100 = 2.28°C/100 m 3,776 m - 96.0 m (1.25oF/100ft).
The geothermal gradient of profile B (fig. 17), 2.28°C/100 m (1.25°F/100 ft), is higher than the geothermal gradient of 1.59°CI100 m (0.93°F/100 ft) that was calculated from the temperature log of profile A. The temperatures along profile A (fig. 17) are probably not at thermal equilibrium because of the lack of long shut-in periods.
An example of an extremely long temperature survey is the one reported by Castano and Sparks (1974) in the Swanson River Oil Field. Temperatures recorded over a shut-in period of 100 days, after calculation, gave a geothermal gradient of 2.37°C/100 m (1.30°F/100 ft) and a surface temperature of 3. 9°C (39°F) (Castano, oral commun. , 1980). The geothermal gradient of the Swanson River Oil Field is profile C in figure 17. This geothermal gradient, 2. 3 7°C/l 00 m (1.30°F/100 ft), compares well with the geothermal gradient calculated from the COST No. 1 well data, 2.28°C/100 m (1.25°F/100 fi).
44 Geologic Studies of the Lower Cook Inlet COST No. 1 Well
In addition, a geothermal gradient was calculated from the uncorrected BHT data obtained from well log surveys run in the field, profile D in figure 17. The geothermal gradient of profileD, 1.52°C/100 m (0.83°F/100 ft), compares well with the geothermal gradient of profile A, 1.59°CI100 m (0. 93°F/100 fi) that was calculated from the temperature log data of COST No. 1 well. Since the BHT data are comparable with the temperature log data, the temperature log data must not be equilibrium temperatures.
GEOTHERMAL GRADIENT OF THE AREA
The geothermal data in a basin generally has lower gradients for the thickest parts of the basin and higher gradients for the perimeter where the older rocks are closer to the surface. This relation is shown for the Great Valley of California on the Geothermal Map of North America (Kinney, 1976).
The west limb of the Cook Inlet basin is flanked by a batholith of Mesozoic and Cenozoic ages and five volcanoes: Mount Spurr, Redoubt Volcano, Iliamna Volcano, Augustine Volcano, and Mount Douglas (fig. 20). The geothermal gradient contours in upper Cook Inlet appear to reflect this heat source because the 2.7°CI100 m (1.6°F/100 ft) contour is located on the west near the heat source and the 2.1 °C/100 m (1.2°F/100 ft) contour is located on the east farthest from the source. The highest geothermal gradient contour is closer to the batholith near Tyonek in upper Cook Inlet than it is to the batholith near Homer in the lower Cook Inlet.
The geothermal gradient in COST No. 1 well is lower than would be predicted from the regional trend (fig. 20; Kinney, 1976). The well is located a similar distance from the batholith as Tyonek, and it is also near an active volcanoAugustine Volcano, so one would expect the well to have a high geothermal gradient. Yet the geothermal gradient of the well is lower; it is very similar to the geothermal gradient of the Swanson River Oil Field.
THERMAL HISTORY
The thermal history or maximum temperature undergone by rocks can be inferred from the first occurrence of laumontite, from vitrinite reflectance, and from the TAl (thermal alteration index).
Laumontite
The first occurrence of laumontite recorded by Bolm and McCulloh (this volume) is at 1,891 m (6,205 ft) in the COST No. 1 well. It is also present in most samples from depths greater than 2,134 m (7 ,000 fi).
The present pressure and temperature of the rocks that the laumontite first occurs in is 184 bars at 50°C (122°F); this temperature is 30°C (86°F) too cool to form laumontite.
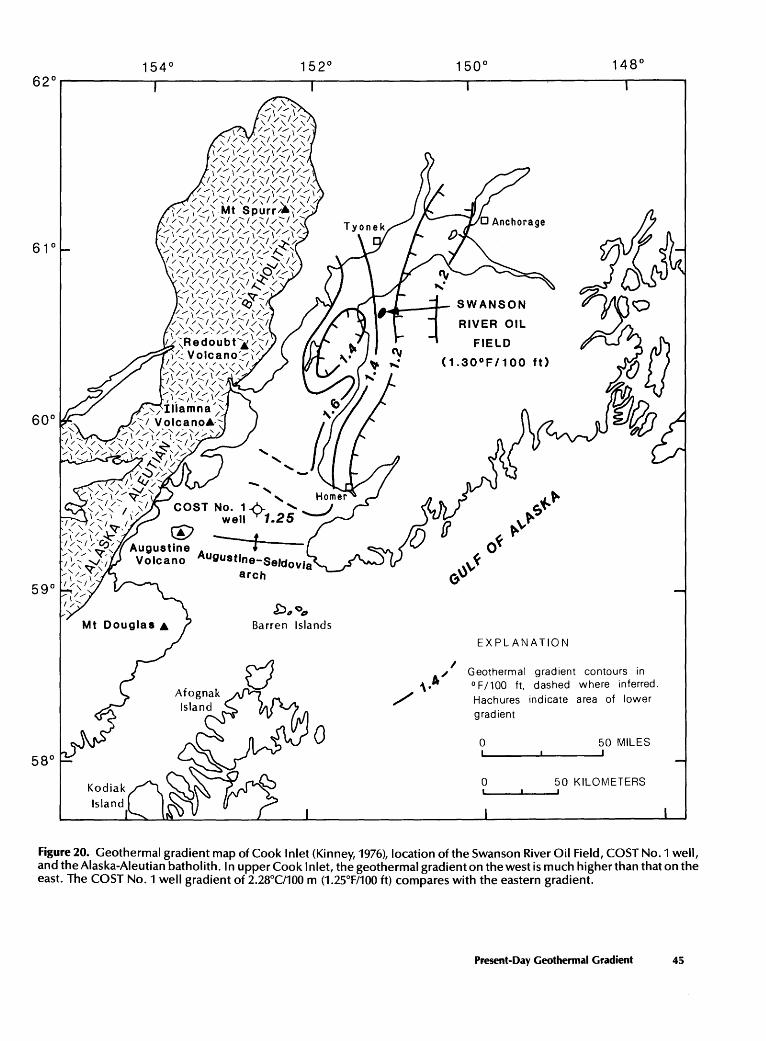
62°~--------~------------------~------------------~--------~------~------,
Augustine-Seldovia arch
I::J~~o~ Barren Islands
0
RIVER OIL
FIELD
(1.30°F/100 ft)
EXPLANATION
Geothermal gradient contours in ° F/100 ft. dashed where inferred. Hachures indicate area of lower gradient
0 50 MILES
0 50 KILOMETERS
Figure 20. Geothermal gradient map of Cook Inlet (Kinney, 1976), location of the Swanson River Oil Field, COST No.1 well, and the Alaska-Aleutian batholith. In upper Cook Inlet, the geothermal gradient on the west is much higher than that on the east. The COST No.1 well gradient of 2.28°C/100 m (1.25°F/100 ft) compares with the eastern gradient.
Present-Day Geothermal Gradient 45
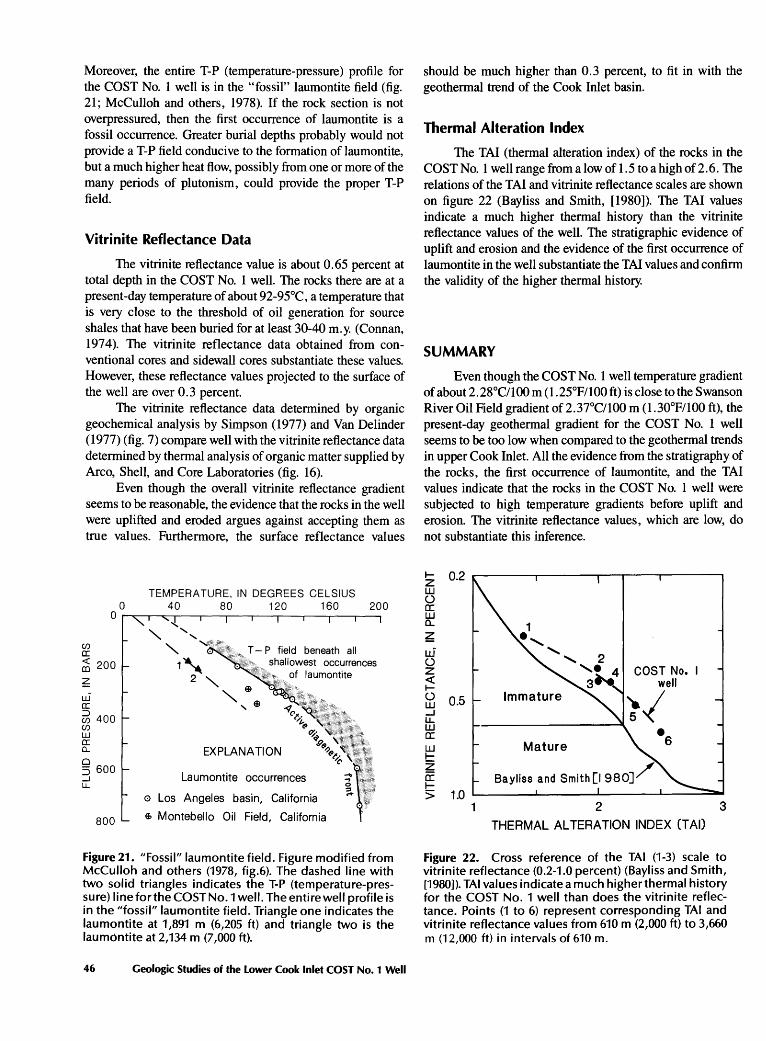
Moreover, the entire T-P (temperature-pressure) profile for the COST No. I well is in the "fossil" laumontite field (fig. 21; McCulloh and others, 1978). If the rock section is not overpressured, then the first occurrence of laumontite is a fossil occurrence. Greater burial depths probably would not provide a T-P field conducive to the formation of laumontite, but a much higher heat flow, possibly from one or more of the many periods of plutonism, could provide the proper T-P field.
Vitrinite Reflectance Data
The vitrinite reflectance value is about 0.65 percent at total depth in the COST No. 1 well. The rocks there are at a present-day temperature of about 92-95°C, a temperature that is very close to the threshold of oil generation for source shales that have been buried for at least 30-40 m.y. (Connan, 1974). The vitrinite reflectance data obtained from conventional cores and sidewall cores substantiate these values. However, these reflectance values projected to the surface of the well are over 0. 3 percent.
The vitrinite reflectance data determined by organic geochemical analysis by Simpson (1977) and Van Delinder (1977) (fig. 7) compare well with the vitrinite reflectance data determined by thermal analysis of organic matter supplied by Arco, Shell, and Core Laboratories (fig. 16).
Even though the overall vitrinite reflectance gradient seems to be reasonable, the evidence that the rocks in the well were uplifted and eroded argues against accepting them as true values. Furthermore, the surface reflectance values
TEMPERATURE, IN DEGREES CELSIUS 0 40 80 120 160 200
0
' (f)
' T- P field beneath all 0:
~ 200 1' shallowest occurrences of laumontite
~ 2' w " 0: ' e ~" . ~ 400 ?;_~ (f) w o;~ 0: ~~-?. (L EXPLANATION 61?" 0 5 600 __J Laumontite occurrences LL
o Los Angeles basin, California
800 ~ Montebello Oil Field, California
Figure 21. "Fossil" laumontite field. Figure modified from McCulloh and others (1978, fig.6). The dashed line with two solid triangles indicates the T-P (temperature-pressure) line for the COST No.1 well. The entire well profile is in the 11fossil" laumontite field. Triangle one indicates the laumontite at 1,891 m (6,205 ft) and triangle two is the laumontite at 2,134 m (7,000 ft).
46 Geologic Studies of the Lower Cook Inlet COST No. 1 Well
should be much higher than 0.3 percent, to fit in with the geothermal trend of the Cook Inlet basin.
Thermal Alteration Index
The TAl (thermal alteration index) of the rocks in the COST No. 1 well range from a low of 1.5 to a high of2.6. The relations of the TAl and vitrinite reflectance scales are shown on figure 22 (Bayliss and Smith, [1980]). The TAl values indicate a much higher thermal history than the vitrinite reflectance values of the well. The stratigraphic evidence of uplift and erosion and the evidence of the first occurrence of laumontite in the well substantiate the TAl values and confirm the validity of the higher thermal history.
SUMMARY
Even though the COST No. 1 well temperature gradient of about 2.28°C/100 m (1.25°F/100 ft) is close to the Swanson River Oil Field gradient of 2.37°C/100 m (1.30°FI100 ft), the present-day geothermal gradient for the COST No. 1 well seems to be too low when compared to the geothermal trends in upper Cook Inlet. All the evidence from the stratigraphy of the rocks, the first occurrence of laumontite, and the TAl values indicate that the rocks in the COST No. 1 well were subjected to high temperature gradients before uplift and erosion. The vitrinite reflectance values, which are low, do not substantiate this inference.
1- 0.2 z LU 0 a: LU a. ~ u.j 0
COST No. I z -< well 1-0 0.5 Immature ':/ LU _J u.. LU a: LU Mature 1-z a: 1-> 1.0
1 2 3 THERMAL ALTERATION INDEX (T AI)
Figure 22. Cross reference of the TAl (1-3) scale to vitrinite reflectance (0.2-1.0 percent) (Bayliss and Smith, [1980]). TAl values indicate a much higher thermal history for the COST No. 1 well than does the vitrinite reflectance. Points (1 to 6) represent corresponding TAl and vitrinite reflectance values from 610 m (2,000 ft) to 3,660 m (12,000 ft) in intervals of 610 m.
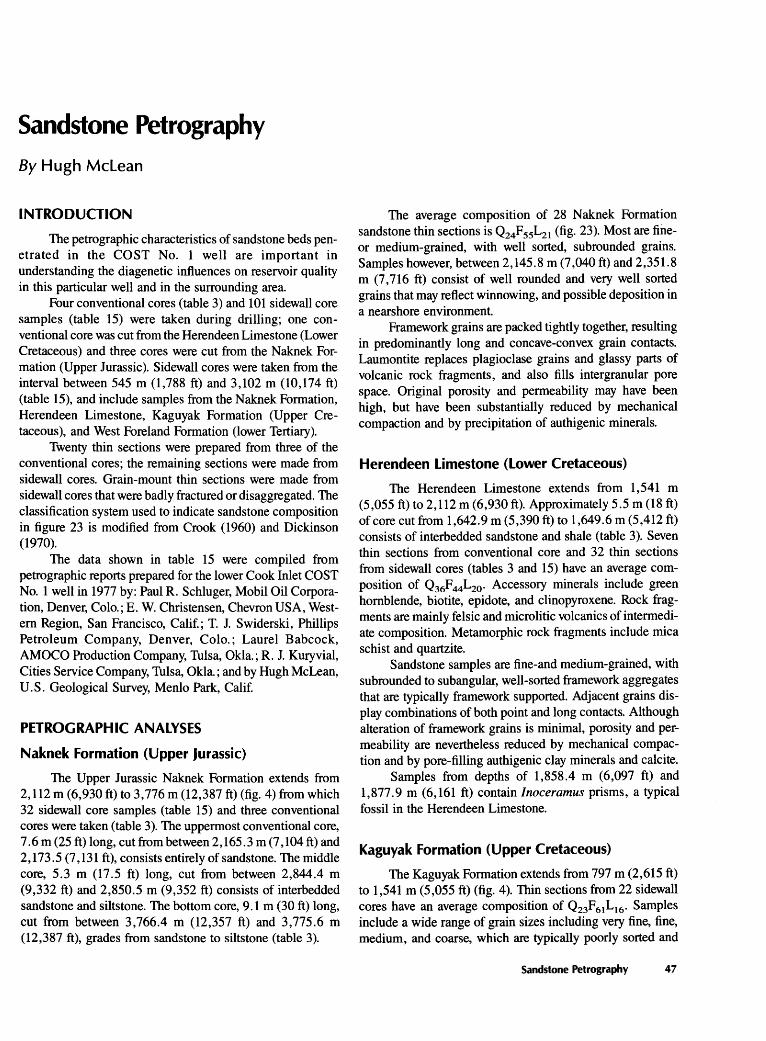
Sandstone Petrography
By Hugh Mclean
INTRODUCTION
The petrographic characteristics of sandstone beds penetrated in the COST No. 1 well are important in ~nde~stand~ng the diagenetic influences on reservoir quality m th1s part1cular well and in the surrounding area.
Four conventional cores (table 3) and 101 sidewall core samples (table 15) were taken during drilling; one conventional core was cut from the Herendeen Limestone (Lower Cretaceous) and three cores were cut from the Naknek Formation (Upper Jurassic). Sidewall cores were taken from the interval between 545 m (1,788 ft) and 3,102 m (10,174 ft) (table 15), and include samples from the Naknek Formation, Herendeen Limestone, Kaguyak Formation (Upper Cretaceous), and West Foreland Formation (lower Tertiary).
Twenty thin sections were prepared from three of the conventional cores; the remaining sections were made from sidewall cores. Grain-mount thin sections were made from sidewall cores that were badly fractured or disaggregated. The classification system used to indicate sandstone composition in figure 23 is modified from Crook (1960) and Dickinson (1970).
The data shown in table 15 were compiled from petrographic reports prepared for the lower Cook Inlet COST ~o. 1 well in 1977 by: Paul R. Schluger, Mobil Oil CorporatiOn, Denver, Colo.; E. W. Christensen, Chevron USA, Westem Region, San Francisco, Calif.; T. J. Swiderski, Phillips Petroleum Company, Denver, Colo.; Laurel Babcock, AMOCO Production Company, Tulsa, Okla.; R. J. Kuryvial, Cities Service Company, Tulsa, Okla.; and by Hugh McLean, U.S. Geological Survey, Menlo Park, Calif.
PETROGRAPHIC ANALYSES
Naknek Formation (Upper Jurassic)
The Upper Jurassic Naknek Formation extends from 2,112 m (6,930 ft) to 3, 776 m (12,387 ft) (fig. 4) from which 32 sidewall core samples (table 15) and three conventional cores were taken (table 3). The uppermost conventional core, 7.6 m (25ft) long, cut from between 2,165.3 m (7 ,104ft) and 2,173.5 (7, 131 ft), consists entirely of sandstone. The middle core, 5.3 m (17.5 ft) long, cut from between 2,844.4 m (9,332 ft) and 2,850.5 m (9,352 ft) consists of interbedded sandstone and siltstone. The bottom core, 9.1 m (30ft) long, cut from between 3,766.4 m (12,357 ft) and 3,775.6 m (12,387 ft), grades from sandstone to siltstone (table 3).
The average composition of 28 Naknek Formation sandstone thin sections is Q24F55L21 (fig. 23). Most are fineor medium-grained, with well sorted, subrounded grains. Samples however, between 2,145.8 m (7,040 ft) and 2,351.8 m (7, 716 ft) consist of well rounded and very well sorted grains that may reflect winnowing, and possible deposition in a nearshore environment.
Framework grains are packed tightly together, resulting in predominantly long and concave-convex grain contacts. Laumontite replaces plagioclase grains and glassy parts of volcanic rock fragments, and also fills intergranular pore space. Original porosity and permeability may have been high, but have been substantially reduced by mechanical compaction and by precipitation of authigenic minerals.
Herendeen Limestone (Lower Cretaceous)
The Herendeen Limestone extends from 1,541 m (5,055 ft) to 2,112 m (6,930 ft). Approximately 5.5 m (18ft) of core cut from 1,642.9 m (5,390 ft) to 1,649.6 m (5,412 ft) consists of interbedded sandstone and shale (table 3). Seven thin sections from conventional core and 32 thin sections from sidewall cores (tables 3 and 15) have an average composition of Q36F 44L20. Accessory minerals include green hornblende, biotite, epidote, and clinopyroxene. Rock fragments are mainly felsic and microlitic volcanics of intermediate composition. Metamorphic rock fragments include mica schist and quartzite.
Sandstone samples are fine-and medium-grained, with subrounded to subangular, well-sorted framework aggregates that are typically framework supported. Adjacent grains display combinations of both point and long contacts. Although alteration of framework grains is minimal, porosity and permeability are nevertheless reduced by mechanical compaction and by pore-filling authigenic clay minerals and calcite.
Samples from depths of 1,858.4 m (6,097 ft) and 1,877.9 m (6,161 ft) contain Inoceramus prisms, a typical fossil in the Herendeen Limestone.
Kaguyak Formation (Upper Cretaceous)
The Kaguyak Formation extends from 797 m (2,615 ft) to 1,541 m (5,055 ft) (fig. 4). Thin sections from 22 sidewall cores have an average composition of Q23F61L16. Samples include a wide range of grain sizes including very fine, fine, medium, and coarse, which are typically poorly sorted and
Sandstone Petrography 47
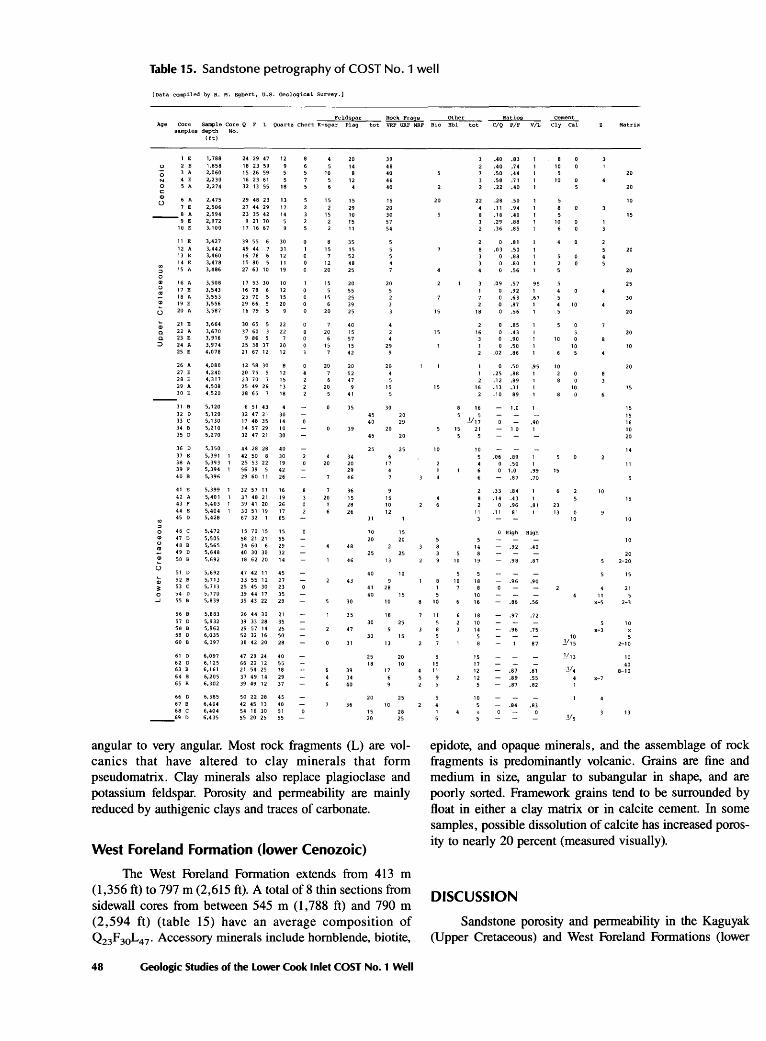
Table 15. Sandstone petrography of COST No.1 well
{Data compiled by R. M. Egbert, U.S. Geological Survey.]
Feldspar Rock Fraga Other Ratios Cement Age Core Sample Core Q F L Quartz Chert K-spar Plag tot VRF URF MRF Bio Hbl C/Q P/F V/L Cly Cal Matrix
0
0 N 0 c: Ql (.)
"' :::> 0 C1> 0
"' C1>
(.)
C1> c. c. ::>
"' :::> 0 C1> 0
"'
samples depth No.
1 E
2 E 3 A 4 E 5 A
6 A
7 E 8 A 9 E
10 E
11 E
12 A 13 E 14 E 15 A
16 A
17 E 18 A
19 E 20 A
21 E
22 A 23 E 24 A
25 E
(ft)
1, 788 1,858 2,060 2,230 2,274
2,475 2,506 2,594 2,972 3,100
3,427 3,442 3,460 3,478 3,486
3,508 3,543 3,553 3,556 3,587
3,664 3,670 3,916 3,974 4,078
26 A 4,080 27 E 4,240 28 E 4,317 29 A 4,508 30 E 4,520
31 B 5,120 32 D 5,120 33 c 5,130 34 B 5,210 35 D 5,270
24 29 47 12 18 23 59 15 26 59 16 23 61 5 32 13 55 18
29 48 23 13 27 44 29 17 23 35 42 14
9 21 70 17 16 67
39 55 6 30 49 44 7 31 16 78 6 12 15 80 5 11 27 63 10 19
17 53 30 10 16 78 6 12 25 70 5 15 29 66 20 16 79
30 65 5 22 37 60 22
9 86 25 38 37 20 216712 12
12 58 30 20 75 5 12 23 70 7 15 25 49 26 13 28 65 7 18
6 5143 32 47 21 30 17 48 35 14 14 57 29 10 32 47 21 30
36 D 5,350 44 28 28 40 37 E 5,391 1 42 SO 8 30 38 A 5,393 1 25 53 22 19 39 F 5,394 1 56 39 5 42 40 B 5,396 29 60 11 26
41 E 5,399 1 32 57 11 16 42 A
43 F 44 E 45 D
46 c 47 D
48 B 49 D
5,401 1 3148 21 19 5,403 1 39 41 20 26 5,404 1 30 51 19 17 5,428 67 32 1 65
5,472 15 70 15 15 5,505 58 2121 55 5,565 34 60 6 29 5,648 40 30 30 32
~ 50 8 5,692 18 62 20 14
(.)
C1>
~ 0
...J
51 D
52 B
53 c 54 D
55 B
5,692 5,713 5,713 5,770 5,839
56 B 5,883 57 D 5,932 sa s 5,962 59 D 6,035 60 B 6,097
61 D 6,097 62 D 6,125 63 B 6,161 64 B 6,205 65 B 6,302
66 D 6,385 67 B 6,404 68 c 6,404
__ 69 D 6,435
47 4211 45 33 5512 27 25 45 30 23 39 44 17 35 35 43 22 29
26 44 30 21 39 33 28 35 29 5714 25 52 32 16 so 38 42 20 28
47 29 24 40 66 22 12 55 21 54 25 18 37 49 14 29 39 49 12 37
50 22 28 45 42 45 13 40 5416 30 51 55 20 25 55
5 10
15 2
15 2
15 7
12 20
15
15 6
20
20 6
15
20
20
20
20
20 14
8 12
15 29 10 15 11
35 15 52 48 25
20 55 25 39 25
40 15 57 15 42
20 52 47
41
39 48 40 46 40
15 20 30 57 54
20
29
20
15
35 30 45 20 40 29
39 20 45 20
25 25 34 20 17 29 46
36 15 28 26
48
46
43
30
31
15 10 12
70 15 20 20
25 25 13
40 10
41 28 40 15
10
35 18 30 25
47 30 15
31 13
25 20 18 10
39 17 34 6 40
20 25 36 10
15 28 20 25
angular to very angular. Most rock fragments (L) are volcanics that have altered to clay minerals that form pseudomatrix. Clay minerals also replace plagioclase and potassium feldspar. Porosity and permeability are mainly reduced by authigenic clays and traces of carbonate.
West Foreland Formation (lower Cenozoic)
The West Foreland Formation extends from 413 m (1,356 ft) to 797 m (2,615 ft). A total of 8 thin sections from sidewall cores from between 545 m (1, 788 ft) and 790 m (2,594 ft) (table 15) have an average composition of Q23F30L47 . Accessory minerals include hornblende, biotite,
48 Geologic Studies of the Lower Cook Inlet COST No. 1 Well
20
15
15
15
10
10
11 5
15 11
9
.40 .83
.40 .74
.so .44
.58 .71
.22 .40
10 5
10
22 .28 .so .11 .94 .18 .40 .29 .88 .36 .85
0 .81 .03 .so
0 .88 .80 .56
.09 .57 95 0 .92
.63 .67
5 10
.87 10 18 0 .56
0 .85 16 0 .43
3 .90 10 .so 10
.02 .86
0 .so .95 10 .25 .88 2 .12 .89
16 .13 .31 10
16 5
.!In
.10 89
1.0
.90 15 21 10
5
10 .06 .89
0 .50 0 1.0 .99 15
- .87 .70
.33 .84
.14 .43 1 0 .96 .81
11 .11 81 3
0 High High
14 .92 .40 8
10 19 .98 .87
10 18 8
10 16
18 10 14
5
15 17 12 12
5
10 5
- .96 .90
.86 .56
.97 .72
- .96 .75
87
.87 .81
.89 .ss
.87 .82
.84 .83
23 13 0
10
.!Is
10
11 x-5
x-3
x-7
20
20
10
15
20
20
25
30
20
20
10
20
15
15 15 16 10 20
14
11
15
10
10
20 2-20
15
21
2-3
10
2-10
10 40
8-10
13
epidote, and opaque minerals, and the assemblage of rock fragments is predominantly volcanic. Grains are fine and medium in size, angular to subangular in shape, and are poorly sorted. Framework grains tend to be surrounded by float in either a clay matrix or in calcite cement. In some samples, possible dissolution of calcite has increased porosity to nearly 20 percent (measured visually).
DISCUSSION
Sandstone porosity and permeability in the Kaguyak (Upper Cretaceous) and West Foreland Formations (lower
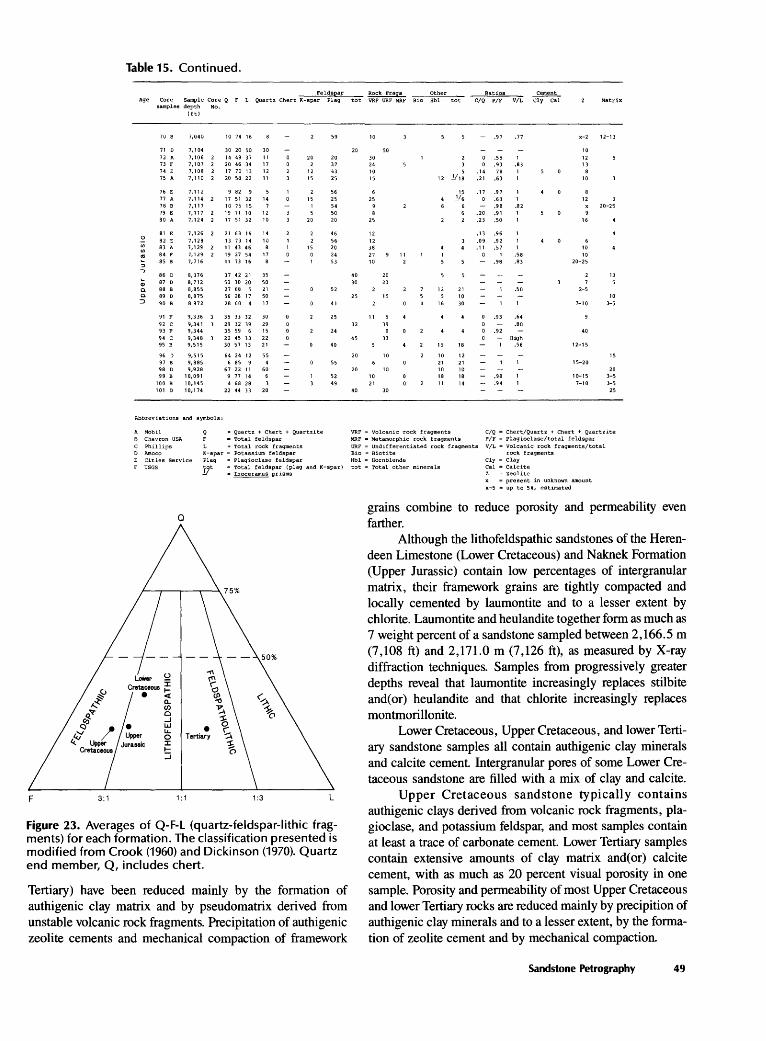
Table 15. Continued.
Feldsear Age Core Sample Core Q F L Quartz Chert K-spar Plag
samples depth 1ft)
70 8 7,040 10 74 16 59
71 D 7,104 30 20 50 30
72 A 7,106 14 49 37 11 20 20 73 F 7,107 20 46 34 17 37 74 E 7,108 2 17 70 13 12 12 43 75 A 7,110 2 20 58 22 11 15 25
76 E 7,112 9 82 9 5 56 77 A 7,114 2 17 51 32 14 15 25 78 B 7,117 10 75 15 54 79 E 7,117 2 19 71 10 12 50 80 A 7,124 2 17 51 32 10 20 20
<.l 81 E 7,126 2 21 63 16 14 46 82 E 7,128 13 73 14 10 56
en 83 A 7,129 2 11 43 46 8 15 20 en ., 84 F 7,1.l9 2 19 27 54 17 24 85 B
::> 7,716 11 73 16 53
...., 86 D 8,376 37 42 21 35
;o 87 D 8,712 50 30 20 50
c. 88 B 8,855 27 68 5 21 52 c. 89 D 8,875 56 28 17 50 ::J 90 B 8972 28 68 4 17 41
91 F 9,336 3 35 33 32 30 25
92 c 9,341 3 29 32 39 29 93 F 9,344 35 59 6 15 24 94 c 9,348 3 22 45 33 22 95 B 9,515 30 57 13 21 40
96 D 9,515 64 24 12 55 97 8 9,885 6 85 9 55 98 D 9,928 67 22 11 60 99 8 10,091 9 77 14 52
100 B 10,145 4 68 28 49 101 D 10,174 22 44 33 20
Abbreviations and symbols:
1\ Mobil = Quartz + Chert + Quartzite B Chevron USA = Total feldspar c Phillips = Total rock fragments D Amoco K-spar = Potassium feldspar E Cities Service Plag = Plagioclase feldspar F USGS J/t = Total feldspar lplag and K-spar)
=~prisms
Q
F 3:1 1:1 1:3 L
Figure 23. Averages of Q-F-L (quartz-feldspar-lithic fragments) for each formation. The classification presented is modified from Crook (1960) and Dickinson (1970). Quartz end member, Q, includes chert.
Tertiary) have been reduced mainly by the formation of authigenic clay matrix and by pseudomatrix derived from unstable volcanic rock fragments. Precipitation of authigenic zeolite cements and mechanical compaction of framework
Rock Fraqs Other Ratios ~ tot VRF URF MRF Bio Hbl tot C/Q P/F V/L Cly Cal Matrix
10 - .97 .77 x-2 12-13
20 50 10
30 0 .55 1 12 24 0 .93 .83 13 10 5 .14 78 15 12 .!!1s .21 .63 10
15 .17 .97 25 .!16 0 .63 12
- .98 .82 20-25 .20 .91
25 .23 .50 16
12 .13 .96
12 .09 .92 38 .11 .57 10 27 11 .58 10 10 2 - .98 .83 20-25
40 20 13 30 20
12 21 .50 2-5 25 15 5 10 10
16 30 7-10 3-5
11 .93 .64
32 39 .80 0 .92 40
45 33 - High 15 18 .56 12-15
20 10 10 12 15 21 21 15-20
20 10 10 10 20 10 18 18 - .98 10-15 3-5
21 11 14 - .94 7-10 3-5 40 30 25
VRF = Volcanic rock fragments C/Q = Chert/Quartz + Chert + Quartzite MRF = Metamorphic rock fragments P/F = Plagioclase/total feldspar URF = Undifferentiated rock fragments V/L = Volcanic rock fragments/total Bio = Biotite rock fragments Hbl = Hornblende Cly = Clay tot = Total other minerals Cal = Calcite
z = Zeolite X = present in unknown amount x-5 = up to 5%, estimated
grains combine to reduce porosity and permeability even farther.
Although the lithofeldspathic sandstones of the Herendeen Limestone (Lower Cretaceous) and Naknek Formation (Upper Jurassic) contain low percentages of intergranular matrix, their framework grains are tightly compacted and locally cemented by laumontite and to a lesser extent by chlorite. Laumontite and heulandite together form as much as 7 weight percent of a sandstone sampled between 2,166.5 m (7,108 ft) and 2,171.0 m (7,126 ft), as measured by X-ray diffraction techniques. Samples from progressively greater depths reveal that laumontite increasingly replaces stilbite and(or) heulandite and that chlorite increasingly replaces montmorillonite.
Lower Cretaceous, Upper Cretaceous, and lower Tertiary sandstone samples all contain authigenic clay minerals and calcite cement. Intergranular pores of some Lower Cretaceous sandstone are filled with a mix of clay and calcite.
Upper Cretaceous sandstone typically contains authigenic clays derived from volcanic rock fragments, plagioclase, and potassium feldspar, and most samples contain at least a trace of carbonate cement. Lower Tertiary samples contain extensive amounts of clay matrix and( or) calcite cement, with as much as 20 percent visual porosity in one sample. Porosity and permeability of most Upper Cretaceous and lower Tertiary rocks are reduced mainly by precipition of authigenic clay minerals and to a lesser extent, by the formation of zeolite cement and by mechanical compaction.
Sandstone Petrography 49

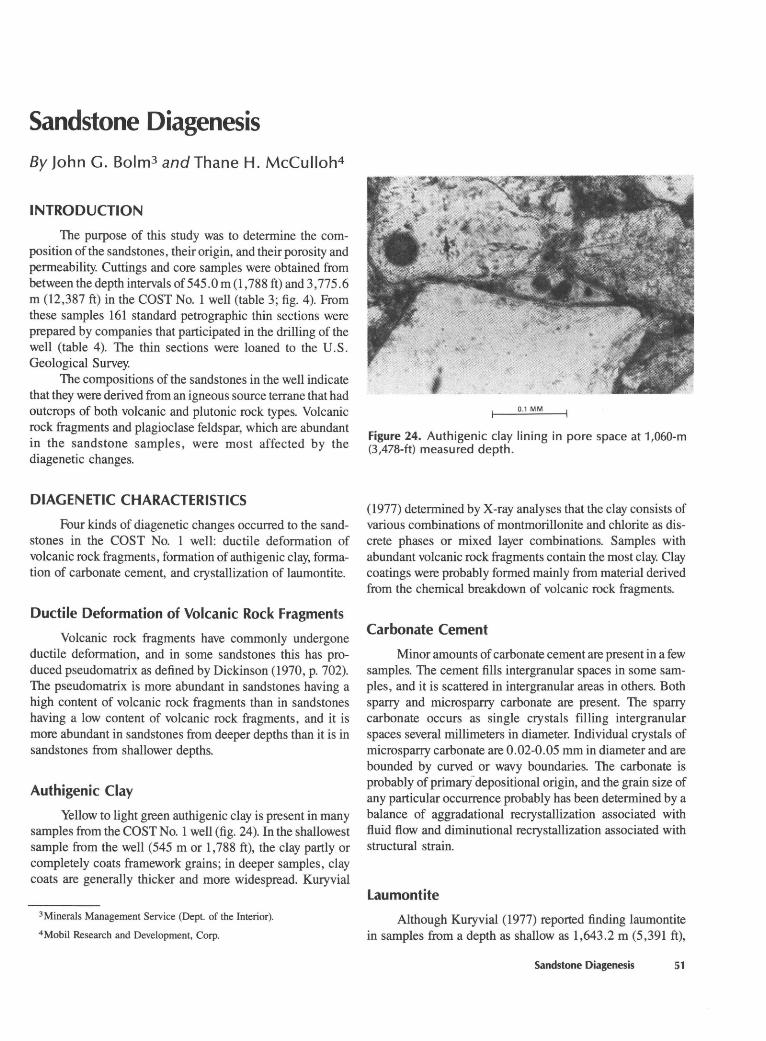
Sandstone Diagenesis By John G. Bolm3 and Thane H. McCulloh4
INTRODUCTION
The purpose of this study was to determine the composition of the sandstones, their origin, and their porosity and permeability. Cuttings and core samples were obtained from between the depth intervals of545.0 m (1,788 ft) and 3,775.6 m (12,387 ft) in the COST No. 1 well (table 3; fig. 4). From these samples 161 standard petrographic thin sections were prepared by companies that participated in the drilling of the well (table 4 ). The thin sections were loaned to the U.S. Geological Survey.
The compositions of the sandstones in the well indicate that they were derived from an igneous source terrane that had outcrops of both volcanic and plutonic rock types. Volcanic rock fragments and plagioclase feldspar, which are abundant in the sandstone samples, were most affected by the diagenetic changes.
DIAGENETIC CHARACTERISTICS
Four kinds of diagenetic changes occurred to the sandstones in the COST No. 1 well: ductile deformation of volcanic rock fragments, formation of authigenic clay, formation of carbonate cement, and crystallization of laumontite.
Ductile Deformation of Volcanic Rock Fragments
Volcanic rock fragments have commonly undergone ductile deformation, and in some sandstones this has produced pseudomatrix as defined by Dickinson (1970, p. 702). The pseudomatrix is more abundant in sandstones having a high content of volcanic rock fragments than in sandstones having a low content of volcanic rock fragments, and it is more abundant in sandstones from deeper depths than it is in sandstones from shallower depths.
Authigenic Clay
Yellow to light green authigenic clay is present in many samples from the COST No. 1 well (fig. 24). In the shallowest sample from the well (545 m or 1, 788 ft), the clay partly or completely coats framework grains; in deeper samples, clay coats are generally thicker and more widespread. Kuryvial
3Minerals Management Service (Dept. of the Interior).
4 Mobil Research and Development, Corp.
0.1 MM
Figure 24. Authigenic clay lining in pore space at 1 ,060-m (3,478-ft) measured depth.
(1977) determined by X-ray analyses that the clay consists of various combinations of montmorillonite and chlorite as discrete phases or mixed layer combinations. Samples with abundant volcanic rock fragments contain the most clay. Clay coatings were probably formed mainly from material derived from the chemical breakdown of volcanic rock fragments.
Carbonate Cement
Minor amounts of carbonate cement are present in a few samples. The cement fills intergranular spaces in some samples, and it is scattered in intergranular areas in others. Both sparry and microsparry carbonate are present. The sparry carbonate occurs as single crystals filling intergranular spaces several millimeters in diameter. Individual crystals of micros parry carbonate are 0. 02-0.05 mm in diameter and are bounded by curved or wavy boundaries. The carbonate is probably of primarf depositional origin, and the grain size of any particular occurrence probably has been determined by a balance of aggradational recrystallization associated with fluid flow and diminutional recrystallization associated with structural strain.
Laumontite
Although Kuryvial (1977) reported finding laumontite in samples from a depth as shallow as 1,643.2 m (5,391 ft),
Sandstone Diagenesis 51
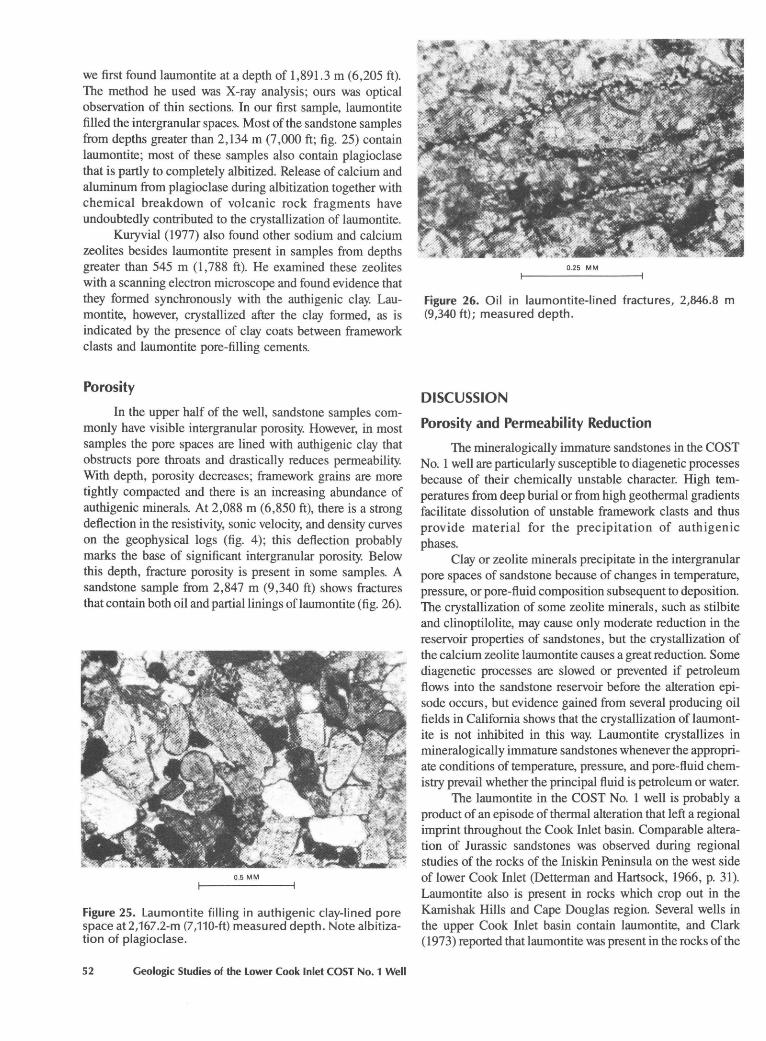
we first found laumontite at a depth of 1,891.3 m (6,205 ft). The method he used was X-ray analysis; ours was optical observation of thin sections. In our first sample, laumontite filled the intergranular spaces. Most of the sandstone samples from depths greater than 2,134 m (7 ,000 ft; fig. 25) contain laumontite; most of these samples also contain plagioclase that is partly to completely albitized. Release of calcium and aluminum from plagioclase during albitization together with chemical breakdown of volcanic rock fragments have undoubtedly contributed to the crystallization of laumontite.
Kuryvial (1977) also found other sodium and calcium zeolites besides laumontite present in samples from depths greater than 545 m (1, 788 ft). He examined these zeolites with a scanning electron microscope and found evidence that they formed synchronously with the authigenic clay. Laumontite, however, crystallized after the clay formed, as is indicated by the presence of clay coats between framework clasts and laumontite pore-filling cements.
Porosity
In the upper half of the well, sandstone samples commonly have visible intergranular porosity. However, in most samples the pore spaces are lined with authigenic clay that obstructs pore throats and drastically reduces permeability. With depth, porosity decreases; framework grains are more tightly compacted and there is an increasing abundance of authigenic minerals. At 2,088 m (6,850 ft), there is a strong deflection in the resistivity, sonic velocity, and density curves on the geophysical logs (fig. 4); this deflection probably marks the base of significant intergranular porosity. Below this depth, fracture porosity is present in some samples. A sandstone sample from 2,847 m (9,340 ft) shows fractures that contain both oil and partial linings of laumontite (fig. 26).
0.5 MM
Figure 25. Laumontite filling in authigenic clay-lined pore space at 2,167.2-m (7,110-ft) measured depth. Note albitization of plagioclase.
52 Geologic Studies of the Lower Cook Inlet COST No.1 Well
0.25 MM
Figure 26. Oil in laumontite-lined fractures, 2,846.8 m (9,340 ft); measured depth.
DISCUSSION
Porosity and Permeability Reduction
The mineralogically immature sandstones in the COST No. 1 well are particularly susceptible to diagenetic processes because of their chemically unstable character. High temperatures from deep burial or from high geothermal gradients facilitate dissolution of unstable framework clasts and thus provide material for the precipitation of authigenic phases.
Clay or zeolite minerals precipitate in the intergranular pore spaces of sandstone because of changes in temperature, pressure, or pore-fluid composition subsequent to deposition. The crystallization of some zeolite minerals, such as stilbite and clinoptilolite, may cause only moderate reduction in the reservoir properties of sandstones, but the crystallization of the calcium zeolite laumontite causes a great reduction. Some diagenetic processes are slowed or prevented if petroleum flows into the sandstone reservoir before the alteration episode occurs, but evidence gained from several producing oil fields in California shows that the crystallization of laumontite is not inhibited in this way. Laumontite crystallizes in mineralogically immature sandstones whenever the appropriate conditions of temperature, pressure, and pore-fluid chemistry prevail whether the principal fluid is petroleum or water.
The laumontite in the COST No. 1 well is probably a product of an episode of thermal alteration that left a regional imprint throughout the Cook Inlet basin. Comparable alteration of Jurassic sandstones was observed during regional studies of the rocks of the Iniskin Peninsula on the west side of lower Cook Inlet (Detterman and Hartsock, 1966, p. 31). Laumontite also is present in rocks which crop out in the Kamishak Hills and Cape Douglas region. Several wells in the upper Cook Inlet basin contain laumontite, and Clark (1973) reported that laumontite was present in the rocks of the
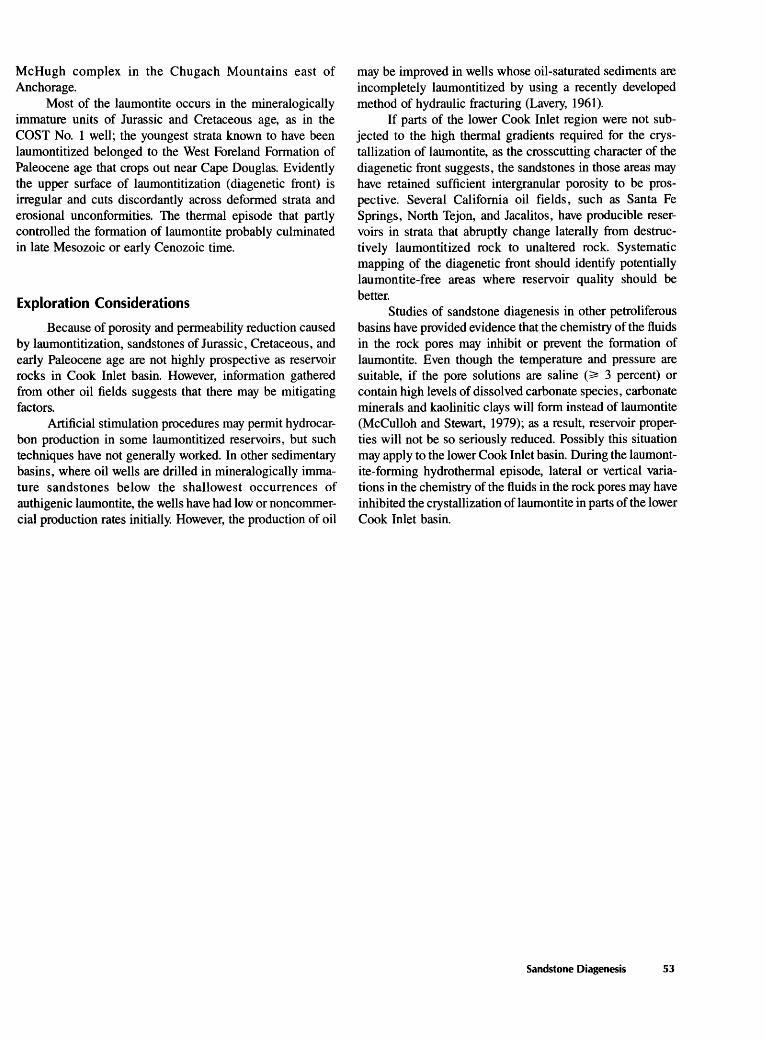
McHugh complex in the Chugach Mountains east of Anchorage.
Most of the laumontite occurs in the mineralogically immature units of Jurassic and Cretaceous age, as in the COST No. 1 well; the youngest strata known to have been laumontitized belonged to the West Foreland Formation of Paleocene age that crops out near Cape Douglas. Evidently the upper surface of laumontitization (diagenetic front) is irregular and cuts discordantly across deformed strata and erosional unconformities. The thermal episode that partly controlled the formation of laumontite probably culminated in late Mesozoic or early Cenozoic time.
Exploration Considerations
Because of porosity and permeability reduction caused by laumontitization, sandstones of Jurassic, Cretaceous, and early Paleocene age are not highly prospective as reservoir rocks in Cook Inlet basin. However, information gathered from other oil fields suggests that there may be mitigating factors.
Artificial stimulation procedures may permit hydrocarbon production in some laumontitized reservoirs, but such techniques have not generally worked. In other sedimentary basins, where oil wells are drilled in mineralogically immature sandstones below the shallowest occurrences of authigenic laumontite, the wells have had low or noncommercial production rates initially. However, the production of oil
may be improved in wells whose oil-saturated sediments are incompletely laumontitized by using a recently developed method of hydraulic fracturing (Lavery, 1961).
If parts of the lower Cook Inlet region were not subjected to the high thermal gradients required for the crystallization of laumontite, as the crosscutting character of the diagenetic front suggests, the sandstones in those areas may have retained sufficient intergranular porosity to be prospective. Several California oil fields, such as Santa Fe Springs, North Tejon, and Jacalitos, have producible reservoirs in strata that abruptly change laterally from destructively laumontitized rock to unaltered rock. Systematic mapping of the diagenetic front should identify potentially laumontite-free areas where reservoir quality should be better.
Studies of sandstone diagenesis in other petroliferous basins have provided evidence that the chemistry of the fluids in the rock pores may inhibit or prevent the formation of laumontite. Even though the temperature and pressure are suitable, if the pore solutions are saline c~ 3 percent) or contain high levels of dissolved carbonate species, carbonate minerals and kaolinitic clays will form instead of laumontite (McCulloh and Stewart, 1979); as a result, reservoir properties will not be so seriously reduced. Possibly this situation may apply to the lower Cook Inlet basin. During the laumontite-forming hydrothermal episode, lateral or vertical variations in the chemistry of the fluids in the rock pores may have inhibited the crystallization of laumontite in parts of the lower Cook Inlet basin.
Sandstone Diagenesis 53

Plutonism and Provenance-Implications for Sandstone Compositions By Travis Hudsons
INTRODUCTION
In order to predict the kinds of sedimentary sequences in a well, the type of tectonic setting in the surrounding area must be identified first.
The provenance history of the forearc basin that includes Cook Inlet is revealed in the temporal, petrologic, and regional relations of southern Alaska plutonic rocks. The plutonic history indicates that provenance evolved from simple magmatic arc sequences in the early Mesozoic to a complicated composite of magmatic arc, recycled orogen, and continental block provenances in the late Cenozoic. Because three major provenance types are present, a complete range of sandstone framework modes is to be expected. Generally, Jurassic plutonism produced rocks with mafic to intermediate compositions, Cretaceous plutonism produced mostly intermediate compositions, and Tertiary plutonism produced felsic compositions. During provenance evolution, the amounts of metamorphic and plutonic rocks increased proportionally and the compositions of the younger plutons became more felsic, so the younger sandstones of the Cook Inlet basin are most likely to have quartzose framework modes.
For the purpose of this report, the provenance of the forearc basin is considered to be that part of southern Alaska south of, and including, the Aleutian-Alaska Range. This simplifying assumption focuses the discussion on the region proximal to the basin although it does not imply that other parts of Alaska could not have also been part of the provenance.
SOUTHERN ALASKA PLUTONISM
Plutonic rocks are very extensive in southern Alaska; all larger outcrops are shown in figure 27. The distribution, age, and setting of these rocks define several regional plutonic belts (Reed and Lanphere, 1973b; Hudson, 1979a), and these belts have important implications for southern Alaskan tectonic history (Hudson, 1979b,c; Hudson and others, 1979). Southern Alaska plutons (fig. 27) can be subdivided into the following groups or episodes of plutonic activity based on their age and geologic setting:
1. Late Triassic(?) and Early Jurassic (ca. 195 to 185 Ma) quartz diorite and tonalite in elongate deformed plutons
5 ARCO Exploration Technology.
are discontinuously exposed on northwestern Kodiak Island, the Barren Islands, and southern Kenai Peninsula. Some plutons intrude Upper Triassic sedimentary rocks that include volcanogenic sandstone and tuff. Because the K-Ar ages (about 193 Ma) on these plutonic rocks are all single mineral (hornblende) minimum ages, some could be slightly older.
2. Early Jurassic(?) gabbro, quartz diorite, and tonalite make up elongate and deformed plutons of the northern Chugach Mountains; the easternmost plutonic complex in this group (fig. 27) is mostly gabbro. The age of these poorly known plutons is uncertain. Because they share certain petrologic characteristics and a similar geologic setting with plutonic rocks on western Kodiak Island they may be Early Jurassic in age.
3. Middle and Late Jurassic (ca. 175 to 145 Ma) gabbro to granite but mostly quartz diorite, tonalite (including trondhjemite) and granodiorite make up large elongate batholithic complexes in the Aleutian Range and the Talkeetna Mountains. The batholiths locally intrude, and are regionally in spatial association with, Early Jurassic volcanogenic rocks of the Talkeetna Formation.
4. Late Jurassic (ca. 160 to 140 Ma) quartz diorite, monzodiorite, tonalite, and granodiorite are present in a large batholithic complex and some smaller plutons of the Chitina Valley area (Chitina Valley batholith of MacKevett, 1978). The plutons are known to have correlatives to the south east, and they apparently overlap in age and share some petrologic characteristics with Middle and Late Jurassic plutons to the west. Unlike Jurassic plutons to the west, however, spatially associated volcanogenic rocks have not been identified with plutons of the Chitina Valley area.
5. Middle Cretaceous (ca. 120 to 105 Ma) diorite to granite is present in shallow-seated small to moderate-sized plutons in the Nutzotin Mountains-correlative plutons have been identified to the southeast but not to the west. These plutons have local areas of extensive hydrothermal alteration and the volcanogenic rocks of the Lower Cretaceous Chisana Formation (Richter, 1976) are probably related to them.
6. Late Cretaceous and early Tertiary (ca. 7 5 to 50 Ma) gabbro to granite form many large plutons and coalescing batholithic complexes that make up a major part of the plutonic rocks in the Alaska Range and Talkeetna Mountains. Most of the more mafic rocks are ~62 Ma old and tend to be located in the southern and eastern plutons of the group.
Plutonism and Provenance-Implications for Sandstone Compositions 55
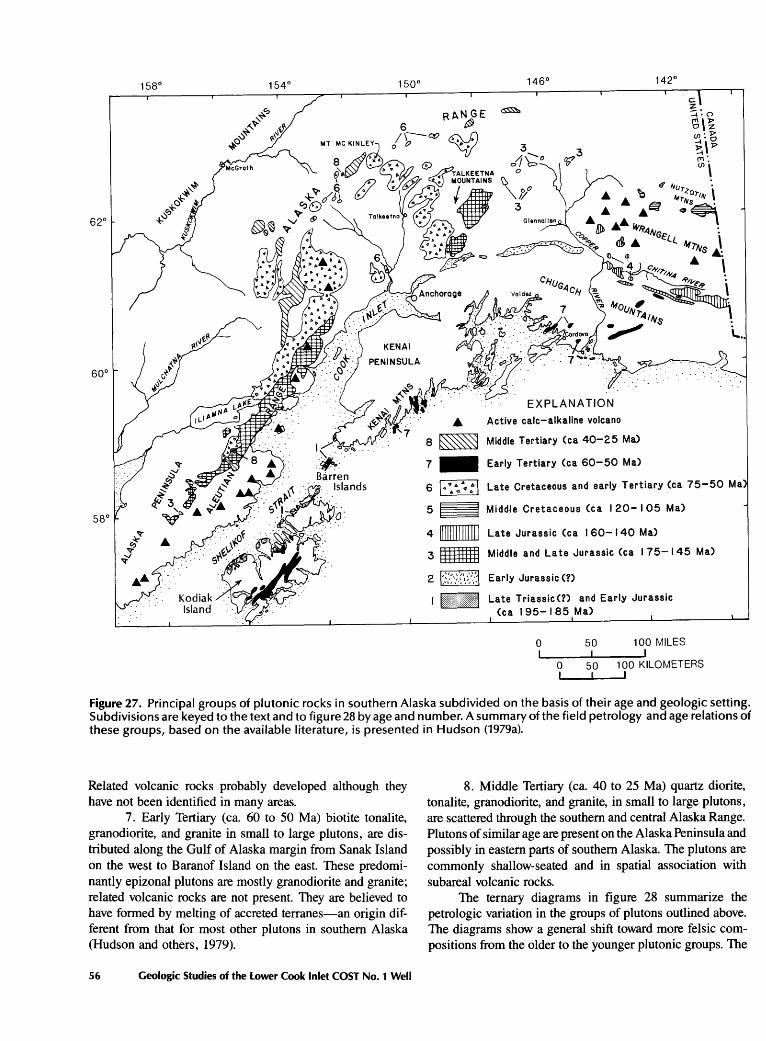
RANGE t)
.& Active calc-alkaline volcano
8 ~ Middle Tertiary (ca 40-25 Ma)
7 - Early Tertiary (ca 60-50 Ma)
6 ~ Late Cretaceous and early Tertiary (ca 75-50 Ma
5 ~ Middle Cretaceous (ca I 20-1 05 Ma)
4 liiiiiiiiJIII] Late Jurassic (ca 160-140 Ma)
3 ;R Middle and Late Jurassic (ca I 75-145 Ma)
2 !:~:·:{:"..~::,:] Early Jurassic(?)
1 [t'i!'!ii!i!!i!!i!i!::::::::::::j Late Triassic(?) and Early Jurassic (ca I 95- I 85 Ma)
0 50 100 MILES
0 50 100 KILOMETERS I I I
Figure 27. Principal groups of plutonic rocks in southern Alaska subdivided on the basis of their age and geologic setting. Subdivisions are keyed to the text and to figure 28 by age and number. A summary of the field petrology and age relations of these groups, based on the available literature, is presented in Hudson (1979a).
Related volcanic rocks probably developed although they have not been identified in many areas.
7. Early Tertiary (ca. 60 to 50 Ma) biotite tonalite, granodiorite, and granite in small to large plutons, are distributed along the Gulf of Alaska margin from Sanak Island on the west to Baranof Island on the east. These predominantly epizonal plutons are mostly granodiorite and granite; related volcanic rocks are not present. They are believed to have formed by melting of accreted terranes-an origin different from that for most other plutons in southern Alaska (Hudson and others, 1979).
56 Geologic Studies of the Lower Cook Inlet COST No. 1 Well
8. Middle Tertiary (ca. 40 to 25 Ma) quartz diorite, tonalite, granodiorite, and granite, in small to large plutons, are scattered through the southern and central Alaska Range. Plutons of similar age are present on the Alaska Peninsula and possibly in eastern parts of southern Alaska. The plutons are commonly shallow-seated and in spatial association with subarea! volcanic rocks.
The ternary diagrams in figure 28 summarize the petrologic variation in the groups of plutons outlined above. The diagrams show a general shift toward more felsic compositions from the older to the younger plutonic groups. The
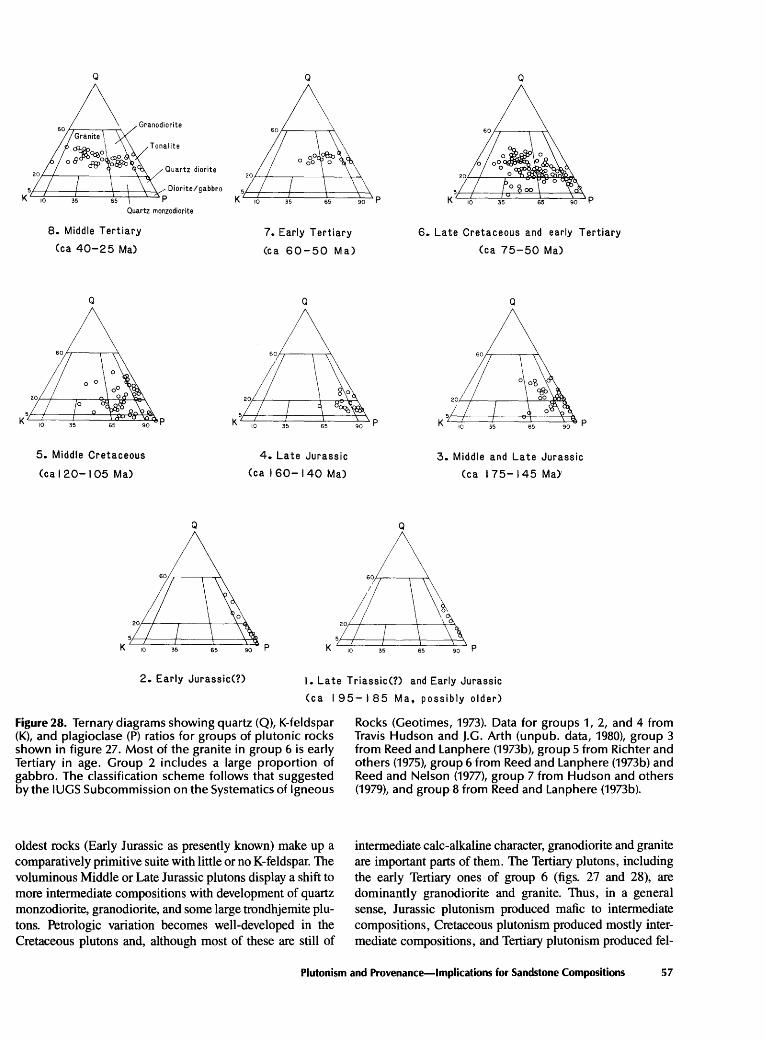
Q
Tonalite
Quartz diorite
'L=!=-==:t=====~t=::t~p Diorite/gabbro
Quartz monzodiorite
Q Q
8. Middle Tertiary
(ca 40-25 Ma)
7. Early Tertiary
(ca 60-50 Ma)
6. Late Cretaceous and early Tertiary
(ca 75-50 Ma)
Q
5. Middle Cretaceous
(ca 120-1 05 Ma)
K 10
Q
35 65
Q
4. Late Jurassic
(ca I 60- I 40 Ma)
Q
Q
3. Middle and Late Jurassic
(ca I 75- 145 Ma)'
2. Early Jurassic(?) I. Late Triassic(?) and Early Jurassic
(ca I 95- I 85 Ma. possibly older)
Figure 28. Ternary diagrams showing quartz (Q), K-feldspar (K), and plagioclase (P) ratios for groups of plutonic rocks shown in figure 27. Most of the granite in group 6 is early Tertiary in age. Group 2 includes a large proportion of gabbro. The classification scheme follows that suggested by the JUGS Subcommission on the Systematics of Igneous
oldest rocks (Early Jurassic as presently known) make up a comparatively primitive suite with little or no K-feldspar. The voluminous Middle or Late Jurassic plutons display a shift to more intermediate compositions with development of quartz monzodiorite, granodiorite, and some large trondhjemite plutons. Petrologic variation becomes well-developed in the Cretaceous plutons and, although most of these are still of
Rocks (Geotimes, 1973). Data for groups 1, 2, and 4 from Travis Hudson and j.G. Arth (unpub. data, 1980), group 3 from Reed and Lanphere (1973b), group 5 from Richter and others (1975), group 6 from Reed and Lanphere (1973b) and Reed and Nelson (1977), group 7 from Hudson and others (1979), and group 8 from Reed and Lanphere (1973b).
intermediate calc-alkaline character, granodiorite and granite are important parts of them. The Tertiary plutons, including the early Tertiary ones of group 6 (figs. 27 and 28), are dominantly granodiorite and granite. Thus, in a general sense, Jurassic plutonism produced mafic to intermediate compositions, Cretaceous plutonism produced mostly intermediate compositions, and Tertiary plutonism produced fel-
Plutonism and Provenance-Implications for Sandstone Compositions 57
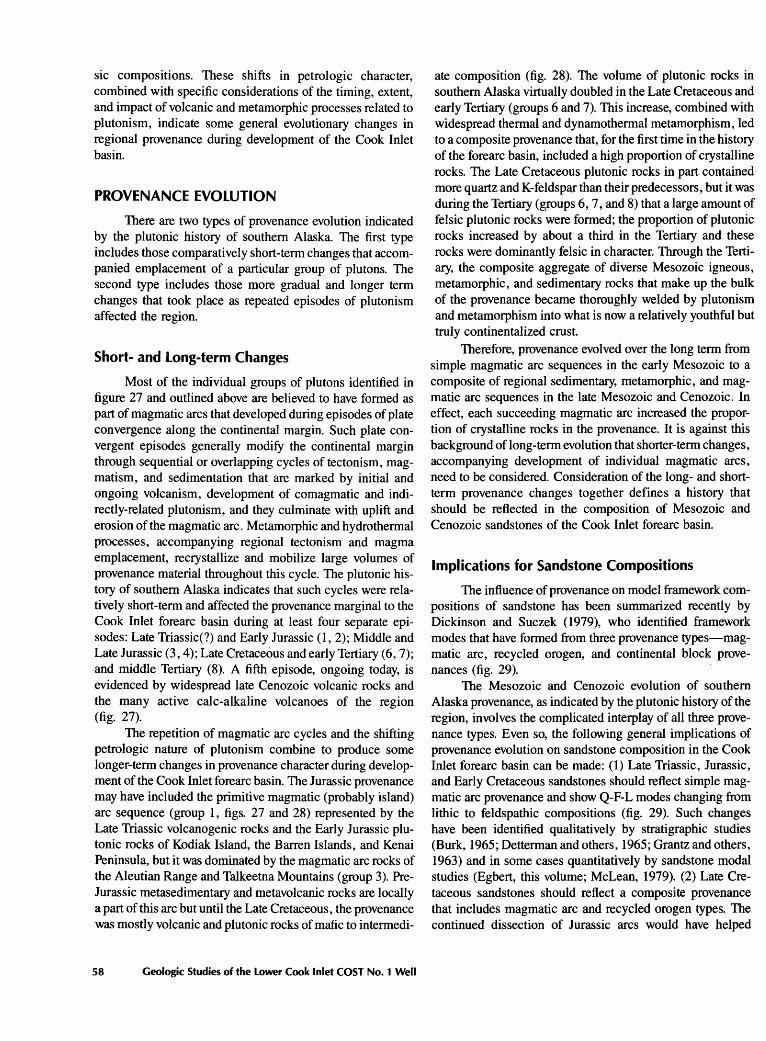
sic compositions. These shifts in petrologic character, combined with specific considerations of the timing, extent, and impact of volcanic and metamorphic processes related to plutonism, indicate some general evolutionary changes in regional provenance during development of the Cook Inlet basin.
PROVENANCE EVOLUTION
There are two types of provenance evolution indicated by the plutonic history of southern Alaska. The first type includes those comparatively short-term changes that accompanied emplacement of a particular group of plutons. The second type includes those more gradual and longer term changes that took place as repeated episodes of plutonism affected the region.
Short- and Long-term Changes
Most of the individual groups of plutons identified in figure 27 and outlined above are believed to have formed as part of magmatic arcs that developed during episodes of plate convergence along the continental margin. Such plate convergent episodes generally modify the continental margin through sequential or overlapping cycles of tectonism, magmatism, and sedimentation that are marked by initial and ongoing volcanism, development of comagmatic and indirectly-related plutonism, and they culminate with uplift and erosion of the magmatic arc. Metamorphic and hydrothermal processes, accompanying regional tectonism and magma emplacement, recrystallize and mobilize large volumes of provenance material throughout this cycle. The plutonic history of southern Alaska indicates that such cycles were relatively short-term and affected the provenance marginal to the Cook Inlet forearc basin during at least four separate episodes: Late Triassic(?) and Early Jurassic (1, 2); Middle and Late Jurassic (3, 4); Late Cretaceous and early Tertiary (6, 7); and middle Tertiary (8). A fifth episode, ongoing today, is evidenced by widespread late Cenozoic volcanic rocks and the many active calc-alkaline volcanoes of the region (fig. 27).
The repetition of magmatic arc cycles and the shifting petrologic nature of plutonism combine to produce some longer-term changes in provenance character during development of the Cook Inlet forearc basin. The Jurassic provenance may have included the primitive magmatic (probably island) arc sequence (group 1, figs. 27 and 28) represented by the Late Triassic volcanogenic rocks and the Early Jurassic plutonic rocks of Kodiak Island, the Barren Islands, and Kenai Peninsula, but it was dominated by the magmatic arc rocks of the Aleutian Range and Talkeetna Mountains (group 3 ). PreJurassic metasedimentary and metavolcanic rocks are locally a part of this arc but until the Late Cretaceous, the provenance was mostly volcanic and plutonic rocks of mafic to intermedi-
58 Geologic Studies of the Lower Cook Inlet COST No. 1 Well
ate composition (fig. 28). The volume of plutonic rocks in southern Alaska virtually doubled in the Late Cretaceous and early Tertiary (groups 6 and 7). This increase, combined with widespread thermal and dynamothermal metamorphism, led to a composite provenance that, for the first time in the history of the forearc basin, included a high proportion of crystalline rocks. The Late Cretaceous plutonic rocks in part contained more quartz and K-feldspar than their predecessors, but it was during the Tertiary (groups 6, 7, and 8) that a large amount of felsic plutonic rocks were formed; the proportion of plutonic rocks increased by about a third in the Tertiary and these rocks were dominantly felsic in character. Through the Tertiary, the composite aggregate of diverse Mesozoic igneous, metamorphic, and sedimentary rocks that make up the bulk of the provenance became thoroughly welded by plutonism and metamorphism into what is now a relatively youthful but truly continentalized crust.
Therefore, provenance evolved over the long term from simple magmatic arc sequences in the early Mesozoic to a composite of regional sedimentary, metamorphic, and magmatic arc sequences in the late Mesozoic and Cenozoic. In effect, each succeeding magmatic arc increased the proportion of crystalline rocks in the provenance. It is against this background of long-term evolution that shorter-term changes, accompanying development of individual magmatic arcs, need to be considered. Consideration of the long- and shortterm provenance changes together defines a history that should be reflected in the composition of Mesozoic and Cenozoic sandstones of the Cook Inlet forearc basin.
Implications for Sandstone Compositions
The influence of provenance on model framework compositions of sandstone has been summarized recently by Dickinson and Suczek (1979), who identified framework modes that have formed from three provenance types-magmatic arc, recycled orogen, and continental block provenances (fig. 29).
The Mesozoic and Cenozoic evolution of southern Alaska provenance, as indicated by the plutonic history of the region, involves the complicated interplay of all three provenance types. Even so, the following general implications of provenance evolution on sandstone composition in the Cook Inlet forearc basin can be made: (1) Late Triassic, Jurassic, and Early Cretaceous sandstones should reflect simple magmatic arc provenance and show Q-F-L modes changing from lithic to feldspathic compositions (fig. 29). Such changes have been identified qualitatively by stratigraphic studies (Burk, 1965; Detterman and others, 1965; Grantz and others, 1963) and in some cases quantitatively by sandstone modal studies (Egbert, this volume; McLean, 1979). (2) Late Cretaceous sandstones should reflect a composite provenance that includes magmatic arc and recycled orogen types. The continued dissection of Jurassic arcs would have helped
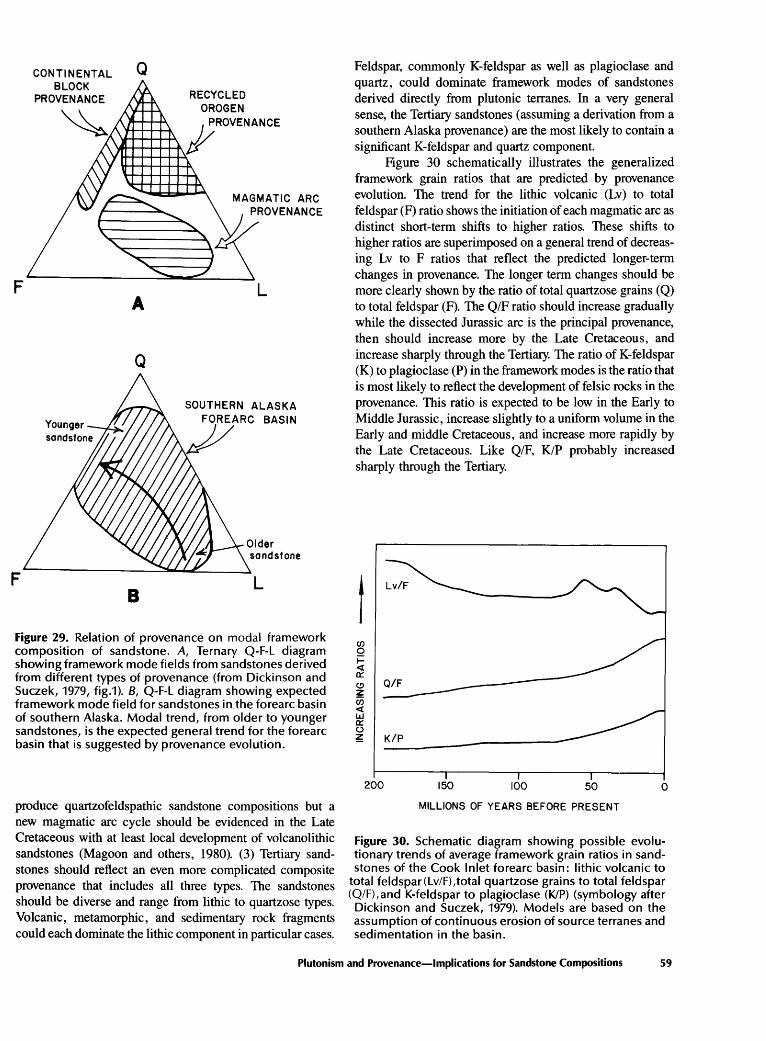
F
F
CONTINENTAL BLOCK
PROVENANCE
~
Q
A
Q
B
MAGMATIC ARC PROVENANCE
L
SOUTHERN ALASKA J/ARC BASIN
Older sandstone
L
Figure 29. Relation of provenance on modal framework composition of sandstone. A, Ternary Q-F-L diagram showing framework mode fields from sandstones derived from different types of provenance (from Dickinson and Suczek, 1979, fig.1). 8, Q-F-L diagram showing expected framework mode field for sandstones in the forearc basin of southern Alaska. Modal trend, from older to younger sandstones, is the expected general trend for the forearc basin that is suggested by provenance evolution.
produce quartzofeldspathic sandstone compositions but a new magmatic arc cycle should be evidenced in the Late Cretaceous with at least local development of volcanolithic sandstones (Magoon and others, 1980). (3) Tertiary sandstones should reflect an even more complicated composite provenance that includes all three types. The sandstones should be diverse and range from lithic to quartzose types. Volcanic, metamorphic, and sedimentary rock fragments could each dominate the lithic component in particular cases.
Feldspar, commonly K-feldspar as well as plagioclase and quartz, could dominate framework modes of sandstones derived directly from plutonic terranes. In a very general sense, the Tertiary sandstones (assuming a derivation from a southern Alaska provenance) are the most likely to contain a significant K-feldspar and quartz component.
Figure 30 schematically illustrates the generalized framework grain ratios that are predicted by provenance evolution. The trend for the lithic volcanic (Lv) to total feldspar (F) ratio shows the initiation of each magmatic arc as distinct short-term shifts to higher ratios. These shifts to higher ratios are superimposed on a general trend of decreasing Lv to F ratios that reflect the predicted longer-term changes in provenance. The longer term changes should be more clearly shown by the ratio of total quartzose grains (Q) to total feldspar (F). The Q/F ratio should increase gradually while the dissected Jurassic arc is the principal provenance, then should increase more by the Late Cretaceous, and increase sharply through the Tertiary. The ratio of K-feldspar (K) to plagioclase (P) in the framework modes is the ratio that is most likely to reflect the development of felsic rocks in the provenance. This ratio is expected to be low in the Early to Middle Jurassic, increase slightly to a uniform volume in the Early and middle Cretaceous, and increase more rapidly by the Late Cretaceous. Like Q/F, KIP probably increased sharply through the Tertiary.
t (/) 0 f= .q: 0:: (!) z (ij <t L&.J 0::: ()
~ ~K/~P--------------------
200 150 100 50
MILLIONS OF YEARS BEFORE PRESENT
0
Figure 30. Schematic diagram showing possible evolutionary trends of average framework grain ratios in sandstones of the Cook Inlet forearc basin: lithic volcanic to
total feldspar(Lv/F),total quartzose grains to total feldspar ( Q/F), and K-feldspar to plagioclase (KIP) (symbology after
Dickinson and Suczek, 1979). Models are based on the assumption of continuous erosion of source terranes and sedimentation in the basin.
Plutonism and Provenance-Implications for Sandstone Compositions 59
CONCLUSION
The Mesozoic and Cenozoic plutonic history of southem Alaska provides insight into the provenance evolution for the forearc basin that includes Cook Inlet. This plutonic history indicates that provenance evolved from simple magmatic arc sequences in the Early Mesozoic to a complicated composite that includes magmatic arc, recycled orogen, and continental block provenance types in the late Cenozoic. Provenance with continental block characteristics is not widespread adjacent to Cook Inlet; it is mostly represented by those areas dominated by felsic plutonic rocks-these types of plutonic rocks were primarily emplaced in southern Alaska during the Tertiary.
60 Geologic Studies of the Lower Cook Inlet COST No. 1 Well
Sandstone compositions in the forearc basin can be expected to reflect the changes in provenance and to show an increasing diversity from the early Mesozoic to late Cenozoic. Because all three major provenance types (fig. 29A) have developed in southern Alaska, a complete range of sandstone framework modes is to be expected (fig. 29B). However, the increasing proportion of metamorphic and plutonic rocks during provenance evolution combined with a shift to more felsic compositions in younger plutons suggests that younger sandstones of the Cook Inlet basin are the most likely to have quartzose framework modes. Although younger sandstones are expected to show an increasing diversity of composition, the general evolutionary trends shown in figure 29B are probably developed in the forearc basin.
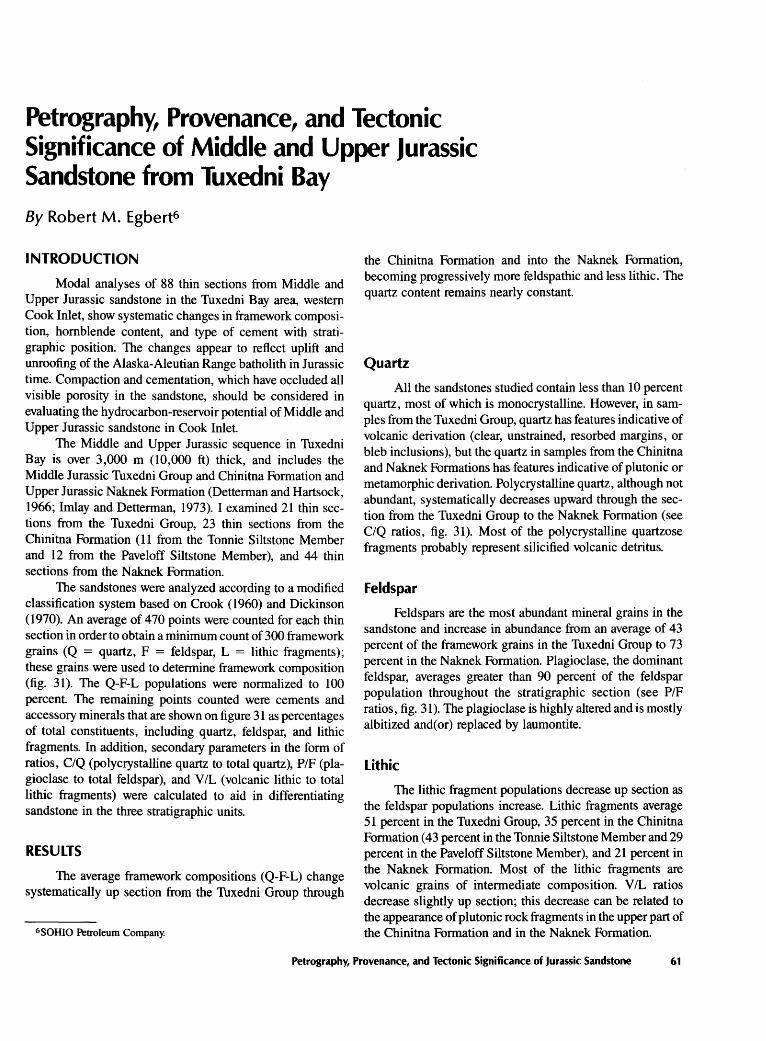
Petrography, Provenance, and Tectonic Significance of Middle and Upper Jurassic Sandstone from Tuxedni Bay By Robert M. Egbert6
INTRODUCTION
Modal analyses of 88 thin sections from Middle and Upper Jurassic sandstone in the Tuxedni Bay area, western ~ook Inlet, show systematic changes in framework composition, hornblende content, and type of cement with stratigraphic position. The changes appear to reflect uplift and unroofing of the Alaska-Aleutian Range batholith in Jurassic time. Compaction and cementation, which have occluded all visible porosity in the sandstone, should be considered in evaluating the hydrocarbon-reservoir potential of Middle and Upper Jurassic sandstone in Cook Inlet.
The Middle and Upper Jurassic sequence in Tuxedni Bay is over 3,000 m (10,000 ft) thick, and includes the Middle Jurassic Tuxedni Group and Chinitna Formation and Upper Jurassic Naknek Formation (Detterman and Hartsock 1966; Imlay and Detterman, 1973). I examined 21 thin sec~ tions from the Tuxedni Group, 23 thin sections from the Chinitna Formation (11 from the Tonnie Siltstone Member and 12 from the Paveloff Siltstone Member), and 44 thin sections from the Naknek Formation.
The sandstones were analyzed according to a modified classification system based on Crook (1960) and Dickinson (1970). An average of 4 70 points were counted for each thin section in order to obtain a minimum count of 300 framework grains <q = quartz, F = feldspar, L = lithic fragments); these grams were used to determine framework composition (fig. 31). The Q-F-L populations were normalized to 100 percent. The remaining points counted were cements and accessory minerals that are shown on figure 31 as percentages of total constituents, including quartz, feldspar, and lithic fragments. In addition, secondary parameters in the form of r~tios, C/Q (polycrystalline quartz to total quartz), P/F (plagiOclase to total feldspar), and V/L (volcanic lithic to total lithic frag~ents) were calculated to aid in differentiating sandstone m the three stratigraphic units.
RESULTS
The average framework compositions (Q-F-L) change systematically up section from the Tuxedni Group through
6 SOHIO Petroleum Company.
the Chinitna Formation and into the Naknek Formation becoming progressively more feldspathic and less lithic. Th; quartz content remains nearly constant.
Quartz
All the sandstones studied contain less than 10 percent quartz, most of which is monocrystalline. However, in samples from the Tuxedni Group, quartz has features indicative of volcanic derivation (clear, unstrained, resorbed margins, or bleb inclusions), but the quartz in samples from the Chinitna and Naknek Formations has features indicative of plutonic or metamorphic derivation. Poly crystalline quartz, although not abundant, systematically decreases upward through the section from the Tuxedni Group to the Naknek Formation (see C/Q ratios, fig. 31). Most of the polycrystalline quartzose fragments probably represent silicified volcanic detritus.
Feldspar
Feldspars are the most abundant mineral grains in the sandstone and increase in abundance from an average of 43 percent of the framework grains in the Tuxedni Group to 73 percent in the Naknek Formation. Plagioclase, the dominant feldspar, averages greater than 90 percent of the feldspar population throughout the stratigraphic section (see P/F ratios, fig. 31 ). The plagioclase is highly altered and is mostly albitized and(or) replaced by laumontite.
Lithic
The lithic fragment populations decrease up section as the feldspar populations increase. Lithic fragments average 51 percent in the Tuxedni Group, 35 percent in the Chinitna Formation ( 43 percent in the Tonnie Siltstone Member and 29 percent in the Paveloff Siltstone Member), and 21 percent in the Naknek Formation. Most of the lithic fragments are volcanic grains of intermediate composition. V /L ratios decrease slightly up section; this decrease can be related to the appearance of plutonic rock fragments in the upper part of the Chinitna Formation and in the Naknek Formation.
Petrography, Provenance, and Tectonic Significance of Jurassic Sandstone 61
Q
t
F L F L
Q Compositon Naknek Formation
(N 44)
Q 6 F 73 L 20
C/Q .06 P/F .96 V/L .84
Hornblende (%) 11
Chlorite (%) 4 Laumontite
F L (%) 10
F
TUXEDNI GROUP
Q
t
Chinitna Formation Paveloff Tonnie Sts. Mbr. Sts. Mbr.
(N 12) (N 11)
5 4 66 53 29 43
.11 .12
.96 .96
.93 .90
7 0
11 12 5
L
Tuxedni Grou,E
(N 21)
6 43 51
.27
.92
.96
0
17 2
Figure 31. Q-F-l ternary diagrams and compositional data of sandstone from Tuxedni Bay. Sandstone classification after Crook (1960) and Dickinson (1970). N, number of thin sections; Q, quartz; F, feldspar; and l, lithic fragments; C, polycrystalline quartz; P, plagioclase; V, volcanic lithic fragments.
Accessory Minerals
Accessory minerals include: hornblende, epidote, biotite, and opaque minerals. Hornblende, which is absent or present in only trace amounts in samples from the Tuxedni Group and Tonnie Siltstone Member of the Chinitna Formation, is the dominant accessory mineral in the Paveloff Siltstone Member of the Chinitna Formation and in the Naknek Formation, averaging 7 and 11 percent respectively.
lntergranular Spaces
Three types of cement, chlorite, laumontite, and calcite, fill intergranular spaces in the sandstones. Chlorite is ubiquitous in the Tuxedni Group and in the lower part of the Chinitna Formation, apparently forming from the chemical breakdown of the abundant volcanic rock fragments. Laumontite is a common cement in the upper part of the Chinitna Formation and is the dominant cement in the Naknek Formation; laumontite probably formed in response to chemical alteration of plagioclase that is abundant in these units. Sampling was biased towards noncalcareous sandstone in order to obtain accurate modal analyses because calcite can replace
62 Geologic Studies of the Lower Cook Inlet COST No. 1 Well
framework grains. However, though calcite-cemented sandstone was found in all units, it was not common. No porosity was observed in any of the sandstone. Initial pore space has been totally occluded by compaction and deformation of volcanic lithic grains, and by chlorite, laumontite, and calcite cements.
DISCUSSION
Sandstone of the Tuxedni Group was derived largely from a volcanic terrane as indicated by the high percentages of volcanic lithic grains and volcanic quartz. Several important changes in sandstone composition occur between the two members of the Chinitna Formation. The Tonnie Siltstone Member is volcanic-lithic rich, is virtually devoid of hornblende, and has chlorite as the dominant cement, whereas the overlying Paveloff Siltstone Member is much more feldspathic (less lithic rich), contains an average of 7 percent hornblende, and has laumontite as a common cement in addition to chlorite (fig. 31 ). These differences indicate a change from a dominantly volcanic source for the Tonnie Siltstone Member to a mixed volcanic/plutonic provenance
for the Pavel off Siltstone Member. Sandstone of the Naknek Formation was derived mainly from a plutonic source, as indicated by the high percentages of feldspar and hornblende.
The composition of sandstone from the Tuxedni Group and Chinitna and Naknek Formations is directly related to Jurassic tectonic events in south-central Alaska. During the Early Jurassic, 1,800 to 2,700 m (6,000-9,000 ft) of volcanic and volcaniclastic rocks (Talkeetna Formation) accumulated in the area of the present-day Alaska-Aleutian Range forming a volcanic arc at least 800 km (500 mi) long (Detterman and Hartsock, 1966; Reed and Lanphere, 1973a). During the Middle to Late Jurassic, gabbro to granite but mostly quartz diorite, and tonalite to granodiorite of the Alaska-Aleutian Range batholith intruded the Early Jurassic volcanic arch sequence and older rocks (Detterman and others, 1965; Hudson, this volume). Uplift and erosion of the ancestral Aleutian Range in the Middle Jurassic shed volcanic detritus into the
adjacent Cook Inlet forearc basin-the deposits represented by the Tuxedni Group. Continued uplift and erosion of the Aleutian Range in the late Middle Jurassic partially unroofed the Alaska-Aleutian Range batholith, and both volcanic and plutonic detritus was being deposited in the adjacent basin; these deposits are represented by the Chinitna Formation. By Late Jurassic time, when rocks ofthe Naknek Formation were being deposited, the Alaska-Aleutian Range batholith was mostly unroofed, thereby supplying dominantly plutonic detritus to the Cook Inlet basin. These conclusions are consistent with previous detailed work by Detterman and Reed (1980). They base their conclusions mainly on comparison of age and composition of conglomerate clasts in the Naknek Formation to underlying units. I suggest, however, that the Alaska-Aleutian Range batholith was unroofed earlier-during the deposition of the Paveloff Siltstone Member of the Chinitna Formation.
Petrography, Provenance, and Tectonic Significance of Jurassic Sandstone 63

Framework Geology and Sandstone Composition
By Leslie B. Magoon and Robert M. Egbert7
INTRODUCTION
. The purpose of this paper is to review the stratigraphic history and tectonic evolution of the Cook Inlet forearc basin in order to understand the evolution of the sandstone composition so that potential hydrocarbon reservoirs can be predicted.
The tectonic evolution of the Cook Inlet -Shelikof Strait area and adjacent areas is complex because the areas are a part of the northern Pacific margin that has been the site of continuous convergence throughout the Mesozoic and Cenozoic eras. The Cook Inlet forearc basin is bounded on the northwest by the Alaska-Aleutian Range and the Talkeetna Mountains and on the southeast by Kodiak Island and a~jacent islands, the Barren Islands, and the Chugach Mountams. The main discussion will focus on the rock units and tectonic elements of the Cook Inlet-Shelikof Strait area which includes the Alaska Peninsula from Puale Bay north: east to the Matanuska Valley (fig. 32). If pertinent, rock units and tectonic elements adjacent to this area also will be discussed.
The stratigraphic and structural history of each rock unit will be summarized; all the available information on s_andstone composition will be summarized; and the implications of sandstone composition and provenance in relation to the tectonic evolution and development of a hydrocarbon ~servoir will be discussed. The parallel change in composit10n of the plutonic bodies of southern Alaska (Hudson, this volume) to that of the sandstones of the Cook Inlet forearc basin, and in some instances, to that of the sandstones of the accreted terranes, will be demonstrated.
The stratigraphic history will include discussions on: the early Mesozoic geologic framework of the Cook Inlet forearc basin northwest of the Border Ranges fault, the Mesozoic and Cenozoic accreted terranes southeast of the Border Ranges fault, and the Mesozoic Peninsular terrane within the Cook Inlet forearc basin that overlaps the Border Ranges fault. Information from the lower Cook Inlet COST No. 1 well, as well as other wells, measured sections, and plutonic bodies, is incorporated in this discussion.
The compositions of the sandstones in the Cook Inlet forearc basin have an important bearing on the development
7 SOHIO Petroleum Company.
of hydrocarbon reservoirs in the Cook Inlet-Shelikof Strait area. New data and data from many other sources, modal analyses, and petrographic descriptions of approximately 700 sandstone samples from the Cook Inlet-Shelikof Strait and adjacent areas, are included here. The petrographic data are summarized in figure 33 and in tables 16 and 17.
Dickinson's (1970) classification is used for the sandstone, and his classification with modifications from Crook (1960) is used for subquartzose sandstone. If the published data did not conform to the conventions of Dickinson (1970), the data was recalculated and this is noted in tables 16 and 17.
The sandstones are classified using three primary grain parameters: Q (quartz), F (feldspar), and L (lithic fragments). To further differentiate the sandstones, secondary parameters in the form of ratios, C/Q (polycrystalline quartz to total quartz), P/F (plagioclase to total feldspar), and V/L (volcanic lithic to total unstable lithic fragments) are listed in tables 16 and 17 and discussed in the text. New point-count data and the published point -count data of Egbert and Magoon (1981) were made by counting at least 300 framework grains (quartz, feldspar, and lithic fragments) following the method of Dickinson (1970). All the sandstone from the Cook InletShelikof Strait and adjacent areas is subquartzose (Q<75) and is classified using the following system: feldspathic (F/ L>3), lithofeldspathic (3>F/L> 1), feldspatholithic (3>L/ F> 1), and lithic (L/F>3).
By applying the techniques of Dickinson and Suczek (1979), the compositions of the sandstones in the forearc basin are related to those of the plutonic bodies and of the accreted terranes, thus two provenance terranes, a magmatic arc and a recycled orogen, are identified in the Cook InletShelikof Strait area from the Q-F-L (quartz-feldspar-lithic) ternary diagrams.
GEOLOGIC FRAMEWORK
Rocks of the Cook Inlet -Shelikof Strait are part of a belt of Mesozoic and Cenozoic sedimentary rocks that extend northeastward to the Matanuska Valley and southwestward along the Alaska Peninsula and Shelikof Strait (figs. 32, 34, 35). Four major northeast -trending geologic features flank the Cook Inlet-Shelikof Strait area; the Alaska-Aleutian Range batholith and the Bruin Bay and Castle Mountain faults are on
Framework Geology and Sandstone Composition 65
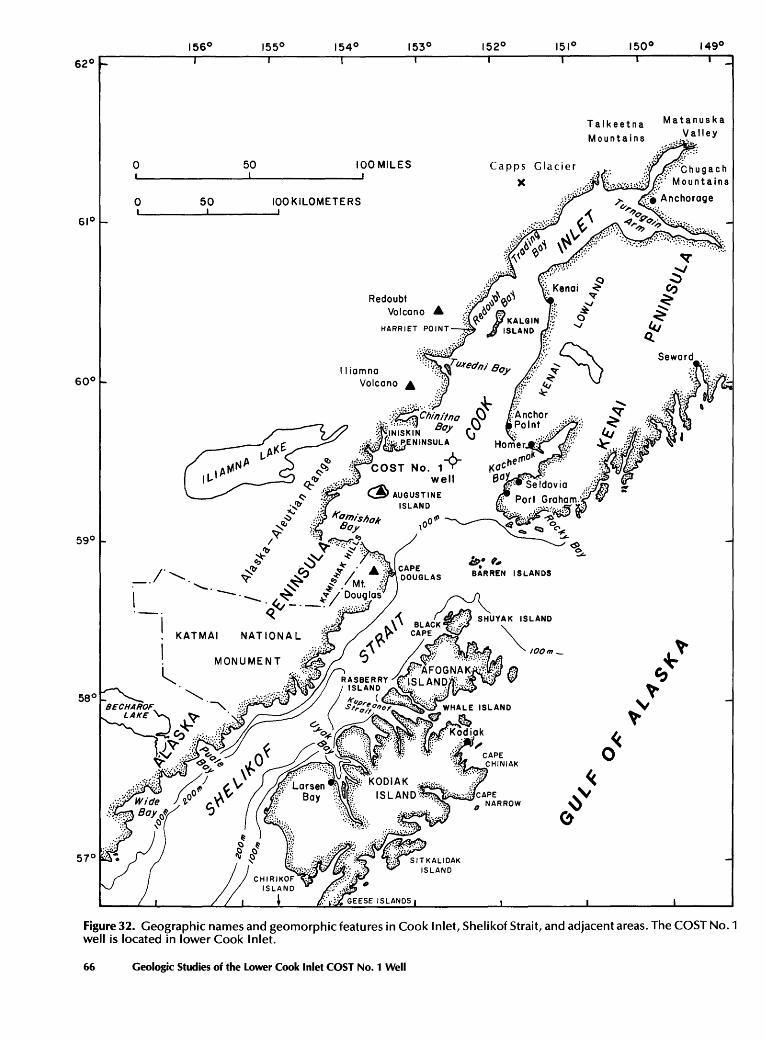
0
0 50
I KATMAI
50 100 MILES
100 KILOMETERS
NATIONAL
Redoubt Volcano A
Iliamna Volcano
I MONUMENT
~
Capps Glacier
)(
J!J,: ,, BARREN ISLANDS
Talkeetna
Mountains
Figure 32. Geographic names and geomorphic features in Cook Inlet, Shelikof Strait, and adjacent areas. The COST No.1 well is located in lower Cook Inlet.
66 Geologic Studies of the Lower Cook Inlet COST No. 1 Well
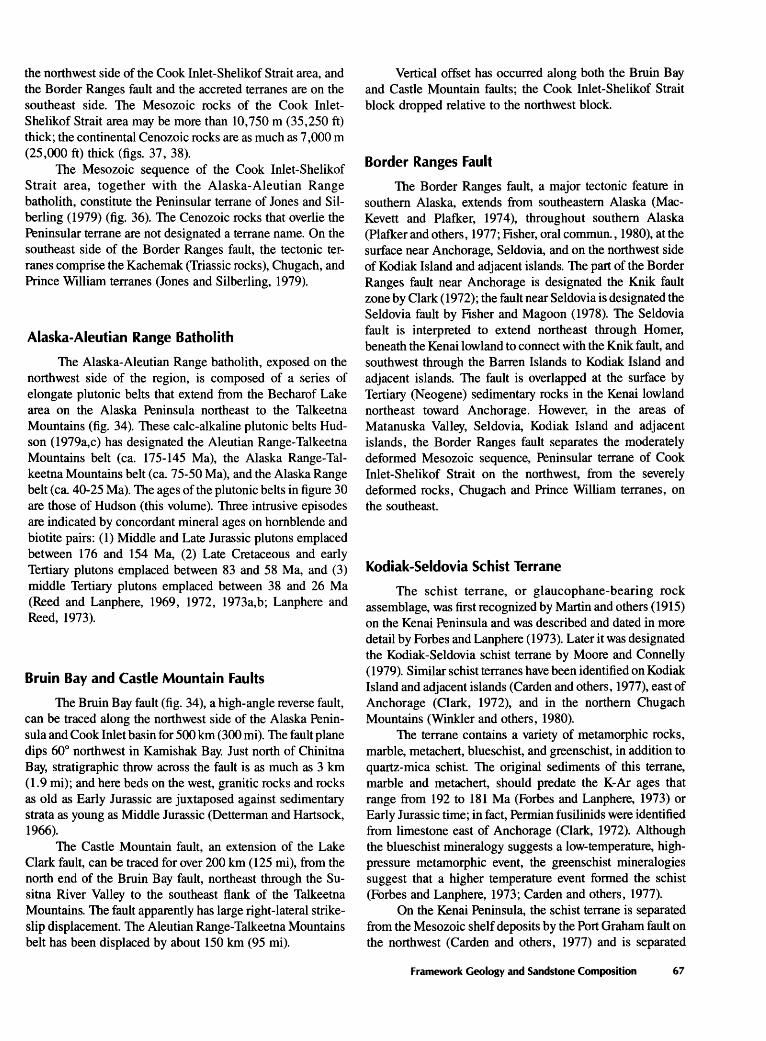
the northwest side of the Cook Inlet-Shelikof Strait area, and the Border Ranges fault and the accreted terranes are on the southeast side. The Mesozoic rocks of the Cook InletShelikof Strait area may be more than 10,750 m (35,250 ft) thick; the continental Cenozoic rocks are as much as 7,000 m (25 ,000 ft) thick (figs. 37, 38).
The Mesozoic sequence of the Cook Inlet-Shelikof Strait area, together with the Alaska-Aleutian Range batholith, constitute the Peninsular terrane of Jones and Silberling (1979) (fig. 36). The Cenozoic rocks that overlie the Peninsular terrane are not designated a terrane name. On the southeast side of the Border Ranges fault, the tectonic terranes comprise the Kachemak (Triassic rocks), Chugach, and Prince William terranes (Jones and Silberling, 1979).
Alaska-Aleutian Range Batholith
The Alaska-Aleutian Range batholith, exposed on the northwest side of the region, is composed of a series of elongate plutonic belts that extend from the Becharof Lake area on the Alaska Peninsula northeast to the Talkeetna Mountains (fig. 34 ). These calc-alkaline plutonic belts Hudson (1979a,c) has designated the Aleutian Range-Talkeetna Mountains belt (ca. 175-145 Ma), the Alaska Range-Talkeetna Mountains belt (ca. 75-50 Ma), and the Alaska Range belt (ca. 40-25 Ma). The ages of the plutonic belts in figure 30 are those of Hudson (this volume). Three intrusive episodes are indicated by concordant mineral ages on hornblende and biotite pairs: (1) Middle and Late Jurassic plutons emplaced between 176 and 154 Ma, (2) Late Cretaceous and early Tertiary plutons emplaced between 83 and 58 Ma, and (3) middle Tertiary plutons emplaced between 38 and 26 Ma (Reed and Lanphere, 1969, 1972, 1973a,b; Lanphere and Reed, 1973).
Bruin Bay and Castle Mountain Faults
The Bruin Bay fault (fig. 34), a high-angle reverse fault, can be traced along the northwest side of the Alaska Peninsula and Cook Inlet basin for 500 km (300 mi). The fault plane dips 60° northwest in Kamishak Bay. Just north of Chinitna Bay, stratigraphic throw across the fault is as much as 3 km (1.9 mi); and here beds on the west, granitic rocks and rocks as old as Early Jurassic are juxtaposed against sedimentary strata as young as Middle Jurassic (Detterman and Hartsock, 1966).
The Castle Mountain fault, an extension of the Lake Clark fault, can be traced for over 200 km (125 mi), from the north end of the Bruin Bay fault, northeast through the Susitna River Valley to the southeast flank of the Talkeetna Mountains. The fault apparently has large right-lateral strikeslip displacement. The Aleutian Range-Talkeetna Mountains belt has been displaced by about 150 km (95 mi).
Vertical offset has occurred along both the Bruin Bay and Castle Mountain faults; the Cook Inlet-Shelikof Strait block dropped relative to the northwest block.
Border Ranges Fault
The Border Ranges fault, a major tectonic feature in southern Alaska, extends from southeastern Alaska (MacKevett and Plafker, 1974), throughout southern Alaska (Plafker and others, 1977; Fisher, oral commun., 1980), at the surface near Anchorage, Seldovia, and on the northwest side of Kodiak Island and adjacent islands. The part of the Border Ranges fault near Anchorage is designated the Knik fault zone by Clark (1972); the fault near Seldovia is designated the Seldovia fault by Fisher and Magoon (1978). The Seldovia fault is interpreted to extend northeast through Homer, beneath the Kenai lowland to connect with the Knik fault, and southwest through the Barren Islands to Kodiak Island and adjacent islands. The fault is overlapped at the surface by Tertiary (Neogene) sedimentary rocks in the Kenai lowland northeast toward Anchorage. However, in the areas of Matanuska Valley, Seldovia, Kodiak Island and adjacent islands, the Border Ranges fault separates the moderately deformed Mesozoic sequence, Peninsular terrane of Cook Inlet-Shelikof Strait on the northwest, from the severely deformed rocks, Chugach and Prince William terranes, on the southeast.
Kodiak-Seldovia Schist Terrane
The schist terrane, or glaucophane-bearing rock assemblage, was first recognized by Martin and others (1915) on the Kenai Peninsula and was described and dated in more detail by Forbes and Lanphere (1973). Later it was designated the Kodiak-Seldovia schist terrane by Moore and Connelly (1979). Similar schist terranes have been identified on Kodiak Island and adjacent islands (Carden and others, 1977), east of Anchorage (Clark, 1972), and in the northern Chugach Mountains (Winkler and others, 1980).
The terrane contains a variety of metamorphic rocks, marble, metachert, blueschist, and greenschist, in addition to quartz-mica schist. The original sediments of this terrane, marble and metachert, should predate the K-Ar ages that range from 192 to 181 Ma (Forbes and Lanphere, 1973) or Early Jurassic time; in fact, Permian fusilinids were identified from limestone east of Anchorage (Clark, 1972). Although the blueschist mineralogy suggests a low-temperature, highpressure metamorphic event, the greenschist mineralogies suggest that a higher temperature event formed the schist (Forbes and Lanphere, 1973; Carden and others, 1977).
On the Kenai Peninsula, the schist terrane is separated from the Mesozoic shelf deposits by the Port Graham fault on the northwest (Carden and others, 1977) and is separated
Framework Geology and Sandstone Composition 67
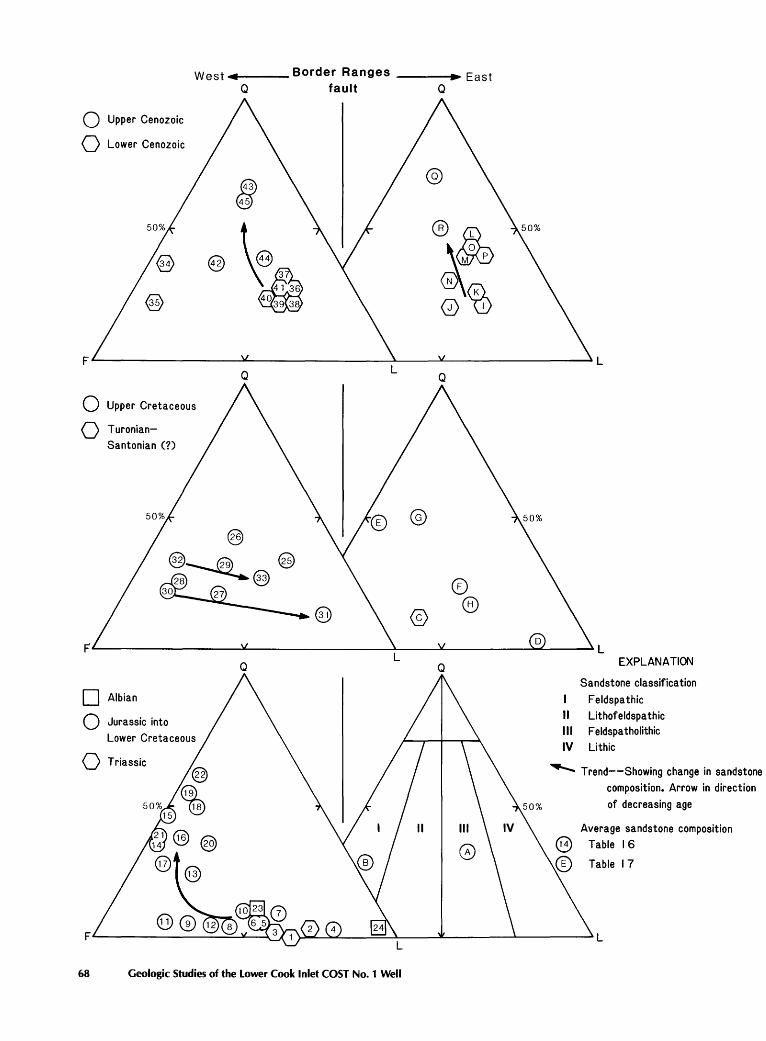
West .,.4.,._ ___ Border Ranges -----t.,• East
0 Upper Cenozoic
0 Lower Cenozoic
0 Upper Cretaceous
0 Turonian
Santonian (?)
0 Albian
0 Jurassic into
0 Triassic
Q fault
Q L
Q
68 Geologic Studies of the Lower Cook Inlet COST No. 1 Well
@
@
Q
Q
Q
® ®
EXPLANATION
Sandstone classification
I F eldspa thic
II Lithofeldspa thic
Ill F eldspa tho lithic
IV Lithic
~ Trend--Showing change in sandstone
composition. Arrow in direction
of decreasing age
Average sandstone composition
Table 16
Table 17
from the Kachemak (Triassic rocks) and Chugach terranes by the Border Ranges fault on the southeast (Plafker and others, 1977). In the northern Chugach Mountains, the schist terrane has been, in part, tectonically incorporated into the McHugh Complex (Winkler and others, 1980). On Kodiak Island and adjacent islands, the schist terrane is bounded on the east by the Border Ranges fault and on the west by the Kodiak-Kenai plutonic belt.
Kodiak-Kenai Plutonic Belt
The Kodiak-Kenai plutonic belt, ca. 195-185 Ma, (Hudson, 1979b; fig. 27, this volume) extends from the Seldovia area southwest to Kodiak Island; it includes the Afognak pluton (Hill and Morris, 1977). The K-Ar age of the plutonic body on the Barren Islands is 187 Ma (Cowan and Boss, 1978); and on Kodiak Island and adjacent islands the age ranges from 193 to 184 Ma (Carden and others, 1977).
The structural relation of the Kodiak-Kenai plutonic belt to the Kodiak-Seldovia schist terrane is unclear. In the Seldovia area the rock units are geographically separated (Carden and others, 1977). The similarity in K-Ar age and close geographic proximity of the pluton to the schist terrane leads Carden and others ( 1977) to infer that emplacement of the pluton did not create the schist, but the two rock units "experience(d) a similar crystallization and cooling history". The pluton is in intrusive contact with the Mesozoic shelf rocks on Kodiak and the Barren Islands (Carden and others, 1977; Cowan and Boss, 1978; Connelly and Moore, 1979).
ACCRETED TERRANES
The severely deformed Mesozoic and Cenozoic rocks southeast of the Border Ranges fault can be subdivided into two fault-bounded terranes (Jones and Silberling, 1979; Jones and others, 1984 )-the Chugach terrane, and the Prince William terrane (fig. 36).
Chugach Terrane
The Chugach terrane (Berg and others, 1972) lies southeast of the Border Ranges fault (fig. 36). It consists of
Figure 33. Q-F-L ternary diagrams for sandstones from Upper Triassic through upper Cenozoic rocks of the Cook Inlet forearc basin northwest of the Border Ranges fault and of the accreted terranes southeast of the fault. Average Q-FL values are plotted; numbers and letters refer to samples listed in tables 16 and 17.
the Triassic rocks and the melange and flysch sequences. The melange consists of the McHugh and Uyak Complexes and the deformed flysch sequences consist of the Cape Current terrane, the Valdez Group, and the Kodiak and Shumagin Formations.
Triassic Rocks
The chert and ellipsoidal lavas that are mapped east of the Border Ranges fault and along the south shore of Kachemak Bay (Martin and others, 1915, pl. III; Magoon and others, 1976b) constitute the Triassic rocks (fig. 36). A Triassic age has been assigned to the rocks on the basis of the stratigraphic relations of the nearby units (Martin and others, 1915, p. 61) and on the paleontologic evidence. A radiolarian assemblage, recovered from chert on Yukon Island in Kachemak Bay by E. A. Pessagno in 1975, was assigned a Late Triassic age (Jones and others, 1977, p. 2572). This chert unit was found to be in thrust-fault contact with the McHugh Complex by J. S. Kelley (Magoon and others, 1976b). Other workers have included the Triassic rocks in the Seldovia Bay Complex (Cowan and Boss, 1978) or in the McHugh Complex (Plafker and others, 1977).
McHugh and Uyak Complexes
The McHugh and Uyak Complexes consist of metasedimentary and metavolcanic rocks in the Chugach Mountains near Anchorage (Clark, 1972, 1973), on the Kenai Peninsula (Kelley, 1977b), and on the northwest part of Kodiak Island and adjacent islands (Connelly, 1978; Connelly and Moore, 1979) (fig. 34).
Quantitative modal analyses of sandstone are limited for the McHugh Complex. Clardy (1974) described one sample from the McHugh east of Anchorage as having a modal composition of Q33F25L42. Nineteen sandstone samples from the Uyak Complex on the Kodiak Island and adjacent islands have an average modal composition of Q29F61L10 (Connelly, 1978). Plagioclase to total feldspar ratios (P/F), which range from 1.0 to 0.91, indicate that nearly all the feldspar is plagioclase. The very high ratios of volcanic lithic to total lithic fragments (V /L) indicate a volcanic source terrane.
Quartz from both the McHugh and Uyak Complexes is present in moderate amounts. Polycrystalline to total quartz ratios (C/Q) are low, therefore most of the quartz is monocrystalline. Connelly (1978) concluded that the monocrystalline quartz was mainly of volcanic derivation. However, Connelly (1978) described several samples of "chert-clast wackes" from the Uyak Complex as having high polycrystalline quartz to total quartz ratios.
Framework Geology and Sandstone Composition 69
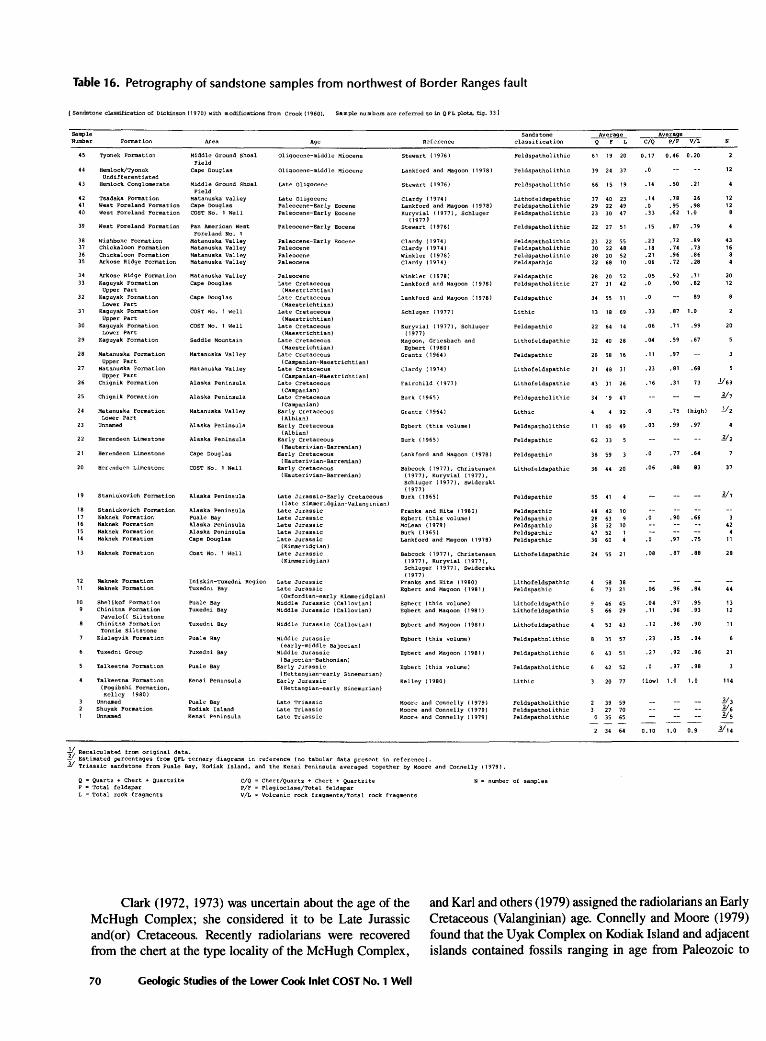
Table 16. Petrography of sandstone samples from northwest of Border Ranges fault
[Sandstone classification of Dickinson (1970) with modifications from Crook (1960). Sample numbers are referred to in QFL plots, fig. 33 J
Sample Number Formation
45 Tyonek Formation
4 4 Hemlock/Tyonek Undifferentiated
43 Hemlock Conglomerate
Area
Middle Ground Shoal Field
Cape Douglas
Middle Ground Shoal Field
42 Tsadaka Formation Matanus'ka Valley 41 West Foreland Formation Cape Douglas 40 West Foreland Formation COST No. 1 Well
39 West Foreland Formation Pan American West
38 Wishbone Formation 37 Chickaloon Formation 36 Chickaloon Form.at.ion 35 Arkose Ridge Formation
34 Arkose Ridge Formation 33 Kaguyak Formation
Upper Part 32 Kaguyak Formation
Lower Part 31 Kaguyak Formation
Upper Part 30 Kaguyak Formation
Lower Part 29 Kaguyak Formation
28 Matanuska Formation Upper Part
27 Matanuska Formation Upper Part
26 Chignik Formation
25 Chignik Formation
24 Matanuska Formation Lower Part
23 Unnamed
22 Herendeen Limestone
21 Herendeen Limestone
20
19
18 17 16 15 14
13
12 11
10
Herendeen Limestone
Staniukovich Formation
Staniukollich Formation Naknek Formation Naknek Formation Naknek Formation Naknek Formation
Naknek Formation
Naknek Formation Naknek Formation
Shel ikof Formation Chinitna Formation
Paveloff Siltstone Chinitna Formation
Tonnie Siltstone Kialagvik Formation
Tuxedni Group
Talkeetna Formation
Talkeetna Fonnation (Pogibshi Formation, Kell8y 1980)
Unnamed Shuyak Formation Unnamed
Foreland No. 1 Matanuska Valley Matanus'ka Valley Matanuska Valley Matanuska Valley
Matanuska Valley Cape Douglas
Cape Douglas
COST No. 1 Well
COST No. 1 llell
Saddle Mounta1n
Matanuska Valley
Matanuska Valley
Alaska Peninsula
Alaska Peninsula
Matanuska Valley
Alaska Peninsula
Alaska Peninsula
Cape Douglas
COST No. 1 Nell
Alaska Peninsula
Alaska Peninsula Puale Bay Alaska Peninsula Alaska Peninsula Cape Douglas
Cost No. 1 llell
Iniskin-Tuxedni Region Tuxedni Bay
Puale Bay Tuxedni Bay
Tuxedni Bay
Puale Bay
Tuxedni Bay
Puale Bay
Kenai Pen1nsula
Pual~ Bay Kodiak Island Kenai Peninsula
Age
Oligocene-middle Miocene
Oligocene-middle Miocene
Late 01 igocene
Late 01 igocen0 Paleocene-Early Eocene Paleocene-Early Eocene
Paleocene-Early Eocene
Paleocene-Early Eocene Paleocene Paleocene Paleocene
Paleocene Late Cretaceous
(Maestrichtian) Late Cretaceous
(Maestrichtian) Late Cretaceous
(Maestrichtian) Late Cretaceous
(Maestrichtian) Late Cretaceous
(Maestrichtian) Late Cretaceous
( Campanian-Maestrichtian) Late Cretaceous
( Campanian-Maestrichtian) Late Cretaceous
(Campanian) Late Cretaceous
(Campanian) Early Cretaceous
(Albian) Early Cretaceous
(Albian) Early Cretaceous
(Hauterivian-Barremian) Early Cretaceous
(Hauterivian-Barremian) Early Cretaceous
(Hauterivian-Barremian)
Late Jurassic-Early Cretaceous (late J<immeridgian-Valang in ian)
Late Jurassic Late Jurassic Late Jurassic Late Jurassic Late Jurassic
(Kimmeridgian) Late Jurassic
(Kimmeridgian)
Late Jurassic Late Jurassic
(Oxfordian-early Kimmeridgian) Middle Jurassic (Callovian) Middle Jurassic (Callovian)
Middle Jurassic (Callovian)
Middle Jurassic (early-middle Bajocian)
Middle Jurassic (Bajocian-Bathonian)
Early Jurassic ( Hettangian-early Sinernurian)
Early Jurassic (Hettangian-early Sinemurian)
Late Triassic Late Triassic Late Triassic
Reference
Stewart ( 19 76 )
Lankford and Magoon ( 1978)
Stewart ( 1976)
Clardy ( 1974) Lankford and Magoon (1978) J<uryvial ( 1977) 1 Schluger
! 1977 I Stewart (1976)
Clardy ( 1974) Clardy ( 1974) Winkler ( 1978) Clardy ( 1974)
Winkler ( 1978) Lankford and Magoon (1978)
Lankford and Magoon ( 1978)
Schluger ( 1977)
Kuryvial ( 1977) 1 Schluger ( 1977)
Magoon, Griesbach and Egbert ( 1980)
Grantz ( 1964)
Clardy ( 1974)
Fairchild ( 1977)
Burk ( 1965)
Grantz (1964)
Egbert (this volume)
Burk (1965)
Lankford and l4agoon ( 1978)
Babcock ( 1977}, Christensen (1977), Kuryvial (1977), Schluger ( 1977), Swiderski ( 1977)
Burk (1965)
Franks and Hite (1980) Egbert (this volume) McLean ( 1979) Burk ( 1965) Lankford and Magoon (1978)
Babcock ( 1977), Christensen (1977), Kuryvial (1977), Schluger ( 1977), Swiderski ( 1977)
Franks and Hite (1980) Egbert and Magoon ( 1981 )
Egbert (this volume) Egbert and Magoon (1981)
Egbert and Magoon ( 1981)
Egbert (this volume)
Egbert and Magoon ( 1981)
Egbert (this volume)
Kelley ( 1980)
Moore and Connelly ( 1 979) Moore and Connelly (1979) Moor~ and Connelly ( 1979)
¥; Recalculated from original data. - Estimated percentages from QFL ternary diagrams in reference (no tabular data present in reference). ]./ Triassic sandstone from Puale Bay, Kodiak Island, and the Kenai Peninsula averaged together by Moore and Connelly ( 1979).
Sandstone classification
Feldspatholithic
Feldspatholi thic
Feldspatholithic
Lithofeldspathic Feldspatholithic Feldspatholithic
Feldspatholithic
Feldspatholithic Feldspatholithic Feldspatholithic Feldspathic
Feldspathic Feldspatholithic
Feldspathic
Lithic
Feldspathic
Li thofeldspathic
Feldspathic
Li thofeldspathic
Li thofe ldspa thic
Feldspatholithic
Lithic
Feldspatholithic
Feldspathic
Feldspathic
Lithofeldspathic
Feldspathic
Feldspathic Feldspathic Feldspathic Feldspathic Feldspathic
Li thofe ldspathic
Lithofeldspathic Feldspathic
Lithofeldspathic Lithofeldspathic
Lithofeldspathic
Feldspatholithic
Feldspatholithic
Feldspatholithic
Lithic
Feldspatholithic Feldspatholithic Feldspatholithic
Q = Quartz + Chert + Quartzite F c •rotal feldspar
C/Q = Chert/Quartz + Chert + Quartzite P/F = Plagioclase/Total feldspar
N = nwnber of samples
L = Total rock fragments V/L = Volcanic rock fragments/Total rock fragments
~.Y-~!9~ ~e~ Q F L C/Q P/F V/L
61 19 20 0.17 0.46 0.20
39 24 37
66 15 19
37 40 23 29 22 49 23 30 47
22 27 51
23 22 55 30 22 48 28 20 52 22 68 10
28 20 52 27 31 42
34 55 11
13 18 69
22 64 14
32 40 28
26 58 16
21 48 31
43 31 26
34 19 47
4 92
11 40 49
62 33
38 59
36 44 20
55 41
48 42 10 28 63 9 38 52 10 47 52 36 60
24 55 21
58 38 73 21
46 45 66 29
53 43
35 57
43 51
42 52
20 77
2 39 59 3 27 70
0 35 65
2 34 64
.0
.14 • 50 .21
.14 • 78 26
.0 .95 .98
.33 .62 1.0
.15 • 87 • 79
.23
.18
.21 • 06
.05 .0
. 72 .89 • 74 • 73 .96 .86 • 72 .28
.92 . 71 • 90 • 82
.0 89
• 33 .87 1.0
12
12 12
8
43 16
8 4
20 12
.06 . 71 .99 20
.04 • 59 . 67
.11 .97
.23 • 81 .68
.16 .31 73 ..!.169
Y1
.o .75 (high) ..!./2
.03 • 99 • 97
.o
.06
.0
.o
.08
.06
.04
.11
.12
• 77 .64
.88
• 90
.97
• 87
• 96
.97
.96
83
.66
• 75
.88
.84
.95
. 93
.96 .90
.23 • 95 • 94
.27 .92 .96
. 0 • 97 .98
(low) 1.0 1.0
0.10 1.0 0.9
37
42
11
28
44
13 12
11
21
114
Clark ( 1972, 1973) was uncertain about the age of the McHugh Complex; she considered it to be Late Jurassic and( or) Cretaceous. Recently radiolarians were recovered from the chert at the type locality of the McHugh Complex,
and Karl and others (1979) assigned the radiolarians an Early Cretaceous (Valanginian) age. Connelly and Moore (1979) found that the Uyak Complex on Kodiak Island and adjacent islands contained fossils ranging in age from Paleozoic to
70 Geologic Studies of the Lower Cook Inlet COST No. 1 Well
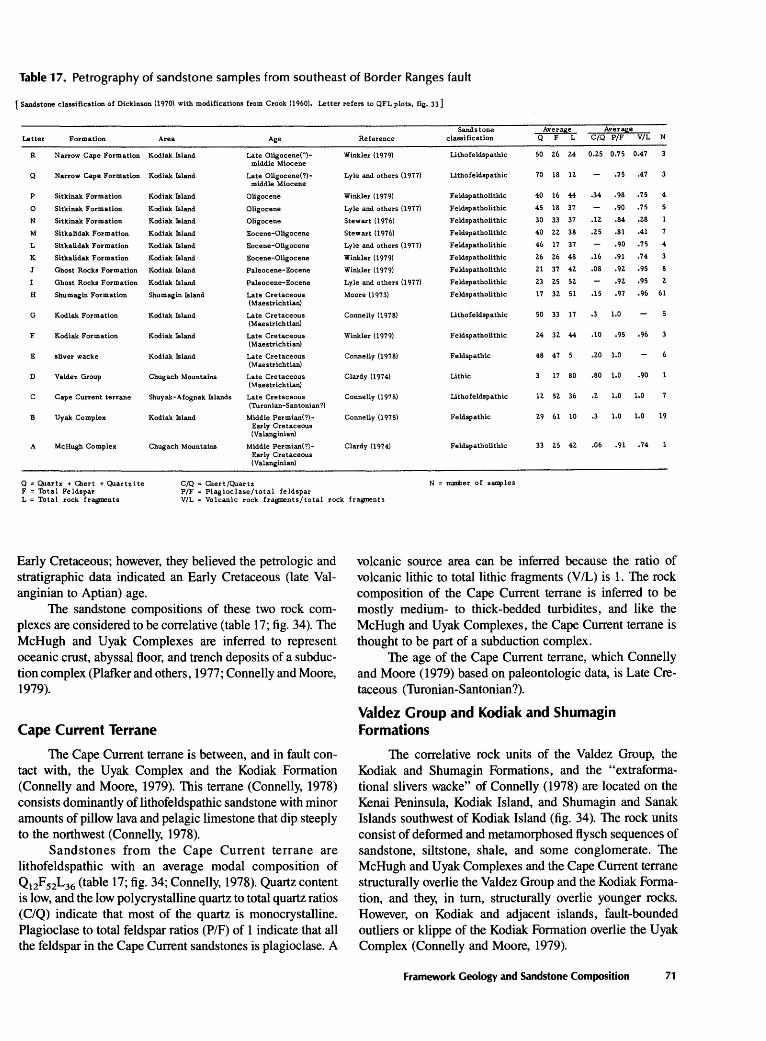
Table 17. Petrography of sandstone samples from southeast of Border Ranges fault
[Sandstone classification of Dickinson (1970) with modifications from Crook (1960), Letter refers to QFL plots, fig. 33]
Sandstone Aver!!S,e Aver!!ie Letter Formation Area Age Reference classification Q F L C/Q P/F V/L N
R Narrow Cape Formation Kodiak Island Late Oligocene(~)- Winkler (1979) Litho feldspathic 50 26 24 0.25 0.75 0.47 middle Miocene
Q Narrow Cape Formation Kodiak Island Late Oligocene(?)- Lyle and others (1977) Lithofeldspathic 70 18 12 .75 .47 middle Miocene
p Sitkinak Formation Kodiak Island Oligocene Winkler (1979) Feldspatholithic 40 16 44 .34 .98 .75 4
0 Sitkinak Formation Kodiak Island Oligocene Lyle and others (1977) Feldspatholithic 45 18 37 .90 .75
N Sitkinak Formation Kodiak Island Oligocene Stew art ( 197 6) Feldspatholithic 30 33 37 .12 .84 .28
M Sitkalidak Formation Kodiak Island Eocene-Oligocene Stewart (1976) Feldspatholithic 40 22 38 .25 .81 .41
L Sitkalidak Formation Kodiak Island Eocene-Oligocene Lyle and others (1977) Feldspatholithic 46 17 37 .90 .75
K Sitkalidak Formation Kodiak Island Eocene-Oligocene Winkler (1979) Feldspatholithic 26 26 48 .16 .91 .74
J Ghost Rocks Formation Kodiak Island Paleocene-Eocene Winkler (1979) Feldspatholithic 21 37 42 .08 .92 .95
Ghost Rocks Formation Kodiak Island Paleocene-Eocene Lyle and others (1977) Feldspatholithic 23 25 52 .92 .95 2
H Shumagin Formation Shumagin Island Late Cretaceous Moore (1973) Feldspatholithic 17 32 51 .15 .97 .96 61 (Maestrichtian)
G Kodiak Formation Kodiak Island Late Cretaceous Connelly (1978) Lithofeldspathic 50 33 17 .3 1.0 (Maestrichtian)
F Kodiak Formation Kodiak Island Late Cretaceous Winkler (1979) Feldspatholithic 24 3Z 44 .10 .95 .96 (Maestrichtian)
E sliver wacke Kodiak Island Late Cretaceous Connelly (1978) Feldspathic 48 47 5 .20 1.0 (Maestrichtian)
D Valdez Group Chugach Mountains Late Cretaceous Clardy (1974) Lithic 17 80 .80 1.0 .90 (Maestrichtian)
c Cape Current terrane Shuyak-Afognak Islands Late Cretaceous Connelly (1978) Lithofeldspathic 12 52 36 .2 1.0 1.0 (Turonian-Santonian?)
B Uyak Complex Kodiak Island Middle Permian(?)- Connelly (1978) Feldspathic 29 61 10 .3 1.0 1.0 19 Early Cretaceous (Valanginian)
A McHugh Complex Chugach Mountains Middle Permian(?)- Clardy (1974) Feldspatholithic 33 25 42 .06 .91 .74 Early Cretaceous (Valanginian)
Q =Quartz + Cllert +Quartzite C/Q = Cllert/Quartz N = mmi>er of sarq>les F = Total Feldspar P/F = Plagioclase/total feldspar L = Total rock fragments V/L = Volcanic rock fragments/total rock fragments
Early Cretaceous; however, they believed the petrologic and stratigraphic data indicated an Early Cretaceous (late Valanginian to Aptian) age.
The sandstone compositions of these two rock complexes are considered to be correlative (table 17; fig. 34). The McHugh and Uyak Complexes are inferred to represent oceanic crust, abyssal floor, and trench deposits of a subduction complex (Plafker and others, 1977; Connelly and Moore, 1979).
Cape Current Terrane
The Cape Current terrane is between, and in fault contact with, the Uyak Complex and the Kodiak Formation (Connelly and Moore, 1979). This terrane (Connelly, 1978) consists dominantly of lithofeldspathic sandstone with minor amounts of pillow lava and pelagic limestone that dip steeply to the northwest (Connelly, 1978).
Sandstones from the Cape Current terrane are lithofeldspathic with an average modal composition of Q12F52L36 (table 17; fig. 34; Connelly, 1978). Quartz content is low, and the low polycrystalline quartz to total quartz ratios ( C/Q) indicate that most of the quartz is monocrystalline. Plagioclase to total feldspar ratios (P/F) of 1 indicate that all the feldspar in the Cape Current sandstones is plagioclase. A
volcanic source area can be inferred because the ratio of volcanic lithic to total lithic fragments (V/L) is 1. The rock composition of the Cape Current terrane is inferred to be mostly medium- to thick-bedded turbidites, and like the McHugh and Uyak Complexes, the Cape Current terrane is thought to be part of a subduction complex.
The age of the Cape Current terrane, which Connelly and Moore ( 1979) based on paleontologic data, is Late Cretaceous (Turonian-Santonian?).
Valdez Group and Kodiak and Shumagin Formations
The correlative rock units of the Valdez Group, the Kodiak and Shumagin Formations, and the "extraformational slivers wacke" of Connelly (1978) are located on the Kenai Peninsula, Kodiak Island, and Shumagin and Sanak Islands southwest of Kodiak Island (fig. 34). The rock units consist of deformed and metamorphosed flysch sequences of sandstone, siltstone, shale, and some conglomerate. The McHugh and Uyak Complexes and the Cape Current terrane structurally overlie the Valdez Group and the Kodiak Formation, and they, in tum, structurally overlie younger rocks. However, on Kodiak and adjacent islands, fault-bounded outliers or klippe of the Kodiak Formation overlie the U yak Complex (Connelly and Moore, 1979).
Framework Geology and Sandstone Composition 71
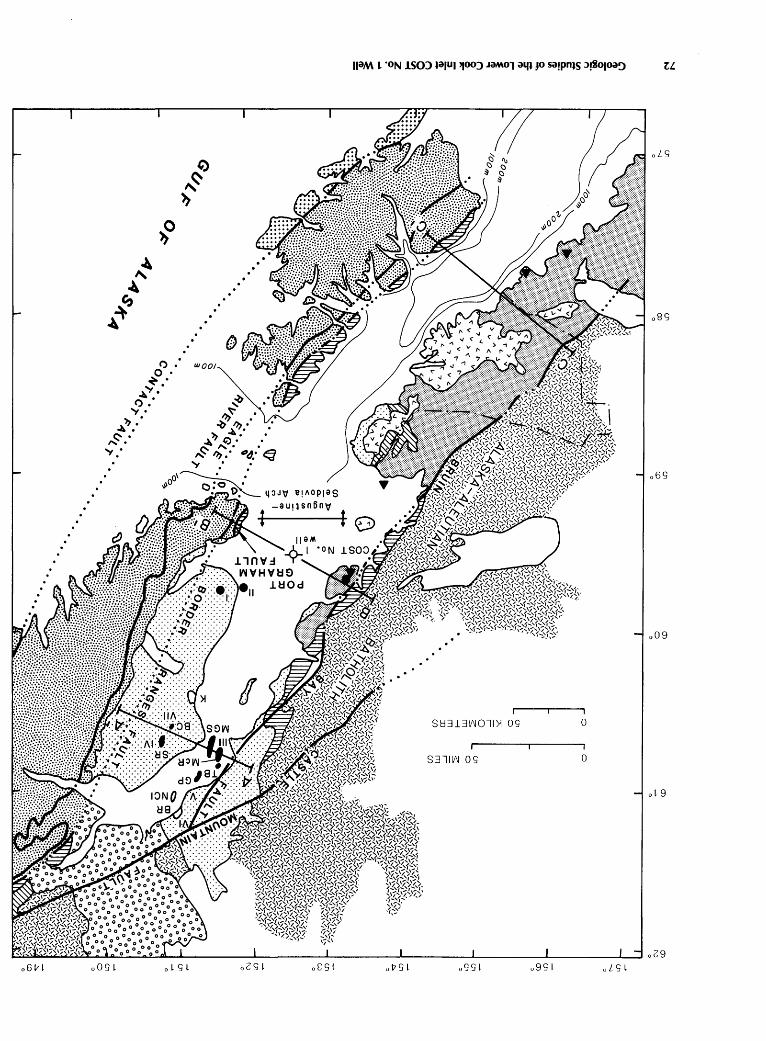
o6V~
~ ~
4
~" 4
0(): .::: • • (). "Y:
•""' .. ~: " . "Y:
~fi)
~
~ ~
~"'."'_:· •""' ~. .
" ": -4.· eJ ~- ">· • "Y : :
oO'~; 4:lJ'if 1:!!AOPJ9S • "',';:,~ -•unsn6n~t $
oOS~ 0 ~ s ~ 0 (; s ~ o8S~
naM ~ "ON lSOJ tafUI 'fOO) JO)MOl alJt JO sa,pnts :>!SOfoa~ Zl
oLS
o8S
o6S
o09
St:E3L3l/IJOll~ OS 0
S::Jllli\J OS 0
0 ~ 9
oG9 oVS~ oSS ~ o9S ~ oLS~
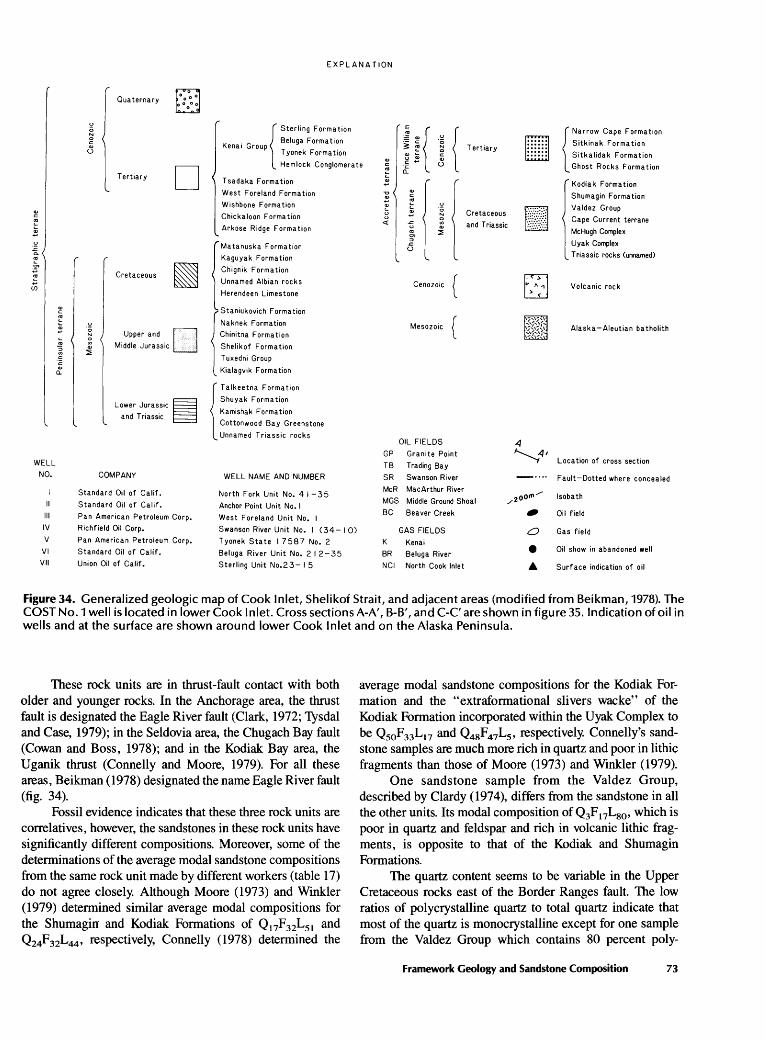
EXPLANATION
~0 Quaternary ~
Tertiary
Tertiary D {
Sterling Formation
Kenai Group Beluga Formation Tyonek Formation
Hemlock Conglomerate ., 0::
~ {
Narrow Cape Formation
Sitkinak Formation
Sitkalidak Formation
Ghost Rocks Formation
"' 0::
"' "'
WELL
NO.
II
Ill
IV
v VI
VII
"' 0::
"' .,
Cretaceous ~
Upper and I' :::: <: ''1 Middle Jurassic { }
Lower Jurassic ~ and Triassic ~
COMPANY
Standard Oil of Calif.
Standard Oil of Calif.
Pan American Petroleum Corp.
Richfield Oil Corp.
Pan American Petroleum Corp.
Standard Oil of Calif.
Union Oil of Calif.
T sad aka Formation
West Foreland Formation
Wishbone Formation
Chickaloon Formation
Arkose Ridge Formation
Ma tanuska Formation
Kaguyak Formation
Chignik Formation
Unnamed Albian rocks
Herendeen Limestone
Naknek Formation
Chinitna Formation
Shelikof Formation
Tuxedni Group
Kialagvik Formation
(
Talkeetna Formation
Shuyak Formation
Kamishak Formation
Cottonwood Bay Greenstone
Unnamed Triassic rocks
WELL NAME AND NUMBER
North Fork Unit No. 4 I -35
Anchor Point Unit No. I
West Foreland Unit No. I
Swanson River Unit No. I (34- 1 0)
Tyonek State I 7587 No. 2
Beluga River Unit No. 2 I 2-35
Sterling Unit No.23- I 5
Cenozoic {
Mesozoic {
OIL FIELDS
GP Granite Point
TB Trading Bay
SR Swanson River
Cretaceous
and Triassic l Kodiak Formation
Shumagin Formation
Valdez Group
Cape Current terrane
McHugh Complex
Uyak Complex
Triassic rocks (unnamed)
Volcanic rock
Alaska- Aleutian batholith
Location of cross section
Fault-Dotted where concealed
MeR MacArthur River
MGS Middle Ground Shoal
BC Beaver Creek
/zoO.,__..... Isobath
GAS FIELDS
K Kenai
BR Beluga River
NCI North Cook Inlet
_, Oil field
0 Gas field
e Oil show in abandoned well
A Surface indication of oil
Figure 34. Generalized geologic map of Cook Inlet, Shelikof Strait, and adjacent areas (modified from Beikman, 1978). The COST No.1 well is located in lower Cook Inlet. Cross sections A-A', B-B', and C-C' are shown in figure 35. Indication of oil in wells and at the surface are shown around lower Cook Inlet and on the Alaska Peninsula.
These rock units are in thrust-fault contact with both older and younger rocks. In the Anchorage area, the thrust fault is designated the Eagle River fault (Clark, 1972; Tysdal and Case, 1979); in the Seldovia area, the Chugach Bay fault (Cowan and Boss, 1978); and in the Kodiak Bay area, the Uganik thrust (Connelly and Moore, 1979). For all these areas, Beikman (1978) designated the name Eagle River fault (fig. 34).
Fossil evidence indicates that these three rock units are correlatives, however, the sandstones in these rock units have significantly different compositions. Moreover, some of the determinations of the average modal sandstone compositions from the same rock unit made by different workers (table 17) do not agree closely. Although Moore (1973) and Winkler (1979) determined similar average modal compositions for the Shumagin and Kodiak Formations of Q17F32L51 and Q24F32L44 , respectively, Connelly (1978) determined the
average modal sandstone compositions for the Kodiak Formation and the "extraformational slivers wacke" of the Kodiak Formation incorporated within the Uyak Complex to be Q50F33L17 and Q48F47L5 , respectively. Connelly's sandstone samples are much more rich in quartz and poor in lithic fragments than those of Moore (1973) and Winkler (1979).
One sandstone sample from the Valdez Group, described by Clardy (1974), differs from the sandstone in all the other units. Its modal composition of Q3F 17L80 , which is poor in quartz and feldspar and rich in volcanic lithic fragments, is opposite to that of the Kodiak and Shumagin Formations.
The quartz content seems to be variable in the Upper Cretaceous rocks east of the Border Ranges fault. The low ratios of polycrystalline quartz to total quartz indicate that most of the quartz is monocrystalline except for one sample from the Valdez Group which contains 80 percent poly-
Framework Geology and Sandstone Composition 73
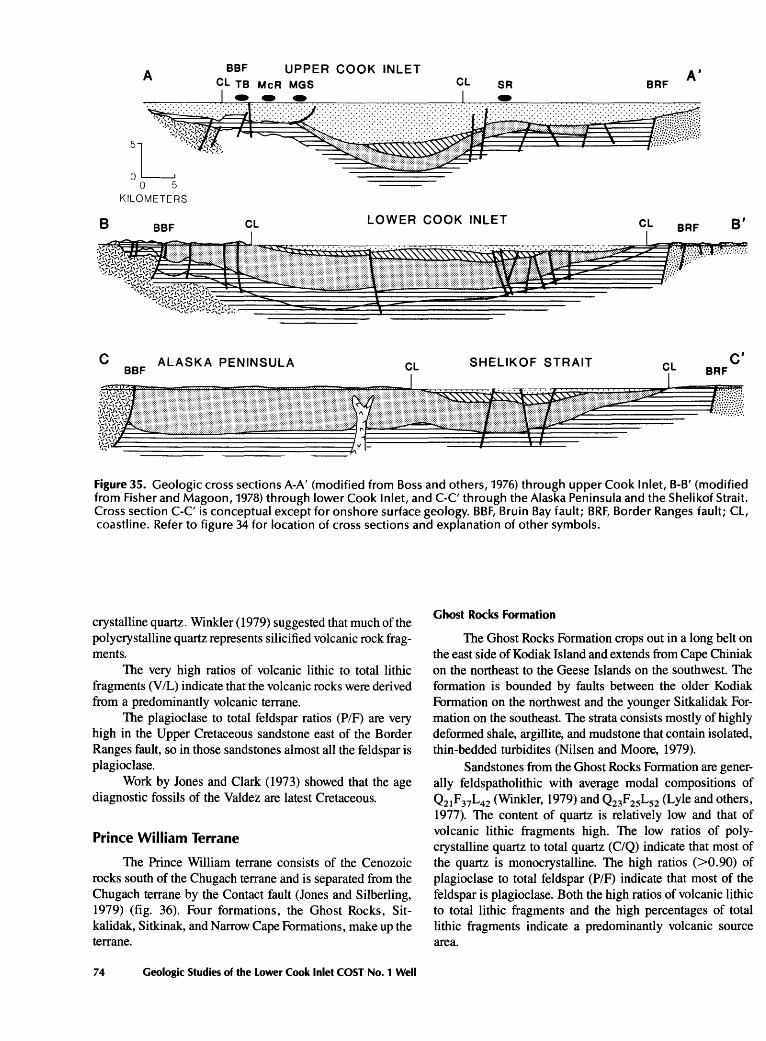
A BBF UPPER COOK INLET CL TB MeR MGS CL A'
SR BRF
B CL LOWER COOK INLET CL B'
c BBF ALASKA PENINSULA CL SHELIKOF STRAIT CL C'
BRF
Figure 35. Geologic cross sections A-A' (modified from Boss and others, 1976) through upper Cook Inlet, B-B' (modified from Fisher and Magoon, 1978) through lower Cook Inlet, and C-C' through the Alaska Peninsula and the Shelikof Strait. Cross section C-C' is conceptual except for onshore surface geology. BBF, Bruin Bay fault; BRF, Border Ranges fault; Cl, coastline. Refer to figure 34 for location of cross sections and explanation of other symbols.
crystalline quartz. Winkler (1979) suggested that much of the polycrystalline quartz represents silicified volcanic rock fragments.
The very high ratios of volcanic lithic to total lithic fragments (V/L) indicate that the volcanic rocks were derived from a predominantly volcanic terrane.
The plagioclase to total feldspar ratios (P/F) are very high in the Upper Cretaceous sandstone east of the Border Ranges fault, so in those sandstones almost all the feldspar is plagioclase.
Work by Jones and Clark (1973) showed that the age diagnostic fossils of the Valdez are latest Cretaceous.
Prince William Terrane
The Prince William terrane consists of the Cenozoic rocks south of the Chugach terrane and is separated from the Chugach terrane by the Contact fault (Jones and Silberling, 1979) (fig. 36). Four formations, the Ghost Rocks, Sitkalidak, Sitkinak, and Narrow Cape Formations, make up the terrane.
74 Geologic Studies of the Lower Cook Inlet COST No.1 Well
Ghost Rocks Formation
The Ghost Rocks Formation crops out in a long belt on the east side of Kodiak Island and extends from Cape Chiniak on the northeast to the Geese Islands on the southwest. The formation is bounded by faults between the older Kodiak Formation on the northwest and the younger Sitkalidak Formation on the southeast. The strata consists mostly of highly deformed shale, argillite, and mudstone that contain isolated, thin-bedded turbidites (Nilsen and Moore, 1979).
Sandstones from the Ghost Rocks Formation are generally feldspatholithic with average modal compositions of Q21F37L42 (Winkler, 1979) and Q23F25L52 (Lyle and others, 1977). The content of quartz is relatively low and that of volcanic lithic fragments high. The low ratios of polycrystalline quartz to total quartz (C/Q) indicate that most of the quartz is monocrystalline. The high ratios (>0.90) of plagioclase to total feldspar (P/F) indicate that most of the feldspar is plagioclase. Both the high ratios of volcanic lithic to total lithic fragments and the high percentages of total lithic fragments indicate a predominantly volcanic source area.
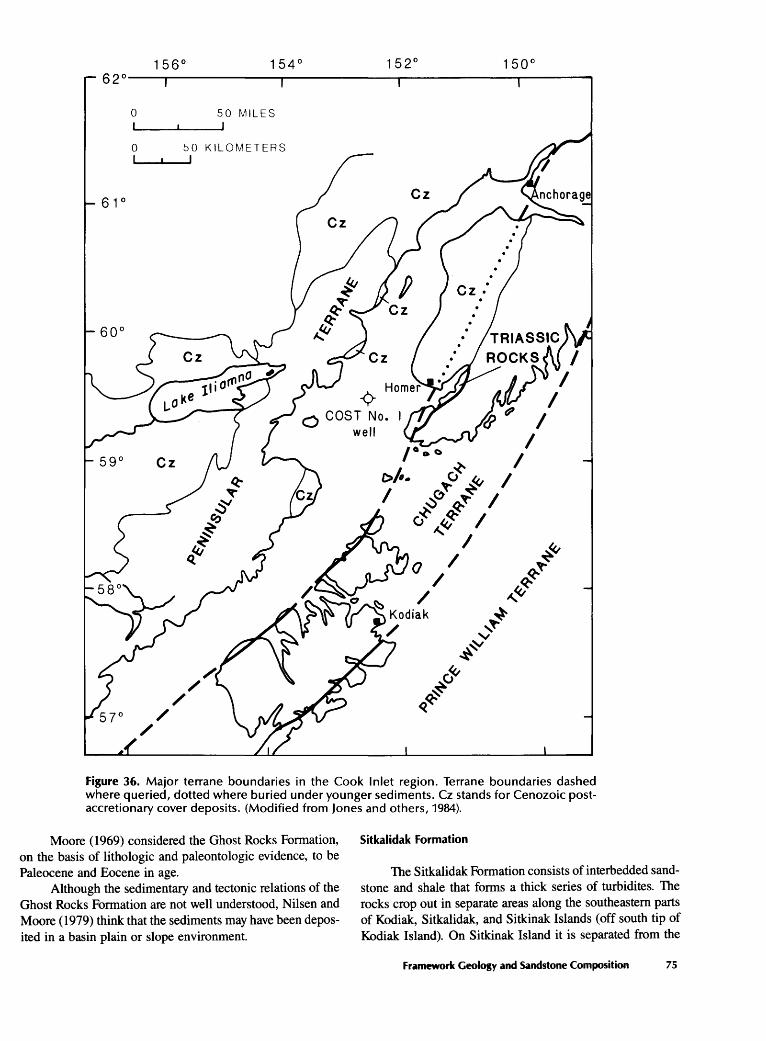
156° 154° 62°
0 50 MILES
0 50 KILOMETERS I I
61°
152° 150°
Cz
~ I r>f.. u ~ I I (!)~ ~ I
~ ~ u~ ~q;; I
" I 0 /
/ ~ /
Kodiak /
I
I I
I I
Figure 36. Major terrane boundaries in the Cook Inlet region. Terrane boundaries dashed where queried, dotted where buried under younger sediments. Cz stands for Cenozoic postaccretionary cover deposits. (Modified from Jones and others, 1984).
Moore (1969) considered the Ghost Rocks Formation, on the basis of lithologic and paleontologic evidence, to be Paleocene and Eocene in age.
Although the sedimentary and tectonic relations of the Ghost Rocks Formation are not well understood, Nilsen and Moore (1979) think that the sediments may have been deposited in a basin plain or slope environment.
Sitkalidak Formation
The Sitkalidak Formation consists of interbedded sandstone and shale that forms a thick series of turbidites. The rocks crop out in separate areas along the southeastern parts of Kodiak, Sitkalidak, and Sitkinak Islands (off south tip of Kodiak Island). On Sitkinak Island it is separated from the
Framework Geology and Sandstone Composition 75
Sitkinak Formation by faults; on Kodiak Island it is faulted from the older Ghost Rocks Formation; on Sitkalidak Island, it is conformably overlain by the Sitkinak Formation; and at Cape Narrow (at the northeast end of Kodiak Island), it is overlain unconformably by the Narrow Cape Formation. At its type section in eastern Sitkalidak Island, Moore (1969) estimated the formation to be about 3,000 m (10,000 ft) thick.
Sandstones from the Sitkalidak Formation (table 17) are generally feldspatholithic with average modal compositions of Q26F26L48 (Winkler, 1979), Q46F17L37 (Lyle and others, 1977), and Q40F22L38 (Stewart, 1976). The moderate amounts of quartz present are mostly monocrystalline, as indicated by the polycrystalline quartz to total quartz ratios (C/Q). Polycrystalline quartz is about twice as abundant in the Sitkalidak Formation as in the Ghost Rocks Formation.
The ratios of plagioclase to total feldspar (P/F), which range from 0.81 to 0.91, indicate that most of the feldspar is plagioclase in the Sitkalidak Formation. K-feldspar, also present, is slightly more abundant in the Sitkalidak than in older units. Volcanic lithic to total lithic fragment ratios (VI L), which range from 0.41 to 0. 75, indicate that volcanic lithic fragments are not the important framework grains. Most of the lithic fragments are sedimentary rock fragments, and there are lesser amounts of metamorphic rock fragments.
The sandstone and shale of the Sitkalidak Formation were deposited in middle and outer submarine fan environments in the Eocene and Oligocene (Nilsen and Moore, 1979).
Sitkinak Formation
Small isolated outcrops of the Sitkinak Formation are exposed on Kodiak Island, Sitkalidak Island, Sitkinak Island, and Chirikof Island (southwest from Kodiak Island). The Sitkinak Formation consists of two distinct sedimentary deposits-marine and nonmarine facies. The marine facies on Sitkalidak Island consists of interfan channel conglomerate and slope facies siltstone and shale (Nilsen and Moore, 1979); these beds conformably overlie the Sitkalidak Formation and are faulted against the Ghost Rocks Formation (Nilsen and Moore, 1979). The nonmarine facies on Sitkinak Island consist of conglomerate, sandstone, and siltstone with some coal and carbonaceous shale; this unit is faulted against the Sitkalidak Formation. The siltstone and fine-grained sandstone strata contain abundant fossil plants of Oligocene age (Moore, 1969).
Sandstone, generally feldspatholithic (table 17) from the Sitkinak Formation, have average modal compositions of Q30F33L37 (Stewart, 1976), Q45F18L37 (Lyle and others, 1977), and Q40F16L44 (Winkler, 1979). Quartz is present in moderate amounts. The low ratios of polycrystalline quartz to total quartz (C/Q) indicate that most of the quartz is monocrystalline. However, polycrystalline quartz is slightly more
76 Geologic Studies of the Lower Cook Inlet COST No. 1 Well
abundant in the Sitkinak Formation than in the Sitkalidak Formation.
The high ratios of plagioclase to total feldspar, ranging from 0.84 to 0.98, indicate that plagioclase is the most abundant feldspar. The content of potassium feldspar is as low in the Sitkinak Formation as it is in the Sitkalidak Formation.
A great diversity in type of lithic fragments is present, as indicated by the range from 0.28 to 0. 75 of volcanic lithic to total lithic fragments. Sedimentary and metamorphic lithic fragments make up a significant part of the total lithic fragment assemblage, but generally volcanic lithic fragments are more abundant.
Narrow Cape Formation
The Narrow Cape Formation, at its type locality at Narrow Cape on eastern Kodiak Island, consists of silty sandstone and siltstone and sedimentary breccia and conglomerate. The formation rests with angular unconformity on the Sitkalidak and Ghost Rocks Formations. A smaller outcrop on Sitkinak Island has a general lithology similar to that at Narrow Cape. The Narrow Cape Formation here is disconformable with the Sitkinak Formation. The exposures at both places contain abundant fossils; however, at Narrow Cape the fossils indicate an early and middle Miocene age, and at Sitkinak Island, they indicate a late Oligocene or early Miocene age (Allison and Addicott, 1976). The strata represent marine shelf deposits.
Sandstone from the Narrow Cape Formation is lithofeldspathic with average modal compositions of Q70F18L12 (Lyle and others, 1977) and Q5of26L24 (Winkler, 1979). Quartz content is higher in this formation than in the older formations. The low ratios of polycrystalline quartz to total quartz (C/Q) indicate that most of the quartz is monocrystalline. The Narrow Cape Formation contains similar percentages of polycrystalline quartz (as much as 25 percent of the total quartz) as the Sitkinak Formation.
Plagioclase to total feldspar ratios (P/F), which average 0. 7 5, indicate that most of the feldspar is plagioclase and that 25 percent of the total feldspar assemblage is K-feldspar. Of the lithic fragment assemblage, 48 percent is sedimentary, 4 7 percent are volcanic, and 5 percent are metamorphic rock fragments. The Narrow Cape Formation has the greatest diversity in types of lithic fragments than any other formation east of the Border Ranges Fault.
Peninsular Terrane
Moderately deformed upper Paleozoic and Mesozoic sedimentary rocks at least as old as Permian are present within the confines of the basin framework (fig. 36). The Permian rocks (Hanson, 1957) are known from only one small area near Puale Bay, so they will not be discussed here; only the Mesozoic rocks will be discussed in this section. Formerly these Mesozoic sedimentary rocks were designated
the Matanuska-Wrangell terrane (Berg and others, 1972), but they are now renamed the Peninsular terrane (Jones and Silberling, 1979). The age, general lithology, and stratigraphic relations of these rocks are shown on figure 37. The important distinction between this terrane and the previous terranes is that the stratigraphic units are deposited one on top of another and many stratigraphic units are separated by unconformities, whereas most of the previously discussed terranes are in fault contact and become progressively younger southward from the Border Ranges fault to the Aleutian trench.
Upper Triassic Rocks
On the northwest side of lower Cook Inlet, Upper Triassic rocks are exposed in scattered outcrops on both sides of the Bruin Bay fault from Tuxedni Bay to Kamishak Bay. At the head of Tuxedni Bay, unnamed Upper Triassic rocks, as much as 395 m thick (1,300 ft; fig. 37), consist of metamorphosed limestone, tuff, chert, sandstone, shale, and basaltic lava flows (Detterman and Hartsock, 1966). West of the Bruin Bay fault in the Kamishak Bay area, the Upper Triassic mafic-volcanic rocks of the Cottonwood Bay Greenstone presumably underlie the fossiliferous limestone, chert, and tuff of the Kamishak Formation (Detterman and Reed, 1980). The Cottonwood Bay Greenstone is probably more than 600 m thick (2,000 ft; fig. 37), and a composite thickness for the three members of the Kamishak Formation is as much as 1,290 m thick (4,230 ft; fig. 37; Detterman and Reed, 1980).
In the Puale Bay area unnamed Upper Triassic rocks, as much as 800 m thick (2,625 ft; fig. 37), consist of fossiliferous limestone and volcanic agglomerate intruded by basaltic dikes and sills (Imlay and Detterman, 1977). On the southeast side of lower Cook Inlet, unnamed Upper Triassic rocks exposed northwest of the Border Ranges fault on the Kenai Peninsula co~sist of fossiliferous limestone, finegrained tuffs, and a few thin sandstone beds (Martin and others, 1915; Moore and Connelly, 1979).
Unnamed Upper Triassic rocks at least 600 m thick (2,000 ft; fig. 37) depositionally overlie undeformed pillow basalts on the westernmost island of the Barren Islands (Cowan and Boss, 1978). These rocks, which contain Late Triassic fossils, consist of gently folded greenish tuff, tuffaceous sandstone, minor black siliceous mudstone, and chert (Cowan and Boss, 1978). On the northwestern part of the Kodiak Islands, pillowed greenstones are overlain by fossiliferous volcaniclastic turbidites of the Upper Triassic Shuyak Formation (Connelly, 1978).
Sandstones within Upper Triassic rocks from widely spaced areas around Cook Inlet and Shelikof Straits have similar compositions (table 16, fig. 33). The sandstones are lithic and feldspatholithic and are distinctly poor in quartz. Average modal compositions determined by Moore and Con-
nelly (1979) are Q0F35L65 from the Kenai Peninsula, Q3F27L70 from the Shuyak Formation, Kodiak Island, and Q2F39L59 from Puale Bay.
Polycrystalline quartz to total quartz ratios (C/Q) are all low, therefore most of the quartz is monocrystalline. Plagioclase to total feldspar ratios (P/F) of one indicate that plagioclase is the only feldspar present. The very high ratios of volcanic lithic to total lithic fragments (V/L) reflect the lithic nature of the sandstones and indicate a prominent volcanic source terrane.
Two assumptions need to be made to reconstruct the generalized paleogeology of the Late Triassic rocks: (1) the structural grain of the Triassic is parallel to the Kodiak-Kenai plutonic belt of Late Triassic(?)-Early Jurassic age; and (2) the Triassic rocks, on both sides of the Cook Inlet-Shelikof Strait west of the Border Ranges fault, are genetically related but are not fragments of other land masses that were later welded together. If these assumptions are true, then the northwest and southeast flanks of the basin can be compared. Shallow-water shelf carbonates and agglomerates occur on the northwest flank compared to turbidite sandstones and siltstones on the southeast flank; mafic igneous flows, sills, and dikes with a few pillow basalts occur mainly on the northwest compared to many pillow basalts on the southeast; chert occurs on both flanks. In other words, the Late Triassic rocks formed a broad volcanic Island arc that included shallow-water carbonates, turbidites, mafic volcanic rocks, and chert.
Lower Jurassic Rocks
Lower Jurassic rocks are exposed on both sides of Cook Inlet. On the northwest side, the outcrop belt is as much as 15 km (10 mi) wide and is cut in several places by the Bruin Bay fault. South of Tuxedni Bay, unfossiliferous Lower Jurassic rocks dip generally southeast and consist of poorly bedded volcanic agglomerates, breccias, and lava flows of the Talkeetna Formation (Detterman and Hartsock, 1966). In the Iniskin-Tuxedni area the formation is as much as 2,575 m (8,500 ft) thick (fig. 37).
Near Seldovia, fossiliferous Lower Jurassic strata consist of a pyroclastic sequence that is about 4, 000 m ( 13,000 ft) thick (fig. 37; Kelley, 1978). Three lithofacies were mapped from bottom to top: a graded pyroclastic lithofacies with each graded sequence as much as 50 m (165ft) thick, a pyroclastic debris-flow and fossil-bearing turbidite lithofacies, and a reworked volcaniclastic lithofacies with coal beds as much as 4 m (15ft) thick (Kelley, 1978). On the basis of lithology and age, the rocks near Seldovia have been assigned to the Talkeetna Formation (Magoon and others, 1976b ). Lower Jurassic rocks are not exposed northwest of the Border Ranges fault on Kodiak Island (Connelly and Moore, 1979) or on the Barren Islands.
On the northwest coast of Shelikof Strait in Puale Bay, as much as 555 m (1 ,820ft) (fig. 36) of sparsely fossiliferous
Framework Geology and Sandstone Composition 77
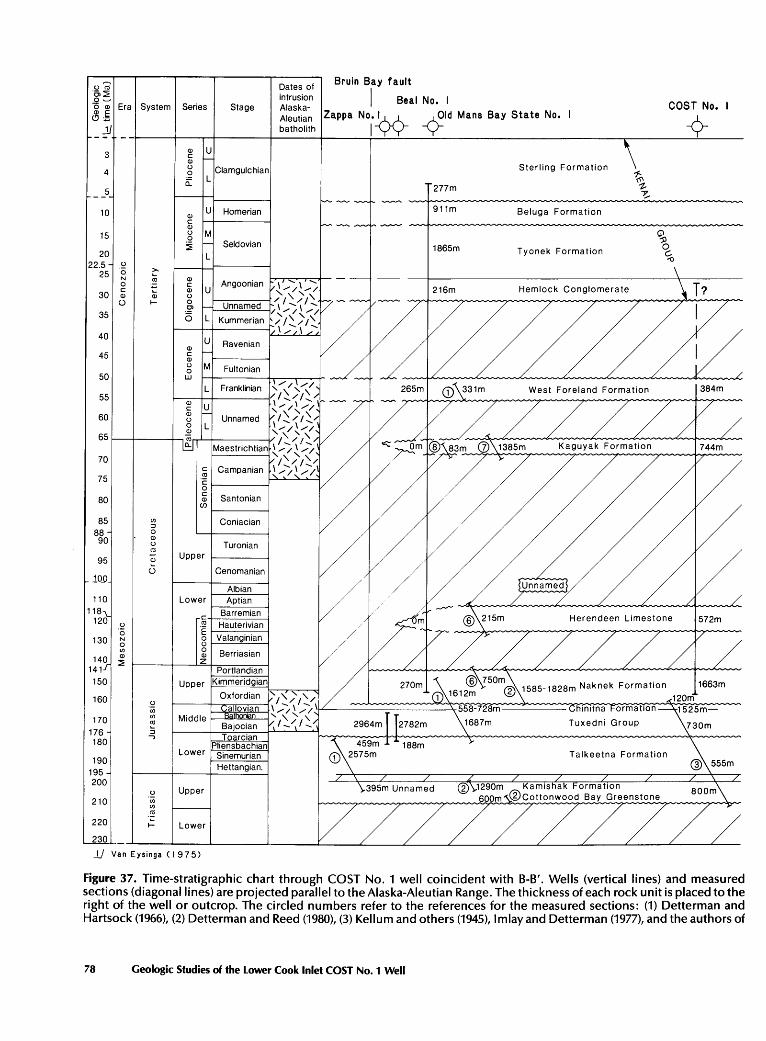
(.)~ Dates of Bruin Bay fault '51~ intrusion I Bear No. I 0'-' 0 Q) Era System Series Stage Alaska- COST No. I ~:E Aleutian Zappa Nol-9¢- ~ld Mans Bay State No. I
-¢-JJ batholith -- -3
Q) u c ....._ Q) \ 4 (.) Clamgulchian Sterling Formation .2 0:: L ~
__ 5_ 277m ~ .......... ~~ ~~
10 u Homerian 911m Beluga Formation Q) c Q) ~ __...._ ~ ~~~
15 (.) M '1 0
~ r- Seldovian 1865m 0 20 L
Tyonek Formation c. ~
22.5 .~ \ 25 0 >.
N ctl Q) ----0 c u Angoonian /\'_.,.'/\_.,.""'; 216m Hemlock Conglomerate \ T?
30 c Q) ,,, Q) Q) (.)
/l ..... ./1:._ () 1- 0 Unnamed
s~L:zzzzzLV .21 r- /~/ /~// 35 6 L Kummerian r-/ /~..,/ /:....
40 I/\,..,./\"" u Raveman Q)
45 c -Q) (.) M Fultonian 0
50 w L Franklinian ~ ....... /~//, 265m CD~31m West Foreland Formation 384m
55 / !'::..,/ 1~./ Q) u ~/ /~ ....... /\ c
60 Q) -
Unnamed /l,/1'/ (.)
0 L ~,..,.)~_.,.), ~ 65 ~
;'/,,/ Maestncht1an ~,..,.)~ ....... ""'/,
70 /f,/1'/ c Campanian ~,..,./~ ....... /\
v;j// v 75 ctl ·c:
0 c
Santonian 80 Q) (/)
85 en Coniacian ::J
88 0
90 Q) (.) Turonian /y/ / L/ ctl
Upper 95 ~ () Cenomanian
10..0 // / ~UnnameC!~ Albian 110 Lower Aptian / / / / /
/ /~ L. 11~}... Barremian ,(rlr c //m @~15m Herendeen Umestone 572m 120 (.) ctl Hauterivian ·a '§
Valanginian / -v/~7/ // / 130 N 0 0 (.)
~/ / << //
en 0 Berriasian 140
Q) Q)
~ z 141.r Portlandian ~ 270m .~ ®\:50~585_ 1828m Naknek Format;on 1663m 150 Upper Kimmeridgian
160 Oxfordian )'t''/1'/ 1 1612m <.<_120m (.)
'Cii allovian z,..,./~,.-/~ 558-728m Ch;n;tna Formatron~sm-170 en Middle H~thonan
/I,/ I'/ 2964m Ll2782m -~~87m Tuxedni Group 730m ctl Bajocian 176 :; _i - .. \ ........
180 ""') Toarcian
~ 459m l ~188m )..
~555m Pliensbachian
Lower Sinemurian 575m Talkeetna Formation 190
Hettangian. 195 200 / \ / / L / / / / / /
(.) Upper \395m Unnamed @\.1290m Kamishak Format1on BOOm\
210 en 600m_'\.'Pcottonwood Bay Greenstone en
/7//////// ctl
220 ~ Lower
~-JJ Van Eysinga (I 975)
Figure 37. Time-stratigraphic chart through COST No. 1 well coincident with B-B'. Wells (vertical lines) and measured sections (diagonal lines) are projected parallel to the Alaska-Aleutian Range. The thickness of each rock unit is placed to the right of the well or outcrop. The circled numbers refer to the references for the measured sections: (1) Detterman and Hartsock (1966), (2) Detterman and Reed (1980), (3) Kellum and others (1945), Imlay and Detterman (1977), and the authors of
78 Geologic Studies of the Lower Cook Inlet COST No. 1 Well
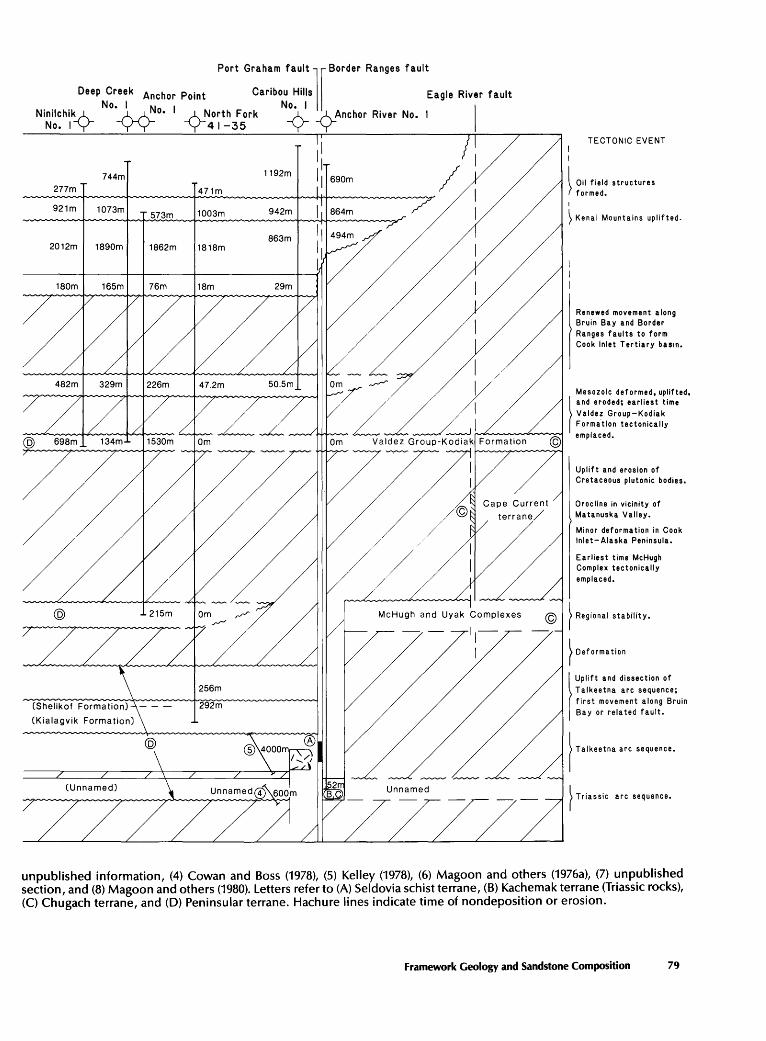
Port Graham fault ll Border Ranges fault
Deep Creek Anchor Point Caribou Hills Eagle River fault No. I N 1 No. I
1
NinilchikA _AK 0" ANorth Fork ____A_ ~A_Anchor River No.
No. IY YY Y41-35 y Y TECTONIC EVENT
744m 1192m 690m I 277m
~ Oil field structures 471m formed.
921m 1073m I
57 3m 1003m 942m ) Kenai Mountains uplifted.
863m 2012m 1890m 1862m 1818m
180m 165m 76m 18m 29m
Renewed movement along Bruin Bay and Border Ranges faults to form Cook Inlet Tertiary bastn.
I /
~ Mesozoic deformed, uplifted,
f '"' "''''' mlloot tlmo Valdez Group-Kodiak
~~I Forma.tion tectonically
© emplaced.
Uplift and erosion of Cretaceous plutonic bodies.
Orocline in vicinity of Matanuska Valley.
Minor deformation in Cook Inlet-Alaska Peninsula.
Earliest time McHugh Complex tectonically emplaced.
r-'"
- -
r "·"" .. , ,; ... ,.,, .. 256m Talkeetna arc sequence;
292m first movement along Bruin
(Kialagvik Formation) Bay or related fault.
© f Tolk""'"' "'"'""·
unpublished information, (4) Cowan and Boss (1978), (5) Kelley (1978), (6) Magoon and others (1976a), (7) unpublished section, and (8) Magoon and others (1980). letters refer to (A) Seldovia schist terrane, (B) Kachemak terrane (Triassic rocks), (C) Chugach terrane, and (D) Peninsular terrane. Hachure lines indicate time of nondeposition or erosion.
Framework Geology and Sandstone Composition 79
Lower Jurassic volcaniclastic sandstone, conglomerate, and limestone are exposed (Imlay and Detterman, 1977). According to Detterman (oral commun., 1980), Lower Jurassic rocks of Puale Bay are very similar to the Talkeetna Formation in the Talkeetna Mountains.
The presence of the Lower Jurassic Talkeetna Formation on both sides of Cook Inlet, in some offshore areas (Boss and others, 1976; Fisher and Magoon, 1978), and in the Puale Bay area suggests that this unit is continuous beneath Cook Inlet and Shelikof Strait.
Lower Jurassic sandstones from widely spaced areas in Cook Inlet and Shelikof Strait and adjacent areas are similar and they are also similar to sandstones in the underlying Upper Triassic sequences. The Lower Jurassic sandstones are generally volcanic lithic rich, reflecting a primary volcanic nature of associated rocks interbedded with the sandstones. Average modal compositions from the Puale Bay area and from the Kenai Peninsula are Q6F 42L52 (Egbert, this volume) and Q3F20L77 (Kelley, 1980), respectively.
The sandstones are distinctly quartz poor with low polycrystalline quartz to total quartz ratios (C/Q) indicating that most of the quartz that is present is monocrystalline. The quartz has features indicative of volcanic derivation: clear, unstrained, resorbed margins or bleb inclusions. Plagioclase to total feldspar ratios (P/F) are high (0.97 to 1.0); the high ratios indicate that almost all the feldspar is plagioclase. Volcanic lithic to total lithic fragment ratios (V/L), which are also high (0. 98 to 1. 0), reflect the volcanic lithic rich nature of the sandstones and indicate an extensive volcanic source terrane.
Middle Jurassic Rocks
Unconformably overlying the Lower Jurassic volcaniclastic rocks is a thick sequence of Middle Jurassic marine sedimentary rocks. These rocks are exposed only on the west side of Cook Inlet and on the Alaska Peninsula east of the Bruin Bay fault. In the subsurface, 292 m (960 ft) of Middle Jurassic rock has been penetrated in the North Fork 41-35 well on the Kenai lowland (fig. 37).
Middle Jurassic rocks are divided, in upward order, into the Tuxedni Group and the Chinitna Formation in the Cook Inlet area and into the Kialagvik and the Shelikof Formations on the Alaska Peninsula.
Tuxedni Group and Kialagvik Formation
The Tuxedni Group, Bajocian to Callovian in age, includes as many as six formations and ranges in thickness from 536 to 2,748 m (1,760 to 9,015 ft) in the IniskinTuxedni area (Detterman and Hartsock, 1966, pl. 5). According to Detterman and Hartsock (1966, pl. 5), the thickness of the Tuxedni Group on the Chisik Island-Tuxedni Bay section measures 1,687 m (5,535 ft) (fig. 37), is abundantly fossiliferous and contains 35 percent sandstone and 65 percent
80 Geologic Studies of the Lower Cook Inlet COST No. 1 Well
siltstone with minor amounts of tuff. All the sediments were deposited in a shallow marine shelf environment.
The Kialagvik Formation, Toarcian and Bajocian in age and in part correlative to the Tuxedni Group, crops out along the north shore of Puale Bay on the Alaska Peninsula (Imlay and Detterman, 1977). The unit is at least 730 m (2,400 ft) thick (fig. 37), is sparsely fossiliferous and contains 10 percent sandstone-conglomerate and 90 percent siltstone representing submarine slope-channel fill and slope deposits, respectively.
Sandstones from the Tuxedni Group and Kialagvik Formation from widely spaced areas have similar compositions. The sandstones are feldspatholithic with average modal compositions of Q6F 43L51 (Egbert and Magoon, 1981) and Q8F35L57 (Egbert, this volume) from the Tuxedni Group and Kialagvik Formation respectively. The sandstones are quartz poor with low polycrystalline quartz to total quartz ratios indicating that most of the quartz is monocrystalline. The quartz, mostly of volcanic origin, was probably derived from the underlying volcanic and volcaniclastic Talkeetna Formation.
The high (0.92-0.95) plagioclase to total feldspar ratios (P/F) indicate that most of the feldspar is plagioclase. The high ratios of volcanic lithic to total lithic fragments (V/L) reflect the lithic-rich nature of the sandstones and also their derivation from an extensive volcanic source terrane (Talkeetna Formation).
Chinitna and Shelikof Formations
The Chinitna Formation of Callovian age, has two members, and ranges in thickness from 558 m (1,830 ft) at the Chisik Island-Tuxedni Bay section to 728 m (2,375 ft) in the Iniskin-Tuxedni area (fig. 37; Detterman and Hartsock, 1966, pl. 5). The Chisik Island-Tuxedni Bay section contains 10 percent sandstone-conglomerate and 90 percent siltstone. These rocks represent submarine channel fill conglomerate and slope facies siltstone and thin-bedded turbidite sandstone of the forearc basin.
The Shelikof Formation, of Callovian age and a correlative unit to the Chinitna Formation, overlies the Kialagvik Formation in the Puale Bay area (Kellum and others, 1945; Imlay and Detterman, 1977). Here the Shelikof Formation is at least 1,525 m thick (5 ,000 ft) (fig. 37), is sparsely fossiliferous, and contains 80 percent sandstone and 20 percent siltstone. These rocks mainly represent submarine fan deposits.
Sandstones from the Chinitna and Shelikof Formations are generally lithofeldspathic with average modal compositions of Q5F 59L36 and Q9F 46L45 , respectively (Egbert and Magoon, 1981; Egbert, this volume). Quartz content is low in both units; the low polycrystalline quartz to total quartz ratios indicate that most of the quartz is monocrystalline. Present in only minor amounts, the polycrystalline quartz probably represents silicified volcanic detritus.
Feldspars are the most abundant framework grains in the Chinitna and Shelikof Formations. The high plagioclase to total feldspar ratios (P/F) indicate that most of the feldspar is plagioclase. Lithic fragments are the second most abundant framework grains; the high volcanic lithic to total lithic fragment ratios (V/L) indicate a predominantly volcanic source terrane. The high feldspar content may indicate plutonic source areas in addition to volcanic sources. Hornblende becomes a dominant accessory mineral in the Shelikof Formation and in the upper part of the Chinitna Formation, however, its virtual absence in underlying units indicates the unroofing of the Jurassic plutonic rocks.
Upper Jurassic Rocks
Naknek Formation
The Naknek Formation of Oxfordian to Tithonian age unconformably overlies the Chinitna and Shelikof Formations. The Naknek Formation crops out from the Alaska Peninsula to Tuxedni Bay and is also present in the Matanuska Valley. It has greater areal exposure than the underlying or overlying rocks. The depositional environment of the Naknek Formation varies from fluvial, alluvial and shallow marine deposits to deep-marine channel, slope, and submarine fan deposits.
In the Iniskin-Tuxedni area, as much as 1,612 m (5,285 ft) of the Naknek is exposed and the outcrops represent four members (fig. 37; Detterman and Hartsock, 1966) and in the Kamishak Bay area, the thickness ranges from 1,585 to 1,828 m (5,200 to 5,995 ft) (fig. 37; Detterman and Reed, 1980). The Naknek Formation does not crop out on the southeast side of the basin, but 256m (840ft) of Upper Jurassic rocks were penetrated in the North Fork 41-35 well and 1,663 m (5,455 ft) were penetrated in the COST No. 1 well (fig. 36). Along the Alaska Peninsula, the Naknek varies in thickness and may be as much as 3,050 m (10,000 ft) thick (Burk, 1965).
Sandstones from the Naknek Formation on the Alaska Peninsula are all generally feldspathic with moderate amounts of quartz and average modal compositions of Q28F 63L9 (Egbert, this volume), Q38F 52L10 (McLean, 1979), Q36F60L4 (Lankford and Magoon, 1978), and Q47F52L1
(Burk, 1965). These rocks are similar to sandstones penetrated in the COST No. 1 well that have an average modal composition of Q24F 55L21 (McLean, this volume). This composition contrasts to Naknek sandstones exposed in the Iniskin-Tuxedni region that are distinctly quartz poor but still feldspathic; they have average modal compositions of Q6F73L21 (Egbert and Magoon, 1981) and Q4F58L38 (Franks and Hite, 1980).
Although there is a distinct contrast in quartz content between the Naknek exposed on the Alaska Peninsula to that exposed in the Iniskin-Tuxedni area, the polycrystalline quartz to total quartz ratios are all similar and indicate that
almost all of the quartz is monocrystalline. Plagioclase to total feldspar ratios (P/F), which are all high, indicate that most of the feldspar is plagioclase, however K-feldspar is more abundant in the Naknek Formation than in the underlying units. Potassium feldspar in the Naknek Formation, which averages 13 percent of the total feldspar population, is most abundant in samples from the COST No. 1 well.
Volcanic lithic to total lithic fragment ratios (V/L) are high in the Naknek Formation but are lower than the ratios in underlying units; this variation indicates greater diversity in the source area. Plutonic, sedimentary, and metamorphic lithic fragments account for the remaining lithic fragment population.
Upper Jurassic and Lower Cretaceous Rocks
Staniukovich Formation
The Staniukovich Formation of Late Jurassic (Kimmeridgian) through Early Cretaceous (Valanginian) age crops out on the southwest end of the Alaska Peninsula where it conformably overlies the Naknek Formation. The formation is unknown in the Cape Douglas area and areas farther northeast. The Staniukovich Formation is as much as 549 m (1,800 ft) thick and consists mainly of marine sandstone and siltstone (Burk, 1965).
Two sandstone samples described by Burk (1965) are feldspathic; their average modal composition, Q55F 41L4 , is similar to the average modal composition, Q48F 42L10, of Franks and Hite (1980). The sandstone samples in the Staniukovich are more quartz rich than those in the underlying Naknek Formation and are nearly compositionally mature.
Lower Cretaceous Rocks
Herendeen Limestone
Lower Cretaceous (Valanginian to Barremian) rocks crop out in many areas from the Matanuska Valley and Wrangell Mountains in the north (Grantz and others, 1966; MacKevett, 1976, 1978) to Port Moller-Herendeen Bay area on the Alaska Peninsula in the south (Atwood, 1911; Burk, 1965; Molenaar, 1980).
In this area, thick beds of the Naknek Formation (91 + m; 300 + ft), Staniukovich Formation (550 m; 1,800 ft), and Herendeen Limestone (152 m; 500 ft) (Burk, 1965; Jones, 1973) seem to be substantial evidence that sedimentation was continuous from Late Jurassic through Early Cretaceous; however, Molenaar (1980) demonstrates an unconformity between Lower Cretaceous and Upper Jurassic strata in the Chignik area 160 km (100 mi) to the northeast.
In the Kamishak Hills, 215 m (700ft) of Lower Cretaceous rock (Herendeen Limestone) unconformably overlies Upper Jurassic strata (Jones and Detterman, 1966; Jones,
Framework Geology and Sandstone Composition 81
1973; Magoon .and others, 1976a, 1978). The beds consist of 7 percent sandstone and 93 percent siltstone and are rich in Inoceramus fragments. These bioclastic fragments occur in very high concentrations and are described as limestone in this predominantly siltstone rock unit.
In the subsurface, Lower Cretaceous rocks were depicted by Boss and others (1976) in a cross section through Cook Inlet basin north of Kalgin Island. On the Kenai Lowland 215 m (700 ft) of Lower Cretaceous rocks (Herendeen Limestone) were penetrated in the Anchor Point No. 1 well and 572 m (1 ,875 ft) were penetrated in the COST No. 1 well (fig. 37, table 16).
The Lower Cretaceous Nelchina Limestone crops out east of the Matanuska Valley (Grantz and others, 1966) and in the Wrangell Mountains (MacKevett, 1976, 1978). The similarity of both the Herendeen and Nelchina Limestones, in age and lithology, has been acknowledged by many workers. In the Wrangell Mountains the undeformed Lower Cretaceous rocks unconformably overlie much older severely deformed rocks (MacKevett, 1976, 1978).
Sandstone from the Lower Cretaceous sequences are generally feldspathic and lithofeldspathic with average modal compositions of Q62F33L5 from the Alaska Peninsula (Burk, 1965), Q38F 59L3 from the Cape Douglas area, (Lankford and Magoon, 1978) and Q36F44L20 from the COST No. 1 well (McLean, this volume). Quartz content is similar to the upper part of the underlying Naknek and Staniukovich Formations reflecting increased compositional maturity from underlying units.
Polycrystalline quartz to total quartz ratios are very low; the low ratio indicates that most of the quartz is monocrystalline. Plagioclase to total feldspar ratios (P/F) are high but K-feldspar ranges from 12 to 23 percent of the total feldspar populations. Volcanic lithic to total lithic fragment ratios (V/L) are moderately high, but total lithic fragment populations are low.
Unnamed Albian Rocks
Rocks of Albian age have been reported from the Matanuska Valley (Grantz, 1964) and Wrangell Mountains (Jones, 1973). Fossils collected recently by the authors on the Alaska Peninsula, which were identified by D. L. Jones, indicate that Albian rocks are also present on the Alaska Peninsula. The fossils were collected north of the Katmai River from rocks in fault contact with the Naknek Formation.
Albian sandstone samples from the Matanuska Valley and on the Alaska Peninsula are lithic and feldspatholithic with average modal compositions ofQ4F4L92 and Q11F40L49 respectively (Grantz, 1964; Egbert, this volume). These compositions are in sharp contrast to the more feldspathic nature of the Lower Cretaceous (Valanginian to Barremian) and Upper Jurassic sandstone.
Polycrystalline quartz to total quartz ratios (C/Q) are very low. Plagioclase to total feldspar ratios (P/F) are high,
82 Geologic Studies of the Lower Cook Inlet COST No. 1 Well
however K-feldspar accounts for 25 percent of the total feldspar population from samples from the Matanuska Valley and account for only 1 percent of the total feldspar from the Alaska Peninsula. The very high volcanic lithic to total lithic fragment (V/L) and total lithic fragment populations from both areas possibly reflect local but prominent volcanic sources during the Albian.
Upper Cretaceous Rocks
Upper Cretaceous (Campanian and Maestrichtian) rocks in the Cook Inlet area north of Kalgin Island are assigned to the Matanuska Formation; south of Kalgin Island, they are assigned to the Kaguyak Formation. Magoon and others (l976b) and Fisher and Magoon (1978) suggested the latitude at Seldovia as an arbitrary boundary separating these two formations, but that suggestion was prior to drilling the COST No. 1 well (Magoon and Claypool, 1979, 1981) and recognizing the Saddle Mountain outcrop northeast of Chinitna Bay (Magoon and others, 1980) and the Augustine Island outcrop (Buffler, 1976; Detterman and Reed, 1980). In addition, the continuity or mapability of Upper Cretaceous rocks south of Kalgin Island to the Katmai River can be demonstrated using reflection seismic data (Fisher and Magoon, 1978), well control, and outcrop patterns.
The Kaguyak Formation (Keller and Reiser, 1959) crops out in the Kamishak Hills-Cape Douglas area where 1,385 m (4,545 ft) of rock unconformably overlies Lower Cretaceous and Upper Jurassic strata (fig. 37). In upward succession this formation consists of a thin shallow-marine basal conglomerate (5 m; 16ft) that grades upward into thick sandstones (32m; 105ft), bioturbated gray siltstone (600 m; 1,970 ft), and turbidite sandstone interbedded with siltstone (460 m·; 1,500 ft). The COST No. 1 well penetrated 744 m (2,325 ft) of the Kaguyak Formation. In addition, 83 m (275 ft) of Upper Cretaceous nonmarine sandstone, conglomerate, and coal are exposed northwest of the COST No. 1 well; the Upper Cretaceous rocks unconformably overlie Upper Jurassic rocks near Saddle Mountain in the Iniskin-Tuxedni area (Magoon and others, 1980).
On the Kenai Lowland, several wells penetrated the Kaguyak Formation, including the Anchor Point No. 1 well, which penetrated 1,530 m (5,000 ft) of Upper Cretaceous strata (figs. 34 and 37, table 16).
In the Matanuska Valley at least 1,250 m (4,100 ft) of Campanian and Maestrichtian rocks of the Matanuska Formation are exposed (Grantz, 1964). In this area the Matanuska Formation is composed of claystone, siltstone, sandstone, and conglomerate, and the rocks have features indicative of deposition from turbidity currents (Grantz, 1964).
South of Wide Bay on the Alaska Peninsula (fig. 32), the Upper Cretaceous rocks are known as the Chignik Formation (fig. 37) and consist dominantly of sandstone with lesser amounts of conglomerate, siltstone, shale and mudstone.
Depositional environments represented within the formatioil. range from fluvial to marine (Burk, 1965; Imlay and Detterman, 1977; Fairchild, 1977; Molenaar, 1980).
Sandstones from the Matanuska, Kaguyak, and Chignik Formations are of variable composition, ranging from lithic to feldspathic with intermediate quartz content. Sandstones from the Kaguyak Formation are represented by two compositional modes. In the Cape Douglas area and in the COST No. 1 well, the lower part of the Kaguyak Formation has average modal compositions of Q34F 55L 11 (Lankford and Magoon, 1978) and Q22F64L14 (McLean, this volume) respectively. Similarly, sandstone from the Kaguyak Formation near Saddle Mountain, which has been correlated with the lower part of the Kaguyak Formation penetrated in the COST No. 1 well (Magoon and others, 1980), has an average modal composition of Q32F 40L28 .
In contrast, sandstones from the upper part of the Kaguyak Formation from the Cape Douglas area and COST No. 1 well have average modal compositions of Q27L31F42
and Q 13F 18L69 , respectively; these compositions reflect increased volcanic lithic detritus from source areas in the latest Cretaceous.
Stratigraphically located sandstone samples were not collected from the Matanuska Formation, however, Grantz (1964) and Clardy (1974) indicate average modal compositions of Q26F58L16 and Q21F 48L31 , respectively; these compositions are similar to the modal compositions of the lower part of the Kaguyak Formation.
Sandstone samples from the Chignik Formation are mostly lithofeldspathic and feldspatholithic with average total quartz percentages higher than in the Kaguyak and Matanuska Formations. Average modal compositions from the Chignik are Q43F31L26 (Fairchild, 1977) and Q34F19L47
(Burk, 1965). Quartz content is variable from the Kaguyak,
Matanuska, and Chignik Formations, but the low ratios of polycrystalline quartz to total quartz (C/Q) indicate that most of the quartz is monocrystalline. Plagioclase to total feldspar ratios (P/F), although variable in the three formations, generally are lower in the three formations than in the underlying units; this variability indicates increased K-feldspar content (as much as 41 percent of the total feldspar from the Kaguyak Formation and 69 percent from the Chignik Formation, table 16). The moderate to high ratios of volcanic lithic to total lithic fragment (V/L) reflect a prominent volcanic source, but plutonic and sedimentary sources are also indicated.
CENOZOIC SEDIMENTARY ROCKS
The early Cenozoic sequence (ca. 50-65 Ma) includes the Arkose Ridge, Chickaloon, West Foreland, and Wishbone Formations (fig. 37). The late Cenozoic sequence (ca. 0-30 Ma) includes the Kenai Group (Hemlock Conglomerate and Tyonek, Beluga, and Sterling Formations) and Quaternary rocks.
Lower Cenozoic Rocks Arkose Ridge and Chickaloon Formations
The Arkose Ridge Formation crops out north of the Castle Mountain fault north of the Matanuska Valley. The age of this unit has not been established, but it is considered Late Cretaceous by Csejtey and others (1977) and Early and Late(?) Cretaceous by Grantz and Wolfe (1961) and Paleocene by Magoon and others (1976b) (fig. 38). The outcrops of the Arkose Ridge have not been correlated with the subsurface units, so at present it cannot be considered a regional unit.
The Chickaloon Formation, Paleocene in age (Magoon and others, 1976b), consists of volcanic lithic sandstone, siltstone, and coal. The Chickaloon crops out south of the Castle Mountain fault in the Matanuska Valley and can be correlated into the subsurface from here to west of the Susitna River (Alaska Geological Society, 1969c, 1970a, b). The Chickaloon is of regional importance inasmuch as it extends into the subsurface and is compositionally similar to and correlates, in part, with the West Foreland and Wishbone Formations.
Sandstone from the Arkose Ridge and Chickaloon Formations are feldspathic and feldspatholithic, respectively. Average modal sandstone compositions from the Arkose Ridge Formation are Q 37F57L6 (Winkler, 1978) and Q22F68L10 (Clardy, 1974), whereas average modal compositions from the Chickaloon Formation are Q28F20L52
(Winkler, 1978) and Q30F22L48 (Clardy, 1974). Arkose Ridge sandstone compositions reflect the composition of granitic and local metamorphic rocks that are directly below stratigraphically whereas the sandstone compositions of the Chickaloon Formation indicate a volcanic source in part, however the sandstones also contain a heavy mineral population high in epidote and garnet that partly reflects a metamorphic source terrane (Kirschner and Lyon, 1973; Clardy, 1974).
Both the Arkose Ridge and Chickaloon Formations have moderate amounts of quartz and low pofycrystalline quartz to total quartz ratios, however polycrystalline quartz in Chickaloon samples, which is three to four times more abundant than in samples from the Arkose Ridge Formation, may be silicified volcanic rock fragments.
Plagioclase to total feldspar ratios, which are moderate to high, indicate that most of the feldspar is plagioclase, but as much as 28 percent of the feldspar is K-feldspar in both units (Clardy, 1974). Volcanic lithic to total lithic fragment ratios are low to moderate in the Arkose Ridge Formation and high in the Chickaloon Formation, and total lithic fragments are much higher in the Chickaloon Formation than in the Arkose Ridge Formation.
West Foreland and Wishbone Formations
The type section of the West Foreland Formation, as designated by Calderwood and Fackler (1972), is the section
Framework Geology and Sandstone Composition 83
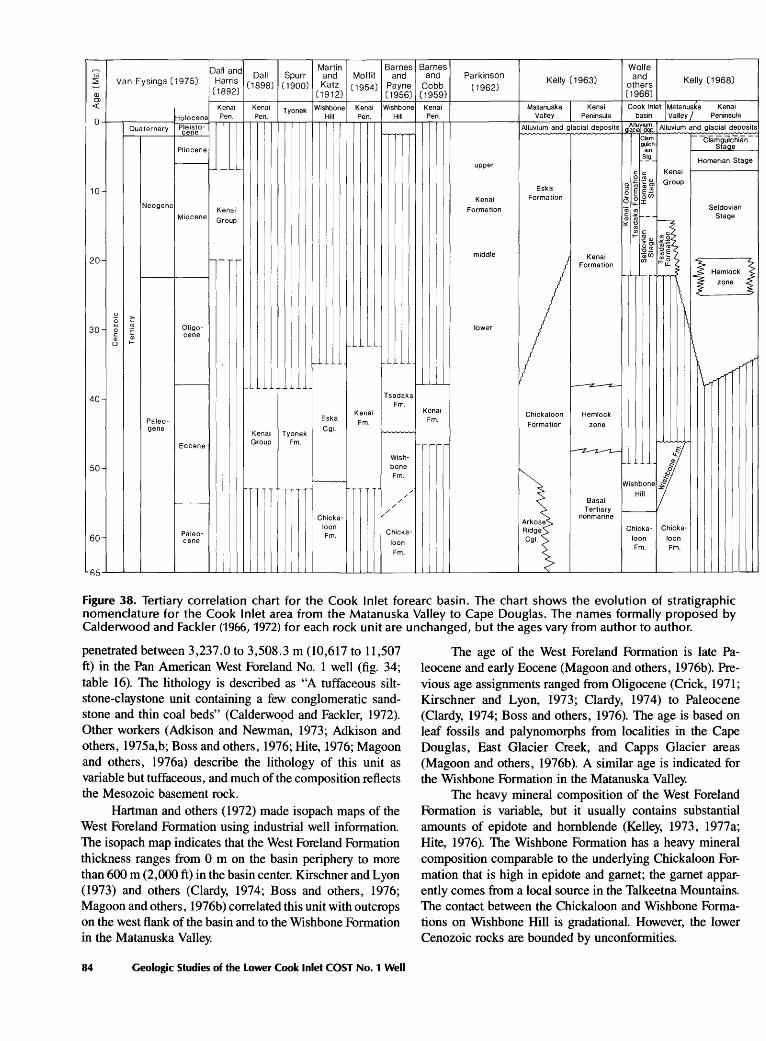
Dall and Dall Spurr Van Eysinga (1975) Harns c1898) c1900)
(1892)
Martin Barnes Barnes and Moffit and and Katz (1954) Payne Cobb
(1912) (1956) (1959)
Parkinson (1962)
Kelly (1963)
Wolfe and
others (1966)
Kelly (1968)
Q) Ol <( Kenai Kenai Wishbone Kenai Wishbone Kenai Matanuska Kenai Cook Inlet IMatanuska Kenai
Pen. Pen. Tyonek Hill Pen. Hill Pen. Valley Peninsula basin I Valley J Peninsula 04--r-Q-ua-te-r-na-ry~H~~~~~s~c~~~~e~~rl-.r~~~~~~rl-~~+----+~~rl----------+-AI-Iuv-iu_m_a-nd~gla-c-ia-ld-e-po-s-its+_•~~,~~~~Y~~~~-'A~IIu-vi-um~aLn-d-gl-ac-ia-l-de-p-os~its
cene ,.-,..... Clam- t- Clamgulchian
10
20
30
40
50
60
Neogene
Paleogene
Pliocene
Miocene
Oligocene
Eocene
Paleocene
Kenai Group
h-
l Kenai Group
Tyonek Fm.
Eska
Cgl.
~
Kenai Fm.
Ch"k'- I loon Fm.
Tsadaka Fm.
/
Wishbone Fm.
/
/ /
/
Chicka
loon Fm.
Kenai Fm.
' --
upper
Kenai
Formation
middle
lower
Eska Formation
Chickaloon Formation
Arkose Ridge Cgl.
Kenai Formation
Hemlock
zone
Basal Tertiary
nonmarine
g~~~h Staoe 8.!.9:... Homerian Stage
Kenai
Group
\ 1\
1\
~ >-
w;>hb.J l Hill r
t----
Chicka- Chicka-
loon loon Fm. Fm.
Seldovian Stage
1\~
Hemlock
zone
Figure 38. Tertiary correlation chart for the Cook Inlet forearc basin. The chart shows the evolution of stratigraphic nomenclature for the Cook Inlet area from the Matanuska Valley to Cape Douglas. The names formally proposed by Calderwood and Fackler (1966, 1972) for each rock unit are unchanged, but the ages vary from author to author.
penetrated between 3,237.0 to 3,508.3 m (10,617 to 11,507 ft) in the Pan American West Foreland No. 1 well (fig. 34; table 16). The lithology is described as "A tuffaceous siltstone-claystone unit containing a few conglomeratic sandstone and thin coal beds" (Calderwo9d and Fackler, 1972). Other workers (Adkison and Newman, 1973; Adkison and others, 1975a,b; Boss and others, 1976; Rite, 1976; Magoon and others, 1976a) describe the lithology of this unit as variable but tuffaceous, and much of the composition reflects the Mesozoic basement rock.
Hartman and others (1972) made isopach maps of the West Foreland Formation using industrial well information. The isopach map indicates that the West Foreland Formation thickness ranges from 0 m on the basin periphery to more than 600 m (2,000 ft) in the basin center. Kirschner and Lyon (1973) and others (Clardy, 1974; Boss and others, 1976; Magoon and others, 1976b) correlated this unit with outcrops on the west flank of the basin and to the Wishbone Formation in the Matanuska Valley.
84 Geologic Studies of the Lower Cook Inlet COST No.1 Well
The age of the West Foreland Formation is late Paleocene and early Eocene (Magoon and others, 1976b). Previous age assignments ranged from Oligocene (Crick, 1971; Kirschner and Lyon, 1973; Clardy, 1974) to Paleocene (Clardy, 1974; Boss and others, 1976). The age is based on leaf fossils and palynomorphs from localities in the Cape Douglas, East Glacier Creek, and Capps Glacier areas (Magoon and others, 1976b). A similar age is indicated for the Wishbone Formation in the Matanuska Valley.
The heavy mineral composition of the West Foreland Formation is variable, but it usually contains substantial amounts of epidote and hornblende (Kelley, 1973, 1977a; Rite, 1976). The Wishbone Formation has a heavy mineral composition comparable to the underlying Chickaloon Formation that is high in epidote and garnet; the garnet apparently comes from a local source in the Talkeetna Mountains. The contact between the Chickaloon and Wishbone Formations on Wishbone Hill is gradational. However, the lower Cenozoic rocks are bounded by unconformities.
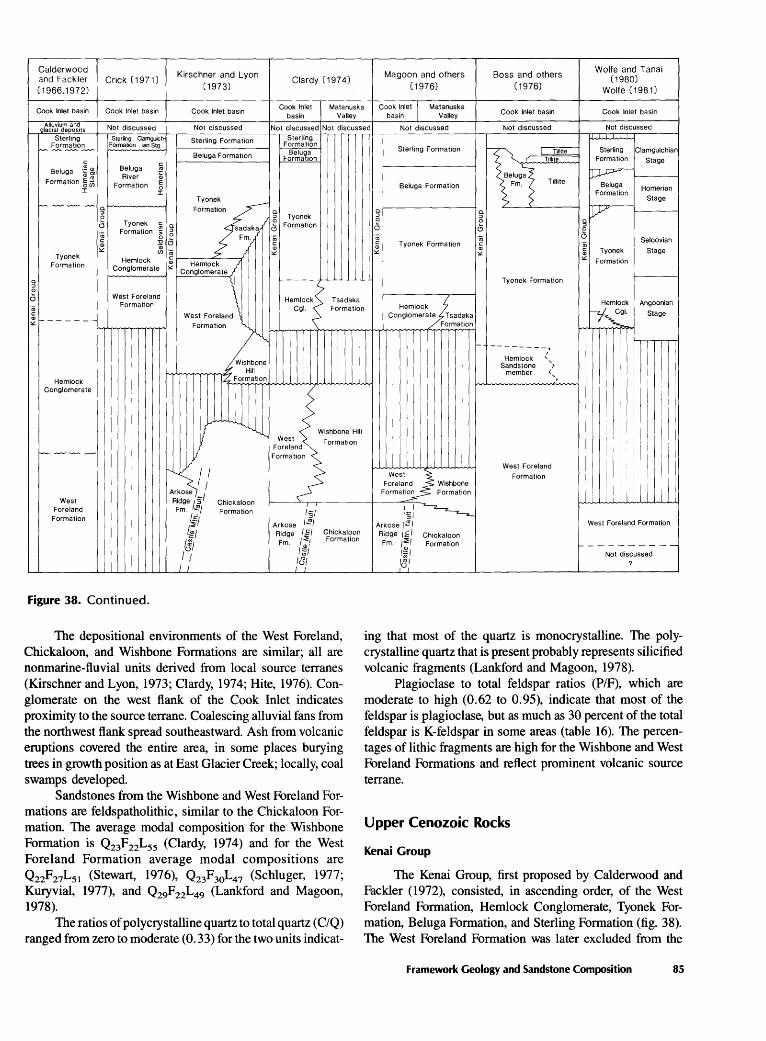
Calderwood and Fackler Crick (1971) ( 1966, 1972)
Kirschner and Lyon (1973)
Clardy (1974) Magoon and others
(1976) Boss and others
(1976)
Wolfe and Tanai (1980)
Wolfe (1981)
Cook Inlet basin Cook Inlet basin Cook Inlet basin Cook Inlet
basin Matanuska
Valley Cook Inlet I Matanuska
basin Valley Cook Inlet basin Cook Inlet basin
Alluvium and glacial deposits Not discussed Not discussed Not discussed Not discussed Not discussed Not discussed Not discussed
Sterling Formation
---~~~
c:
Beluga ·~ ~ Formation ~ ~
J:
Sterling ClamgulchFormation ian Stg
Beluga ~ ·;:
Fo~~:;ion ~ J:
Sterling Formation
Beluga Formation
Tyonek ~ ~ ~ ~ g. 1------~--1
Form~aion ~
Tyonek Formation
0
c'5 ·~ :.::
Tyonek ~ a. sadaky CJ FormatiOn ·~ ~ Fm.l ·c:;;;
:2 C)
~ ·Q)~ I ~ Hemlock r---H-em-1-oc~k---7'/
Conglomerate :.:: Conglomerate A
Sterling Formation
Beluga Formation
Tyonek Formation
----~
rf~ Sterling Clamgulchian
Tillite Formation Stage
,;'1 nn" ~
Beluga Homerian Formation
Stage
Sterling Formation
Beluga Formation
g. g.v 0
c'5 0
-~ c'5 Seldovian
:.:: ·~ Tyonek Stage
-~ Tyonek Formation :.::
:.:: Formation
Tyonek Formation
West Foreland Formation
~ West Foreland \
Hemlock Cgl.
Tsadaka Formation Hemlock~; Hemlock Angoonian
~· Stage
Hemlock Conglomerate
West Foreland Formation
Figure 38. Continued.
Formation "-
Wishbone r.-,...<.,.....,..."1""'1...,......""""~c-,if" Hill
L. Formation
I "'~,Y If
I I Arkose Ridge l::gl Chickaloon Fm. J!!l Formation
~/ lgt
'8t II
L!
West Foreland Formation
I I
I'§/ Arkose /J!!f Ridge IS/ Fm. 1!1
It;/ ICJI J_j_
Wishbone Hill
Formation
Chickaloon Formation
The depositional environments of the West Foreland, Chickaloon, and Wishbone Formations are similar; all are nonmarine-fluvial units derived from local source terranes (Kirschner and Lyon~ 1973; Clardy, 1974; Rite, 1976). Conglomerate on the west flank of the Cook Inlet indicates proximity to the source terrane. Coalescing alluvial fans from the northwest flank spread southeastward. Ash from volcanic eruptions covered the entire area, in some places burying trees in growth position as at East Glacier Creek; locally, coal swamps developed.
Sandstones from the Wishbone and West Foreland Formations are feldspatholithic, similar to the Chickaloon Formation. The average modal composition for the Wishbone Formation is Q23F22L55 (Clardy, 1974) and for the West Foreland Formation average modal compositions are Q22F27L51 (Stewart, 1976), Q23F30L47 (Schluger, 1977; Kuryvial, 1977), and Q29F22L49 (Lankford and Magoon, 1978).
The ratios of polycrystalline quartz to total quartz (C/Q) ranged from zero to moderate (0. 33) for the two units indicat-
Conglomerate Tsadaka Formation
West ~ Foreland 5: Wishbone Formati~ Formation
13!~ Arkose 1~1 Ridge IE I Chickaloon Fm. 1::;;1 Formation
I~ I l:gl u,
West Foreland
Forma lion
I! I
West Foreland Formation
----------Not discussed
ing that most of the quartz is monocrystalline. The polycrystalline quartz that is present probably represents silicified volcanic fragments (Lankford and Magoon, 1978).
Plagioclase to total feldspar ratios (P/F), which are moderate to high (0.62 to 0.95), indicate that most of the feldspar is plagioclase, but as much as 30 percent of the total feldspar is K-feldspar in some areas (table 16). The percentages of lithic fragments are high for the Wishbone and West Foreland Formations and reflect prominent volcanic source terrane.
Upper Cenozoic Rocks
Kenai Group
The Kenai Group, first proposed by Calderwood and Fackler (1972), consisted, in ascending order, of the West Foreland Formation, Hemlock Conglomerate, Tyonek Formation, Beluga Formation, and Sterling Formation (fig. 38). The West Foreland Formation was later excluded from the
Framework Geology and Sandstone Composition 85
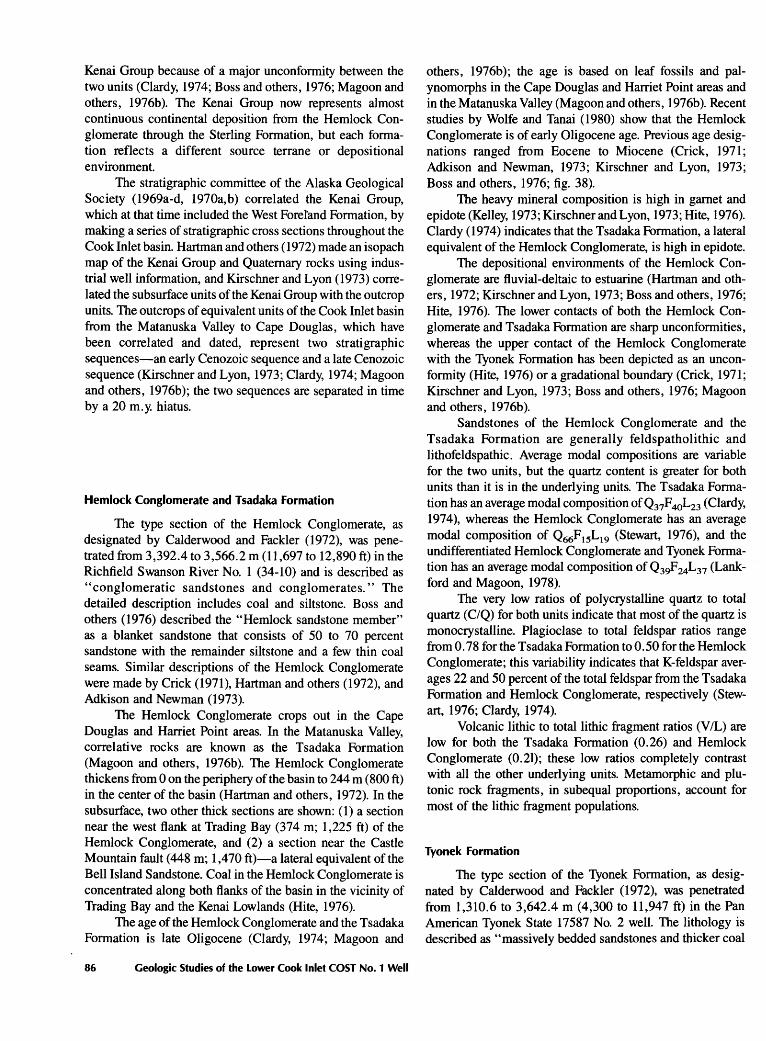
Kenai Group because of a major unconformity between the two units (Clardy, 1974; Boss and others, 1976; Magoon and others, 1976b). The Kenai Group now represents almost continuous continental deposition from the Hemlock Conglomerate through the Sterling Formation, but each formation reflects a different source terrane or depositional environment.
The stratigraphic committee of the Alaska Geological Society (l969a-d, 1970a,b) correlated the Kenai Group, which at that time included the West Foretand Formation, by making a series of stratigraphic cross sections throughout the Cook Inlet basin. Hartman and others (1972) made an isopach map of the Kenai Group and Quaternary rocks using industrial well information, and Kirschner and Lyon (1973) correlated the subsurface units of the Kenai Group with the outcrop units. The outcrops of equivalent units of the Cook Inlet basin from the Matanuska Valley to Cape Douglas, which have been correlated and dated, represent two stratigraphic sequences-an early Cenozoic sequence and a late Cenozoic sequence (Kirschner and Lyon, 1973; Clardy, 1974; Magoon and others, 1976b); the two sequences are separated in time by a 20 m. y. hiatus.
Hemlock Conglomerate and Tsadaka Formation
The type section of the Hemlock Conglomerate, as designated by Calderwood and Fackler (1972), was penetrated from 3,392.4 to 3,566.2 m (11,697 to 12,890 ft) in the Richfield Swanson River No. 1 (34-10) and is described as "conglomeratic sandstones and conglomerates." The detailed description includes coal and siltstone. Boss and others (1976) described the "Hemlock sandstone member" as a blanket sandstone that consists of 50 to 70 percent sandstone with the remainder siltstone and a few thin coal seams. Similar descriptions of the Hemlock Conglomerate were made by Crick (1971), Hartman and others (1972), and Adkison and Newman (1973).
The Hemlock Conglomerate crops out in the Cape Douglas and Harriet Point areas. In the Matanuska Valley, correlative rocks are known as the Tsadaka Formation (Magoon and others, 1976b). The Hemlock Conglomerate thickens from 0 on the periphery of the basin to 244m (800ft) in the center of the basin (Hartman and others, 1972). In the subsurface, two other thick sections are shown: (1) a section near the west flank at Trading Bay (374 m; 1,225 ft) of the Hemlock Conglomerate, and (2) a section near the Castle Mountain fault (448 m; 1,470 ft)-a lateral equivalent of the Bell Island Sandstone. Coal in the Hemlock Conglomerate is concentrated along both flanks of the basin in the vicinity of Trading Bay and the Kenai Lowlands (Hite, 1976).
The age of the Hemlock Conglomerate and the Tsadaka Formation is late Oligocene (Clardy, 1974; Magoon and
86 Geologic Studies of the Lower Cook Inlet COST No. 1 Well
others, 1976b); the age is based on leaf fossils and palynomorphs in the Cape Douglas and Harriet Point areas and in the Matanuska Valley (Magoon and others, 1976b). Recent studies by Wolfe and Tanai (1980) show that the Hemlock Conglomerate is of early Oligocene age. Previous age designations ranged from Eocene to Miocene (Crick, 1971; Adkison and Newman, 1973; Kirschner and Lyon, 1973; Boss and others, 1976; fig. 38).
The heavy mineral composition is high in garnet and epidote (Kelley, 1973; Kirschner and Lyon, 1973; Hite, 1976). Clardy (1974) indicates that the Tsadaka Formation, a lateral equivalent of the Hemlock Conglomerate, is high in epidote.
The depositional environments of the Hemlock Conglomerate are fluvial-deltaic to estuarine (Hartman and others, 1972; Kirschner and Lyon, 1973; Boss and others, 1976; Hite, 1976). The lower contacts of both the Hemlock Conglomerate and Tsadaka Formation are sharp unconformities, whereas the upper contact of the Hemlock Conglomerate with the Tyonek Formation has been depicted as an unconformity (Hite, 1976) or a gradational boundary (Crick, 1971; Kirschner and Lyon, 1973; Boss and others, 1976; Magoon and others, 1976b).
Sandstones of the Hemlock Conglomerate and the Tsadaka Formation are generally feldspatholithic and lithofeldspathic. Average modal compositions are variable for the two units, but the quartz content is greater for both units than it is in the underlying units. The Tsadaka Formation has an average modal composition of Q37F 40L23 (Clardy, 197 4 ), whereas the Hemlock Conglomerate has an average modal composition of Q66F15L19 (Stewart, 1976), and the undifferentiated Hemlock Conglomerate and Tyonek Formation has an average modal composition of Q39F24L37 (Lankford and Magoon, 1978).
The very low ratios of polycrystalline quartz to total quartz (C/Q) for both units indicate that most of the quartz is monocrystalline. Plagioclase to total feldspar ratios range from 0. 78 for the Tsadaka Formation to 0. 50 for the Hemlock Conglomerate; this variability indicates that K-feldspar averages 22 and 50 percent of the total feldspar from the Tsadaka Formation and Hemlock Conglomerate, respectively (Stewart, 1976; Clardy, 1974).
Volcanic lithic to total lithic fragment ratios (V/L) are low for both the Tsadaka Formation (0.26) and Hemlock Conglomerate (0.21); these low ratios completely contrast with all the other underlying units. Metamorphic and plutonic rock fragments, in subequal proportions, account for most of the lithic fragment populations.
Tyonek Formation
The type section of the Tyonek Formation, as designated by Calderwood and Fackler (1972), was penetrated from 1,310.6 to 3,642.4 m (4,300 to 11,947 ft) in the Pan American Tyonek State 17587 No. 2 well. The lithology is described as "massively bedded sandstones and thicker coal
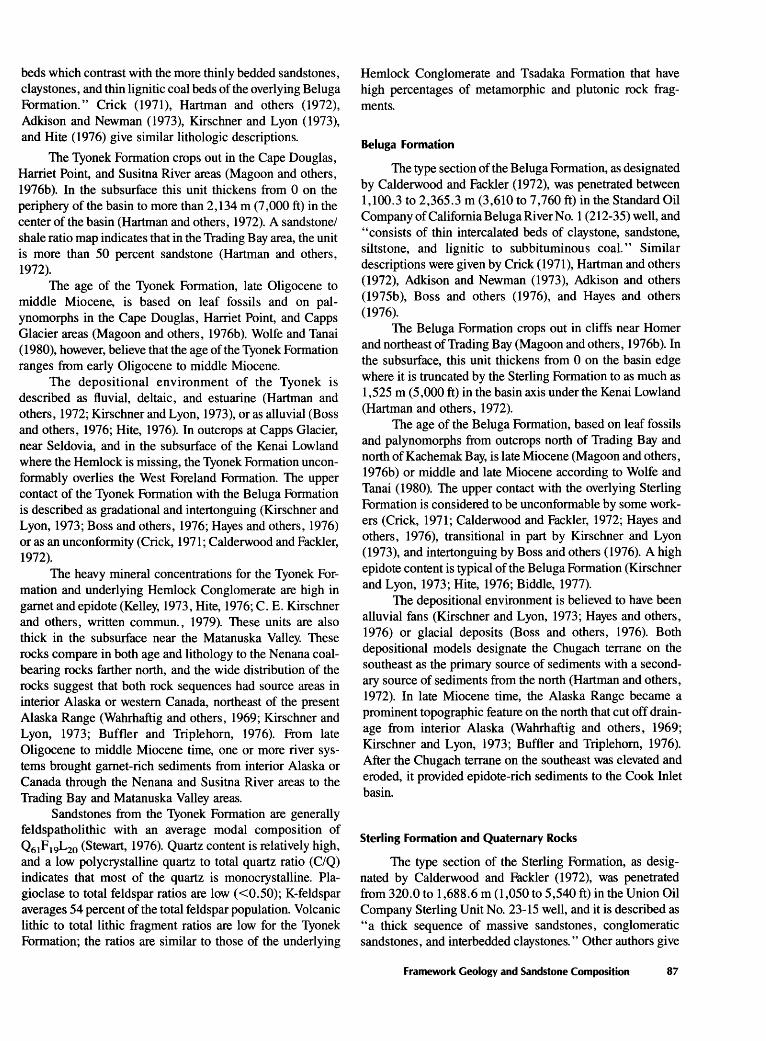
beds which contrast with the more thinly bedded sandstones, claystones, and thin lignitic coal beds of the overlying Beluga Formation." Crick (1971), Hartman and others (1972), Adkison and Newman (1973), Kirschner and Lyon (1973), and Rite (1976) give similar lithologic descriptions.
The Tyonek Formation crops out in the Cape Douglas, Harriet Point, and Susitna River areas (Magoon and others, 1976b). In the subsurface this unit thickens from 0 on the periphery of the basin to more than 2,134 m (7,000 ft) in the center of the basin (Hartman and others, 1972). A sandstone/ shale ratio map indicates that in the Trading Bay area, the unit is more than 50 percent sandstone (Hartman and others, 1972).
The age of the Tyonek Formation, late Oligocene to middle Miocene, is based on leaf fossils and on palynomorphs in the Cape Douglas, Harriet Point, and Capps Glacier areas (Magoon and others, 1976b). Wolfe and Tanai ( 1980), however, believe that the age of the Tyonek Formation ranges from early Oligocene to middle Miocene.
The depositional environment of the Tyonek is described as fluvial, deltaic, and estuarine (Hartman and others, 1972; Kirschner and Lyon, 1973), or as alluvial (Boss and others, 1976; Rite, 1976). In outcrops at Capps Glacier, near Seldovia, and in the subsurface of the Kenai Low land where the Hemlock is missing, the Tyonek Formation unconformably overlies the West Foreland Formation. The upper contact of the Tyonek Formation with the Beluga Formation is described as gradational and intertonguing (Kirschner and Lyon, 1973; Boss and others, 1976; Hayes and others, 1976) or as an unconformity (Crick, 1971; Calderwood and Fackler, 1972).
The heavy mineral concentrations for the Tyonek Formation and underlying Hemlock Conglomerate are high in garnet and epidote (Kelley, 1973, Rite, 1976; C. E. Kirschner and others, written commun., 1979). These units are also thick in the subsurface near the Matanuska Valley. These rocks compare in both age and lithology to the Nenana coalbearing rocks farther north, and the wide distribution of the rocks suggest that both rock sequences had source areas in interior Alaska or western Canada, northeast of the present Alaska Range (Wahrhaftig and others, 1969; Kirschner and Lyon, 1973; Buffler and Triplehorn, 1976). From late Oligocene to middle Miocene time, one or more river systems brought garnet-rich sediments from interior Alaska or Canada through the Nenana and Susitna River areas to the Trading Bay and Matanuska Valley areas.
Sandstones from the Tyonek Formation are generally feldspatholithic with an average modal composition of Q6IF19L20 (Stewart, 1976). Quartz content is relatively high, and a low polycrystalline quartz to total quartz ratio (C/Q) indicates that most of the quartz is monocrystalline. Plagioclase to total feldspar ratios are low ( <0.50); K-feldspar averages 54 percent of the total feldspar population. Volcanic lithic to total lithic fragment ratios are low for the Tyonek Formation; the ratios are similar to those of the underlying
Hemlock Conglomerate and Tsadaka Formation that have high percentages of metamorphic and plutonic rock fragments.
Beluga Formation
The type section of the Beluga Formation, as designated by Calderwood and Fackler (1972), was penetrated between 1,100.3 to 2,365.3 m (3,610 to 7,760 ft) in the. Standard Oil CompanyofCaliforniaBelugaRiverNo. 1 (212-35) well, and "consists of thin intercalated beds of claystone, sandstone, siltstone, and lignitic to sub bituminous coal." Similar descriptions were given by Crick (1971), Hartman and others (1972), Adkison and Newman (1973), Adkison and others (1975b), Boss and others (1976), and Hayes and others (1976).
The Beluga Formation crops out in cliffs near Homer and northeast of Trading Bay (Magoon and others, 1976b). In the subsurface, this unit thickens from 0 on the basin edge where it is truncated by the Sterling Formation to as much as 1,525 m (5,000 ft) in the basin axis under the Kenai Lowland (Hartman and others, 1972).
The age of the Beluga Formation, based on leaf fossils and palynomorphs from outcrops north of Trading Bay and north of Kachemak Bay, is late Miocene (Magoon and others, 1976b) or middle and late Miocene according to Wolfe and Tanai (1980). The upper contact with the overlying Sterling Formation is considered to be unconformable by some workers (Crick, 1971; Calderwood and Fackler, 1972; Hayes and others, 1976), transitional in part by Kirschner and Lyon (1973), and intertonguing by Boss and others (1976). A high epidote content is typical of the Beluga Formation (Kirschner and Lyon, 1973; Rite, 1976; Biddle, 1977).
The depositional environment is believed to have been alluvial fans (Kirschner and Lyon, 1973; Hayes and others, 1976) or glacial deposits (Boss and others, 1976). Both depositional models designate the Chugach terrane on the southeast as the primary source of sediments with a secondary source of sediments from the north (Hartman and others, 1972). In late Miocene time, the Alaska Range became a prominent topographic feature on the north that cut off drainage from interior Alaska (Wahrhaftig and others, 1969; Kirschner and Lyon, 1973; Buffter and Triplehorn, 1976). After the Chugach terrane on the southeast was elevated and eroded, it provided epidote-rich sediments to the Cook Inlet basin.
Sterling Formation and Quaternary Rocks
The type section of the Sterling Formation, as designated by Calderwood and Fackler (1972), was penetrated from 320.0 to 1,688.6 m (1,050 to 5,540 ft) in the Union Oil Company Sterling Unit No. 23-15 well, and it is described as "a thick sequence of massive sandstones, conglomeratic sandstones, and interbedded claystones." Other authors give
Framework Geology and Sandstone Composition 87
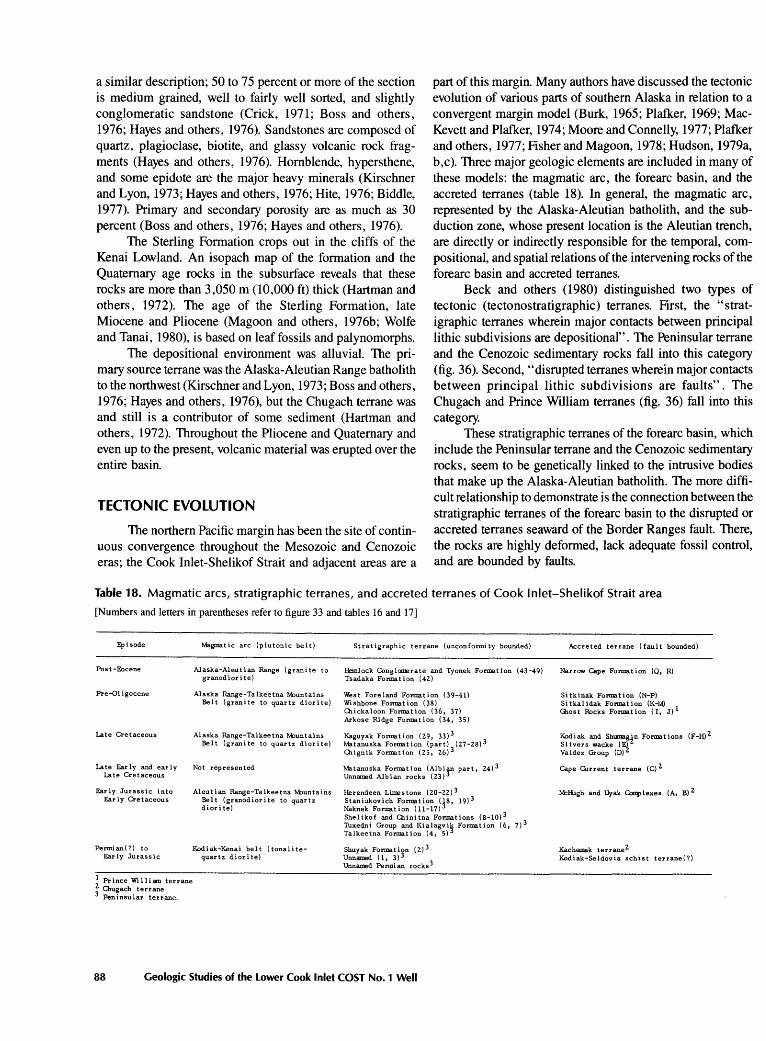
a similar description; 50 to 75 percent or more of the section is medium grained, well to fairly well sorted, and slightly conglomeratic sandstone (Crick, 1971; Boss and others, 1976; Hayes and others, 1976). Sandstones are composed of quartz, plagioclase, biotite, and glassy volcanic rock fragments (Hayes and others, 1976). Hornblende, hypersthene, and some epidote are the major heavy minerals (Kirschner and Lyon, 1973; Hayes and others, 1976; Hite, 1976; Biddle, 1977). Primary and secondary porosity are as much as 30 percent (Boss and others, 1976; Hayes and others, 1976).
The Sterling Formation crops out in the cliffs of the Kenai Lowland. An isopach map of the formation and the Quaternary age rocks in the subsurface reveals that these rocks are more than 3,050 m (10,000 ft) thick (Hartman and others, 1972). The age of the Sterling Formation, late Miocene and Pliocene (Magoon and others, 1976b; Wolfe and Tanai, 1980), is based on leaf fossils and palynomorphs.
The depositional environment was alluvial. The primary source terrane was the Alaska-Aleutian Range batholith to the northwest (Kirschner and Lyon, 1973; Boss and others, 1976; Hayes and others, 1976), but the Chugach terrane was and still is a contributor of some sediment (Hartman and others, 1972). Throughout the Pliocene and Quaternary and even up to the present, volcanic material was erupted over the entire basin.
TECTONIC EVOLUTION
The northern Pacific margin has been the site of continuous convergence throughout the Mesozoic and Cenozoic eras; the Cook Inlet-Shelikof Strait and adjacent areas are a
part of this margin. Many authors have discussed the tectonic evolution of various parts of southern Alaska in relation to a convergent margin model (Burk, 1965; Plafker, 1969; MacKevett and Plafker, 1974; Moore and Connelly, 1977; Plafker and others, 1977; Fisher and Magoon, 1978; Hudson, 1979a, b,c). Three major geologic elements are included in many of these models: the magmatic arc, the forearc basin, and the accreted terranes (table 18). In general, the magmatic arc, represented by the Alaska-Aleutian batholith, and the subduction zone, whose present location is the Aleutian trench, are directly or indirectly responsible for the temporal, compositional, and spatial relations of the intervening rocks of the forearc basin and accreted terranes.
Beck and others (1980) distinguished two types of tectonic (tectonostratigraphic) terranes. First, the "stratigraphic terranes wherein major contacts between principal lithic subdivisions are depositional". The Peninsular terrane and the Cenozoic sedimentary rocks fall into this category (fig. 36). Second, "disrupted terranes wherein major contacts between principal lithic subdivisions are faults". The Chugach and Prince William terranes (fig. 36) fall into this category.
These stratigraphic terranes of the forearc basin, which include the Peninsular terrane and the Cenozoic sedimentary rocks, seem to be genetically linked to the intrusive bodies that make up the Alaska-Aleutian batholith. The more difficult relationship to demonstrate is the connection between the stratigraphic terranes of the forearc basin to the disrupted or accreted terranes seaward of the Border Ranges fault. There, the rocks are highly deformed, lack adequate fossil control, and are bounded by faults.
Table 18. Magmatic arcs, stratigraphic terranes, and accreted terranes of Cook lnlet-Shelikof Strait area
[Numbers and letters in parentheses refer to figure 33 and tables 16 and 17]
Episode
Post-Eocene
Pre-01 igocene
Late Cretaceous
Late Early and early Late Cretaceous
Early Jurassic into Early Cretaceous
Permian(?) to Early Jurassic
Magmatic arc (plutonic belt)
Alaska-Aleutian Range (granite to granodior i tel
Alaska Range-Talkeetna Mmntains Belt (granite to quartz diorite)
Alaska Range-Talkeetna Mmntains Belt (granite to quartz diorite)
Not represented
Aleut ian Range-Talkeetna M>untains Belt (granodiorite to quartz diorite)
Kodiak-Kenai belt (tonalitequartz dior i tel
1 Prince William terrane 2. Olugach terrane 3 Peninsular terraneo_
Stratigraphic terrane (unconformity bounded)
Hemlock Conglomerate and Tyonek Format ion (43-49) Tsadaka Format ion (42.)
West Foreland Formation (39-41) Wishbone Formation (38) Olickaloon Formation (36, 37) Arkose Ridge Formation (34, 35)
Kaguyak Formation (2.9, 33)3 Matanuska Formation (part) (2.7-2.8)3 Olignik Formation (2.5, 2.6)3
Matanuska Format ion (Albian part, 2.4) 3 Unnamed Albian rocks (2.3)3
Herendeen Limestone (2.0-2.2.)3 Staniukovich Formation q8, 19)3 Naknek Formation (11-17) Shelikof and Olinitna Formations (8-10)3 Thxedni Group and Kialagvik Format ion (6, 7) 3
Talkeetna Format ion (4, 5) 3
Shuyak Formation (2.)3 Unnamed ( 1, 3) 3 Unnamed Permian rocks3
88 Geologic Studies of the Lower Cook Inlet COST No. 1 Well
Accreted terrane (fault bounded)
Narrow Cape Format ion (Q, R)
Si tkinak Format ion (N-P) Sitkalidak Formation (K-M) Glast Rocks Formation (1, J)l
Kodiak and Shumagin Format ions (F-H) Z Slivers wacke (E~ Valdez Group (D)
Cape Current terrane (C) Z
M:Hlgh and Uyak Ca!Iplexes (A, B) Z
Kachemak terranez Kodiak-Seldovia schist terrane(?)
Paleomagnetic data from both the stratigraphic and disrupted terranes strongly suggest that southern Alaska is a conglomeration of terranes that originated in a more southerly latitude and subsequently moved north to finally collide or accrete in southern Alaska (Packer and Stone, 1974; Jones and others, 1977; Hillhouse, 1977; Stone, 1979). The petrographic data and depositional history of the sandstones in the Cook Inlet basin and adjacent terranes do not preclude this interpretation, but the Cook Inlet evidence does constrain the interpretation. For example, sandstones in the Cook Inlet basin and from adjacent accreted terranes that are of the same age and composition as the sandstones of southern Alaska may well have had the same source areas. However, we feel that the terranes of southern Alaska need not have evolved in their present location, and therefore they are not necessarily in conflict with the paleomagnetic data.
The development of the magmatic arc, the forearc basin (stratigraphic terrane), and accreted terrane (disrupted terrane of the Cook Inlet-Shelikof Strait and adjacent areas) can be discussed in terms of the tectonic cycle. Each cycle represents one episode in the development of the crust adjacent to this convergent margin (Hudson, this volume); each succeeding episode affects the crust landward of the trench. The crust, which ranged from near oceanic to continental in composition, evolved in six episodes that took place over the following time span: (1) Permian(?) through Early Jurassic; (2) Early Jurassic into Early Cretaceous; (3) late Early and early Late(?) Cretaceous; (4) Late Cretaceous; (5) early Cenozoic, and (6) late Cenozoic. The rocks of episodes 1 and 2, and 4 and 5 may overlap temporally, but they are different geologically, whereas the rocks of episode 3 are different temporally but are poorly represented geologically.
According to this model, a complete tectonic cycle goes through three stages of development; first, plutonism and volcanism construct a magmatic arc along a convergent margin; second, the tectonic forces associated with the convergent margin and magmatic arc interact to form the outer arc ridge, shelf, slope, trench, and abyssal plain. Finally uplift and erosion dissect the magmatic arc and the outer arc ridge, and the eroded sediments fill the arc basins, shelf, slope, and trench, and then spill onto the abyssal plain. Throughout the cycle, tectonism, magmatism, and sedimentation proceed at varying intensities. Present-day evidence for the existence of the cycle include: (1) a plutonic belt with radiometric age dates that correspond to the cycle; (2) evidence for coeval extrusive volcanic activity of calc-alkaline composition; (3) undeformed sedimentary rocks bounded by unconformities (stratigraphic terrane) whose provenance is the magmatic arc and whose age, from fossils or radiometric age dates, is similar to the plutonic belt, and ( 4) accreted (disrupted) terrane(s), bounded by faults, whose age based on fossils is no younger than the undeformed sedimentary rocks of the forearc basin and whose rocks were probably deformed towards the end of the cycle. The disrupted terrane need not evolve adjacent to nor be intimately associated with the
stratigraphic terrane. The time needed to complete a stage in the tectonic cycle is called an episode.
Permian(?) through Early Jurassic Episode
The first episode took place during the Triassic, but fossil evidence suggests it may have extended back into the Permian(?) and forward into the Early Jurassic. The magmatic arc is represented by the Kodiak-Kenai plutonic belt, the extrusive activity by the pillow basalts and greenstones, and the erosion of the volcanic terrane is shown by the lithicrich turbidite sandstones (numbers 1 through 3 on table 16 and fig. 33). Behind or adjacent to the arc, biothermal carbonate reefs were periodically inundated by volcanic agglomerates. The accretionary wedge may be represented by the Triassic rocks in Kachemak Bay or by the Kodiak-Seldovia schist terrane, but the latter rocks may not be related to the rocks of the accretionary wedge because the schist is presently defined as being inboard of the Border Ranges fault.
Early Jurassic into Early Cretaceous Episode
The second episode, which took place from Early Jurassic through Early Cretaceous, is the most complete, longest, and best understood. The magmatic arc is represented by the Aleutian Range-Talkeetna Mountain plutonic belt, the extrusive activity is represented by the volcanogenic Talkeetna Formation, and the unroofing of the magmatic arc is exquisitely shown by the change in composition of the sandstone (numbers 4 through 22 in table 16 and fig. 33) and conglomerate in the middle Jurassic through Lower Cretaceous sedimentary rocks of the Peninsular terrane. The change in sandstone composition compares closely with the magmatic arc provenance of Dickinson and Suczek (1979). The fault-bounded accretionary terrane may be represented by the McHugh and Uyak Complexes because its youngest age is Aptian. The compositions of the sandstone within this terrane are variable (letters A and B in table 17 and fig. 33), but the terrane is inadequately sampled. The rock sample from the Chugach Mountains is more quartz rich compared with the lithic content than any other rocks involved in this episode from the Peninsular terrane, but the rock samples from Kodiak Island do compare fairly well with rocks of the same age in the Peninsular terrane.
Late Early and Early Late(?) Cretaceous Episode
The third episode, which occurred during the late Early and early Late(?) Cretaceous, is poorly represented in the rock record. The middle Cretaceous plutons, which are located in the Nutzotin Mountain on the USA-Canadian border, probably are not represented in the immediate vicinity of the Cook Inlet; the only rocks in the forearc basin are lithicrich sandstones of Albian age (numbers 23 and 24 in table 16 and fig. 33). The accreted terrane is represented by the youn-
Framework Geology and Sandstone Composition 89
ger Cape Current terrane that occurs on the Shuyak and Afognak Islands which are questionably of Turonian-Santonian age (letter C in table 17 and fig. 33).
Late Cretaceous Episode
The fourth episode, which occurred during the Late Cretaceous, is well represented in the rock record and isolated by unconformities. Although the plutonic belt contains intrusive bodies of both ages, the Late Cretaceous episode is considered distinct from the early Cenozoic episode because a major unconformity occurs at the base of the early Cenozoic rocks. The unconformity at the Late Cretaceous-early Cenozoic boundary, the most important structural unconformity because the Mesozoic rocks were folded and truncated before the Cenozoic rocks were deposited, separates the two episodes. The magmatic arc is represented, in part, by the Alaska Range-Talkeetna Mountain plutonic belt of granite to quartz diorite composition. The composition of the Upper Cretaceous sandstone (numbers 30 and 32 in table 16 and fig. 33) reflects the reworking of the underlying feldspathic-rich rocks and deeply dissected magmatic arc of the second episode, but eventually the sandstone composition becomes more lithic rich high in the section. The primary extrusive volcanic rock of the Late Cretaceous may have been reworked into the lithic-rich sandstones in the upper part of the Kaguyak Formation in the COST No. 1 well (number 31 in table 16 and fig. 33) and in the Cape Douglas area (number 33 in table 16 and fig. 33). In general, Upper Cretaceous sandstones are more quartz rich than the underlying Mesozoic units (numbers 25 through 33 in table 16 and fig. 33). The accreted terrane contains sandstones ranging from those having few volcanic-lithic fragments (letter E in table 17 and fig. 33) to those having abundant volcanic-lithic fragments (letter Din table 17 and fig. 33). From a petrographic study of rock fragments from Upper Cretaceous sandstone of the Chugach terrane, Zuffa and others (1980) concluded that the sandstone was derived primarily from a volcanic arc with secondary inputs from a magmatic arc, a subduction complex and recycled sedimentary debris. To date (1981), the range in compositions of the sandstones in the forearc basin and accreted terrane does not preclude that the provenance is the
90 Geologic Studies of the Lower Cook Inlet COST No. 1 Well
same for both and that the accreted terrane may be farther from the source than the forearc basin.
Early Cenozoic Episode
The fifth episode, which occurred during the early Cenozoic, includes the same plutonic belt as the previous episode. These early Cenozoic stratigraphic units of the forearc basin unconformably overlie the Mesozoic rocks and the accreted terrane seaward of the Border Ranges fault. The composition of the sandstone is approximately 50 percent lithic (numbers 36 through 41 in table 16 and fig. 33) except for the Arkose Ridge Formation, which contains very few lithic fragments (numbers 34 and 35 in table 16 and fig. 33). The Ghost Rocks Formation of the accreted (Prince William) terrane, (letters I and J in table 17 and fig. 33), is very similar in composition to the lithic-rich sandstone. In addition, the Sitkalidak and Sitkinak Formations (letters K through P in table 17 and fig. 33 ), which are more quartz rich than the lithic-rich sandstone, also contain a lot of lithic material.
Late Cenozoic Episode
The last episode, which is still going on today, is demonstrated by the granitic to granodioritic plutonic rocks exposed in the Alaska Range and the stratigraphic terrane by the late Cenozoic Kenai Group; however, there is no evidence of an accretionary terrane. Provenance of the lower part of the Kenai Group sedimentary rocks in the forearc basin (numbers 42 through 45 in table 16 and fig. 33) is more quartz rich in the lower part than in the upper part; the plutonic body follows the same trend as the sedimentary rocks (Hudson, this volume). Heavy-mineral content (garnet and epidote) suggest that the provenance for the Hemlock Conglomerate and Tyonek Formation is from the interior of Alaska. High concentrations of epidote and volcanic-lithic fragments in the Beluga Formation suggest that the provenance is the Kenai Peninsula after the Alaska Range was uplifted. The provenance for the Sterling Formation and Quaternary rocks is probably the Alaska-Aleutian Range, and to a lesser degree, the Kenai Peninsula. Except for today's active volcanism, there is no evidence of a plutonic body with K-Ar age dates that correlate with the Kenai Group and Quaternary rocks.
Conclusions
By Leslie B. Magoon
1. The COST No. 1 well was drilled in 65 m (214ft) of water and penetrated 3,776 m (12,387 ft) of sedimentary rocks in the Alaska Outer Continental Shelf block 489 about midway between the Iniskin Peninsula on the northwest and the Kenai Peninsula on the southeast. The ages of the sedimentary units were determined by wireline logs and the classification of Foraminifera, Radiolaria, calcareous nannoplankton, and marine and terrestrial palynomorphs. The section from 413 m (1 ,356ft) to 797 m (2,615 ft) is Cenozoic. The underlying section, from 797 m (2,615 ft) to 2,112 m (6,930 ft), is Cretaceous; at 1,541 m (5,055 ft) the section is divided into Upper and Lower Cretaceous rocks. The bottom section, from 2,112 m (6,930 ft) to 3,775.6 m (12,387 ft), is Upper Jurassic (Oxfordian through Tithonian). The base of this section probably was not penetrated so the 1,663 m (5,455 ft) thickness is probably a minimum. The top of this unit is controversial. Drill cutting samples indicate that the top is at 2,109 m (6,918 ft), 2,112 m (6,928 ft), or 2,135 m (7 ,003 ft). Paleontologic evidence indicates that the top is at 2,109 m (6,918 ft) or 2,417 m (7,928 ft). I place the top at 2,112 m (6,928 ft), just below the abundant Inoceramus fragments and just above the first occurrence of laumontite.
The West Foreland Formation, of lower Cenozoic age, extends down to 797 m (2,615 ft). The sediments are sandstone, siltstone, coal, and some conglomerate. Modal analyses of the sandstone indicate that it is feldspatholithic with an average composition of Q23F30L47 . The Kaguyak Formation (Upper Cretaceous), from 797 m (2,615 ft) to 1,541 m (5,055 ft) contains marine and nonmarine sediments. The feldspathic sandstone has an average composition of Q23F61L16 . The Herendeen Limestone (Lower Cretaceous) contains sandstone, siltstone, shale, and abundant Inoceramus fragments from 1,541 m (5,055 ft) to 2,122 m (6,930 ft). The lithofeldspathic sandstone has an average composition of Q36F 44L20 . The bottom section, the Naknek Formation (Upper Jurassic), down to 3,776 m (12,387 ft), is dominantly siltstone, shale, and sandstone. The average composition of the lithofeldspathic sandstone is Q24F 55L21 .
The West Foreland Formation, the shallowest unit sampled, has a minimum thickness of 384 m (1 ,259 ft). Paleontologic data indicate Mesozoic rocks were reworked into a nonmarine environment. The organic carbon content of the unit is low and the section is thermally immature. No hydrocarbon shows were indicated. The Kaguyak Formation is 744 m (2,440 ft) thick and includes three sandstone bodies that are potential hydrocarbon reservoirs. Paleontologic and
lithologic evidence indicate two prograding sedimentary sequences that prograde seaward from upper bathyal to nonmarine. Although the organic carbon content is as much as 1.07 weight percent, the kerogen is low in oil-prone material and lacks an adequate thermal history to generate oil. Two different hydrocarbon shows were reported in this unit. The Herendeen Limestone is 572 m (1 ,875 ft) thick. Foraminiferal data indicate middle bathyal to inner neritic marine environments. The organic carbon content is low, and the thermal history is insufficient to generate hydrocarbons. Only a few hydrocarbon indications were reported. Reservoir properties of the sandstones are poor. The deepest rock unit penetrated, the Naknek Formation, is at least 1,663 m (5,457 ft) thick. Even though the rock is thoroughly cemented with laumontite, it contained most of the hydrocarbon shows. Since the strata, mostly sandstone and siltstone, is low in organic content, and the organic matter is not the type to generate oil, the oil must have migrated into the area of the well bore from another part of the basin where mature oilprone source rocks are present.
2. Information about the environmental geology of the lower Cook Inlet basin is limited; and no quantitative information has been collected from the upper Cook Inlet basin.
A number of geologic features and processes have been identified that may pose problems to engineering installations in the lower Cook Inlet and along the adjacent coastline. Strong earthquakes have caused major damage to the area by ground failure, surface warping, and tsunamis. Four active volcanoes on the west side of lower Cook Inlet are andesitic, so they can have violent eruptions. Very little is known about the swift bottom currents and sandwaves that have broken pipelines in the upper Cook Inlet.
3. The seismic horizons were determined by comparing the measured seismic reflections with the calculated reflections from the COST No. 1 well. Horizon A, at 900 m (2,950 ft) depth in the well, is near the top of the Upper Cretaceous rocks. Horizon B is at the depth of 2, 005 m (6,575 ft) in the well. That depth represents the CretaceousJurassic contact where the rocks no longer have intergranular porosity but are cemented with calcite and laumontite. The third horizon, C, is 1,400 m (4,600 ft) below the bottom of the well and about 3,100 m (10,200 ft) below the top of the Upper Jurassic rocks. It represents the contact between the top of the Middle Jurassic rocks and the base of the Upper Jurassic.
Conclusions 91
4. The paleontology and biostratigraphy are based on detailed analysis of foraminifers, marine and terrestrial palynomorphs, calcareous nannoplankton, and Radiolaria. Eocene fossils from413 to 552 m (1 ,356 to 1,810 ft) represent a predominantly nonmarine depositional environment in a warm temperate climate. The Paleocene rocks from 552 to 799 m (1 ,810 to 2,620 ft) are characterized by a palynomorph assemblage containing Paraalnipollenites confusus. Well developed Late Cretaceous (Maestrichtian) microfossil assemblages, from 799 to 1,539 m (2,620 to 5,050 ft), indicate nonmarine and marine intervals. Sparse but diagnostic assemblages of Early Cretaceous Hauterivian to Valanginian(?) microfossils, from 1,539 to 2,417 m (5,050 to 7, 930 ft), indicate a marine depositional environment whose paleobathymetry fluctuated twice from upper slope to middle-shelf water depths. Late Jurassic (Tithonian to Oxfordian) microfossils, from 2,417 to 3, 776 m (7 ,930 to 12,387 ft), indicate an intertidal to inner neritic marine depositional environment.
5. The COST No. 1 well does not contain prospective petroleum source rocks. The organic carbon content, which ranges from 0. 08 to 0. 65 weight percent, is more abundant in the upper part of the well than in the lower. The thermal maturity, however, increases with increasing depth. The transition from immature to mature hydrocarbon generation seems to be from 2,100-2,700 m (6,900-8,900 ft) in the well.
The Mesozoic sediments in the COST No. 1 well contain much less organic matter than the Mesozoic sediments in the upper Cook Inlet and the North Slope in Alaska. Although the thermochemical transformation of the organic matter in the Mesozoic rocks is marginally mature to mature, the organic matter is dominantly of the type that has a poor oil-generating capacity. However, because the COST No. 1 well did not penetrate the source rocks for petroleum in the upper Cook Inlet-the shales of the Middle Jurassic-the prospect for petroleum in the lower Cook Inlet should not be judged only on the data obtained from the COST No. 1 well. The oil-generating system in the Cook Inlet basin is probably made up of migrating paths from the Middle Jurassic rocks.
6. The present-day geothermal gradient for the COST No. 1 well is 2.28°C/100 m. Even though this gradient is close to that of the Swanson River oil field gradient of 2.37°CI100 m, the gradient is too low when compared to the geothermal trends in the upper Cook Inlet. The evidence from the stratigraphy of the rocks, the first occurrence of laumontite, and the TAl values indicate that the rocks in the well were subjected to high temperature gradients before uplift and erosion. The low vitrinite reflectance values do not substantiate this inference.
7. The compositions of the sandstones in the COST No. 1 well indicate that they were derived from an igneous source terrane which had outcrops of both volcanic and plutonic rock types. The shaliowest samples are volcaniclastic sandstone. The West Foreland Formation of lower Cenozoic age contains feldspatholithic sandstone with an
92 Geologic Studies of the Lower Cook Inlet COST No. 1 Well
average composition of Q23F30L47 . The Kaguyak Formation (Upper Cretaceous) contains feldspathic sandstone with an average composition of Q23F61 L16 • Both the Herendeen Limestone (Lower Cretaceous) and Naknek Formation (Upper Jurassic) contain lithofeldspathic sandstone with average modal compositions of Q36F 44L20 and Q24F 55L21 ,
respectively. 8. The diagenetic changes most affected the volcanic
rock fragments and plagioclase feldspar that are abundant in the sandstone samples. Sandstone diagenesis increases with increasing depth in the COST No. 1 well. Pseudomatrix is more common in the deeper sandstones than in the higher sandstones. Authigenic clay, montmorillonite and chlorite, increases with depth, and some of it formed before laumontite crystallization. Laumontite is present in most sandstone samples from depths greater than 2,134 m (7 ,000 ft) where most plagioclase is partly to completely albitized and intergranular porosity is destroyed.
The major cause for the reduction of porosity and permeability in the COST No. 1 well is due to the formation of authigenic clay matrix and pseudomatrix. The minor cause is that of compaction and diagenesis.
The sandstones of the West Foreland Formation (lower Cenozoic) have a porosity of nearly 20 percent. The porosity and permeability of the sandstone of the Herendeen Limestone (Lower Cretaceous) has been reduced by compaction and pore fillings of clay and calcite. The original porosity of the sandstone of the Naknek Formation (Upper Jurassic) was probably high but is now substantially reduced by compaction and by precipitation of authigenic minerals (laumontite).
9. The Middle Jurassic sandstones of the Tuxedni Group were derived largely from a volcanic terrane. Important differences in composition occur between the Tonnie Siltstone Member of the Chinitna Formation and the overlying Paveloff Siltstone Member; the lower member is volcanic-lithic rich, is virtually devoid of hornblende, and is cemented mostly with chlorite; and the upper member is less lithic-rich (more feldspathic ), contains an average of 7 percent hornblende, and is cemented with laumontite as well as chlorite.
The cementation and compaction of the sandstones in the Tuxedni Bay area in the western Cook Inlet should be considered when evaluating the hydrocarbon-reservoir potential of the Middle and Upper Jurassic sandstone in Cook Inlet.
The new data about the composition of the sandstones from the Tuxedni Group and Chinitna and Naknek Formations provide evidence that the Alaska-Aleutian Range batholith was unroofed during the deposition of the Pavel off Siltstone Member of the Chinitna Formation. This event would have happened earlier than previously thought.
10. Eight separate episodes of plutonism in southern Alaska may have affected or have affected the provenance history of the forearc basin that includes Cook Inlet. The petrologic variations of the plutons representing these eight episodes reveal a general trend to higher felsic composition
from the older to the younger plutonic groups. Generally, Jurassic plutonism produced mafic to intermediate compositions, Cretaceous plutonism produced mostly intermediate compositions, and Tertiary plutonism produced felsic compositions.
Both short-term and long-term plate-convergent episodes have affected the provenance of the Cook Inlet forearc basin. Four relatively short-term episodes that affected the Cook Inlet basin occurred during the Late Triassic(?) and Early Jurassic, Middle and Late Jurassic, Late Cretaceous and early Tertiary, and middle Tertiary. Widespread upper Cenozoic volcanic rocks and the presence of many calcalkaline volcanoes in the region are evidence that a fifth episode is taking place now.
Over the long term, the provenance evolved from simple magmatic arc sequences in the early Mesozoic to a composite of regional sedimentary, metamorphic, and magmatic arc sequences in the late Mesozoic and Cenozoic. In effect, each succeeding magmatic arc increased the proportion of crystalline rocks in the provenance. The simple magmatic arc provenance of the Upper Triassic, Jurassic, and Lower Cretaceous produced sandstones changing from lithic to feldspathic compositions. The sandstones in the Upper Cretaceous should demonstrate a composite provenance that includes magmatic arc and recycled orogen types, and, after a new magmatic arc cycle began in the Late Cretaceous, local development of volcanolithic sandstones.
Late Cenozoic sandstones should demonstrate a complex composite provenance that includes magmatic arc, recycled orogen, and continental block provenance types. The diverse sandstones should range from lithic to quartzose types.
The development of three major provenance types in southern Alaska will produce a complete range of sandstone framework modes. However, the younger sandstones of the Cook Inlet basin are the most likely to have quartzose frame'work modes because the increasing proportion of metamorphic and plutonic rocks during provenance evolution occurred as the compositions in younger plutons became more felsic.
11. Only the sandstones from the Lower Jurassic through the Lower Cretaceous changed compositions in the way Dickinson and Suczek ( 1979) predicted for magmatic arc provenances. In the forearc basin, the Upper Cretaceous sandstones change composition from a feldspathic to a feldspatholithic sandstone with very little change in quartz content; this change is the reverse of the kind of change expected in a magmatic arc provenance and more like the dissection of the previous magmatic arc provenance. The changes in the Cenozoic sandstones in the forearc basin and the accreted terranes also are those of a magmatic provenance; the sandstones were all feldspatholithic but they increased in quartz content very rapidly as they decreased in age, undoubtedly demonstrating the more felsic provenance and indicating that the drainage system reached into interior Alaska.
Only in the Cenozoic sandstones was the quartz content high enough to provide adequate petroleum reservoirs consistently. The Upper Jurassic sandstone would have been a good petroleum reservoir before the laumontite filled all the pores in the rocks.
12. Considering all the data, only three sandstone beds of Upper Cretaceous age are potential hydrocarbon reservoirs in the COST No. 1 well. These rocks, however, are not the source rocks for the petroleum in the upper Cook Inlet. COST No. 1 well did not penetrate the shales of the middle Jurassic, so the question of whether potential prospective petroleum accumulations are present in the lower Cook Inlet basin still remains unanswered.
References Adkison, W. L., Kelley, J. S., and Newman, K. R., 1975a,
Lithology and palynology of Tertiary rocks exposed near Capps glacier and along Chuitna River, Tyonek quadrangle, southern Alaska: U.S. Geological Survey Open-File Report 75-21, 58 p., 1 plate. .
---1975b, Lithology and palynology of the Beluga and Sterling formations exposed near Homer, Kenai Peninsula, Alaska: U.S. Geological Survey Open-File Report 75-383, 239 p., 1 plate.
Adkison, W. L., and Newman, K. R., 1973, Lithologic characteristics and palynology of upper Cretaceous and Tertiary rocks in the Deep Creek unit well, Kenai Peninsula, Alaska: U.S. Geological Survey Open-File Report 73-1857, 271 p., 1 plate.
Alaska Geological Society, 1969a, Northwest to southeast stratigraphic correlation section, Drift River to Anchor River, Cook Inlet basin, Alaska: Anchorage, vertical scale 1 inch = 500 feet.
---1969b, South to north stratigraphic correlation section, Anchor Point to Campbell Point, Cook Inlet basin, Alaska: Anchorage, vertical scale 1 inch = 500 feet.
---1969c, South to north stratigraphic correlation section, Kalgin Island to Beluga River, Cook Inlet basin, Alaska: Anchorage, vertical scale 1 inch = 500 feet.
---1969d, West to east stratigraphic correlation section, West Foreland to Swan Lake, Cook Inlet basin, Alaska: Anchorage, vertical scale 1 inch = 500 feet.
---1970a, South to north stratigraphic correlation section, Campbell Point to Rosetta, Cook Inlet basin, Alaska: Anchorage, vertical scale 1 inch = 500 feet.
---1970b, West to east stratigraphic correlation section, Beluga River to Wasilla, Cook Inlet basin, Alaska: Anchorage, vertical scale 1 inch = 500 feet.
Allison, R. C., and Addicott, W. 0., 1976, The North Pacific Miocene record of My til us ( P licatomytilus ), a new subgenus of Bivalvia: U.S. Geological Survey Professional Paper 962, 22 p.
Ariey, Cass, and McCoy, Scott, 1977, Sidewall sample description, Atlantic Richfield lower Cook Inlet COST No. 1: Atlantic Richfield Company, 45 p. [Basic data can be consulted at
References 93
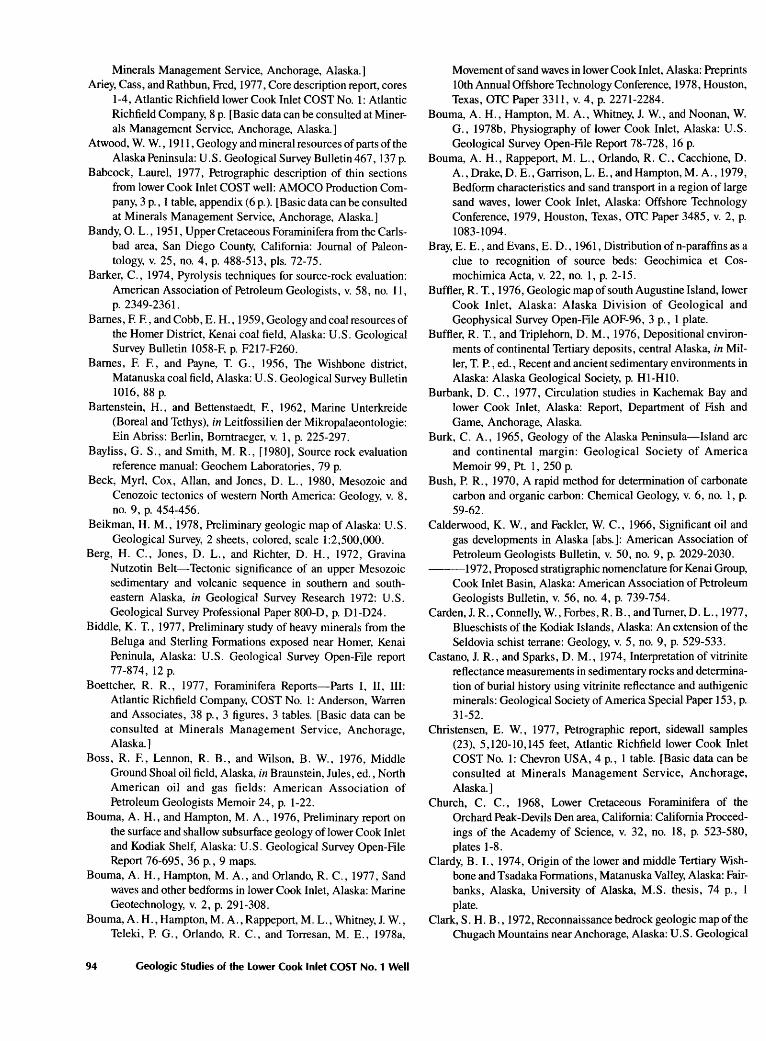
Minerals Management Service, Anchorage, Alaska.] Ariey, Cass, and Rathbun, Fred, 1977, Core description report, cores
1-4, Atlantic Richfield lower Cook Inlet COST No. 1: Atlantic Richfield Company, 8 p. [Basic data can be consulted at Minerals Management Service, Anchorage, Alaska.]
Atwood, W. W., 1911, Geology and mineral resources of parts of the Alaska Peninsula: U.S. Geological Survey Bulletin 467, 137 p.
Babcock, Laurel, 1977, Petrographic description of thin sections from lower Cook Inlet COST well: AMOCO Production Company, 3 p., 1 table, appendix ( 6 p. ). [Basic data can be consulted at Minerals Management Service, Anchorage, Alaska.]
Bandy, 0. L., 1951, Upper Cretaceous Foraminifera from the Carlsbad area, San Diego County, California: Journal of Paleontology, v. 25, no. 4, p. 488-513, pis. 72-75.
Barker, C., 1974, Pyrolysis techniques for source-rock evaluation: American Association of Petroleum Geologists, v. 58, no. 11, p. 2349-2361.
Barnes, F. F., and Cobb, E. H., 1959, Geology and coal resources of the Homer District, Kenai coal field, Alaska: U.S. Geological Survey Bulletin 1058-F, p. F217-F260.
Barnes, F. F., and Payne, T. G., 1956, The Wishbone district, Matanuska coal field, Alaska: U.S. Geological Survey Bulletin 1016, 88 p.
Hartenstein, H., and Bettenstaedt, F., 1962, Marine Unterkreide (Boreal and Tethys), in Leitfossilien der Mikropalaeontologie: Ein Abriss: Berlin, Borntraeger, v. 1, p. 225-297.
Bayliss, G. S., and Smith, M. R., [1980], Source rock evaluation reference manual: Geochem Laboratories, 79 p.
Beck, Myrl, Cox, Allan, and Jones, D. L., 1980, Mesozoic and Cenozoic tectonics of western North America: Geology, v. 8, no. 9, p. 454-456.
Beikman, H. M.,.1978, Preliminary geologic map of Alaska: U.S. Geological Survey, 2 sheets, colored, scale 1:2,500,000.
Berg, H. C., Jones, D. L., and Richter, D. H., 1972, Gravina Nutzotin Belt-Tectonic significance of an upper Mesozoic sedimentary and volcanic sequence in southern and southeastern Alaska, in Geological Survey Research 1972: U.S. Geological Survey Professional Paper 800-D, p. D1-D24.
Biddle, K. T., 1977, Preliminary study of heavy minerals from the Beluga and Sterling Formations exposed near Homer, Kenai Peninula, Alaska: U.S. Geological Survey Open-File report 77-874, 12 p.
Boettcher, R. R., 1977, Foraminifera Reports-Parts I, II, III: Atlantic Richfield Company, COST No. 1: Anderson, Warren and Associates, 38 p., 3 figures, 3 tables. [Basic data can be consulted at Minerals Management Service, Anchorage, Alaska.]
Boss, R. F., Lennon, R. B., and Wilson, B. W., 1976, Middle Ground Shoal oil field, Alaska, in Braunstein, Jules, ed., North American oil and gas fields: American Association of Petroleum Geologists Memoir 24, p. 1-22.
Bouma, A. H., and Hampton, M.A., 1976, Preliminary report on the surface and shallow subsurface geology oflower Cook Inlet and Kodiak Shelf, Alaska: U.S. Geological Survey Open-File Report 76-695, 36 p., 9 maps.
Bouma, A. H., Hampton, M.A., and Orlando, R. C., 1977, Sand waves and other bedforms in lower Cook Inlet, Alaska: Marine Geotechnology, v. 2, p. 291-308.
Bouma, A. H., Hampton, M. A., Rappeport, M. L., Whitney, J. W., Teleki, P. G., Orlando, R. C., and Torresan, M. E., 1978a,
94 Geologic Studies of the Lower Cook Inlet COST No.1 Well
Movement of sand waves in lower Cook Inlet, Alaska: Preprints 1Oth Annual Offshore Technology Conference, 1978, Houston, Texas, OTC Paper 3311, v. 4, p. 2271-2284.
Bouma, A. H., Hampton, M.A., Whitney, J. W., and Noonan, W. G., 1978b, Physiography of lower Cook Inlet, Alaska: U.S. Geological Survey Open-File Report 78-728, 16 p.
Bouma, A. H., Rappeport, M. L., Orlando, R. C., Cacchione, D. A., Drake, D. E., Garrison, L. E., and Hampton, M.A., 1979, Bedform characteristics and sand transport in a region of large sand waves, lower Cook Inlet, Alaska: Offshore Technology Conference, 1979, Houston, Texas, OTC Paper 3485, v. 2, p. 1083-1094.
Bray, E. E., and Evans, E. D., 1961, Distribution ofn-paraffins as a clue to recognition of source beds: Geochimica et Cosmochimica Acta, v. 22, no. 1, p. 2-15.
Buffler, R. T., 1976, Geologic map of south Augustine Island, lower Cook Inlet, Alaska: Alaska Division of Geological and Geophysical Survey Open-File AOF-96, 3 p., 1 plate.
Buffler, R. T., and Triplehorn, D. M., 1976, Depositional environments of continental Tertiary deposits, central Alaska, in Miller, T. P. , ed. , Recent and ancient sedimentary environments in Alaska: Alaska Geological Society, p. H1-H10.
Burbank, D. C., 1977, Circulation studies in Kachemak Bay and lower Cook Inlet, Alaska: Report, Department of Fish and Game, Anchorage, Alaska.
Burk, C. A., 1965, Geology of the Alaska Peninsula-Island arc and continental margin: Geological Society of America Memoir 99, Pt. 1, 250 p.
Bush, P. R., 1970, A rapid method for determination of carbonate carbon and organic carbon: Chemical Geology, v. 6, no. I, p. 59-62.
Calderwood, K. W., and Fackler, W. C., 1966, Significant oil and gas developments in Alaska [ abs.]: American Association of Petroleum Geologists Bulletin, v. 50, no. 9, p. 2029-2030.
---1972, Proposed stratigraphic nomenclature for Kenai Group, Cook Inlet Basin, Alaska: American Association of Petroleum Geologists Bulletin, v. 56, no. 4, p. 739-754.
Carden, J. R., Connelly, W., Forbes, R. B., and Turner, D. L., 1977, Blueschists of the Kodiak Islands, Alaska: An extension of the Seldovia schist terrane: Geology, v. 5, no. 9, p. 529-533.
Castano, J. R., and Sparks, D. M., 1974, Interpretation of vitrinite reflectance measurements in sedimentary rocks and determination of burial history using vitrinite reflectance and authigenic minerals: Geological Society of America Special Paper 153, p. 31-52.
Christensen, E. W., 1977, Petrographic report, sidewall samples (23), 5,120-10,145 feet, Atlantic Richfield lower Cook Inlet COST No. 1: Chevron USA, 4 p., 1 table. [Basic data can be consulted at Minerals Management Service, Anchorage, Alaska.]
Church, C. C. , 1968, Lower Cretaceous Foraminifera of the Orchard Peak-Devils Den area, California: California Proceedings of the Academy of Science, v. 32, no. 18, p. 523-580, plates 1-8.
Clardy, B. 1., 1974, Origin of the lower and middle Tertiary Wishbone and Tsadaka Formations, Matanuska Valley, Alaska: Fairbanks, Alaska, University of Alaska, M.S. thesis, 74 p., 1 plate.
Clark, S. H. B. , 1972, Reconnaissance bedrock geologic map of the Chugach Mountains near Anchorage, Alaska: U.S. Geological
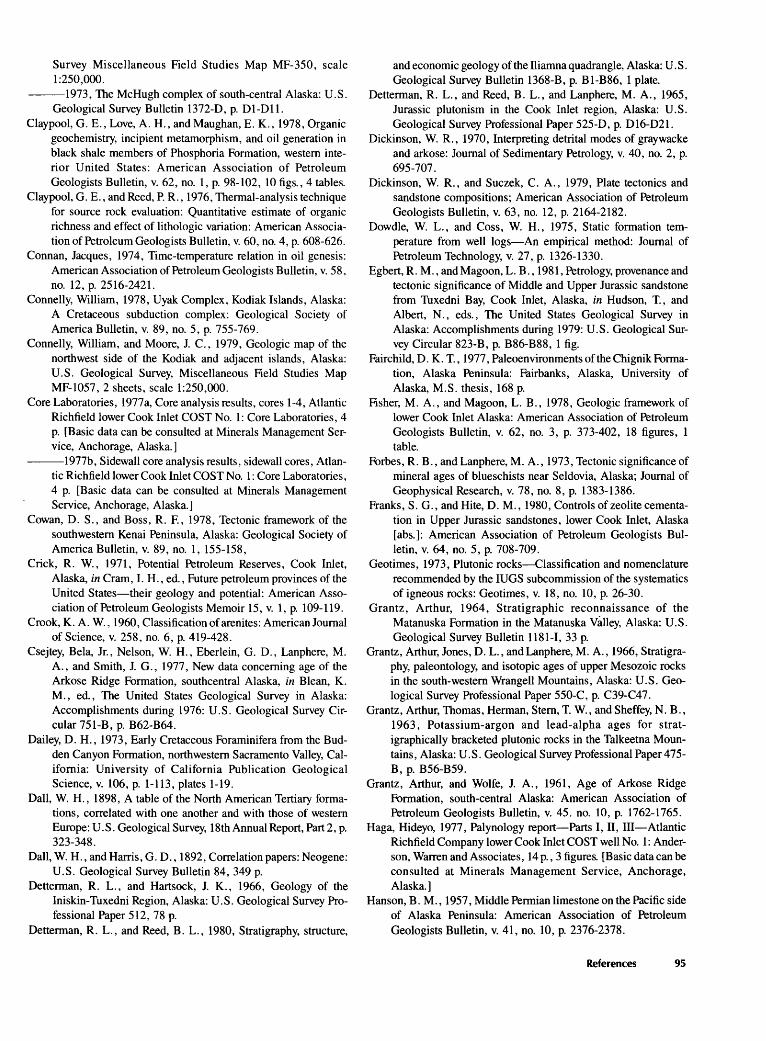
Survey Miscellaneous Field Studies Map MF-350, scale 1:250,000.
---1973, The McHugh complex of south-central Alaska: U.S. Geological Survey Bulletin 1372-D, p. D1-Dll.
Claypool, G. E., Love, A. H., and Maughan, E. K., 1978, Organic geochemistry, incipient metamorphism, and oil generation in black shale members of Phosphoria Formation, western interior United States: American Association of Petroleum Geologists Bulletin, v. 62, no. 1, p. 98-102, 10 figs., 4 tables.
Claypool, G. E., and Reed, P.R., 1976, Thermal-analysis technique for source rock evaluation: Quantitative estimate of organic richness and effect of lithologic variation: American Association of Petroleum Geologists Bulletin, v. 60, no. 4, p. 608-626.
Connan, Jacques, 1974, Time-temperature relation in oil genesis: American Association of Petroleum Geologists Bulletin, v. 58, no. 12, p. 2516-2421.
Connelly, William, 1978, Uyak Complex, Kodiak Islands, Alaska: A Cretaceous subduction complex: Geological Society of America Bulletin, v. 89, no. 5, p. 755-769.
Connelly, William, and Moore, J. C., 1979, Geologic map of the northwest side of the Kodiak and adjacent islands, Alaska: U.S. Geological Survey, Miscellaneous Field Studies Map MF-1057, 2 sheets, scale 1:250,000.
Core Laboratories, 1977a, Core analysis results, cores 1-4, Atlantic Richfield lower Cook Inlet COST No. 1: Core Laboratories, 4 p. [Basic data can be consulted at Minerals Management Service, Anchorage, Alaska.]
---1977b, Sidewall core analysis results, sidewall cores, Atlantic Richfield lower Cook Inlet COST No. 1: Core Laboratories, 4 p. [Basic data can be consulted at Minerals Management Service, Anchorage, Alaska.]
Cowan, D. S., and Boss, R. F., 1978, Tectonic framework of the southwestern Kenai Peninsula, Alaska: Geological Society of America Bulletin, v. 89, no. 1, 155-158,
Crick, R. W., 1971, Potential Petroleum Reserves, Cook Inlet, Alaska, in Cram, I. H., ed., Future petroleum provinces of the United States-their geology and potential: American Association of Petroleum Geologists Memoir 15, v. 1, p. 109-119.
Crook, K. A. W. , 1960, Classification of arenites: American Journal of Science, v. 258, no. 6, p. 419-428.
Csejtey, Bela, Jr., Nelson, W. H., Eberlein, G. D., Lanphere, M. A., and Smith, J. G., 1977, New data concerning age of the Arkose Ridge Formation, southcentral Alaska, in Blean, K. M., ed., The United States Geological Survey in Alaska: Accomplishments during 1976: U.S. Geological Survey Circular 751-B, p. B62-B64.
Dailey, D. H., 1973, Early Cretaceous Foraminifera from the Budden Canyon Formation, northwestern Sacramento Valley, California: University of California Publication Geological Science, v. 106, p. 1-113, plates 1-19.
Dall, W. H., 1898, A table of the North American Tertiary formations, correlated with one another and with those of western Europe: U.S. Geological Survey, 18th Annual Report, Part 2, p. 323-348.
Dall, W. H., and Harris, G. D., 1892, Correlation papers: Neogene: U.S. Geological Survey Bulletin 84, 349 p.
Detterman, R. L., and Hartsock, J. K., 1966, Geology of the Iniskin-Tuxedni Region, Alaska: U.S. Geological Survey Professional Paper 512, 78 p.
Detterman, R. L., and Reed, B. L., 1980, Stratigraphy, structure,
and economic geology of the Iliamna quadrangle, Alaska: U.S. Geological Survey Bulletin 1368-B, p. B1-B86, 1 plate.
Detterman, R. L., and Reed, B. L., and Lanphere, M.A., 1965, Jurassic plutonism in the Cook Inlet region, Alaska: U.S. Geological Survey Professional Paper 525-D, p. D16-D21.
Dickinson, W. R., 1970, Interpreting detrital modes of graywacke and arkose: Journal of Sedimentary Petrology, v. 40, no. 2, p. 695-707.
Dickinson, W. R., and Suczek, C. A., 1979, Plate tectonics and sandstone compositions; American Association of Petroleum Geologists Bulletin, v. 63, no. 12, p. 2164-2182.
Dowdle, W. L., and Coss, W. H., 1975, Static formation temperature from well logs-An empirical method: Journal of Petroleum Technology, v. 27, p. 13 26-1330.
Egbert, R. M., and Magoon, L. B., 1981, Petrology, provenance and tectonic significance of Middle and Upper Jurassic sandstone from Tuxedni Bay, Cook Inlet, Alaska, in Hudson, T., and Albert, N., eds., The United States Geological Survey in Alaska: Accomplishments during 1979: U.S. Geological Survey Circular 823-B, p. B86-B88, 1 fig.
Fairchild, D. K. T., 1977, Paleoenvironments of the Chignik Formation, Alaska Peninsula: Fairbanks, Alaska, University of Alaska, M.S. thesis, 168 p.
Fisher, M.A., and Magoon, L. B., 1978, Geologic framework of lower Cook Inlet Alaska: American Association of Petroleum Geologists Bulletin, v. 62, no. 3, p. 373-402, 18 figures, 1 table.
Forbes, R. B., and Lanphere, M.A., 1973, Tectonic significance of mineral ages of blueschists near Seldovia, Alaska; Journal of Geophysical Research, v. 78, no. 8, p. 1383-1386.
Franks, S. G., andHite, D. M., 1980, Controlsofzeolitecementation in Upper Jurassic sandstones, lower Cook Inlet, Alaska [abs.]: American Association of Petroleum Geologists Bulletin, v. 64, no. 5, p. 708-709.
Geotimes, 1973, Plutonic rocks-Classification and nomenclature recommended by the lUGS subcommission of the systematics of igneous rocks: Geotimes, v. 18, no. 10, p. 26-30.
Grantz, Arthur, 1964, Stratigraphic reconnaissance of the Matanuska Formation in the Matanuska Valley, Alaska: U.S. Geological Survey Bulletin 1181-1, 33 p.
Grantz, Arthur, Jones, D. L., and Lanphere, M.A., 1966, Stratigraphy, paleontology, and isotopic ages of upper Mesozoic rocks in the south-western Wrangell Mountains, Alaska: U.S. Geological Survey Professional Paper 550-C, p. C39-C47.
Grantz, Arthur, Thomas, Herman, Stem, T. W., and Sheffey, N. B., 1963, Potassium-argon and lead-alpha ages for stratigraphically bracketed plutonic rocks in the Talkeetna Mountains, Alaska: U.S. Geological Survey Professional Paper 475-B, p. B56-B59.
Grantz, Arthur, and Wolfe, J. A., 1961, Age of Arkose Ridge Formation, south-central Alaska: American Association of Petroleum Geologists Bulletin, v. 45. no. 10, p. 1762-1765.
Haga, Hideyo, 1977, Palynology report-Parts I, II, III-Atlantic Richfield Company lower Cook Inlet COST well No. 1: Anderson, Warren and Associates, 14 p., 3 figures. [Basic data can be consulted at Minerals Management Service, Anchorage, Alaska.]
Hanson, B. M. , 1957, Middle Permian limestone on the Pacific side of Alaska Peninsula: American Association of Petroleum Geologists Bulletin, v. 41, no. 10, p. 2376-2378.
References 95
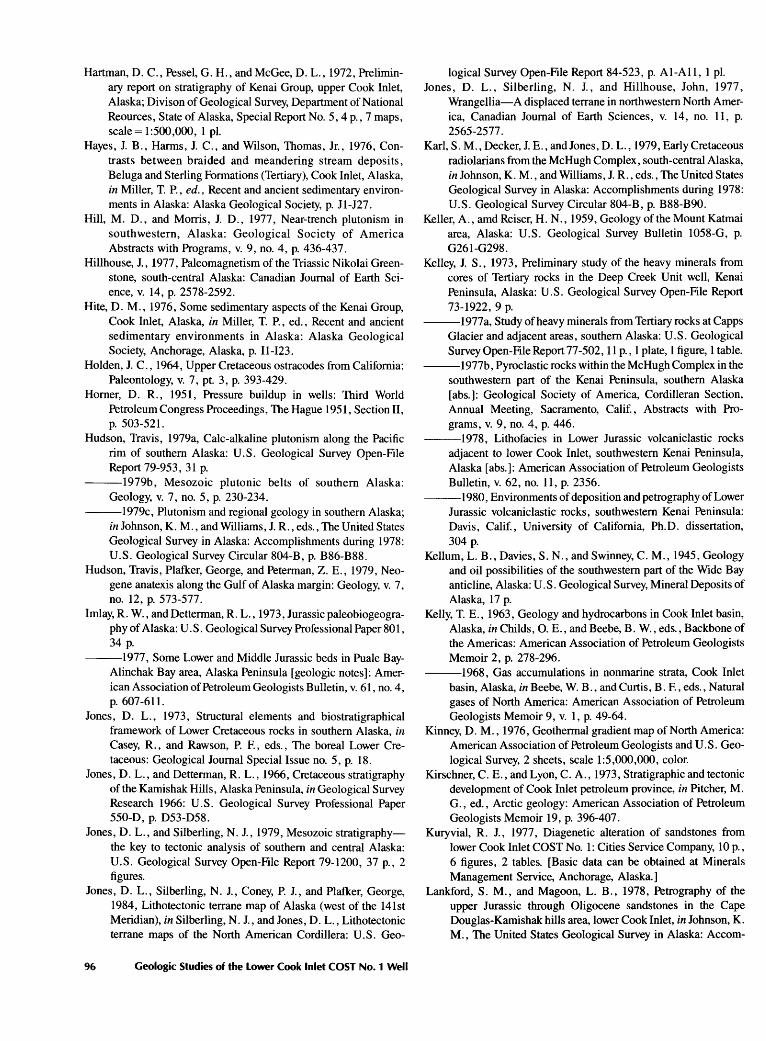
Hartman, D. C., Pessel, G. H., and McGee, D. L., 1972, Preliminary report on stratigraphy of Kenai Group, upper Cook Inlet, Alaska; Divison of Geological Survey, Department of National Reources, State of Alaska, Special Report No. 5, 4 p. , 7 maps, scale= 1:500,000, 1 pl.
Hayes, J. B., Harms, J. C., and Wilson, Thomas, Jr., 1976, Contrasts between braided and meandering stream deposits, Beluga and Sterling Formations (Tertiary), Cook Inlet, Alaska, in Miller, T. P., ed., Recent and ancient sedimentary environments in Alaska: Alaska Geological Society, p. 11-127.
Hill, M. D., and Morris, J. D., 1977, Near-trench plutonism in southwestern, Alaska: Geological Society of America Abstracts with Programs, v. 9, no. 4, p. 436-437.
Hillhouse, J., 1977, Paleomagnetism of the Triassic Nikolai Greenstone, south-central Alaska: Canadian Journal of Earth Science, v. 14, p. 2578-2592.
Hite, D. M., 1976, Some sedimentary aspects of the Kenai Group, Cook Inlet, Alaska, in Miller, T. P. , ed. , Recent and ancient sedimentary environments in Alaska: Alaska Geological Society, Anchorage, Alaska, p. 11-I23.
Holden, J. C., 1964, Upper Cretaceous ostracodes from California: Paleontology, v. 7, pt. 3, p. 393-429.
Homer, D. R., 1951, Pressure buildup in wells: Third World Petroleum Congress Proceedings, The Hague 1951, Section II, p. 503-521.
Hudson, Travis, 1979a, Calc-alkaline plutonism along the Pacific rim of southern Alaska: U.S. Geological Survey Open-File Report 79-953, 31 p.
---1979b, Mesozoic plutonic belts of southern Alaska: Geology, v. 7, no. 5, p. 230-234.
---1979c, Plutonism and regional geology in southern Alaska; in Johnson, K. M., and Williams, J. R., eds., The United States Geological Survey in Alaska: Accomplishments during 1978: U.S. Geological Survey Circular 804-B, p. B86-B88.
Hudson, Travis, Plafker, George, and Peterman, Z. E., 1979, Neogene anatexis along the Gulf of Alaska margin: Geology, v. 7, no. 12, p. 573-577.
Imlay, R. W., and Detterman, R. L., 1973, Jurassic paleobiogeography of Alaska: U.S. Geological Survey Professional Paper 801, 34 p.
---1977, Some Lower and Middle Jurassic beds in Puale BayAlinchak Bay area, Alaska Peninsula [geologic notes]: American Association of Petroleum Geologists Bulletin, v. 61, no. 4, p. 607-611.
Jones, D. L., 1973, Structural elements and biostratigraphical framework of Lower Cretaceous rocks in southern Alaska, in Casey, R., and Rawson, P. F., eds., The boreal Lower Cretaceous: Geological Journal Special Issue no. 5, p. 18.
Jones, D. L., and Detterman, R. L., 1966, Cretaceous stratigraphy of the Kamishak Hills, Alaska Peninsula, in Geological Survey Research 1966: U.S. Geological Survey Professional Paper 550-D, p. D53-D58.
Jones, D. L., and Silberling, N.J., 1979, Mesozoic stratigraphythe key to tectonic analysis of southern and central Alaska: U.S. Geological Survey Open-File Report 79-1200, 37 p., 2 figures.
Jones, D. L., Silberling, N.J., Coney, P. J., and Plafker, George, 1984, Lithotectonic terrane map of Alaska (west of the 141st Meridian), in Silberling, N. J., and Jones, D. L., Lithotectonic terrane maps of the North American Cordillera: U.S. Geo-
96 Geologic Studies of the Lower Cook Inlet COST No. 1 Well
logical Survey Open-File Report 84-523, p. A1-A11, 1 pl. Jones, D. L., Silber ling, N. J., and Hillhouse, John, 1977,
Wrangellia-A displaced terrane in northwestern North America, Canadian Journal of Earth Sciences, v. 14, no. 11, p. 2565-2577.
Karl, S.M., Decker, J. E., and Jones, D. L., 1979, Early Cretaceous radiolarians from the McHugh Complex, south-central Alaska, in Johnson, K. M., and Williams, J. R., eds., The United States Geological Survey in Alaska: Accomplishments during 1978: U.S. Geological Survey Circular 804-B, p. B88-B90.
Keller, A., amd Reiser, H. N., 1959, Geology of the Mount Katmai area, Alaska: U.S. Geological Survey Bulletin 1058-G, p. G261-G298.
Kelley, J. S., 1973, Preliminary study of the heavy minerals from cores of Tertiary rocks in the Deep Creek Unit well, Kenai Peninsula, Alaska: U.S. Geological Survey Open-File Report 73-1922, 9 p.
---1977a, Study of heavy minerals from Tertiary rocks at Capps Glacier and adjacent areas, southern Alaska: U.S. Geological Survey0pen-FileReport77-502, 11 p., 1 plate, 1 figure, 1 table.
---1977b, Pyroclastic rocks within the McHugh Complex in the southwestern part of the Kenai Peninsula, southern Alaska [ abs.]: Geological Society of America, Cordilleran Section, Annual Meeting, Sacramento, Calif. , Abstracts with Programs, v. 9, no. 4, p. 446.
---1978, Lithofacies in Lower Jurassic volcaniclastic rocks adjacent to lower Cook Inlet, southwestern Kenai Peninsula, Alaska [ abs.]: American Association of Petroleum Geologists Bulletin, v. 62, no. 11, p. 2356.
---1980, Environments of deposition and petrography of Lower Jurassic volcaniclastic rocks, southwestern Kenai Peninsula: Davis, Calif., University of California, Ph.D. dissertation, 304 p.
Kellum, L. B., Davies, S. N., and Swinney, C. M., 1945, Geology and oil possibilities of the southwestern part of the Wide Bay anticline, Alaska: U.S. Geological Survey, Mineral Deposits of Alaska, 17 p.
Kelly, T. E., 1963, Geology and hydrocarbons in Cook Inlet basin, Alaska, in Childs, 0. E., and Beebe, B. W., eds., Backbone of the Americas: American Association of Petroleum Geologists Memoir 2, p. 278-296.
---1968, Gas accumulations in nonmarine strata, Cook Inlet basin, Alaska, in Beebe, W. B. , and Curtis, B. F. , eds. , Natural gases of North America: American Association of Petroleum Geologists Memoir 9, v. 1, p. 49-64.
Kinney, D. M., 1976, Geothermal gradient map of North America: American Association of Petroleum Geologists and U.S. Geological Survey, 2 sheets, scale 1:5,000,000, color.
Kirschner, C. E., and Lyon, C. A., 1973, Stratigraphic and tectonic development of Cook Inlet petroleum province, in Pitcher, M. G., ed., Arctic geology: American Association of Petroleum Geologists Memoir 19, p. 396-407.
Kuryvial, R. J. , 1977, Diagenetic alteration of sandstones from lower Cook Inlet COST No. 1: Cities Service Company, 10 p., 6 figures, 2 tables. [Basic data can be obtained at Minerals Management Service, Anchorage, Alaska.]
Lankford, S. M., and Magoon, L. B., 1978, Petrography of the upper Jurassic through Oligocene sandstones in the Cape Douglas-Karnishak hills area, lower Cook Inlet, in Johnson, K. M., The United States Geological Survey in Alaska: Accom-
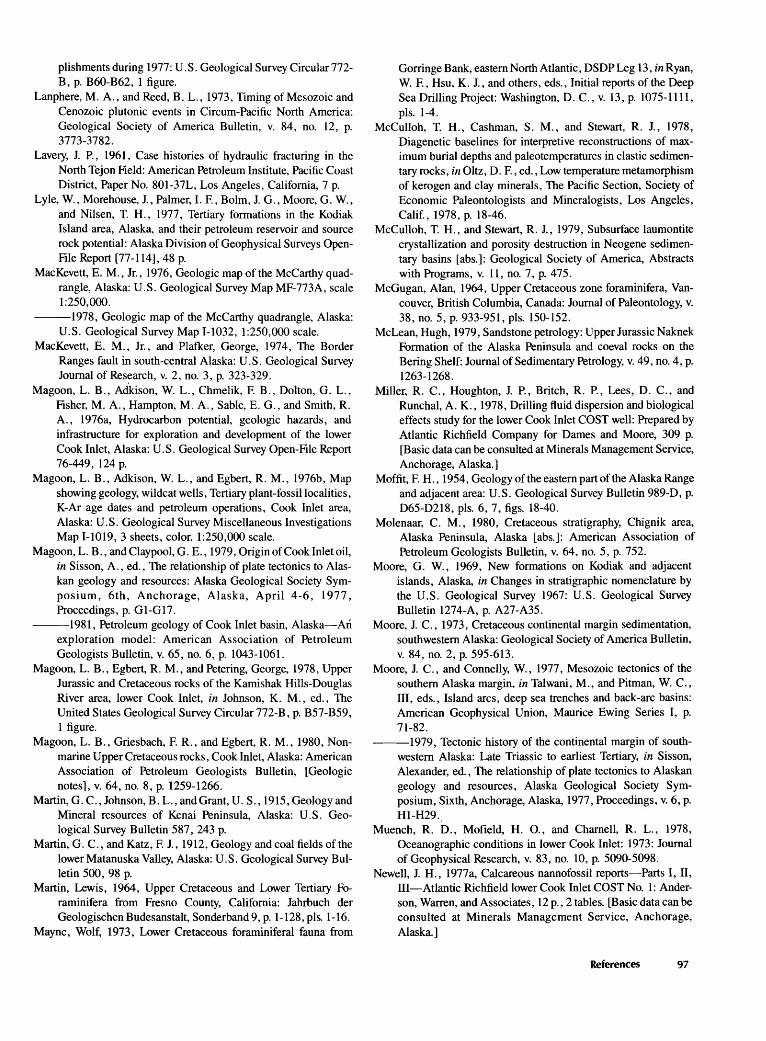
plishments during 1977: U.S. Geological Survey Circular 772-B, p. B60-B62, 1 figure.
Lanphere, M.A., and Reed, B. L., 1973, Timing of Mesozoic and Cenozoic plutonic events in Circum-Pacific North America: Geological Society of America Bulletin, v. 84, no. 12, p. 3773-3782.
Lavery, J. P., 1961, Case histories of hydraulic fracturing in the North Tejon Field: American Petroleum Institute, Pacific Coast District, Paper No. 801-37L, Los Angeles, California, 7 p.
Lyle, W., Morehouse, J., Palmer, I. F., Bolm, J. G., Moore, G. W., and Nilsen, T. H., 1977, Tertiary formations in the Kodiak Island area, Alaska, and their petroleum reservoir and source rock potential: Alaska Division of Geophysical Surveys OpenFile Report [77 -114], 48 p.
MacKevett, E. M., Jr., 1976, Geologic map of the McCarthy quadrangle, Alaska: U.S. Geological Survey Map MF-773A, scale 1:250,000.
---1978, Geologic map of the McCarthy quadrangle, Alaska: U.S. Geological Survey Map 1-1032, 1:250,000 scale.
MacKevett, E. M., Jr., and Plafker, George, 1974, The Border Ranges fault in south-central Alaska: U.S. Geological Survey Journal of Res~arch, v. 2, no. 3, p. 323-329.
Magoon, L. B., Adkison, W. L., Chmelik, F. B., Dolton, G. L., Fisher, M.A., Hampton, M.A., Sable, E. G., and Smith, R. A., 1976a, Hydrocarbon potential, geologic hazards, and infrastructure for exploration and development of the lower Cook Inlet, Alaska: U.S. Geological Survey Open-File Report 76-449' 124 p.
Magoon, L. B., Adkison, W. L., and Egbert, R. M., 1976b, Map showing geology, wildcat wells, Tertiary plant-fossil localities, K-Ar age dates and petroleum operations, Cook Inlet area, Alaska: U.S. Geological Survey Miscellaneous Investigations Map 1-1019, 3 sheets, color, 1:250,000 scale.
Magoon, L. B., and Claypool, G. E., 1979, Origin of Cook Inlet oil, in Sisson, A., ed., The relationship of plate tectonics to Alaskan geology and resources: Alaska Geological Society Symposium, 6th, Anchorage, Alaska, April 4-6, 1977, Proceedings, p. G 1-G 17.
---1981, Petroleum geology of Cook Inlet basin, Alaska-An exploration model: American Association of Petroleum Geologists Bulletin, v. 65, no. 6, p. 1043-1061.
Magoon, L. B., Egbert, R. M., and Petering, George, 1978, Upper Jurassic and Cretaceous rocks of the Kamishak Hills-Douglas River area, lower Cook Inlet, in Johnson, K. M., ed., The United States Geological Survey Circular 772-B, p. B57-B59, 1 figure.
Magoon, L. B., Griesbach, F. R., and Egbert, R. M., 1980, Nonmarine Upper Cretaceous rocks, Cook Inlet, Alaska: American Association of Petroleum Geologists Bulletin, [Geologic notes], v. 64, no. 8, p. 1259-1266.
Martin, G. C., Johnson, B. L., and Grant, U.S., 1915, Geology and Mineral resources of Kenai Peninsula, Alaska: U.S. Geological Survey Bulletin 587, 243 p.
Martin, G. C. , and Katz, F. J. , 1912, Geology and coal fields of the lower Matanuska Valley, Alaska: U.S. Geological Survey Bulletin 500, 98 p.
Martin, Lewis, 1964, Upper Cretaceous and Lower Tertiary Foraminifera from Fresno County, California: Jahrbuch der Geologischen Budesanstalt, Sonderband 9, p. 1-128, pis. 1-16.
Mayne, Wolf, 1973, Lower Cretaceous foraminiferal fauna from
Gorringe Bank, eastern North Atlantic, DSDP Leg 13, in Ryan, W. F., Hsu, K. J., and others, eds., Initial reports of the Deep Sea Drilling Project: Washington, D. C. , v. 13, p. 107 5-1111 , pis. 1-4.
McCulloh, T. H., Cashman, S. M., and Stewart, R. J., 1978, Diagenetic baselines for interpretive reconstructions of maximum burial depths and paleotemperatures in clastic sedimentary rocks, in Oltz, D. F., ed., Low temperature metamorphism of kerogen and clay minerals, The Pacific Section, Society of Economic Paleontologists and Mineralogists, Los Angeles, Calif., 1978, p. 18-46.
McCulloh, T. H., and Stewart, R. 1., 1979, Subsurface laumontite crystallization and porosity destruction in Neogene sedimentary basins [abs.]: Geological Society of America, Abstracts with Programs, v. 11, no. 7, p. 475.
McGugan, Alan, 1964, Upper Cretaceous zone foraminifera, Vancouver, British Columbia, Canada: Journal of Paleontology, v. 38, no. 5, p. 933-951, pls. 150-152.
McLean, Hugh, 1979, Sandstone petrology: Upper Jurassic Naknek Formation of the Alaska Peninsula and coeval rocks on the Bering Shelf: Journal of Sedimentary Petrology, v. 49, no. 4, p. 1263-1268.
Miller, R. C., Houghton, J. P., Britch, R. P., Lees, D. C., and Runchal, A. K., 1978, Drilling fluid dispersion and biological effects study for the lower Cook Inlet COST well: Prepared by Atlantic Richfield Company for Dames and Moore, 309 p. [Basic data can be consulted at Minerals Management Service, Anchorage, Alaska.]
Moffit, F. H. , 1954, Geology of the eastern part of the Alaska Range and adjacent area: U.S. Geological Survey Bulletin 989-D, p. D65-D218, pis. 6, 7, figs. 18-40.
Molenaar, C. M., 1980, Cretaceous stratigraphy, Chignik area, Alaska Peninsula, Alaska [ abs.]: American Association of Petroleum Geologists Bulletin, v. 64, no. 5, p. 752.
Moore, G. W., 1969, New formations on Kodiak and adjacent islands, Alaska, in Changes in stratigraphic nomenclature by the U.S. Geological Survey 1967: U.S. Geological Survey Bulletin 1274-A, p. A27-A35.
Moore, J. C. , 1973, Cretaceous continental margin sedimentation, southwestern Alaska: Geological Society of America Bulletin, v. 84, no. 2, p. 595-613.
Moore, J. C. , and Connelly, W. , 1977, Mesozoic tectonics of the southern Alaska margin, in Talwani, M., and Pitman, W. C., III, eds., Island arcs, deep sea trenches and back-arc basins: American Geophysical Union, Maurice Ewing Series I, p. 71-82.
---1979, Tectonic history of the continental margin of southwestern Alaska: Late Triassic to earliest Tertiary, in Sisson, Alexander, ed. , The relationship of plate tectonics to Alaskan geology and resources, Alaska Geological Society Symposium, Sixth, Anchorage, Alaska, 1977, Proceedings, v. 6, p. Hl-H29 ..
Muench, R. D., Mofield, H. 0., and Charnell, R. L., 1978, Oceanographic conditions in lower Cook Inlet: 1973: Journal of Geophysical Research, v. 83, no. 10, p. 5090-5098.
Newell, J. H., 1977a, Calcareous nannofossil reports-Parts I, II, III-Atlantic Richfield lower Cook Inlet COST No. 1: Anderson, Warren, and Associates, 12 p., 2 tables. [Basic data can be consulted at Minerals Management Service, Anchorage, Alaska.]
References 97
---1977b, Siliceous microfossil report-Part !-Atlantic Richfield lower Cook Inlet COST No. 1: Anderson, Warren, and Associates, 1 p. [Basic data can be consulted at Minerals Management Service, Anchorage, Alaska.]
Nilsen, T. H., and Moore, G. W., 1979, Reconnaissance study of Upper Cretaceous to Miocene stratigraphic units and sedimentary facies, Kodiak and adjacent islands, Alaska, with a section on Sedimentary petrography by G. R. Winkler: U.S. Geological Survey Professional Paper 1093, 34 p.
Parkinson, L. J., 1962, One field, one giant-The story of Swanson River: Oil and Gas Journal, v. 60, no. 13, p. 180-183.
Pessagno, E. A., Jr., 1977, Radiolarian zonation and stratigraphy of the Upper Cretaceous portion of the Great Valley sequence, California Coast Ranges: Special publication, Micropaleontology, no. 2, 95 p., pis. 1-4.
Plafker, George, 1969, Tectonics of the March 27, 1964, Alaska earthquake: U.S. Geological Survey Professional Paper 543-1, 74 p.
Plafker, G., Jones, D. L., and Pessagno, E. A., Jr., 1977, A Cretaceous accretionary flysch and melange terrane along the Gulf of Alaska margin, in The United States Geological Survey in Alaska: Accomplishments during 1976: U.S. Geological Survey Circular 751-B, p. B41-B43.
Reed, B. L., and Lanphere, M. A., 1969, Age and chemistry of Mesozoic and Tertiary plutonic rocks in south-central Alaska: Geological Society of America Bulletin, v. 80, no. 1, p. 23-44.
---1972, Generalized geologic map of the Alaska-Aleutian Range batholith showing potassium-argon ages of the plutonic rocks: U.S. Geological Survey Miscellaneous Field Studies Map MF-372, 1:1,000,000 scale, 2 sheets.
---1973a, Plutonic rocks of Alaska-Aleutian Range batholith, in Arctic geology: American Association of Petroleum Geologists Memoir 19, p. 421-428.
---1973b, Alaska-Aleutian Range batholith, geochronology, chemistry, and relation to circum-Pacific plutonism: Geological Society of America Bulletin, v. 84, no. 8, p. 2583-2610.
Reed, B. L., and Nelson, S. W., 1977, Geologic map of the Talkeetna quadrangle, Alaska: U.S. Geological Survey Map MF-870-A, 1:250,000 scale, 1 sheet.
Richter, D. H., 1976, Geological map of the Nabesna quadrangle, Alaska: U.S. Geological Survey Map 1-932, 1:250,000 scale.
Richter, D. H., Lanphere, M.A., and Matson, N. A., Jr., 1975, Granitic plutonism and metamorphism, eastern Alaska Range, Alaska: Geological Society of America Bulletin, v. 86, no. 6, p. 819-829.
Schluger, P. R., 1977, Petrographic summaries of sidewall cores from 1, 810-4,560 feet: Core 1 and Core 2, Atlantic Richfield lower Cook Inlet COST No. 1: Mobil Oil Corporation, 10 p. , 1 figure. [Basic data can be obtained at Minerals Management Service, Anchorage, Alaska.]
Scott, J. A. B., 1974, The Foraminifera of the Haslam, Qualicum, and Trent River Formations, Vancouver Island, British Columbia: Canada Petroleum Geology Bulletin, v. 22, no. 2, p. 119-179, plates 1-6.
Simpson, H. M., 1977, Vitrinite reflectance, Atlantic Richfield lower Cook Inlet COST No. 1: Atlantic Richfield Company, 2 p., 5 figures, appendix, 43 p. [Basic data can be consulted at Minerals Management Service, Anchorage, Alaska.]
Sliter, W. V., 1968, Upper Cretaceous Foraminifera from southern California and northwestern Baja California, Mexico: Univer-
98 Geologic Studies of the Lower Cook Inlet COST No. 1 Well
sity of Kansas Paleontology Contributions, series no. 49, article 7, p. 1-141, pis. 1-24.
---1973, Upper Cretaceous Foraminifera from the Vancouver Island area, British Columbia, Canada: Journal of Foraminiferal Research, v. 3, no. 4, p. 167-186, pis. 1-6.
Sliter, W. V., and Baker, R. A., 1972, Cretaceous bathymetric distribution of benthic foraminifera: Journal of Foraminiferal Research, v. 2, no. 4, p. 167-183, figs. 1-8.
Spurr, J. E., 1900, A reconnaissance in southwestern Alaska in 1898: U.S. Geological Survey 20th Annual Report, Part 7, p. 31-264.
Stewart, R. J., 1976, Turbidites of the Aleutian abyssal plain: Mineralogy, provenance, and constraints for Cenozoic motion of the Pacific Plate: Geological Society of American Bulletin, v. 87, no. 5, p. 793-808, 14 figures.
Stone, D. B. , 1979, Paleomagnetism and paleographic reconstruction of southern Alaska, in Sisson, A., ed., Relationship of plate tectonics to Alaskan geology and resources: Alaska Geology Society, p. Kl-Kl7.
Stover, L. E., and Evitt, W. R., 1978, Analyses of pre-Pleistocene organic-walled dinoflagellates: Stanford University Publications, Geological Sciences, v. 15, 300 p.
Swain, F. M., 1973, Upper Cretaceous Ostracoda from the northwestern Pacific Ocean: Journal of Paleontology, v. 47, no. 4, p. 711-714, pl. 1.
Swiderski, T. J., 1977, Petrographic analysis of Cretaceous and Jurassic samples from the lower Cook Inlet COST No. 1 well, Alaska: Phillips Petroleum Company, 10 p., 1 table. [Basic data can be obtained at Minerals Management Service, Anchorage, Alaska.]
Timko, K. J., and Ferti, W. H., 1972, How downhole temperatures, pressures affect drilling: World Oil, v. 175, no. 5, p. 73-80, 88.
Tis sot, B. P. , and Welte, D. H. , 197 8, Petroleum formation and occurrence, a new approach to oil and gas exploration: New York, Springer-Verlag, 538 p.
Trujillo, E. F., 1960, Upper Cretaceous Foraminifera from near Redding, Shasta County, California: Journal of Paleontology, v. 34, no. 2, p. 290-346, plates 43-50.
Tysdal, R. G., and Case, J. E., 1979, Geologic map of the Seward and Blying Sound Quadrangles, Alaska: U.S. Geological Survey Miscellaneous Investigations Map 1-1150, color, 1:250,000 scale, 12 p.
Van Delinder, C. G., 1977, Hydrocarbon source facies analysis COST lower Cook Inlet No. 1 well, Cook Inlet, Alaska: Geochem Laboratories, 14 p., 6 figures, 8 tables. [Basic data can be consulted at Minerals Management Service, Anchorage, Alaska.]
Van Eysinga, F. W. B., 1975, Geologic time table: Amsterdam, Elsevier, 1 sheet.
Vassoevich, N. B., Visotskii, I. V., Guseva, A. N., and Olenin, V. B., 1967, Hydrocarbons in the sedimentary mantle of the earth, in 7th World Petroleum Congress, 7th, Proceedings, v. 2, London: Elsevier, pp. 37-45.
Visser, R. C. , 1969, Platform design and construction in Cook Inlet, Alaska: Journal of Petroleum Technology, v. 21, no. 4, p. 411-420.
Wahrhaftig, Clyde, Wolfe, E. B. L., and Lanphere, M. A., 1969, The Coal-Bearing group in the Nenana coal field, Alaska: U.S. Geological Survey Bulletin 1274-D, p. D1-D30.
Waller, R. M. , 1966, Effects of the earthquake of March 27, 1964,
in the Homer area: U.S. Geological Survey Professional Paper 542-D, 28 p.
Whitney, J. W., Noonan, W. G., Thurston, D., Bouma, A. H., and Hampton, M. A., 1979, Lower Cook Inlet, Alaska: Do these large sand waves migrate?: Offshore Technology Conference, 11th, Proceedings, v. 2, OTC Paper 3484, p. 1071-1082.
Wills, J. C., Bolm, J. G., Stewart, G. H., Turner, R. F., Lynch, M. B., Petering, G, W., Parker, John, and Schook, Brian, 1978, Geological and operational summary, Atlantic Richfield lower Cook Inlet, Alaska, COST well No. 1: U.S. Geological Survey Open-File Report 78-145, 46 p.
Winkler, G. G., 1978, Framework grain mineralogy and provenance of sandstone from the Arkose Ridge and Chickaloon Formations, Matanuska Valley, in Johnson, K. M., ed., The United States Geological Survey in Alaska: Accomplishments during 1977: U.S. Geological Survey Circular 772-B, p. B70-B73.
---1979, With a section on Sedimentary petrography, in Nilsen, T. H., and Moore, G. W., eds., Reconnaissance study of Upper Cretaceous to Miocene stratigraphic units and sedimentary facies, Kodiak and adjacent islands, Alaska: U.S. Geological
Survey Professional Paper 1093, 34 p. Winkler, G. R., Miller, R. J., and Case, J. E., 1980, Blocks and belts
of blueschist and greenschist in the Valdez Quadrangle, Chugach Mountains, southern Alaska [abs.]: Geological Society of America, Abstracts with Programs, Cordilleran Section, v. 12, no. 3, p. 160.
Wolfe, J. A., 1981, A chronologie framework for Cenozoic megafossil floras of northwestern North America and its relation to marine geochronology: Geological Society of America, Special Paper 184, p. 39-42.
Wolfe, J. A., Hopkins, D. M., and Leopold, E. B., 1966, Tertiary stratigraphy and paleobotany of the Cook Inlet region, Alaska: U.S. Geological Survey Professional Paper 398-A, 29 p.
Wolfe, J. A., and Tanai, Toshimasa, 1980, The Miocene Seldovia Point flora from the Kenai Group, Alaska: U.S. Geological Survey Professional Paper 1105, 52 p.
Zuffa, G. G., Nilsen, T. H., and Winkler, G. R., 1980, Rockfragment petrography of the Upper Cretaceous Chugach terrane, southern Alaska: U.S. Geological Survey Open-File Report 80-713, 30 p.
References 99
tl U.S. GOVERNMENT PRINTING OFFICE:1986-686-653