Embed Size (px)
Citation preview
Geologic Framework for the National Assessment of Carbon Dioxide Storage Resources─Williston Basin, Central Montana Basins, and Montana Thrust Belt Study Areas
By Marc L. Buursink, Matthew D. Merrill, William H. Craddock, Tina L. Roberts-Ashby, Sean T. Brennan, Madalyn S. Blondes, Philip A. Freeman, Steven M. Cahan, Christina A. DeVera, and Celeste D. Lohr
Chapter J of Geologic Framework for the National Assessment of Carbon Dioxide Storage Resources
Edited by Peter D. Warwick and Margo D. Corum
Open-File Report 2012–1024–J
U.S. Department of the Interior U.S. Geological Survey
ii
U.S. Department of the Interior SALLY JEWELL, Secretary
U.S. Geological Survey Suzette M. Kimball, Acting Director
U.S. Geological Survey, Reston, Virginia: 2014
For product and ordering information: World Wide Web: http://www.usgs.gov/pubprod Telephone: 1-888-ASK-USGS
For more information on the USGS—the Federal source for science about the Earth, its natural and living resources, natural hazards, and the environment: World Wide Web: http://www.usgs.gov Telephone: 1-888-ASK-USGS
Suggested citation: Buursink, M.L., Merrill, M.D., Craddock, W.H., Roberts-Ashby, T.L., Brennan, S.T., Blondes, M.S., Freeman, P.A., Cahan, S.M., DeVera, C.A., and Lohr, C.D., 2014, Geologic framework for the national assessment of carbon dioxide storage resources— Williston Basin, Central Montana Basins, and Montana Thrust Belt study areas, chap. J of Warwick, P.D., and Corum, M.D., eds., Geologic framework for the national assessment of carbon dioxide storage resources: U.S. Geological Survey Open-File Report 2012–1024–J, 40 p., http://dx.doi.org/10.3133/ofr20121024J.
ISSN 2331-1258 (online)
Any use of trade, product, or firm names is for descriptive purposes only and does not imply endorsement by the U.S. Government.
Although this report is in the public domain, permission must be secured from the individual copyright owners to reproduce any copyrighted material contained within this report.
iii
Editors’ Preface
By Peter D. Warwick and Margo D. Corum
The 2007 Energy Independence and Security Act (Public Law 110–140; U.S. Congress, 2007) directs the U.S. Geological Survey (USGS) to conduct a national assessment of potential geologic storage resources for carbon dioxide (CO2) and to consult with other Federal and State agencies to locate the pertinent geological data needed for the assessment. The geologic storage of CO2 is one possible way to mitigate its effects on climate change.
The methodology used by the USGS for the assessment was described by Brennan and others (2010), who revised the methodology by Burruss and others (2009) according to comments from peer reviewers, an external panel of experts, and members of the public. During the implementation phase of the assessment (from 2010 to 2012), several practical steps were added to the assessment methodology of Brennan and others (2010). The details of the methodology used in the assessment are described in Blondes and others (2013). The assessment methodology is non-economic and is intended to be used at regional to sub-basinal scales.
The operational unit of the assessment is a storage assessment unit (SAU), which is composed of a porous storage formation with fluid flow and an overlying fine-grained sealing unit. Assessments are conducted at the SAU level and are aggregated to basinal and regional results. SAUs have a minimum depth of 3,000 feet (ft), which ensures that the CO2 is in a supercritical state, and thus occupies less pore space than a gas. Standard SAUs have a maximum depth of 13,000 ft below the surface, a depth accessible with average injection pipeline pressures (Burruss and others, 2009; Brennan and others, 2010; Blondes and others, 2013). Where geologic conditions favor CO2 storage below 13,000 ft, an additional deep SAU is assessed.
The assessments are also constrained by the occurrence of relatively fresh formation water; any formation water having a salinity less than 10,000 parts per million (ppm, which is equivalent to milligrams per liter, mg/L) total dissolved solids (TDS), regardless of depth, has the potential to be used as a potable water supply (U.S. Environmental Protection Agency, 2009). The U.S. Environmental Protection Agency (EPA) (2010) defines the lower limit of 10,000 ppm (mg/L) TDS for injection of CO2. Therefore, the potential storage resources for CO2 in formations where formation waters have salinities less than 10,000 ppm (mg/L) TDS are not assessed (Brennan and others, 2010; Blondes and others, 2013).
This report series contains a geologic description of each SAU identified within each report’s assessed basins and focuses on particular characteristics specified in the methodology that influence the potential CO2 storage resource. The geologic framework information contained in these reports was used to calculate a statistical Monte Carlo-based distribution of potential storage space in the various SAUs following Brennan and others (2010) and Blondes and others (2013). Assessment data, results, and summary can be found in the U.S. Geological Survey Geologic Carbon Dioxide Storage Resources Assessment Team’s (2013a,b,c) reports. Figures in this report series show SAU boundaries and cell maps of well penetrations through the sealing unit into the top of the storage formation. Wells sharing the same well borehole are treated as a single penetration. Cell maps show the number of penetrating wells within one square mile and are derived from interpretations of incompletely attributed well data (IHS Energy Group, 2011; and other data as available), a digital compilation that is known not to include all drilling. The USGS does not expect to know the location of all wells and cannot guarantee the amount of drilling through specific formations in any given cell shown on cell maps.
iv
References Cited Blondes, M.S., Brennan, S.T., Merrill, M.D., Buursink, M.L., Warwick, P.D., Cahan, S.M., Cook, T.A.,
Corum, M.D., Craddock, W.H., DeVera, C.A., Drake, R.M., Drew, L.J., Freeman, P.A., Lohr, C.D., Olea, R.A., Roberts-Ashby, T.L., Slucher, E.R., and Varela, B.A., 2013, National assessment of geologic carbon dioxide storage resources—Methodology implementation: U.S. Geological Survey Open-File Report 2013–1055, 26 p., at http://pubs.usgs.gov/of/2013/1055/.
Brennan, S.T., Burruss, R.C., Merrill, M.D., Freeman, P.A., and Ruppert, L.F., 2010, A probabilistic assessment methodology for the evaluation of geologic carbon dioxide storage: U.S. Geological Survey Open-File Report 2010–1127, 31 p., accessed March 22, 2011, at http://pubs.usgs.gov/of/2010/1127/.
Burruss, R.C., Brennan, S.T., Freeman, P.A., Merrill, M.D., Ruppert, L.F., Becker, M.F., Herkelrath, W.N., Kharaka, Y.K., Neuzil, C.E., Swanson, S.M., Cook, T.A., Klett, T.R., Nelson, P.H., and Schenk, C.J., 2009, Development of a probabilistic assessment methodology for evaluation of carbon dioxide storage: U.S. Geological Survey Open-File Report 2009–1035, 81 p., accessed March 22, 2011, at http://pubs.usgs.gov/of/2009/1035/.
IHS Energy Group, 2011, ENERDEQ U.S. well data: IHS Energy Group, online database available from IHS Energy Group, 15 Inverness Way East, D205, Englewood, CO 80112, U.S.A., accessed January 20, 2011.
U.S. Congress, 2007, Energy Independence and Security Act of 2007—Public Law 110–140: U.S. Government Printing Office, 311 p., accessed October 30, 2012, at http://frwebgate.access.gpo.gov/cgi-bin/getdoc.cgi?dbname=110_cong_public_laws&docid=f:publ140.110.pdf.
U.S. Environmental Protection Agency, 2009, Safe Drinking Water Act (SDWA): Washington, D.C., U.S. Environmental Protection Agency Web site, accessed January 14, 2009, at http://www.epa.gov/ogwdw/sdwa/index.html.
U.S. Environmental Protection Agency, 2010, Final rule for Federal requirements under the underground injection control (UIC) program for carbon dioxide (CO2) geologic sequestration (GS) wells: Washington, D.C., U.S. Environmental Protection Agency Web site, accessed October 15, 2012, at http://water.epa.gov/type/groundwater/uic/class6/gsregulations.cfm.
U.S. Geological Survey Geologic Carbon Dioxide Storage Resources Assessment Team, 2013a, National assessment of geologic carbon dioxide storage resources—Summary (ver. 1.1, September 2013): U.S. Geological Survey Fact Sheet 2013–3020, 6 p. (Supersedes ver. 1.0 released June 26, 2013.), at http://pubs.usgs.gov/fs/2013/3020/.
U.S. Geological Survey Geologic Carbon Dioxide Storage Resources Assessment Team, 2013b, National assessment of geologic carbon dioxide storage resources—Data (ver. 1.1, September 2013): U.S. Geological Survey Data Series 774, 13 p., plus 2 appendixes and 2 large tables in separate files (Supersedes ver. 1.0 released June 26, 2013.), at http://pubs.usgs.gov/ds/774/.
U.S. Geological Survey Geologic Carbon Dioxide Storage Resources Assessment Team, 2013c, National assessment of geologic carbon dioxide storage resources—Results (ver. 1.1, September 2013): U.S. Geological Survey Circular 1386, 41 p. (Supersedes ver. 1.0 released June 26, 2013.), at http://pubs.usgs.gov/circ/1386/.
v
Contents Editors’ Preface ............................................................................................................................................................. iii References Cited ........................................................................................................................................................... iv Conversion Factors........................................................................................................................................................ vi Abbreviations ................................................................................................................................................................ vii Report Overview ............................................................................................................................................................ 1 Abstract ......................................................................................................................................................................... 3 Williston Basin Introduction ............................................................................................................................................ 4
Basin Physiography ................................................................................................................................................... 4 Geologic History ......................................................................................................................................................... 4 Hydrocarbon Exploration and Production ................................................................................................................... 5 Storage Resource Assessment .................................................................................................................................. 6
Deadwood and Black Island Formations SAU C50310101 and Deadwood and Black Island Formations Deep SAU C50310102 .................................................................................................................................................................... 9 Winnipegosis Formation, Interlake Formation, and Bighorn Group SAU C50310103 ...................................................12 Three Forks Formation and Jefferson Group SAU C50310104 ....................................................................................15 Kibbey Formation and Madison Group SAU C50310105 .............................................................................................18 Minnelusa Group SAU C50310106...............................................................................................................................21 Lower Swift Formation SAU C50310107 ......................................................................................................................23 Inyan Kara Group SAU C50310108..............................................................................................................................26 Newcastle Formation SAU C50310109 ........................................................................................................................29 Eagle Sandstone ..........................................................................................................................................................32 Central Montana Basins ...............................................................................................................................................33 Montana Thrust Belt .....................................................................................................................................................33 Acknowledgments ........................................................................................................................................................35 References Cited ..........................................................................................................................................................35
Figures Figure 1. Map of Williston Basin, Central Montana Basins, and Montana Thrust Belt study areas in Montana, North Dakota, and South Dakota ................................................................................................................................... 2 Figure 2. Map showing the Williston Basin study area, North Dakota, South Dakota, and Montana, including major structural features ................................................................................................................................................ 7 Figure 3. Generalized stratigraphic column of geologic units in the Williston Basin study area, North Dakota, South Dakota, and Montana .......................................................................................................................................... 8 Figure 4. Map showing the Deadwood and Black Island Formations, and Deadwood and Black Island Formations Deep Storage Assessment Units .............................................................................................................. 11 Figure 5. Map showing the Winnipegosis Formation, Interlake Formation, and Bighorn Group Storage Assessment Unit .......................................................................................................................................................... 14 Figure 6. Map showing the Three Forks Formation and Jefferson Group Storage Assessment Unit...................... 17 Figure 7. Map showing the Kibbey Formation and Madison Group Storage Assessment Unit ............................... 20 Figure 8. Map showing the Minnelusa Group Storage Assessment Unit ................................................................ 22 Figure 9. Map showing the Lower Swift Formation Storage Assessment Unit ........................................................ 25 Figure 10. Map showing the Inyan Kara Group Storage Assessment Unit................................................................ 28 Figure 11. Map showing the Newcastle Formation Storage Assessment Unit .......................................................... 31
vi
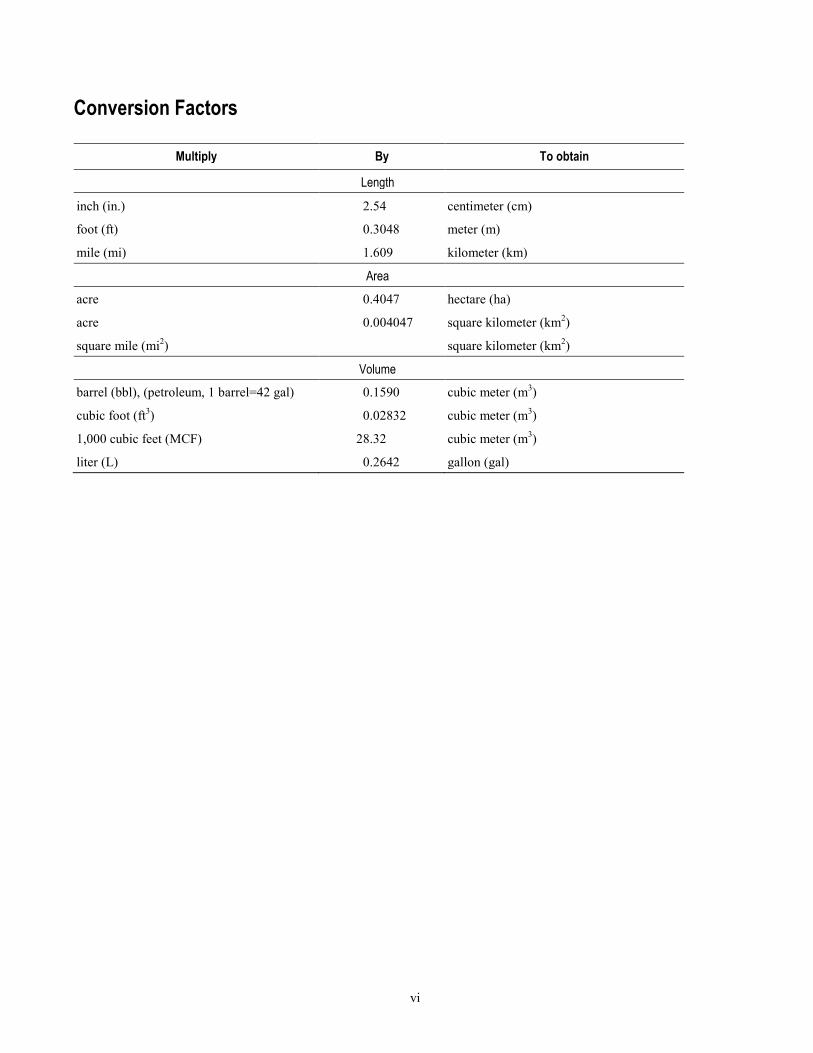
Conversion Factors
Multiply By To obtain
Length
inch (in.) 2.54 centimeter (cm)
foot (ft) 0.3048 meter (m)
mile (mi) 1.609 kilometer (km)
Area acre 0.4047 hectare (ha)
acre 0.004047 square kilometer (km2)
square mile (mi2) square kilometer (km2)
Volume barrel (bbl), (petroleum, 1 barrel=42 gal) 0.1590 cubic meter (m3)
cubic foot (ft3) 0.02832 cubic meter (m3)
1,000 cubic feet (MCF) 28.32 cubic meter (m3)
liter (L) 0.2642 gallon (gal)
vii
Abbreviations BCFG billion cubic feet of gas
CO2 carbon dioxide
EPA U.S. Environmental Protection Agency
mD millidarcy
mg/L milligrams per liter
MMBO million barrels of oil
MTB Montana Thrust Belt
NOGA national oil and gas assessment
OFR open-file report
ppm parts per million
SAU storage assessment unit
TDS total dissolved solids
USDW underground source of drinking water
USGS U.S. Geological Survey
1
Report Overview This three-part report contains the geologic framework for three adjacent study areas, including
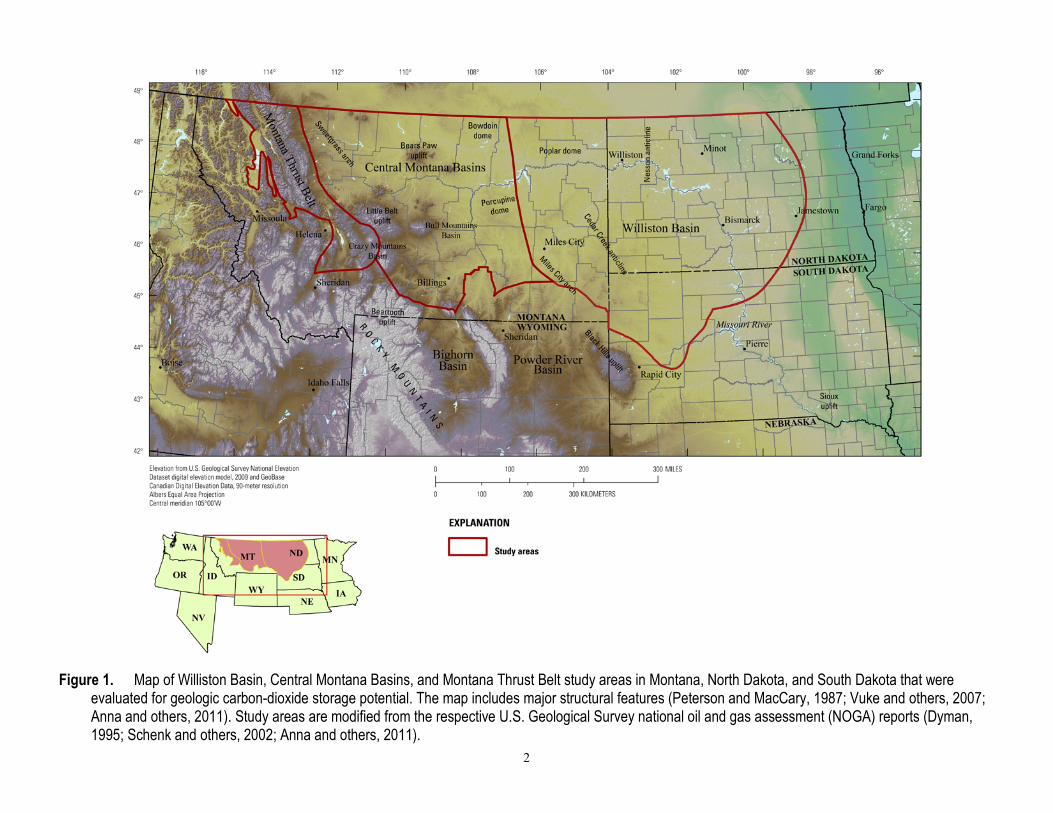
the Williston Basin, multiple Central Montana basins, and the Montana Thrust Belt (MTB) (fig. 1). Although these study areas are in close proximity and are included in a combined geologic framework report, the basins were formed and filled under different circumstances, and each is investigated and assessed separately, when amenable.
The Williston Basin study area is situated in the northern Great Plains and extends into North Dakota, South Dakota, Montana and Canada. It is a relatively large structural and sedimentary intracratonic basin, with Cambrian through Tertiary formations, and has no topographic depression. The Central Montana Basins study area contains many of the same Cambrian through Tertiary age formations found in the sedimentary basins east of the northern Rocky Mountain Cordillera. This wide study area encompasses numerous smaller basins and structural uplifts. The MTB study area occupies the mostly mountainous terrain of western Montana, and borders Canada and Idaho. The MTB comprises the Cordilleran Thrust Belt located within the State of Montana, includes Paleozoic to Tertiary age sedimentary units, and consists of numerous thrust sheets and intrusive bodies (Perry, 1995).
As in previous chapters of the Geologic Framework for the National Assessment of Carbon Dioxide Storage Resources series, geologists describe their investigation of the study areas and their work on unique storage assessments units (SAUs), when amenable. Furthermore, to preserve a consistent format across report chapters, these individual SAU descriptions are treated as top-level sections. Lastly, each of the three study areas requires a separate introduction to develop the geologic assessment framework, as in prior chapters of this series.
2
Figure 1. Map of Williston Basin, Central Montana Basins, and Montana Thrust Belt study areas in Montana, North Dakota, and South Dakota that were evaluated for geologic carbon-dioxide storage potential. The map includes major structural features (Peterson and MacCary, 1987; Vuke and others, 2007; Anna and others, 2011). Study areas are modified from the respective U.S. Geological Survey national oil and gas assessment (NOGA) reports (Dyman, 1995; Schenk and others, 2002; Anna and others, 2011).
3
Abstract The 2007 Energy Independence and Security Act directs the U.S. Geological Survey (USGS) to
conduct a national assessment of potential geologic storage resources for carbon dioxide (CO2). The methodology used by the USGS for the national CO2 assessment follows that of previous USGS work. This methodology is non-economic and is intended to be used at regional to sub-basinal scales.
The Williston Basin of North Dakota, South Dakota, and Montana, along with the Central Montana Basins and Montana Thrust Belt study areas are adjacent and share similar geologic units. In general, the Williston Basin study area is a wide sedimentary basin, whereas the Central Montana Basins study area contains sedimentary rocks along topographic highs and flat plains, and the Montana Thrust Belt study area is more structurally complex.
This report identifies and contains geologic descriptions of nine storage assessment units (SAUs) in Cambrian to Upper Cretaceous sedimentary rocks within the Williston Basin study area. The Central Montana Basins and Montana Thrust Belt study areas were also investigated for this report. Nevertheless, no SAUs in these study areas were assessed because they contained potential sources of underground drinking water; although sufficient geologic data were available, and suitable storage formations meeting our size, depth, reservoir quality, and regional seal guidelines were found. Ultimately, the report focuses on the characteristics, specified in the methodology, that influence the potential CO2 storage resource in the SAUs. Specific descriptions of the SAU boundaries as well as their sealing and reservoir units are included. Properties for each SAU, such as depth to top, gross thickness, porosity, permeability, groundwater quality, and structural reservoir traps, are usually provided to illustrate geologic factors critical to the assessment. The geologic information herein was employed, as specified in the USGS methodology, to calculate a probabilistic distribution of potential storage resources in each SAU with these assessment outputs contained in a companion results report.
Figures in this report show the study area boundaries along with the SAU extent and cell maps of well penetrations through sealing units into the top of the storage formations. The USGS does not necessarily know the location of all wells and cannot guarantee the full extent of drilling through specific formations in any given cell shown on the cell maps.
4
Geologic Framework for the National Assessment of Carbon Dioxide Storage Resources─Williston Basin, Central Montana Basins, and Montana Thrust Belt Study Areas
By Marc L. Buursink, Matthew D. Merrill, William H. Craddock, Tina L. Roberts-Ashby, Sean T. Brennan, Madalyn S. Blondes, Philip A. Freeman, Steven M. Cahan, Christina A. DeVera, and Celeste D. Lohr
Williston Basin Introduction Basin Physiography
The Williston Basin is a structural and sedimentary intracratonic basin on the western shelf of the Paleozoic North American craton (Peterson, 1995). The middle part of North America consisted of a thin craton prior to the Phanerozoic Eon followed by relatively thin and discontinuous Paleozoic sediments deposited on the shelf of the Cordilleran orogeny (Anna and others, 2011). Interaction between two Archean sheer systems may have controlled the evolution of the Williston Basin by creating a depressed block and initiating sedimentation (Gerhard and others, 1990). Thinning of most sedimentary units from basin center to basin edge reflects its structural simplicity (Peterson and MacCary, 1987; Pollastro and others, 2008).
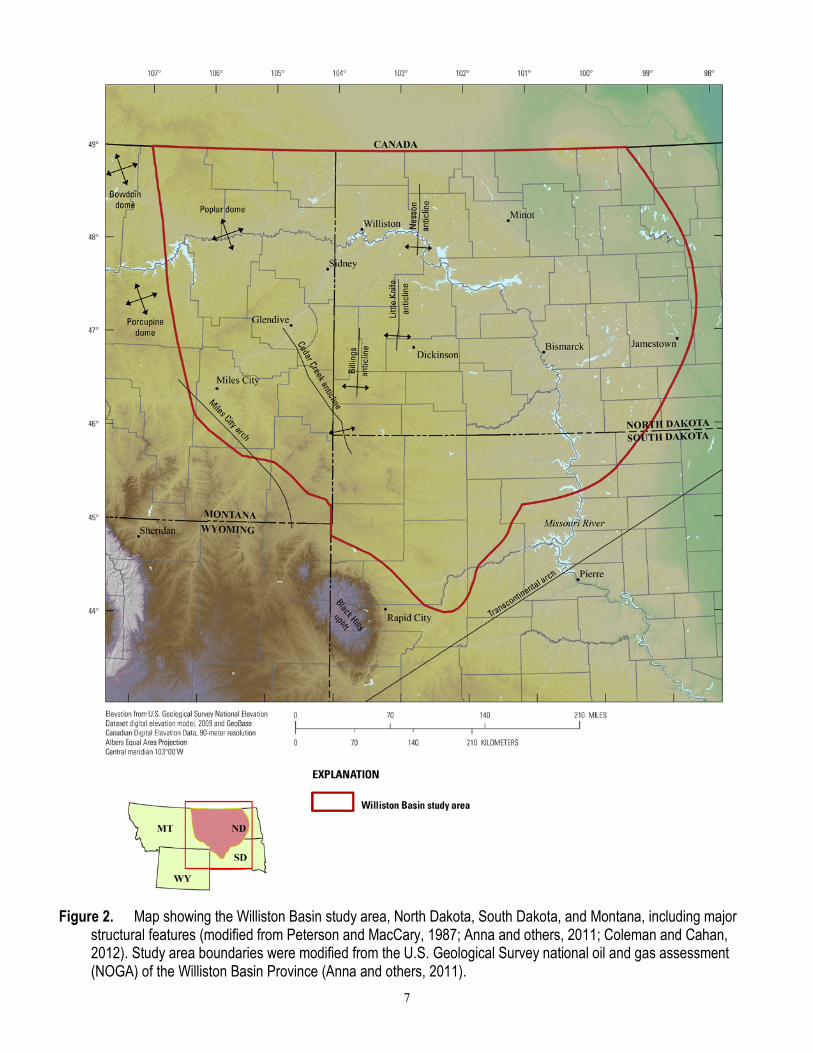
The elliptical basin is a mostly flat-lying, moderately dissected plain with little topographic relief, occupies a large segment of the northern Great Plains, and extends northward into Canada (Peterson, 1995; Pollastro and others, 2008) (figs. 1 and 2). Our Williston Basin study area is bordered to the southeast by the Transcontinental arch and to the north by the United States and Canada international border, whereas the western and southwestern borders are defined by the Bowdoin dome, Porcupine dome, Miles City arch, and Black Hills uplift, which are Laramide or rejuvenated Laramide structures (Peterson, 1995; Anna and others, 2011) (fig. 2). In Canada, the basin is defined by the Canadian Shield to the east and the Bow Island arch to the northwest (not shown in fig. 2).
The study area covers about 143,000 square miles across parts of North Dakota, South Dakota, and Montana, and contains a sedimentary rock volume of about 202,000 cubic miles (Peterson, 1995; Pollastro and others, 2008). Cambrian through Holocene sedimentary rocks are found in the basin, and the maximum thickness of Phanerozoic rocks is greater than 16,000 ft in North Dakota (Anna and others, 2011). Except for southwestern North Dakota and adjoining parts of eastern Montana and South Dakota, the Williston Basin is covered by Pleistocene glacial sediments (Gerhard and others, 1990). In the main part of the basin, the oldest outcrops are Late Cretaceous age, whereas lower Paleozoic rocks are exposed in Manitoba at the edge of the Canadian Shield and in the Black Hills of South Dakota (Gerhard and others, 1990).
Geologic History The Williston Basin began subsiding during the Late Cambrian or Early Ordovician and has
continued to subside through geologic time, with the center of subsidence remaining in about the same
5
position in northwestern North Dakota (Peterson, 1995). The stratigraphic record in the basin is relatively complete, though periodic erosional events have occurred throughout the basin’s history, with several cycles of marine transgression and regression resulting in alternating cycles of basin filling and draining having been recorded (Pollastro and others, 2008). Basin filling initiated on crystalline Precambrian basement of the Cordilleran shelf, which subsided minimally (Gerhard and others, 1990).
The relatively complete stratigraphic record shows carbonate deposition in the Paleozoic and siliciclastic deposition in the Mesozoic and Cenozoic. The Paleozoic carbonate rocks are stacked, cyclic, and vary in thickness, except for an initial Phanerozoic transgression that resulted in deposition of Cambrian and Lower Ordovician clastic sediments (Anna and others, 2011). The carbonate interval in the basin includes minor to extensive hiatuses resulting in multiple unconformities, deposition of anhydrites, and secondary dolomitization of limestone (Anna and others, 2011). The mostly clastic interval in the basin was deposited in multiple environments, including continental, shoreline, and basin settings, and it consists of mudstone, shale, sandstone, siltstone, and coal lithologies (Anna and others, 2011). Anna and others (2011, p. 3) explain that “because water depths in the basin during the Phanerozoic were relatively shallow, a small change in water depth resulted in substantial depositional environment and sedimentation changes.”
Strong folding episodes did not occur in the Williston Basin, because it is underlain by cratonic crust, though structural styles in the basin include both classic basement-involved structures resulting in anticlines and more subtle low-relief features (Gerhard and others, 1990). Deformation during the Phanerozoic consisted mostly of fault displacements and subsequent sedimentation (Gerhard and others, 1990). Structural styles, sedimentation, and major faults, lineaments, and fractures in the basin are related to regional wrench-fault tectonics coupled with large-scale tears from two major shear systems (Pollastro and others, 2008). These two Archean shear systems are the Brockton-Froid-Fromberg and Colorado-Wyoming shear zones (Gerhard and others, 1990; Pollastro and others, 2008). The Nesson and Cedar Creek anticlines (fig. 2) resulted from these tectonics and are examples of the complex petroleum trapping in the study area. For further information on Williston Basin geologic history, the reader is referred to Gerhard and Anderson (1988), Peterson (1988), Hunter and Schalla (1995), and Christopher and others (1998).
Hydrocarbon Exploration and Production The Williston Basin is similar to many other petroleum provinces where discovery and production
of hydrocarbons is strongly controlled by and distributed along geologic structures (Pollastro and others, 2008). For example the two large fault-bounded anticlinal features in the basin, the Nesson and Cedar Creek anticlines, have trapped and produced most of its petroleum (Gerhard and others, 1990). Consequently, production is confined to the northern and western parts of the study area, which outlines the general area where source rocks have been buried to depths sufficient to generate hydrocarbons (Anna and others, 2011). Most of the hydrocarbons produced from the Cedar Creek anticline and in Canada migrated to these areas from deeper in the basin.
Hydrocarbon exploration in the Williston Basin was infrequent prior to World War II, and few deep wells were successful. Shallow gas was discovered in the Upper Cretaceous Eagle Sandstone on the Cedar Creek anticline in southeastern Montana in 1916 (Peterson, 1995). Following World War II, major petroleum companies renewed their interest in the deeper prospects of the basin. This new activity lead to the 1951 Beaver Lodge field discovery by the Amerada Oil Company on the Nesson anticline in North Dakota and the Richey and Southwest Richey fields discoveries by Shell Oil Company in eastern Montana (Peterson, 1995). Additional discoveries followed on the Nesson anticline trend by Amerada and other companies, and on the Cedar Creek anticline by Shell. Early production on the Nesson anticline occurred mainly from Mississippian carbonate reservoirs and on the Cedar Creek anticlines from Ordovician and Silurian carbonate reservoirs. By the 1960s about 25 large fields of greater than 15 MMBO (million barrels of oil) had been discovered, and later in the 1970s several important large fields
6
and many smaller ones were discovered, particularly in the deeper Ordovician Red River Formation and in the Silurian and Devonian reservoirs (Peterson, 1995).
The deepest well drilled in the basin to date penetrated Precambrian crystalline rocks at 15,340 ft (4,677 m; location not published); the deepest oil production is from the Ordovician Red River Formation at 14,343 ft (4,372 m) in the Mesa No. 113 Brandvik well in west central North Dakota (Gerhard and others, 1990). To date, the Williston Basin continues as a prolific hydrocarbon producing province, with cumulative production through 2008 alone reaching 2,740 MMBO and 2,700 billion cubic feet of gas (BCFG) coming mostly from the Madison Group and Red River Formation reservoirs (Anna and others, 2011). In all, hydrocarbons have been produced from Cambrian, Ordovician, Silurian, Devonian, Mississippian, Pennsylvania, and Triassic age reservoirs in the Williston Basin (Peterson, 1995). Production has undergone several cycles, starting with conventional oil production with associated gas, and then unconventional production from the Bakken and other formations as part of the latest cycle.
Storage Resource Assessment The USGS regional carbon dioxide (CO2) storage resource assessment of the Williston Basin
resulted in nine SAUs. Each SAU is described in the following sections and includes a storage formation and regional seal pair. The SAU name is typically based on the whole stratigraphic interval or lithology considered for storage (fig. 3). The geographic extents of the SAUs are defined by the depth to the top of the storage formation and by the geologic characteristics of the reservoir and overlying seal. Geologic characteristics described or considered for each SAU include both the seal and reservoir thickness, distribution, and the reservoir quality (such as net-to-gross ratio, porosity, and permeability). Furthermore, we identify regional trends in groundwater quality because the U.S. Environmental Protection Agency (2009, 2010) stipulates that underground sources of drinking water (USDW) with a total dissolved solids (TDS) concentration less than 10,000 mg/L (milligrams per liter [ppm]) may not be used for CO2 storage. For the Williston Basin assessment, groundwater-quality data, based on TDS content, was compiled from multiple sources, including databases (Breit, 2002; Gulf Coast Carbon Center, 2012) and publications (Busby and others, 1995; Bachu and Hitchon, 1996) as described in subsequent sections. As part of the USGS assessment, results from a prior storage capacity investigation in the Williston Basin by Sorenson, Bailey, and others (2009), and by Sorensen, Smith, and others (2009) were consulted, along with data for the Weyburn storage and monitoring project (Saskatchewan Industry and Resources, 2004) and studies by the Plains CO2 Reduction (PCOR) Partnership (2012).
This assessment was conducted following the methodology of Burruss and others (2009), Brennan and others (2010), and Blondes and others (2013) that prescribes the geologic model employed here, a probabilistic statistical analysis, and subsurface conditions favoring supercritical phase CO2. Subsurface conditions favoring CO2 storage at high density include relatively high basin pressures and temperatures (Buursink, 2012). Based on the methodologies, our storage resource was allocated between residual trapping (typically larger but less certain) and buoyant trapping (typically smaller but more certain). Residual trapping occurs at the pore scale, and buoyant trapping is analogous to stratigraphic and (or) structural hydrocarbon trapping. The minimum buoyant-trapping volume is determined from cumulative oil and gas production together with the known hydrocarbon reserve volume, whereas the most likely buoyant-trapping volume adds the minimum volume and the estimated volumes of undiscovered resources (Brennan and others, 2010). The maximum buoyant resource is determined by the assessment geologist. Upon completion of the assessment, the following SAUs, listed by name and number, were described: Deadwood and Black Island Formations C50310101; Deadwood and Black Island Formations Deep C50310102; Winnipegosis Formation, Interlake Formation, and Bighorn Group C50310103; Three Forks Formation and Jefferson Group C50310104; Kibbey Formation and Madison Group C50310105; Minnelusa Group C50310106; Lower Swift Formation C50310107; Inyan Kara Group C50310108; and Newcastle Formation C50310109.
7
Figure 2. Map showing the Williston Basin study area, North Dakota, South Dakota, and Montana, including major structural features (modified from Peterson and MacCary, 1987; Anna and others, 2011; Coleman and Cahan, 2012). Study area boundaries were modified from the U.S. Geological Survey national oil and gas assessment (NOGA) of the Williston Basin Province (Anna and others, 2011).
8
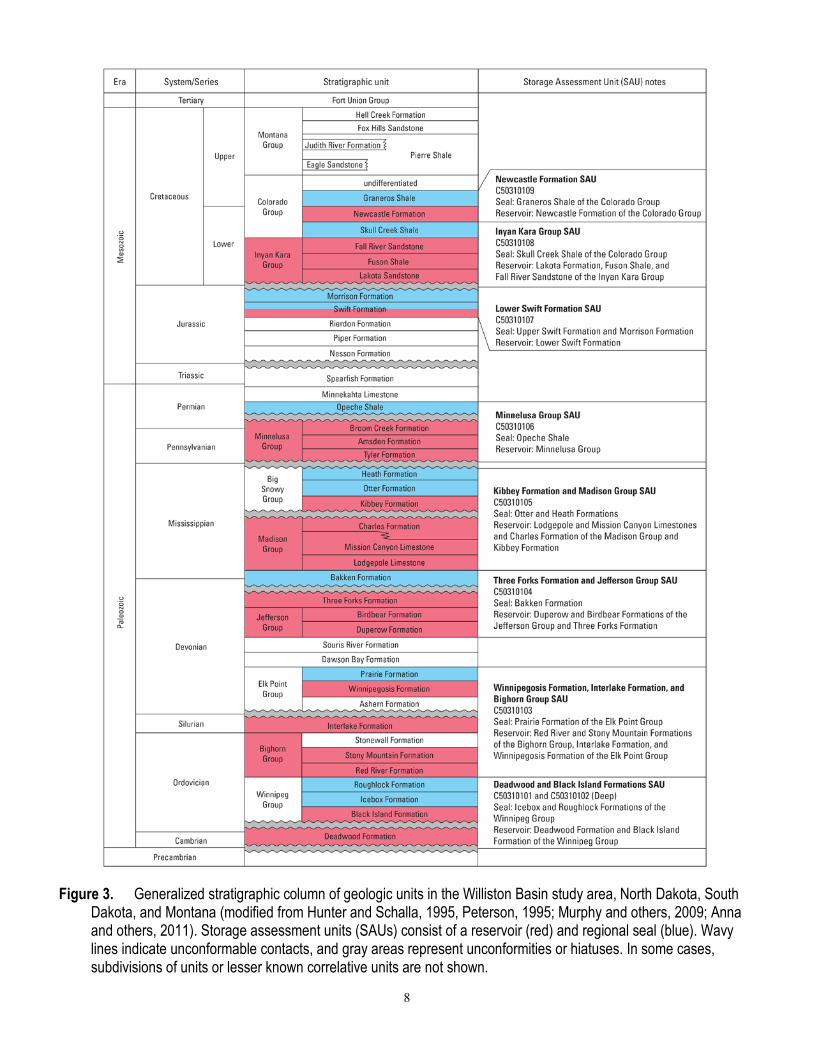
Figure 3. Generalized stratigraphic column of geologic units in the Williston Basin study area, North Dakota, South Dakota, and Montana (modified from Hunter and Schalla, 1995, Peterson, 1995; Murphy and others, 2009; Anna and others, 2011). Storage assessment units (SAUs) consist of a reservoir (red) and regional seal (blue). Wavy lines indicate unconformable contacts, and gray areas represent unconformities or hiatuses. In some cases, subdivisions of units or lesser known correlative units are not shown.
9
Deadwood and Black Island Formations SAU C50310101 and Deadwood and Black Island Formations Deep SAU C50310102
By Marc L. Buursink
The Deadwood and Black Island Formations SAUs consist of those intervals of the preserved Cambrian and Ordovician siliciclastic lithology deemed suitable as reservoirs for CO2 storage and occurring beneath a regionally extensive seal in the Williston Basin. These are composite SAUs composed of multiple storage formations including the Deadwood and Black Island Formations (fig. 3). The Deadwood Formation consists of sandstone and a variable sequence of shale and impure limestone at its type locality near Deadwood in the Black Hills, South Dakota (Fuller, 1961; Lochman-Balk and Wilson, 1967). Specifically, the predominant basal sandstone is brown, micaceous, and glauconitic and is nonconformably underlain by Precambrian quartzite, granite, or gneiss (Kline, 1942; Carlson, 1960). The Deadwood Formation is interpreted as a stable shelf or onlap sequence deposit extending eastward from the Cordilleran geosyncline (Carlson and Anderson, 1965). The Black Island Formation of the Winnipeg Group (fig. 3) primarily consists of clean quartz sandstone and attains a thickness of more than 160 feet on the Nesson anticline (Carlson and Anderson, 1965). The Black Island Formation unconformably overlies the Deadwood Formation, except in eastern North Dakota where it onlaps the Deadwood and nonconformably overlies Precambrian rocks (Carlson and Anderson, 1965). The Winnipeg Group consists of more than 300 feet of basal sandstone and overlying shale units, which outline the early Williston Basin and were deposited under shoaling conditions (Fuller, 1961; Lochman-Balk and Wilson, 1967). The high sandstone content of the western part of the Winnipeg Group suggests a western source (Foster, 1972). Regionally the Middle Ordovician Icebox and Roughlock Formations, deposited during transgressive events when the Williston Basin was part of an extensive epicontinental sea (Carlson and Anderson, 1965; Blakey, 2011), overlie the Black Island Formation and function as the SAU sealing formations (fig. 3). The Icebox Formation consists of greenish-gray and noncalcareous shale and averages more than 100 feet in thickness around the center of the basin (McCoy, 1952; Carlson, 1960). The Roughlock Formation consists of calcareous siltstones and silty dolomite and is usually relatively thin (about 20 feet thick) but attains a thickness of 80 feet in southeastern North Dakota (McCoy, 1952; Carlson, 1960).
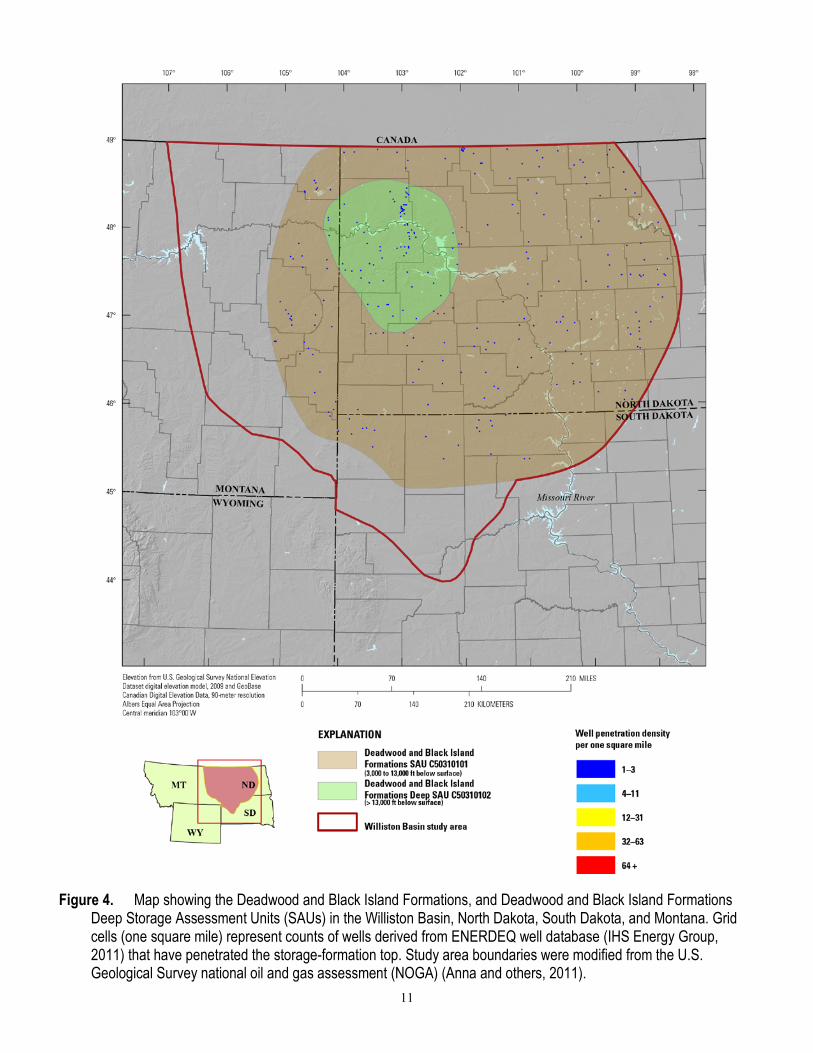
The SAU boundaries are defined by the depth below the surface of the uppermost storage-formation top and by the extent of the regional seal. Formation-top picks, reported in a proprietary commercial database (IHS Energy Group, 2011), for the Black Island Formation constrain the SAU boundaries. The Deadwood and Black Island Formations SAU lies between 3,000 and 13,000 ft in depth and covers about a 41-million acre most likely area; and the Deadwood and Black Island Formations Deep SAU lies between 13,000 and 15,000 ft and covers about a 6-million acre most likely area (fig. 4). The SAUs do not extend into the western Williston Basin because the regional seal is absent (Foster, 1972), and they do not extend into Canada because this is a U.S. national assessment. These interpretations are supported by structure contour and isopach maps from Carlson and Anderson (1965), from Downey (1986), from Peterson and MacCary (1987), and from Timothy Nesheim (North Dakota Geological Survey, written commun., 2011), and supplemented by the Geologic Atlas of the Rocky Mountain Region maps and cross sections (Foster, 1972).
The Deadwood and Black Island Formations SAU gross thickness ranges from 150 to 600 ft with a net thickness between 90 and 360 ft, and the Deadwood and Black Island Formations Deep SAU gross thickness ranges from 800 to 1,100 ft with a net thickness between 440 and 600 ft. Because these are composite SAUs, isopach maps of the individual storage formations were first scanned, geo-referenced,
10
and digitized; and then thickness values from the maps were scaled by formation-specific net-to-gross ratio derived from the literature and well logs (Foster, 1972; LeFever and others, 1987; Ellingson and LeFever, 1995; Anna, 2011). Finally, using a geographic information system, the net-porous interval of the composite SAU was summed (Buursink and others, 2011).
In the Williston Basin, the Deadwood and Black Island Formations comprise a marginally productive hydrocarbon interval (Peterson, 1995; Anna and others, 2011) with reservoir-quality data reported in multiple forms. Besides published porosity and permeability estimates (Stocker, 1956; Laird, 1964) and those reported by Timothy Nesheim (North Dakota Geological Survey, written commun., 2011) for this interval, additional values are estimated from relevant siliciclastic analogs (Ehrenberg and others, 2009), and average field values are extracted from Nehring Associates, Inc. (2010). The Deadwood and Black Island Formations SAU porosity ranges from 6 to 16 percent and permeability ranges from 0.01 to 5,000 millidarcies (mD); the Deadwood and Black Island Formations Deep SAU porosity ranges from 3 to 6 percent and permeability ranges from 0.001 to 10 mD.
Water-quality data obtained from multiple sources, including databases (Breit, 2002; Gulf Coast Carbon Center, 2012) and publications (Downey and others, 1987; Busby and others, 1995; Bachu and Hitchon, 1996; Otton, 2006) for the study area indicated mixed freshwater and saline water areas in the SAUs. Storage-formation areas with groundwater below the 10,000 mg/L (ppm) total TDS limit were identified and discounted in the assessment. Generally, groundwater TDS values increase slightly with depth in the Deadwood and Black Island Formations SAU. In the Deadwood and Black Island Formations Deep SAU, the groundwater TDS value is above the USDW limit of 10,000 mg/L (ppm), and therefore the entire SAU area is available for storage. To generate a probabilistic maximum volume for buoyant trapping for each SAU, the size and location of mapped structural features (Peterson and MacCary, 1987; Gerhard and others, 1990) and NOGA play descriptions (Peterson, 1995; Anna and others, 2011) were used to extrapolate current hydrocarbon fields. The extrapolated Nehring Associates, Inc. (2010) average field size and field locations, along with the mean average SAU porosity and most likely net thickness, were used to estimate the maximum buoyant trapping resource.
11
Figure 4. Map showing the Deadwood and Black Island Formations, and Deadwood and Black Island Formations Deep Storage Assessment Units (SAUs) in the Williston Basin, North Dakota, South Dakota, and Montana. Grid cells (one square mile) represent counts of wells derived from ENERDEQ well database (IHS Energy Group, 2011) that have penetrated the storage-formation top. Study area boundaries were modified from the U.S. Geological Survey national oil and gas assessment (NOGA) (Anna and others, 2011).
12
Winnipegosis Formation, Interlake Formation, and Bighorn Group SAU C50310103
By Marc L. Buursink
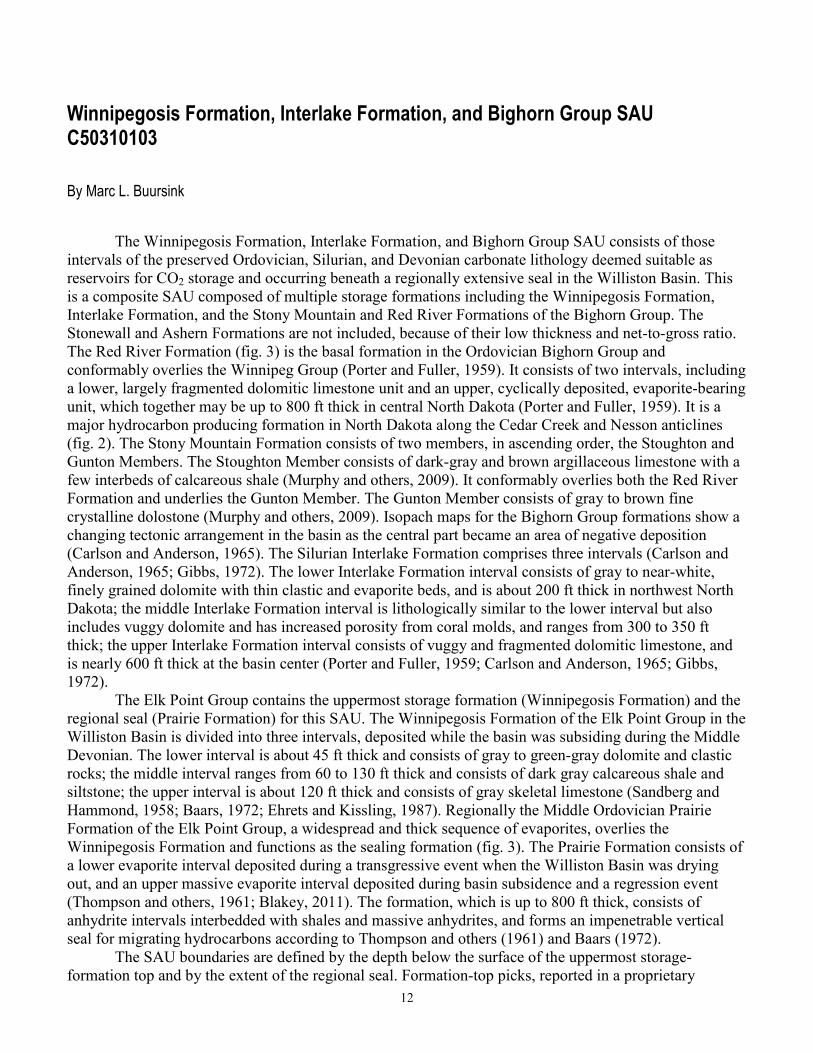
The Winnipegosis Formation, Interlake Formation, and Bighorn Group SAU consists of those intervals of the preserved Ordovician, Silurian, and Devonian carbonate lithology deemed suitable as reservoirs for CO2 storage and occurring beneath a regionally extensive seal in the Williston Basin. This is a composite SAU composed of multiple storage formations including the Winnipegosis Formation, Interlake Formation, and the Stony Mountain and Red River Formations of the Bighorn Group. The Stonewall and Ashern Formations are not included, because of their low thickness and net-to-gross ratio. The Red River Formation (fig. 3) is the basal formation in the Ordovician Bighorn Group and conformably overlies the Winnipeg Group (Porter and Fuller, 1959). It consists of two intervals, including a lower, largely fragmented dolomitic limestone unit and an upper, cyclically deposited, evaporite-bearing unit, which together may be up to 800 ft thick in central North Dakota (Porter and Fuller, 1959). It is a major hydrocarbon producing formation in North Dakota along the Cedar Creek and Nesson anticlines (fig. 2). The Stony Mountain Formation consists of two members, in ascending order, the Stoughton and Gunton Members. The Stoughton Member consists of dark-gray and brown argillaceous limestone with a few interbeds of calcareous shale (Murphy and others, 2009). It conformably overlies both the Red River Formation and underlies the Gunton Member. The Gunton Member consists of gray to brown fine crystalline dolostone (Murphy and others, 2009). Isopach maps for the Bighorn Group formations show a changing tectonic arrangement in the basin as the central part became an area of negative deposition (Carlson and Anderson, 1965). The Silurian Interlake Formation comprises three intervals (Carlson and Anderson, 1965; Gibbs, 1972). The lower Interlake Formation interval consists of gray to near-white, finely grained dolomite with thin clastic and evaporite beds, and is about 200 ft thick in northwest North Dakota; the middle Interlake Formation interval is lithologically similar to the lower interval but also includes vuggy dolomite and has increased porosity from coral molds, and ranges from 300 to 350 ft thick; the upper Interlake Formation interval consists of vuggy and fragmented dolomitic limestone, and is nearly 600 ft thick at the basin center (Porter and Fuller, 1959; Carlson and Anderson, 1965; Gibbs, 1972).
The Elk Point Group contains the uppermost storage formation (Winnipegosis Formation) and the regional seal (Prairie Formation) for this SAU. The Winnipegosis Formation of the Elk Point Group in the Williston Basin is divided into three intervals, deposited while the basin was subsiding during the Middle Devonian. The lower interval is about 45 ft thick and consists of gray to green-gray dolomite and clastic rocks; the middle interval ranges from 60 to 130 ft thick and consists of dark gray calcareous shale and siltstone; the upper interval is about 120 ft thick and consists of gray skeletal limestone (Sandberg and Hammond, 1958; Baars, 1972; Ehrets and Kissling, 1987). Regionally the Middle Ordovician Prairie Formation of the Elk Point Group, a widespread and thick sequence of evaporites, overlies the Winnipegosis Formation and functions as the sealing formation (fig. 3). The Prairie Formation consists of a lower evaporite interval deposited during a transgressive event when the Williston Basin was drying out, and an upper massive evaporite interval deposited during basin subsidence and a regression event (Thompson and others, 1961; Blakey, 2011). The formation, which is up to 800 ft thick, consists of anhydrite intervals interbedded with shales and massive anhydrites, and forms an impenetrable vertical seal for migrating hydrocarbons according to Thompson and others (1961) and Baars (1972).
The SAU boundaries are defined by the depth below the surface of the uppermost storage-formation top and by the extent of the regional seal. Formation-top picks, reported in a proprietary
13
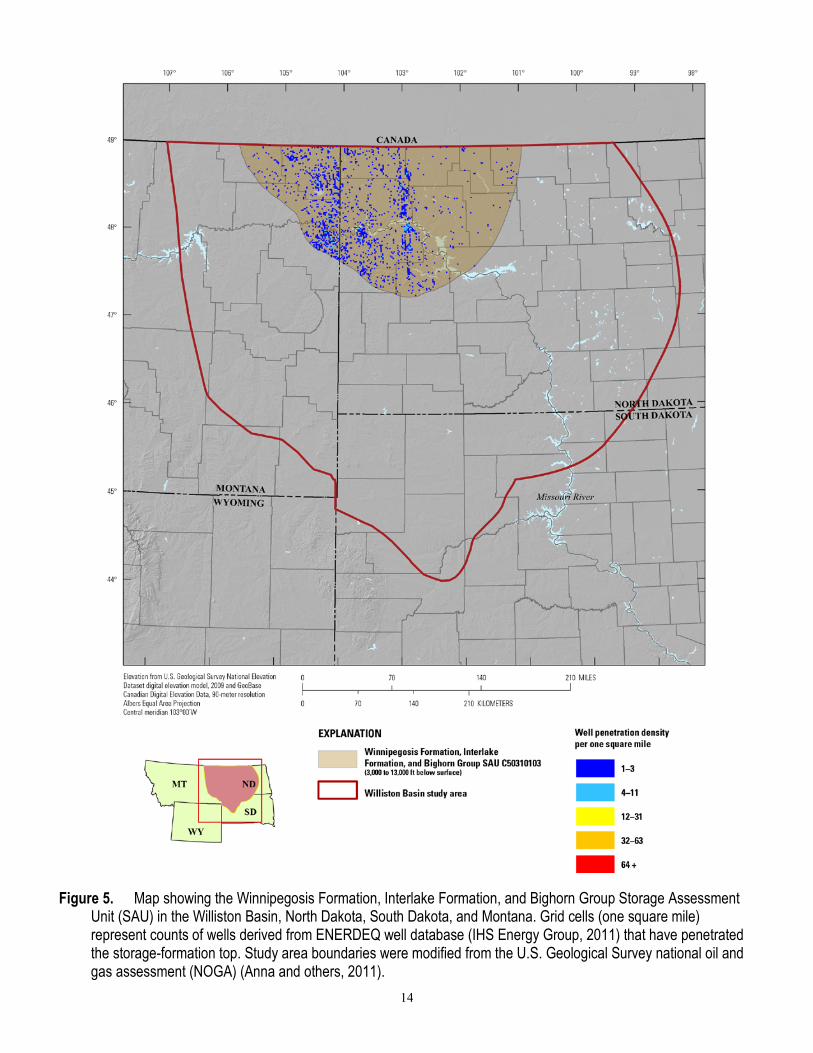
commercial database (IHS Energy Group, 2011), for the Winnipegosis Formation constrain the SAU boundary. The Winnipegosis Formation, Interlake Formation, and Bighorn Group SAU lies between 3,000 and 13,000 ft in depth and covers about an 11-million acre most likely area (fig. 5). The SAU does not extend into the southeastern Williston Basin because the regional seal is absent and does not extend into Canada because this is a U.S. national assessment. These interpretations are supported by structure contour and isopach maps from Sandberg (1961), Thompson and others (1961), Carlson and Anderson (1965), and Downey (1986), and are supplemented by the Geologic Atlas of the Rocky Mountain Region maps and cross sections (Baars, 1972).
The Winnipegosis Formation, Interlake Formation, and Bighorn Group SAU gross thickness ranges from 1,600 to 2,200 ft with a net thickness between 760 and 1,100 ft. Because these are composite SAUs, isopach maps of the individual storage formations were first scanned, geo-referenced, and digitized; and then thickness values from the maps were scaled by formation-specific net-to-gross ratio derived from the literature and well logs (Porter and Fuller, 1959; Foster, 1972; Gibbs, 1972; Baars, 1972; Ehrets and Kissling, 1987; Megathan, 1987; Anna, 2011). Finally, using a geographic information system, the net-porous interval of the composite SAU was summed (Buursink and others, 2011).
In the Williston Basin, the Winnipegosis Formation, Interlake Formation, and Bighorn Group comprise a productive hydrocarbon interval (Peterson, 1995; Anna and others, 2011) with reservoir-quality data reported in multiple forms. Besides published porosity and permeability estimates (Porter and Fuller, 1959; Inden and others, 1998; LeFever, 2006) for this interval, additional values are estimated from relevant carbonate analogs (Schmoker and others, 1985; Ehrenberg and others, 2006; Ehrenberg and others, 2009), and average field values are extracted from Nehring Associates, Inc. (2010). The reservoir portion of the Winnipegosis Formation consists of pinnacle reefs and this affects our net-to-gross ratio, porosity, and permeability estimates for the SAU (Fischer and Burke, 1987). The Winnipegosis Formation, Interlake Formation, and Bighorn Group SAU porosity ranges from 6 to 16 percent and permeability ranges from 0.01 to 200 mD.
Water-quality data obtained from multiple databases (Breit, 2002; Gulf Coast Carbon Center, 2012) and publications (Downey and others, 1987; Busby and others, 1995; Bachu and Hitchon, 1996; Otton, 2006) for the study area indicated predominantly saline waters in the SAU. No assessed areas with groundwater below the 10,000 mg/L (ppm) total TDS limit were identified, and therefore the entire SAU area is available for storage. The presence of the overlying evaporite seal supports this interpretation. To generate a probabilistic maximum volume for buoyant trapping for each SAU, the size and location of mapped structural features (Peterson and MacCary, 1987; Gerhard and others, 1990) and NOGA play descriptions (Peterson, 1995; Anna and others, 2011) were used to estimate hydrocarbon field distribution. The extrapolated Nehring Associates, Inc. (2010) average field size and field locations, along with the mean average SAU porosity and most likely net thickness, were used to estimate the maximum buoyant trapping resource.
14
Figure 5. Map showing the Winnipegosis Formation, Interlake Formation, and Bighorn Group Storage Assessment Unit (SAU) in the Williston Basin, North Dakota, South Dakota, and Montana. Grid cells (one square mile) represent counts of wells derived from ENERDEQ well database (IHS Energy Group, 2011) that have penetrated the storage-formation top. Study area boundaries were modified from the U.S. Geological Survey national oil and gas assessment (NOGA) (Anna and others, 2011).
15
Three Forks Formation and Jefferson Group SAU C50310104
By Tina L. Roberts-Ashby
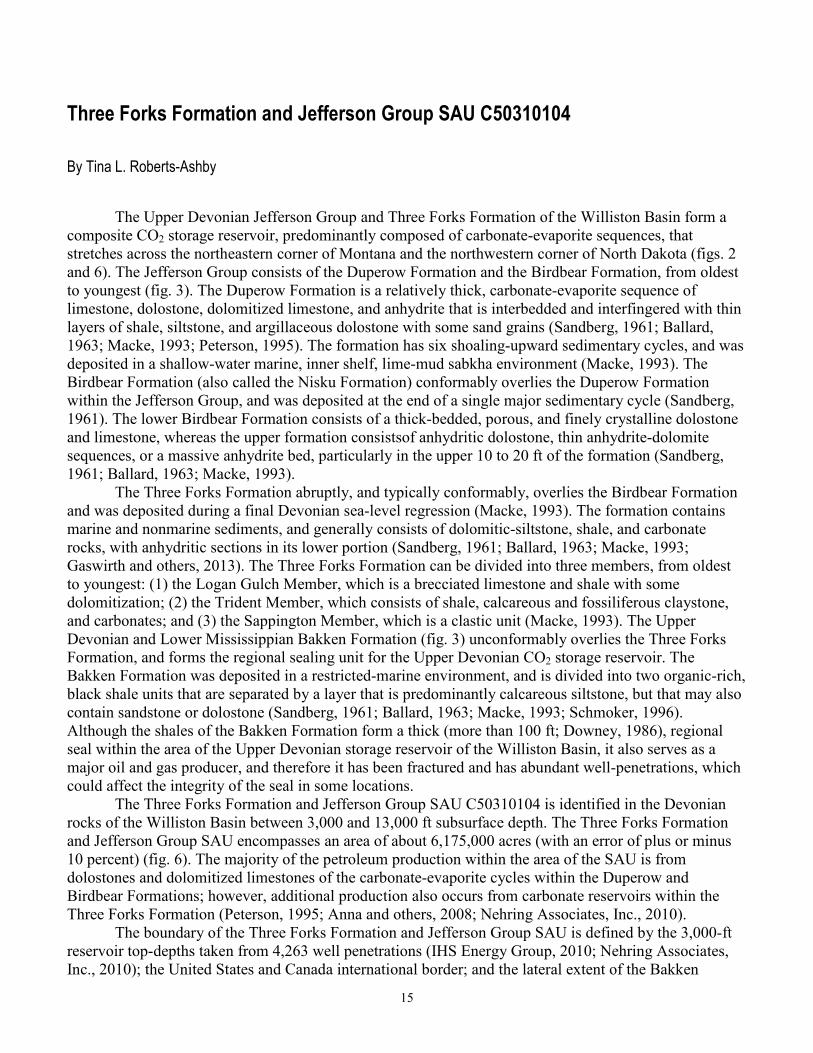
The Upper Devonian Jefferson Group and Three Forks Formation of the Williston Basin form a composite CO2 storage reservoir, predominantly composed of carbonate-evaporite sequences, that stretches across the northeastern corner of Montana and the northwestern corner of North Dakota (figs. 2 and 6). The Jefferson Group consists of the Duperow Formation and the Birdbear Formation, from oldest to youngest (fig. 3). The Duperow Formation is a relatively thick, carbonate-evaporite sequence of limestone, dolostone, dolomitized limestone, and anhydrite that is interbedded and interfingered with thin layers of shale, siltstone, and argillaceous dolostone with some sand grains (Sandberg, 1961; Ballard, 1963; Macke, 1993; Peterson, 1995). The formation has six shoaling-upward sedimentary cycles, and was deposited in a shallow-water marine, inner shelf, lime-mud sabkha environment (Macke, 1993). The Birdbear Formation (also called the Nisku Formation) conformably overlies the Duperow Formation within the Jefferson Group, and was deposited at the end of a single major sedimentary cycle (Sandberg, 1961). The lower Birdbear Formation consists of a thick-bedded, porous, and finely crystalline dolostone and limestone, whereas the upper formation consistsof anhydritic dolostone, thin anhydrite-dolomite sequences, or a massive anhydrite bed, particularly in the upper 10 to 20 ft of the formation (Sandberg, 1961; Ballard, 1963; Macke, 1993).
The Three Forks Formation abruptly, and typically conformably, overlies the Birdbear Formation and was deposited during a final Devonian sea-level regression (Macke, 1993). The formation contains marine and nonmarine sediments, and generally consists of dolomitic-siltstone, shale, and carbonate rocks, with anhydritic sections in its lower portion (Sandberg, 1961; Ballard, 1963; Macke, 1993; Gaswirth and others, 2013). The Three Forks Formation can be divided into three members, from oldest to youngest: (1) the Logan Gulch Member, which is a brecciated limestone and shale with some dolomitization; (2) the Trident Member, which consists of shale, calcareous and fossiliferous claystone, and carbonates; and (3) the Sappington Member, which is a clastic unit (Macke, 1993). The Upper Devonian and Lower Mississippian Bakken Formation (fig. 3) unconformably overlies the Three Forks Formation, and forms the regional sealing unit for the Upper Devonian CO2 storage reservoir. The Bakken Formation was deposited in a restricted-marine environment, and is divided into two organic-rich, black shale units that are separated by a layer that is predominantly calcareous siltstone, but that may also contain sandstone or dolostone (Sandberg, 1961; Ballard, 1963; Macke, 1993; Schmoker, 1996). Although the shales of the Bakken Formation form a thick (more than 100 ft; Downey, 1986), regional seal within the area of the Upper Devonian storage reservoir of the Williston Basin, it also serves as a major oil and gas producer, and therefore it has been fractured and has abundant well-penetrations, which could affect the integrity of the seal in some locations.
The Three Forks Formation and Jefferson Group SAU C50310104 is identified in the Devonian rocks of the Williston Basin between 3,000 and 13,000 ft subsurface depth. The Three Forks Formation and Jefferson Group SAU encompasses an area of about 6,175,000 acres (with an error of plus or minus 10 percent) (fig. 6). The majority of the petroleum production within the area of the SAU is from dolostones and dolomitized limestones of the carbonate-evaporite cycles within the Duperow and Birdbear Formations; however, additional production also occurs from carbonate reservoirs within the Three Forks Formation (Peterson, 1995; Anna and others, 2008; Nehring Associates, Inc., 2010).
The boundary of the Three Forks Formation and Jefferson Group SAU is defined by the 3,000-ft reservoir top-depths taken from 4,263 well penetrations (IHS Energy Group, 2010; Nehring Associates, Inc., 2010); the United States and Canada international border; and the lateral extent of the Bakken
16
Formation seal where it is at least 75 ft thick, as determined from differencing formation tops from 2,882 wells (IHS Energy Group, 2010) and from a published isopach map (Downey, 1986). The rocks within the SAU deepen and thicken toward the center of the basin, and on average range from 700 to 825 ft thick with a most likely thickness of 750 ft, as determined from differencing formation tops from 2,152 well penetrations located throughout the SAU (IHS Energy Group, 2010).
The carbonates within many of the carbonate-evaporite sequences of the SAU commonly contain reefoid or mound buildups that have been largely dolomitized and contain abundant porosity (Peterson, 1995). Average porosity in the porous intervals of the Three Forks Formation and Jefferson Group SAU is 10 to 17 percent, with a most likely value of 12 percent (Nehring Associates, Inc., 2010). Net porous interval thickness was estimated by multiplying the total storage formation thickness by an average net-to-gross thickness ratio of 0.35, which was interpreted from geophysical logs. This resulted in an estimated average net porous interval thickness that ranges from 245 to 290 ft, with a most likely value of 260 ft for the Three Forks Formation and Jefferson Group SAU. Average permeability in the SAU is 0.5 to 100 mD, with a most likely value of 30 mD (Nehring Associates, Inc., 2010).
Previous investigations of Devonian rocks in the Williston Basin report TDS values within formation waters of these rocks that on average range from 19,000 to 120,000 mg/L (ppm), but may be more than 400,000 mg/L (ppm) in the area of the SAU (Barnes, 1952; Downey, 1986). Additionally, wells sampled within the confines of the SAU indicate formation waters have TDS values that are saline and over 400,000 mg/L (ppm) in some locations (Breit, 2002), all of which exceed the 10,000 mg/L (ppm) lower regulatory limit (U.S. Environmental Protection Agency, 2009). However, one well out of hundreds of wells that were sampled within the SAU showed a TDS value slightly below 10,000 mg/L (ppm) (Breit, 2002). Based upon the background literature (Barnes, 1952; Downey, 1986), and considering this suspected freshwater-well is surrounded by wells showing TDS values well above 10,000 mg/L (ppm), its validity is questionable; therefore, it is most likely that 100 percent of the Three Forks Formation and Jefferson Group SAU is potentially suitable for storage of CO2, with a minimum likelihood of 98 percent and a maximum likelihood of 100 percent.
Folds and closures associated with carbonate-bank buildups that are sealed by anhydrites or overlying shales are typical trapping mechanisms within the Upper Devonian rocks that compose the SAU (Peterson, 1995). In order to calculate the maximum buoyant pore volume within structural and stratigraphic closures for the Three Forks Formation and Jefferson Group C50310104 SAU, the known closure areas from the highly productive regions located throughout the SAU were extrapolated and multiplied by the upper estimates on regional reservoir thickness and porosity. The known closure areas were calculated by summing petroleum reservoir areas for the SAU (Nehring Associates, Inc., 2010). An assumption underlying this calculation is that there is potential for additional uncharged or undiscovered structural and stratigraphic closures outside of regions of historical hydrocarbon production.
17
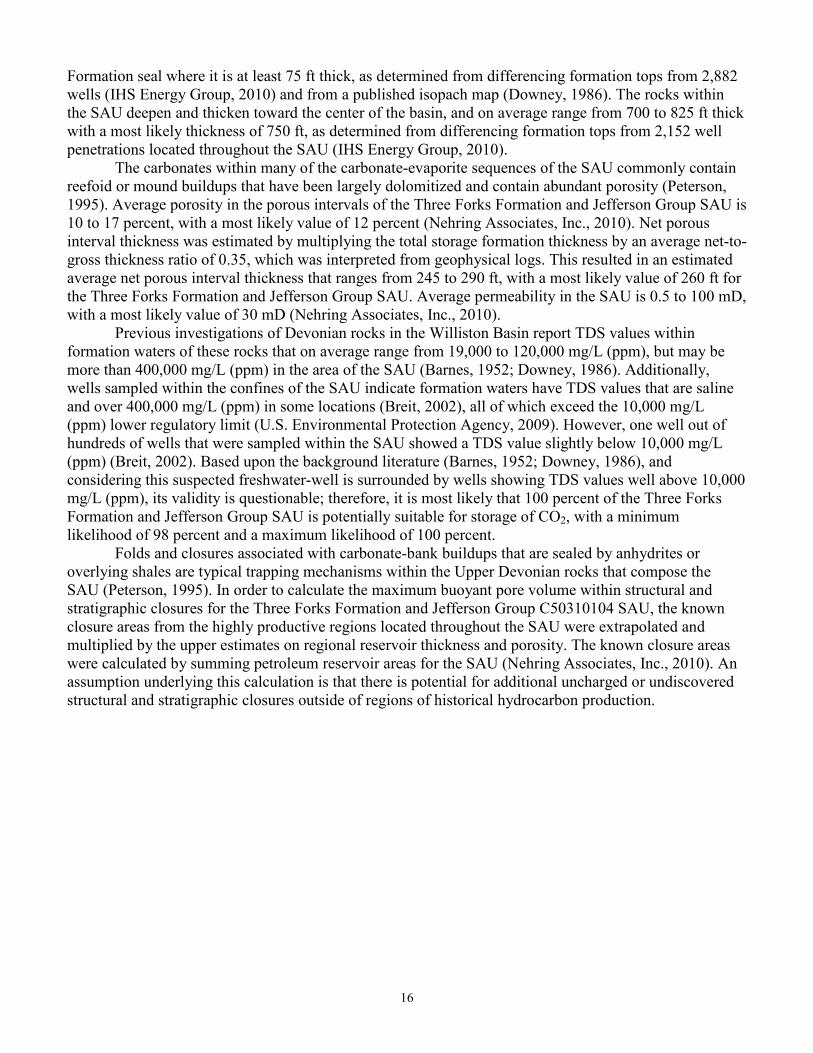
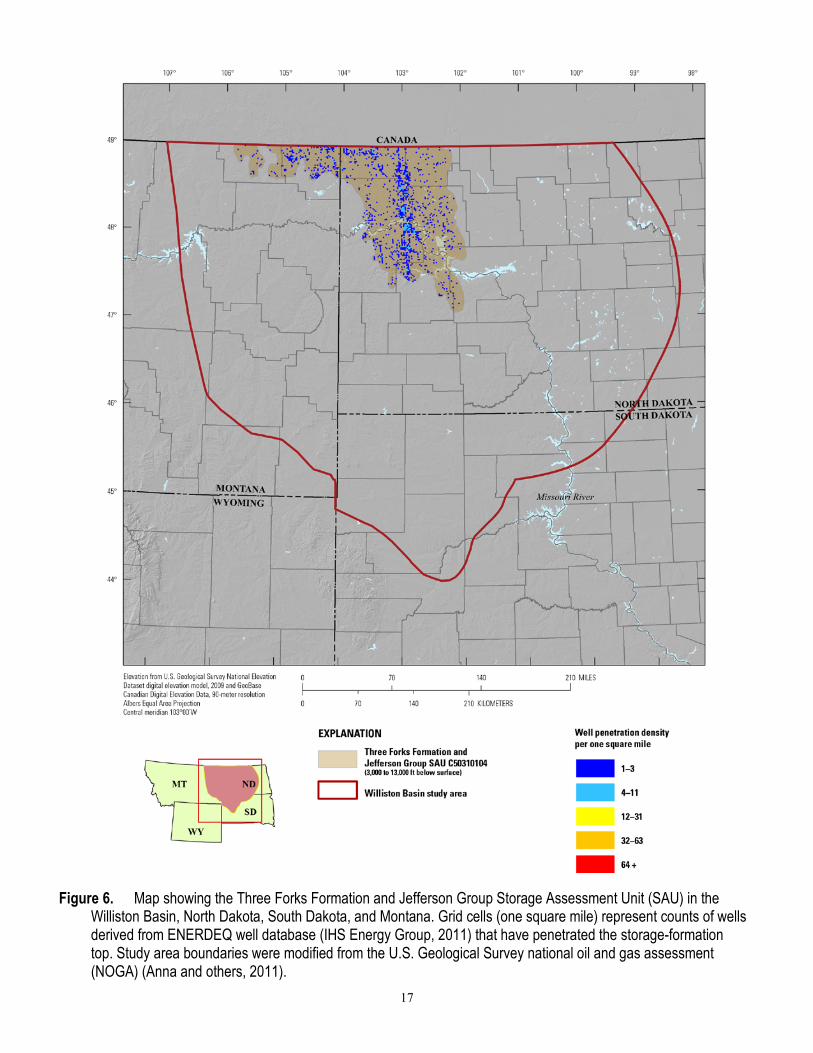
Figure 6. Map showing the Three Forks Formation and Jefferson Group Storage Assessment Unit (SAU) in the Williston Basin, North Dakota, South Dakota, and Montana. Grid cells (one square mile) represent counts of wells derived from ENERDEQ well database (IHS Energy Group, 2011) that have penetrated the storage-formation top. Study area boundaries were modified from the U.S. Geological Survey national oil and gas assessment (NOGA) (Anna and others, 2011).
18
Kibbey Formation and Madison Group SAU C50310105
By Tina L. Roberts-Ashby
The Mississippian Madison Group and Kibbey Formation of the Williston Basin form a composite CO2 storage reservoir, predominantly composed of carbonate-evaporite sequences, that stretches across eastern Montana, western North Dakota, and the northwestern corner of South Dakota (figs. 2 and 7). The Madison Group contains interbedded carbonates and evaporites, and was deposited in a warm, shallow-water marine environment (Sloss, 1952). The group is divided into three formations, from oldest to youngest: (1) the Lodgepole Limestone, which consists of a thin sand and basal shale interval that is overlain by cherty, argillaceous, and crinoid-fragmental limestone; (2) the Mission Canyon Limestone, a predominantly limestone, sometimes argillaceous, unit with increased dolomitization toward the upper section that contains relatively thick, fossiliferous, and highly porous intervals throughout; and (3) the Charles Formation, a predominantly anhydrite unit with a porous basal limestone that contains some dolostone, limestone, salt, and shales throughout (Barnes, 1952; Sloss, 1952). The Kibbey Formation of the Big Snowy Group is generally disconformable, but in some locations is transitional with the underlying Madison Group, and is composed of lenticular, quartzitic sands and red shales, with some carbonates and evaporites (Barnes, 1952; Sloss, 1952). The remainder of the Big Snowy Group consists of the Otter Formation and Heath Formation (fig. 3), both of which form a composite regional seal for the underlying Mississippian CO2 storage reservoir. The Otter Formation consists predominantly of green shales with some oolitic limestone, whereas the Heath Formation is a black, carbonaceous shale with thin layers of limestone and sand, although these formations are generally undifferentiated in the subsurface (Barnes, 1952; Sloss, 1952). In the area of the storage reservoir, this composite Otter and Heath Formations seal is typically 100 to 200 ft thick, but may be more than 500 ft thick in some regions.
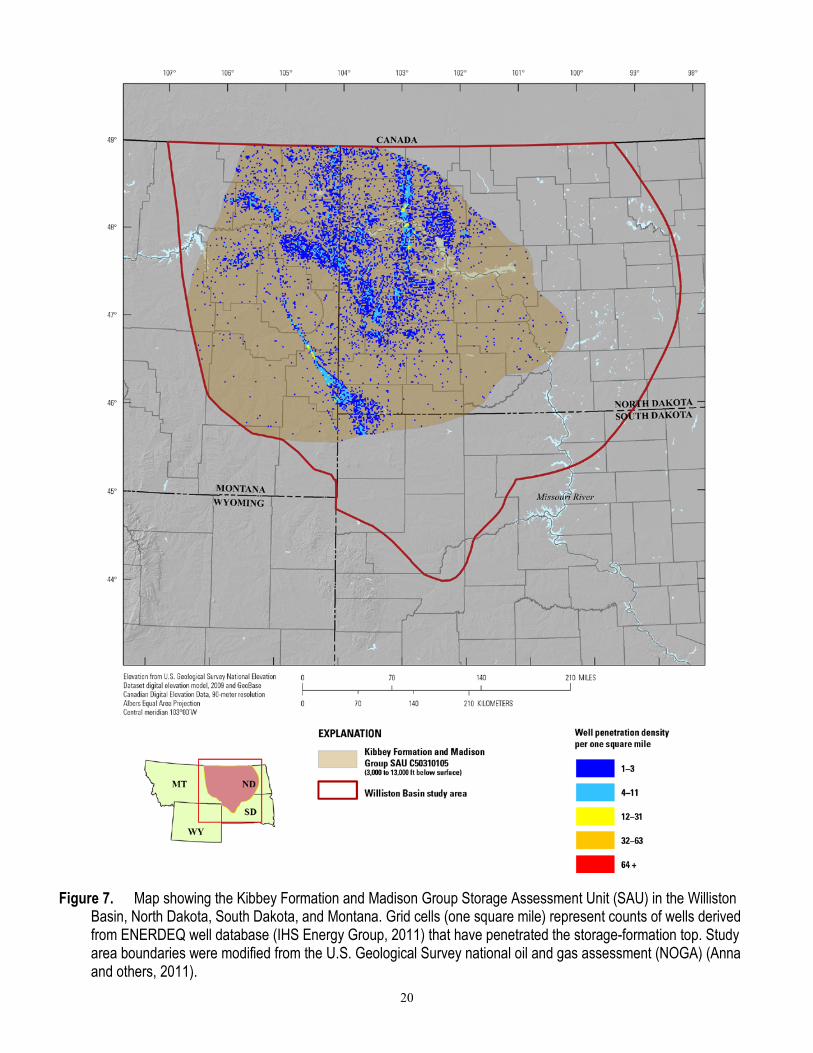
One CO2 storage reservoir, the Kibbey Formation and Madison Group C50310105 SAU, is identified in the Mississippian rocks of the Williston Basin, and occurs between 3,000- and 13,000-ft subsurface depth. The Kibbey Formation and Madison Group SAU encompasses an area of about 33,043,000 acres (with an error of plus or minus 10 percent) (fig. 7). The majority of the petroleum production within the area of the SAU is from the Madison Group, specifically the Mission Canyon Limestone and Charles Formation, which is the largest oil reserve discovered to date in the basin (Barnes, 1952; Peterson, 1995; Nehring Associates, Inc., 2010).
The boundary of the Kibbey Formation and Madison Group SAU is defined by the 3,000-ft reservoir top-depths taken from 11,144 well penetrations (IHS Energy Group, 2010; Nehring Associates, Inc., 2010); the United States and Canada international border; and the lateral extent of the Otter and Heath Formations seal where it is at least 50 ft thick, as determined from differencing formation tops from 2,980 wells (IHS Energy Group, 2010) and from published cross sections (Barnes, 1952; Sloss, 1952). The rocks within the SAU deepen and thicken toward the center of the basin and on average are 1,500 to 2,000 ft thick, with a most likely thickness of 1,800 ft, as determined from differencing formation tops from 3,204 well penetrations located throughout the SAU (IHS Energy Group, 2010).
Porosity and reservoir-rock quality are best in the Mission Canyon Limestone and Charles Formation of the Madison Group, and typically consist of dolomitized carbonate algal-oolitic, crinoidal, or bioclastic banks, as well as limestones with abundant vuggy or fracture porosity (Barnes, 1952; Peterson, 1995). Average porosity in the porous intervals of the Kibbey Formation and Madison Group SAU is 7 to 16 percent, with a most likely value of 10 percent (Nehring Associates, Inc., 2010). Net-to-gross was interpreted from geophysical logs and porous interval contour maps (Downey, 1984, 1986), and resulted in an average net porous interval thickness that ranges from 150 to 450 ft, with a most likely
19
value of 300 ft for the Kibbey Formation and Madison Group SAU. Average permeability in the SAU is 0.01 to 1,800 mD, with a most likely value of 4 mD (Nehring Associates, Inc., 2010).
Published literature contains little water-quality data for the Kibbey Formation; however, previous investigations of the Madison Group, which makes up the majority of the SAU in the Williston Basin, report that TDS values within formation waters of these rocks range from 3,200 on average to greater than 300,000 mg/L (ppm) (Barnes, 1952; Downey, 1986). Wells sampled within the confines of the SAU indicate formation waters within the Kibbey Formation and rocks of the Madison Group are both fresh (TDS less than 10,000 mg/L [ppm]) and saline (TDS greater than 10,000 mg/L [ppm]) (Breit, 2002). Therefore, most likely 70 percent of the area of the Kibbey Formation and Madison Group SAU is considered potentially suitable for storage of CO2, with a minimum likelihood of 60 percent and a maximum likelihood of 75 percent.
Folds and closures associated with carbonate-bank or mound buildups that are sealed by anhydrites, salts, or overlying shales are the predominant trapping mechanisms within the Kibbey Formation and Madison Group SAU, although lateral facies changes also contribute to trapping within these rocks (Peterson, 1995). In order to calculate the maximum buoyant pore volume within structural and stratigraphic closures for the Kibbey Formation and Madison Group SAU, the known closure areas from the highly productive regions located throughout the SAU were extrapolated and combined with upper bounds on regional reservoir thickness and porosity. The known closure areas were calculated by summing petroleum reservoir areas for the SAU (Nehring Associates, Inc., 2010). An assumption underlying this calculation is that there is potential for additional uncharged or undiscovered structural and stratigraphic closures outside of regions of historical hydrocarbon production.
20
Figure 7. Map showing the Kibbey Formation and Madison Group Storage Assessment Unit (SAU) in the Williston Basin, North Dakota, South Dakota, and Montana. Grid cells (one square mile) represent counts of wells derived from ENERDEQ well database (IHS Energy Group, 2011) that have penetrated the storage-formation top. Study area boundaries were modified from the U.S. Geological Survey national oil and gas assessment (NOGA) (Anna and others, 2011).
21
Minnelusa Group SAU C50310106
By Sean T. Brennan
The Minnelusa Group in the Williston Basin comprises the Pennsylvanian Tyler and Amsden Formations and the Permian Broom Creek Formation (figs. 2 and 3). The Tyler Formation is a mixed sandstone, dolomite, and evaporite formation deposited in shallow, restricted environments (Murphy and others, 2009). The Tyler Formation is overlain by the shallow marine Amsden Formation, which in the Williston Basin is predominantly dolomite, with interbedded shale and sandstone (Murphy and others, 2009). At the base of the Amsden Formation is the Alaska Bench Member, which is primarily shaley-micritic limestone. The Amsden Formation is overlain by the shallow marine Broom Creek Formation, which is predominantly sandstone, with interbedded dolomite, anhydrite, shale, and chert (Murphy and others, 2009). The Minnelusa Group is overlain by the restricted marine Opeche Shale, which in the Williston Basin is shale to mudstone, with gypsum, anhydrite, and thick halite deposits up to 200 feet thick in the central basin; the formation averages 200 feet in thickness in the Williston Basin (Benison and Goldstein, 2000; Murphy and others, 2009). The Opeche Shale forms the sealing unit for the Minnelusa Group SAU.
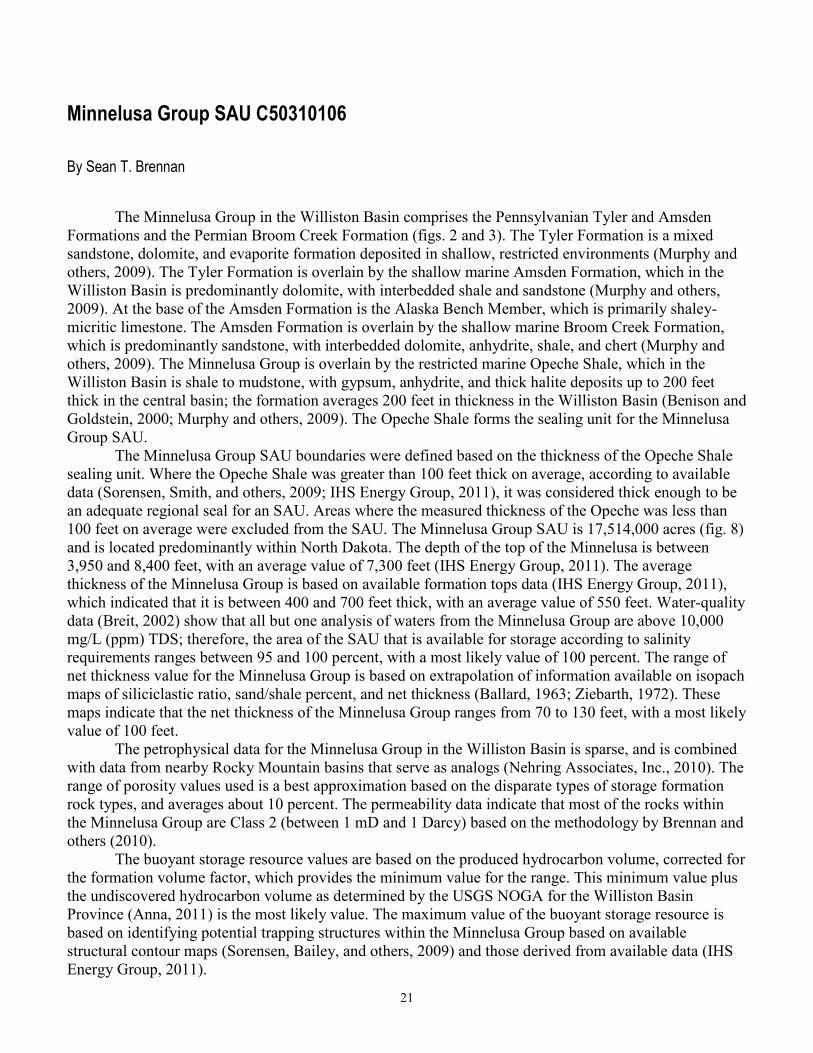
The Minnelusa Group SAU boundaries were defined based on the thickness of the Opeche Shale sealing unit. Where the Opeche Shale was greater than 100 feet thick on average, according to available data (Sorensen, Smith, and others, 2009; IHS Energy Group, 2011), it was considered thick enough to be an adequate regional seal for an SAU. Areas where the measured thickness of the Opeche was less than 100 feet on average were excluded from the SAU. The Minnelusa Group SAU is 17,514,000 acres (fig. 8) and is located predominantly within North Dakota. The depth of the top of the Minnelusa is between 3,950 and 8,400 feet, with an average value of 7,300 feet (IHS Energy Group, 2011). The average thickness of the Minnelusa Group is based on available formation tops data (IHS Energy Group, 2011), which indicated that it is between 400 and 700 feet thick, with an average value of 550 feet. Water-quality data (Breit, 2002) show that all but one analysis of waters from the Minnelusa Group are above 10,000 mg/L (ppm) TDS; therefore, the area of the SAU that is available for storage according to salinity requirements ranges between 95 and 100 percent, with a most likely value of 100 percent. The range of net thickness value for the Minnelusa Group is based on extrapolation of information available on isopach maps of siliciclastic ratio, sand/shale percent, and net thickness (Ballard, 1963; Ziebarth, 1972). These maps indicate that the net thickness of the Minnelusa Group ranges from 70 to 130 feet, with a most likely value of 100 feet.
The petrophysical data for the Minnelusa Group in the Williston Basin is sparse, and is combined with data from nearby Rocky Mountain basins that serve as analogs (Nehring Associates, Inc., 2010). The range of porosity values used is a best approximation based on the disparate types of storage formation rock types, and averages about 10 percent. The permeability data indicate that most of the rocks within the Minnelusa Group are Class 2 (between 1 mD and 1 Darcy) based on the methodology by Brennan and others (2010).
The buoyant storage resource values are based on the produced hydrocarbon volume, corrected for the formation volume factor, which provides the minimum value for the range. This minimum value plus the undiscovered hydrocarbon volume as determined by the USGS NOGA for the Williston Basin Province (Anna, 2011) is the most likely value. The maximum value of the buoyant storage resource is based on identifying potential trapping structures within the Minnelusa Group based on available structural contour maps (Sorensen, Bailey, and others, 2009) and those derived from available data (IHS Energy Group, 2011).
22
Figure 8. Map showing the Minnelusa Group Storage Assessment Unit (SAU) in the Williston Basin, North Dakota, South Dakota, and Montana. Grid cells (one square mile) represent counts of wells derived from ENERDEQ well database (IHS Energy Group, 2011) that have penetrated the storage-formation top. Study area boundaries were modified from the U.S. Geological Survey national oil and gas assessment (NOGA) (Anna and others, 2011).
23
Lower Swift Formation SAU C50310107
By William H. Craddock
The Swift Formation of Williston Basin was deposited during the Oxfordian and Kimmeridgian Ages of the Jurassic Period (Peterson, 1957; Turner and Peterson, 2004) in a shallow seaway related to flexural subsidence along the eastern flank of the Nevadan orogenic system (for example see DeCelles, 2004; Turner and Peterson, 2004). At its type locality in northwestern Montana, the formation is characterized by a glauconitic sandstone member that is bounded above and below by more shale-prone members (for example see Cobban, 1945; Francis, 1957). In general, the proportion and thickness of sandstone strata decrease to the east across Williston Basin (for example see Peterson, 1957), perhaps reflecting an increasing spatial separation from sediment sources in the Nevadan orogenic highlands to the west. In the vicinity of Montana and North Dakota, the overlying Morrison Formation (fig. 3) consists of varicolored shales deposited in a nonmarine setting (Peterson, 1957; Turner and Peterson, 2004). Analysis of regional networks of geophysical logs indicates that the Morrison is more shale-prone in Williston Basin than it is in nearby regions of the northern Rocky Mountains (North Dakota Geological Survey, written commun., 2011). In fact, locally in Williston Basin, the Morrison Formation appears to comprise several hundred feet of shale with very few sandstone interbeds, such that it may serve as a robust top seal for the underlying Swift Formation. In light of the fact that the upper Swift Formation is mostly shale, and that in some studies, the Morrison Formation top seal is undifferentiated from the Swift Formation altogether (Gerhard and others, 1990), we name our SAU the Lower Swift Formation SAU for the coarser-grained intervals that could serve as reservoirs for CO2.
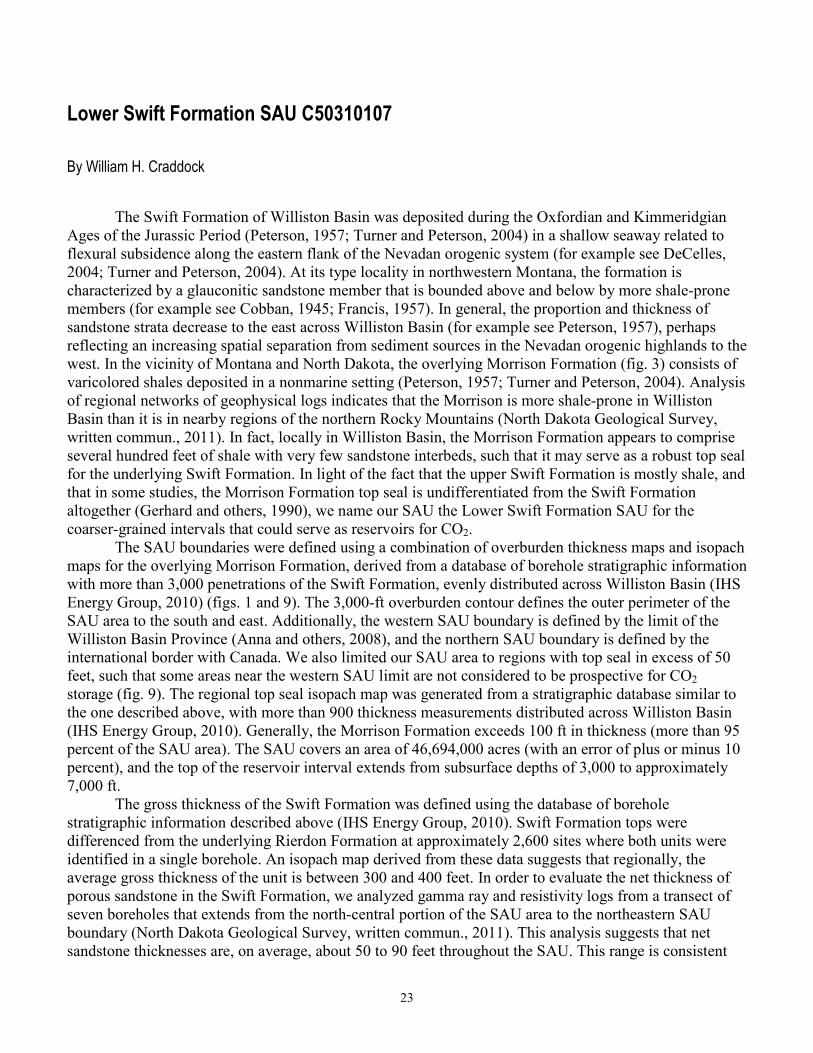
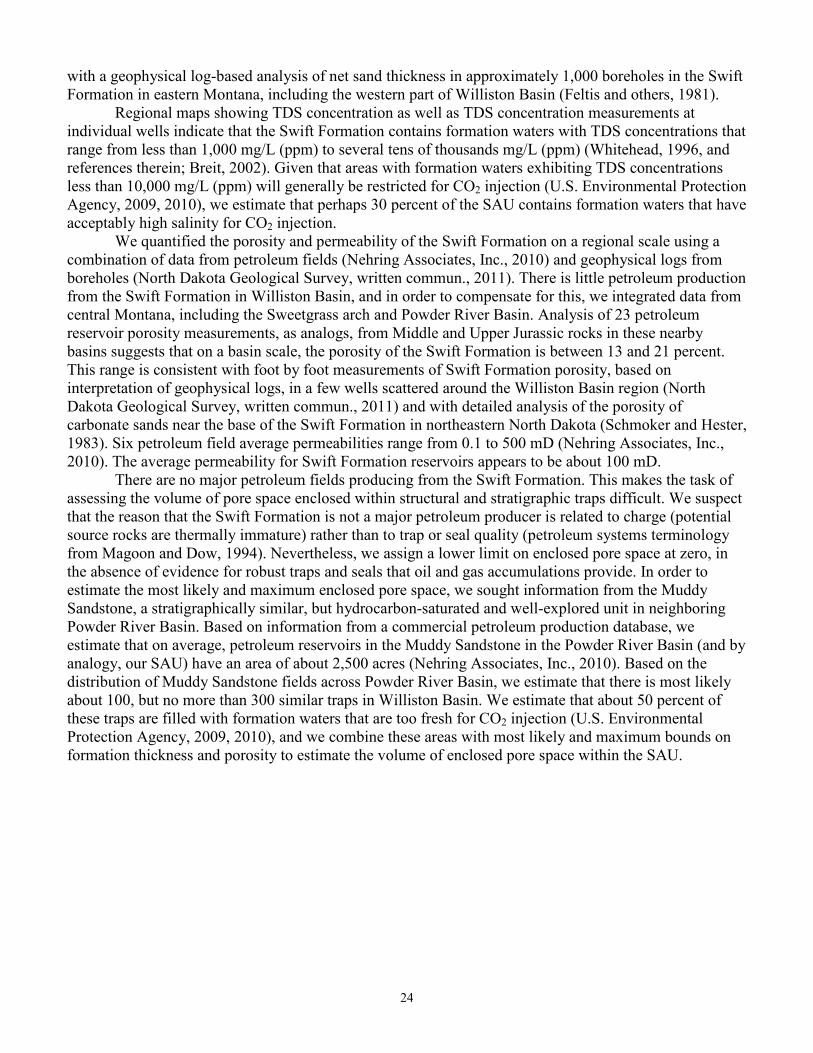
The SAU boundaries were defined using a combination of overburden thickness maps and isopach maps for the overlying Morrison Formation, derived from a database of borehole stratigraphic information with more than 3,000 penetrations of the Swift Formation, evenly distributed across Williston Basin (IHS Energy Group, 2010) (figs. 1 and 9). The 3,000-ft overburden contour defines the outer perimeter of the SAU area to the south and east. Additionally, the western SAU boundary is defined by the limit of the Williston Basin Province (Anna and others, 2008), and the northern SAU boundary is defined by the international border with Canada. We also limited our SAU area to regions with top seal in excess of 50 feet, such that some areas near the western SAU limit are not considered to be prospective for CO2 storage (fig. 9). The regional top seal isopach map was generated from a stratigraphic database similar to the one described above, with more than 900 thickness measurements distributed across Williston Basin (IHS Energy Group, 2010). Generally, the Morrison Formation exceeds 100 ft in thickness (more than 95 percent of the SAU area). The SAU covers an area of 46,694,000 acres (with an error of plus or minus 10 percent), and the top of the reservoir interval extends from subsurface depths of 3,000 to approximately 7,000 ft.
The gross thickness of the Swift Formation was defined using the database of borehole stratigraphic information described above (IHS Energy Group, 2010). Swift Formation tops were differenced from the underlying Rierdon Formation at approximately 2,600 sites where both units were identified in a single borehole. An isopach map derived from these data suggests that regionally, the average gross thickness of the unit is between 300 and 400 feet. In order to evaluate the net thickness of porous sandstone in the Swift Formation, we analyzed gamma ray and resistivity logs from a transect of seven boreholes that extends from the north-central portion of the SAU area to the northeastern SAU boundary (North Dakota Geological Survey, written commun., 2011). This analysis suggests that net sandstone thicknesses are, on average, about 50 to 90 feet throughout the SAU. This range is consistent
24
with a geophysical log-based analysis of net sand thickness in approximately 1,000 boreholes in the Swift Formation in eastern Montana, including the western part of Williston Basin (Feltis and others, 1981).
Regional maps showing TDS concentration as well as TDS concentration measurements at individual wells indicate that the Swift Formation contains formation waters with TDS concentrations that range from less than 1,000 mg/L (ppm) to several tens of thousands mg/L (ppm) (Whitehead, 1996, and references therein; Breit, 2002). Given that areas with formation waters exhibiting TDS concentrations less than 10,000 mg/L (ppm) will generally be restricted for CO2 injection (U.S. Environmental Protection Agency, 2009, 2010), we estimate that perhaps 30 percent of the SAU contains formation waters that have acceptably high salinity for CO2 injection.
We quantified the porosity and permeability of the Swift Formation on a regional scale using a combination of data from petroleum fields (Nehring Associates, Inc., 2010) and geophysical logs from boreholes (North Dakota Geological Survey, written commun., 2011). There is little petroleum production from the Swift Formation in Williston Basin, and in order to compensate for this, we integrated data from central Montana, including the Sweetgrass arch and Powder River Basin. Analysis of 23 petroleum reservoir porosity measurements, as analogs, from Middle and Upper Jurassic rocks in these nearby basins suggests that on a basin scale, the porosity of the Swift Formation is between 13 and 21 percent. This range is consistent with foot by foot measurements of Swift Formation porosity, based on interpretation of geophysical logs, in a few wells scattered around the Williston Basin region (North Dakota Geological Survey, written commun., 2011) and with detailed analysis of the porosity of carbonate sands near the base of the Swift Formation in northeastern North Dakota (Schmoker and Hester, 1983). Six petroleum field average permeabilities range from 0.1 to 500 mD (Nehring Associates, Inc., 2010). The average permeability for Swift Formation reservoirs appears to be about 100 mD.
There are no major petroleum fields producing from the Swift Formation. This makes the task of assessing the volume of pore space enclosed within structural and stratigraphic traps difficult. We suspect that the reason that the Swift Formation is not a major petroleum producer is related to charge (potential source rocks are thermally immature) rather than to trap or seal quality (petroleum systems terminology from Magoon and Dow, 1994). Nevertheless, we assign a lower limit on enclosed pore space at zero, in the absence of evidence for robust traps and seals that oil and gas accumulations provide. In order to estimate the most likely and maximum enclosed pore space, we sought information from the Muddy Sandstone, a stratigraphically similar, but hydrocarbon-saturated and well-explored unit in neighboring Powder River Basin. Based on information from a commercial petroleum production database, we estimate that on average, petroleum reservoirs in the Muddy Sandstone in the Powder River Basin (and by analogy, our SAU) have an area of about 2,500 acres (Nehring Associates, Inc., 2010). Based on the distribution of Muddy Sandstone fields across Powder River Basin, we estimate that there is most likely about 100, but no more than 300 similar traps in Williston Basin. We estimate that about 50 percent of these traps are filled with formation waters that are too fresh for CO2 injection (U.S. Environmental Protection Agency, 2009, 2010), and we combine these areas with most likely and maximum bounds on formation thickness and porosity to estimate the volume of enclosed pore space within the SAU.
25
Figure 9. Map showing the Lower Swift Formation Storage Assessment Unit (SAU) in the Williston Basin, North Dakota, South Dakota, and Montana. Grid cells (one square mile) represent counts of wells derived from ENERDEQ well database (IHS Energy Group, 2011) that have penetrated the storage-formation top. Study area boundaries were modified from the U.S. Geological Survey national oil and gas assessment (NOGA) (Anna and others, 2011).
26
Inyan Kara Group SAU C50310108
By William H. Craddock
The Inyan Kara Group was deposited in the earliest Cretaceous in the Sevier foreland basin, and it unconformably overlies the Jurassic Morrison Formation (Hansen, 1955; DeCelles, 2004) (fig. 3). The Inyan Kara Group includes three formations, which from oldest to youngest are the Lakota Sandstone, the Fuson Shale, and the Fall River Sandstone. The Lakota Sandstone and Fuson Shale are marine sandstones and shales, respectively (Hansen, 1955). The Fall River Sandstone, also known as the Dakota Formation outside of the Black Hills area, is a regionally extensive sandstone that was deposited in both shallow marine (southern Williston) and fluvio-deltaic settings (northern Williston) (Russell 1927; Gries, 1954; Hansen, 1955). The Inyan Kara Group is conformably overlain by the Skull Creek Shale, which is an open marine shale, also deposited in the Sevier foreland basin (Hansen, 1955; Mallory, 1972; DeCelles, 2004). A stratigraphic database, containing approximately 2,400 borehole penetrations of the Skull Creek Shale, indicates that the shale is hundreds of feet thick and extensive across all of Williston Basin (IHS Energy Group, 2010). Subsurface correlations of geophysical logs from several boreholes indicate that the formation is homogeneous shale and corroborate the previous evidence for the large lateral extent of the unit (Hansen, 1955). The thickness and lithologic character of the Skull Creek Shale suggest that it should serve as a robust top seal for prospective reservoirs in the coarse-grained intervals of the Inyan Kara Group (see Magoon and Dow, 1994; Brennan and others, 2010) (fig. 3). Analysis of formation tops suggest that the Fuson Shale may also serve as a robust, internal seal for lower Inyan Kara Group reservoirs because it is in excess of 100 feet thick across northern Williston Basin. However, in southern Williston Basin, the Fuson Shale thins to a few tens of feet, such that it may not be considered a regional seal for the purpose of this assessment (see Brennan and others, 2010; Blondes and others, 2013).
The SAU area for the Inyan Kara Group was defined on the basis of the 3,000-ft overburden contour (see Brennan and others, 2010) (fig. 10). An overburden contour map was generated from a stratigraphic database containing more than 16,000 borehole penetrations in the Inyan Kara Group with data widely distributed across the entire study area (IHS Energy Group, 2010). Additionally, the western SAU boundary is defined by the limit of the Williston Basin Province (Anna and others, 2008), and the northern SAU boundary is defined by the international border with Canada. The SAU covers an area of about 44,326,000 acres (with an error of plus or minus 10 percent) and extends from subsurface depths of 3,000 to approximately 6,500 ft.
The gross thickness of the Inyan Kara Group was defined using the aforementioned stratigraphic database (IHS Energy Group, 2010). The stratigraphic thickness was determined in boreholes in which both the Inyan Kara Group and the immediately underlying formation were identified, and isopach maps were derived from the resulting data. Each of the individual isopach maps was constrained by tens of hundreds of evenly distributed measurements. Across Williston Basin, the Inyan Kara Group ranges from 200 to 300 ft in thickness. In order to evaluate the net thickness of porous sandstone in the Inyan Kara Group, we analyzed gamma ray and resistivity logs from a network of 12 boreholes distributed across the central portion of the SAU (Hansen, 1955). This analysis suggests that net sandstone thicknesses are, on average, about 110 to 150 ft across the SAU. This range is consistent with a geophysical log-based analysis of net sand thickness in approximately 1,000 boreholes in the Inyan Kara Group in eastern Montana, including the western part of Williston Basin (Feltis and others, 1981).
Regional maps showing the TDS concentration contours along with measurements at individual wells indicate that the Inyan Kara Group contains formation waters with TDS concentrations from less than 1,000 mg/L (ppm) to several tens of thousands mg/L (ppm) (Whitehead, 1996, and references
27
therein; Breit, 2002). Given that areas with formation waters exhibiting concentrations of TDS less than 10,000 mg/L (ppm) will generally be restricted for CO2 injection (U.S. Environmental Protection Agency, 2009, 2010), we estimate that perhaps 25 percent of the SAU contains formation waters that have acceptably high salinity for CO2 injection and disposal.
We quantified the porosity and permeability of the Inyan Kara on a regional scale using a combination of data from petroleum fields (Nehring Associates, Inc., 2010) and geophysical logs from boreholes (North Dakota Geological Survey, written commun., 2011). There is little petroleum production from the Inyan Kara Group in Williston Basin, and in order to compensate for this, we integrated data from central Montana, including the Sweetgrass arch, and Powder River Basin. This analysis includes about 100 porosity measurements for Inyan Kara Group reservoirs from the nearby basins and suggests that on a basin scale, the average porosity of the Swift Formation is between 14 and 22 percent. This range is consistent with foot by foot measurements of Inyan Kara Group porosity, based on interpretation of geophysical logs, in a few wells scattered around the Williston Basin region (North Dakota Geological Survey, written commun., 2011). For a similar number of petroleum reservoir permeability measurements from the nearby basins, values range from 0.01 to 2,000 mD (Nehring Associates, Inc., 2010). The average permeability of the Inyan Kara Group appears to be about 100 mD.
There are no major petroleum fields producing from the Inyan Kara Group, and we estimate the minimum, most likely, and maximum enclosed pore volume (analogous to structural and [or] stratigraphic hydrocarbon traps) following the methods described for the Lower Swift Formation SAU.
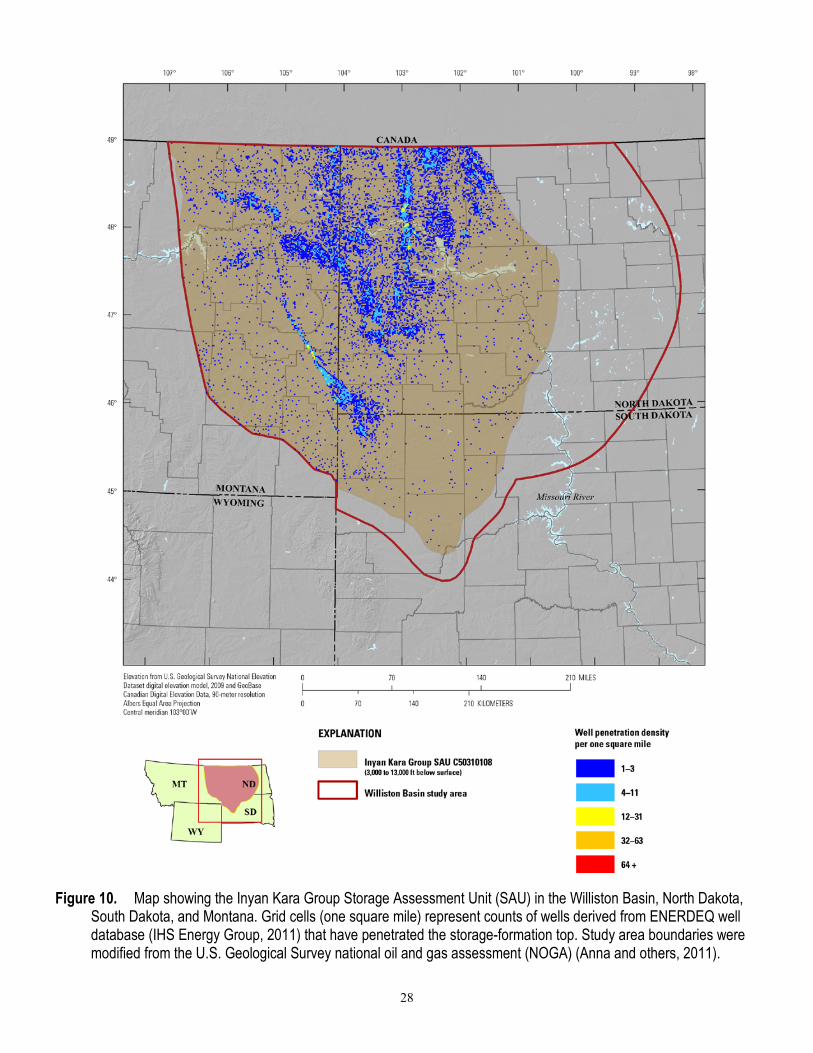
28
Figure 10. Map showing the Inyan Kara Group Storage Assessment Unit (SAU) in the Williston Basin, North Dakota, South Dakota, and Montana. Grid cells (one square mile) represent counts of wells derived from ENERDEQ well database (IHS Energy Group, 2011) that have penetrated the storage-formation top. Study area boundaries were modified from the U.S. Geological Survey national oil and gas assessment (NOGA) (Anna and others, 2011).
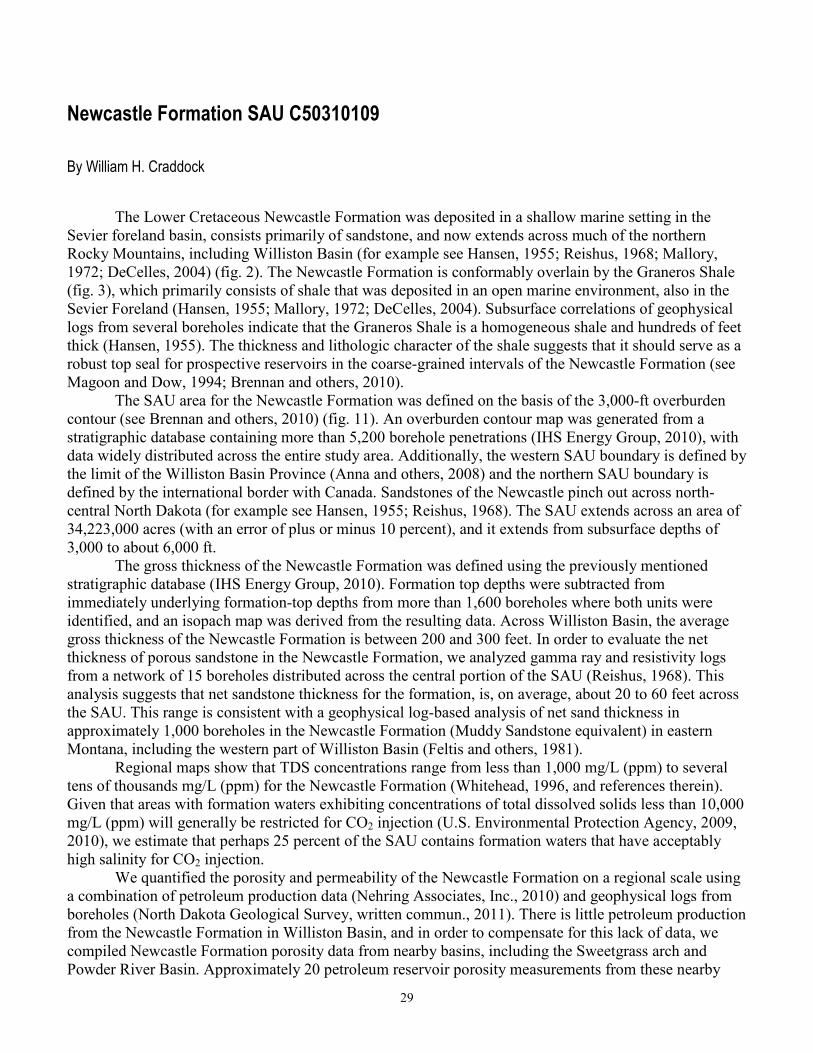
29
Newcastle Formation SAU C50310109
By William H. Craddock
The Lower Cretaceous Newcastle Formation was deposited in a shallow marine setting in the Sevier foreland basin, consists primarily of sandstone, and now extends across much of the northern Rocky Mountains, including Williston Basin (for example see Hansen, 1955; Reishus, 1968; Mallory, 1972; DeCelles, 2004) (fig. 2). The Newcastle Formation is conformably overlain by the Graneros Shale (fig. 3), which primarily consists of shale that was deposited in an open marine environment, also in the Sevier Foreland (Hansen, 1955; Mallory, 1972; DeCelles, 2004). Subsurface correlations of geophysical logs from several boreholes indicate that the Graneros Shale is a homogeneous shale and hundreds of feet thick (Hansen, 1955). The thickness and lithologic character of the shale suggests that it should serve as a robust top seal for prospective reservoirs in the coarse-grained intervals of the Newcastle Formation (see Magoon and Dow, 1994; Brennan and others, 2010).
The SAU area for the Newcastle Formation was defined on the basis of the 3,000-ft overburden contour (see Brennan and others, 2010) (fig. 11). An overburden contour map was generated from a stratigraphic database containing more than 5,200 borehole penetrations (IHS Energy Group, 2010), with data widely distributed across the entire study area. Additionally, the western SAU boundary is defined by the limit of the Williston Basin Province (Anna and others, 2008) and the northern SAU boundary is defined by the international border with Canada. Sandstones of the Newcastle pinch out across north-central North Dakota (for example see Hansen, 1955; Reishus, 1968). The SAU extends across an area of 34,223,000 acres (with an error of plus or minus 10 percent), and it extends from subsurface depths of 3,000 to about 6,000 ft.
The gross thickness of the Newcastle Formation was defined using the previously mentioned stratigraphic database (IHS Energy Group, 2010). Formation top depths were subtracted from immediately underlying formation-top depths from more than 1,600 boreholes where both units were identified, and an isopach map was derived from the resulting data. Across Williston Basin, the average gross thickness of the Newcastle Formation is between 200 and 300 feet. In order to evaluate the net thickness of porous sandstone in the Newcastle Formation, we analyzed gamma ray and resistivity logs from a network of 15 boreholes distributed across the central portion of the SAU (Reishus, 1968). This analysis suggests that net sandstone thickness for the formation, is, on average, about 20 to 60 feet across the SAU. This range is consistent with a geophysical log-based analysis of net sand thickness in approximately 1,000 boreholes in the Newcastle Formation (Muddy Sandstone equivalent) in eastern Montana, including the western part of Williston Basin (Feltis and others, 1981).
Regional maps show that TDS concentrations range from less than 1,000 mg/L (ppm) to several tens of thousands mg/L (ppm) for the Newcastle Formation (Whitehead, 1996, and references therein). Given that areas with formation waters exhibiting concentrations of total dissolved solids less than 10,000 mg/L (ppm) will generally be restricted for CO2 injection (U.S. Environmental Protection Agency, 2009, 2010), we estimate that perhaps 25 percent of the SAU contains formation waters that have acceptably high salinity for CO2 injection.
We quantified the porosity and permeability of the Newcastle Formation on a regional scale using a combination of petroleum production data (Nehring Associates, Inc., 2010) and geophysical logs from boreholes (North Dakota Geological Survey, written commun., 2011). There is little petroleum production from the Newcastle Formation in Williston Basin, and in order to compensate for this lack of data, we compiled Newcastle Formation porosity data from nearby basins, including the Sweetgrass arch and Powder River Basin. Approximately 20 petroleum reservoir porosity measurements from these nearby

30
basins suggest that on a basin scale, the porosity of the Newcastle Formation ranges between 13 and 19 percent. This range is consistent with foot-by-foot measurements of the Newcastle Formation porosity, based on interpretation of geophysical logs, in a few wells scattered around the Williston Basin region (North Dakota Geological Survey, written commun., 2011). About 15 petroleum reservoir permeability measurements from these two basins range from 0.01 to 100 mD (Nehring Associates, Inc., 2010). We estimate that the average permeability for potential Newcastle Formation reservoirs is about 50 mD.
There are no major petroleum fields producing from the Newcastle Formation, and we estimate the minimum, most likely, and maximum enclosed pore volume (analogous to structural and [or] stratigraphic hydrocarbon traps) following the methods described for the Lower Swift Formation SAU (see previous section).
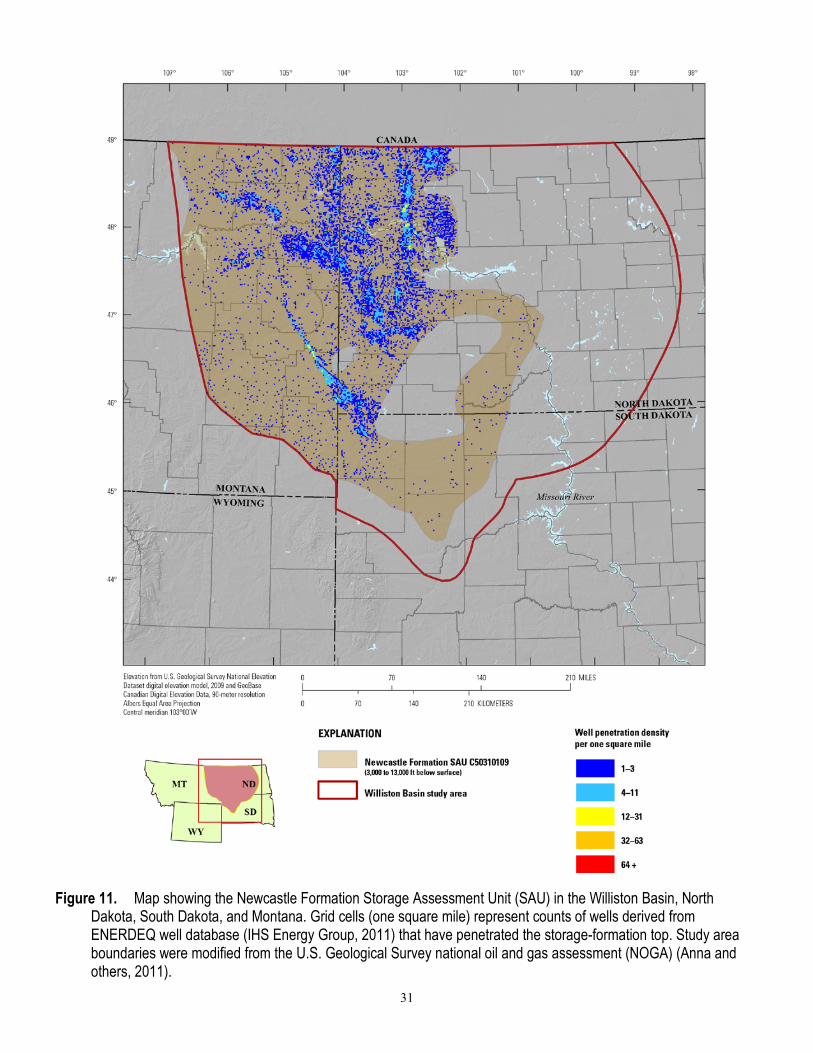
31
Figure 11. Map showing the Newcastle Formation Storage Assessment Unit (SAU) in the Williston Basin, North Dakota, South Dakota, and Montana. Grid cells (one square mile) represent counts of wells derived from ENERDEQ well database (IHS Energy Group, 2011) that have penetrated the storage-formation top. Study area boundaries were modified from the U.S. Geological Survey national oil and gas assessment (NOGA) (Anna and others, 2011).
32
Eagle Sandstone
By William H. Craddock
The Eagle Sandstone (fig. 3) of the Montana Group in Williston Basin was deposited in the Late Cretaceous in a shallow marine setting in the Sevier foreland basin (DeCelles, 2004). It is overlain by the Pierre Shale, which is a homogeneous, open marine shale with a thickness on the order of 2,000 feet across Williston Basin (Murphy and others, 2009). The coarse-grained Eagle Sandstone is likely to have reservoir properties (for example, porosity and permeability) that are suitable for CO2 injection and storage, and the overlying Pierre Shale is likely to be a robust seal; both units are present in Williston Basin and across much of the northeastern Rocky Mountain region. However, the reservoir and seal quality of the Eagle Sandstone in Williston Basin, required for designation as an SAU (Brennan and others, 2010; Blondes and others, 2013), remains largely untested because there has been no significant petroleum production to date from the interval (Nehring Associates, Inc., 2010). The Eagle Sandstone is thought to contain formation waters with concentrations of TDS of 3,000 mg/L (ppm) or less (Whitehead, 1996). Because of the potential for this formation to serve as a drinking water source, it is unlikely that CO2 disposal would be permitted within this formation (U.S. Environmental Protection Agency, 2009, 2010). For this reason, we have not assessed the storage potential of the Eagle Sandstone.
33
Central Montana Basins
By Matthew D. Merrill
USGS assessment geologists investigated the CO2 storage potential in the Central Montana Basins study area (fig. 1), a region bounded to the north by the Canadian border, to the west by the Montana Thrust Belt study area (see next section in this report), to the south by the northern extents of the Bighorn and Powder River Basins, and to the east by the Williston Basin (see prior section in this report). This area resides completely within the State of Montana and includes or partially includes numerous geologic structures that, while diverse, were grouped together as the single Central Montana Basins study area for national-scale investigation purposes. The aforementioned structures include, but are not limited to, the Sweetgrass arch, the Little Belt uplift, the Beartooth uplift, the Bears Paw uplift, Bull Mountains Basin, the Bowdoin dome, and the Porcupine dome (Dyman, 1987; Vuke and others, 2007) (fig. 1). Numerous smaller features such as domes, faulted zones, and intrusions are also present but not mentioned herein.
The Central Montana Basins study area contains many of the same Cambrian through Tertiary age formations found to the south in other sedimentary basins east of the Rocky Mountain Cordillera, such as the Bighorn, Powder River and Wind River Basins. Paleozoic sedimentary rocks represent a cratonic boundary area that was marine-dominated with pulses of regressive sediments throughout the record. Notably, though much of the northern Central Montana Basins study area is absent of Pennsylvanian, Permian, and Triassic rocks, they are, however, present to the south in the Central Montana trough (Maughan, 1966; Dyman, 1987). Mesozoic formations record the retro-arc foreland deposits shed from an active convergent tectonic boundary to the east. During the Late Cretaceous and Tertiary, the Laramide orogeny produced much of the modern structural features seen across the study area as well as a shift from foreland style deposits to more terrigenous orogenic ones.
Assessment geologists selected four intervals for potential CO2 storage assessments. The potential reservoirs included a composite reservoir of many Mississippian formations and three reservoirs in the Cretaceous section. Sandstones in the Newcastle, Muddy, and (or) Frontier Formations, and (or) the Eagle Sandstone were all potential candidates. An abundance of groundwater with TDS contents within ranges defined by the U.S. Environmental Protection Agency (2009) as an USDW is, however, an issue. The methodology does not allow CO2 storage in these waters (Brennan and others, 2010; Blondes and others, 2013). Waivers allowing for CO2 storage in USDWs would not be available because existing oil and gas production is not present (U.S. Environmental Protection Agency, 2010) where formations of interest are at the depths required by the method. Therefore, because of water-quality concerns, no SAUs were assessed in the Central Montana Basins study area.
Montana Thrust Belt
By Matthew D. Merrill
The Montana Thrust Belt (MTB) study area, as investigated by the assessment team, includes Paleozoic to Tertiary age sedimentary units along the eastern side of the Rocky Mountain Cordillera from northern Montana to the Beartooth uplift to the south (fig. 1). Western Montana has been divided by Peterson (1981) into five provinces, including a northwestern area of Precambrian Belt Supergroup
34
exposures, a west-central region of Mesozoic intrusives, an east-central area of upper Mesozoic and lower Tertiary volcanic and conglomerate deposits, a south-central area of Precambrian rocks, and a Laramide thrust and fold belt in the east. The study area is based on a combination of five assessment units boundaries from the 2002 USGS National Oil and Gas Assessment (Schenk and others, 2002) located mostly within the Laramide thrust and fold belt.
Much like the Wyoming-Idaho-Utah Thrust Belt, the MTB includes numerous eastward thrusted Paleozoic through Tertiary rocks. A long interval of tectonic thrusting occurred from 200 to 60 Ma (mega-annum [million years]) (Monger and Price, 1979). Specifically in the northern MTB area, thrusting occurred during the Late Cretaceous through Paleocene time (Mudge, 1982). To the south thrusting began around 77 Ma (Harlan and others, 2008), and to the west, just outside the MTB study area, thrusting began around 100 Ma (Harrison and Cressman, 1993).
Within the thrusted area, Proterozoic and Paleozoic rocks are exposed in the central and western parts, Paleozoic rocks in the central part, and Mesozoic rocks in the central and eastern parts of the study area (Mudge, 1982). During Paleozoic and Mesozoic time, the MTB was part of a boundary zone on the western side of North America that separated the craton from the open marine environment (Peterson, 1981). Accordingly, the rocks deposited in the MTB study area and the rest of the Rocky Mountain region are mainly marine with regressive pulses of clastic deposits from the craton or local topographic highs (Peterson, 1981).
Potential SAUs were investigated by assessment geologists for the presence of adequate sealing and reservoir formations. Initial investigations resulted in the pre-selection of SAUs in the Mississippian Madison Limestone, Devonian Jefferson Formation, Cretaceous Colorado Group sandstones, and the Cretaceous Kootenai Formation. However, further research indicated that waters in these formations contained TDS contents within the U.S. Environmental Protection Agency (2009) definition of waters that are a potential USDW. The methodology does not allow CO2 storage in these waters (Brennan and others, 2010; Blondes and others, 2013). Waivers allowing for CO2 storage in USDWs would not be available because existing oil and gas production is absent (U.S. Environmental Protection Agency, 2010) from the study area in the formations of interest. Therefore because of water-quality concerns, no SAUs were assessed in the MTB.
35
Acknowledgments The authors acknowledge Troy Cook, Mahendra Verma, and Hossein Jahediesfanjani who helped
to interpret the petroleum engineering data for the study areas at the USGS. Furthermore, Edward C. Murphy, State Geologist, and Timothy Nesheim from the North Dakota Geological Survey, and Jay A. Gunderson from the Montana Bureau of Mines and Geology helped by supplying geologic information and interpretations for the study areas. We thank Joe East for administering the USGS State Cooperative Agreements. The content and presentation of this report benefited greatly from the technical peer reviews by Stephanie Gaswirth and Robert Milici.
References Cited Anna, L.O., 2011, Geologic assessment of undiscovered oil and gas in the Williston Basin Province,
Montana, North Dakota, and South Dakota, chap. 3 of U.S. Geological Survey Williston Basin Province Assessment Team, Assessment of undiscovered oil and gas resources of the Williston Basin Province of North Dakota, Montana, and South Dakota, 2010: U.S. Geological Survey Digital Data Series 69–W, 76 p., at http://pubs.usgs.gov/dds/dds-069/dds-069-w/contents/ reports/69_w_ch_3.pdf.
Anna, L.O., Pollastro, Richard, and Gaswirth, S.B., 2011, Williston Basin Province—Stratigraphic and structural framework to a geologic assessment of undiscovered oil and gas resources, chap. 2 of U.S. Geological Survey Williston Basin Province Assessment Team, Assessment of undiscovered oil and gas resources of the Williston Basin Province of North Dakota, Montana, and South Dakota, 2010: U.S. Geological Survey Digital Data Series 69–W, 17 p., at http://pubs.usgs.gov/dds/dds-069/dds-069-w/contents/reports/69_w_ch_2.pdf.
Anna, L.O., Pollastro, R.M., Gaswirth, S.B., Lewan, M.D., Lillis, P.G., Roberts, L.N.R., Schenk, C.J., Charpentier, R.R., Cook., T.A., and Klett, T.R., 2008, Assessment of undiscovered oil and gas resources of the Williston Basin Province of North Dakota, Montana, and South Dakota: U.S. Geological Survey Fact Sheet 2008–3092, 2 p., at http://pubs.usgs.gov/fs/2008/3092/.
Baars, D.L., 1972, Devonian System, in Mallory, W.W., ed., Geologic atlas of the Rocky Mountain region: Denver, Colo., Rocky Mountain Association of Geologists, p. 90–99.
Bachu, Stefan, and Hitchon, Bruce, 1996, Regional-scale flow of formation waters in the Williston Basin: American Association of Petroleum Geologists Bulletin, v. 80, no. 2, p. 248–264.
Ballard, F.V., 1963, Structural and stratigraphic relationships in the Paleozoic rocks of eastern North Dakota: North Dakota Geological Survey Bulletin 40, 75 p.
Barnes, T.R., 1952, The Williston Basin—A new province for oil exploration: Billings Geological Society, Third Annual Field Conference Guidebook, p. 96–117.
Benison, K.C., and Goldstein, R.H., 2000, Sedimentology of ancient saline pans—An example from the Permian Opeche Shale, Williston Basin, North Dakota, U.S.A.: Journal of Sedimentary Research, v. 70, no. 1, p. 159–169.
Blakey, Ron, 2011, Paleogeography: Flagstaff, Ariz., Department of Geology, Northern Arizona University, accessed February 15, 2012, at http://www2.nau.edu/rcb7/index.html.
Blondes, M.S., Brennan, S.T., Merrill, M.D., Buursink, M.L., Warwick, P.D., Cahan, S.M., Cook, T.A., Corum, M.D., Craddock, W.H., DeVera, C.A., Drake, R.M., Drew, L.J., Freeman, P.A., Lohr, C.D., Olea, R.A., Roberts-Ashby, T.L., Slucher, E.R., and Varela, B.A., 2013, National assessment of geologic carbon dioxide storage resources—Methodology implementation: U.S. Geological Survey Open-File Report 2013–1055, 26 p., at http://pubs.usgs.gov/of/2013/1055/.
Breit, G.N., 2002, Produced waters database: U.S. Geological Survey online database, accessed January 19, 2011, at http://energy.cr.usgs.gov/prov/prodwat/.
Brennan, S.T., Burruss, R.C., Merrill, M.D., Freeman, P.A., and Ruppert, L.F., 2010, A probabilistic assessment methodology for the evaluation of geologic carbon dioxide storage: U.S. Geological Survey Open-File Report 2010–1127, 31 p., at http://pubs.usgs.gov/of/2010/1127/.
36
Burruss, R.C., Brennan, S.T., Freeman, P.A., Merrill, M.D., Ruppert, L.F., Becker, M.F., Herkelrath, W.N., Kharaka, Y.K., Neuzil, C.E., Swanson, S.M., Cook, T.A., Klett, T.R., Nelson, P.H., and Schenk, C.J., 2009, Development of a probabilistic assessment methodology for evaluation of carbon dioxide storage: U.S. Geological Survey Open-File Report 2009–1035, 81 p., at http://pubs.usgs.gov/of/2009/1035/.
Busby, J.F., Kimball, B.A., Downey, J.S., and Peter, K.D., 1995, Geochemistry of water in aquifers and confining units of the northern Great Plains in parts of Montana, North Dakota, South Dakota, and Wyoming: U.S. Geological Survey Professional Paper 1402–F, p. F1–F146, at http://pubs.usgs.gov/pp/1402f/report.pdf.
Buursink, M.L., 2012, Reservoir pressure and temperature regimes in sedimentary basins and the geologic carbon-dioxide sequestration resource [abs]: American Association of Petroleum Geologists Search and Discovery Article #90142, Annual Convention and Exhibition, Long Beach, California, April 22–25, 2012, at http://www.searchanddiscovery.com/abstracts/html/2012/90142ace/abstracts/buu.htm.
Buursink, M.L., Slucher, E.R., Merrill, M.D., and Warwick, P.D., 2011, Assessing composite storage formations for geologic carbon sequestration [abs.]: American Association of Petroleum Geologists Search and Discovery Article #90131, American Association of Petroleum Geologists Eastern Section Meeting, Washington, D.C., September 25–27, at http://www.searchanddiscovery.com/abstracts/pdf/2011/eastern/abstracts/ndx_buursink.pdf.
Carlson, C.G., 1960, Stratigraphy of the Winnipeg and Deadwood Formations in North Dakota: North Dakota Geological Survey Bulletin 35, 145 p.
Carlson, C.G., and Anderson, S.B., 1965, Sedimentary and tectonic history of North Dakota part of Williston Basin: American Association of Petroleum Geologists Bulletin, v. 49, no. 111, p. 1833–1846.
Christopher, J.E., Gilboy, C.F., Paterson, D.F., Bend, S.L., eds., 1998, Eighth International Williston Basin Symposium Proceedings: Regina, Saskatchewan, Saskatchewan Geological Society Special Publication Number 13, 290 p.
Cobban, W.A., 1945, Marine Jurassic formations of Sweetgrass arch, Montana: American Association of Petroleum Geologists Bulletin, v. 29, p. 1262–1303.
Coleman, J.L., Jr., and Cahan, S.M., 2012, Preliminary catalog of the sedimentary basins of the United States: U.S. Geological Survey Open-File Report 2012–1111, 27 p. (plus 4 figures and 1 table available as separate files), at http://pubs.usgs.gov/of/2012/1111/.
DeCelles, P.G., 2004, Late Jurassic to Eocene evolution of the Cordilleran thrust belt and foreland basin system, Western U.S.A.: American Journal of Science, v. 304, p. 105–168.
Downey, J.S., 1984, Geohydrology of the Madison and associated aquifers in parts of Montana, North Dakota, South Dakota, and Wyoming: U.S. Geological Survey Professional Paper 1273–G, 47 p., at http://pubs.usgs.gov/pp/1273g/report.pdf.
Downey, J.S., 1986, Geohydrology of bedrock aquifers in the northern Great Plains in parts of Montana, North Dakota, South Dakota, and Wyoming: U.S. Geological Survey Professional Paper 1402–E, 96 p., at http://pubs.er.usgs.gov/publication/pp1402E.
Downey, J.S., Busby, J.F., and Dinwiddie, G.A., 1987, Regional aquifers and petroleum in the Williston Basin region of the United States, in Peterson, J.A., Longman, M.W., Anderson, S.B., Pilatzke, R.H., and Kent, D.M., eds., Williston Basin, anatomy of a cratonic oil province: Rocky Mountain Association of Geologists, p. 299–312.
Dyman, T.S., 1987, A review of the geology and petroleum resource potential of north central Montana: U.S. Geological Survey Open-File Report 87–450–G, 32 p., at http://pubs.usgs.gov/of/1987/0450g/report.pdf.
Dyman, T.S., 1995, North-Central Montana Province (028), in Gautier, D.L., Dolton, G.L., Takahashi, K.I., and Varnes, K.L., eds., 1995 National petroleum assessment of United States oil and gas resources—Results, methodology, and supporting data: U.S. Geological Survey Digital Data Series DDS–30, Release 2, one CD-ROM, at http://certmapper.cr.usgs.gov/data/noga95/prov28/text/prov28.pdf.
37
Ehrenberg, S.N., Eberli, G.P., Keramati, M., and Moallemi, S.A., 2006, Porosity-permeability relationships in interlayered limestone-dolostone reservoirs: American Association of Petroleum Geologists Bulletin, v. 90, no. 1, p. 91–114.
Ehrenberg, S.N., Nadeau, P.H., and Steen, Øyvind, 2009, Petroleum reservoir porosity versus depth—Influence of geological age: American Association of Petroleum Geologists Bulletin, v. 93, no. 10, p. 1281–1296.
Ehrets, J.R., and Kissling, D.L., 1987, Winnipegosis platform margin and pinnacle reef reservoirs, northwestern North Dakota, in Fischer, D.W., ed., Fifth International Williston Basin Symposium Core Workshop Volume: North Dakota Geological Survey Miscellaneous Series 69, p. 1–32.
Ellingson, J.B., and LeFever, R.D., 1995, Depositional environments and history of the Winnipeg Group (Ordovician), Williston Basin, North Dakota, in Hunter, L.D.V., and Schalla, R.A., eds., Seventh International Williston Basin Symposium: Montana, North Dakota, and Saskatchewan Geological Societies 1995 Guidebook, p. 129–141.
Feltis, R.D., Lewis, B.D., Lewis, R.L.F., Rioux, R.P., Jauhola, C.A., and Hotchkiss, W.R., 1981, Selected geologic data from the northern Great Plains area of Montana: U.S. Geological Survey Open-File Report 81–415, 63 p., at http://pubs.usgs.gov/of/1981/0415/report.pdf.
Fischer, D.W., and Burke, R.B., 1987, A synoptic overview of Winnipegosis pinnacle reefs in North Dakota: North Dakota Geological Survey Miscellaneous Series 68, 15 p.
Foster, N.H., 1972, Ordovician System, in Mallory, W.W., ed., Geologic atlas of the Rocky Mountain region: Denver, Colo., Rocky Mountain Association of Geologists, p. 76–85.
Francis, D.R., 1957, Jurassic stratigraphy of Williston Basin area: American Association of Petroleum Geologists Bulletin, v. 41, no. 3, p. 367–398.
Fuller, J.G.C.M., 1961, Ordovician and contiguous formations in North Dakota, South Dakota, Montana, and adjoining areas of Canada and United States: American Association of Petroleum Geologists Bulletin, v. 45, no. 8, p. 1334–1363.
Gaswirth, S.B., Marra, K.R., Cook, T.A, Charpentier, R.R., Gautier, D.L., Higley, D.K., Klett, T.R., Lewan, M.D., Lillis, P.G., Schenk, C.J., Tennyson, M.E., and Whidden, K.J., 2013, Assessment of undiscovered oil resources in the Bakken and Three Forks Formations, Williston Basin Province, Montana, North Dakota, and South Dakota, 2013: U.S. Geological Survey Fact Sheet 2013–3013, 4 p., at http://pubs.usgs.gov/fs/2013/3013/.
Gerhard, L.C., and S.B. Anderson, 1988, The Williston Basin—Sedimentary cover—North American craton, U.S. (chap. 9), in Sloss, L.L., ed., Geology of North America: Decade of North American Geology, Geological Society of America, vol. D-2, p. 221–242.
Gerhard, L.C., Anderson, S.B., and Fischer, D.W., 1990, Petroleum geology of the Williston Basin, chap. 29 of Leighton, M.W., Kolata, D.R., Oltz, D.T., and Eidel, J.J., eds., Interior cratonic basins: American Association of Petroleum Geologists Memoir 51, p. 507–559.
Gibbs, F.K., 1972, Silurian System, in Mallory, W.W., ed., Geologic atlas of the Rocky Mountain region: Denver, Colo., Rocky Mountain Association of Geologists, p. 86–89.
Gries, J.P., 1954, Cretaceous rocks of Williston Basin: American Association of Petroleum Geologists Bulletin, v. 38, no. 4, 453 p.
Gulf Coast Carbon Center, 2012, Brine-formation database: Bureau of Economic Geology, accessed February 15, 2012, at http://www.beg.utexas.edu/gccc/dispslsalnt01.php.
Hansen, D.E., 1955, Subsurface correlations of the Cretaceous Greenhorn-Lakota interval in North Dakota: North Dakota Geological Survey Bulletin 29, 45 p.
Harlan, S.S., Geissman, J.W., Whisner, S.C., and Schmidt, C.J., 2008, Paleomagnetism and geochronology of sills of the Doherty Mountain area, southwestern Montana—Implications for the timing of fold-and-thrust belt deformation and vertical-axis rotations along the southern margin of the Helena salient: Geological Society of America Bulletin, v. 120, no. 9-10, p. 1091–1104.
38
Harrison, J.E., and Cressman, E.R., 1993, Geology of the Libby thrust belt of northwestern Montana and its implications to regional tectonics: U.S. Geological Survey Professional Paper 1524, 42 p., http://pubs.usgs.gov/pp/1524/report.pdf.
Hunter, L.D.V., and Schalla, R.A., eds., 1995, Seventh International Williston Basin Symposium 1995 Guidebook: Billings, Montana, Montana, North Dakota, and Saskatchewan Geological Societies, 455 p.
IHS Energy Group, 2010 [includes data current as of December 23, 2009], PIDM (Petroleum Information Data Model) relational U.S. well data: IHS Energy Group, database available from IHS Energy Group, 15 Inverness Way East, D205, Englewood, CO 80112, U.S.A.
IHS Energy Group, 2011, ENERDEQ U.S. well data: IHS Energy Group, online database available from IHS Energy Group, 15 Inverness Way East, D205, Englewood, CO 80112, U.S.A., accessed January 20, 2011.
Inden, R., Byrnes, A., and Cluff, B., 1998, Facies and reservoir characteristics of Silurian Interlake of the central and southwestern Williston Basin, in Christopher, J.E., Gilboy, C.F., Paterson, D.F., Bend, S.L., eds., Eighth International Williston Basin Symposium Proceedings: Saskatchewan Geological Society, p. 67–88.
Kline, V.H., 1942, Stratigraphy of North Dakota: American Association of Petroleum Geologists Bulletin, v. 26, no. 3, p. 336–379.
Laird, W.M., 1964, Resume of the stratigraphy and structure of North Dakota, in Third International Williston Basin Symposium, Billings, N. Dak.: North Dakota and Saskatchewan Geological Societies, p. 39–44.
LeFever, J.A., 2006, Horizontal drilling in the Williston Basin—Proven and possible thoughts: Rocky Mountain Natural Gas Geology and Resource Conference, Rocky Mountain Association of Geologists, Denver, Colo., August 7–9, 5 p.
LeFever, R.D., Thompson, S.C., and Anderson, D.B., 1987, Earliest Paleozoic history of the Williston Basin in North Dakota, in Fischer, D.W., ed., Fifth International Williston Basin Symposium Core Workshop Volume: North Dakota Geological Survey Miscellaneous Series 69, p. 22–36.
Lochman-Balk, Christina, and Wilson, J.W., 1967, Stratigraphy of Upper Cambrian-Lower Ordovician subsurface sequence in Williston Basin: American Association of Petroleum Geologists Bulletin, v. 51, no. 6, p. 883–917.
Macke, D.L., 1993, Cambrian through Mississippian rocks of the Powder River Basin, Wyoming, Montana, and adjacent areas: U.S. Geological Survey Bulletin 1917–M, 182 p., at http://pubs.usgs.gov/bul/1917m/report.pdf.
Magoon, L.B., and Dow, W.G., 1994, The petroleum system—From source to trap: American Association of Petroleum Geologists Memoir 60, 655 p.
Mallory, W.W., ed., 1972, Geologic atlas of the Rocky Mountain region, United States of America: Denver, Colo., Rocky Mountain Association of Geologists, 331 p.
Maughan, E.K., 1966, Pennsylvanian and Permian paleogeography, tectonics, and stratigraphy in Montana and the Dakotas, in Twentieth Annual Conference, Symposium on Recently Developed Geologic Principles and Sedimentation of the Permo-Pennsylvanian of the Rocky Mountains: Wyoming Geological Association, p. 95–108.
McCoy, M.R., 1952, Ordovician sediments in the northern Black Hills, in Sonnenberg, F.P., ed., Black Hills-Williston Basin: Billings Geological Society Guidebook, no. 3, p. 44–47.
Megathan, E.R., 1987, Silurian Interlake Group, A sequence of cyclic marine and freshwater carbonate deposits in the central Williston Basin, in Fischer, D.W., ed., Fifth International Williston Basin Symposium Core Workshop Volume: North Dakota Geological Survey Miscellaneous Series 69, p. 59–88.
Monger, J.W.H., and Price, R.A., 1979, Geodynamic evolution of the Canadian Cordillera—Progress and problems: Canadian Journal of Earth Sciences, v. 16, no. 3, p. 770–791.
39
Mudge, M.R., 1982, A resume of the structural geology of the Northern Disturbed Belt, northwestern Montana, in Geologic studies of the Cordilleran Thrust Belt: Rocky Mountain Association of Geologists, v. 1, p. 91–122.
Murphy, E.C., Nordeng, S.H., Juenker, B.J., and Hoganson, J.W., 2009, North Dakota stratigraphic column: North Dakota Geological Survey Miscellaneous Series 91, 1 plate.
Nehring Associates, Inc., 2010 [data current as of December 2008], The significant oil and gas fields of the United States: Colorado Springs, Colo., Nerhing Associates, Inc., database available from Nehring Associates, Inc., P.O. Box 1655, Colorado Springs, CO 80901, U.S.A.
Otton, J.K., 2006, Environmental aspects of produced-water salt releases in onshore and estuarine petroleum-producing areas of the United States—A bibliography: U.S. Geological Survey Open-File Report 2006–1154, 223 p., at http://pubs.usgs.gov/of/2006/1154/pdf/of06-1154_508.pdf.
Perry, W.J., Jr., 1995, Montana Thrust Belt Province (037), in Gautier, D.L., Dolton, G.L., Takahashi, K.I., and Varnes, K.L., eds., 1995 National assessment of United States oil and gas resources—Results, methodology, and supporting data: U.S. Geological Survey Digital Data Series DDS−30, Release 2, one CD-ROM, at http://certmapper.cr.usgs.gov/data/noga95/prov37/text/prov37.pdf.
Peterson, J.A., 1957, Marine Jurassic of northern Rocky Mountains and Williston basins: American Association of Petroleum Geologists Bulletin, v. 41, p. 399–440.
Peterson, J.A., 1981, General stratigraphy and regional paleostructure of the western Montana Overthrust Belt, in 1981 Field Conference and Symposium Guidebook to Southwest Montana: Montana Geological Society, p. 5–35.
Peterson, J.A., 1988, Geologic summary and hydrocarbon plays, Williston Basin, Montana, North and South Dakota, and Sioux arch, South Dakota and Nebraska, U.S.: U.S. Geological Survey Open-File Report 87–450–N, 43 p., at http://pubs.usgs.gov/of/1987/0450n/report.pdf.
Peterson, J.A., 1995, Williston Basin Province (031), in Gautier, D.L., Dolton, G.L., Takahashi, K.I., and Varnes, K.L., eds., 1995 National assessment of United States oil and gas resources—Results, methodology, and supporting data: U.S. Geological Survey Digital Data Series DDS–30, Release 2, one CD-ROM, at http://certmapper.cr.usgs.gov/data/noga95/prov31/text/prov31.pdf.
Peterson, J.A., and MacCary, L.M., 1987, Regional stratigraphy and general petroleum geology of the U.S. portion of the Williston Basin and adjacent areas, in Peterson, J.A., Longman, M.W., Anderson, S.B., Pilatzke, R.H., and Kent, D.M., eds., Williston Basin, anatomy of a cratonic oil province: Rocky Mountain Association of Geologists, p. 9–43.
Plains CO2 Reduction (PCOR) Partnership, 2012, Scientific topical reports: University of North Dakota Energy and Environmental Research Center, at http://www.undeerc.org/PCOR/newsandpubs/scientificreports.aspx.
Pollastro, R.M., Roberts, L.N.R., Cook, T.A., and Lewan, M.D., 2008, Assessment of undiscovered technically recoverable oil and gas resources of the Bakken Formation, Williston Basin, Montana and North Dakota, 2008: U.S. Geological Survey Open-File Report 2008–1353, 3 sheets, at http://pubs.usgs.gov/of/2008/1353/.
Porter, J.W., and Fuller, J.G.C.M., 1959, Lower Paleozoic rocks of northern Williston Basin and adjacent areas: American Association of Petroleum Geologists Bulletin, v. 43, no. 1, p. 124–189.
Reishus, Mark, 1968, The Newcastle Formation in the Williston Basin of North Dakota: North Dakota Geological Survey Report of Investigation 47, 26 p.
Russell, W.L., 1927, The origin of the sandstone dikes of the Black Hills region: American Journal of Science, 5th series, v. 14, p. 402–408.
Sandberg, C.A., 1961, Distribution and thickness of Devonian rocks in Williston Basin and in central Montana and north-central Wyoming: U.S. Geological Survey Bulletin 1112–D, 30 p., 6 plates, at http://pubs.usgs.gov/bul/1112d/report.pdf.
Sandberg, C.A., and Hammond, C.R., 1958, Devonian system in Williston Basin and central Montana: American Association of Petroleum Geologists Bulletin, v. 42, no. 10, p. 2293–2334.
40
Saskatchewan Industry and Resources, 2004, Regional mapping component of the IEA Weyburn CO2 monitoring and storage project, accessed July 8, 2013, at http://www.ir.gov.sk.ca/files/co2monitoring/index.asp.
Schenk, C.J., Charpentier, R.R., Cook, T.A., Dyman, T.S., French, C.D., Henry, M.E., Klett, T.R., Perry, W.J., Jr., Pollastro, R.M., and Potter, C.J., 2002, Assessment of undiscovered oil and gas resources of the Montana Thrust Belt Province, 2002: U.S. Geological Survey Fact Sheet FS–148–02, at http://pubs.usgs.gov/fs/fs-148-02/FS-148-02.pdf.
Schmoker, J.W., 1996, Unconventional plays—Continuous type, in Peterson, J.A., eds., 1995 National oil and gas assessment conventional plays within the Williston Basin Province: U.S. Geological Survey Digital Data Series DDS-30, Release 2, one CD-ROM, at http://pubs.usgs.gov/dds/dds-030/.
Schmoker, J.W., and Hester, T.C., 1983, Porosity and thermal maturity of limestone bodies in Jurassic Swift Formation, Williston Basin, North Dakota: U.S. Geological Survey Open-File Report 83–723, 12 p., at http://pubs.usgs.gov/of/1983/0723/report.pdf.
Schmoker, J.W., Krystinik, K.B., and Halley, R.B., 1985, Selected characteristics of limestone and dolomite reservoirs in the United States: American Association of Petroleum Geologists Bulletin, v. 69, no. 5, p. 733–741.
Sloss, L.L., 1952, Introduction to the Mississippian of the Williston Basin, in Black Hills—Williston Basin: Billings Geological Society, Third Annual Field Conference, p. 65–69.
Sorensen, J.A., Bailey, T.P., Smith, S.A., Gorecki, C.D., Fischer, D.W., Peck, W.D., Steadman, E.N., and Harju, J.A., 2009, CO2 storage capacity estimates for stacked brine-saturated formations in the North Dakota portion of the Williston Basin: Energy Procedia, v. 1, no. 1, p. 2833–2840.
Sorensen, J.A., Smith, S.A., Dobroskok, A.A., Peck, W.D., Belobraydic, M.L., Kringstad, J.J., and Zeng, Z.W., 2009, Carbon dioxide storage potential of the Broom Creek Formation in North Dakota—A case study in site characterization for large-scale sequestration, in Grobe, M., Pashin, J.C., and Dodge, J.C. eds., Carbon dioxide sequestration in geological media—State of the science: American Association of Petroleum Geologists Studies in Geology 59, p. 279–296.
Stocker, G.R., 1956, Deadwood and Winnepeg correlations in the Williston Basin: First International Williston Basin Symposium, North Dakota and Saskatchewan Geological Societies, p. 112–114.
Thompson, E.E., Alexander, F., Tudor, M.S., Garbarini, G.S., and Laird, W.M., 1961, Stratigraphy of the Williston Basin, Devonian System: North Dakota Geological Society, 47 p.
Turner, C.E., and Peterson, F., 2004, Reconstruction of the Upper Jurassic Morrison Formation extinct ecosystem—A synthesis: Sedimentary Geology, v. 167, p. 309–355.
U.S. Environmental Protection Agency, 2009, Safe Drinking Water Act (SDWA): Washington, D.C., U.S. Environmental Protection Agency Web site, accessed January 14, 2009, at http://www.epa.gov/ogwdw/sdwa/index.html.
U.S. Environmental Protection Agency, 2010, Federal requirements under the underground injection control (UIC) for carbon dioxide (CO2) geologic sequestration (GS) wells: Washington, D.C., U.S. Environmental Protection Agency Web site, accessed October 15, 2012, at http://water.epa.gov/type/groundwater/uic/class6/gsregulations.cfm.
Vuke, S.M., Porter, K.W., Lonn, J.D., and Lopez, D.A., 2007, Geologic map of Montana: Montana Bureau of Mines and Geology, Geologic Map 62, 1:500,000 scale, 73 p., 2 sheets.
Whitehead, R.L., 1996, Ground water atlas of the United States: Montana, North Dakota, South Dakota, Wyoming: U.S. Geological Survey Hydrologic Atlas HA 730–1, at http://pubs.usgs.gov/ha/ha730/ch_i/index.html.
Ziebarth, H.C., 1972, The stratigraphy and economic potential of Permo-Pennsylvanian strata in southwestern North Dakota: University of North Dakota, Grand Forks, North Dakota, Ph.D. dissertation, 414 p.
ISSN 2331-1258 (online) http://dx.doi.org/10.3133/ofr20121024j.