Embed Size (px)
Citation preview
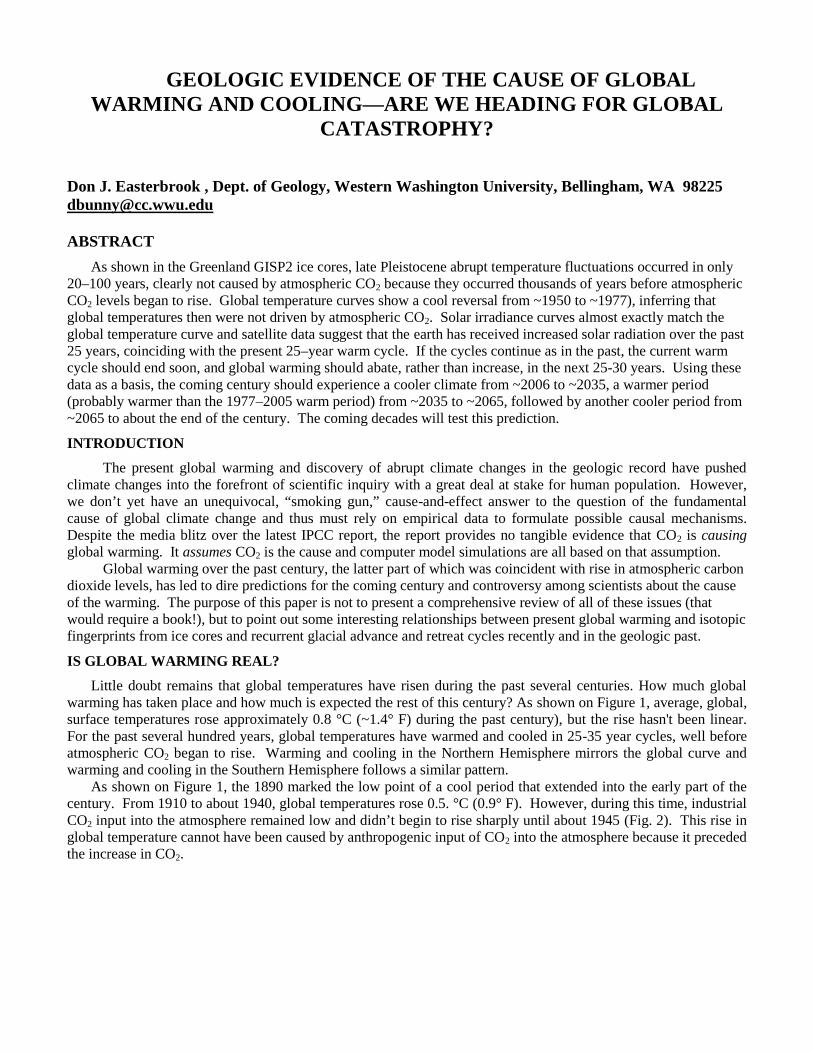
GEOLOGIC EVIDENCE OF THE CAUSE OF GLOBALWARMING AND COOLING—ARE WE HEADING FOR GLOBAL
CATASTROPHY?
Don J. Easterbrook , Dept. of Geology, Western Washington University, Bellingham, WA [email protected]
ABSTRACT
As shown in the Greenland GISP2 ice cores, late Pleistocene abrupt temperature fluctuations occurred in only20–100 years, clearly not caused by atmospheric CO2 because they occurred thousands of years before atmosphericCO2 levels began to rise. Global temperature curves show a cool reversal from ~1950 to ~1977), inferring thatglobal temperatures then were not driven by atmospheric CO2. Solar irradiance curves almost exactly match theglobal temperature curve and satellite data suggest that the earth has received increased solar radiation over the past25 years, coinciding with the present 25–year warm cycle. If the cycles continue as in the past, the current warmcycle should end soon, and global warming should abate, rather than increase, in the next 25-30 years. Using thesedata as a basis, the coming century should experience a cooler climate from ~2006 to ~2035, a warmer period(probably warmer than the 1977–2005 warm period) from ~2035 to ~2065, followed by another cooler period from~2065 to about the end of the century. The coming decades will test this prediction.
INTRODUCTION
The present global warming and discovery of abrupt climate changes in the geologic record have pushedclimate changes into the forefront of scientific inquiry with a great deal at stake for human population. However,we don’t yet have an unequivocal, “smoking gun,” cause-and-effect answer to the question of the fundamentalcause of global climate change and thus must rely on empirical data to formulate possible causal mechanisms.Despite the media blitz over the latest IPCC report, the report provides no tangible evidence that CO2 is causingglobal warming. It assumes CO2 is the cause and computer model simulations are all based on that assumption.
Global warming over the past century, the latter part of which was coincident with rise in atmospheric carbondioxide levels, has led to dire predictions for the coming century and controversy among scientists about the causeof the warming. The purpose of this paper is not to present a comprehensive review of all of these issues (thatwould require a book!), but to point out some interesting relationships between present global warming and isotopicfingerprints from ice cores and recurrent glacial advance and retreat cycles recently and in the geologic past.
IS GLOBAL WARMING REAL?
Little doubt remains that global temperatures have risen during the past several centuries. How much globalwarming has taken place and how much is expected the rest of this century? As shown on Figure 1, average, global,surface temperatures rose approximately 0.8 °C (~1.4° F) during the past century), but the rise hasn't been linear.For the past several hundred years, global temperatures have warmed and cooled in 25-35 year cycles, well beforeatmospheric CO2 began to rise. Warming and cooling in the Northern Hemisphere mirrors the global curve andwarming and cooling in the Southern Hemisphere follows a similar pattern.
As shown on Figure 1, the 1890 marked the low point of a cool period that extended into the early part of thecentury. From 1910 to about 1940, global temperatures rose 0.5. °C (0.9° F). However, during this time, industrialCO2 input into the atmosphere remained low and didn’t begin to rise sharply until about 1945 (Fig. 2). This rise inglobal temperature cannot have been caused by anthropogenic input of CO2 into the atmosphere because it precededthe increase in CO2.

2
Figure 1. a. Global temperature change from 1880 to 2007. (NASA-GISS). Note the warming period from~1910 to ~1945, the cool period from ~1945 to 1977, and the warm period from 1977 to 1998.b. U.S. temperature change from 1880 to 2007.
A ~30 year global cooling period occurred from the mid 1940s to 1977, during which time temperatures cooled0.5° C (0.9° F) in the Northern Hemisphere and 0.2° C (0.4° F) globally (Fig. 3), despite rapid rise in atmosphericCO2. (Fig. 2). Many glaciers advanced significantly during this cool period. If CO2 is the cause of global warming,the sharply rising atmospheric CO2 during this time should have resulted in global warming, not ~30 years of globalcooling.
In 1977, an abrupt climatic shift occurred and temperatures rose about 0.5°C (0.9° F) over the next 25 years asthe earth entered the current warm period (Fig. 1a). During this time, atmospheric CO2 continued to rise, but of thepast four, 25–30–year global temperature fluctuations, only the last one (1977–present) could possibly be attributedto CO2.
Global temperatures rose from 1977 to 1998, during which glacial melting accelerated and sea surfacetemperatures increased. However, the thermal high of 1998 has not been exceeded and temperatures during thepast 10 years declined slightly to 2007, then plunged dramatically in 2007-2008 (Fig. 2)

3
Figure 2. Global temperature 1996-2008
RISE OF ATMOSPHERIC CARBON DIOXIDE
Although CO2 has long been recognized as a greenhouse gas, it makes up only ~0.03% of the atmosphere(Figure 3), far less than water vapor (2-4%). Atmospheric CO2 levels have risen since 1945 to 0.038%, but thequestion is whether or not an increase of only 0.008% can overshadow the effects of solar changes. The answer tothis question may be found in the geologic record of global climate changes and changes in atmospheric CO2.
Figure 2. Composition of the atmosphere.
Measurements of CO2 from air trapped in polar ice cores over tens of thousands of years shows thatatmospheric CO2 concentrations typically vary from about 270–285 ppm, averaging about 280 ppm. AtmosphericCO2 concentrations have been stable at ~280 ± 10 ppm during the past millennium until the industrial revolutionwhen it rose gradually. In 1945, CO2 began to increase rapidly. Atmospheric CO2 levels rose CO2 to ~370 in 2000.However, from 1945 to 1977, while CO2 levels rose from approximately 300 ppm to 330 ppm, the globaltemperature rise reversed and cooled about 0.2 degrees during the same period (Fig. 3).

4
Figure 3A. CO2 emissions to the atmosphere since 1850. Note that emissions rose sharply beginning in~1945, but 30 years of global cooling followed. Global warming in the early part of the century (~1910-1945)occurred without substantial increase in CO2.
Figure 3B. Atmospheric CO2 since 1955. Note that no sudden change in CO2 occurred in 1977 at the time ofabrupt climate change from cool to warm.
The high solubility and chemical reactivity of CO2 permits ready exchange of CO2 between the atmosphere andoceans. The amount of CO2 in the oceans is about 50 times greater than in the atmosphere. CO2 solubility dependson temperature, so changes in sea surface temperature affects CO2 exchange with the atmosphere. Warming of seasurface water drives CO2 into the atmosphere, as is seen in spikes in atmospheric CO2 during strong El Niño years.
GLOBAL WARMING AND CO2 DURING THE PAST CENTURY
Global warming from 1890 to 1945 not caused by atmospheric CO2
Atmospheric temperature measurements, glacier fluctuations, and oxygen isotope data from Greenland ice cores allrecord a cool period from about 1880 to about 1910, reaching a low about 1890. During this period, globaltemperatures were about 0.9 ° C (1.6 ° F) cooler than at present. From 1880 to 1890, temperatures dropped 0.35 °C (0.6° F) in only 10 years. From 1890 to 1900, temperatures rose 0.25 ° C (0.45 ° F) in 10 years, after whichtemperatures dipped slightly (0.15 ° C (0.3 ° F) until 1910. From 1910 to 1945, global temperatures rose 0.4 ° C(0.7 ° F), half of the total temperature rise for the past century. As expected, glaciers during this period retreatedand, in general, followed the warming climate pattern. All of this occurred before CO2 emissions began to soar

5
(after 1945) (Fig. 3A), so at least half of the warming of the past century cannot have been caused by manmadeCO2.
Figure 4. Global cooling during soaring atmospheric CO2 emissions 1945 to 1977.
Global temperatures began to cool in the late 1940’s at the point when CO2 emissions began to soar (Fig. 3A).For 30 years thereafter temperatures declined 0.2 ° C (0.4 ° F) globally and 0.5 ° C (0.9 ° F) in the NorthernHemisphere (Fig. 5).
During this 30 year period (1945–1977), glaciers ceased the recession of the preceding ~30 years and began toadvance. By 1980, many advancing glaciers had recovered much of the length lost in the previous ~30 year ofwarming. Many examples of glacial recession during the past century cited in the news media show contrastingterminal positions beginning with the maximum extent at the end of a ~30 year cool period and ending with theminimum extent of the present 30 year warm period. A much better gauge of the effect of climate on glacierswould be to compare glacier terminal positions between the ends of successive cool periods or the ends ofsuccessive warm periods.
Figure 5 shows global temperature and atmospheric CO2 from 1940 to 1980. Note that even though CO2 risessharply, global temperature drops during that period. If CO2 causes global warming, temperature should have risen,rather than declined.
Global warming during rising atmospheric CO2 from 1977 to 2007
In 1977, global temperatures, which had been declining since the late 1940’s, abruptly reversed and began torise. Since then, global temperatures have risen ~0.5 ° C (0.9 ° F), alpine glaciers have retreated, Arctic sea ice hasdiminished, melting of the Greenland Ice Sheet has accelerated, and other changes have occurred. During this time,atmospheric CO2 has continued to rise, the only period in the past century when global warming and atmosphericCO2 have risen together.

6
Figure 5. Global cooling during rapid increase in atmospheric CO2 from 1940 to 1977.
Is Global Warming Caused by Rising CO2?
No tangible, physical evidence exists that proves a cause–and–effect relationship between global climatechanges and atmospheric CO2. The fact that CO2 is a greenhouse gas and that CO2 has increased doesn’t prove thatCO2 has caused global warming. As shown by isotope measurements from ice cores in Greenland and Antarcticaand by measurements of atmospheric CO2 during El Nino warming oceans emit more CO2 into the atmosphereduring climatic warming. The ice core records indicate that after the last Ice Age, temperatures rose for about 800years before atmospheric CO2 rose, showing that climatic warming causes CO2 to rise, not vice versa. No doubtexists that the present high levels of atmospheric CO2 are the result of human input, but the contribution that itmakes to global warming remains to be proven.
Assertions by the ICPP and other CO2 proponents
As seen in the previous discussion, no correlation exists between atmospheric CO2 and the many global climatechanges that have occurred over the past several centuries and the past 15,000 years. In a Newsweek article (August13, 2007), author Sharon Begley states “Current warming is 10 times greater than ever before seen in the geologicrecord. The chance that warming is natural is less than 10 percent.” Every competent geologist knows that thisstatement is totally false and contrary to vast amounts of well-established data. Global climates have warmed about4-7° F in a series of ~30 year cycles since the Little Ice Age 400 years ago, all with no correlation with atmosphericCO2, yet the author claims that “the pattern of warming has a human fingerprint.” What is needed to bring clarityto the issue is not rhetoric like this, but a hard look at the huge amount of geologic data that shows we’ve hadclimate changes 20 times greater than the past century in a fourth of the time.
In February 2007, The International Panel on Climate Change (IPCC) released a summary report forpolicymakers by 33 authors. The panel conducted no research of its own but relied on previously publishedmaterial. Neither the summary report nor the earlier full report contains any tangible, physical, cause-and-effectevidence that global warming is caused by anthropogenic CO2 emissions. The IPCC conclusions are based on theempirical observation that global temperatures have risen during the past century and CO2 has also risen and oncomputer model simulations that assume global temperatures will rise with increasing atmospheric CO2. Becausethe coincidence of increase in global temperature and atmospheric CO2 is an empirical relationship, that does not initself prove that rising CO2 is causing global warming. Nonetheless, the IPCC summary report for policymakersconcludes that “Most of the observed increases in globally averaged temperatures since the mid-20th century isvery likely due to the observed increase in anthropogenic greenhouse gas concentrations.” They also concludedthat “The widespread warming of the atmosphere and ocean, together with ice mass loss, support the conclusionthat it is extremely unlikely that global climate change of the past fifty years can be explained without external

7
forcing, and very likely that it is not due to known natural causes alone.” Curiously, they later state the “It is veryunlikely that climate changes of a least the seven centuries prior to 1950 were due to variability generated withinthe climate system alone. A significant fraction of the reconstructed Northern Hemisphere interdecadaltemperature variability over those centuries is very likely attributed to volcanic eruptions and changes in solarirradiance, and it is likely that anthropogenic forcing contributed to the early 20th century warming evident in theserecords.” The report does not elaborate on why, if solar irradiance or volcanic eruptions were responsible forearlier climate changes, they could not also be the cause of changes since 1950, nor how anthropogenic emissionscould be responsible for early 20th century warming before CO2 emissions began to soar after 1945.
In his book “The Inconvenient truth Gore (2006) attributes global warming of the past century to anthropogenicCO2 emissions, alleging that “Our civilization has never experienced any environmental shift remotely similar tothis. Today’s climate pattern has existed throughout the entire history of human civilization” and that “Everyplace―every city, every farm is located or has been developed on the basis of the same climate patterns we have always known. “
Gore (2006) contends that the possibility of global warming being caused by natural climate cycles is amisconception. “Climate does naturally change. By studying tree rings, lake sediments, ice cores, and othernatural features that provide a record of past climates, scientist know that changes in climate, including abruptchanges, have occurred throughout history. But these changes all took place with natural variations in carbondioxide levels that were small than the ones we are now causing. Cores taken from deep in the ice of Antarcticashow that carbon dioxide levels are higher now than they have been at any time in the last 650,000 years, whichmeans we are outside the realm of natural climate variation. More CO2 in the atmosphere means warmingtemperatures.” This is one example among many of circular reasoning and bad logic—it correctly admits thatnatural climatic cycles have been responsible for abrupt climate changes in the past when CO2 levels were low andcould not be the cause of the climate changes, then arrives at the peculiar conclusion that climatic warming must becaused by increasing CO2.
Gore (2006) and other proponents of the CO2 as the cause of global warming allege that “there is virtually noserious disagreement remaining on any of these central points that make up the consensus view of the worldscientific community.” The basis for this claim apparently is based, at least in part, on the IPCC report and theclaim that virtually all of the world’s scientists endorse it. However, the summary 2007 report for policymakerswas compiled by only 33 authors and the full report, to be released in June 2007, was assembled by 143 authors andreviewed by 27 editors, hardly representative of the entire scientific community. Lindzen (2006) points out, “thereis no consensus” -- no one has polled the world’s several hundred thousand scientists. Gore (2006) claimed that of928 articles dealing with climate change in the past 10 years, none expressed any doubt about the cause of globalwarming. Lindzen (2006), however, found that of those 928 publications, only 13 favored CO2 as the cause ofglobal warming. Clearly, what needs to be done is to get away from the rhetoric and politicizing of global warmingand carefully analyze the facts as they exist.
LESSONS FROM PAST GLOBAL CLIMATE CHANGES
Proponents of CO2 as the cause of global warming have stated that never before in the Earth’s history of hasclimate changed as rapidly as in the past century and that proves global warming is being caused by anthropogenicCO2. Statements such as these are easily refutable by the geologic record. Figure 5 shows temperature changesrecorded in the GISP2 ice core from the Greenland Ice Sheet. The global warming experienced during the pastcentury pales into insignificance when compared to the magnitude of at least ten sudden, profound climate reversalsover the past 15,000 years (Figure 5).

8
Figure 5. Temperature changes over the past 15,000 years. Red lines represent times of sudden warming, bluelines represent times of rapid cooling. Numbers refer to the events listed below. (Modified from Cuffey and Clow,1997 and Alley, 2004)
Late Pleistocene abrupt climate changes
The magnitude and timing of past climatic changes are recorded in the isotope data from Greenland andAntarctic ice cores. These data clearly show that abrupt climate changes many times greater than those of the pastcentury have occurred many times in the geologic past. Numbers correspond to the temperature curves on Figure 5.
1. About 15,000 yrs ago, a sudden, intense, climatic warming (~12° C; ~21° F) caused dramatic melting oflarge Ice Age ice sheets that covered Canada and the northern U.S., all of Scandinavia, and much of northernEurope and Russia. Sea level that had been 120 m (~400 ft) lower than present rose quickly and submergedlarge areas than had been dry land during the Ice Age.
2. A few centuries later, temperatures again plummeted (~11° ; ~20° F) and glaciers advanced.
3. About 14,000 years ago, global temperatures rose rapidly (~4.5°C; ~8° F) once again and glaciersreceded.
4. About 13,400 years ago, global temperatures plunged again (~8°C; ~14° F) and glaciers advanced.
5. About 13,200 years ago, global temperatures increased rapidly (~5°C; ~9° F) and glaciers receded.
6. 12,700 yrs ago global temperatures plunged sharply (~8°C; ~14° F) and a 1000 year period of glacialreadvance, the Younger Dryas, began.
7. 11,500 yrs ago, global temperatures rose sharply (~12° C; ~21° F), marking the end of the YoungerDryas cold period and the end of the Pleistocene Ice Age.
Early Holocene climate changes
8,200 years ago, the post-Ice Age interglacial period was interrupted by a sudden global cooling (~4° C;~7° F) that lasted for a few centuries (Figure 5, 6). During this time, alpine glaciers advanced and builtmoraines. The warming that followed the abrupt cool period was also abrupt. Neither the abrupt climaticcooling nor the warming that followed was preceded by atmospheric CO2 changes.

9
Figure 6. The 8200 sudden climate change, recorded in oxygen isotope ratios in the GISP2 ice core, lasted about200 years.
Late Holocene climate changes
750 B.C. to 200 B.C. cool period
Prior to the founding of the Roman Empire, Egyptians records show a cool climatic period from about 750 to450 B.C. and the Romans wrote that the Tiber River froze and snow remained on the ground for long periods(Singer, 2007).
The Roman warm period (200 B.C. to 600 A.D.)
After 100 B.C., Romans wrote of grapes and olives growing farther north in Italy that had been previouslypossible and of little snow or ice (Singer, 2007).
The Dark Ages cool period (440 A.D. to 900 A.D.)
The Dark Ages were characterized by marked cooling. A particularly puzzling event apparently occurred in540 A.D. when tree rings suggest greatly retarded growth, the sun appeared dimmed for more than a year,temperatures dropped in Ireland, Great Britain, Siberia, North and South America, fruit didn’t ripen, and snow fellin the summer in southern Europe (Baillie in Singer, 2007). In 800 A.D., the Black Sea froze and in 829 A.D. theNile River froze (Oliver, 1973).
The Medieval Warm Period (900 A.D. to 1300 A.D.)
The Medieval Warm (MWP) Period was a time of warm climate from about 900–1300 AD when globaltemperatures were apparently somewhat warmer than at present. Its effects were evident in Europe where graincrops flourished, alpine tree lines rose, many new cities arose, and the population more than doubled. The Vikingstook advantage of the climatic amelioration to colonize Greenland, and wine grapes were grown as far north asEngland where growing grapes is now not feasible and about 500 km north of present vineyards in France andGermany. Grapes are presently grown in Germany up to elevations of about 560 meters, but from about 1100 to1300 A.D., vineyards extended up to 780 meters, implying temperatures warmer by about 1.0 to 1.4° C (Oliver,1973, Tkachuck, 1983). Wheat and oats were grown around Trondheim, Norway, suggesting climates aboutwarmer one degree C warmer than present (Fagan, 2000).
Elsewhere in the world, prolonged droughts affected the southwestern United States and Alaska warmed.Sediments in Lake Nakatsuna in central Japan record warmer temperatures. Sea surface temperatures in theSargasso Sea were approximately 1°C warmer than today and the climate in equatorial east Africa was drier from1000–1270 AD. An ice core from the eastern Antarctic Peninsula shows warmer temperatures during this period.
Oxygen isotope studies in Greenland, Ireland, Germany, Switzerland, Tibet, China, New Zealand, andelsewhere, plus tree-ring data from many sites around the world all confirm the presence of a global MedievalWarm Period. Soon and Baliunas (2003) found that 92% of 112 studies showed physical evidence of the MWP,only two showed no evidence, and 21 of 22 studies in the Southern Hemisphere showed evidence of Medievalwarming. Evidence of the MWP at specific sites are summarized in Fagan (2007) and Singer (2007). Thus,

10
evidence that the Medieval Warm Period was a global event is widespread. The IPCC 2nd report (Climate Change1995) included a graph showing the MWP with warmer temperatures than today and the Little Ice Age with muchcooler temperatures.
Despite all of this physical evidence of the global MWP, the IPCC 3rd report (Climate Change 2001) reassessedthe MWP on the basis of tree ring studies by Mann et al. (1998) and concluded that neither the MWP nor the LittleIce Age were global climatic events. Mann’s graph (Fig. 7) became known as “the hockey stick” of climate changeand was used in the 2001 IPCC report to assert that climate had not changed until led to Gore’s 2007 famousassertion that “Our civilization has never experienced any environmental shift remotely similar to this. Today’sclimate pattern has existed throughout the entire history of human civilization.”
Figure 7. Mann (1998) “hockey stick” graph of temperature change over the past 1000 years
The Mann “hockey stick” was at odds with hundreds of historical and isotope sources, including theGreenland GRIP ice core isotope data, sea surface temperatures in the Sargasso Sea sediments (Fig. 8) (Keigwin,1996), and paleo-temperature data other than tree rings (Fig. 9) (Loehle, 2007). McIntrye and McKitrick (2003)evaluated the data in the Mann paper and concluded that the Mann curve was invalid “due to collation errors,unjustifiable truncation or extrapolation of source data, obsolete data, geographical location errors, incorrectcalculation of principal components and other quality control defects.“ Thus, the “hockey stick” concept of globalclimate change is now widely considered invalid and an embarrassment to the IPCC.
Figure 8. Surface temperatures of the Sargasso Sea reconstructed from isotope ratios in marine organisms(Keigwin, 1996).

11
Figure 9. Reconstructed paleo-temperatures without tree ring data (Loehle, 2007)
The Little Ice Age (1300 A.D. to the 20th century)
At the end of the Medieval Warm Period, temperatures dropped drammatically in ~20 years and the cold periodthat followed is known as the Little Ice Age (LIA). The colder climate that ensued for several centuries wasdevastating. Temperatures of the cold winters and cool, rainy summers were too low for effective growing of cerealcrops, resulting in widespread famine and disease.
Glaciers in Greenland began advancing and pack ice extended southward in the North Atlantic in the 13thcentury. Glaciers expanded worldwide. The population of Europe had become dependent on cereal grains as a foodsupply during the Medieval Warm Period and when the colder climate, early snows, violent storms, and recurrentflooding swept Europe, massive crop failures occurred. Three years of torrential rains that began in 1315 led to theGreat Famine of 1315-1317. The Thames River in London froze over, the growing season was significantlyshortened, crops failed repeatedly, and wine production dropped sharply.
Winters during the Little Ice Age were bitterly cold in many parts of the world (Fagan, 2000; Grove, 2004).Advance of glaciers in the Swiss Alps in the mid–17th century gradually encroached on farms and buried entirevillages. The Thames River and canals and rivers of the Netherlands frequently froze over during the winter. NewYork Harbor froze in the winter of 1780 and people could walk from Manhattan to Staten Island. Sea icesurrounding Iceland extended for miles in every direction, closing many harbors. The population of Icelanddecreased by half and the Viking colonies in Greenland died out in the 1400s because they could no longer growenough food there and pack ice became an increasingly difficult problem. In parts of China, warm weather cropsthat had been grown for centuries were abandoned. In North America, early European settlers experiencedexceptionally severe winters.
The cold and terrible famines of the early 1300s abated somewhat after a century or so, then turned even colderin the 16th and 17th centuries. The largest settlement in Greenland, about 225 farms, survived until about 1500 butwith a shortened growing season and encroaching sea ice their situation became increasingly desperate (Fagan,2000; Grove, 2004). In England, the Thames froze over and during the bitter cold winter of 1684, a three-mile widestrip of ice froze along the English channel. In 1695, ice blocked the coast of Ireland for much of the year and theentire cod fishery there failed (Fagan, 2000). Famines from 1690 to 1700 and in 1725 and 1816 resulted in severalmillion deaths (Fagan, 2000).
Glaciers all over the world advanced to their most extended positions since the last Ice Age and build moraineswell downvalley from their present termini. Villages in the European Alps were damaged or destroyed and alpinetree lines dropped several hundred meters.
In 1609, Galileo perfected the telescope, allowing observation of sun spots. From 1645 to1715, solar activitywas extremely low, with some years having no sunspots at all. This period of low sunspot activity, known as theMaunder Minimum, coincided with the thermal low of the Little Ice Age. The Spörer Sunspot Minimum also

12
occurred during a significant cold period of the Little Ice Age. Low solar activity during the Little Ice Age is alsoshown by changes in the production rates of radiocarbon and 10Be in the upper atmosphere.
Global temperatures have risen about 1° F per century since the Little Ice Age, but the warming has not beencontinuous. Numerous 25-35 year warm/cool cycles appear in the record of glacial fluctuations and isotope recordsin Greenland ice cores.
CLIMATIC FLUCTUATIONS SINCE THE LITTLE ICE AGE—SHORT-TERM CLIMATE CYCLES
The global climate has warmed progressively since the LIA, but not at a constant rate. Oscillations betweenwarm and cool periods have occurred in a fairly regular fashion about every 25-35 years (Figure 7).
Global temperatures have risen about 1° F per century since the cooling of the Little Ice Age, but the warminghas not been continuous. Numerous ~30 year warming periods have been interspersed with ~30 year coolingperiods (Figure 7). However, each warming period has been slightly warmer than the preceding one and cool periodhas not been quite as cool as the previous one. For example, the present warm period (1977–2007) is slightlywarmer than the 1920–1950 warm period, and the 1947–1977 cool cycle (Figure 1) is not quite as cool as the~1880–1910 cool period.
Figure 10. Cyclic warming and cooling trends in the past 500 years (plotted from GISP2 data, Stuiver andGrootes, 2000).
During each warm cycle, glaciers retreated and during each cool cycle, glaciers advanced. However, becauseeach warm cycle was slightly warmer than the previous one and each cool cycle not quite as cool as the previousone, glacier termini have progressively receded upvalley from their Little Ice Age maximums. These relationshipsare well shown on glaciers on Mt. Baker, Washington where large distinct Little Ice Age moraines mark the glaciertermini well below present ice termini. Successively higher moraines upvalley mark progressive advances andstillstands resulting from warm/cool cycles. The later moraines match the observed global climate changes (Fig. 1).
The oldest Little Ice Age moraines have trees growing on them dating back to the 1500’s. A buried forest onthe Coleman glacier moraine (Figure 11), dated at 680 ± 80 and 740 ± 80 14C yrs B.P., grew during the MidievalWarm Period atop an older moraine. The forest was buried by a Little Ice Age moraine. Annual rings from treesgrowing on successively younger moraines upvalley show moraine–building episodes in the 1600’s, ~1750, ~1790,~1850, and ~1890.

13
Figure 11. Little Ice Age moraine burying a forest that grew during the Medieval Warm Period, Colemanglacier, Mt. Baker, WA.
Ice margins of Mt. Baker glaciers are shown on air photos dating back to 1943 and on some earlier ground andair photos (Figures 9–13). Glaciers that had been retreating since at least the 1920’s advanced during the 1947–1977 cool period to positions downvalley from their 1943 termini. They began to retreat once again at the start ofthe 1977–2007 warm cycle and present termini of the Easton and Boulder glaciers are about 1500 ft. upvalley fromtheir 1979 positions.
These glacier fluctuations closely follow the global cooling record and indicate that the ~30 yr. warming andcooling cycles seen in the glacial record mimic global climate changes. Thus, pre-historic glacial fluctuations alsoappear to record global climate changes.
Figure 12. GISP2 oxygen isotope record of the 1875-1900 cool period.
Coleman Glacier, Mt. BakerColeman Glacier, Mt. Baker1940 to 1947 1947-1979
Figure 13A. Coleman Glacier, Mt. Baker WA. Figure 13B. Retreat and advance of the Coleman glacier

14
Figure 13C. Retreat of the Coleman glacier since 1979, the beginningof the present 30 yr. warm cycle.
Easton Glacier, Mt. BakerEaston Glacier, Mt. Baker1940 to 1956 1956 to 1979
Figure 14A Easton glacier, Mt. Baker, WA Figure 14B. Retreat and advance of the Easton glacier.
Figure 14C. Retreat of the Easton glacier since 1979, the beginningof the present 30 yr. warm cycle.

15
Boulder Glacier, Mt. BakerBoulder Glacier, Mt. Baker1940 to 1956 1956 to 1979
Figure 15A Boulder glacier, Mt. Baker, WA Figure 15B. Retreat and advance of the Boulder glacier.
Figure 15C. Retreat of the Boulder glacier since 1979, thebeginning of the present 30 yr. warm cycle.
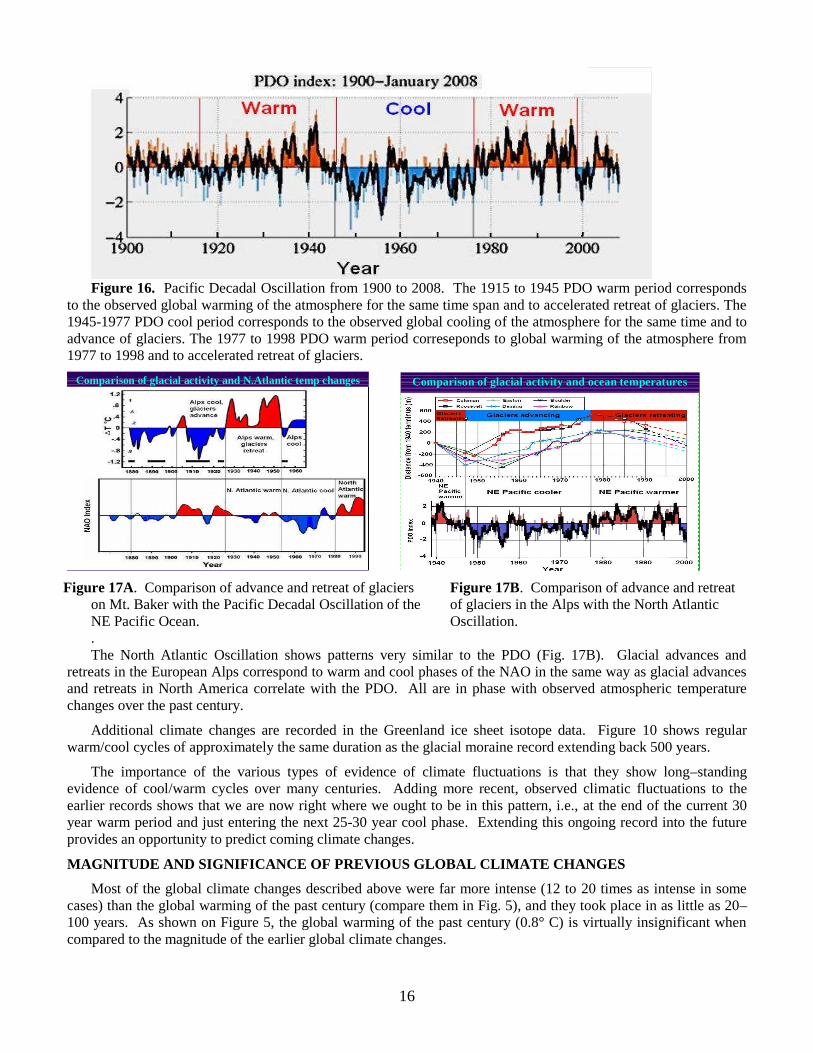
Each of these glacial fluctuations matches the both global temperature curve and sea surface temperaturesrecorded by the Pacific Decadal Oscillation (Fig. 16). The 1915 to 1945 PDO warm period occurred during theobserved global warming of the atmosphere from 1915 to 1945 and to accelerated retreat of glaciers. The 1945-1977 PDO cool period took place during the global cooling of the atmosphere from 1945 to 1977 and to theadvance of glaciers. The 1977 to 1998 PDO warm period occurred during global warming of the atmosphere from1977 to 1998 and to accelerated retreat of glaciers. After the 1998 El Nino Pacific warm event, the PDO switchedfrom its warm phase to a cool phase, but was interrupted by the 2005-2006 El Nino. In 2007-2008, the PDOresumed its cool phase and the winter of 2007-2008 was record-breaking cool globally.
16
Figure 16. Pacific Decadal Oscillation from 1900 to 2008. The 1915 to 1945 PDO warm period correspondsto the observed global warming of the atmosphere for the same time span and to accelerated retreat of glaciers. The1945-1977 PDO cool period corresponds to the observed global cooling of the atmosphere for the same time and toadvance of glaciers. The 1977 to 1998 PDO warm period correseponds to global warming of the atmosphere from1977 to 1998 and to accelerated retreat of glaciers.
Comparison of glacial activity andComparison of glacial activity and N.AtlanticN.Atlantic temp changestemp changes Comparison of glacial activity and ocean temperaturesComparison of glacial activity and ocean temperatures
Figure 17A. Comparison of advance and retreat of glaciers Figure 17B. Comparison of advance and retreaton Mt. Baker with the Pacific Decadal Oscillation of the of glaciers in the Alps with the North AtlanticNE Pacific Ocean. Oscillation..The North Atlantic Oscillation shows patterns very similar to the PDO (Fig. 17B). Glacial advances and
retreats in the European Alps correspond to warm and cool phases of the NAO in the same way as glacial advancesand retreats in North America correlate with the PDO. All are in phase with observed atmospheric temperaturechanges over the past century.
Additional climate changes are recorded in the Greenland ice sheet isotope data. Figure 10 shows regularwarm/cool cycles of approximately the same duration as the glacial moraine record extending back 500 years.
The importance of the various types of evidence of climate fluctuations is that they show long–standingevidence of cool/warm cycles over many centuries. Adding more recent, observed climatic fluctuations to theearlier records shows that we are now right where we ought to be in this pattern, i.e., at the end of the current 30year warm period and just entering the next 25-30 year cool phase. Extending this ongoing record into the futureprovides an opportunity to predict coming climate changes.
MAGNITUDE AND SIGNIFICANCE OF PREVIOUS GLOBAL CLIMATE CHANGES
Most of the global climate changes described above were far more intense (12 to 20 times as intense in somecases) than the global warming of the past century (compare them in Fig. 5), and they took place in as little as 20–100 years. As shown on Figure 5, the global warming of the past century (0.8° C) is virtually insignificant whencompared to the magnitude of the earlier global climate changes.

17
None of these sudden, pre-1977 global climate changes could possibly have been caused by human CO2 inputto the atmosphere because they all took place long before human CO2 contributions to the atmosphere began. Thecause of the ten ‘natural’ climate changes that occurred earlier could easily have been the same as the cause ofpresent global warming.
If CO2 is indeed the cause of global warming, then global temperatures should mirror the rise in CO2. For thepast 1000 years, atmospheric CO2 levels have remained fairly constant at about 280 ppm (parts per million).Atmospheric CO2 concentrations began to rise during the industrial resolution early in the 20th century. In 1945,atmospheric CO2 rose sharply. By 1980 it has risen to just under 340 ppm. During this time, however, globaltemperatures fell about 0.5° C (0.9° F) in the Northern Hemisphere and about 0.2° C (0.4° F) globally (Fig. 3). In1977, global atmospheric temperatures again reversed suddenly, rising about 0.5° C (0.9° F) above the 1945-1977cool cycle in 25 years. If CO2 is the cause of global warming, why did temperatures fall for 30 years while CO2
was sharply accelerating? Logic dictates that this anomalous cooling cycle during accelerating CO2 levels mustmean either (1) rising CO2 is not the cause of global warming or (2) some process other than rising CO2 is capableof overriding its effect on global atmospheric warming and CO2 is inconsequential.
If we look at temperature patterns since the latter part of the Little Ice Age (~1600 to 1860 A.D.), a very similarpattern emerges--25-30 periods of alternating warm and cool temperatures during overall warming from the LittleIce Age low. These temperature fluctuations took place well before any effect of anthropogenic atmospheric CO2
and were far greater. About 80% of the CO2 from human activities was added to the atmosphere after 1940, so theearly 20th Century and earlier warming trends had to be natural and the recent trend in surface warming cannot beprimarily attributable to human–made greenhouse gases. Thus, CO2 cannot possibly have been the cause of theseclimatic changes so why should we suppose that the last few must be? We clearly need to look to causalmechanisms other than rising CO2 if we are to truly understand global warming.
SOLAR IRRADIANCE AND GLOBAL CLIMATE CHANGE
The global climate changes described above have coincided with changes in sunspot activity, solar irradiance,and rates of production of 14C and 10Be in the atmosphere by radiation, suggesting that the climate changes arecaused by fluctuations in solar activity. A good example of the relationship between solar activity and climateoccurred
When Galileo perfected the telescope in 1609, scientists could see sunspots for the first time. They were ofsuch interest that records were kept of the number of sunspots observed, and although perhaps not entirely accuratedue to cloudy days, lost records, etc., the records show a remarkable pattern for nearly a century (Fig. 22). From1600 to 1700 AD, very few sunspots were seen, despite the fact that many scientists with telescopes were lookingfor them, and reports of aurora borealis were minimal. This interval is known as the Maunder Minimum (E.W.Maunder, 1894; E.E. Maunder, 1922). After 1700 AD, the number of observed sunspots increased sharply fromnearly zero to 50–100 (Fig. 22). The Maunder Minimum was preceded by the Sporer Minimum (~1410–1540 AD)and the Wolf Minimum (~1290–1320 AD) (Fig. 27). Each of these periods is characterized by low numbers ofsunspots, significant changes in the rate of production of 14C in the atmosphere, and cooler global climates.
Figure 22. Sunspots during the Little Ice Age. (Modified from Eddy, 1976)

18
Global temperature change, sunspots, solar irradiance, 10Be and 14C production
Good correlations can now be made between global temperature change, sunspots (Fig. 23) (Eddy, 1976;Stuiver and Quay, 1980), solar irradiance (Lean, 1989, 1991, 2000, 2001, Lean and Rind, 1998; Lean et al., 1995,2002), and 10Be (Beer et al., 1994, 1996, 2000) and 14C production (Stuiver, 1961, 1994; Stuiver and Brasiunas,1991, 1992; Stuiver et al., 1991, 1995) in the atmosphere. 10Be is produced in the upper atmosphere by radiationbombardment of oxygen. Increased radiation results in increased 10Be production. Plots of 10Be production andsunspots (Figs. 24, 25) indicate a good correlation between the two. Thus, 10Be measurements can serve as a proxyfor solar activity.
Figure 23. Variation in global warming and cooling with solar activity from 1860 to 1990. Note how closely thetrends of the curves follow one another almost exactly. Contrast this with the lack of correlation of CO2 variationand global temperature and in pre–1980 global temperature changes.
Figure 24. Variation of 10Be production in the upper atmosphere with sun spots.

19
Figure 25. Correlation of temperatures derived from oxygen isotope ratios with production rates ofradiocarbon in the upper atmosphere.
The close correspondence of solar activity to global climate change from 1750 to 1990 is shown in Figure 26.Not only did atmospheric global temperature change with solar activity, but so did sea surface temperatures. Thisis in sharp contrast to the lack of correlation of atmospheric CO2 changes to global warming and cooling prior to1980. Solar irradiance and global temperature show the same relationship as solar activity (sunspots) and globaltemperature. Solar irradiance from 1750 to 1990 shows almost exactly the same pattern as global warming andcooling over the past 250 years.

20
Figure 26. Solar irradiance and global warming and cooling from 1750 to 1990. During this 250 year period, thetwo curves follow a remarkably similar pattern. (Modified from Hoyt and Schatten, 1997)
A similar relationship between solar irradiance and climate change for the past 400 years is shown in Figure 26.The very low sunspot activity that began about 1600 AD is also marked by a decrease in solar irradiance thatheralded the beginning of the Little Ice Age. Solar irradiance also dropped during the Dalton Minimum in the early1800s. Since then, solar irradiance has risen with an oscillatory pattern (Fig. 26)
The correspondence of global cold periods with solar irradiance and sun spot cycle length isremarkable. Figure 276 shows the close relationship of time of glacial advance with low solar irradiance.Figure 28 shows a comparison of the correlation of solar irradiance and global temperature and the lack ofcorrelation of atmospheric CO2 and global temperature.
Figure 27. Solar irradiance, sunspots, and glacial fluctuations. Blue areas are times of glacial advances.Note that each period of glacial advance is marked by a time of low solar irradiance, including the 1880 to1910 and 1945 to 1977 glacial advances during global cool periods. Is the correspondence of the extendedlength of sun spot cycle 23, recent global cooling, and the setting up of the cool phase of the PDO purelycoincidental or is there a cause-and-effect relationship?

21
Figure 28. Comparison of the correlation of global temperature with solar irradiance and the lack ofcorrelation with CO2.
Low sun spot frequency in sun spot cycle 23 is extended beyond the normal length and cycle 24 isoverdue. The recent global cooling and setting up of the cool phase of the PDO is reminiscent of solarand climatic conditions at the beginning of the Little Ice Age.
Figure 28. Decline in sun spots since 2000, which corresponds to setting up of the Pacific DecadalOscillation cool phase and slight global cooling since 1998.
CLIMATE CHANGES IN THE COMING CENTURY
IPCC Predictions:
What does the century have in store for global climates? According to the IPCC, Al Gore’s recent book, andmany computer modelers who believe that CO2 is the cause of global warming, the Earth is in store for climaticcatastrophe later this century. Computer models predict global warming of as much as 5-6° C (10-11° F) (Fig. 4),which would cause massive starvation from crop failures, melting of most of the world’s glaciers, sea level risewith drowning of some low-lying islands and coastal cities, and numerous environmental changes. All of this is

22
predicated on the assumption that global warming is caused by increasing atmospheric CO2 and that CO2 willcontinue to rise rapidly.
The Intergovernmental Panel on Climatic Change (IPCC) has projected that in the next century, globalwarming will continue to rise to catastrophically higher and higher levels (Figure 4). The basis for this prediction isthat the IPCC believes that rising atmospheric CO2 is the cause of global warming and that CO2 levels willcontinue to rise in the future, so global temperatures will also continue to rise. Computer models, programmed tocalculate rise in global temperatures as a function of CO2, predict that by 2100, atmospheric CO2 will to rise to 540-970 ppm and global temperature will increase 0.6 °C (1.1° F) by 2010, 1.2° C (2.1° F) by 2038, and up to 10.7°C(19° F) by 2100.
Figure 19. IPCC computer-projected global temperature increase for the coming century. Gray area is therange of IPCC predictions; red line is the Easterbrook projection based on past cyclic climate changes.
Figure 20. Comparison of IPCC global warming predictions to 2050 and the Easterbrook projection.
The validity of these predictions depends on the assumptions that (1) the cause of global warming is rising CO2,
(2) the rise in CO2 is caused by anthropogenic fossil fuel emissions and other human activities, and (3)anthropogenic fossil fuel emissions will continue to rise throughout the present century. With so much at stake,verifying the soundness of these assumptions is of critical importance.
The ramifications of such an increase in global warming are far reaching, even catastrophic in some areas.Such a rise of global surface temperatures would have devastating results. The Arctic Ocean would become free ofits cover of sea ice, the Greenland ice sheet would diminish rapidly, and alpine glaciers would disappear. Watersupply in areas that depend on snowmelt would be severely impacted. Melting of Greenland and Antarctic icewould cause sea level to rise, flooding low coast areas and submerging low coral islands in the oceans. Crops incritical agricultural areas would fail, resulting in widespread starvation of millions of people in agriculturally

23
marginal areas. Wheat/grain belts, such as the mid-continent area of North America, would have to shift northward.Droughts would become increasingly severe in dry areas. Environmental impacts would be severe, resulting inextinction of some species and drastic population decreases in others.
Predictions Based on Past Climate Patterns
Considering all the positive correlations between solar activity and global climate change, what if the cause ofglobal warming is solar, rather than atmospheric CO2? Then all of the computer models are meaningless and wecan look to past natural climatic cycles as a basis for predicting future climate changes. The climatic fluctuationsover the past few hundred years suggest ~30 year climatic cycles of global warming and cooling, on a general risingtrend from the Little Ice Age cool period. If the trend continues as it has for the past several centuries, globaltemperatures for the coming century might look like those in Figure 15. Global cooling should begin soon and lastuntil about 2040, then warm again until about 2070, and cooling again to the end of the century. The total increasein global warming from now to the end of the century should be only about 0.4°C, compared to nearly 11°C(maximum) predicted by the IPCC (Fig. 16)
Figure 21. Global temperature projection for the coming century, based on warming/cooling cycles of the pastseveral centuries. The 30-year global cooling prediction was first made in 1998 and reaffirmed in 2001. The recentsetting up of the cool phase of the PDO appears to confirm the strong likelihood that the prediction will indeedhappen.
RECENT GLOBAL COOLING AND PACIFIC DECADAL OSCILLATION (PDO)COOLING IN THE PACIFIC OCEAN
Global temperatures peaked in 1998 and have not been exceeded since then, despite dire predictions bythe IPCC and CO2 advocates. Instead, the climate cooled slightly from 1998 to 2007 and then cooleddramatically in 2007-2008 (Fig. x). Pacific Ocean temperatures began a cooling phase in 1999 that wasbriefly interrupted by El Nino in 2005-2006 and dramatic cooling in 2007-2008 appears to be acontinuation of a global cooling trend set up by the PDO cool phase (Fig. 18).
The announcement by NASA’s Jet Propulsion Laboratory that the Pacific Decadal Oscillation (PDO)had shifted to its cool phase (Fig. 18) is right on schedule as predicted by past climate and PDO changes(Easterbrook, 2001, 2006, 2007). It is not an oddity superimposed upon and masking the predicted severewarming by the IPCC.

24
Figure 18. Cooling of the Pacific Ocean and setting up of the PDO. Sea surface temperature anomalyin the Pacific Ocean from April 14–21, 2008. The anomaly compares the recent temperatures measuredwith an average of data from 1985–1997. Places where the Pacific was cooler than normal are blue, placeswhere temperatures were average are white, and places where the ocean was warmer than normal are red.The cool water anomaly in the center of the image shows the lingering effect of the year-old La Niña.However, the much broader area of cooler-than-average water off the coast of North America fromAlaska (top center) to the equator is a classic feature of the cool phase of the Pacific Decadal Oscillation(PDO). The cool waters wrap in a horseshoe shape around a core of warmer-than-average water. (In thewarm phase, the pattern is reversed). Unlike El Niño and La Niña, which may occur every 3 to 7 yearsand last from 6 to 18 months, the PDO can remain in the same phase for 20 to 30 years. (NASA image byJesse Allen, AMSR-E data by Chelle Gentemann and Frank Wentz, Remote Sensing Systems. Caption byRebecca Lindsey, adapted from a press release from NASA JPL).
As shown by the historic pattern of PDOs over the past century (Fig. 2) and by corresponding globalwarming and cooling, the pattern is part of ongoing warm/cool cycles that last 25-30 years. Thus, the past30 years of global warming has apparently ended.