Embed Size (px)
Citation preview
210
Pelican
Lake
Lake
Edward
North
Long
Lake
371 Lake
Hubert
ClarkLake
1250
1225
1225
1200
1200
1200
1200
1200
1200
1175
1175
1175
1175
1200
1200
1225
Well 1
Well 2
Well 3
Well 4
Well 5
see inset
RoundLake
LakeHubert
1200
Well 2
Well 3
Well 4
Well 5
Inflow
Outflow
371
Nisswa
LakeEdward
SilverLake
PerchLake
LougeeLake
CullenLakes
TwinLakes
RiceLake
GardenLake
JohnsonLake
RoundLake
GladstoneLake
BassLake
SpiderLake
FawnLake
ClarkLake
Lake
Hubert
PelicanLake
371
Nisswa
LakeEdward
SilverLake
PerchLake
LougeeLake
CullenLakes
TwinLakes
RiceLake
GardenLake
JohnsonLake
RoundLake
GladstoneLake
BassLake
SpiderLake
FawnLake
ClarkLake
Lake
Hubert
PelicanLake
371
Nisswa
LakeEdward
SilverLake
PerchLake
LougeeLake
CullenLakes
TwinLakes
RiceLake
GardenLake
JohnsonLake
RoundLake
GladstoneLake
BassLake
SpiderLake
FawnLake
ClarkLake
Lake
Hubert
PelicanLake
6
169
18
371
210
6
371
1825
25
210
6
18
210
371
371
46°15'
46°30'
46°45'46°45'
46°30'
46°15'
94°15' 94°00'
94°00'94°15'
T. 138 N.
T. 137 N.
T. 136 N.
T. 135 N.
T. 134 N.
T. 133 N.
T. 43 N.
T. 44 N.
R. 32 W. R. 31 W. R. 30 W. R. 29 W. R. 28 W.
R. 29 W. R. 28 W. R. 25 W.R. 26 W.R. 27 W.
T. 138 N.
T. 43 N.
T. 44 N.
T. 45 N.
T. 46 N.
T. 47 N.
T. 137 N.
Trommald
Garrison
Brainerd
Crosby
Deerwood
PequotLakes
BreezyPoint
Nisswa
Baxter
LizzieLake
CloughLake
StewartLake
Kego LakeMitchell
Lake
ButterfieldLake
EagleLake
West FoxLake
PickerelLake
GoodrichLake
DolneyLake
LakePine
Little
OxLake
Big TroutLake
Lower Whitefish
Lake
Upper
WhitefishLake
BerthaLake
Clear
Star Lake
KimbleLake
RushLake
DuckLake
Cross
Lake VelvetLake
Big BirdLake
PineLake
GreerLake Bass
Lake Adney
Lake
GoogleLake
FoolLake
HorseshoeLakes
BassLake
Mission
Lakes
PelicanLake
LakeEdward
SilverLake
PerchLake
LougeeLake
CullenLakes
TwinLakes
SibleyLake
ClarkLake
RiceLake
GardenLake
JohnsonLake
BlackBear Lake
ColesLake
GullLake
RoundLake
Lake
HubertGladstone
Lake
North LongLake
WiseLake
Red SandLake
White SandLake
PerchLake
MudLake
SebieLake
RoundLake
South Long
Lake
RussellLake
Upper SouthLong Lake
MudLake
Twin IslandLake
HoppyLake
RiceLake
BassLake
SpiderLake
FawnLake
BlueLake Anna
Lake
SquawLake
PapooseLake
RuthLake
Lake Mary
LakeEmily
DahlerLake
TroutLake
DuckLake
Little PineLake
EasthamLake
DeanLake
PerryLake
RabbitLake
IslandLake
CarlsonLake
Stark Lake
RossLake
RooseveltLake
RogerLake
CedarLake
PlatteLake
RockLake
WhitefishLake
CampLake
SmithLake
HoltLake
BordenLake
MillerLake
RoundLake
KenneyLake
ScottLake Rice Lake
PartridgeLake
TurtleLake
BirchLake
Bay Lake
PortageLake Hanks
Lake
MapleLake
ClearwaterLake
NokayLake
HeronLake
EagleLake
WolfLake Loon
Lake
LookoutLake
LongLake
ShirtLake
Hamlet Lake
RiceLake
OlanderLake
Serpent Lake
AgateLake
ErskineLake
TwentytwoLake
BulldogLake
Jack PineLake
MudLake
MudLake
Crow WingLake
CaseyLake
BlackLake
RenoLake
BlackhoofLake
Upper DeanLake
MudLake
IslandLake
LowsLake
JailLake
Indian JackLake
DeerLake
NelsonLakeOssawinnamakee Lake
PortageLake
NisswaLake
Upper HayLake
LowerHayLake
WhippleLakes
GilbertLake
RoyLake
MilleLacsLake
Nokasippi
River
PinePine River
Dag
gett
Bro
ok
River
Mississippi
River
River
Little
HorseshoeLake
Cuyuna
GraveLake
Riverton
AIT
KIN
CO
UN
TY
AIT
KIN
CO
UN
TYCASS COUNTY
CA
SS
CO
UN
TY
MO
RR
ISO
N
MORRISON COUNTY
YT
NU
OC
SC
AL ELLI
M
CO
UN
TY
T. 136 N.
Daggett
Bro
ok
LakeJenkins
Figure 9 Extent
Figure 11 Extent
MonitoringWell 18000
169
18
210
25
210
6
210
46°15'
46°30'
46°45'46°45'
46°30'
46°15'
94°15' 94°00'
94°00'94°15'
Brainerd
Crosby
Lake Whitefish
Pelican
Lake
LakeEdward
North Long
Lake
NokasippiRiver
River
MississippiRiver
6
18
371
371
25
Mississippi
1 0 1 2 3 4 5 MILES
SCALE 1:350 000
1 0 1 2 3 4 5 6 7 KILOMETERS
1 0 1 2 3 4 5 MILES
SCALE 1:200 000
1 0 1 2 3 4 5 6 7 8 KILOMETERS
COMPILATION SCALE 1:100 000
1196
1197
1198
1199
1200
1985 1990 1995 2000 2005 2010Year
Elev
atio
n (fe
et a
bove
mea
n se
a le
vel)
Lake elevationExplanation
Lake runout elevation
1204
1205
1206
1207
1208
1985 1990 1995 2000 2005 2010Year
Elev
atio
n (fe
et a
bove
mea
n se
e le
vel)
Lake elevationExplanation
1196
1197
1198
1199
1200
1985 1990 1995 2000 2005 2010Year
Elev
atio
n (fe
et a
bove
mea
n se
a le
vel)
Lake elevationExplanation
Lake runout elevation
1237
1238
1239
1240
1241
1980 1985 1990 1995 2000 2005 2010Year
Elev
atio
n (fe
et a
bove
mea
n se
a le
vel)
Lake elevationExplanation
Lake runout elevation
-90
-80
-70
-60
-50
-40
-30
-20
-13 -11 -9 -7 -5 -3 -1 1δ 18O
δ 2 H
2σ minimum
2σ maximum
Ground water
North Americanmeteoric water line
Lakes
ExplanationWell 5
Whitefish Lake
Well 2Well 3
Well 4
Lake Hubert
Pelican Lake
Pelican Lake
Lake Hubert
Well 1 (C-3, plate 8)
0
5
10
15
20
25
30
35
40
1970
1972
1974
1976
1978
1980
1982
1984
1986
1988
1990
1992
1994
1996
1998
2000
2002
2004
2006
2008
2010
Ann
ual p
reci
pita
tion
(inch
es)
8b 30-year normalprecipitation
1199
1200
1201
1202
1203
1204
1205
1206
1207
1208
1209
1970 1980 1990 2000 2010Year
Elev
atio
n (fe
et a
bove
mea
n se
a le
vel)
8a
Lake elevation
Lake runout elevationWater-table elevationin DNR monitoringwell 18000
Explanation
1200 Water-table elevation (in feet above mean sea level). Contour interval is 25 feet.General direction of ground-water movement.
STATE OF MINNESOTADEPARTMENT OF NATURAL RESOURCESDIVISION OF WATERS
COUNTY ATLAS SERIESATLAS C-16, PART B, PLATE 10 OF 10Interaction of Lakes and Ground Water
GEOLOGIC ATLAS OF CROW WING COUNTY, MINNESOTA
The DNR Information Center
Twin Cities: (651) 296-6157Minnesota toll free: 1-888-646-6367Telecommunication device for the hearing
impaired (TDD): (651) 296-5484TDD Minnesota toll free: 1-800-657-3929DNR web site: http://www.dnr.state.mn.us
This information is available in alternative format on request.
Equal opportunity to participate in and benefit from programs of the Minnesota Department of Natural Resources is avail-able regardless of race, color, national origin, sex, sexual orientation, marital status, status with regard to public assis-tance, age, or disability. Discrimination inquiries should be sent to Minnesota DNR, 500 Lafayette Road, St. Paul, MN 55155-4031, or the Equal Opportunity Office, Department of the Interior, Washington, DC 20240.
© 2007 State of Minnesota,Department of Natural Resources, and theRegents of the University of Minnesota.
This map was compiled and generated using geographic information systems (GIS) technology. Digital data products, including chemistry and geophysical data, are available from DNR Waters at http://www.dnr.state.mn.us.waters.This map was prepared from publicly available information only. Every reason-able effort has been made to ensure the accuracy of the factual data on which this map interpretation is based. However, the Department of Natural Resources does not warrant the accuracy, completeness, or any implied uses of these data. Users may wish to verify critical information; sources include both the references here and information on file in the offices of the Minnesota Geologi-cal Survey and the Minnesota Department of Natural Resources. Every effort has been made to ensure the interpretation shown conforms to sound geologic and cartographic principles. This map should not be used to establish legal title, boundaries, or locations of improvements.Digital base composite:Roads and county boundaries - Minnesota Department of Transportation GIS Statewide Base Map (source scale 1:24,000)Hydrologic features - U.S. Geological Survey Digital Line Graphs (source scale 1:100,000)Digital base annotation - Minnesota Geological SurveyProject data compiled from 2005 to 2007 at a scale of 1:100,000. Universal Transverse Mercator projection, grid zone 15, 1983 North American datum. Vertical datum is mean sea level.GIS and cartography by Todd Petersen and Greg Massaro. Edited by Nick Kroska.
INTERACTION OF LAKES AND GROUND WATER
By
Todd A. Petersenand
James A. Solstad
2007
FIGURE 4. Ross Lake hydrograph. Ross Lake is a type 1 lake in Garri-son till deposits. It has a relatively large ratio (19:1) of contributing surface watershed area to lake area. On several occasions during the late summer, however, the combined surface and ground water entering the lake was insufficient to offset evaporation losses, and the water level dropped below its runout eleva-tion.
FIGURE 5. Clark Lake hydro-graph. Clark Lake is a type 1 lake in Glacial Lake Brainerd deposits. It has a relatively large ratio (42:1) of contributing surface watershed area to lake area. During most years, it received sufficient surface-water input to maintain the water elevation above its runout elevation.
FIGURE 7. Lake Hubert hydro-graph. Lake Hubert is a type 3 lake with a small ratio (3.4:1) of contrib-uting surface watershed area to lake area. It rises high enough to have a surface-water outlet during wet years, but during extended dry condi-tions, its water elevation is consis-tently below its runout elevation.
FIGURE 6. Horseshoe Lake hydro-graph. Horseshoe Lake is a type 2 lake in a landlocked basin, with a very small ratio (2.6:1) of contribut-ing surface watershed area to lake area. It is dominated by ground-water flow. The yearly water-elevation fluctuation is generally very small; the multiyear water-elevation fluctuation is much larger.
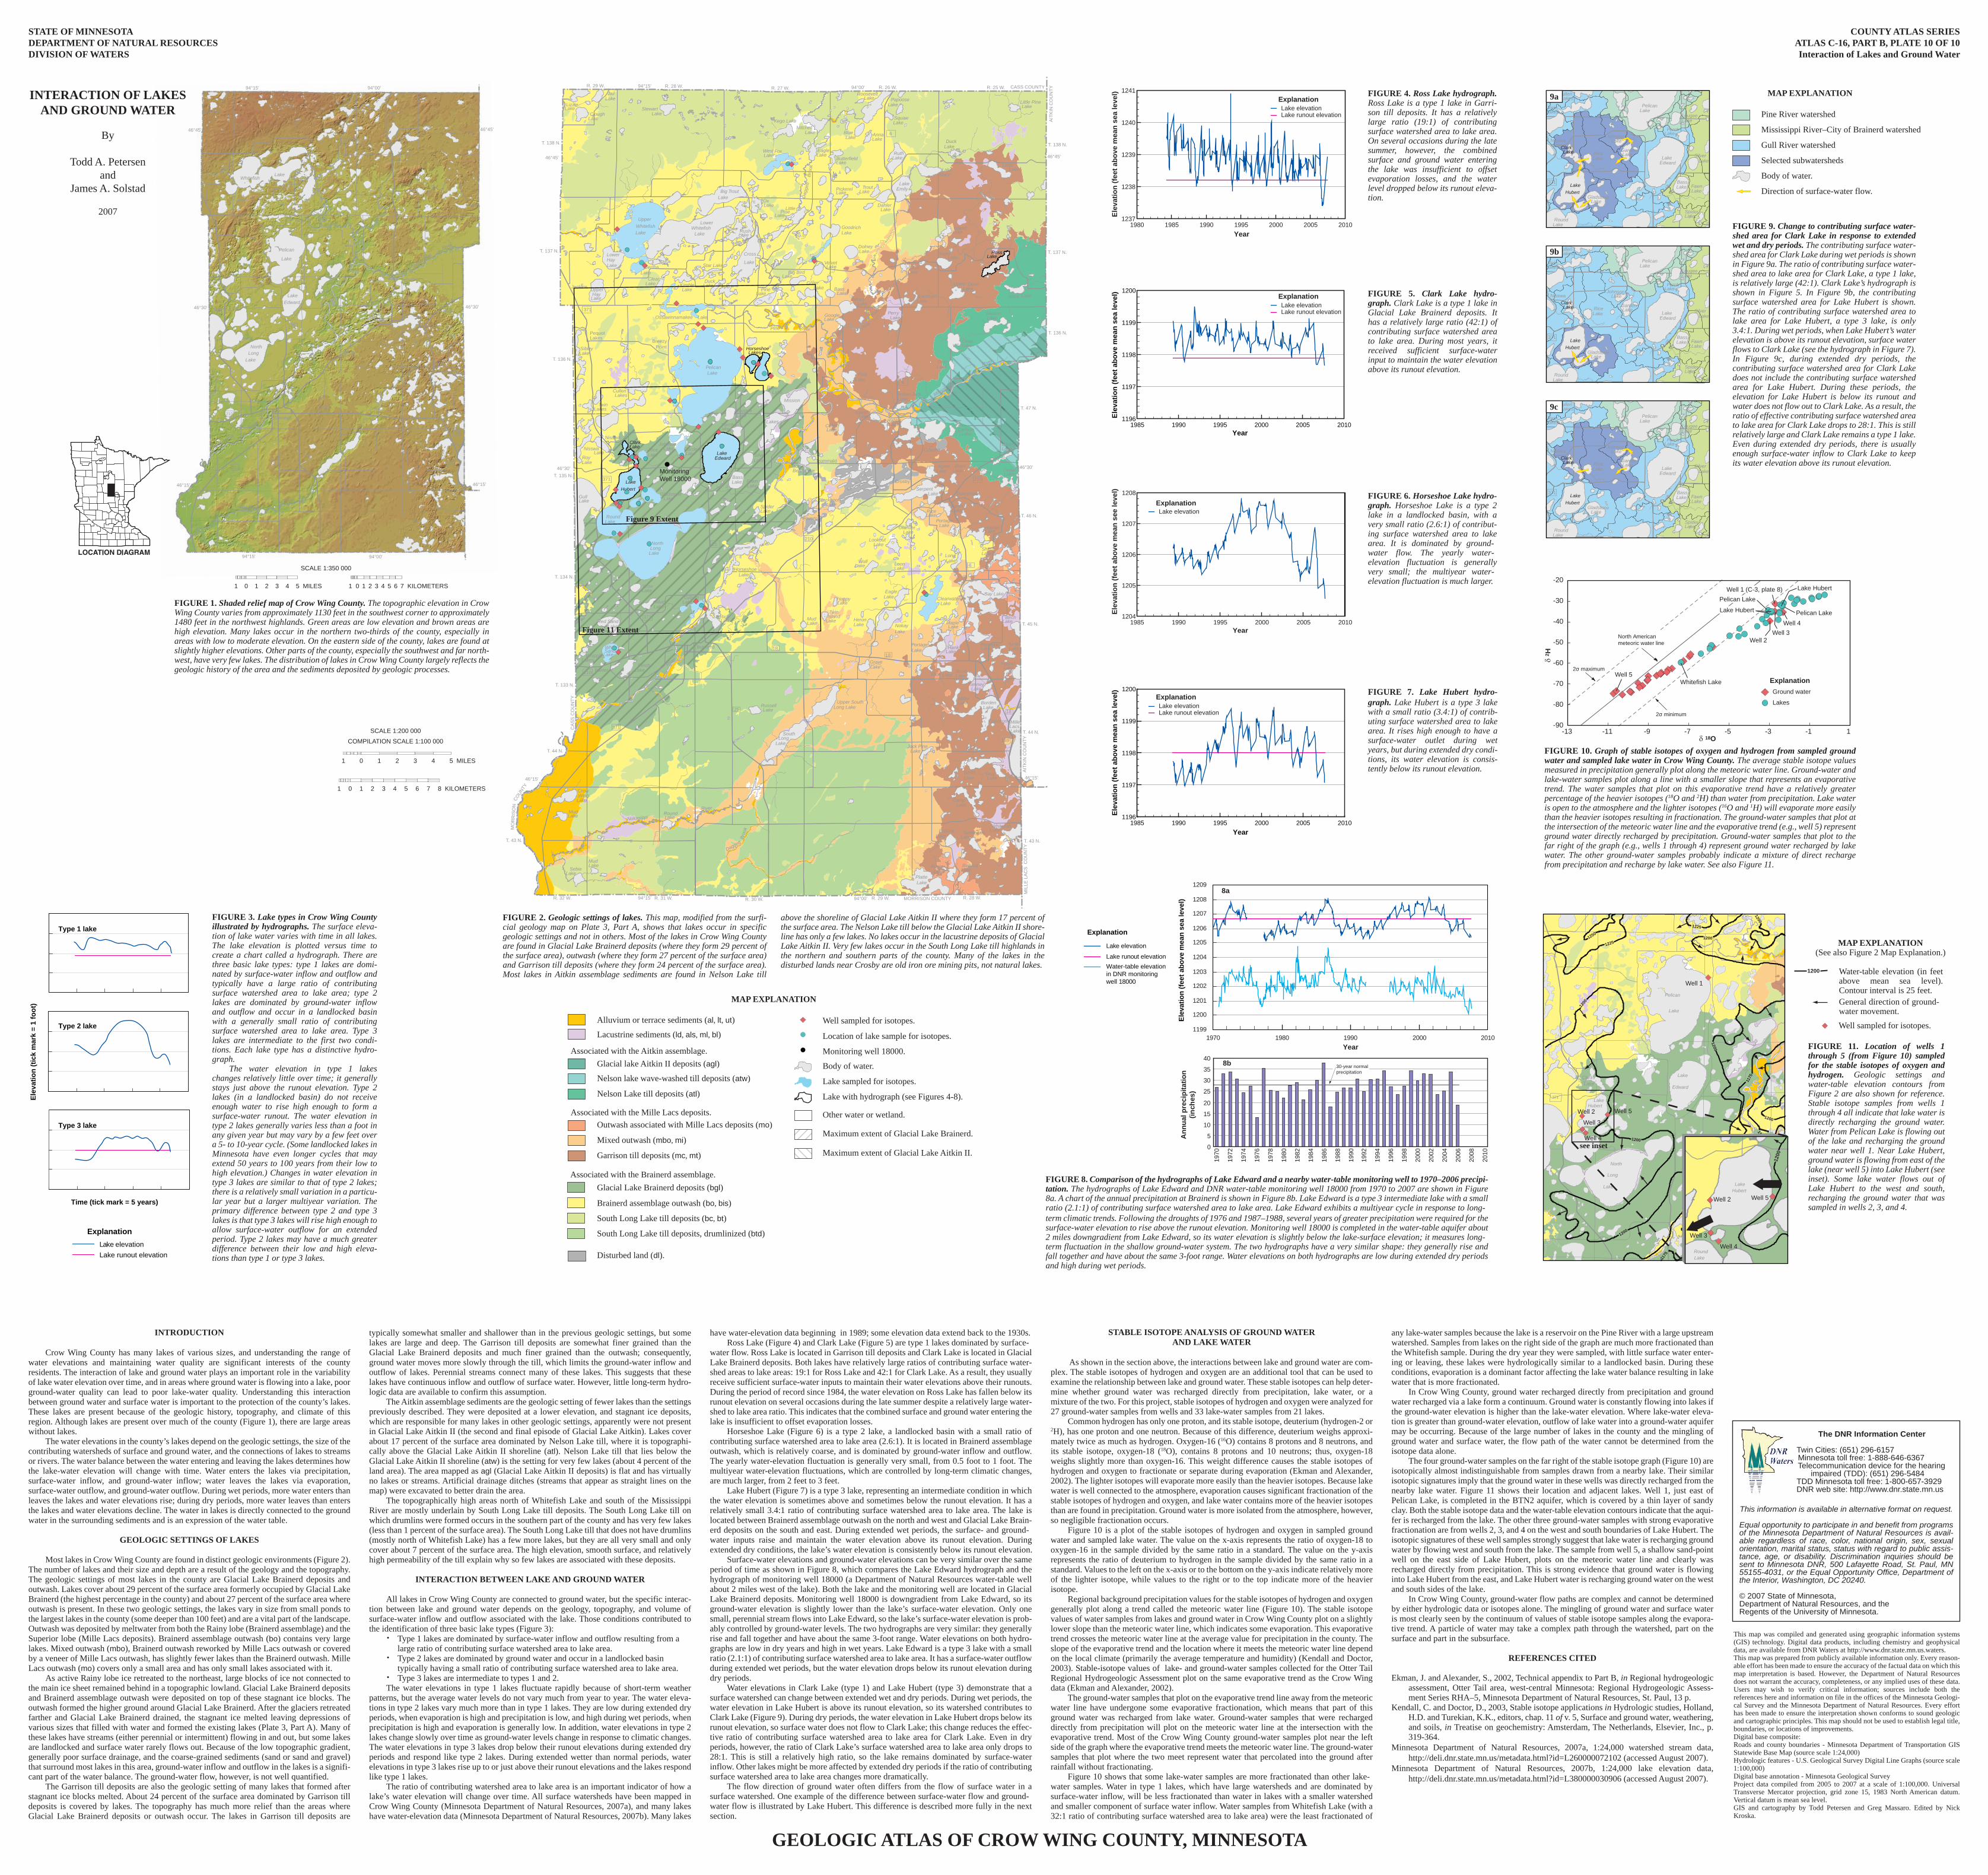
FIGURE 11. Location of wells 1 through 5 (from Figure 10) sampled for the stable isotopes of oxygen and hydrogen. Geologic settings and water-table elevation contours from Figure 2 are also shown for reference. Stable isotope samples from wells 1 through 4 all indicate that lake water is directly recharging the ground water. Water from Pelican Lake is flowing out of the lake and recharging the ground water near well 1. Near Lake Hubert, ground water is flowing from east of the lake (near well 5) into Lake Hubert (see inset). Some lake water flows out of Lake Hubert to the west and south, recharging the ground water that was sampled in wells 2, 3, and 4.
FIGURE 1. Shaded relief map of Crow Wing County. The topographic elevation in Crow Wing County varies from approximately 1130 feet in the southwest corner to approximately 1480 feet in the northwest highlands. Green areas are low elevation and brown areas are high elevation. Many lakes occur in the northern two-thirds of the county, especially in areas with low to moderate elevation. On the eastern side of the county, lakes are found at slightly higher elevations. Other parts of the county, especially the southwest and far north-west, have very few lakes. The distribution of lakes in Crow Wing County largely reflects the geologic history of the area and the sediments deposited by geologic processes.
Lake elevation Lake runout elevation
Time (tick mark = 5 years)
Elev
atio
n (ti
ck m
ark
= 1
foot
)
Explanation
Type 1 lake
Type 2 lake
Type 3 lake
FIGURE 3. Lake types in Crow Wing County illustrated by hydrographs. The surface eleva-tion of lake water varies with time in all lakes. The lake elevation is plotted versus time to create a chart called a hydrograph. There are three basic lake types: type 1 lakes are domi-nated by surface-water inflow and outflow and typically have a large ratio of contributing surface watershed area to lake area; type 2 lakes are dominated by ground-water inflow and outflow and occur in a landlocked basin with a generally small ratio of contributing surface watershed area to lake area. Type 3 lakes are intermediate to the first two condi-tions. Each lake type has a distinctive hydro-graph.
The water elevation in type 1 lakes changes relatively little over time; it generally stays just above the runout elevation. Type 2 lakes (in a landlocked basin) do not receive enough water to rise high enough to form a surface-water runout. The water elevation in type 2 lakes generally varies less than a foot in any given year but may vary by a few feet over a 5- to 10-year cycle. (Some landlocked lakes in Minnesota have even longer cycles that may extend 50 years to 100 years from their low to high elevation.) Changes in water elevation in type 3 lakes are similar to that of type 2 lakes; there is a relatively small variation in a particu-lar year but a larger multiyear variation. The primary difference between type 2 and type 3 lakes is that type 3 lakes will rise high enough to allow surface-water outflow for an extended period. Type 2 lakes may have a much greater difference between their low and high eleva-tions than type 1 or type 3 lakes.
FIGURE 10. Graph of stable isotopes of oxygen and hydrogen from sampled ground water and sampled lake water in Crow Wing County. The average stable isotope values measured in precipitation generally plot along the meteoric water line. Ground-water and lake-water samples plot along a line with a smaller slope that represents an evaporative trend. The water samples that plot on this evaporative trend have a relatively greater percentage of the heavier isotopes (18O and 2H) than water from precipitation. Lake water is open to the atmosphere and the lighter isotopes (16O and 1H) will evaporate more easily than the heavier isotopes resulting in fractionation. The ground-water samples that plot at the intersection of the meteoric water line and the evaporative trend (e.g., well 5) represent ground water directly recharged by precipitation. Ground-water samples that plot to the far right of the graph (e.g., wells 1 through 4) represent ground water recharged by lake water. The other ground-water samples probably indicate a mixture of direct recharge from precipitation and recharge by lake water. See also Figure 11.
FIGURE 2. Geologic settings of lakes. This map, modified from the surfi-cial geology map on Plate 3, Part A, shows that lakes occur in specific geologic settings and not in others. Most of the lakes in Crow Wing County are found in Glacial Lake Brainerd deposits (where they form 29 percent of the surface area), outwash (where they form 27 percent of the surface area) and Garrison till deposits (where they form 24 percent of the surface area). Most lakes in Aitkin assemblage sediments are found in Nelson Lake till
above the shoreline of Glacial Lake Aitkin II where they form 17 percent of the surface area. The Nelson Lake till below the Glacial Lake Aitkin II shore-line has only a few lakes. No lakes occur in the lacustrine deposits of Glacial Lake Aitkin II. Very few lakes occur in the South Long Lake till highlands in the northern and southern parts of the county. Many of the lakes in the disturbed lands near Crosby are old iron ore mining pits, not natural lakes.
Pine River watershed
Mississippi River–City of Brainerd watershed
Gull River watershed
Selected subwatersheds
Body of water.
9a
9b
9c
MAP EXPLANATION
FIGURE 9. Change to contributing surface water-shed area for Clark Lake in response to extended wet and dry periods. The contributing surface water-shed area for Clark Lake during wet periods is shown in Figure 9a. The ratio of contributing surface water-shed area to lake area for Clark Lake, a type 1 lake, is relatively large (42:1). Clark Lake’s hydrograph is shown in Figure 5. In Figure 9b, the contributing surface watershed area for Lake Hubert is shown. The ratio of contributing surface watershed area to lake area for Lake Hubert, a type 3 lake, is only 3.4:1. During wet periods, when Lake Hubert’s water elevation is above its runout elevation, surface water flows to Clark Lake (see the hydrograph in Figure 7). In Figure 9c, during extended dry periods, the contributing surface watershed area for Clark Lake does not include the contributing surface watershed area for Lake Hubert. During these periods, the elevation for Lake Hubert is below its runout and water does not flow out to Clark Lake. As a result, the ratio of effective contributing surface watershed area to lake area for Clark Lake drops to 28:1. This is still relatively large and Clark Lake remains a type 1 lake. Even during extended dry periods, there is usually enough surface-water inflow to Clark Lake to keep its water elevation above its runout elevation.
Direction of surface-water flow.
MAP EXPLANATION
Body of water.
Lake sampled for isotopes.
Lake with hydrograph (see Figures 4-8).
Well sampled for isotopes.
Location of lake sample for isotopes.
Monitoring well 18000.
Lacustrine sediments (ld, als, ml, bl)
Alluvium or terrace sediments (al, lt, ut)
Glacial lake Aitkin II deposits (agl)
Nelson lake wave-washed till deposits (atw)
Nelson Lake till deposits (atl)
Associated with the Aitkin assemblage.
Garrison till deposits (mc, mt)
Outwash associated with Mille Lacs deposits (mo)
Mixed outwash (mbo, mi)
Associated with the Mille Lacs deposits.
Disturbed land (dl).
Other water or wetland.
Glacial Lake Brainerd deposits (bgl)
South Long Lake till deposits, drumlinized (btd)
South Long Lake till deposits (bc, bt)
Brainerd assemblage outwash (bo, bis)
Associated with the Brainerd assemblage.
Maximum extent of Glacial Lake Aitkin II.
Maximum extent of Glacial Lake Brainerd.
FIGURE 8. Comparison of the hydrographs of Lake Edward and a nearby water-table monitoring well to 1970–2006 precipi-tation. The hydrographs of Lake Edward and DNR water-table monitoring well 18000 from 1970 to 2007 are shown in Figure 8a. A chart of the annual precipitation at Brainerd is shown in Figure 8b. Lake Edward is a type 3 intermediate lake with a small ratio (2.1:1) of contributing surface watershed area to lake area. Lake Edward exhibits a multiyear cycle in response to long-term climatic trends. Following the droughts of 1976 and 1987–1988, several years of greater precipitation were required for the surface-water elevation to rise above the runout elevation. Monitoring well 18000 is completed in the water-table aquifer about 2 miles downgradient from Lake Edward, so its water elevation is slightly below the lake-surface elevation; it measures long-term fluctuation in the shallow ground-water system. The two hydrographs have a very similar shape: they generally rise and fall together and have about the same 3-foot range. Water elevations on both hydrographs are low during extended dry periods and high during wet periods.
MAP EXPLANATION(See also Figure 2 Map Explanation.)
Well sampled for isotopes.
INTRODUCTION
Crow Wing County has many lakes of various sizes, and understanding the range of water elevations and maintaining water quality are significant interests of the county residents. The interaction of lake and ground water plays an important role in the variability of lake water elevation over time, and in areas where ground water is flowing into a lake, poor ground-water quality can lead to poor lake-water quality. Understanding this interaction between ground water and surface water is important to the protection of the county’s lakes. These lakes are present because of the geologic history, topography, and climate of this region. Although lakes are present over much of the county (Figure 1), there are large areas without lakes.
The water elevations in the county’s lakes depend on the geologic settings, the size of the contributing watersheds of surface and ground water, and the connections of lakes to streams or rivers. The water balance between the water entering and leaving the lakes determines how the lake-water elevation will change with time. Water enters the lakes via precipitation, surface-water inflow, and ground-water inflow; water leaves the lakes via evaporation, surface-water outflow, and ground-water outflow. During wet periods, more water enters than leaves the lakes and water elevations rise; during dry periods, more water leaves than enters the lakes and water elevations decline. The water in lakes is directly connected to the ground water in the surrounding sediments and is an expression of the water table.
GEOLOGIC SETTINGS OF LAKES
Most lakes in Crow Wing County are found in distinct geologic environments (Figure 2). The number of lakes and their size and depth are a result of the geology and the topography. The geologic settings of most lakes in the county are Glacial Lake Brainerd deposits and outwash. Lakes cover about 29 percent of the surface area formerly occupied by Glacial Lake Brainerd (the highest percentage in the county) and about 27 percent of the surface area where outwash is present. In these two geologic settings, the lakes vary in size from small ponds to the largest lakes in the county (some deeper than 100 feet) and are a vital part of the landscape. Outwash was deposited by meltwater from both the Rainy lobe (Brainerd assemblage) and the Superior lobe (Mille Lacs deposits). Brainerd assemblage outwash (bo) contains very large lakes. Mixed outwash (mbo), Brainerd outwash reworked by Mille Lacs outwash or covered by a veneer of Mille Lacs outwash, has slightly fewer lakes than the Brainerd outwash. Mille Lacs outwash (mo) covers only a small area and has only small lakes associated with it.
As active Rainy lobe ice retreated to the northeast, large blocks of ice not connected to the main ice sheet remained behind in a topographic lowland. Glacial Lake Brainerd deposits and Brainerd assemblage outwash were deposited on top of these stagnant ice blocks. The outwash formed the higher ground around Glacial Lake Brainerd. After the glaciers retreated farther and Glacial Lake Brainerd drained, the stagnant ice melted leaving depressions of various sizes that filled with water and formed the existing lakes (Plate 3, Part A). Many of these lakes have streams (either perennial or intermittent) flowing in and out, but some lakes are landlocked and surface water rarely flows out. Because of the low topographic gradient, generally poor surface drainage, and the coarse-grained sediments (sand or sand and gravel) that surround most lakes in this area, ground-water inflow and outflow in the lakes is a signifi-cant part of the water balance. The ground-water flow, however, is not well quantified.
The Garrison till deposits are also the geologic setting of many lakes that formed after stagnant ice blocks melted. About 24 percent of the surface area dominated by Garrison till deposits is covered by lakes. The topography has much more relief than the areas where Glacial Lake Brainerd deposits or outwash occur. The lakes in Garrison till deposits are
typically somewhat smaller and shallower than in the previous geologic settings, but some lakes are large and deep. The Garrison till deposits are somewhat finer grained than the Glacial Lake Brainerd deposits and much finer grained than the outwash; consequently, ground water moves more slowly through the till, which limits the ground-water inflow and outflow of lakes. Perennial streams connect many of these lakes. This suggests that these lakes have continuous inflow and outflow of surface water. However, little long-term hydro-logic data are available to confirm this assumption.
The Aitkin assemblage sediments are the geologic setting of fewer lakes than the settings previously described. They were deposited at a lower elevation, and stagnant ice deposits, which are responsible for many lakes in other geologic settings, apparently were not present in Glacial Lake Aitkin II (the second and final episode of Glacial Lake Aitkin). Lakes cover about 17 percent of the surface area dominated by Nelson Lake till, where it is topographi-cally above the Glacial Lake Aitkin II shoreline (atl). Nelson Lake till that lies below the Glacial Lake Aitkin II shoreline (atw) is the setting for very few lakes (about 4 percent of the land area). The area mapped as agl (Glacial Lake Aitkin II deposits) is flat and has virtually no lakes or streams. Artificial drainage ditches (streams that appear as straight lines on the map) were excavated to better drain the area.
The topographically high areas north of Whitefish Lake and south of the Mississippi River are mostly underlain by South Long Lake till deposits. The South Long Lake till on which drumlins were formed occurs in the southern part of the county and has very few lakes (less than 1 percent of the surface area). The South Long Lake till that does not have drumlins (mostly north of Whitefish Lake) has a few more lakes, but they are all very small and only cover about 7 percent of the surface area. The high elevation, smooth surface, and relatively high permeability of the till explain why so few lakes are associated with these deposits.
INTERACTION BETWEEN LAKE AND GROUND WATER
All lakes in Crow Wing County are connected to ground water, but the specific interac-tion between lake and ground water depends on the geology, topography, and volume of surface-water inflow and outflow associated with the lake. Those conditions contributed to the identification of three basic lake types (Figure 3):
· Type 1 lakes are dominated by surface-water inflow and outflow resulting from a large ratio of contributing surface watershed area to lake area.· Type 2 lakes are dominated by ground water and occur in a landlocked basin
typically having a small ratio of contributing surface watershed area to lake area.· Type 3 lakes are intermediate to types 1 and 2.The water elevations in type 1 lakes fluctuate rapidly because of short-term weather
patterns, but the average water levels do not vary much from year to year. The water eleva-tions in type 2 lakes vary much more than in type 1 lakes. They are low during extended dry periods, when evaporation is high and precipitation is low, and high during wet periods, when precipitation is high and evaporation is generally low. In addition, water elevations in type 2 lakes change slowly over time as ground-water levels change in response to climatic changes. The water elevations in type 3 lakes drop below their runout elevations during extended dry periods and respond like type 2 lakes. During extended wetter than normal periods, water elevations in type 3 lakes rise up to or just above their runout elevations and the lakes respond like type 1 lakes.
The ratio of contributing watershed area to lake area is an important indicator of how a lake’s water elevation will change over time. All surface watersheds have been mapped in Crow Wing County (Minnesota Department of Natural Resources, 2007a), and many lakes have water-elevation data (Minnesota Department of Natural Resources, 2007b). Many lakes
have water-elevation data beginning in 1989; some elevation data extend back to the 1930s. Ross Lake (Figure 4) and Clark Lake (Figure 5) are type 1 lakes dominated by surface-
water flow. Ross Lake is located in Garrison till deposits and Clark Lake is located in Glacial Lake Brainerd deposits. Both lakes have relatively large ratios of contributing surface water-shed areas to lake areas: 19:1 for Ross Lake and 42:1 for Clark Lake. As a result, they usually receive sufficient surface-water inputs to maintain their water elevations above their runouts. During the period of record since 1984, the water elevation on Ross Lake has fallen below its runout elevation on several occasions during the late summer despite a relatively large water-shed to lake area ratio. This indicates that the combined surface and ground water entering the lake is insufficient to offset evaporation losses.
Horseshoe Lake (Figure 6) is a type 2 lake, a landlocked basin with a small ratio of contributing surface watershed area to lake area (2.6:1). It is located in Brainerd assemblage outwash, which is relatively coarse, and is dominated by ground-water inflow and outflow. The yearly water-elevation fluctuation is generally very small, from 0.5 foot to 1 foot. The multiyear water-elevation fluctuations, which are controlled by long-term climatic changes, are much larger, from 2 feet to 3 feet.
Lake Hubert (Figure 7) is a type 3 lake, representing an intermediate condition in which the water elevation is sometimes above and sometimes below the runout elevation. It has a relatively small 3.4:1 ratio of contributing surface watershed area to lake area. The lake is located between Brainerd assemblage outwash on the north and west and Glacial Lake Brain-erd deposits on the south and east. During extended wet periods, the surface- and ground-water inputs raise and maintain the water elevation above its runout elevation. During extended dry conditions, the lake’s water elevation is consistently below its runout elevation.
Surface-water elevations and ground-water elevations can be very similar over the same period of time as shown in Figure 8, which compares the Lake Edward hydrograph and the hydrograph of monitoring well 18000 (a Department of Natural Resources water-table well about 2 miles west of the lake). Both the lake and the monitoring well are located in Glacial Lake Brainerd deposits. Monitoring well 18000 is downgradient from Lake Edward, so its ground-water elevation is slightly lower than the lake’s surface-water elevation. Only one small, perennial stream flows into Lake Edward, so the lake’s surface-water elevation is prob-ably controlled by ground-water levels. The two hydrographs are very similar: they generally rise and fall together and have about the same 3-foot range. Water elevations on both hydro-graphs are low in dry years and high in wet years. Lake Edward is a type 3 lake with a small ratio (2.1:1) of contributing surface watershed area to lake area. It has a surface-water outflow during extended wet periods, but the water elevation drops below its runout elevation during dry periods.
Water elevations in Clark Lake (type 1) and Lake Hubert (type 3) demonstrate that a surface watershed can change between extended wet and dry periods. During wet periods, the water elevation in Lake Hubert is above its runout elevation, so its watershed contributes to Clark Lake (Figure 9). During dry periods, the water elevation in Lake Hubert drops below its runout elevation, so surface water does not flow to Clark Lake; this change reduces the effec-tive ratio of contributing surface watershed area to lake area for Clark Lake. Even in dry periods, however, the ratio of Clark Lake’s surface watershed area to lake area only drops to 28:1. This is still a relatively high ratio, so the lake remains dominated by surface-water inflow. Other lakes might be more affected by extended dry periods if the ratio of contributing surface watershed area to lake area changes more dramatically.
The flow direction of ground water often differs from the flow of surface water in a surface watershed. One example of the difference between surface-water flow and ground-water flow is illustrated by Lake Hubert. This difference is described more fully in the next section.
STABLE ISOTOPE ANALYSIS OF GROUND WATERAND LAKE WATER
As shown in the section above, the interactions between lake and ground water are com-plex. The stable isotopes of hydrogen and oxygen are an additional tool that can be used to examine the relationship between lake and ground water. These stable isotopes can help deter-mine whether ground water was recharged directly from precipitation, lake water, or a mixture of the two. For this project, stable isotopes of hydrogen and oxygen were analyzed for 27 ground-water samples from wells and 33 lake-water samples from 21 lakes.
Common hydrogen has only one proton, and its stable isotope, deuterium (hydrogen-2 or
2H), has one proton and one neutron. Because of this difference, deuterium weighs approxi-mately twice as much as hydrogen. Oxygen-16 (16O) contains 8 protons and 8 neutrons, and its stable isotope, oxygen-18 (18O), contains 8 protons and 10 neutrons; thus, oxygen-18 weighs slightly more than oxygen-16. This weight difference causes the stable isotopes of hydrogen and oxygen to fractionate or separate during evaporation (Ekman and Alexander, 2002). The lighter isotopes will evaporate more easily than the heavier isotopes. Because lake water is well connected to the atmosphere, evaporation causes significant fractionation of the stable isotopes of hydrogen and oxygen, and lake water contains more of the heavier isotopes than are found in precipitation. Ground water is more isolated from the atmosphere, however, so negligible fractionation occurs.
Figure 10 is a plot of the stable isotopes of hydrogen and oxygen in sampled ground water and sampled lake water. The value on the x-axis represents the ratio of oxygen-18 to oxygen-16 in the sample divided by the same ratio in a standard. The value on the y-axis represents the ratio of deuterium to hydrogen in the sample divided by the same ratio in a standard. Values to the left on the x-axis or to the bottom on the y-axis indicate relatively more of the lighter isotope, while values to the right or to the top indicate more of the heavier isotope.
Regional background precipitation values for the stable isotopes of hydrogen and oxygen generally plot along a trend called the meteoric water line (Figure 10). The stable isotope values of water samples from lakes and ground water in Crow Wing County plot on a slightly lower slope than the meteoric water line, which indicates some evaporation. This evaporative trend crosses the meteoric water line at the average value for precipitation in the county. The slope of the evaporative trend and the location where it meets the meteoric water line depend on the local climate (primarily the average temperature and humidity) (Kendall and Doctor, 2003). Stable-isotope values of lake- and ground-water samples collected for the Otter Tail Regional Hydrogeologic Assessment plot on the same evaporative trend as the Crow Wing data (Ekman and Alexander, 2002).
The ground-water samples that plot on the evaporative trend line away from the meteoric water line have undergone some evaporative fractionation, which means that part of this ground water was recharged from lake water. Ground-water samples that were recharged directly from precipitation will plot on the meteoric water line at the intersection with the evaporative trend. Most of the Crow Wing County ground-water samples plot near the left side of the graph where the evaporative trend meets the meteoric water line. The ground-water samples that plot where the two meet represent water that percolated into the ground after rainfall without fractionating.
Figure 10 shows that some lake-water samples are more fractionated than other lake-water samples. Water in type 1 lakes, which have large watersheds and are dominated by surface-water inflow, will be less fractionated than water in lakes with a smaller watershed and smaller component of surface water inflow. Water samples from Whitefish Lake (with a 32:1 ratio of contributing surface watershed area to lake area) were the least fractionated of
any lake-water samples because the lake is a reservoir on the Pine River with a large upstream watershed. Samples from lakes on the right side of the graph are much more fractionated than the Whitefish sample. During the dry year they were sampled, with little surface water enter-ing or leaving, these lakes were hydrologically similar to a landlocked basin. During these conditions, evaporation is a dominant factor affecting the lake water balance resulting in lake water that is more fractionated.
In Crow Wing County, ground water recharged directly from precipitation and ground water recharged via a lake form a continuum. Ground water is constantly flowing into lakes if the ground-water elevation is higher than the lake-water elevation. Where lake-water eleva-tion is greater than ground-water elevation, outflow of lake water into a ground-water aquifer may be occurring. Because of the large number of lakes in the county and the mingling of ground water and surface water, the flow path of the water cannot be determined from the isotope data alone.
The four ground-water samples on the far right of the stable isotope graph (Figure 10) are isotopically almost indistinguishable from samples drawn from a nearby lake. Their similar isotopic signatures imply that the ground water in these wells was directly recharged from the nearby lake water. Figure 11 shows their location and adjacent lakes. Well 1, just east of Pelican Lake, is completed in the BTN2 aquifer, which is covered by a thin layer of sandy clay. Both the stable isotope data and the water-table elevation contours indicate that the aqui-fer is recharged from the lake. The other three ground-water samples with strong evaporative fractionation are from wells 2, 3, and 4 on the west and south boundaries of Lake Hubert. The isotopic signatures of these well samples strongly suggest that lake water is recharging ground water by flowing west and south from the lake. The sample from well 5, a shallow sand-point well on the east side of Lake Hubert, plots on the meteoric water line and clearly was recharged directly from precipitation. This is strong evidence that ground water is flowing into Lake Hubert from the east, and Lake Hubert water is recharging ground water on the west and south sides of the lake.
In Crow Wing County, ground-water flow paths are complex and cannot be determined by either hydrologic data or isotopes alone. The mingling of ground water and surface water is most clearly seen by the continuum of values of stable isotope samples along the evapora-tive trend. A particle of water may take a complex path through the watershed, part on the surface and part in the subsurface.
REFERENCES CITED
Ekman, J. and Alexander, S., 2002, Technical appendix to Part B, in Regional hydrogeologic assessment, Otter Tail area, west-central Minnesota: Regional Hydrogeologic Assess-ment Series RHA–5, Minnesota Department of Natural Resources, St. Paul, 13 p.
Kendall, C. and Doctor, D., 2003, Stable isotope applications in Hydrologic studies, Holland, H.D. and Turekian, K.K., editors, chap. 11 of v. 5, Surface and ground water, weathering, and soils, in Treatise on geochemistry: Amsterdam, The Netherlands, Elsevier, Inc., p. 319-364.
Minnesota Department of Natural Resources, 2007a, 1:24,000 watershed stream data, http://deli.dnr.state.mn.us/metadata.html?id=L260000072102 (accessed August 2007).
Minnesota Department of Natural Resources, 2007b, 1:24,000 lake elevation data, http://deli.dnr.state.mn.us/metadata.html?id=L380000030906 (accessed August 2007).