Embed Size (px)
Citation preview
GeoLab and MiniLabWorksheets
Cop
yrig
ht ©
Gle
ncoe
/McG
raw
-Hill
, a d
ivis
ion
of t
he M
cGra
w-H
ill C
ompa
nies
, Inc
.Glencoe/McGraw-Hill
Copyright © by The McGraw-Hill Companies, Inc. All rights reserved. Permission is granted to reproduce the material containedherein on the condition that such material be reproduced only for classroom use; be provided to students, teachers, and familieswithout charge; and be used solely in conjunction with the Earth Science: Geology, the Environment, and the Universe program.Any other reproduction, for use or sale, is prohibited without prior written permission of the publisher.
Send all inquiries to:Glencoe/McGraw-Hill8787 Orion PlaceColumbus, OH 43240
ISBN 0-07-824578-8Printed in the United States of America.1 2 3 4 5 6 7 8 9 10 045 08 07 06 05 04 03 02 01
Earth Science: Geology, the Environment, and the Universe
Laboratory Manual, SE and TE
GeoLab and MiniLab Worksheets
Exploring Environmental Problems, SE and TE
Study Guide for Content Mastery, SE and TE
Chapter Assessment
Performance Assessment in Earth Science
ExamView™ Pro CD-ROM Windows/Macintosh
Cooperative Learning in the Science Classroom
Performance Assessment in the Science Classroom
Alternate Assessment in the Science Classroom
Glencoe Science Web Site: science.glencoe.com
Lesson Plans
Block Scheduling Lesson Plans
Section Focus Transparencies and Masters
Teaching Transparencies and Masters
MindJogger Videoquizzes, VHS/DVD
Puzzlemaker Software, Windows/Macintosh
Guided Reading Audio Program
Interactive Teacher Edition CD-ROM
Interactive Lesson Planner CD-ROM
Using the Internet in the Science Classroom
Credits
ART CREDITSMorgan-Cain and Associates: 13, 36, 62, 69, 70, 76, (b)77, (b)81, 85, 89, 111, 115, 122; Precision Graphics: 31, 34, 50, 53, 75, (t)77, 78, 90, 109
PHOTO CREDITS8 United States Geological Survey; 13 (l to r)Charles D. Winters/Photo Researchers, Mark A. Schneider/Visuals Unlimited, Mark A. Schneider/Visuals Unlimited,Biophoto Associates/Photo Researchers, Runk/Schoenberger/Grant Heilman, Doug Martin; 23 John Cancalosi/Peter Arnold, Inc.; 42 United States GeologicalSurvey; 81 (t)United States Geological Survey; 96 (l)Ken Lucas Photo/Visuals Unlimited, (r)Stephen J. Krasemann/DRK Photo; 113 NASA; 129 Jean-CharlesCuillandre/Canada-France-Hawaii Telescope/Science Photo Library/Photo Researchers
GeoLab and MiniLab Worksheets Earth Science: Geology, the Environment, and the Universe iii
Cop
yrig
ht ©
Gle
ncoe
/McG
raw
-Hill
, a d
ivis
ion
of t
he M
cGra
w-H
ill C
ompa
nies
, Inc
.
GEOLAB AND MINILAB WORKSHEETS
Contents
To the Teacher . . . . . . . . . . . . . . . . . . . . . . . . . . . . . iii
Materials List . . . . . . . . . . . . . . . . . . . . . . . . . . . . . . iv
Chapter 1 . . . . . . . . . . . . . . . . . . . . . . . . . . . . . . . . . 1
Chapter 2 . . . . . . . . . . . . . . . . . . . . . . . . . . . . . . . . . 5
Chapter 3 . . . . . . . . . . . . . . . . . . . . . . . . . . . . . . . . . 9
Chapter 4 . . . . . . . . . . . . . . . . . . . . . . . . . . . . . . . . 13
Chapter 5 . . . . . . . . . . . . . . . . . . . . . . . . . . . . . . . . 19
Chapter 6 . . . . . . . . . . . . . . . . . . . . . . . . . . . . . . . . 23
Chapter 7 . . . . . . . . . . . . . . . . . . . . . . . . . . . . . . . . 27
Chapter 8 . . . . . . . . . . . . . . . . . . . . . . . . . . . . . . . . 31
Chapter 9 . . . . . . . . . . . . . . . . . . . . . . . . . . . . . . . . 35
Chapter 10 . . . . . . . . . . . . . . . . . . . . . . . . . . . . . . . 39
Chapter 11 . . . . . . . . . . . . . . . . . . . . . . . . . . . . . . . 43
Chapter 12 . . . . . . . . . . . . . . . . . . . . . . . . . . . . . . . 47
Chapter 13 . . . . . . . . . . . . . . . . . . . . . . . . . . . . . . . 51
Chapter 14 . . . . . . . . . . . . . . . . . . . . . . . . . . . . . . . 55
Chapter 15 . . . . . . . . . . . . . . . . . . . . . . . . . . . . . . . 59
Chapter 16 . . . . . . . . . . . . . . . . . . . . . . . . . . . . . . . 63
Chapter 17 . . . . . . . . . . . . . . . . . . . . . . . . . . . . . . . 67
Chapter 18 . . . . . . . . . . . . . . . . . . . . . . . . . . . . . . . 71
Chapter 19 . . . . . . . . . . . . . . . . . . . . . . . . . . . . . . . 75
Chapter 20 . . . . . . . . . . . . . . . . . . . . . . . . . . . . . . . 79
Chapter 21 . . . . . . . . . . . . . . . . . . . . . . . . . . . . . . . 83
Chapter 22 . . . . . . . . . . . . . . . . . . . . . . . . . . . . . . . 87
Chapter 23 . . . . . . . . . . . . . . . . . . . . . . . . . . . . . . . 91
Chapter 24 . . . . . . . . . . . . . . . . . . . . . . . . . . . . . . . 95
Chapter 25 . . . . . . . . . . . . . . . . . . . . . . . . . . . . . . . 99
Chapter 26 . . . . . . . . . . . . . . . . . . . . . . . . . . . . . . 103
Chapter 27 . . . . . . . . . . . . . . . . . . . . . . . . . . . . . . 107
Chapter 28 . . . . . . . . . . . . . . . . . . . . . . . . . . . . . . 111
Chapter 29 . . . . . . . . . . . . . . . . . . . . . . . . . . . . . . 115
Chapter 30 . . . . . . . . . . . . . . . . . . . . . . . . . . . . . . 121
Chapter 31 . . . . . . . . . . . . . . . . . . . . . . . . . . . . . . 127
Answer Pages . . . . . . . . . . . . . . . . . . . . . . . . . . . T131
To the Teacher
Each activity in this booklet is an expanded version of each GeoLab or MiniLab thatappears in the Student Edition of Earth Science: Geology, the Environment, and theUniverse. All materials lists, procedures, and questions are repeated so that students canread and complete a lab in most cases without having a textbook on the lab table. Datatables are enlarged so that students can record data in them. All lab questions arereprinted with lines on which students can write their answers. In addition, for studentsafety, all appropriate safety symbols and caution statements have been reproduced onthese expanded pages. Answer pages for each MiniLab and GeoLab are included at theend of this booklet.
iv Earth Science: Geology, the Environment, and the Universe GeoLab and MiniLab Worksheets
Cop
yrig
ht ©
Gle
ncoe
/McG
raw
-Hill
, a d
ivis
ion
of t
he M
cGra
w-H
ill C
ompa
nies
, Inc
.
GEOLAB AND MINILAB WORKSHEETS
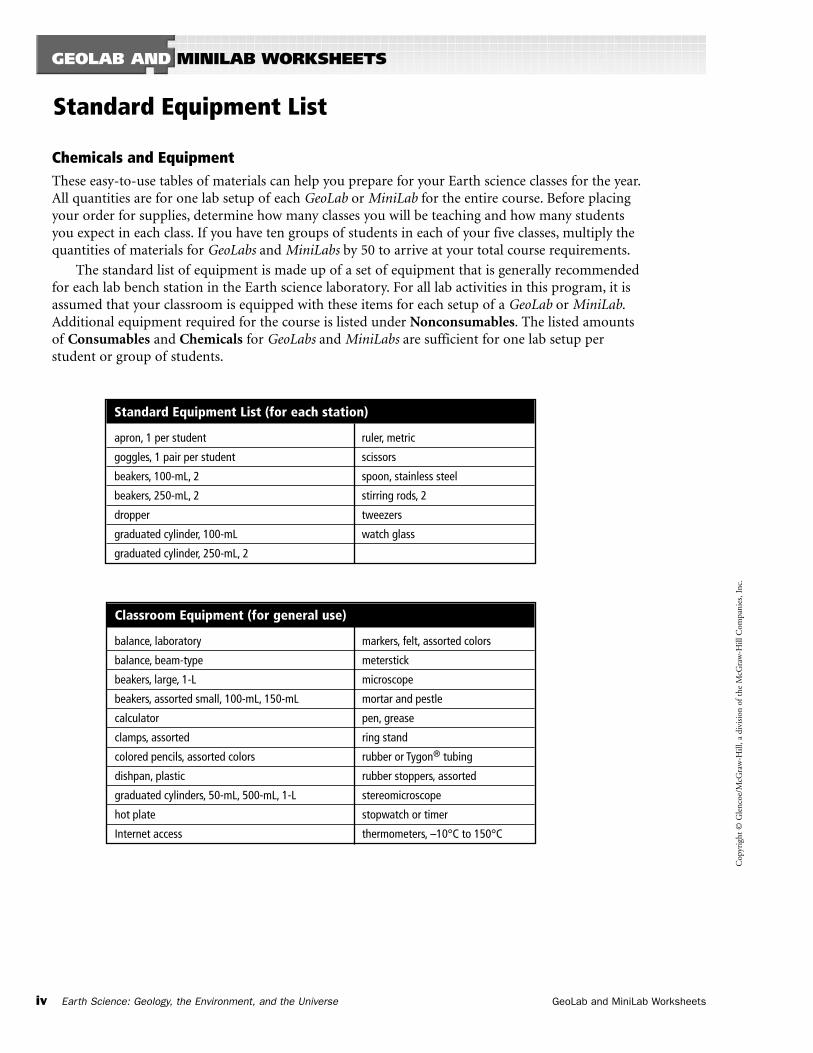
Standard Equipment List
Chemicals and EquipmentThese easy-to-use tables of materials can help you prepare for your Earth science classes for the year.All quantities are for one lab setup of each GeoLab or MiniLab for the entire course. Before placingyour order for supplies, determine how many classes you will be teaching and how many studentsyou expect in each class. If you have ten groups of students in each of your five classes, multiply thequantities of materials for GeoLabs and MiniLabs by 50 to arrive at your total course requirements.
The standard list of equipment is made up of a set of equipment that is generally recommendedfor each lab bench station in the Earth science laboratory. For all lab activities in this program, it isassumed that your classroom is equipped with these items for each setup of a GeoLab or MiniLab.Additional equipment required for the course is listed under Nonconsumables. The listed amountsof Consumables and Chemicals for GeoLabs and MiniLabs are sufficient for one lab setup per student or group of students.
Standard Equipment List (for each station)
apron, 1 per student ruler, metric
goggles, 1 pair per student scissors
beakers, 100-mL, 2 spoon, stainless steel
beakers, 250-mL, 2 stirring rods, 2
dropper tweezers
graduated cylinder, 100-mL watch glass
graduated cylinder, 250-mL, 2
Classroom Equipment (for general use)
balance, laboratory markers, felt, assorted colors
balance, beam-type meterstick
beakers, large, 1-L microscope
beakers, assorted small, 100-mL, 150-mL mortar and pestle
calculator pen, grease
clamps, assorted ring stand
colored pencils, assorted colors rubber or Tygon® tubing
dishpan, plastic rubber stoppers, assorted
graduated cylinders, 50-mL, 500-mL, 1-L stereomicroscope
hot plate stopwatch or timer
Internet access thermometers, –10°C to 150°C
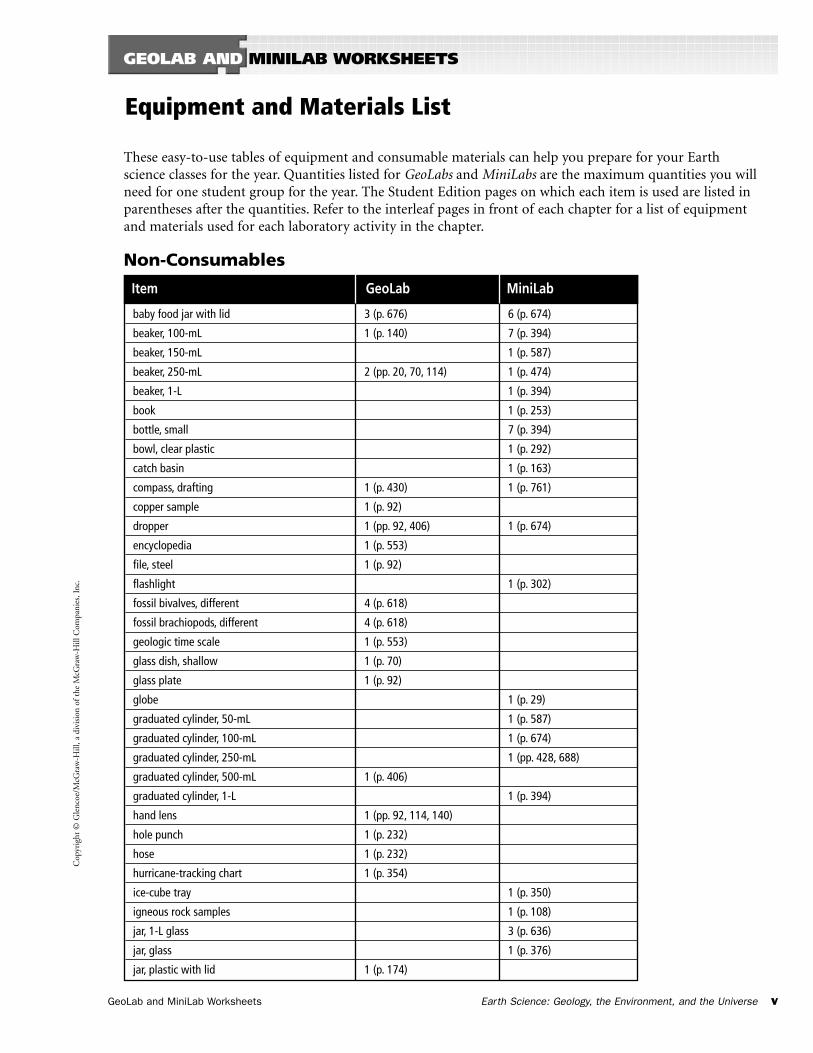
baby food jar with lid 3 (p. 676) 6 (p. 674)
beaker, 100-mL 1 (p. 140) 7 (p. 394)
beaker, 150-mL 1 (p. 587)
beaker, 250-mL 2 (pp. 20, 70, 114) 1 (p. 474)
beaker, 1-L 1 (p. 394)
book 1 (p. 253)
bottle, small 7 (p. 394)
bowl, clear plastic 1 (p. 292)
catch basin 1 (p. 163)
compass, drafting 1 (p. 430) 1 (p. 761)
copper sample 1 (p. 92)
dropper 1 (pp. 92, 406) 1 (p. 674)
encyclopedia 1 (p. 553)
file, steel 1 (p. 92)
flashlight 1 (p. 302)
fossil bivalves, different 4 (p. 618)
fossil brachiopods, different 4 (p. 618)
geologic time scale 1 (p. 553)
glass dish, shallow 1 (p. 70)
glass plate 1 (p. 92)
globe 1 (p. 29)
graduated cylinder, 50-mL 1 (p. 587)
graduated cylinder, 100-mL 1 (p. 674)
graduated cylinder, 250-mL 1 (pp. 428, 688)
graduated cylinder, 500-mL 1 (p. 406)
graduated cylinder, 1-L 1 (p. 394)
hand lens 1 (pp. 92, 114, 140)
hole punch 1 (p. 232)
hose 1 (p. 232)
hurricane-tracking chart 1 (p. 354)
ice-cube tray 1 (p. 350)
igneous rock samples 1 (p. 108)
jar, 1-L glass 3 (p. 636)
jar, glass 1 (p. 376)
jar, plastic with lid 1 (p. 174)
GeoLab and MiniLab Worksheets Earth Science: Geology, the Environment, and the Universe v
Cop
yrig
ht ©
Gle
ncoe
/McG
raw
-Hill
, a d
ivis
ion
of t
he M
cGra
w-H
ill C
ompa
nies
, Inc
.
GEOLAB AND MINILAB WORKSHEETS
Equipment and Materials List
Item GeoLab MiniLab
These easy-to-use tables of equipment and consumable materials can help you prepare for your Earth science classes for the year. Quantities listed for GeoLabs and MiniLabs are the maximum quantities you willneed for one student group for the year. The Student Edition pages on which each item is used are listed inparentheses after the quantities. Refer to the interleaf pages in front of each chapter for a list of equipmentand materials used for each laboratory activity in the chapter.
Non-Consumables
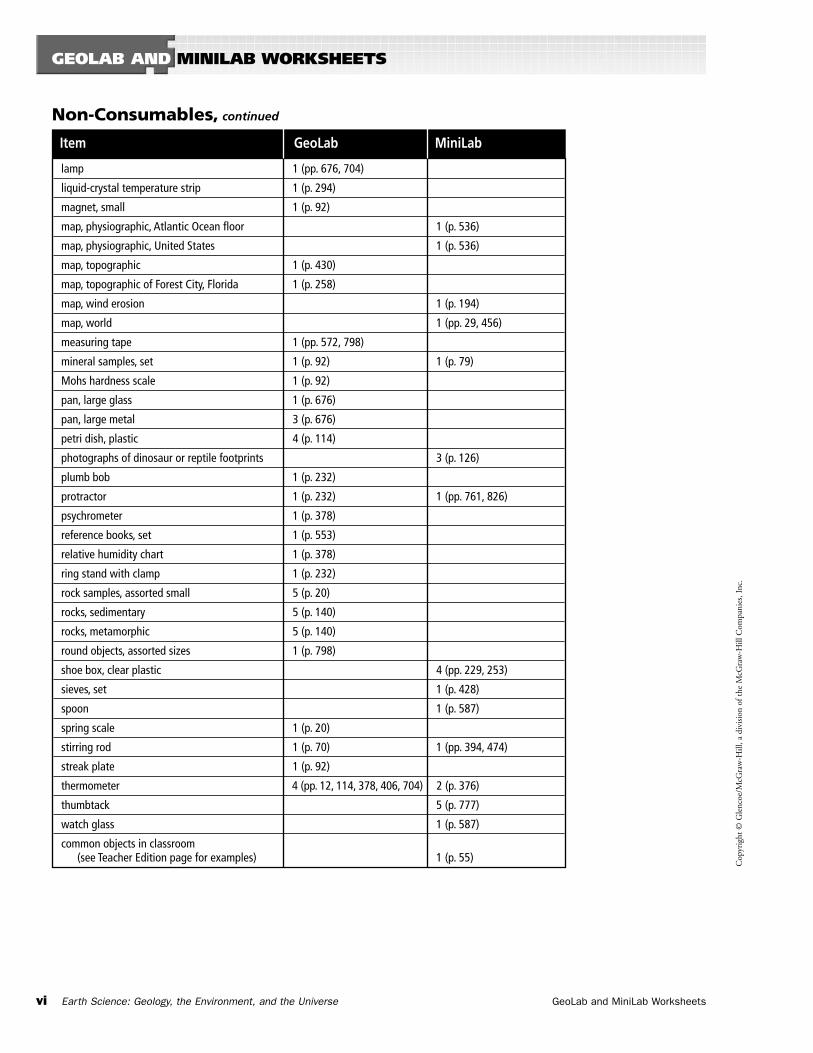
lamp 1 (pp. 676, 704)
liquid-crystal temperature strip 1 (p. 294)
magnet, small 1 (p. 92)
map, physiographic, Atlantic Ocean floor 1 (p. 536)
map, physiographic, United States 1 (p. 536)
map, topographic 1 (p. 430)
map, topographic of Forest City, Florida 1 (p. 258)
map, wind erosion 1 (p. 194)
map, world 1 (pp. 29, 456)
measuring tape 1 (pp. 572, 798)
mineral samples, set 1 (p. 92) 1 (p. 79)
Mohs hardness scale 1 (p. 92)
pan, large glass 1 (p. 676)
pan, large metal 3 (p. 676)
petri dish, plastic 4 (p. 114)
photographs of dinosaur or reptile footprints 3 (p. 126)
plumb bob 1 (p. 232)
protractor 1 (p. 232) 1 (pp. 761, 826)
psychrometer 1 (p. 378)
reference books, set 1 (p. 553)
relative humidity chart 1 (p. 378)
ring stand with clamp 1 (p. 232)
rock samples, assorted small 5 (p. 20)
rocks, sedimentary 5 (p. 140)
rocks, metamorphic 5 (p. 140)
round objects, assorted sizes 1 (p. 798)
shoe box, clear plastic 4 (pp. 229, 253)
sieves, set 1 (p. 428)
spoon 1 (p. 587)
spring scale 1 (p. 20)
stirring rod 1 (p. 70) 1 (pp. 394, 474)
streak plate 1 (p. 92)
thermometer 4 (pp. 12, 114, 378, 406, 704) 2 (p. 376)
thumbtack 5 (p. 777)
watch glass 1 (p. 587)
common objects in classroom (see Teacher Edition page for examples) 1 (p. 55)
vi Earth Science: Geology, the Environment, and the Universe GeoLab and MiniLab Worksheets
Cop
yrig
ht ©
Gle
ncoe
/McG
raw
-Hill
, a d
ivis
ion
of t
he M
cGra
w-H
ill C
ompa
nies
, Inc
.
GEOLAB AND MINILAB WORKSHEETS
Item GeoLab MiniLab
Non-Consumables, continued
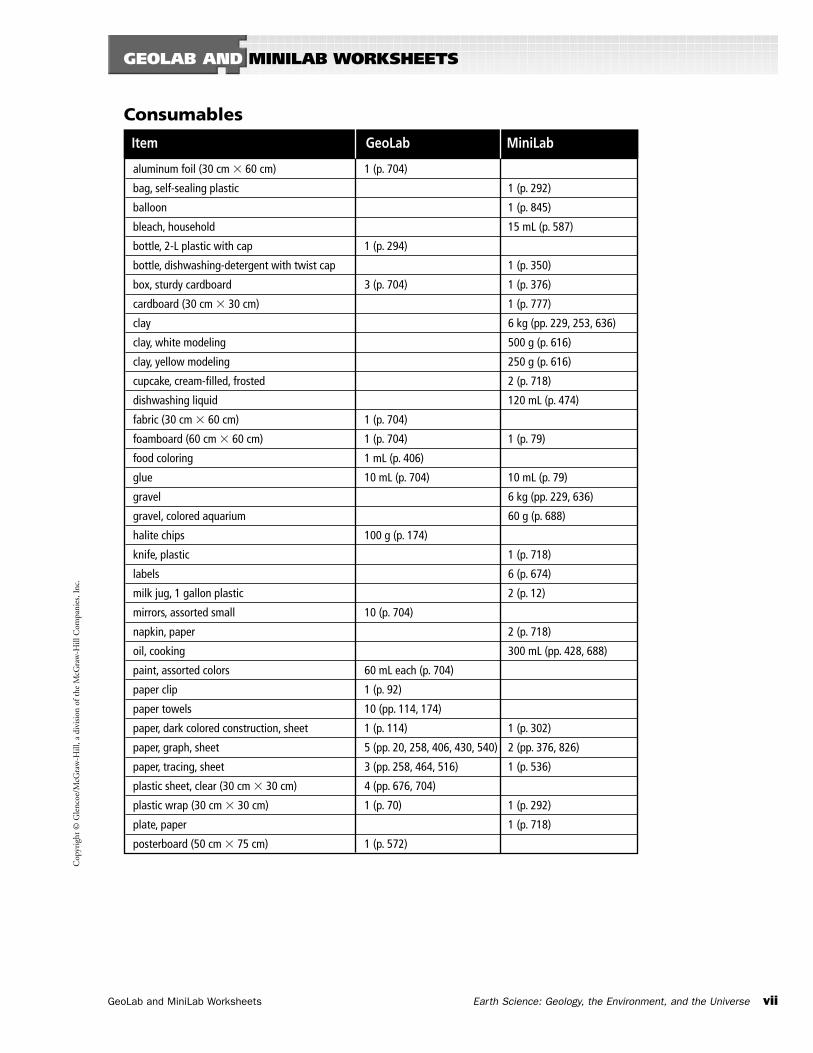
aluminum foil (30 cm � 60 cm) 1 (p. 704)
bag, self-sealing plastic 1 (p. 292)
balloon 1 (p. 845)
bleach, household 15 mL (p. 587)
bottle, 2-L plastic with cap 1 (p. 294)
bottle, dishwashing-detergent with twist cap 1 (p. 350)
box, sturdy cardboard 3 (p. 704) 1 (p. 376)
cardboard (30 cm � 30 cm) 1 (p. 777)
clay 6 kg (pp. 229, 253, 636)
clay, white modeling 500 g (p. 616)
clay, yellow modeling 250 g (p. 616)
cupcake, cream-filled, frosted 2 (p. 718)
dishwashing liquid 120 mL (p. 474)
fabric (30 cm � 60 cm) 1 (p. 704)
foamboard (60 cm � 60 cm) 1 (p. 704) 1 (p. 79)
food coloring 1 mL (p. 406)
glue 10 mL (p. 704) 10 mL (p. 79)
gravel 6 kg (pp. 229, 636)
gravel, colored aquarium 60 g (p. 688)
halite chips 100 g (p. 174)
knife, plastic 1 (p. 718)
labels 6 (p. 674)
milk jug, 1 gallon plastic 2 (p. 12)
mirrors, assorted small 10 (p. 704)
napkin, paper 2 (p. 718)
oil, cooking 300 mL (pp. 428, 688)
paint, assorted colors 60 mL each (p. 704)
paper clip 1 (p. 92)
paper towels 10 (pp. 114, 174)
paper, dark colored construction, sheet 1 (p. 114) 1 (p. 302)
paper, graph, sheet 5 (pp. 20, 258, 406, 430, 540) 2 (pp. 376, 826)
paper, tracing, sheet 3 (pp. 258, 464, 516) 1 (p. 536)
plastic sheet, clear (30 cm � 30 cm) 4 (pp. 676, 704)
plastic wrap (30 cm � 30 cm) 1 (p. 70) 1 (p. 292)
plate, paper 1 (p. 718)
posterboard (50 cm � 75 cm) 1 (p. 572)
GeoLab and MiniLab Worksheets Earth Science: Geology, the Environment, and the Universe vii
Cop
yrig
ht ©
Gle
ncoe
/McG
raw
-Hill
, a d
ivis
ion
of t
he M
cGra
w-H
ill C
ompa
nies
, Inc
.
GEOLAB AND MINILAB WORKSHEETS
Item GeoLab MiniLab
Consumables
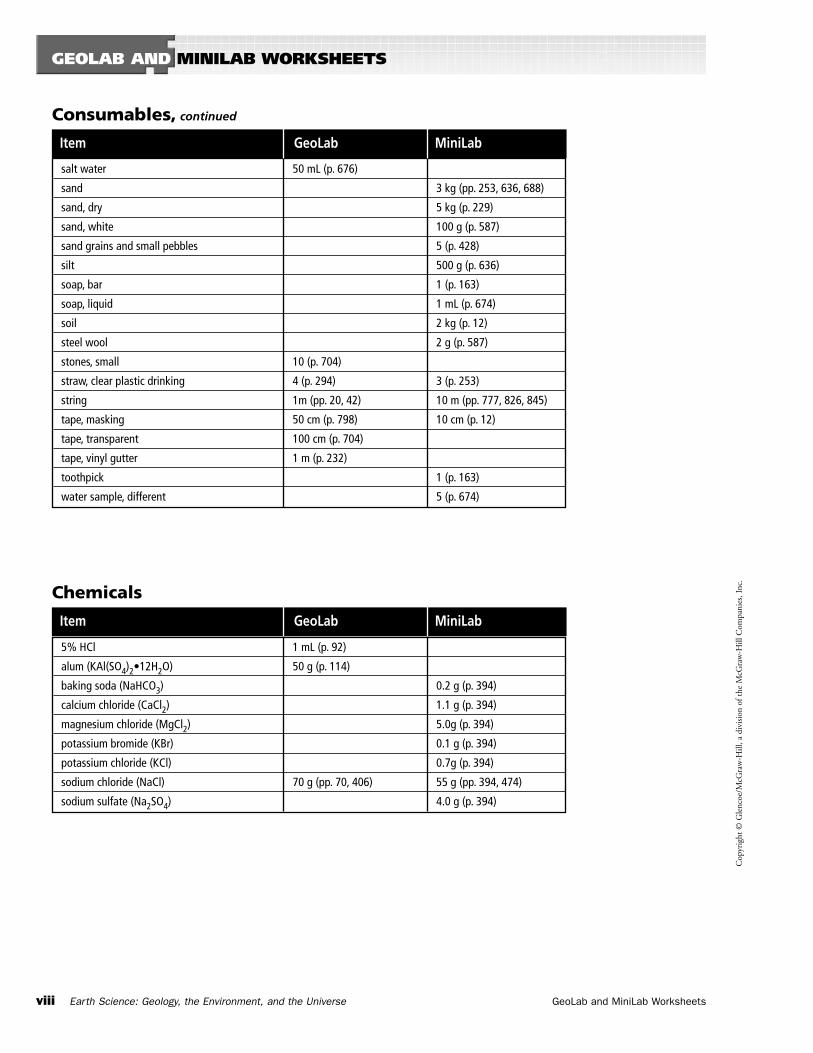
salt water 50 mL (p. 676)
sand 3 kg (pp. 253, 636, 688)
sand, dry 5 kg (p. 229)
sand, white 100 g (p. 587)
sand grains and small pebbles 5 (p. 428)
silt 500 g (p. 636)
soap, bar 1 (p. 163)
soap, liquid 1 mL (p. 674)
soil 2 kg (p. 12)
steel wool 2 g (p. 587)
stones, small 10 (p. 704)
straw, clear plastic drinking 4 (p. 294) 3 (p. 253)
string 1m (pp. 20, 42) 10 m (pp. 777, 826, 845)
tape, masking 50 cm (p. 798) 10 cm (p. 12)
tape, transparent 100 cm (p. 704)
tape, vinyl gutter 1 m (p. 232)
toothpick 1 (p. 163)
water sample, different 5 (p. 674)
viii Earth Science: Geology, the Environment, and the Universe GeoLab and MiniLab Worksheets
Cop
yrig
ht ©
Gle
ncoe
/McG
raw
-Hill
, a d
ivis
ion
of t
he M
cGra
w-H
ill C
ompa
nies
, Inc
.
GEOLAB AND MINILAB WORKSHEETS
Item GeoLab MiniLab
Consumables, continued
5% HCl 1 mL (p. 92)
alum (KAl(SO4)2•12H2O) 50 g (p. 114)
baking soda (NaHCO3) 0.2 g (p. 394)
calcium chloride (CaCl2) 1.1 g (p. 394)
magnesium chloride (MgCl2) 5.0g (p. 394)
potassium bromide (KBr) 0.1 g (p. 394)
potassium chloride (KCl) 0.7g (p. 394)
sodium chloride (NaCl) 70 g (pp. 70, 406) 55 g (pp. 394, 474)
sodium sulfate (Na2SO4) 4.0 g (p. 394)
Item GeoLab MiniLab
Chemicals
Cop
yrig
ht ©
Gle
ncoe
/McG
raw
-Hill
, a d
ivis
ion
of t
he M
cGra
w-H
ill C
ompa
nies
, Inc
.
GeoLab and MiniLab Worksheets Chapter 1 Earth Science: Geology, the Environment, and the Universe 1
Name Class Date
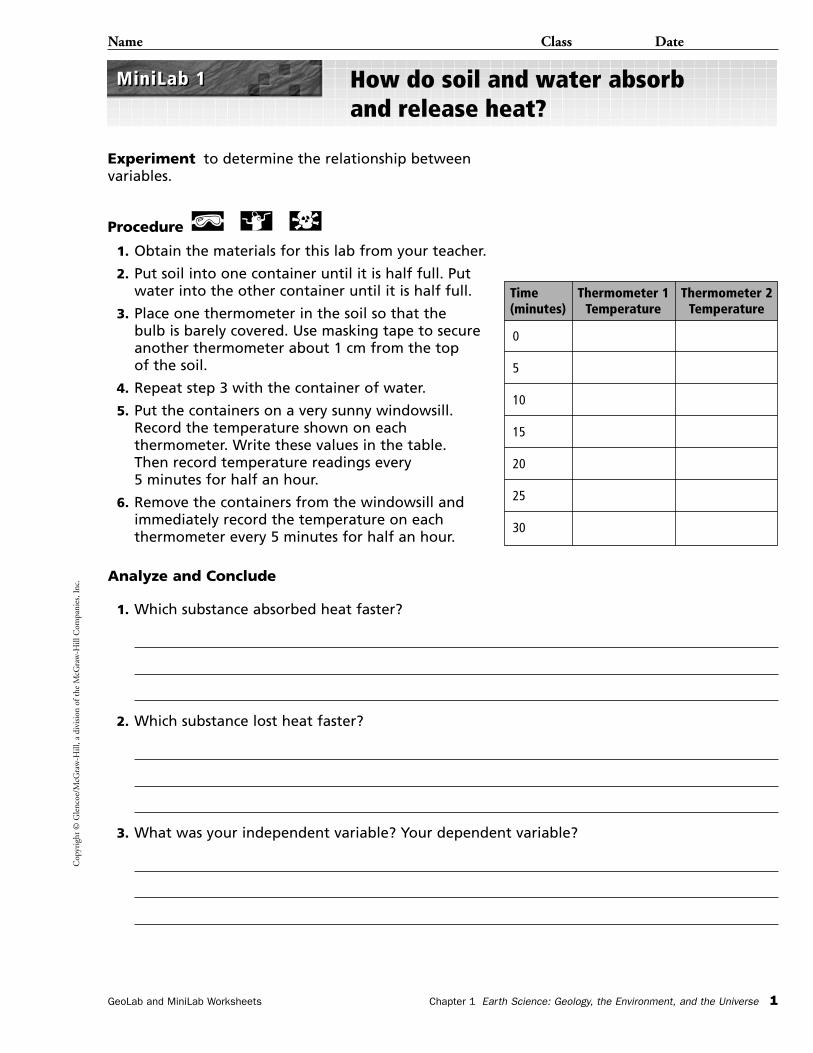
How do soil and water absorb and release heat?
Experiment to determine the relationship betweenvariables.
Procedure
1. Obtain the materials for this lab from your teacher.
2. Put soil into one container until it is half full. Putwater into the other container until it is half full.
3. Place one thermometer in the soil so that the bulb is barely covered. Use masking tape to secureanother thermometer about 1 cm from the topof the soil.
4. Repeat step 3 with the container of water.
5. Put the containers on a very sunny windowsill.Record the temperature shown on eachthermometer. Write these values in the table. Then record temperature readings every 5 minutes for half an hour.
6. Remove the containers from the windowsill andimmediately record the temperature on eachthermometer every 5 minutes for half an hour.
Analyze and Conclude
1. Which substance absorbed heat faster?
2. Which substance lost heat faster?
3. What was your independent variable? Your dependent variable?
MiniLab 1MiniLab 1
Time Thermometer 1 Thermometer 2(minutes) Temperature Temperature
0
5
10
15
20
25
30
Cop
yrig
ht ©
Gle
ncoe
/McG
raw
-Hill
, a d
ivis
ion
of t
he M
cGra
w-H
ill C
ompa
nies
, Inc
.
2 Chapter 1 Earth Science: Geology, the Environment, and the Universe GeoLab and MiniLab Worksheets
Name Class Date
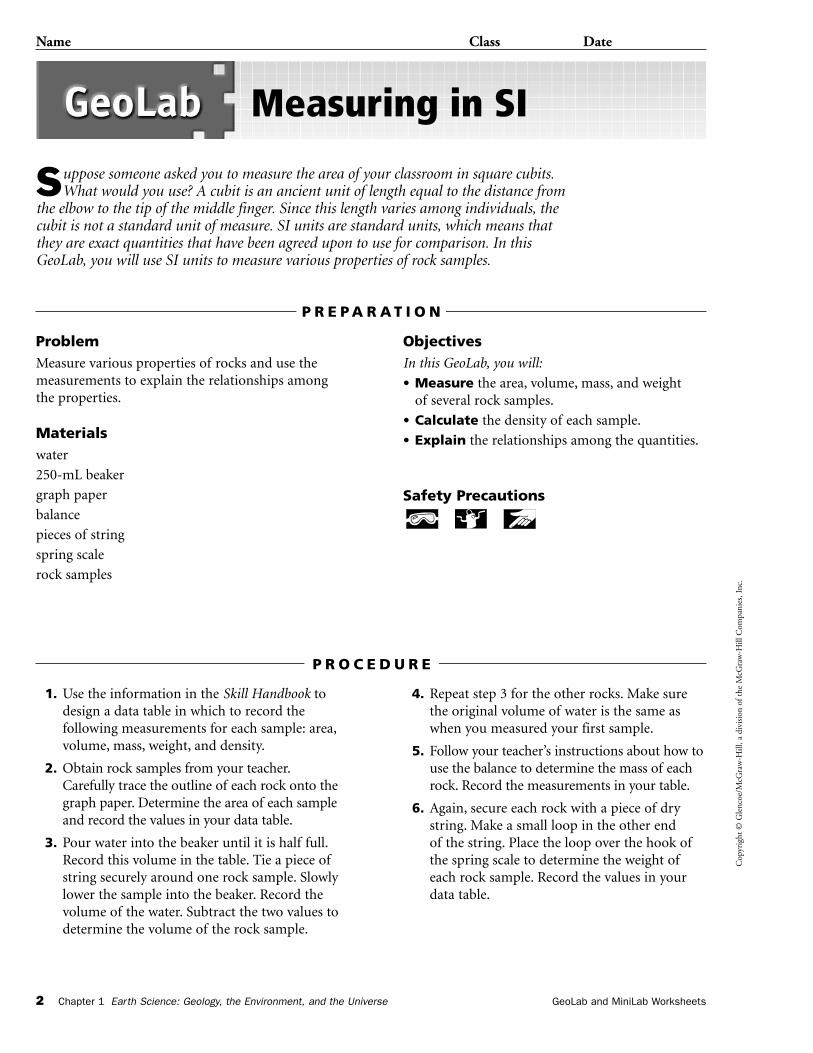
Suppose someone asked you to measure the area of your classroom in square cubits.What would you use? A cubit is an ancient unit of length equal to the distance from
the elbow to the tip of the middle finger. Since this length varies among individuals, thecubit is not a standard unit of measure. SI units are standard units, which means thatthey are exact quantities that have been agreed upon to use for comparison. In thisGeoLab, you will use SI units to measure various properties of rock samples.
ProblemMeasure various properties of rocks and use themeasurements to explain the relationships amongthe properties.
Materialswater
250-mL beaker
graph paper
balance
pieces of string
spring scale
rock samples
ObjectivesIn this GeoLab, you will:
• Measure the area, volume, mass, and weightof several rock samples.
• Calculate the density of each sample.
• Explain the relationships among the quantities.
Safety Precautions
Measuring in SI
P R E P A R A T I O N
1. Use the information in the Skill Handbook todesign a data table in which to record thefollowing measurements for each sample: area,volume, mass, weight, and density.
2. Obtain rock samples from your teacher.Carefully trace the outline of each rock onto thegraph paper. Determine the area of each sampleand record the values in your data table.
3. Pour water into the beaker until it is half full.Record this volume in the table. Tie a piece ofstring securely around one rock sample. Slowlylower the sample into the beaker. Record thevolume of the water. Subtract the two values todetermine the volume of the rock sample.
4. Repeat step 3 for the other rocks. Make surethe original volume of water is the same aswhen you measured your first sample.
5. Follow your teacher’s instructions about how touse the balance to determine the mass of eachrock. Record the measurements in your table.
6. Again, secure each rock with a piece of drystring. Make a small loop in the other endof the string. Place the loop over the hook ofthe spring scale to determine the weight ofeach rock sample. Record the values in yourdata table.
P R O C E D U R E
Cop
yrig
ht ©
Gle
ncoe
/McG
raw
-Hill
, a d
ivis
ion
of t
he M
cGra
w-H
ill C
ompa
nies
, Inc
.
Name Class Date
GeoLab and MiniLab Worksheets Chapter 1 Earth Science: Geology, the Environment, and the Universe 3
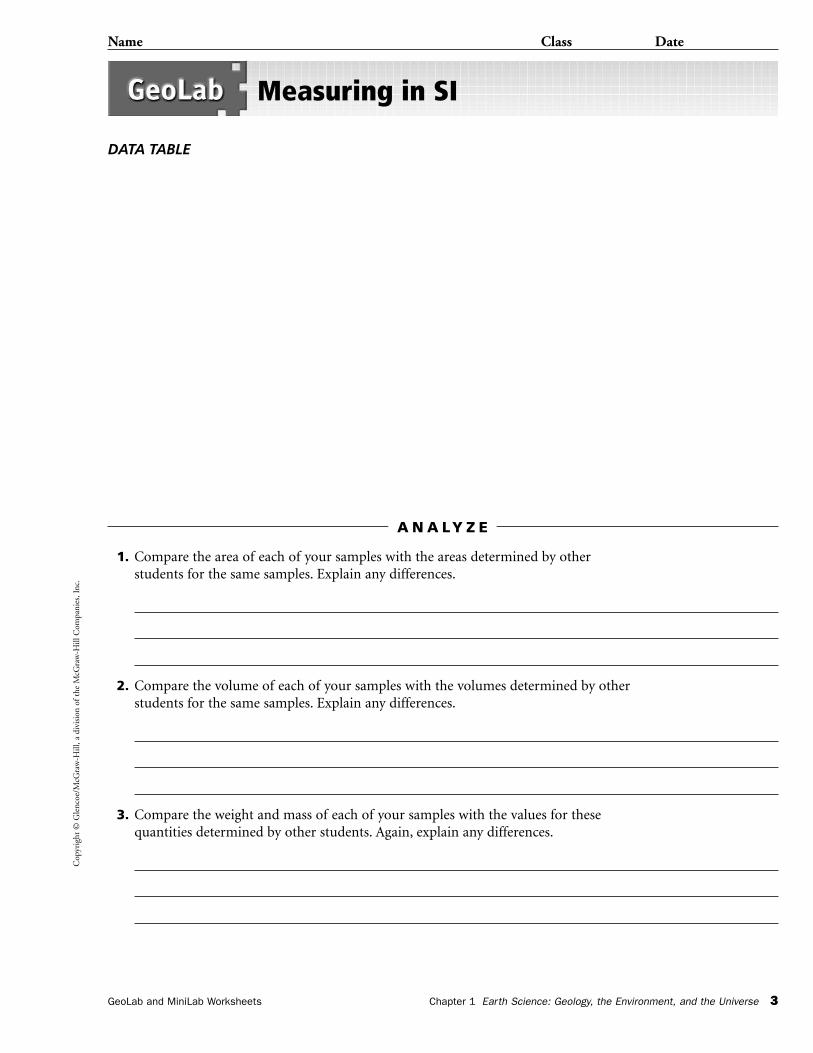
Measuring in SI
1. Compare the area of each of your samples with the areas determined by otherstudents for the same samples. Explain any differences.
2. Compare the volume of each of your samples with the volumes determined by otherstudents for the same samples. Explain any differences.
3. Compare the weight and mass of each of your samples with the values for thesequantities determined by other students. Again, explain any differences.
A N A LY Z E
DATA TABLE
Cop
yrig
ht ©
Gle
ncoe
/McG
raw
-Hill
, a d
ivis
ion
of t
he M
cGra
w-H
ill C
ompa
nies
, Inc
.
Name Class Date
4 Chapter 1 Earth Science: Geology, the Environment, and the Universe GeoLab and MiniLab Worksheets
Measuring in SI
4. Use your measurements to calculate the density of each sample using this formula:density � mass/volume. Record these values in your data table.
1. How accurate do you think your measurement of the area of each sample is? Explain.
2. What were the variables you used to determine the volume of each sample?
3. How could you find the volume of a rock such as pumice, which floats in water?
4. Does mass depend on the size or shape of a rock? Explain.
C O N C L U D E A N D A P P LY
A N A LY Z E
Cop
yrig
ht ©
Gle
ncoe
/McG
raw
-Hill
, a d
ivis
ion
of t
he M
cGra
w-H
ill C
ompa
nies
, Inc
.
GeoLab and MiniLab Worksheets Chapter 2 Earth Science: Geology, the Environment, and the Universe 5
Name Class Date
How can you locate places on Earth?
Determine latitude and longitude for specific places.
Procedure
1. Use a world map or globe to locate the prime meridian and the equator.
2. Take a few moments to become familiar with the grid system. Examinelines of latitude and longitude on the map or globe.
Analyze and Conclude
1. Use a map to find the latitude and longitude of the following places.
Mount St. Helens, Washington
Niagara Falls, New York
Mt. Everest, Nepal
Great Barrier Reef, Australia
2. Use the map to find the name of the places with the following coordinates.
0�03’S, 90�30’W
27�07’S, 109�22’W
41�10’N, 112�30’W
35�02’N, 111�02’W
3�04’S, 37�22’E
3. Find the latitude and longitude of your hometown, the nearest national or state park,and your state capital.
MiniLab 2MiniLab 2
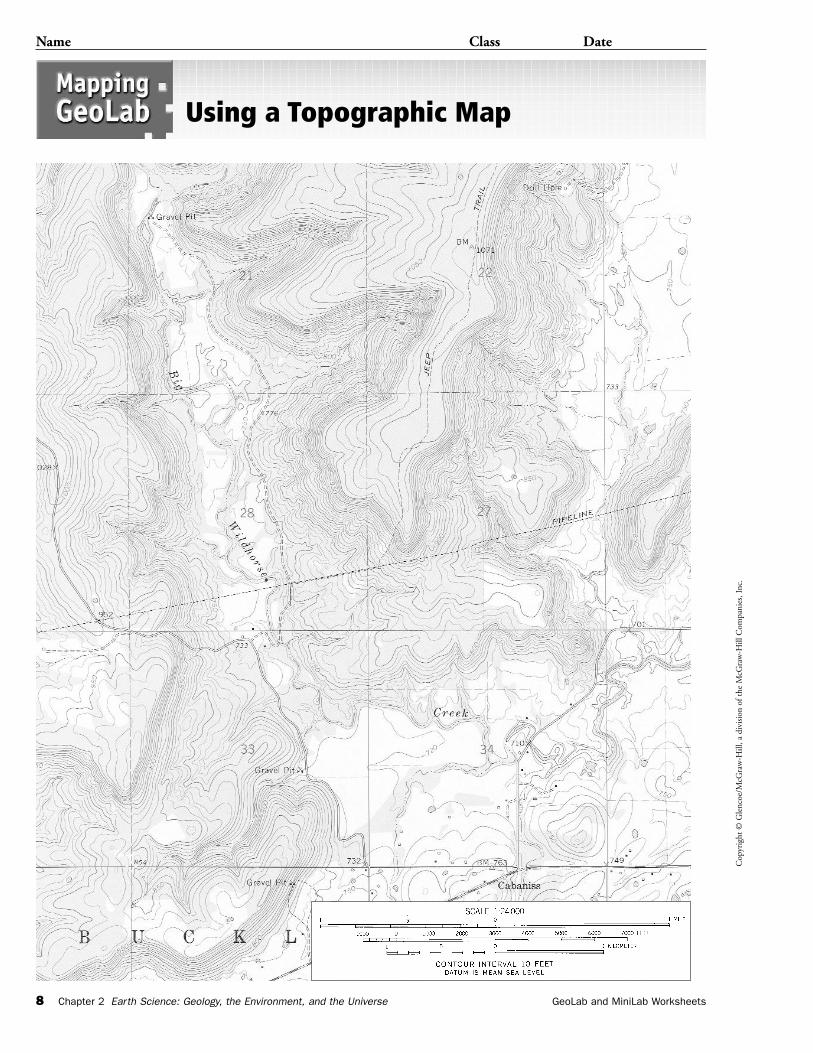
1. What is the contour interval?
2. Calculate the stream gradient of Big Wildhorse Creek from the Gravel Pit insection 21 to where the creek crosses the road in section 34.
3. What is the highest elevation of the jeep trail? If you followed the jeep trail from the highestpoint to where it intersects an unimproved road, what would be your change in elevation?
A N A LY Z E
Cop
yrig
ht ©
Gle
ncoe
/McG
raw
-Hill
, a d
ivis
ion
of t
he M
cGra
w-H
ill C
ompa
nies
, Inc
.
6 Chapter 2 Earth Science: Geology, the Environment, and the Universe GeoLab and MiniLab Worksheets
Name Class Date
Topographic maps show two-dimensional representations of Earth’s surface. Withthese maps, you can determine how steep a hill is, what direction streams flow,
and where mines, wetlands, and other features are located.
ProblemHow can you use a topographic map to interpretinformation about an area?
Materialsruler
string
pencil
Using a Topographic Map
P R E P A R A T I O N
1. Use the map to answer the followingquestions. Be sure to check the map’s scale.
2. Use the string to measure distances betweentwo points that are not in a straight line. Laythe string along the curves, and then measurethe distance by laying the string along the ruler.
3. Remember that elevations on United StatesGeological Survey maps are given in feet.
P R O C E D U R E
Cop
yrig
ht ©
Gle
ncoe
/McG
raw
-Hill
, a d
ivis
ion
of t
he M
cGra
w-H
ill C
ompa
nies
, Inc
.
Name Class Date
GeoLab and MiniLab Worksheets Chapter 2 Earth Science: Geology, the Environment, and the Universe 7
Using a Topographic Map
1. Does Big Wildhorse Creek flow all year round? Explain your answer.
2. What is the shortest distance along roads from the Gravel Pit in section 21 to thesecondary highway?
3. In the space below, draw a profile of the land surface from the bench mark in section22 to the Gravel Pit in section 33.
C O N C L U D E A N D A P P LY
4. If you started at the bench mark (BM) on the jeep trail and hiked along the trail andthe road to the Gravel Pit in section 21, how far would you have hiked?
5. What is the straight-line distance between the two points in question 4? What is thechange in elevation?
A N A LY Z E
Cop
yrig
ht ©
Gle
ncoe
/McG
raw
-Hill
, a d
ivis
ion
of t
he M
cGra
w-H
ill C
ompa
nies
, Inc
.
Name Class Date
8 Chapter 2 Earth Science: Geology, the Environment, and the Universe GeoLab and MiniLab Worksheets
Using a Topographic Map
Cop
yrig
ht ©
Gle
ncoe
/McG
raw
-Hill
, a d
ivis
ion
of t
he M
cGra
w-H
ill C
ompa
nies
, Inc
.
GeoLab and MiniLab Worksheets Chapter 3 Earth Science: Geology, the Environment, and the Universe 9
Name Class Date
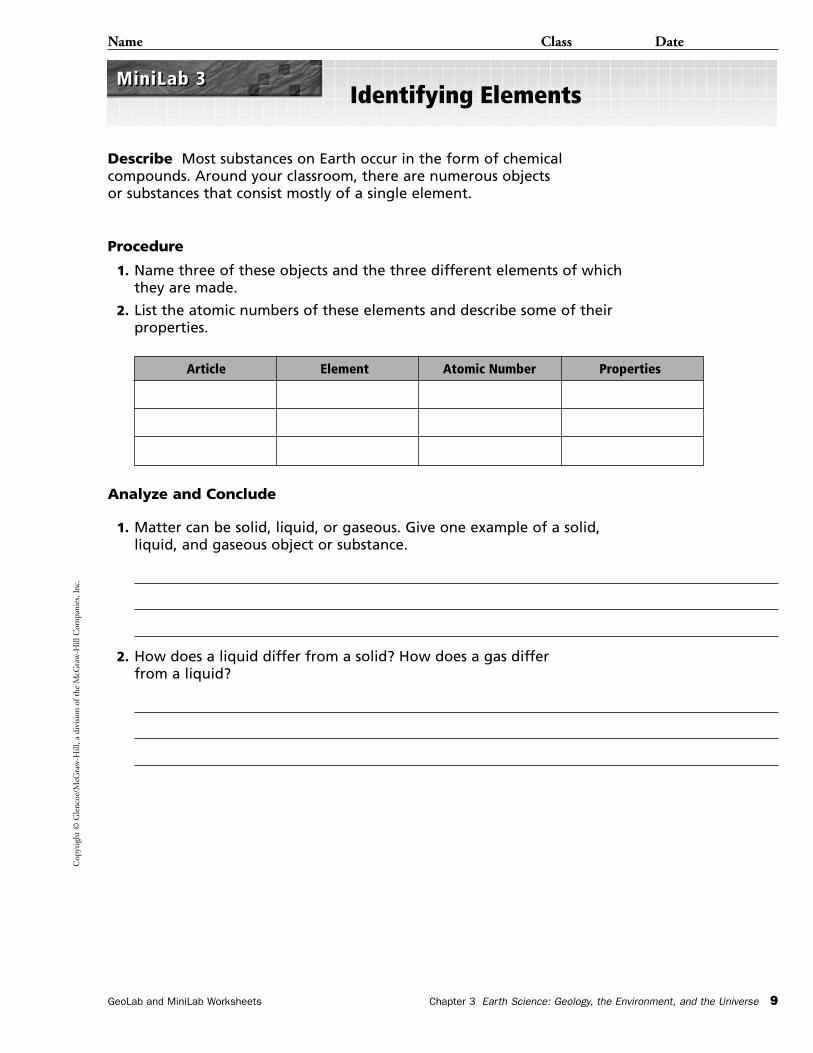
Identifying Elements
Describe Most substances on Earth occur in the form of chemical compounds. Around your classroom, there are numerous objects or substances that consist mostly of a single element.
Procedure
1. Name three of these objects and the three different elements of whichthey are made.
2. List the atomic numbers of these elements and describe some of theirproperties.
Analyze and Conclude
1. Matter can be solid, liquid, or gaseous. Give one example of a solid,liquid, and gaseous object or substance.
2. How does a liquid differ from a solid? How does a gas differ from a liquid?
MiniLab 3MiniLab 3
Article Element Atomic Number Properties
Cop
yrig
ht ©
Gle
ncoe
/McG
raw
-Hill
, a d
ivis
ion
of t
he M
cGra
w-H
ill C
ompa
nies
, Inc
.
10 Chapter 3 Earth Science: Geology, the Environment, and the Universe GeoLab and MiniLab Worksheets
Name Class Date
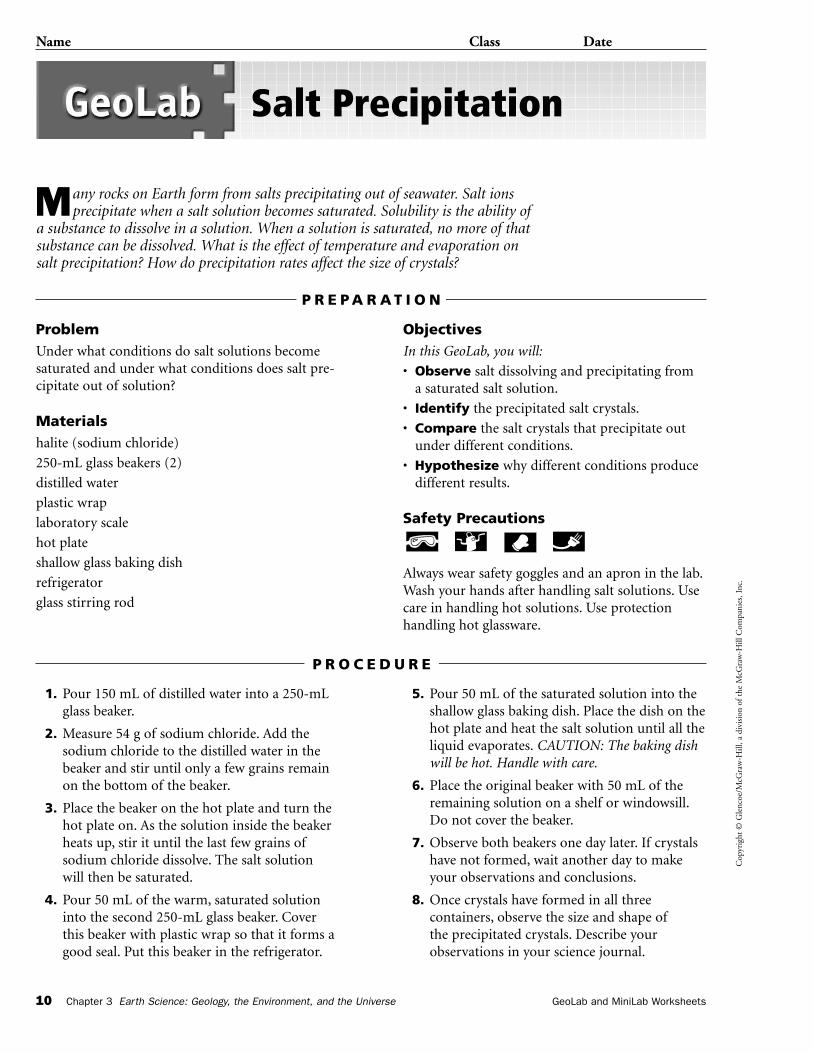
Many rocks on Earth form from salts precipitating out of seawater. Salt ionsprecipitate when a salt solution becomes saturated. Solubility is the ability of
a substance to dissolve in a solution. When a solution is saturated, no more of thatsubstance can be dissolved. What is the effect of temperature and evaporation onsalt precipitation? How do precipitation rates affect the size of crystals?
ProblemUnder what conditions do salt solutions becomesaturated and under what conditions does salt pre-cipitate out of solution?
Materialshalite (sodium chloride)
250-mL glass beakers (2)
distilled water
plastic wrap
laboratory scale
hot plate
shallow glass baking dish
refrigerator
glass stirring rod
ObjectivesIn this GeoLab, you will:
• Observe salt dissolving and precipitating froma saturated salt solution.
• Identify the precipitated salt crystals.
• Compare the salt crystals that precipitate outunder different conditions.
• Hypothesize why different conditions producedifferent results.
Safety Precautions
Always wear safety goggles and an apron in the lab.Wash your hands after handling salt solutions. Usecare in handling hot solutions. Use protection handling hot glassware.
Salt Precipitation
P R E P A R A T I O N
1. Pour 150 mL of distilled water into a 250-mLglass beaker.
2. Measure 54 g of sodium chloride. Add thesodium chloride to the distilled water in thebeaker and stir until only a few grains remainon the bottom of the beaker.
3. Place the beaker on the hot plate and turn thehot plate on. As the solution inside the beakerheats up, stir it until the last few grains ofsodium chloride dissolve. The salt solutionwill then be saturated.
4. Pour 50 mL of the warm, saturated solutioninto the second 250-mL glass beaker. Coverthis beaker with plastic wrap so that it forms agood seal. Put this beaker in the refrigerator.
5. Pour 50 mL of the saturated solution into theshallow glass baking dish. Place the dish on thehot plate and heat the salt solution until all theliquid evaporates. CAUTION: The baking dishwill be hot. Handle with care.
6. Place the original beaker with 50 mL of theremaining solution on a shelf or windowsill.Do not cover the beaker.
7. Observe both beakers one day later. If crystalshave not formed, wait another day to makeyour observations and conclusions.
8. Once crystals have formed in all threecontainers, observe the size and shape ofthe precipitated crystals. Describe yourobservations in your science journal.
P R O C E D U R E
Cop
yrig
ht ©
Gle
ncoe
/McG
raw
-Hill
, a d
ivis
ion
of t
he M
cGra
w-H
ill C
ompa
nies
, Inc
.
Name Class Date
GeoLab and MiniLab Worksheets Chapter 3 Earth Science: Geology, the Environment, and the Universe 11
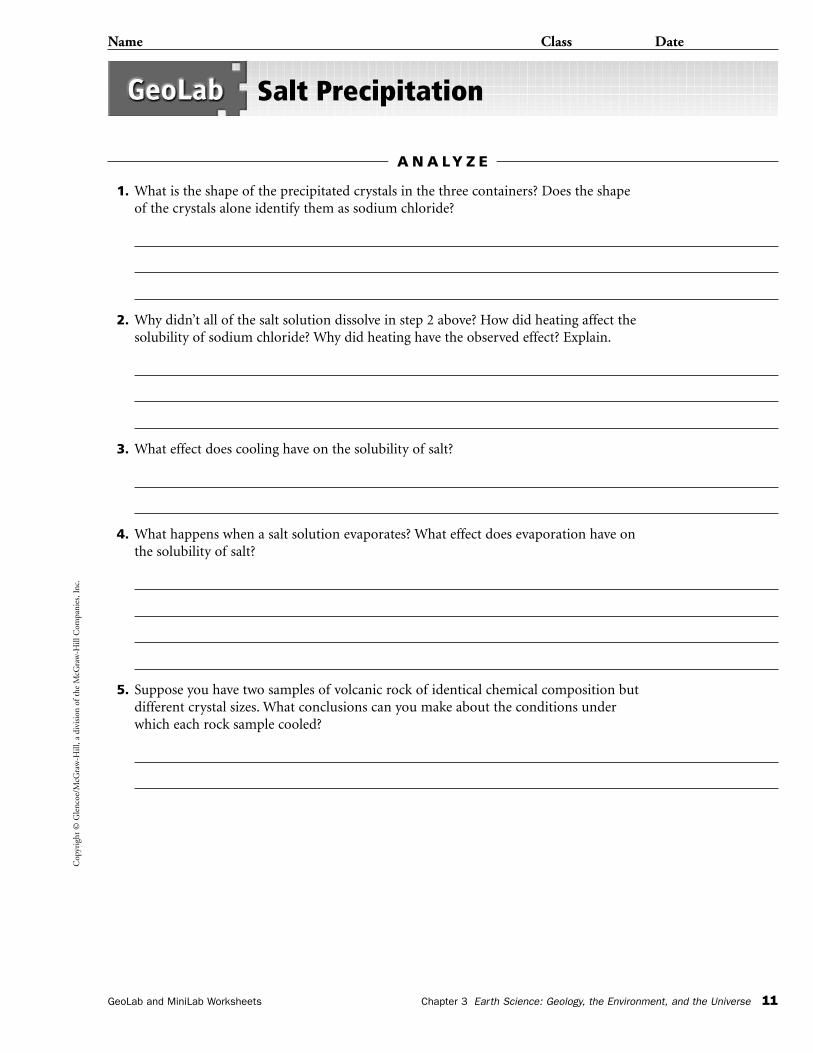
Salt Precipitation
1. What is the shape of the precipitated crystals in the three containers? Does the shapeof the crystals alone identify them as sodium chloride?
2. Why didn’t all of the salt solution dissolve in step 2 above? How did heating affect thesolubility of sodium chloride? Why did heating have the observed effect? Explain.
3. What effect does cooling have on the solubility of salt?
4. What happens when a salt solution evaporates? What effect does evaporation have onthe solubility of salt?
5. Suppose you have two samples of volcanic rock of identical chemical composition butdifferent crystal sizes. What conclusions can you make about the conditions underwhich each rock sample cooled?
A N A LY Z E
Cop
yrig
ht ©
Gle
ncoe
/McG
raw
-Hill
, a d
ivis
ion
of t
he M
cGra
w-H
ill C
ompa
nies
, Inc
.
Name Class Date
12 Chapter 3 Earth Science: Geology, the Environment, and the Universe GeoLab and MiniLab Worksheets
Salt Precipitation
1. What are the sizes of the crystals in the different containers? Which container has thesmallest crystals? Which crystals formed in the shortest time interval?
2. Why does salt precipitate from solution? How is crystal size related to precipitation rate?
3. Design an experiment to separate a heterogeneous mixture of different salts, such asNaCl and MgCl2, into its components, by dissolving and precipitation.
C O N C L U D E A N D A P P LY
Cop
yrig
ht ©
Gle
ncoe
/McG
raw
-Hill
, a d
ivis
ion
of t
he M
cGra
w-H
ill C
ompa
nies
, Inc
.
GeoLab and MiniLab Worksheets Chapter 4 Earth Science: Geology, the Environment, and the Universe 13
Name Class Date
How can crystal systems be modeled?
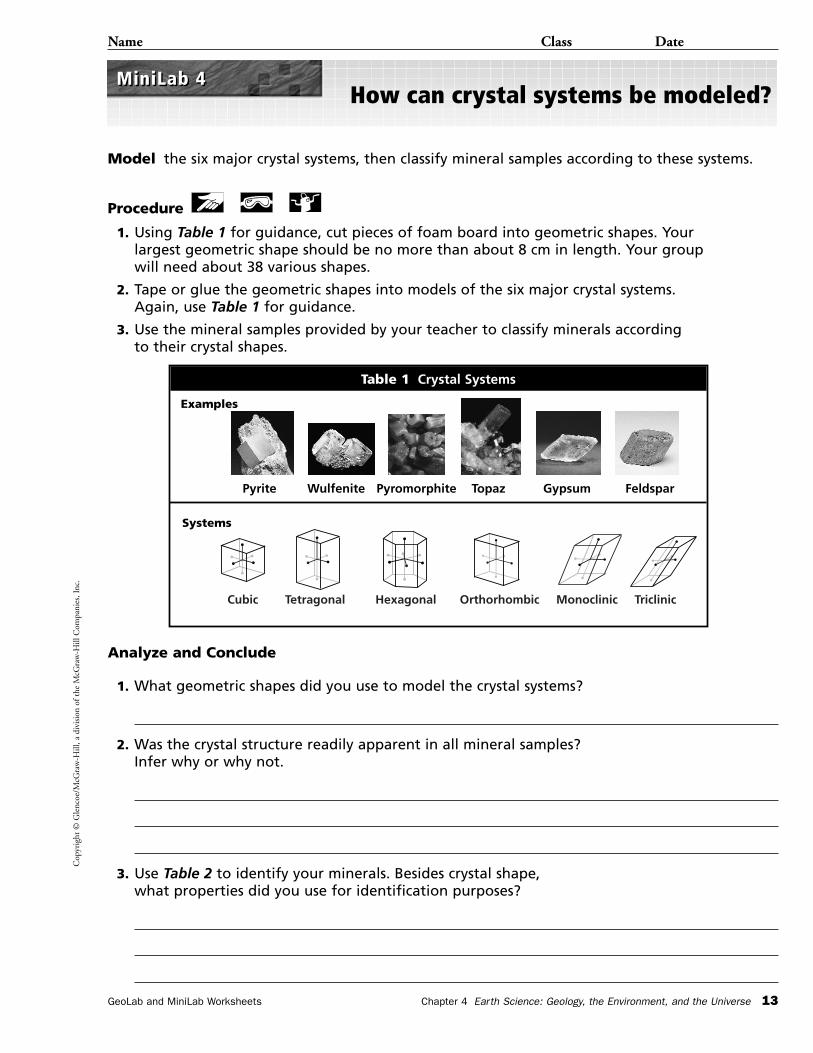
Model the six major crystal systems, then classify mineral samples according to these systems.
Procedure
1. Using Table 1 for guidance, cut pieces of foam board into geometric shapes. Yourlargest geometric shape should be no more than about 8 cm in length. Your groupwill need about 38 various shapes.
2. Tape or glue the geometric shapes into models of the six major crystal systems.Again, use Table 1 for guidance.
3. Use the mineral samples provided by your teacher to classify minerals accordingto their crystal shapes.
Analyze and Conclude
1. What geometric shapes did you use to model the crystal systems?
2. Was the crystal structure readily apparent in all mineral samples? Infer why or why not.
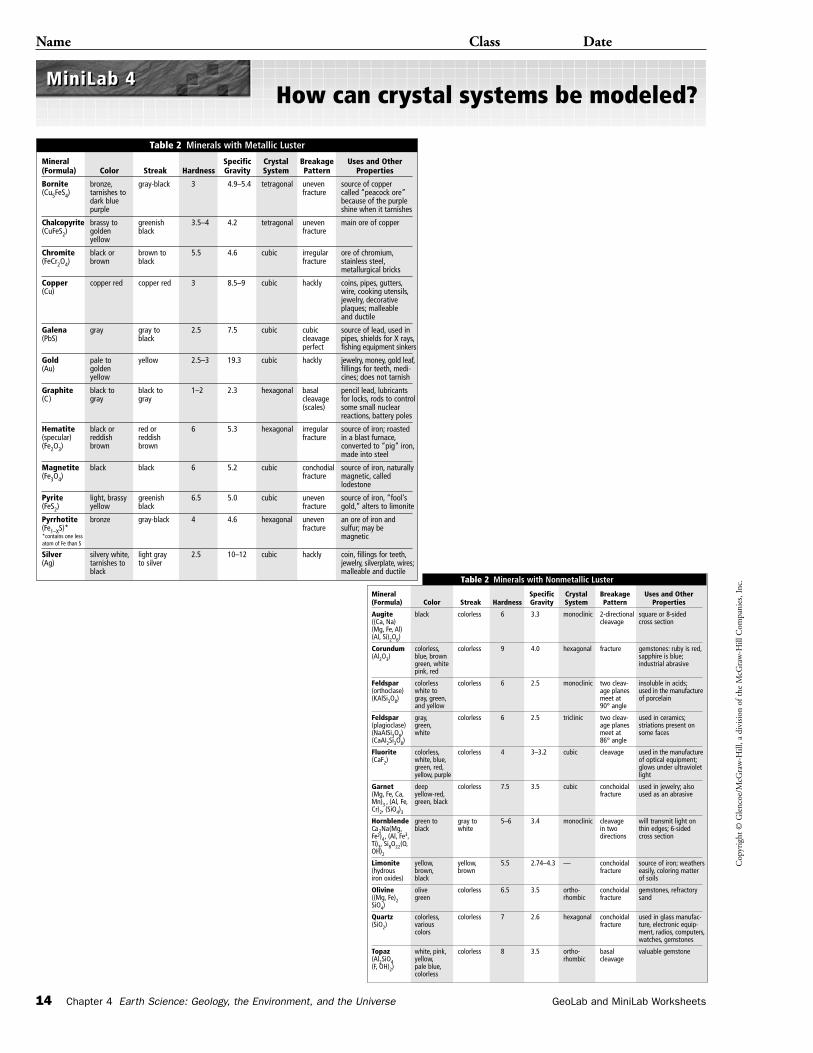
3. Use Table 2 to identify your minerals. Besides crystal shape, what properties did you use for identification purposes?
MiniLab 4MiniLab 4
Table 1 Crystal Systems
Cubic Tetragonal Hexagonal Orthorhombic Monoclinic Triclinic
Pyrite Wulfenite Pyromorphite Topaz Gypsum Feldspar
Examples
Systems
Cop
yrig
ht ©
Gle
ncoe
/McG
raw
-Hill
, a d
ivis
ion
of t
he M
cGra
w-H
ill C
ompa
nies
, Inc
.
14 Chapter 4 Earth Science: Geology, the Environment, and the Universe GeoLab and MiniLab Worksheets
Name Class Date
How can crystal systems be modeled?MiniLab 4MiniLab 4
Table 2 Minerals with Nonmetallic Luster
Mineral Specific Crystal Breakage Uses and Other(Formula) Color Streak Hardness Gravity System Pattern Properties
Augite black colorless 6 3.3 monoclinic 2-directional square or 8-sided((Ca, Na) cleavage cross section(Mg, Fe, Al)(Al, Si)2O6)
Corundum colorless, colorless 9 4.0 hexagonal fracture gemstones: ruby is red,(Al2O3) blue, brown sapphire is blue;
green, white industrial abrasivepink, red
Feldspar colorless colorless 6 2.5 monoclinic two cleav- insoluble in acids;(orthoclase) white to age planes used in the manufacture (KAlSi3O8) gray, green, meet at of porcelain
and yellow 90° angle
Feldspar gray, colorless 6 2.5 triclinic two cleav- used in ceramics;(plagioclase) green, age planes striations present on(NaAISi3O8) white meet at some faces(CaAI2Si3O8) 86° angle
Fluorite colorless, colorless 4 3–3.2 cubic cleavage used in the manufacture(CaF2) white, blue, of optical equipment;
green, red, glows under ultravioletyellow, purple light
Garnet deep colorless 7.5 3.5 cubic conchoidal used in jewelry; also (Mg, Fe, Ca, yellow-red, fracture used as an abrasiveMn)3 , (Al, Fe, green, blackCr)2, (SiO4)3
Hornblende green to gray to 5–6 3.4 monoclinic cleavage will transmit light on Ca 2Na(Mg, black white in two thin edges; 6-sidedFe2)4, (Al, Fe3, directions cross sectionTi)3, Si8O22(O,OH)2
Limonite yellow, yellow, 5.5 2.74–4.3 — conchoidal source of iron; weathers(hydrous brown, brown fracture easily, coloring matteriron oxides) black of soils
Olivine olive colorless 6.5 3.5 ortho- conchoidal gemstones, refractory((Mg, Fe)2 green rhombic fracture sandSiO4)
Quartz colorless, colorless 7 2.6 hexagonal conchoidal used in glass manufac-(SiO2) various fracture ture, electronic equip-
colors ment, radios, computers,watches, gemstones
Topaz white, pink, colorless 8 3.5 ortho- basal valuable gemstone(Al2SiO4 yellow, rhombic cleavage(F, OH)2) pale blue,
colorless
Table 2 Minerals with Metallic Luster
Mineral Specific Crystal Breakage Uses and Other(Formula) Color Streak Hardness Gravity System Pattern Properties
Bornite bronze, gray-black 3 4.9–5.4 tetragonal uneven source of copper(Cu5FeS4) tarnishes to fracture called “peacock ore”
dark blue because of the purplepurple shine when it tarnishes
Chalcopyrite brassy to greenish 3.5–4 4.2 tetragonal uneven main ore of copper(CuFeS2) golden black fracture
yellow
Chromite black or brown to 5.5 4.6 cubic irregular ore of chromium,(FeCr2O4) brown black fracture stainless steel,
metallurgical bricks
Copper copper red copper red 3 8.5–9 cubic hackly coins, pipes, gutters,(Cu) wire, cooking utensils,
jewelry, decorativeplaques; malleableand ductile
Galena gray gray to 2.5 7.5 cubic cubic source of lead, used in(PbS) black cleavage pipes, shields for X rays,
perfect fishing equipment sinkers
Gold pale to yellow 2.5–3 19.3 cubic hackly jewelry, money, gold leaf,(Au) golden fillings for teeth, medi-
yellow cines; does not tarnish
Graphite black to black to 1–2 2.3 hexagonal basal pencil lead, lubricants(C) gray gray cleavage for locks, rods to control
(scales) some small nuclearreactions, battery poles
Hematite black or red or 6 5.3 hexagonal irregular source of iron; roasted(specular) reddish reddish fracture in a blast furnace,(Fe2O3) brown brown converted to “pig” iron,
made into steel
Magnetite black black 6 5.2 cubic conchodial source of iron, naturally(Fe3O4) fracture magnetic, called
lodestone
Pyrite light, brassy greenish 6.5 5.0 cubic uneven source of iron, “fool’s(FeS2) yellow black fracture gold,” alters to limonite
Pyrrhotite bronze gray-black 4 4.6 hexagonal uneven an ore of iron and (Fe1–XS)* fracture sulfur; may be
magnetic
Silver silvery white, light gray 2.5 10–12 cubic hackly coin, fillings for teeth,(Ag) tarnishes to to silver jewelry, silverplate, wires;
black malleable and ductile
*contains one lessatom of Fe than S
Cop
yrig
ht ©
Gle
ncoe
/McG
raw
-Hill
, a d
ivis
ion
of t
he M
cGra
w-H
ill C
ompa
nies
, Inc
.
GeoLab and MiniLab Worksheets Chapter 4 Earth Science: Geology, the Environment, and the Universe 15
Name Class Date
Have you ever used a field guide to identify a bird, flower, rock, or insect? If so, youknow that field guides include far more than simply photographs. A typical field
guide for minerals might include background information about minerals in general,plus specific information about the formation, properties, and uses of each mineral. Inthis activity, you’ll create a field guide to minerals.
ProblemHow would you go about identifying minerals?What physical and chemical properties would youtest? Which of these properties should be includedin a field guide to help others to identify unknownminerals?
Possible Materialsmineral samples Appendix H
hand lens steel file or nail
glass plate piece of copper
streak plate paper clip
Mohs scale of magnetmineral hardness
5 percent hydrochloric acid (HCl) with dropper
HypothesisAs a group, form a hypothesis about which property or properties might be most useful inidentifying minerals. Write your hypothesis in thespace below.
ObjectivesIn this GeoLab, you will:
• Conduct tests on unknown minerals to deter-mine their physical and chemical properties.
• Identify minerals based on the results ofyour tests.
• Design a field guide for minerals.
Safety Precautions
Review the safe use of acids. HCl may cause burns.If a spill occurs, rinse your skin with water andnotify your teacher immediately.
Making a Field Guide to Minerals
P R E P A R A T I O N
Cop
yrig
ht ©
Gle
ncoe
/McG
raw
-Hill
, a d
ivis
ion
of t
he M
cGra
w-H
ill C
ompa
nies
, Inc
.
Name Class Date
16 Chapter 4 Earth Science: Geology, the Environment, and the Universe GeoLab and MiniLab Worksheets
Making a Field Guide to Minerals
1. As a group, list the steps that you will take to test your hypothesis. Keep the available materialsin mind as you plan your procedure. Be specific, describing exactly what you will do at eachstep. Properties that you may want to test include luster, color, reaction to HCl, magnetism,cleavage, fracture, texture, hardness, streak, double refraction, and density.
2. Should you test any of the properties more than once for any of the minerals? How will you determine whether certain properties indicate a specific mineral?
3. Design a data table to summarize your results. You can use this table as the basis foryour field guide. Draw the table in the space below.
4. Read over your entire experiment to make sure that all steps are in a logical order.
5. Have you included a step for additional research? You may have to use the library or theGlencoe Science Web Site to gather all the necessary information for your field guide.
6. What information will be included in the field guide? Possible data include how eachmineral formed, its uses, its chemical formula, and a labeled photograph or drawingof the mineral.
7. Make sure your teacher approves your plan before you proceed with your experiment.
P L A N T H E E X P E R I M E N T
Cop
yrig
ht ©
Gle
ncoe
/McG
raw
-Hill
, a d
ivis
ion
of t
he M
cGra
w-H
ill C
ompa
nies
, Inc
.
Name Class Date
GeoLab and MiniLab Worksheets Chapter 4 Earth Science: Geology, the Environment, and the Universe 17
Making a Field Guide to Minerals
1. Interpreting Results Which properties were most reliable for identifying minerals? Whichproperties were least reliable? Discuss reasons why one property is more useful than others.
2. Defending Your Hypothesis Was your hypothesis supported? Why or why not?
3. Thinking Critically How could you use a piece of paper, a steel knife, and aglass bottle to distinguish between Iceland spar and quartz?
4. Observing and Inferring What mineral reacted with the HCl? Why did themineral bubble? Write the balanced equation that describes the chemical reaction thattook place between the mineral and the acid.
5. Conducting Research What information did you include in the field guide? Whatresources did you use to gather your data? Describe the layout of your field guide.
A N A LY Z E
Cop
yrig
ht ©
Gle
ncoe
/McG
raw
-Hill
, a d
ivis
ion
of t
he M
cGra
w-H
ill C
ompa
nies
, Inc
.
Name Class Date
18 Chapter 4 Earth Science: Geology, the Environment, and the Universe GeoLab and MiniLab Worksheets
Making a Field Guide to Minerals
1. Compare and contrast your field guide with those of other groups. How could youimprove your field guide?
2. What are the advantages and disadvantages of field guides?
3. Based on your results, is there any one definitive test that can always be used toidentify a mineral? Explain.
C O N C L U D E A N D A P P LY
Cop
yrig
ht ©
Gle
ncoe
/McG
raw
-Hill
, a d
ivis
ion
of t
he M
cGra
w-H
ill C
ompa
nies
, Inc
.
GeoLab and MiniLab Worksheets Chapter 5 Earth Science: Geology, the Environment, and the Universe 19
Name Class Date
How do igneous rocks differ?
Compare and contrast the different characteristics of igneous rocks.
Procedure
1. Using the igneous rock samples provided by your teacher, carefullyobserve the following characteristics of each rock: color, grain size,texture, and, if possible, mineral composition.
2. Design a data table to record your observations.
Analyze and Conclude
1. Classify your rock samples as extrusive or intrusive rocks.
2. What characteristics do the extrusive rocks share? How do they differ?What characteristics do the intrusive rocks share? How do they differ?
3. Classify your rock samples as felsic, intermediate, mafic, or ultramafic.
MiniLab 5MiniLab 5
Cop
yrig
ht ©
Gle
ncoe
/McG
raw
-Hill
, a d
ivis
ion
of t
he M
cGra
w-H
ill C
ompa
nies
, Inc
.
20 Chapter 5 Earth Science: Geology, the Environment, and the Universe GeoLab and MiniLab Worksheets
Name Class Date
The rate at which magma cools has an effect on the grain size of the resulting igneous rock.Observing the crystallization of magma is difficult because molten rock is very hot and the
crystallization process is sometimes very slow. Other materials, however, crystallize at lowertemperatures. These materials can be used to model crystal formation.
ProblemModel the crystallization of minerals from magma.
Materialsclean, plastic petri dishes
saturated alum solution
200-mL glass beaker
magnifying glass
piece of dark-colored construction paper
thermometer
paper towels
water
hot plate
ObjectivesIn this GeoLab, you will:
• Determine the relationship between coolingrate and crystal size.
• Compare and contrast different crystal shapes.
Safety Precautions
The alum mixture can cause skin irritation and willbe hot when it is first poured into the petri dishes.If splattering occurs, wash skin with cold water.Always wear safety goggles and an apron in the lab.
Modeling Crystal Formation
P R E P A R A T I O N
1. As a group, plan how you could change thecooling rate of a hot solution poured into apetri dish. For instance, you may want to putone sample in a freezer or refrigerator for adesignated period of time. Assign each groupmember a petri dish to observe during theexperiment.
2. Place a piece of dark-colored constructionpaper on a level surface where it won’t bedisturbed. Place the petri dishes on top of thepaper.
3. Carefully pour a saturated alum solution thatis about 95°C to 98°C, or just below boilingtemperature, into each petri dish so that it ishalf-full. Use caution when pouring the hotliquid to avoid splatters and burns.
4. Observe the petri dishes. On the next page,draw a data table on which to record yourobservations. Below your data table, draw whatyou observe happening in the petri dishassigned to you.
5. Every 5 minutes for 30 minutes, record yourobservations of your petri dish. Make accurate,full-sized drawings of any crystals that beginto form.
P R O C E D U R E
Cop
yrig
ht ©
Gle
ncoe
/McG
raw
-Hill
, a d
ivis
ion
of t
he M
cGra
w-H
ill C
ompa
nies
, Inc
.
Name Class Date
GeoLab and MiniLab Worksheets Chapter 5 Earth Science: Geology, the Environment, and the Universe 21
Modeling Crystal Formation
DATA TABLE
OBSERVATIONS
1. How did you vary the cooling rate of the solutions in the petri dishes? Compare your methodswith those of other groups. Did one method appear to work better than others? Explain.
2. Use a magnifying glass or binocular microscope to observe your alum crystals. Whatdo the crystals look like? Are all the crystals the same size?
A N A LY Z E
Cop
yrig
ht ©
Gle
ncoe
/McG
raw
-Hill
, a d
ivis
ion
of t
he M
cGra
w-H
ill C
ompa
nies
, Inc
.
Name Class Date
22 Chapter 5 Earth Science: Geology, the Environment, and the Universe GeoLab and MiniLab Worksheets
Modeling Crystal Formation
1. What factors affected the size of the crystals in the different petri dishes? How do you know?
2. Infer why the crystals changed shape as they grew.
3. How is this experiment different from magma crystallization? How is it the same?
4. Describe the relationship between cooling rate and crystal formation.
C O N C L U D E A N D A P P LY
A N A LY Z E
3. Compare your drawings and petri dish with those of other students in your group. Which petri dishhad the smallest average crystal size? Describe the conditions under which that petri dish cooled.
4. Do all the crystals have the same shape? Draw the most common shape. Share yourdrawings with other groups. Describe any patterns that you see.
Cop
yrig
ht ©
Gle
ncoe
/McG
raw
-Hill
, a d
ivis
ion
of t
he M
cGra
w-H
ill C
ompa
nies
, Inc
.
GeoLab and MiniLab Worksheets Chapter 6 Earth Science: Geology, the Environment, and the Universe 23
Name Class Date
What happened here?
Interpret animal activity from patterns of fossilfootprints.
Procedure
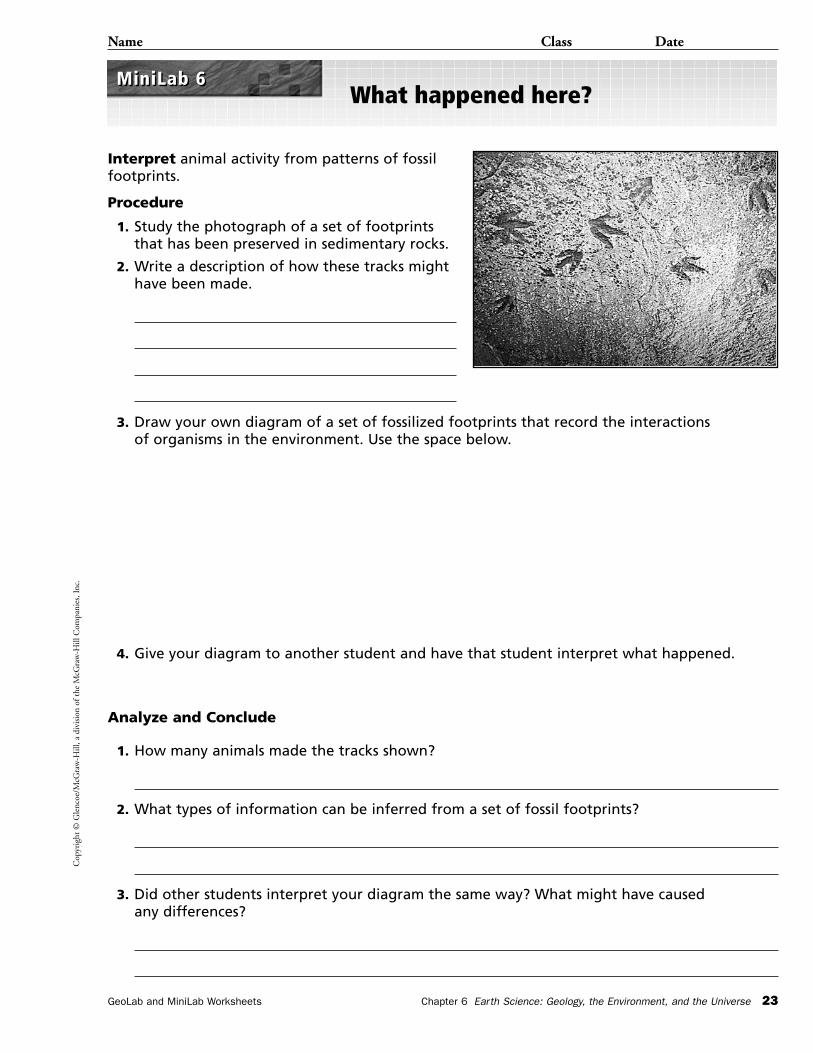
1. Study the photograph of a set of footprintsthat has been preserved in sedimentary rocks.
2. Write a description of how these tracks mighthave been made.
3. Draw your own diagram of a set of fossilized footprints that record the interactionsof organisms in the environment. Use the space below.
4. Give your diagram to another student and have that student interpret what happened.
Analyze and Conclude
1. How many animals made the tracks shown?
2. What types of information can be inferred from a set of fossil footprints?
3. Did other students interpret your diagram the same way? What might have caused any differences?
MiniLab 6MiniLab 6
Cop
yrig
ht ©
Gle
ncoe
/McG
raw
-Hill
, a d
ivis
ion
of t
he M
cGra
w-H
ill C
ompa
nies
, Inc
.
24 Chapter 6 Earth Science: Geology, the Environment, and the Universe GeoLab and MiniLab Worksheets
Name Class Date
As the rock cycle continues, and rocks change from one type to another, more changesoccur than meet the eye. Color, grain size, texture and mineral composition are
easily observed and described visually. Yet, with mineral changes come changes in crystalstructure and density. How can these be accounted for and described? Studying pairs ofsedimentary and metamorphic rocks can show you how.
ProblemHow do the characteristics of sedimentary andmetamorphic rocks compare?
Materialssamples of sedimentary rocks and their
metamorphic equivalents
magnifying glass or hand lens
paper
pencil
beam balance
100-mL graduated cylinder or beaker large enough to hold the rock samples
water
ObjectivesIn this GeoLab, you will:
• Describe the characteristics of sedimentary andmetamorphic rocks.
• Determine the density of different rock types.
• Infer how metamorphism changes the structureof rocks.
Safety Precautions
Always wear safety goggles and an apron in the lab.
Interpreting Changes in Rocks
P R E P A R A T I O N
1. Use the data table on the next page. Add rowsto the table if you are examining more thanfour samples.
2. Observe each rock sample. Record yourobservations in the data table.
3. Recall that density � mass/volume. Make aplan that will allow you to measure the massand volume of a rock sample.
4. Determine the density of each rock sampleand record this information in the data table.
P R O C E D U R E
Cop
yrig
ht ©
Gle
ncoe
/McG
raw
-Hill
, a d
ivis
ion
of t
he M
cGra
w-H
ill C
ompa
nies
, Inc
.
Name Class Date
GeoLab and MiniLab Worksheets Chapter 6 Earth Science: Geology, the Environment, and the Universe 25
Interpreting Changes in Rocks
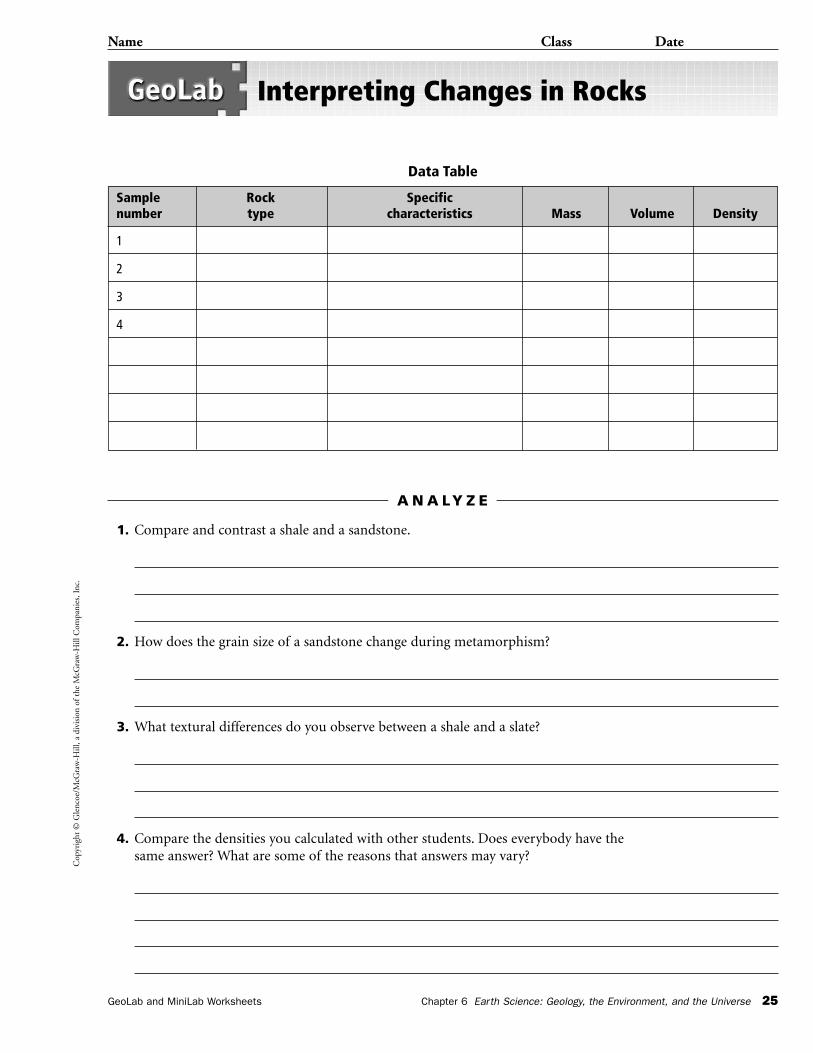
1. Compare and contrast a shale and a sandstone.
2. How does the grain size of a sandstone change during metamorphism?
3. What textural differences do you observe between a shale and a slate?
4. Compare the densities you calculated with other students. Does everybody have thesame answer? What are some of the reasons that answers may vary?
A N A LY Z E
Sample Rock Specificnumber type characteristics Mass Volume Density
1
2
3
4
Data Table
Cop
yrig
ht ©
Gle
ncoe
/McG
raw
-Hill
, a d
ivis
ion
of t
he M
cGra
w-H
ill C
ompa
nies
, Inc
.
Name Class Date
26 Chapter 6 Earth Science: Geology, the Environment, and the Universe GeoLab and MiniLab Worksheets
Interpreting Changes in Rocks
1. Why does the color of a sedimentary rock change during metamorphism?
2. Compare the density of a slate and a quartzite. Which rock has a greater density?Explain.
3. Compare the densities of shale and slate, sandstone and quartzite, and limestone and marble. Does density always change in the same way? Explain the results that you observed.
C O N C L U D E A N D A P P LY
Cop
yrig
ht ©
Gle
ncoe
/McG
raw
-Hill
, a d
ivis
ion
of t
he M
cGra
w-H
ill C
ompa
nies
, Inc
.
GeoLab and MiniLab Worksheets Chapter 7 Earth Science: Geology, the Environment, and the Universe 27
Name Class Date
How do rocks weather?
Model how rocks are exposed to their surrounding environment and slowlyweather away.
Procedure
1. Carve your name deeply into a bar of soap with a toothpick. Weigh thesoap and record the weight.
2. Measure and record the depth of the letters carved into the soap.
3. Place the bar of soap on its edge in a catch basin.
4. Sprinkle water over the bar of soap until a noticeable change occurs inthe depth of the carved letters.
5. Measure and record the depth of the carved letters.
Analyze and Conclude
1. How did the depth of the letters carved into the bar of soap change?
2. Did the shape, size, or weight of the bar of soap change?
3. Where did the missing soap go?
4. What additional procedure could you follow to determine whether anysoap wore away?
MiniLab 7MiniLab 7
Cop
yrig
ht ©
Gle
ncoe
/McG
raw
-Hill
, a d
ivis
ion
of t
he M
cGra
w-H
ill C
ompa
nies
, Inc
.
28 Chapter 7 Earth Science: Geology, the Environment, and the Universe GeoLab and MiniLab Worksheets
Name Class Date
Many factors affect the rate of weathering of Earth materials. Two major factors thataffect the rate at which a rock weathers include the length of time it is exposed to a
weathering agent and the composition of the rock.
ProblemInvestigate the relationship between time and therate of weathering of halite chips.
Materialsplastic jar with lid
water (300 mL)
halite chips (100 g)
balance
timer
paper towels
ObjectivesIn this Geolab, you will:
• Determine the relationship between the lengthof time that rocks are exposed to running waterand the degree of weathering of the rocks.
• Describe the appearance of weathered rocks.
• Infer what other factors may influence the rateof weathering.
• Apply your results to a real-world situation.
Safety Precautions
Wear splash-resistant safety goggles and an apronwhile you do this activity. Do not ingest the halitechips.
Effects of Weathering
P R E P A R A T I O N
Average Shaking Time in Minutes Weight of Chips (g)
3
6
9
12
Weathering Data
Cop
yrig
ht ©
Gle
ncoe
/McG
raw
-Hill
, a d
ivis
ion
of t
he M
cGra
w-H
ill C
ompa
nies
, Inc
.
Name Class Date
GeoLab and MiniLab Worksheets Chapter 7 Earth Science: Geology, the Environment, and the Universe 29
Effects of Weathering
1. Why did you need to soak the chips before conducting the investigation?
2. How did the mass of the rocks change with the length of time they were shaken?
3. How did the shape of the rocks change as a result of being shaken in a jar with water?
4. What factors could have affected a team’s results?
A N A LY Z E
1. Soak 100 g of halite chips in water overnight.
2. As a class, decide on a uniform method ofshaking the jars.
3. Pour off the water and place the halite chips inthe plastic jar.
4. Add 300 mL of water to the jar.
5. Secure the lid on the jar.
6. Shake the jar for the assigned period of time.
7. Remove the water from the jar.
8. Use paper towels to dry the halite chips.
9. Use a balance to weigh the chips. Record yourmeasurement in a data table similar to the oneprovided on page 28.
P R O C E D U R E
Cop
yrig
ht ©
Gle
ncoe
/McG
raw
-Hill
, a d
ivis
ion
of t
he M
cGra
w-H
ill C
ompa
nies
, Inc
.
Name Class Date
30 Chapter 7 Earth Science: Geology, the Environment, and the Universe GeoLab and MiniLab Worksheets
Effects of Weathering
1. What real-world process did you model in this investigation?
2. How would acid precipitation affect this process in the real world?
3. How would the results of your investigation be affected if you used pieces of quartzinstead of halite?
C O N C L U D E A N D A P P LY
Cop
yrig
ht ©
Gle
ncoe
/McG
raw
-Hill
, a d
ivis
ion
of t
he M
cGra
w-H
ill C
ompa
nies
, Inc
.
GeoLab and MiniLab Worksheets Chapter 8 Earth Science: Geology, the Environment, and the Universe 31
Name Class Date
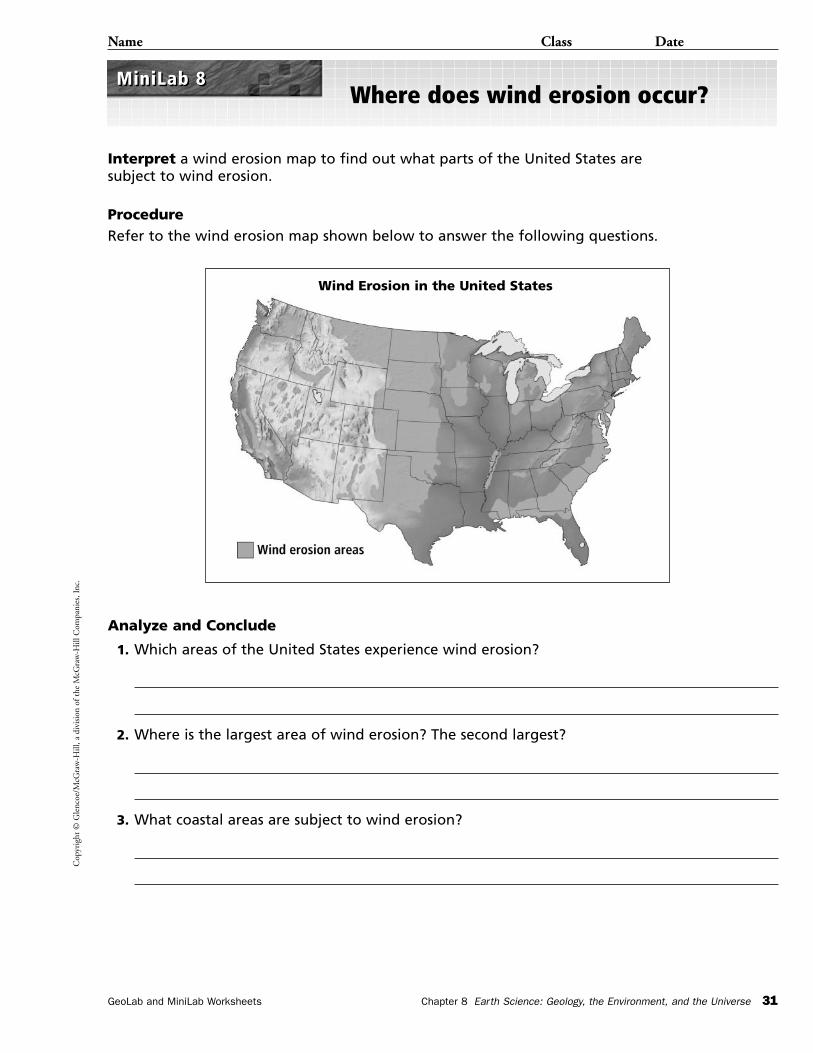
Where does wind erosion occur?
Interpret a wind erosion map to find out what parts of the United States aresubject to wind erosion.
ProcedureRefer to the wind erosion map shown below to answer the following questions.
Analyze and Conclude
1. Which areas of the United States experience wind erosion?
2. Where is the largest area of wind erosion? The second largest?
3. What coastal areas are subject to wind erosion?
MiniLab 8MiniLab 8
Wind Erosion in the United States
Cop
yrig
ht ©
Gle
ncoe
/McG
raw
-Hill
, a d
ivis
ion
of t
he M
cGra
w-H
ill C
ompa
nies
, Inc
.
32 Chapter 8 Earth Science: Geology, the Environment, and the Universe GeoLab and MiniLab Worksheets
Name Class Date
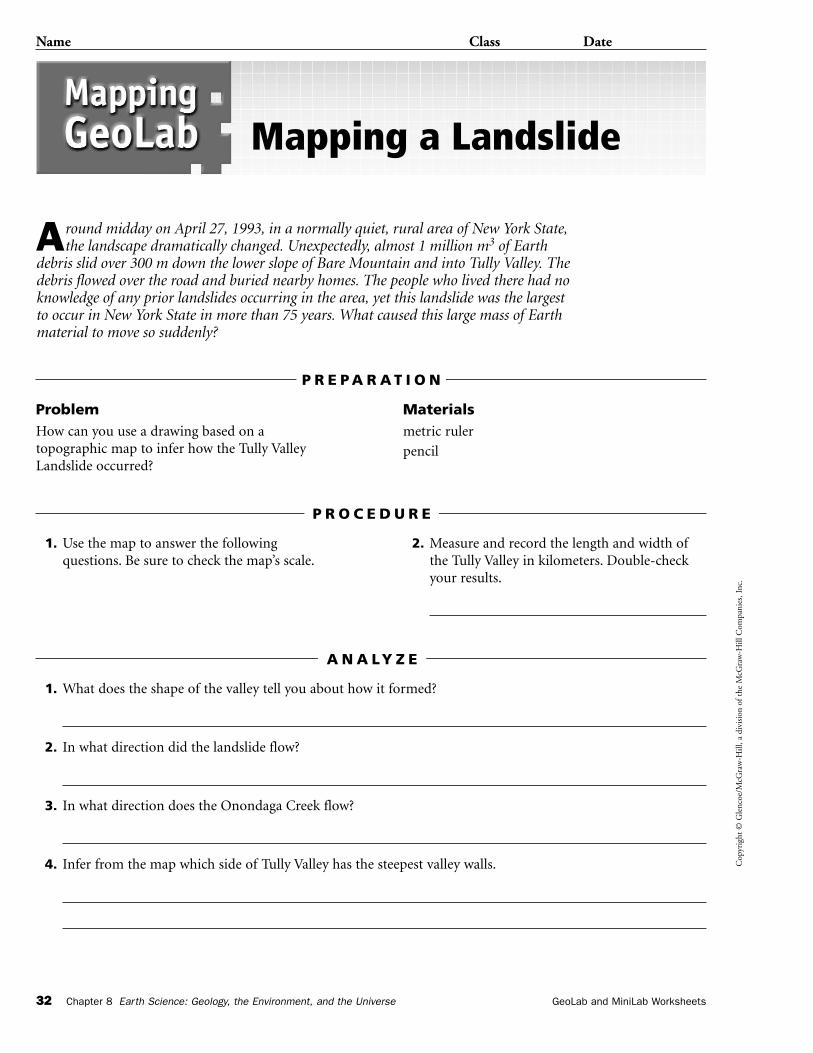
Around midday on April 27, 1993, in a normally quiet, rural area of New York State,the landscape dramatically changed. Unexpectedly, almost 1 million m3 of Earth
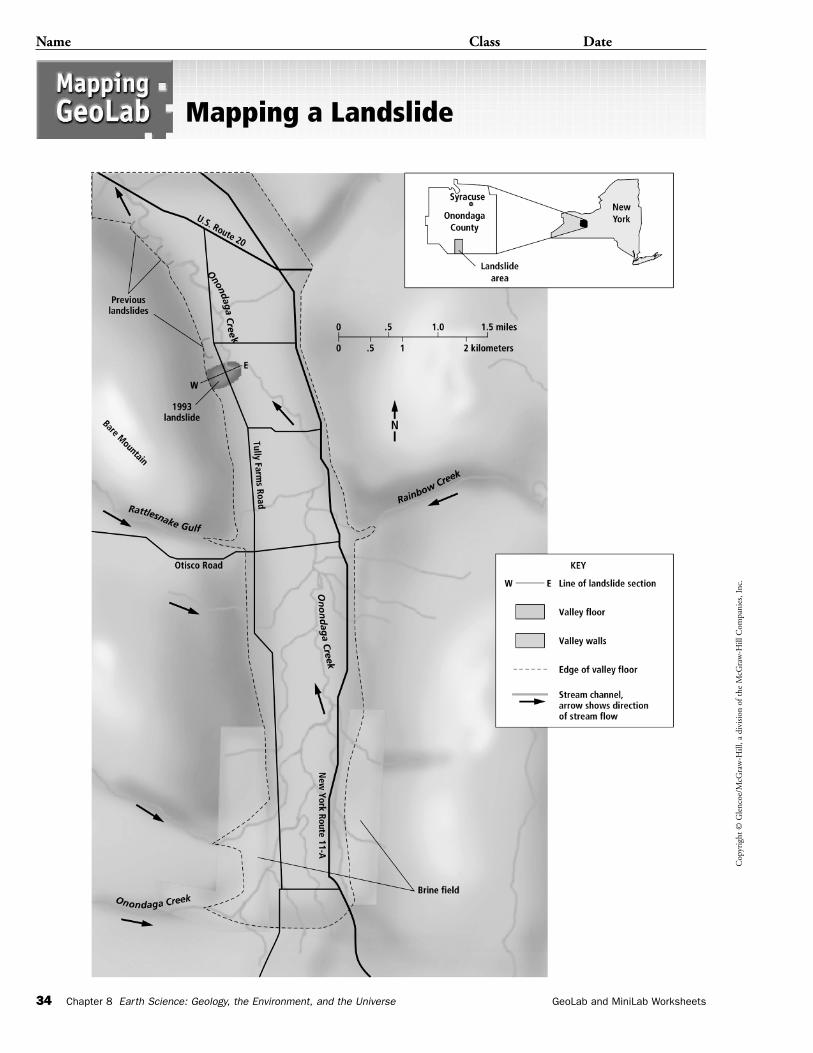
debris slid over 300 m down the lower slope of Bare Mountain and into Tully Valley. Thedebris flowed over the road and buried nearby homes. The people who lived there had noknowledge of any prior landslides occurring in the area, yet this landslide was the largestto occur in New York State in more than 75 years. What caused this large mass of Earthmaterial to move so suddenly?
ProblemHow can you use a drawing based on a topographic map to infer how the Tully ValleyLandslide occurred?
Materials metric ruler
pencil
Mapping a Landslide
P R E P A R A T I O N
1. Use the map to answer the followingquestions. Be sure to check the map’s scale.
2. Measure and record the length and width ofthe Tully Valley in kilometers. Double-checkyour results.
P R O C E D U R E
1. What does the shape of the valley tell you about how it formed?
2. In what direction did the landslide flow?
3. In what direction does the Onondaga Creek flow?
4. Infer from the map which side of Tully Valley has the steepest valley walls.
A N A LY Z E
Cop
yrig
ht ©
Gle
ncoe
/McG
raw
-Hill
, a d
ivis
ion
of t
he M
cGra
w-H
ill C
ompa
nies
, Inc
.
Name Class Date
GeoLab and MiniLab Worksheets Chapter 8 Earth Science: Geology, the Environment, and the Universe 33
Mapping a Landslide
5. What conditions must have been present for the landslide to occur?
6. At the time of the Tully Valley Landslide, the trees were bare. How could this haveaffected the conditions that caused the landslide?
A N A LY Z E
1. Why do you think the Tully Valley Landslide occurred?
2. If you planned to move into an area prone to mass movements, such as landslides,what information would you gather beforehand?
C O N C L U D E A N D A P P LY
Cop
yrig
ht ©
Gle
ncoe
/McG
raw
-Hill
, a d
ivis
ion
of t
he M
cGra
w-H
ill C
ompa
nies
, Inc
.
Name Class Date
34 Chapter 8 Earth Science: Geology, the Environment, and the Universe GeoLab and MiniLab Worksheets
Mapping a Landslide
Cop
yrig
ht ©
Gle
ncoe
/McG
raw
-Hill
, a d
ivis
ion
of t
he M
cGra
w-H
ill C
ompa
nies
, Inc
.
GeoLab and MiniLab Worksheets Chapter 9 Earth Science: Geology, the Environment, and the Universe 35
Name Class Date
Surface materials determine where a lake can form.
Model how different Earth materials may allow lakes to form. Lakes formwhen depressions or low areas fill with water.
Procedure CAUTION: Always wear safety goggles and an apron in the lab.
1. Use three clear, plastic shoe boxes. Half fill each one with earth materials:clay, sand, gravel.
2. Slightly compress the material in each shoe box. Then make a shallowdepression in each surface.
3. Slowly pour 500 mL of water into each of the depressions.
Analyze and Conclude
1. Describe what happened to the 500 mL of water that was added to eachshoe box.
2. How is this activity similar to what actually happens on Earth’s surfacewhen a lake forms?
3. What can you infer about the Earth materials in which lakes mostcommonly form?
MiniLab 9MiniLab 9
Cop
yrig
ht ©
Gle
ncoe
/McG
raw
-Hill
, a d
ivis
ion
of t
he M
cGra
w-H
ill C
ompa
nies
, Inc
.
36 Chapter 9 Earth Science: Geology, the Environment, and the Universe GeoLab and MiniLab Worksheets
Name Class Date
Water in streams flows from areas of higher elevation to areas of lower elevation.The rate of stream flow varies from one stream to another and also in different
areas of the same stream.
ProblemDetermine how slope may affect stream-flow velocity.
Materials1-m length of vinyl gutter pipe
ring stand and clamp
water source with long hose
protractor with plumb bob
sink or container to catch water
stopwatch
grease pencil
meterstick
paper
hole punch
ObjectivesIn this GeoLab, you will:
• Measure the time it takes for water to flowdown a channel at different slopes and depths.
• Organize your data in a table.
• Plot the data on a graph to show how streamvelocity is directly proportional to the streamchannel’s slope and depth.
• Describe the relationship between slope andrate of stream flow.
Safety Precautions
Always wear safety goggles in the lab.
Modeling Stream Velocityand Slope
P R E P A R A T I O N
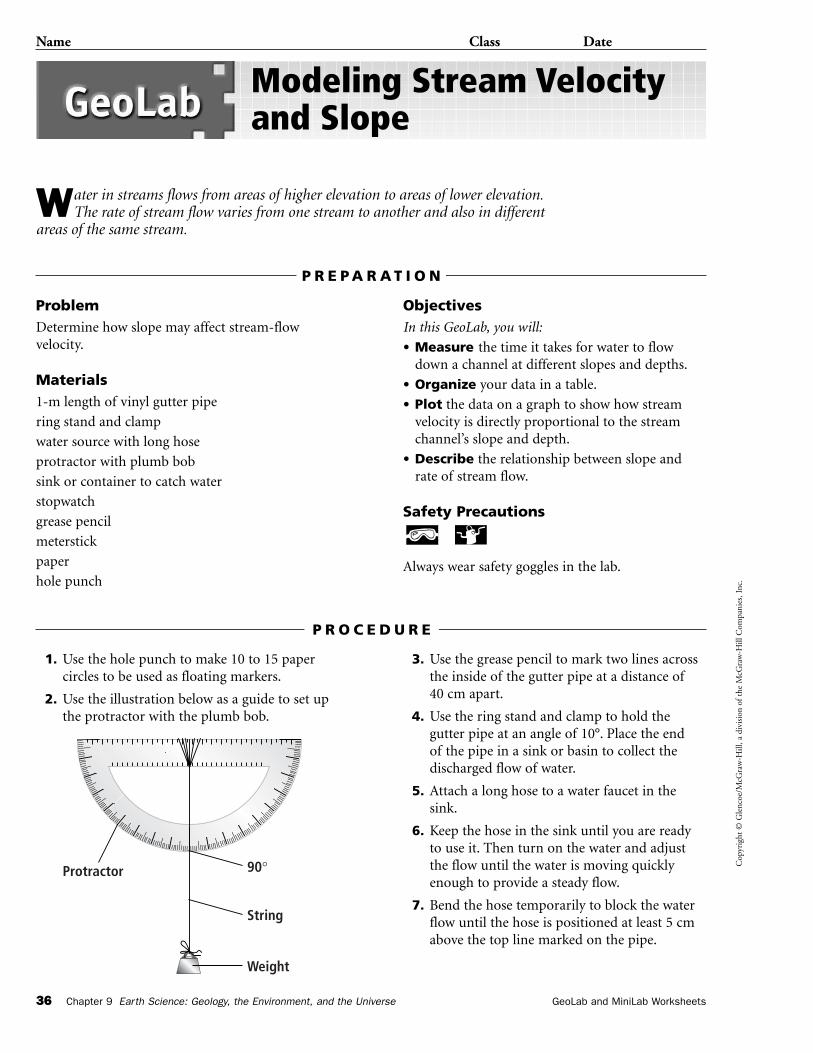
1. Use the hole punch to make 10 to 15 papercircles to be used as floating markers.
2. Use the illustration below as a guide to set upthe protractor with the plumb bob.
3. Use the grease pencil to mark two lines acrossthe inside of the gutter pipe at a distance of40 cm apart.
4. Use the ring stand and clamp to hold thegutter pipe at an angle of 10°. Place the end of the pipe in a sink or basin to collect thedischarged flow of water.
5. Attach a long hose to a water faucet in thesink.
6. Keep the hose in the sink until you are readyto use it. Then turn on the water and adjustthe flow until the water is moving quicklyenough to provide a steady flow.
7. Bend the hose temporarily to block the waterflow until the hose is positioned at least 5 cmabove the top line marked on the pipe.
P R O C E D U R E
String
Protractor
Weight
90°
Cop
yrig
ht ©
Gle
ncoe
/McG
raw
-Hill
, a d
ivis
ion
of t
he M
cGra
w-H
ill C
ompa
nies
, Inc
.
Name Class Date
GeoLab and MiniLab Worksheets Chapter 9 Earth Science: Geology, the Environment, and the Universe 37
Modeling Stream Velocity and Slope
1. Why is it important to keep the water flow constant in this activity?
2. Which variables had to be controlled to avoid errors in your data?
3. Using your graph, predict the velocity of water flow for a 35° slope.
A N A LY Z E
LINE GRAPH
8. Keep the water moving at the same rate offlow for all slope angles being investigated.
9. Drop a floating marker approximately 4 cmabove the top line on the pipe and into theflowing water. Measure the time it takes for thefloating marker to move from the top line tothe bottom line. Record the time in yourscience journal.
10. Repeat step 9 two more times.
11. Repeat steps 9 and 10 but change the slope to20°, then 30°, and then 40°.
12. Make a line graph of the average stream-flowvelocity, using the space below.
P R O C E D U R E
Cop
yrig
ht ©
Gle
ncoe
/McG
raw
-Hill
, a d
ivis
ion
of t
he M
cGra
w-H
ill C
ompa
nies
, Inc
.
Name Class Date
38 Chapter 9 Earth Science: Geology, the Environment, and the Universe GeoLab and MiniLab Worksheets
Modeling Stream Velocity and Slope
1. What is the relationship between the rate of water flow and the angle of the slope?
2. Describe one reason why a stream’s slope might change.
3. Where would you expect to find streams with the highest water-flow velocity?
C O N C L U D E A N D A P P LY
Cop
yrig
ht ©
Gle
ncoe
/McG
raw
-Hill
, a d
ivis
ion
of t
he M
cGra
w-H
ill C
ompa
nies
, Inc
.
GeoLab and MiniLab Worksheets Chapter 10 Earth Science: Geology, the Environment, and the Universe 39
Name Class Date
How does an artesian well work?
Model the changes that an artesian aquifer undergoes when a well is duginto it. What causes the water to rise above the ground surface?
Procedure
CAUTION: Always wear safety goggles and an apron in the lab.
1. Half fill a plastic shoe box or other container with sand. Add enoughwater to saturate the sand. Cover the sand completely with a 1- or 2-cmlayer of clay or a similar impermeable material.
2. Tilt the box at an angle of about 10°. Use a book for a prop.
3. Punch three holes through the clay, one each near the low end, themiddle, and the high end of the box. Insert a clear straw through eachhole into the sand below. Seal the holes around the straws.
Analyze and Conclude
1. Observe the water levels in the straws. Where is the water level thehighest? The lowest?
2. Where is the water table in the box?
3. Where is the water under greatest pressure? Explain.
4. Predict what will happen to the water table and the surface to which thewater flows from one of the straws.
MiniLab 10MiniLab 10
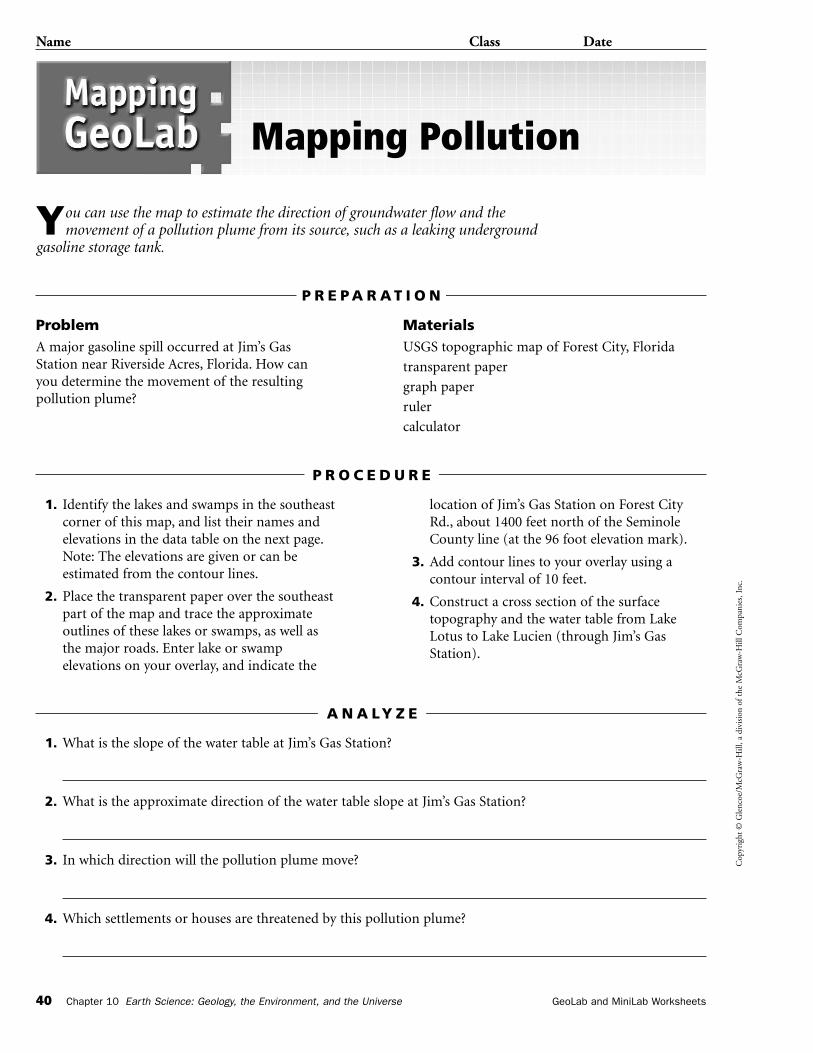
1. What is the slope of the water table at Jim’s Gas Station?
2. What is the approximate direction of the water table slope at Jim’s Gas Station?
3. In which direction will the pollution plume move?
4. Which settlements or houses are threatened by this pollution plume?
A N A LY Z E
Cop
yrig
ht ©
Gle
ncoe
/McG
raw
-Hill
, a d
ivis
ion
of t
he M
cGra
w-H
ill C
ompa
nies
, Inc
.
40 Chapter 10 Earth Science: Geology, the Environment, and the Universe GeoLab and MiniLab Worksheets
Name Class Date
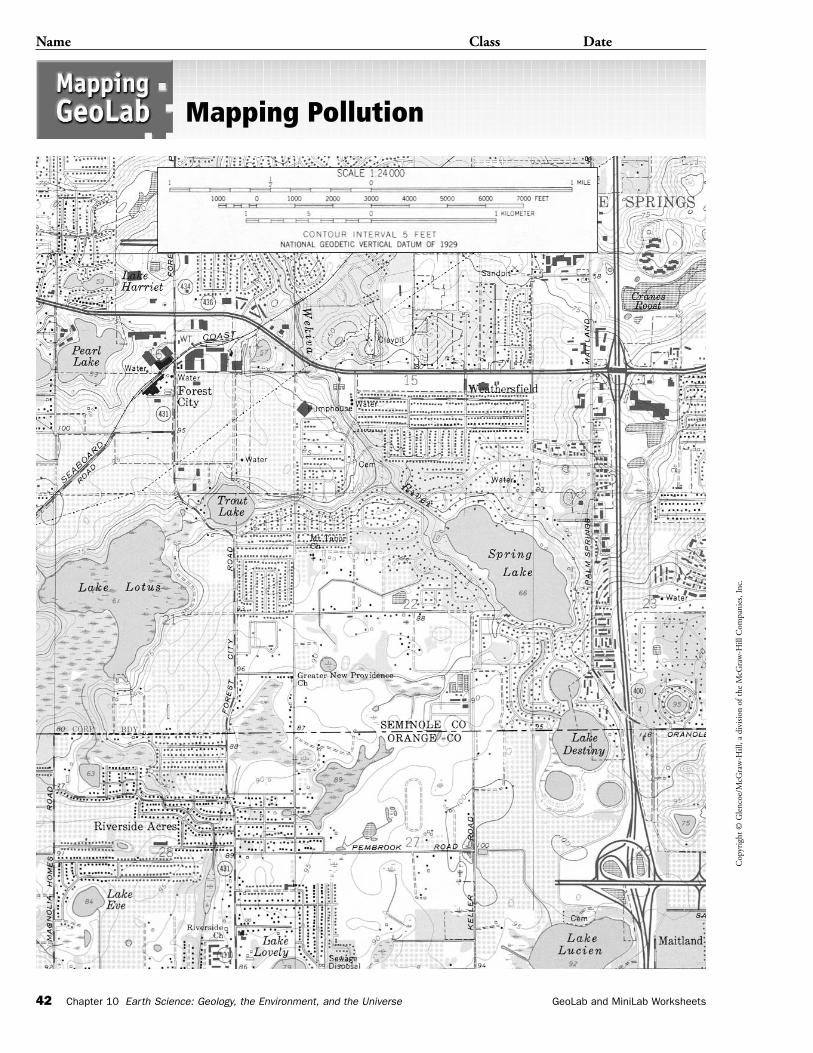
You can use the map to estimate the direction of groundwater flow and themovement of a pollution plume from its source, such as a leaking underground
gasoline storage tank.
ProblemA major gasoline spill occurred at Jim’s Gas Station near Riverside Acres, Florida. How can you determine the movement of the resulting pollution plume?
MaterialsUSGS topographic map of Forest City, Florida
transparent paper
graph paper
ruler
calculator
Mapping Pollution
P R E P A R A T I O N
1. Identify the lakes and swamps in the southeastcorner of this map, and list their names andelevations in the data table on the next page.Note: The elevations are given or can beestimated from the contour lines.
2. Place the transparent paper over the southeastpart of the map and trace the approximateoutlines of these lakes or swamps, as well asthe major roads. Enter lake or swampelevations on your overlay, and indicate the
location of Jim’s Gas Station on Forest CityRd., about 1400 feet north of the SeminoleCounty line (at the 96 foot elevation mark).
3. Add contour lines to your overlay using acontour interval of 10 feet.
4. Construct a cross section of the surfacetopography and the water table from LakeLotus to Lake Lucien (through Jim’s GasStation).
P R O C E D U R E
Cop
yrig
ht ©
Gle
ncoe
/McG
raw
-Hill
, a d
ivis
ion
of t
he M
cGra
w-H
ill C
ompa
nies
, Inc
.
Name Class Date
GeoLab and MiniLab Worksheets Chapter 10 Earth Science: Geology, the Environment, and the Universe 41
Mapping Pollution
1. How far below the surface is the water table in this highest area?
2. What is the relationship of the water table to the surface topography?
C O N C L U D E A N D A P P LY
Name Elevation (in feet)
Cop
yrig
ht ©
Gle
ncoe
/McG
raw
-Hill
, a d
ivis
ion
of t
he M
cGra
w-H
ill C
ompa
nies
, Inc
.
Name Class Date
42 Chapter 10 Earth Science: Geology, the Environment, and the Universe GeoLab and MiniLab Worksheets
Mapping Pollution
Cop
yrig
ht ©
Gle
ncoe
/McG
raw
-Hill
, a d
ivis
ion
of t
he M
cGra
w-H
ill C
ompa
nies
, Inc
.
GeoLab and MiniLab Worksheets Chapter 11 Earth Science: Geology, the Environment, and the Universe 43
Name Class Date
What affects the formation of clouds and precipitation?
Model the water cycle.
Procedure
1. Pour about 125 mL of warm water into a clear, plastic bowl.
2. Loosely cover the top of the bowl with plastic wrap. Overlap the edgesby about 5 cm.
3. Fill a self-sealing plastic bag with ice cubes, seal it, and place it in thecenter of the plastic wrap on top of the bowl. Push the bag of ice downso that the plastic wrap sags in the center, but doesn’t touch the surfaceof the water.
4. Use tape to seal the plastic wrap around the bowl.
5. Observe the surface of the plastic wrap directly under the ice cubes every15 minutes for one hour, or until the ice melts.
Analyze and Conclude
1. What formed on the underside of the wrap? Infer why this happened.
2. Relate your observations to processes in the atmosphere.
3. Predict what would happen if you repeated this activity with hotter water.
MiniLab 11MiniLab 11
Cop
yrig
ht ©
Gle
ncoe
/McG
raw
-Hill
, a d
ivis
ion
of t
he M
cGra
w-H
ill C
ompa
nies
, Inc
.
44 Chapter 11 Earth Science: Geology, the Environment, and the Universe GeoLab and MiniLab Worksheets
Name Class Date
As you go up a mountain, both temperature and air pressure decrease. These effectsare easily explained. Temperature decreases as you get farther away from the
atmosphere’s heat source, Earth’s surface. Pressure decreases as you ascend the mountainbecause there are fewer and fewer particles of air above you. Pressure and temperature,however, are also related through the expansion and compression of air, regardless ofheight. In this activity, you will demonstrate that relationship.
ProblemDemonstrate the relationship between temperatureand pressure.
ObjectivesIn this GeoLab, you will:
• Model the temperature and pressure changes that take place as a result of the expansion and compression of air.
• Relate the changes to processes in the atmosphere.
Materialsclean, clear, plastic 2-L bottle with cap
plastic straws
scissors
thin, liquid-crystal temperature strip
tape
watch or timer
Safety Precautions
Always wear safety goggles and an apron in the lab.
Interpreting Pressure-Temperature Relationships
P R E P A R A T I O N
1. Cut two pieces of straw, each the length of thetemperature strip. Then cut two 2-cm pieces ofstraw. Lay the two long pieces on a table. Placethe two shorter pieces within the space createdby the longer pieces so that the four piecesform a supportive structure for thetemperature strip.
2. Tape the four pieces of straw together. Placethe temperature strip lengthwise upon thestraws. Tape the strip to the straws.
3. Slide the temperature strip-straw assemblyinto the clean, dry bottle. Screw the cap ontightly.
4. Place the sealed bottle on the table so that thetemperature strip faces you and is easy to read.Do not handle the bottle any more than isnecessary so that the temperature inside willnot be affected by the warmth of your hands.
5. Record the temperature of the air inside thebottle as indicated by the temperature strip.
6. Next, position the bottle so that about half itslength extends beyond the edge of the table.Placing one hand on each end of the bottle,push down on both ends so that the bottlebends in the middle. Hold the bottle this way for 2 minutes. During this time, yourpartner should record the temperature every15 seconds.
7. Release the pressure on the bottle. Observeand record the temperature every 15 secondsfor the next 2 minutes.
P R O C E D U R E
Cop
yrig
ht ©
Gle
ncoe
/McG
raw
-Hill
, a d
ivis
ion
of t
he M
cGra
w-H
ill C
ompa
nies
, Inc
.
Name Class Date
GeoLab and MiniLab Worksheets Chapter 11 Earth Science: Geology, the Environment, and the Universe 45
Interpreting Pressure-Temperature Relationships
1. What was the average temperature of the air inside the bottle as you applied pressureto the bottle? How did this differ from the average temperature of the bottled airwhen you released the pressure on the bottle?
2. Make a graph of the temperature changes you recorded throughout the experiment,using the space below.
3. Explain how these temperature changes are related to changes in pressure.
A N A LY Z E
1. Predict how the experiment would change if you took the cap off the bottle.
2. Given your observations and what you know about the behavior of warm air, would youexpect the air over an equatorial desert at midday to be characterized by high or low pressure?
C O N C L U D E A N D A P P LY

Cop
yrig
ht ©
Gle
ncoe
/McG
raw
-Hill
, a d
ivis
ion
of t
he M
cGra
w-H
ill C
ompa
nies
, Inc
.
GeoLab and MiniLab Worksheets Chapter 12 Earth Science: Geology, the Environment, and the Universe 47
Name Class Date
How does the angle of the Sun’s rays differ?
Model the angle at which sunlight reaches Earth’s surface. This angle greatlyaffects the intensity of solar energy received in any one place.
Procedure
1. Hold a flashlight several centimeters above a piece of paper and pointthe flashlight straight down.
2. Use a pencil to trace the outline of the light on the paper. The outlinemodels how the Sun’s rays strike the equator.
3. Keeping the flashlight at the same distance above the paper, tilt the topof the flashlight to roughly a 30° angle.
4. Trace the new outline of the light. This is similar to how the Sun’s raysare received at the poles.
Analyze and Conclude
1. Describe how the outline of the light differed between step 1 and step 3.Explain why it differed.
2. How do you think the change in area covered by the light affects theintensity of light received at any one place?
3. The flashlight models solar radiation striking the surface of Earth.Knowing this, compare how much heat energy is absorbed near theequator and near the poles.
MiniLab 12MiniLab 12
1. What is the contour interval of the isobars?
2. What are the highest and lowest isobars? Where are they located?
3. In which direction are the winds blowing across Texas and Louisiana?
4. What and where are the coldest and warmest temperatures that you can find in thecontinental United States?
A N A LY Z E
Cop
yrig
ht ©
Gle
ncoe
/McG
raw
-Hill
, a d
ivis
ion
of t
he M
cGra
w-H
ill C
ompa
nies
, Inc
.
48 Chapter 12 Earth Science: Geology, the Environment, and the Universe GeoLab and MiniLab Worksheets
Name Class Date
It’s time to put your knowledge of meteorology into action. The surface weather map on the following page shows actual weather data for the United States. In this activity,
you will use the station models, isobars, and pressure systems on the map to forecast the weather.
ProblemHow can you use a surface weather map to inter-pret information about current weather and toforecast future weather?
Materialspencil
ruler
Interpreting a Weather Map
P R E P A R A T I O N
1. The map scale is given in nautical miles. Referto the scale when calculating distances.
2. The unit for isobars is millibars (mb). Instation models, pressure readings are
abbreviated. For example, 1021.9 mb is plottedon a station model as 219 but read as 1021.9.
3. Wind shafts point in the direction from whichthe wind is blowing.
P R O C E D U R E
Cop
yrig
ht ©
Gle
ncoe
/McG
raw
-Hill
, a d
ivis
ion
of t
he M
cGra
w-H
ill C
ompa
nies
, Inc
.
Name Class Date
GeoLab and MiniLab Worksheets Chapter 12 Earth Science: Geology, the Environment, and the Universe 49
Interpreting a Weather Map
1. Would you expect the weather in Georgia and Florida to be clear or rainy? Why?
2. Both of the low-pressure systems in eastern Canada and off the Oregon coast aremoving toward the east at about 15 mph. What kind of weather would you predict forOregon and for northern New York for the next few hours? Explain.
C O N C L U D E A N D A P P LY
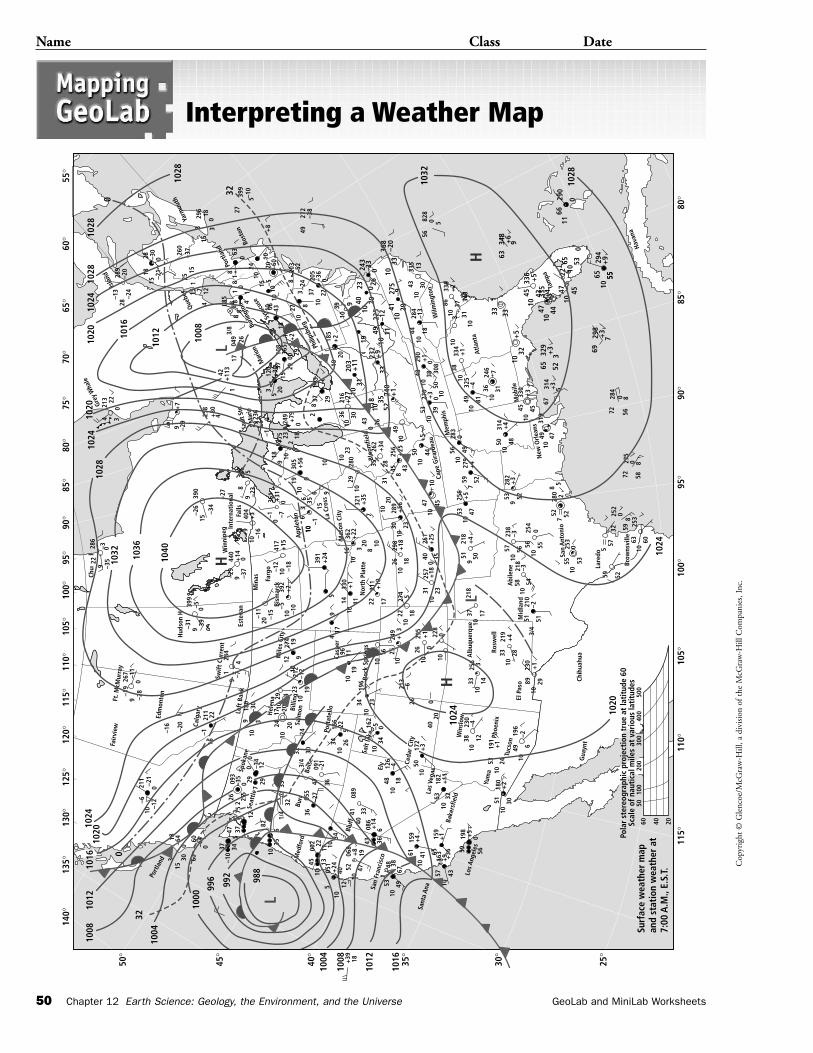
Cop
yrig
ht ©
Gle
ncoe
/McG
raw
-Hill
, a d
ivis
ion
of t
he M
cGra
w-H
ill C
ompa
nies
, Inc
.
Name Class Date
50 Chapter 12 Earth Science: Geology, the Environment, and the Universe GeoLab and MiniLab Worksheets
Interpreting a Weather MapFt
. McM
urra
y
Hava
na
Fair
view
Port
land
Edm
onto
n
Calg
ary
Left
Ban
k
Burr
Med
ford
Bluf
f
Salt
lake
San
Fran
cisc
o
Sant
a An
a
Los A
ngel
es
Bake
rsfie
ld
Yum
a
Tucs
on
Phoe
nix
Win
slow
El P
aso
Gua
ynt
Chih
uah u
a
L ar e
d o
B ro w
n sv i
l le
Bois
e
Port
atel
lo
Rock
Spr
ings
Nor
th P
latt
e
Cape
Gira
rdea
u
Bloo
mfie
ld Mem
phis
Atl
anta
Wilm
ingt
on
Mas
on C
ity
Salm
on
Ceda
r Ci
ty
Ely
Las
Vega
s
Hel
ena
Spok
ane
Mile
s Ci
ty
Billi
ng
–19
–16
–6
315
30
18–6
4
–6460
–10
3437–4
7 37
82
4500
2
089
086
48 3867
5310
6110
10
41
159 159
103253
18210
50+
340
172
–6213
26 020
+11
198
59 56
52
106063
5957
5
252
5880
7227
5
284
6929
8
557
5510
10
6529
4
00
1166
290
+9
+3
72 5680
32 59 2538
0
5118
010
53+
119
1
101238
230
–4
4910
6–219
6
8910
29
+2
2410
30
0+5
6516
3+
910
+36
+1
4357
+4
1048 18
–4126
1034
162
23
196
2231
1
11
174
+1
330
14
391
362
321
+35
1029
28010
23
3526
2+
34
256
+25
1049
7
16+
22103
610
19
–910
305
+56
18
035
6
+24
59 10
+10
17
1022
274
1018
10
10
10
8203
23
289
1020
31
+56
2629
8+
1830
518
2629
5+
1 228
3125
740
1047
1050
+5
4410
438
4528
45
519
50+
421
810
4753
251
+18
035
1023
+25
10 10
3310
14
3310
219
28
230
+1
3/4
515121
010
54–3
58
105355
0253
7 5252
52
52+
427910
490
5628
3
39100+3
50
38
4932
51033
410+
110
5031
4+
41053
270
1048
290
0+1
1018
–13
4310
301333
53336
8–2
0
56
63
4533
6+
5
+4 47 45
22 –665
1053
1047
348
+6
9
828
0 5
0 10
38 308
256
759
+5
953
282
10
1045
1033
+5
10
1086
338
348
37+
2
313
33
32
3110
3624
6
–4
7
81
45
6731
4+
365
329
1044
43 335
+3
352
5
330 3
47
4810
4931
9
+3
280
82
5
21810
57 56
238
–3 254
5610
550
–2
+4
256
3710
17
218
3
0
0
10
1016 25
1024
9 3+
19
96 11
1034
–5 0
49
+14
366
33
2210
510
1311 10
1240
1047
43
068
+8
051
52
19
+24
34
4140
1035
61/
432
3605
5–2
7–2
1
1034 26
–22
166
5
091
3/4
32 3047 3633
12
5
600 0
211
–21
–12
100
–1–20
267
1024
9 –28
–11
–31
–26
15–3
4
838
69–2
7
–23
5
390
–29
258
+80
4
1
42+
113
173/
8
4 085
18
81
10
4
12151
2515
157
88
88
804
9 26
+7
9
399
284
1
211
1622
093
–35
292900
0–3
412
7
26
525
752
910
2910
24 20
101923
21210
–12
91227
4
–11
20–1
5 –510 –1
0
392
–12
41710
+9
404
–136
1
6
–110
1510
–1
+75 23
249
+7923
6
312
0
15+30
37 2900
365
29+
2
18–4
3
10
108
83
–24
37
185
+2
2706
10
10
15 –520
10–6
0
203
–52
4927
2–3
820
5
022
1039 9
10
–12
102041
275
–9
284
44
2022
5
2324
333
–36
40
260
1010
110
85 20
218
3621
6+
27
31
1020
203
+11
1030
430
3610
3524
0+
15211
823
210
1149+
9
19
33
10
0
0
28
29
115
37
9
+31
–70
0+3
–16
+15
–18
10+
219
–20
1710
4
–24
3
180
–30
9–7
4
–5
–29
–37
0440
+14
9
09
39
0
Chur
chill
2228
6Gr
ey W
hale
Isla
nd
Queb
ecYa
rmou
th
Bost
on
Syra
cuse
9 –35
–34
213 22
–13
–20
1518
28 260
296
18 2763
240
+8
399
–10
5
033
–37
–30
0–2
1
–24
2828
90
3
0
Hud
son
H
Inte
rnat
iona
lFa
lls
La C
ross
App
leto
n
Win
nipe
g
Saul
t Ste
.
Mar
ie
Mar
ion Ph
ilips
burg
Este
van Bi
smar
ck
Swift
Cur
rent
Min
as Farg
o
Casp
er
Alb
uque
rque
Rosw
ell
Mid
land
San
Ant
onio
Mob
ile
Tam
paN
ew O
rlea
ns
Abi
lene
+39 18
1028
1032
1024
1020
0
1016
1012
1008
1024
1016
1012
1008
1004
1004
32
1000
996
992 988
1020
1036
1040
1008
1032
1028
1024
1020
1020 10
16
1028
32
1012
1024
1028
1028
0
95°
100°
105°
110°
115°
120°
125°
130°
135°
140°
90°
85°
75°
70°
65°
60°
55°
80°
85°
90°
95°
100°
105°
110°
115°
25°
30°
40°
45°
50°
80°
35°
Seat
tle
Port
land
Burli
ngto
n
5060 40 20
100
Scal
e of
nau
tica
l mile
s at
var
ious
lati
tude
sPo
lar
ster
eogr
aphi
c pr
ojec
tion
tru
e at
lati
tude
60
Surf
ace
wea
ther
map
and
stat
ion
wea
ther
at
7:00
A.M
., E.
S.T.
200
300
400
500
H
H
HL
L
L
Cop
yrig
ht ©
Gle
ncoe
/McG
raw
-Hill
, a d
ivis
ion
of t
he M
cGra
w-H
ill C
ompa
nies
, Inc
.
GeoLab and MiniLab Worksheets Chapter 13 Earth Science: Geology, the Environment, and the Universe 51
Name Class Date
How can mild rains cause floods?
Model the effects of repeated, slow-moving storms that drop rain over thesame area for a long period of time.
Procedure
1. Place an ice-cube tray on the bottom of a large sink or tub.
2. Pour water into a clean, plastic dishwashing-detergent bottle until it is two-thirds full. Replace the cap on the bottle.
3. Hold the bottle upside down with the cap open about 8 cm aboveone end of the ice-cube tray. Gently squeeze the bottle to maintain aconstant flow of water into the tray. Slowly move the bottle from oneend of the tray to the other over the course of 30 seconds. Try to putapproximately equal amounts of water in each ice-cube compartment.
4. Measure the depth of water in each compartment. Calculate the average depth.
5. Repeat steps 1–4, but move the bottle across the ice-cube tray in 15 seconds.
Analyze and Conclude
1. How did the average depth of the water differ in steps 4 and 5? How might you account for the difference?
2. Based on these results, infer how the speed of a moving storm affects theamount of rain received in any one area.
3. How could you alter the experiment to simulate different rates of rainfall?
MiniLab 13MiniLab 13
Cop
yrig
ht ©
Gle
ncoe
/McG
raw
-Hill
, a d
ivis
ion
of t
he M
cGra
w-H
ill C
ompa
nies
, Inc
.
52 Chapter 13 Earth Science: Geology, the Environment, and the Universe GeoLab and MiniLab Worksheets
Name Class Date
Hurricanes are violent storms. That’s why it’s important to have plenty of advancewarning before they hit land. By tracking the changing position of a storm on a
chart and connecting these positions with a line, you can determine a hurricane’s path.
ProblemWhat information can you obtain by studying thepath of a hurricane?
HypothesisUse the Internet to gather information about thepath of a hurricane. Form a hypothesis abouthow the hurricane’s path can be used to predict thestrength of the storm and where most damagemight be inflicted.
ObjectivesIn this GeoLab, you will:
• Gather and communicate data about hurricanes.
• Plot data on a hurricane-tracking chart.
• Predict where storm-inflicted damagemight occur.
Data Sources
Go to the Glencoe Science Web Site at to find links to
hurricane data on the Internet, or use information provided by your teacher.Make copies of the hurricane-tracking chart in this lab or download a chart from the Web Site.
science.glencoe.com
Tracking a Hurricane
P R E P A R A T I O N
1. Draw a data table in the space provided on thenext page. Incorporate your research into thetable. Add any additional information that youthink is important.
2. Go to the Glencoe Science Web Site atto post your data.
3. Visit sites listed on the Glencoe ScienceWeb Site for information on other majorhurricanes.
science.glencoe.com
P R O C E D U R E
P L A N T H E E X P E R I M E N T
1. Find a resource that lists major hurricanes thathave occurred within the past five years. TheGlencoe Science Web Site provides a list ofsites that have information about hurricanes.
2. Choose a hurricane to research. Some recentmajor hurricanes include Hurricane Georges,Hurricane Fran, and Hurricane Bertha.
3. Gather data about the hurricane from the linkson the Glencoe Science Web Site or the library.
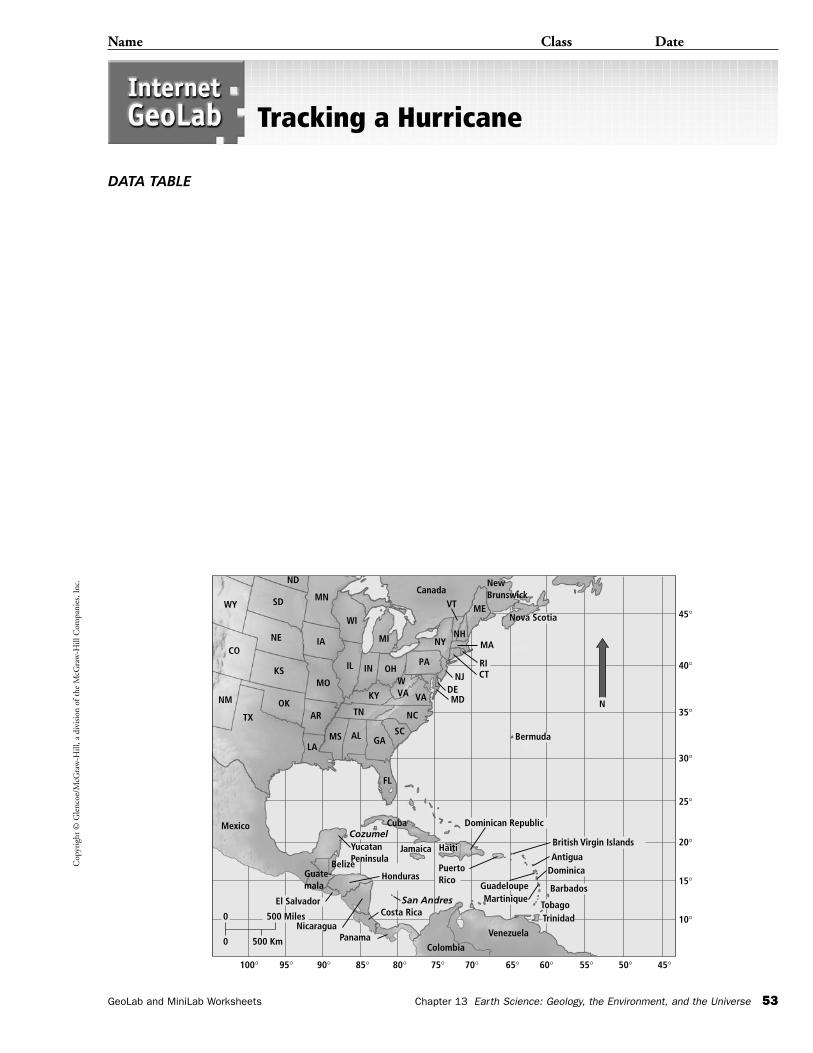
Cop
yrig
ht ©
Gle
ncoe
/McG
raw
-Hill
, a d
ivis
ion
of t
he M
cGra
w-H
ill C
ompa
nies
, Inc
.
Name Class Date
GeoLab and MiniLab Worksheets Chapter 13 Earth Science: Geology, the Environment, and the Universe 53
Tracking a Hurricane
DATA TABLE
500 Km0
500 Miles
45°
40°
35°
30°
25°
20°
15°
10°
60°65°70°75°80°85°90°95°100°
Bermuda
Canada
Nova ScotiaME
NHMANY
PAOH
VT
NewBrunswick
0
NKY
WVA VA
NC
SCGAAL
FL
Cozumel
Belize
WY
CO
NM
TX
Mexico
YucatanPeninsula
Guate-mala
Nicaragua
Honduras
Costa Rica
PanamaColombia
Venezuela
Cuba
Haiti
PuertoRico
British Virgin Islands
Barbados
Dominica
TobagoTrinidad
Antigua
GuadeloupeMartinique
Dominican Republic
Jamaica
San Andres
OKAR
ND
SD
NE
KS
LAMS
MN
WI
IA
MO
IL IN
MI
RI
El Salvador
55° 50° 45°
CTNJDEMD
TN
Cop
yrig
ht ©
Gle
ncoe
/McG
raw
-Hill
, a d
ivis
ion
of t
he M
cGra
w-H
ill C
ompa
nies
, Inc
.
Name Class Date
54 Chapter 13 Earth Science: Geology, the Environment, and the Universe GeoLab and MiniLab Worksheets
Tracking a Hurricane
Sharing Your Data Find this Internet GeoLab on the Glencoe Science Web Site atPost your data in the table provided for this activity. Use the additional
data from other students to complete your chart and answer the Conclude and Apply questions.
1. Plot the position, air pressure, wind speed, and stage of the hurricane at six-hourintervals throughout its existence.
2. Plot the changing position of the hurricane on your hurricane-tracking chart.
3. What was the maximum wind speed in knots that the hurricane reached?
4. Multiply the value from question 3 by 1.15 to find the wind speed in miles per hour.Based on this value, how would the hurricane be classified on the Saffir-Simpson scale?
5. Using your completed hurricane-tracking chart, list the landmasses over which the hurricane passed.
6. Where would you expect the storm surge to have been greatest? Explain. Compare your answer to the information you gathered on the damage inflicted by the storm. Was your answer correct?
7. How was the hurricane’s strength affected when its center passed over land?
science.glencoe.com.
C O N C L U D E A N D A P P LY
Cop
yrig
ht ©
Gle
ncoe
/McG
raw
-Hill
, a d
ivis
ion
of t
he M
cGra
w-H
ill C
ompa
nies
, Inc
.
GeoLab and MiniLab Worksheets Chapter 14 Earth Science: Geology, the Environment, and the Universe 55
Name Class Date
How does the atmosphere affect the transfer of energy?
Model the greenhouse effect.
Procedure
1. On a clear day, place a cardboard box outside in a shaded area. Prop two thermometersagainst the box. Make sure the thermometers are not in direct sun.
2. Cover one thermometer with a clean glass jar.
3. Observe and record the temperature changes of each thermometer every 2 minutes over a 30-minute period.
Analyze and Conclude
1. Make a graph showing how the temperatures of the two thermometers changed over time, using the space below.
2. Based on your graph, which thermometer experienced the greatest increase in temperature? Why?
3. Relate your observations to the greenhouse effect in the atmosphere.
MiniLab 14MiniLab 14
Cop
yrig
ht ©
Gle
ncoe
/McG
raw
-Hill
, a d
ivis
ion
of t
he M
cGra
w-H
ill C
ompa
nies
, Inc
.
56 Chapter 14 Earth Science: Geology, the Environment, and the Universe GeoLab and MiniLab Worksheets
Name Class Date
Microclimates can be caused by tall buildings, large bodies of water, and mountains,among other things. In this activity, you’ll observe different microclimates and then
attempt to determine which factors strengthen microclimates and how these factorschange with distance from Earth’s surface.
ProblemWhich type of surface creates the most pronouncedmicroclimate?
Possible Materials
thermometerpsychrometer
paper strip or wind sock
meterstick
relative humidity chart (Appendix F)
HypothesisHypothesize how different areas of Earth’s surface,such as grassy lawns, asphalt parking lots, and bod-ies of water, affect local climates. Consider alsowhether distance from the ground might affecttemperature, relative humidity, and wind speed.
ObjectivesIn this GeoLab, you will:
• Design and carry out an experiment to studymicroclimates both at Earth’s surface and aboveits surface.
• Observe and record temperature, relativehumidity, and wind speed.
• Infer how different surfaces and changes inheight above these surfaces affect microclimates.
Safety Precautions
Be careful when you handle glass thermometers,especially those that contain mercury. If the ther-mometer breaks, do not touch it. Have your teacherproperly dispose of the glass and the mercury.
Microclimates
P R E P A R A T I O N
1. As a group, write out your hypothesis. List thesteps needed to test your hypothesis. Include inyour plan how you will use your equipment tomeasure temperature, relative humidity, andwind speed at different surfaces and at variousheights above these surfaces.
2. Select your sites. Possible sites include a grassyplayground area, a paved parking lot, and aswimming pool.
3. Be sure to control variables. For instance,different members of your group should makeobservations at each site at the same timeof day. You’ll also need to record weathervariables at several different distances aboveeach surface. Possible distances include 5 cm,1 m, and 2 m.
4. Make a map of your test sites. Design andconstruct data tables for recording yourobservations. You’ll need separate data tablesfor each site. Draw your map and data tablesin the space on the next page.
P R O C E D U R E
Cop
yrig
ht ©
Gle
ncoe
/McG
raw
-Hill
, a d
ivis
ion
of t
he M
cGra
w-H
ill C
ompa
nies
, Inc
.
Name Class Date
GeoLab and MiniLab Worksheets Chapter 14 Earth Science: Geology, the Environment, and the Universe 57
Microclimates
MAPS, GRAPHS, AND DATA TABLE
5. Read over your entire plan to make certain allsteps are in logical order. Identify constantsand variables in your plan.
6. Make sure your teacher approves your planbefore you proceed with your experiment.
7. Carry out your plan.
P R O C E D U R E
Cop
yrig
ht ©
Gle
ncoe
/McG
raw
-Hill
, a d
ivis
ion
of t
he M
cGra
w-H
ill C
ompa
nies
, Inc
.
Name Class Date
58 Chapter 14 Earth Science: Geology, the Environment, and the Universe GeoLab and MiniLab Worksheets
Microclimates
1. Comparing and Contrasting Map your data. Color code the areas on yourmap to show which surfaces had the highest and lowest temperatures, the highest andlowest relative humidity, and the greatest and least wind speed. On your map, includedata for surface areas only.
2. Making and Using Graphs Graph your data for each site, showing differencesin temperature with height. Plot temperature on the x-axis and height on the y-axis.Repeat this step for relative humidity and wind speed.
3. Interpreting Scientific Illustrations Analyze your maps, graphs, and data tofind patterns. Which surfaces had the most pronounced microclimates? Did heightabove the surface affect your data? Infer why or why not.
4. Thinking Critically Analyze your hypothesis and the results of your experiment.Was your hypothesis supported? Explain.
A N A LY Z E
1. Why did some areas have more pronounced microclimates than others? Which factorsseemed to contribute most to the development of microclimates?
2. Which variable changed most with height: temperature, relative humidity, or wind speed? Which variable changed least? Infer why some variables changed more than others with height.
C O N C L U D E A N D A P P LY
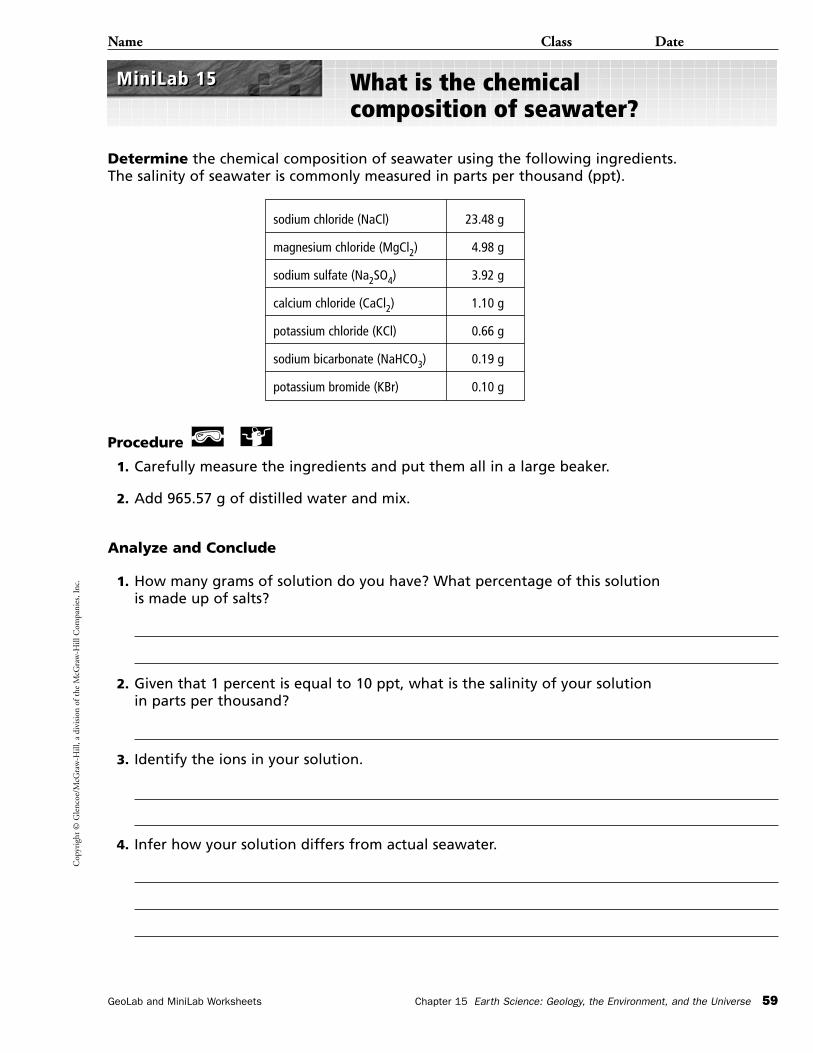
Cop
yrig
ht ©
Gle
ncoe
/McG
raw
-Hill
, a d
ivis
ion
of t
he M
cGra
w-H
ill C
ompa
nies
, Inc
.
GeoLab and MiniLab Worksheets Chapter 15 Earth Science: Geology, the Environment, and the Universe 59
Name Class Date
What is the chemical composition of seawater?
Determine the chemical composition of seawater using the following ingredients.The salinity of seawater is commonly measured in parts per thousand (ppt).
Procedure
1. Carefully measure the ingredients and put them all in a large beaker.
2. Add 965.57 g of distilled water and mix.
Analyze and Conclude
1. How many grams of solution do you have? What percentage of this solution is made up of salts?
2. Given that 1 percent is equal to 10 ppt, what is the salinity of your solution in parts per thousand?
3. Identify the ions in your solution.
4. Infer how your solution differs from actual seawater.
MiniLab 15MiniLab 15
sodium chloride (NaCl) 23.48 g
magnesium chloride (MgCl2) 4.98 g
sodium sulfate (Na2SO4) 3.92 g
calcium chloride (CaCl2) 1.10 g
potassium chloride (KCl) 0.66 g
sodium bicarbonate (NaHCO3) 0.19 g
potassium bromide (KBr) 0.10 g
Cop
yrig
ht ©
Gle
ncoe
/McG
raw
-Hill
, a d
ivis
ion
of t
he M
cGra
w-H
ill C
ompa
nies
, Inc
.
60 Chapter 15 Earth Science: Geology, the Environment, and the Universe GeoLab and MiniLab Worksheets
Name Class Date
The water in the oceans is layered because water masses with higher densities sinkbelow those with lower densities. The density of seawater depends on its temperature
and salinity. In this activity, you’ll model different types of water masses to observe theeffects of density firsthand.
ProblemDetermine how changes in salinity and tempera-ture affect water density.
Materialsscale
graduated 500-mL cylinder
100-mL glass beakers (4)
water
red, yellow, and blue food coloring
salt
thermometer
eyedropper
graph paper
pencil
ruler
calculator
ObjectivesIn this GeoLab you will:
• Compare and contrast the movement ofdifferent water samples.
• Determine the relative densities of the watersamples.
• Predict the arrangement of layers in a body of water.
• Construct and interpret a temperature profile.
Safety Precautions
Always wear safety goggles and an apron in the lab.Wash your hands after completing the lab.
Modeling Water Masses
P R E P A R A T I O N
1. Mix 200 mL of water and 7.5 g of salt in thegraduated cylinder. Pour equal amounts of thesalt solution into two beakers. Fill each of thetwo other beakers with 100 mL of freshwater.
2. Put a few drops of red food coloring in one ofthe salt solutions. Put a few drops of yellowfood coloring in the other salt solution. Put afew drops of blue food coloring in one of thebeakers of freshwater. Do not add foodcoloring to the other beaker of freshwater.
3. Place the beakers with the red salt solution andthe blue freshwater in the refrigerator.Refrigerate them for 30 minutes.
4. Measure and record the temperature of thewater in all four beakers.
5. Put several drops of the cold, red saltwater into the beaker with the warm, yellowsaltwater and observe what happens. Recordyour observations.
6. Put several drops of the cold, blue freshwaterinto the beaker with the warm, clear freshwaterand observe what happens. Record yourobservations.
7. Put several drops of the cold, blue freshwaterinto the beaker with the warm, yellowsaltwater and observe what happens.Record your observations.
P R O C E D U R E
Cop
yrig
ht ©
Gle
ncoe
/McG
raw
-Hill
, a d
ivis
ion
of t
he M
cGra
w-H
ill C
ompa
nies
, Inc
.
Name Class Date
GeoLab and MiniLab Worksheets Chapter 15 Earth Science: Geology, the Environment, and the Universe 61
Modeling Water Masses
1. In your science journal, describe the movement of the cold, red saltwater in step 5.Compare this to the movement of the cold, blue freshwater in step 7. What accountsfor the differences you observed?
2. Based on your observations, list the water samples by color in order of increasing density.
3. If you poured the four water samples into the graduated cylinder, how would theyarrange themselves into layers by color, from top to bottom?
A N A LY Z E
1. Assume that four water masses in a large body of water have the same characteristicsas the water in the four beakers. The warm water layers are 100 m thick, and the coldlayers are 1000 m thick. Graph the temperature profile of the large body of water.
C O N C L U D E A N D A P P LY
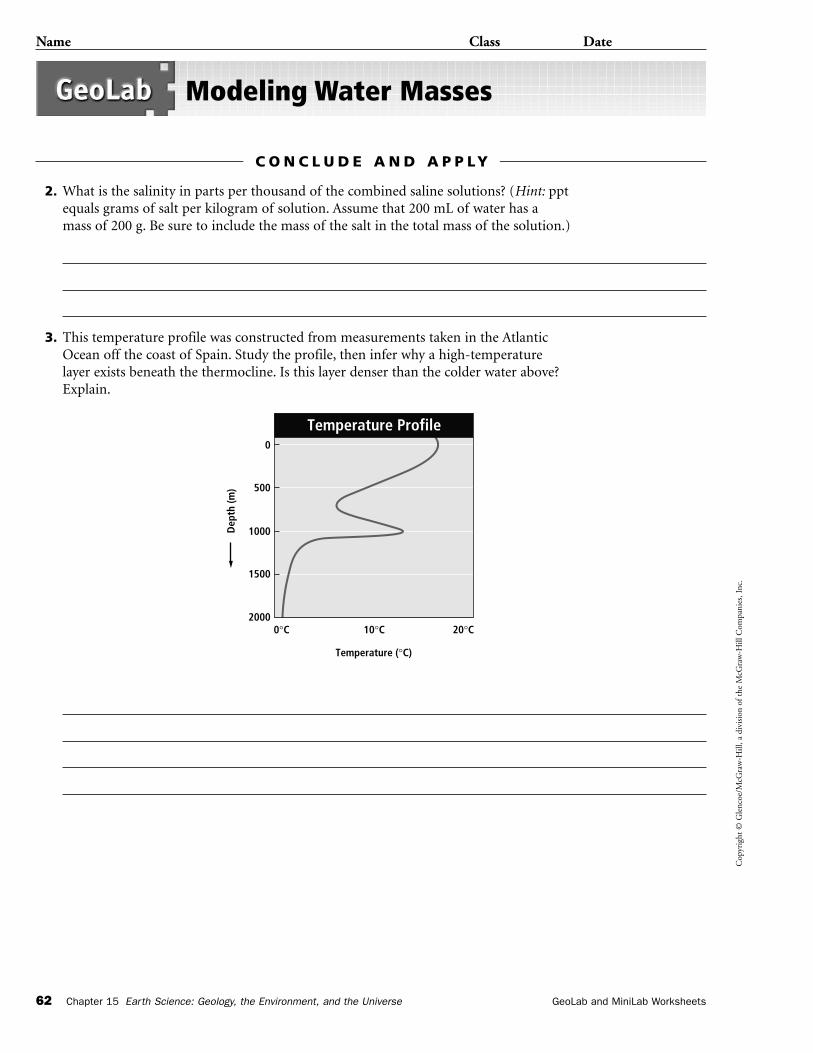
Cop
yrig
ht ©
Gle
ncoe
/McG
raw
-Hill
, a d
ivis
ion
of t
he M
cGra
w-H
ill C
ompa
nies
, Inc
.
Name Class Date
62 Chapter 15 Earth Science: Geology, the Environment, and the Universe GeoLab and MiniLab Worksheets
Modeling Water Masses
C O N C L U D E A N D A P P LY
2. What is the salinity in parts per thousand of the combined saline solutions? (Hint: pptequals grams of salt per kilogram of solution. Assume that 200 mL of water has amass of 200 g. Be sure to include the mass of the salt in the total mass of the solution.)
3. This temperature profile was constructed from measurements taken in the AtlanticOcean off the coast of Spain. Study the profile, then infer why a high-temperaturelayer exists beneath the thermocline. Is this layer denser than the colder water above?Explain.
1000
2000
1500
500
Temperature Profile
Dep
th (m
)
Temperature (°C)
0
0°C 10°C 20°C
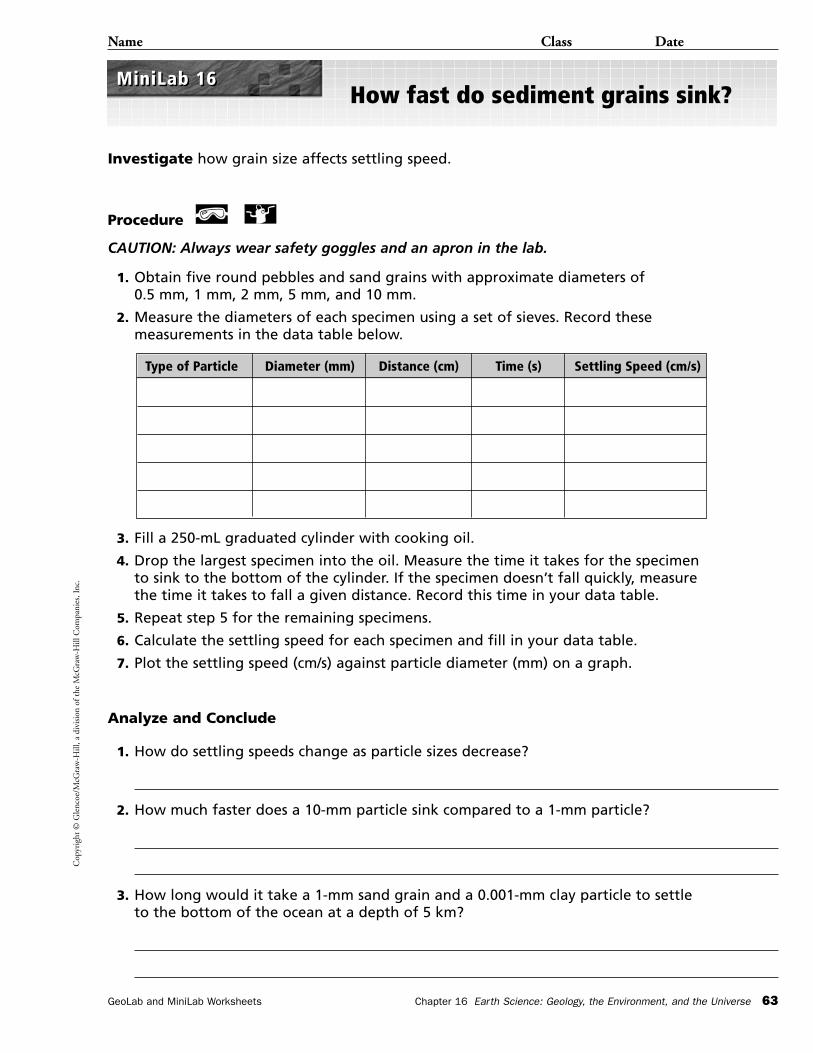
Cop
yrig
ht ©
Gle
ncoe
/McG
raw
-Hill
, a d
ivis
ion
of t
he M
cGra
w-H
ill C
ompa
nies
, Inc
.
GeoLab and MiniLab Worksheets Chapter 16 Earth Science: Geology, the Environment, and the Universe 63
Name Class Date
How fast do sediment grains sink?
Investigate how grain size affects settling speed.
Procedure
CAUTION: Always wear safety goggles and an apron in the lab.
1. Obtain five round pebbles and sand grains with approximate diameters of 0.5 mm, 1 mm, 2 mm, 5 mm, and 10 mm.
2. Measure the diameters of each specimen using a set of sieves. Record these measurements in the data table below.
3. Fill a 250-mL graduated cylinder with cooking oil.
4. Drop the largest specimen into the oil. Measure the time it takes for the specimen to sink to the bottom of the cylinder. If the specimen doesn’t fall quickly, measure the time it takes to fall a given distance. Record this time in your data table.
5. Repeat step 5 for the remaining specimens.
6. Calculate the settling speed for each specimen and fill in your data table.
7. Plot the settling speed (cm/s) against particle diameter (mm) on a graph.
Analyze and Conclude
1. How do settling speeds change as particle sizes decrease?
2. How much faster does a 10-mm particle sink compared to a 1-mm particle?
3. How long would it take a 1-mm sand grain and a 0.001-mm clay particle to settle to the bottom of the ocean at a depth of 5 km?
MiniLab 16MiniLab 16
Type of Particle Diameter (mm) Distance (cm) Time (s) Settling Speed (cm/s)
1. What kind of coastal landform is the Morro Rock Peninsula?
2. What kind of feature is Pillar Rock, and how was it formed?
3. On what coastal feature is Morro Bay State Park located? How was the feature formed?
4. What are the irregular sand hills in Morro Bay State Park?
A N A LY Z EC
opyr
ight
© G
lenc
oe/M
cGra
w-H
ill, a
div
isio
n of
the
McG
raw
-Hill
Com
pani
es, I
nc.
64 Chapter 16 Earth Science: Geology, the Environment, and the Universe GeoLab and MiniLab Worksheets
Name Class Date
Topographic maps of coastal areas show a two-dimensional representation of coastallandforms. You can identify an emergent coast by the landforms along the coastline
as well as landforms found inland.
ProblemHow can you identify and describe the coastallandforms of an emergent coast on a topographicmap?
Materialsmetric ruler
graph paper
drafting compass
calculator
pencil
Identifying CoastalLandforms
P R E P A R A T I O N
1. Determine the map scale and the contourinterval.
2. On the inset map, plot a west-east crosssection of the coast just north of Islay Creekfrom the 60 ft depth contour to a point5000 feet inland. Use a scale of 1:24 000and a vertical exaggeration of 4.
3. Use both maps to answer the followingquestions.
P R O C E D U R E
Cop
yrig
ht ©
Gle
ncoe
/McG
raw
-Hill
, a d
ivis
ion
of t
he M
cGra
w-H
ill C
ompa
nies
, Inc
.
Name Class Date
GeoLab and MiniLab Worksheets Chapter 16 Earth Science: Geology, the Environment, and the Universe 65
Identifying Coastal Landforms
A N A LY Z E
1. Is this portion of the California coast emergent or submergent? What features of thiscoastline provide evidence for your answer?
C O N C L U D E A N D A P P LY
5. What is the direction of the longshore transport along Morro Bay? Explain.
6. Your west-east cross section shows an elevated flat area next to the shoreline.What kind of coastal landform is this? How was it formed?
7. If sea level dropped 10 m, how would the shoreline change? How far would it move seaward?Would it become more regular or irregular? What would happen to Morro Bay?
8. If sea level rose 6 m, how would the coastal region change? Name three major changes.
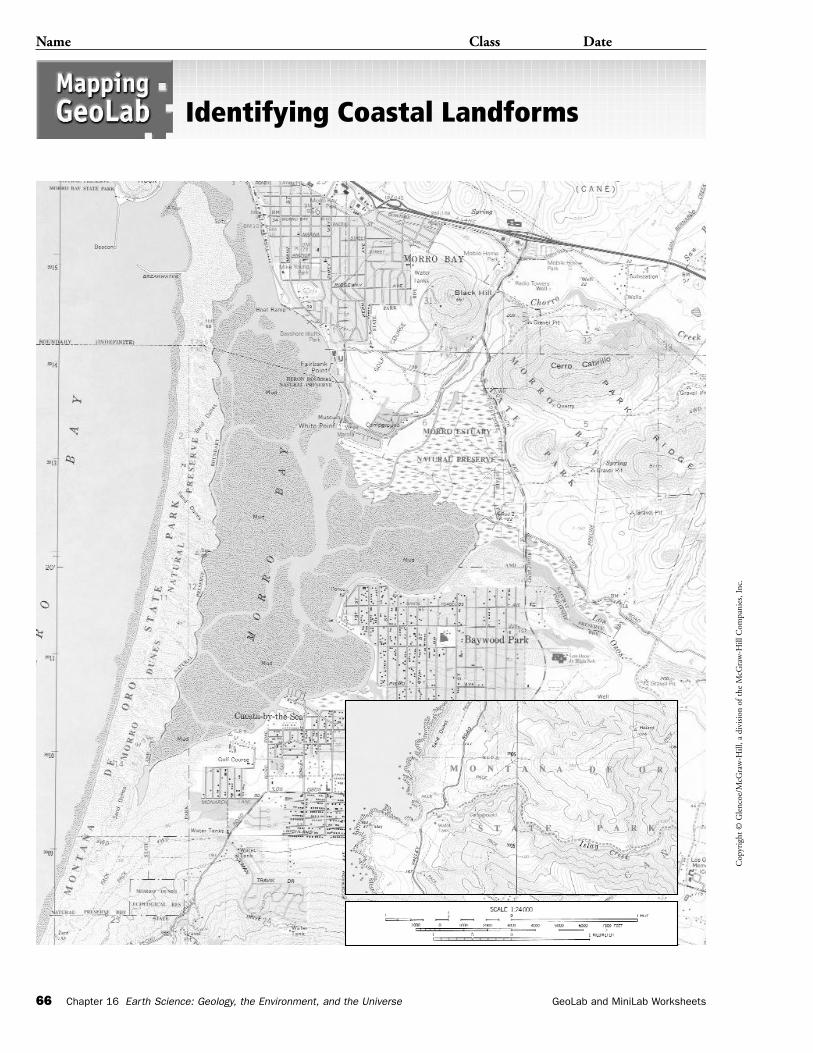
Cop
yrig
ht ©
Gle
ncoe
/McG
raw
-Hill
, a d
ivis
ion
of t
he M
cGra
w-H
ill C
ompa
nies
, Inc
.
Name Class Date
66 Chapter 16 Earth Science: Geology, the Environment, and the Universe GeoLab and MiniLab Worksheets
Identifying Coastal Landforms
Cop
yrig
ht ©
Gle
ncoe
/McG
raw
-Hill
, a d
ivis
ion
of t
he M
cGra
w-H
ill C
ompa
nies
, Inc
.
GeoLab and MiniLab Worksheets Chapter 17 Earth Science: Geology, the Environment, and the Universe 67
Name Class Date
Model ocean-basin formation
Model the formation of the South Atlantic Ocean.
Procedure
1. Use a world map to create paper templates of South America and Africa.
2. Place the two continental templates in the center of a piece of 11″ � 17″ paper and fit them together along their Atlantic coastlines.
3. Carefully trace around the templates with a pencil. Remove the templates and label the diagram “150 million years ago.”
4. Use an average spreading rate of 4 cm/y and a map scale of 1 cm � 500 km to create a series of maps that accurately show the development of the Atlantic Ocean at 30-million-year intervals, beginning 150 million years ago.
Analyze and Conclude
1. Compare your last map with a world map. Is the actual width of the South Atlantic Oceanthe same on both maps?
2. What might have caused any difference between the width in your model and the actualwidth of the present South Atlantic Ocean?
MiniLab 17MiniLab 17
Cop
yrig
ht ©
Gle
ncoe
/McG
raw
-Hill
, a d
ivis
ion
of t
he M
cGra
w-H
ill C
ompa
nies
, Inc
.
68 Chapter 17 Earth Science: Geology, the Environment, and the Universe GeoLab and MiniLab Worksheets
Name Class Date
Iron-bearing minerals in rocks record the orientation of Earth’s magnetic field at thetime of their formation. These preserved magnetic alignments in ocean-floor rocks can
be used to date different parts of the seafloor and to determine rates of spreading alongdivergent plate margins.
ProblemHow can you use paleomagnetic data to interpretinformation about ocean-floor rocks?
Materialstracing paper
metric ruler
No. 2 pencil
colored pencils
Figure 1
Making a Paleomagnetic Map
P R E P A R A T I O N
1. Use the tracing paper and the No. 2 pencil tocarefully copy the base map on the followingpage. Be sure to include the magnetic surveylines, the map scale, and the location indicatedby the letter X on your tracing.
2. Transfer the magnetic survey data from PM1to your tracing by placing the survey line onyour map over the PM1 data curve on thefollowing page. Be sure to align the mid-oceanridge with the dashed line before you begintransferring the line. Label the line.
3. Repeat step 2 for the other four lines.
4. Next, use your ruler to draw a series of parallellines between PM1 and PM2 to connect thecorresponding positive and negative magneticreversals. Draw the lines past PM2, but stopthe lines at the transform boundary.
5. Draw another series of lines between surveylines PM3 and PM4 and between PM4 andPM5. Again, end these lines at the transformboundary.
6. The positive magnetic reading along the mid-ocean ridge represents the Brunhes MagneticEpoch. The first negative anomaly on eitherside of the ridge marks the beginning of theMatuyama Magnetic Epoch. Use Figure 1 toidentify the magnetic reversals.
7. Assign a color for each magnetic reversal.Then, color the corresponding stripe oneach side of the ridge.
P R O C E D U R E
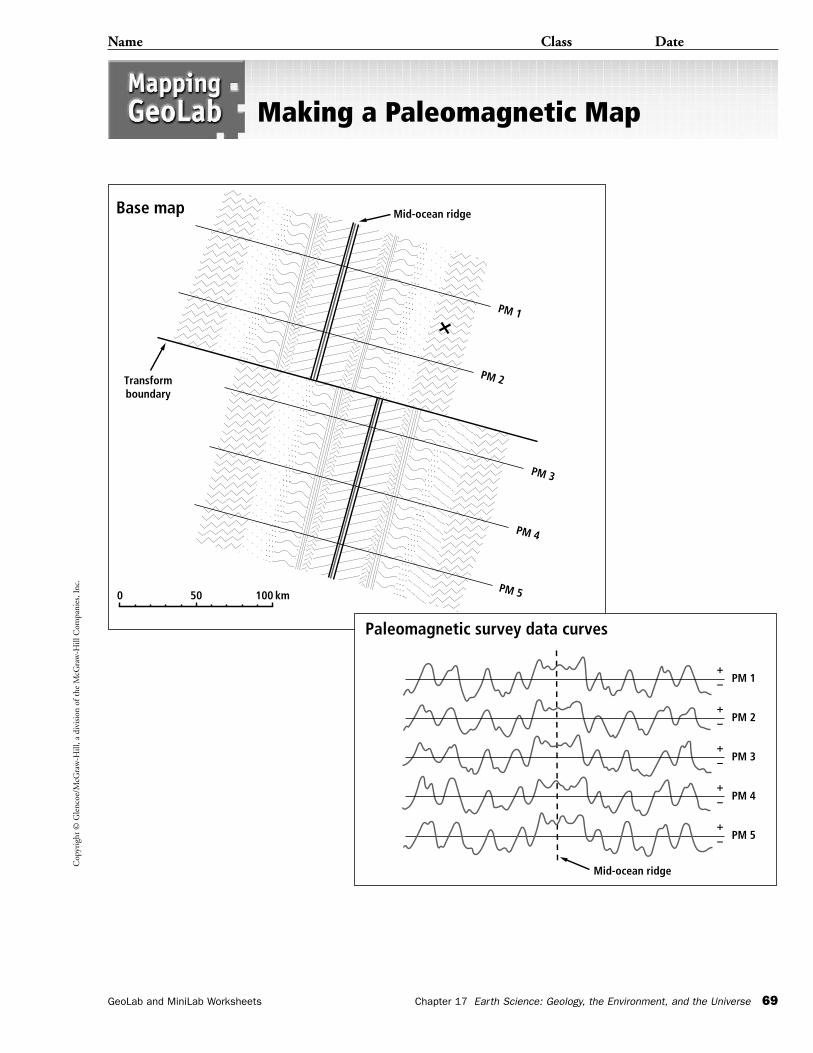
Cop
yrig
ht ©
Gle
ncoe
/McG
raw
-Hill
, a d
ivis
ion
of t
he M
cGra
w-H
ill C
ompa
nies
, Inc
.
Name Class Date
GeoLab and MiniLab Worksheets Chapter 17 Earth Science: Geology, the Environment, and the Universe 69
Making a Paleomagnetic Map
Base map
Paleomagnetic survey data curves
0 50 100 km
Transformboundary
Mid-ocean ridge
PM 1
PM 2
PM 3
PM 4
PM 5
Mid-ocean ridge
PM 1
PM 2
PM 3
PM 4
PM 5
+–
+–
+–
+–
+–
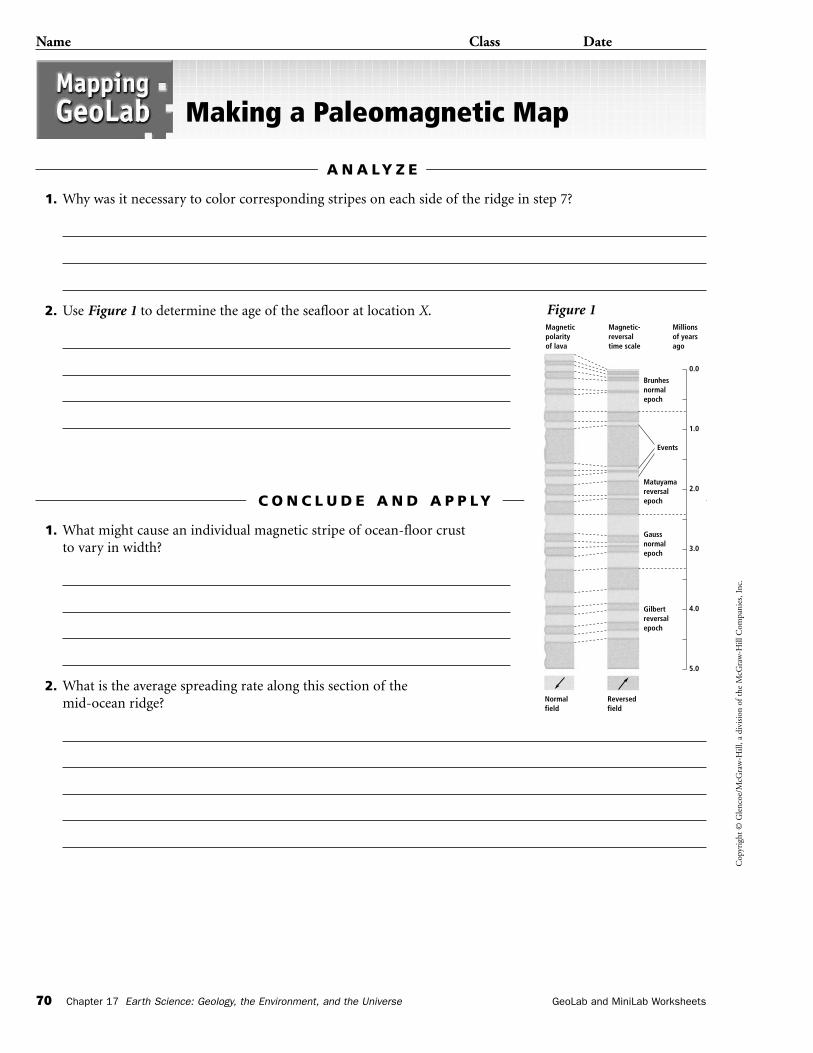
Cop
yrig
ht ©
Gle
ncoe
/McG
raw
-Hill
, a d
ivis
ion
of t
he M
cGra
w-H
ill C
ompa
nies
, Inc
.
Name Class Date
70 Chapter 17 Earth Science: Geology, the Environment, and the Universe GeoLab and MiniLab Worksheets
Making a Paleomagnetic Map
1. Why was it necessary to color corresponding stripes on each side of the ridge in step 7?
2. Use Figure 1 to determine the age of the seafloor at location X.
A N A LY Z E
1. What might cause an individual magnetic stripe of ocean-floor crust to vary in width?
2. What is the average spreading rate along this section of the mid-ocean ridge?
C O N C L U D E A N D A P P LY
Magneticpolarityof lava
Magnetic-reversaltime scale
Millionsof yearsago
Brunhesnormalepoch
Gaussnormalepoch
Events
Matuyamareversalepoch
Gilbertreversalepoch
Normalfield
Reversedfield
0.0
1.0
2.0
3.0
4.0
5.0
Figure 1
Cop
yrig
ht ©
Gle
ncoe
/McG
raw
-Hill
, a d
ivis
ion
of t
he M
cGra
w-H
ill C
ompa
nies
, Inc
.
GeoLab and MiniLab Worksheets Chapter 18 Earth Science: Geology, the Environment, and the Universe 71
Name Class Date
How does silica affect lava flow?
Model the changes in lava viscosity with the addition of silica.
Procedure
CAUTION: Always wear safety goggles and an apron in the lab.
1. Pour 120 mL of dishwashing liquid into a 250-mL beaker.
2. Stir the liquid with a stirring rod. Describe the viscosity.
3. Add 30 g of NaCl (table salt) to the liquid. Stir well. Describe what happens.
4. Repeat step 3 three more times.
Analyze and Conclude
1. What do the liquid and NaCl represent?
2. How does an increase in silica affect lava viscosity?
3. Basaltic eruptions are called flows because of the way they move across Earth’s surface. What can you infer about the silica content of a basaltic flow?
MiniLab 18MiniLab 18
Cop
yrig
ht ©
Gle
ncoe
/McG
raw
-Hill
, a d
ivis
ion
of t
he M
cGra
w-H
ill C
ompa
nies
, Inc
.
72 Chapter 18 Earth Science: Geology, the Environment, and the Universe GeoLab and MiniLab Worksheets
Name Class Date
Some volcanoes can be explosively dangerous. Along with clouds of ash and othervolcanic debris that can linger in the air for years after an eruption, pyroclastic
flows, landslides, and mudflows are common volcanic hazards. An explosive volcano maynot be a hazard to human life and property, however, if it is located in a remote area orerupts infrequently. A number of factors must be taken into account to determine if aparticular volcano poses a risk.
ProblemWhich volcanoes on our planet pose the greatestrisk to human life and property?
HypothesisForm a hypothesis about where you think themost hazardous volcanoes are located on Earth.Think about the potential risk to people and prop-erty near the volcano when formulating yourhypothesis. Write your hypothesis in the spacebelow.
ObjectivesIn this GeoLab, you will:
• Gather and communicate data about threevolcanoes in different parts of the world.
• Form conclusions about the hazards posed bythe volcanoes based on their location, size, lavatype, and eruptive history.
Data SourcesGo to the Glencoe Science Web Site at
to find links to volcano data on the Internet. You can also use current reference books and scientific magazines to aid in the collection of data.
science.glencoe.com
Ranking HazardousVolcanoes
P R E P A R A T I O N
1. Select a country and find out if there areany volcanoes in that country. If there are novolcanoes, choose another country. If there area lot of volcanoes in that country, narrow yoursearch.
2. Repeat step 1 for two other volcanoes. Copyand complete the data table on the next pagewith the information about each of the threevolcanoes you selected.
P R O C E D U R E
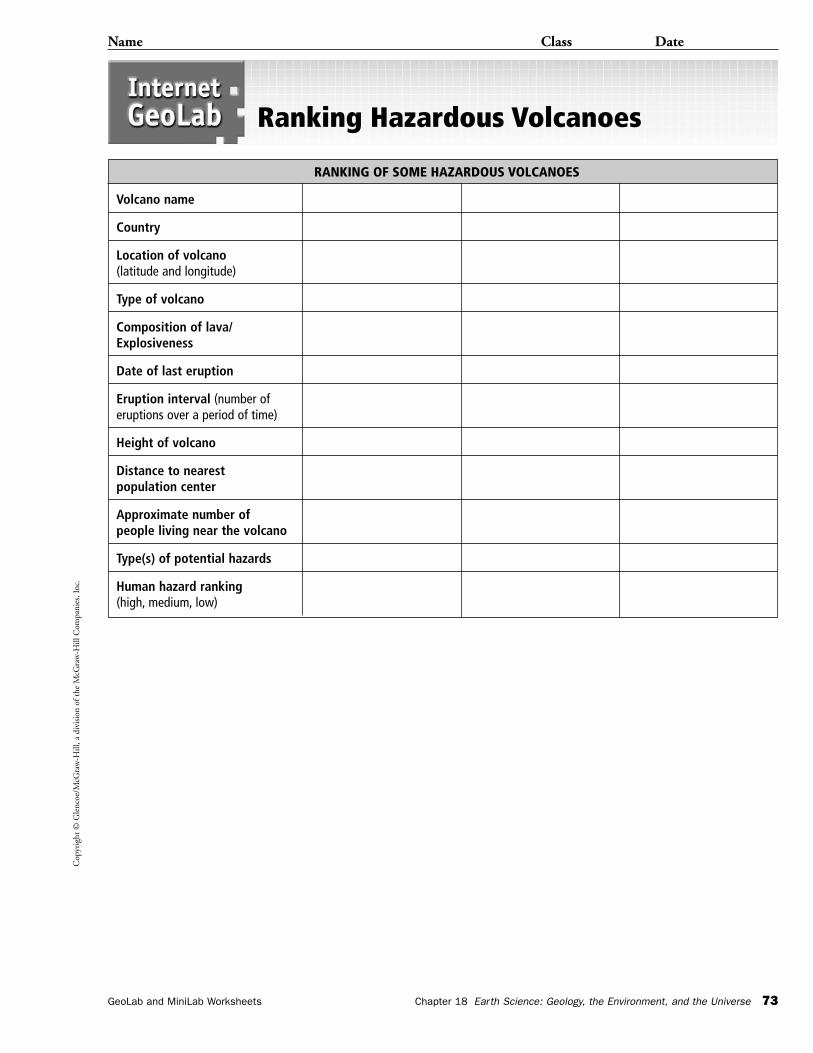
Cop
yrig
ht ©
Gle
ncoe
/McG
raw
-Hill
, a d
ivis
ion
of t
he M
cGra
w-H
ill C
ompa
nies
, Inc
.
Name Class Date
GeoLab and MiniLab Worksheets Chapter 18 Earth Science: Geology, the Environment, and the Universe 73
Ranking Hazardous Volcanoes
RANKING OF SOME HAZARDOUS VOLCANOES
Volcano name
Country
Location of volcano(latitude and longitude)
Type of volcano
Composition of lava/Explosiveness
Date of last eruption
Eruption interval (number of eruptions over a period of time)
Height of volcano
Distance to nearest population center
Approximate number of people living near the volcano
Type(s) of potential hazards
Human hazard ranking(high, medium, low)
Cop
yrig
ht ©
Gle
ncoe
/McG
raw
-Hill
, a d
ivis
ion
of t
he M
cGra
w-H
ill C
ompa
nies
, Inc
.
Name Class Date
74 Chapter 18 Earth Science: Geology, the Environment, and the Universe GeoLab and MiniLab Worksheets
Ranking Hazardous Volcanoes
Sharing Your Data Find this Internet GeoLab on the Glencoe Science Web Site at .Post your data in the table provided for this activity. Use the additional data from other students to complete your chart and answer the Conclude and Apply questions.
1. Which of the volcanoes you researched threatens the greatest number of people?Where is this volcano located?
2. Analyze the data posted by others at the site. Which country hasthe greatest number of potentially dangerous volcanoes? Why?
3. Which country has the greatest total population threatened by volcanoes?
science.glencoe.com
science.glencoe.com
C O N C L U D E A N D A P P LY
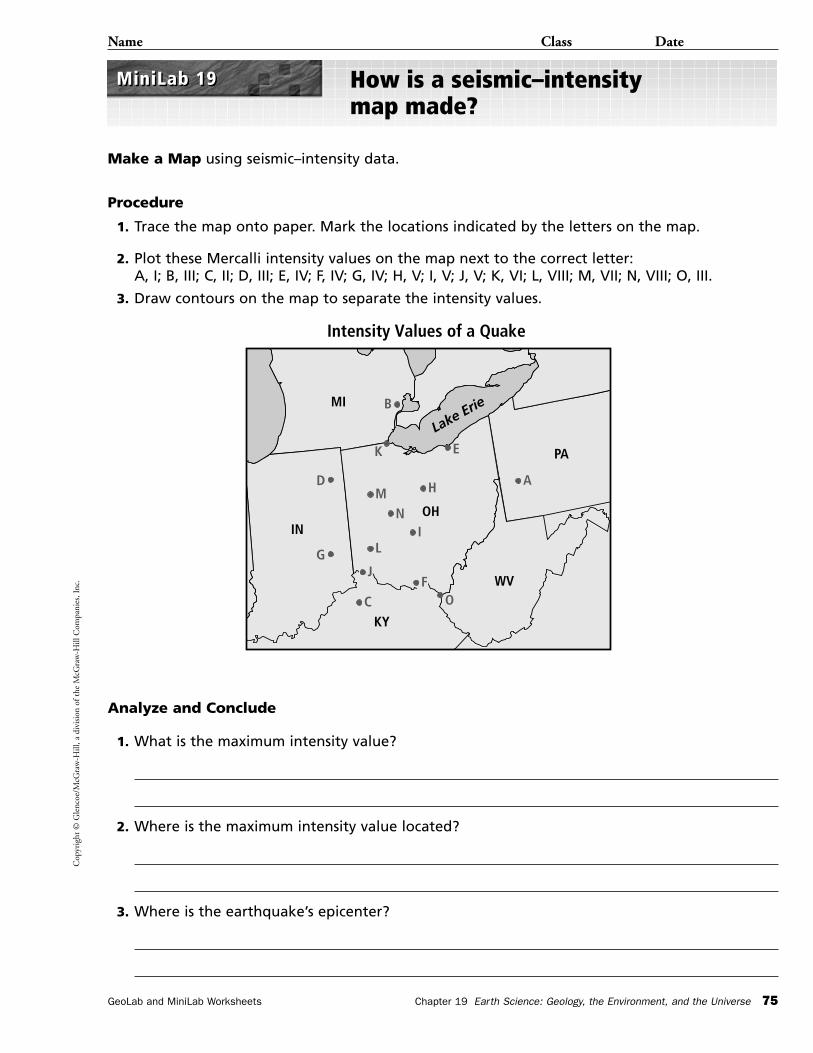
Cop
yrig
ht ©
Gle
ncoe
/McG
raw
-Hill
, a d
ivis
ion
of t
he M
cGra
w-H
ill C
ompa
nies
, Inc
.
GeoLab and MiniLab Worksheets Chapter 19 Earth Science: Geology, the Environment, and the Universe 75
Name Class Date
How is a seismic–intensity map made?
Make a Map using seismic–intensity data.
Procedure
1. Trace the map onto paper. Mark the locations indicated by the letters on the map.
2. Plot these Mercalli intensity values on the map next to the correct letter: A, I; B, III; C, II; D, III; E, IV; F, IV; G, IV; H, V; I, V; J, V; K, VI; L, VIII; M, VII; N, VIII; O, III.
3. Draw contours on the map to separate the intensity values.
Analyze and Conclude
1. What is the maximum intensity value?
2. Where is the maximum intensity value located?
3. Where is the earthquake’s epicenter?
MiniLab 19MiniLab 19
MI
PA
Lake Erie
OHM
K E
N
D
IN
KY
WV
H
I
A
LG
FJ
C O
B
Intensity Values of a Quake
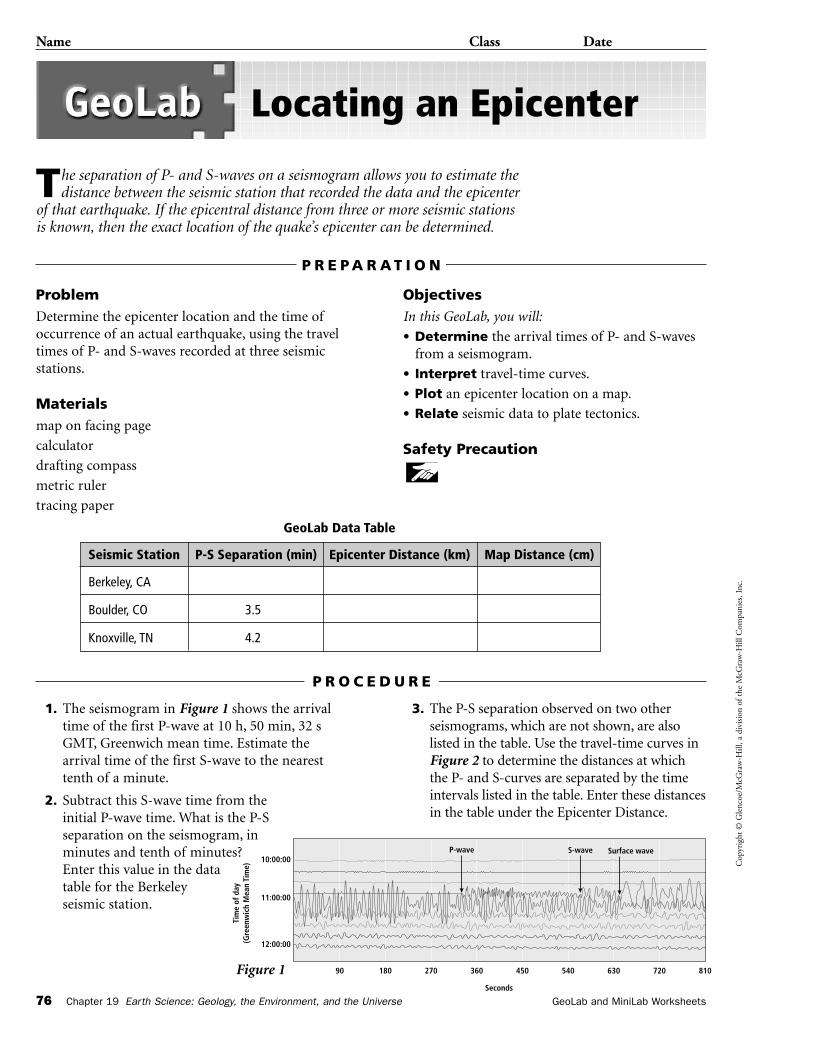
10:00:00P-wave
11:00:00
Tim
e of
day
(Gre
enw
ich
Mea
n Ti
me)
12:00:00
90 180 270 360 450
Seconds
540 630 720 810
S-wave Surface wave
Cop
yrig
ht ©
Gle
ncoe
/McG
raw
-Hill
, a d
ivis
ion
of t
he M
cGra
w-H
ill C
ompa
nies
, Inc
.
76 Chapter 19 Earth Science: Geology, the Environment, and the Universe GeoLab and MiniLab Worksheets
Name Class Date
The separation of P- and S-waves on a seismogram allows you to estimate thedistance between the seismic station that recorded the data and the epicenter
of that earthquake. If the epicentral distance from three or more seismic stationsis known, then the exact location of the quake’s epicenter can be determined.
ProblemDetermine the epicenter location and the time ofoccurrence of an actual earthquake, using the traveltimes of P- and S-waves recorded at three seismicstations.
Materialsmap on facing page
calculator
drafting compass
metric ruler
tracing paper
ObjectivesIn this GeoLab, you will:
• Determine the arrival times of P- and S-wavesfrom a seismogram.
• Interpret travel-time curves.
• Plot an epicenter location on a map.
• Relate seismic data to plate tectonics.
Safety Precaution
Locating an Epicenter
P R E P A R A T I O N
1. The seismogram in Figure 1 shows the arrivaltime of the first P-wave at 10 h, 50 min, 32 sGMT, Greenwich mean time. Estimate thearrival time of the first S-wave to the nearesttenth of a minute.
2. Subtract this S-wave time from the initial P-wave time. What is the P-S separation on the seismogram, in minutes and tenth of minutes? Enter this value in the data table for the Berkeley seismic station.
3. The P-S separation observed on two otherseismograms, which are not shown, are alsolisted in the table. Use the travel-time curves inFigure 2 to determine the distances at whichthe P- and S-curves are separated by the timeintervals listed in the table. Enter these distancesin the table under the Epicenter Distance.
P R O C E D U R E
Seismic Station P-S Separation (min) Epicenter Distance (km) Map Distance (cm)
Berkeley, CA
Boulder, CO 3.5
Knoxville, TN 4.2
GeoLab Data Table
Figure 1
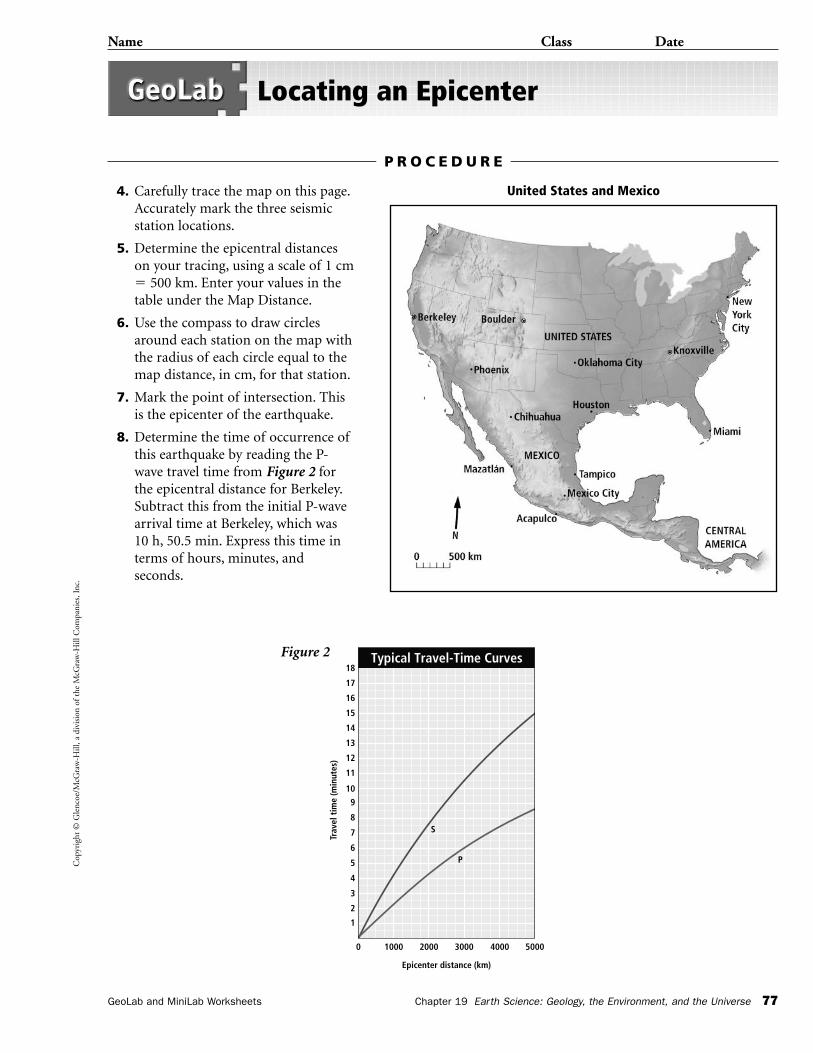
Cop
yrig
ht ©
Gle
ncoe
/McG
raw
-Hill
, a d
ivis
ion
of t
he M
cGra
w-H
ill C
ompa
nies
, Inc
.
Name Class Date
GeoLab and MiniLab Worksheets Chapter 19 Earth Science: Geology, the Environment, and the Universe 77
Locating an Epicenter
P R O C E D U R E
4. Carefully trace the map on this page.Accurately mark the three seismicstation locations.
5. Determine the epicentral distanceson your tracing, using a scale of 1 cm� 500 km. Enter your values in thetable under the Map Distance.
6. Use the compass to draw circlesaround each station on the map withthe radius of each circle equal to themap distance, in cm, for that station.
7. Mark the point of intersection. Thisis the epicenter of the earthquake.
8. Determine the time of occurrence ofthis earthquake by reading the P-wave travel time from Figure 2 forthe epicentral distance for Berkeley.Subtract this from the initial P-wavearrival time at Berkeley, which was10 h, 50.5 min. Express this time interms of hours, minutes, andseconds.
1
10000 2000 3000
S
P
Epicenter distance (km)
4000 5000
2
3
4
5
6
7
8
9
Trav
el t
ime
(min
utes
)
10
11
12
13
14
15
16
17
18Typical Travel-Time CurvesFigure 2
United States and Mexico
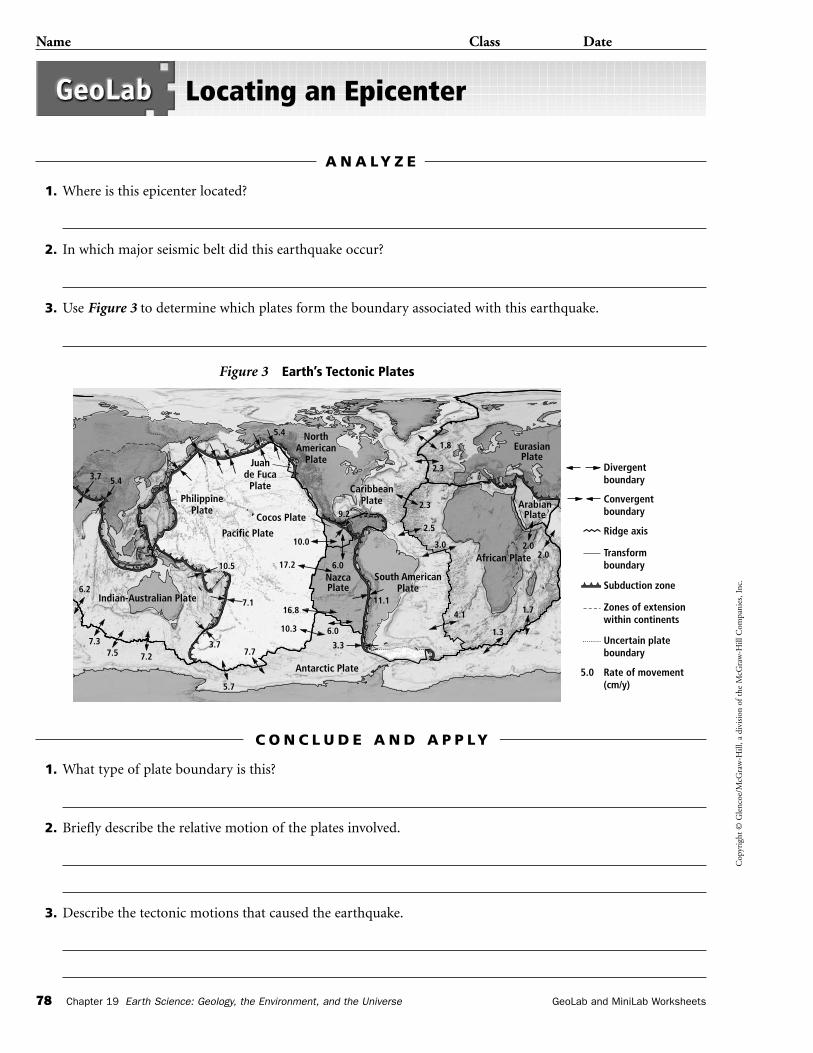
Cop
yrig
ht ©
Gle
ncoe
/McG
raw
-Hill
, a d
ivis
ion
of t
he M
cGra
w-H
ill C
ompa
nies
, Inc
.
Name Class Date
78 Chapter 19 Earth Science: Geology, the Environment, and the Universe GeoLab and MiniLab Worksheets
Locating an Epicenter
1. Where is this epicenter located?
2. In which major seismic belt did this earthquake occur?
3. Use Figure 3 to determine which plates form the boundary associated with this earthquake.
A N A LY Z E
1. What type of plate boundary is this?
2. Briefly describe the relative motion of the plates involved.
3. Describe the tectonic motions that caused the earthquake.
C O N C L U D E A N D A P P LY
PhilippinePlate
5.4
7.3
3.7 5.4
Pacific Plate
Indian-Australian Plate
Antarctic Plate
South AmericanPlate
NorthAmerican
Plate
NazcaPlate
Cocos Plate
Juande Fuca
Plate CaribbeanPlate
African Plate
ArabianPlate
EurasianPlate
2.02.0
1.3
4.1 1.7
6.2
7.5 7.23.7
7.1
10.5
5.7
7.7
10.3
16.8
3.3
6.0
6.0 17.2
11.1
9.2
2.3
1.8
10.0
2.3
2.5
3.0
Divergentboundary
Convergentboundary
Ridge axis
Transformboundary
Zones of extensionwithin continents
Subduction zone
Uncertain plateboundary
Rate of movement(cm/y)
5.0
Figure 3 Earth’s Tectonic Plates
Cop
yrig
ht ©
Gle
ncoe
/McG
raw
-Hill
, a d
ivis
ion
of t
he M
cGra
w-H
ill C
ompa
nies
, Inc
.
GeoLab and MiniLab Worksheets Chapter 20 Earth Science: Geology, the Environment, and the Universe 79
Name Class Date
How large is an ocean ridge?
Compare the width of part of an ocean ridge with the size of the United States.
Procedure
1. Obtain physiographic maps of the Atlantic Ocean floor and North America.
2. Use tracing paper to copy the general outline of a section of the Mid-AtlanticRidge. The length of the section should be long enough to stretch from SanFrancisco to New York City. Mark the ridge axis on your tracing.
3. Place the same tracing paper on the map of North America with theridge axis running east-west. Trace the general outline of the UnitedStates onto the paper.
Analyze and Conclude
1. How wide is the Mid-Atlantic Ridge?
2. Are there any parts of the United States that are not covered by your tracing?
3. If a mountain range the size of the Mid-Atlantic Ridge were located inthe United States as you have drawn it, how would it affect the majorriver drainage patterns and climates in various parts of North America?
MiniLab 20MiniLab 20
Cop
yrig
ht ©
Gle
ncoe
/McG
raw
-Hill
, a d
ivis
ion
of t
he M
cGra
w-H
ill C
ompa
nies
, Inc
.
80 Chapter 20 Earth Science: Geology, the Environment, and the Universe GeoLab and MiniLab Worksheets
Name Class Date
Amap profile, which is also called a cross section, is a side view of a geographic orgeologic feature constructed from a topographic map. You will construct and
analyze a profile of the Grand Tetons, a mountain range in Wyoming that formed whenenormous blocks of rocks were faulted along their eastern flanks, causing the blocks to tiltto the west.
ProblemHow do you construct a map profile?
Materialsmetric ruler
sharp pencil
graph paper
Making a Map Profile
P R E P A R A T I O N
1. On the graph paper, make a grid like the oneshown on the facing page.
2. Place the edge of a paper strip along theprofile line AA' and mark where each majorcontour line intersects the strip.
3. Label each intersection point with thecorrect elevation.
4. Transfer the points from the paper strip tothe profile grid.
5. Connect the points with a smooth line toconstruct a profile of the mountain rangealong line AA'.
6. Label the major geographic features onyour profile.
P R O C E D U R E
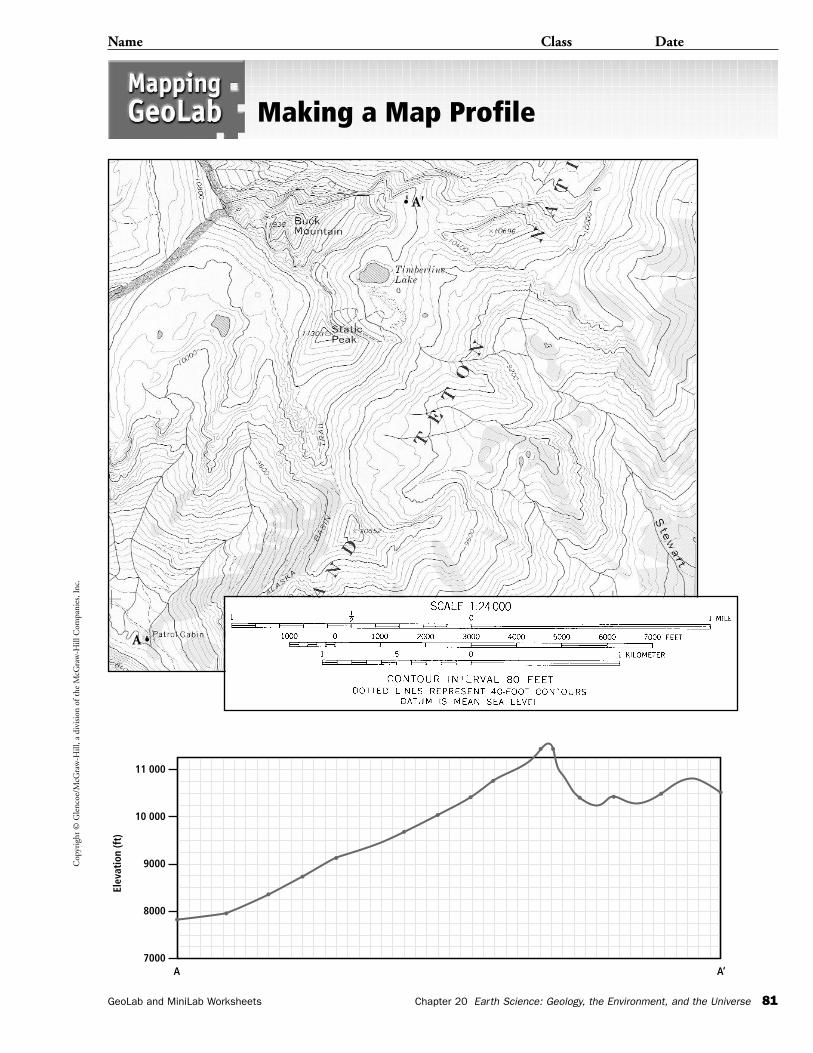
Cop
yrig
ht ©
Gle
ncoe
/McG
raw
-Hill
, a d
ivis
ion
of t
he M
cGra
w-H
ill C
ompa
nies
, Inc
.
Name Class Date
GeoLab and MiniLab Worksheets Chapter 20 Earth Science: Geology, the Environment, and the Universe 81
Making a Map Profile
11 000
10 000
9000
8000
7000A A‘
Elev
atio
n (f
t)
• A'
A •
Cop
yrig
ht ©
Gle
ncoe
/McG
raw
-Hill
, a d
ivis
ion
of t
he M
cGra
w-H
ill C
ompa
nies
, Inc
.
Name Class Date
82 Chapter 20 Earth Science: Geology, the Environment, and the Universe GeoLab and MiniLab Worksheets
Making a Map Profile
1. Describe how the map profile changes with distance from point A.
2. What is the elevation of the highest point on the map profile? The lowest point?
3. What is the average elevation shown in the profile?
4. Calculate the total relief shown in the profile.
A N A LY Z E
1. Is your map profile a scale model of the topography along line AA'? Explain.
2. What determined the scale of this map profile?
3. Why are map profiles made from topographic maps often exaggerated vertically?
C O N C L U D E A N D A P P LY
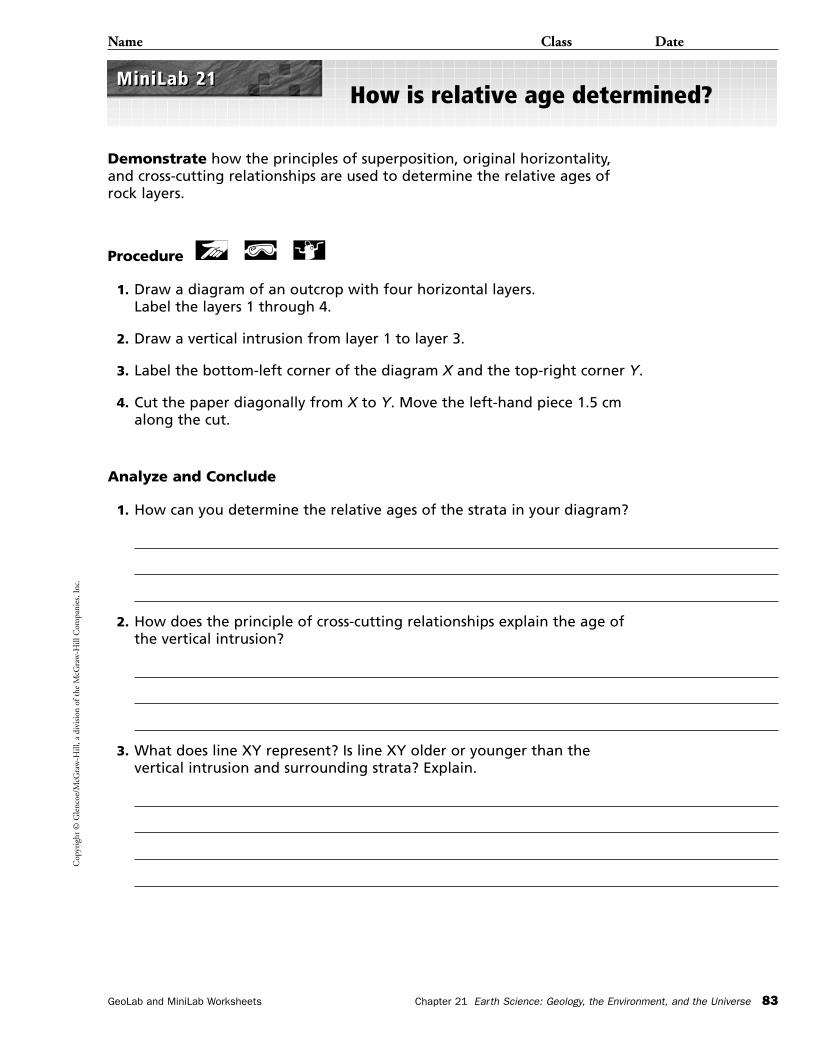
Cop
yrig
ht ©
Gle
ncoe
/McG
raw
-Hill
, a d
ivis
ion
of t
he M
cGra
w-H
ill C
ompa
nies
, Inc
.
GeoLab and MiniLab Worksheets Chapter 21 Earth Science: Geology, the Environment, and the Universe 83
Name Class Date
How is relative age determined?
Demonstrate how the principles of superposition, original horizontality,and cross-cutting relationships are used to determine the relative ages ofrock layers.
Procedure
1. Draw a diagram of an outcrop with four horizontal layers. Label the layers 1 through 4.
2. Draw a vertical intrusion from layer 1 to layer 3.
3. Label the bottom-left corner of the diagram X and the top-right corner Y.
4. Cut the paper diagonally from X to Y. Move the left-hand piece 1.5 cmalong the cut.
Analyze and Conclude
1. How can you determine the relative ages of the strata in your diagram?
2. How does the principle of cross-cutting relationships explain the age ofthe vertical intrusion?
3. What does line XY represent? Is line XY older or younger than thevertical intrusion and surrounding strata? Explain.
MiniLab 21MiniLab 21
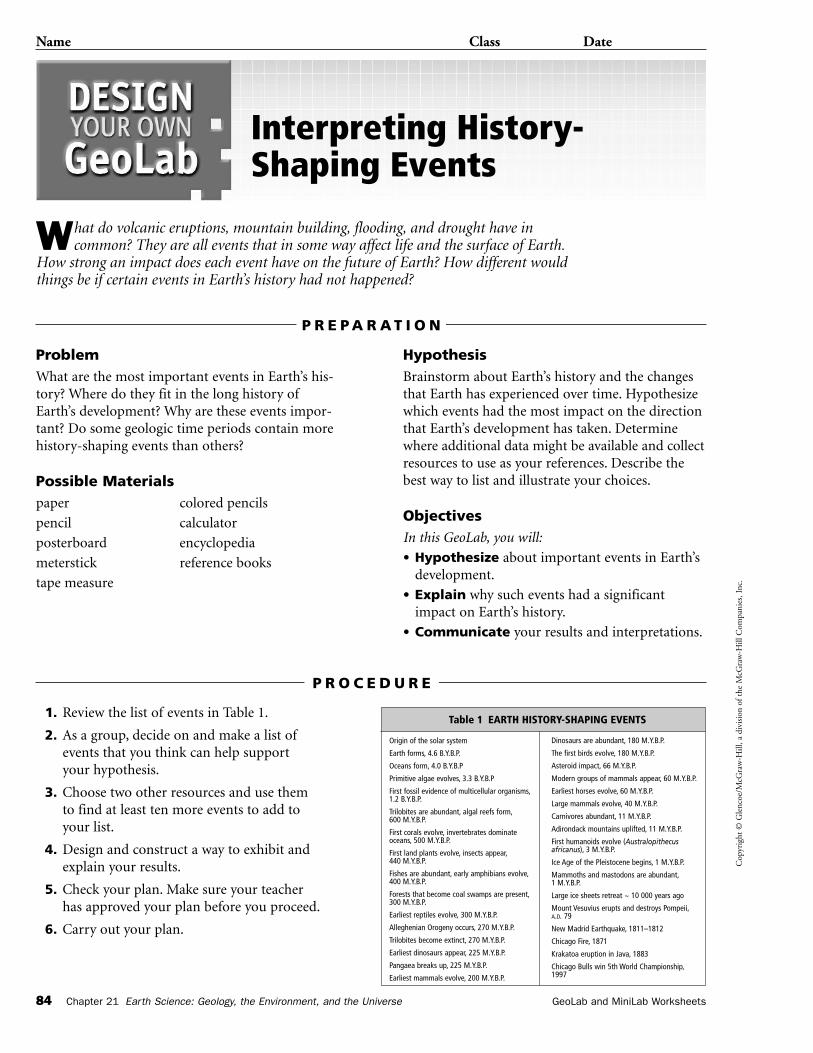
Cop
yrig
ht ©
Gle
ncoe
/McG
raw
-Hill
, a d
ivis
ion
of t
he M
cGra
w-H
ill C
ompa
nies
, Inc
.
84 Chapter 21 Earth Science: Geology, the Environment, and the Universe GeoLab and MiniLab Worksheets
Name Class Date
What do volcanic eruptions, mountain building, flooding, and drought have incommon? They are all events that in some way affect life and the surface of Earth.
How strong an impact does each event have on the future of Earth? How different wouldthings be if certain events in Earth’s history had not happened?
ProblemWhat are the most important events in Earth’s his-tory? Where do they fit in the long history ofEarth’s development? Why are these events impor-tant? Do some geologic time periods contain morehistory-shaping events than others?
Possible Materialspaper colored pencils
pencil calculator
posterboard encyclopedia
meterstick reference books
tape measure
HypothesisBrainstorm about Earth’s history and the changesthat Earth has experienced over time. Hypothesizewhich events had the most impact on the directionthat Earth’s development has taken. Determinewhere additional data might be available and collectresources to use as your references. Describe thebest way to list and illustrate your choices.
ObjectivesIn this GeoLab, you will:
• Hypothesize about important events in Earth’sdevelopment.
• Explain why such events had a significantimpact on Earth’s history.
• Communicate your results and interpretations.
Interpreting History-Shaping Events
P R E P A R A T I O N
1. Review the list of events in Table 1.
2. As a group, decide on and make a list ofevents that you think can help support your hypothesis.
3. Choose two other resources and use them to find at least ten more events to add to your list.
4. Design and construct a way to exhibit andexplain your results.
5. Check your plan. Make sure your teacher has approved your plan before you proceed.
6. Carry out your plan.
P R O C E D U R E
Table 1 EARTH HISTORY-SHAPING EVENTS
Origin of the solar system
Earth forms, 4.6 B.Y.B.P.
Oceans form, 4.0 B.Y.B.P
Primitive algae evolves, 3.3 B.Y.B.P
First fossil evidence of multicellular organisms,1.2 B.Y.B.P.
Trilobites are abundant, algal reefs form,600 M.Y.B.P.
First corals evolve, invertebrates dominate oceans, 500 M.Y.B.P.
First land plants evolve, insects appear,440 M.Y.B.P.
Fishes are abundant, early amphibians evolve,400 M.Y.B.P.
Forests that become coal swamps are present,300 M.Y.B.P.
Earliest reptiles evolve, 300 M.Y.B.P.
Alleghenian Orogeny occurs, 270 M.Y.B.P.
Trilobites become extinct, 270 M.Y.B.P.
Earliest dinosaurs appear, 225 M.Y.B.P.
Pangaea breaks up, 225 M.Y.B.P.
Earliest mammals evolve, 200 M.Y.B.P.
Dinosaurs are abundant, 180 M.Y.B.P.
The first birds evolve, 180 M.Y.B.P.
Asteroid impact, 66 M.Y.B.P.
Modern groups of mammals appear, 60 M.Y.B.P.
Earliest horses evolve, 60 M.Y.B.P.
Large mammals evolve, 40 M.Y.B.P.
Carnivores abundant, 11 M.Y.B.P.
Adirondack mountains uplifted, 11 M.Y.B.P.
First humanoids evolve (Australopithecusafricanus), 3 M.Y.B.P.
Ice Age of the Pleistocene begins, 1 M.Y.B.P.
Mammoths and mastodons are abundant,1 M.Y.B.P.
Large ice sheets retreat ~ 10 000 years ago
Mount Vesuvius erupts and destroys Pompeii,A.D. 79
New Madrid Earthquake, 1811–1812
Chicago Fire, 1871
Krakatoa eruption in Java, 1883
Chicago Bulls win 5th World Championship,1997
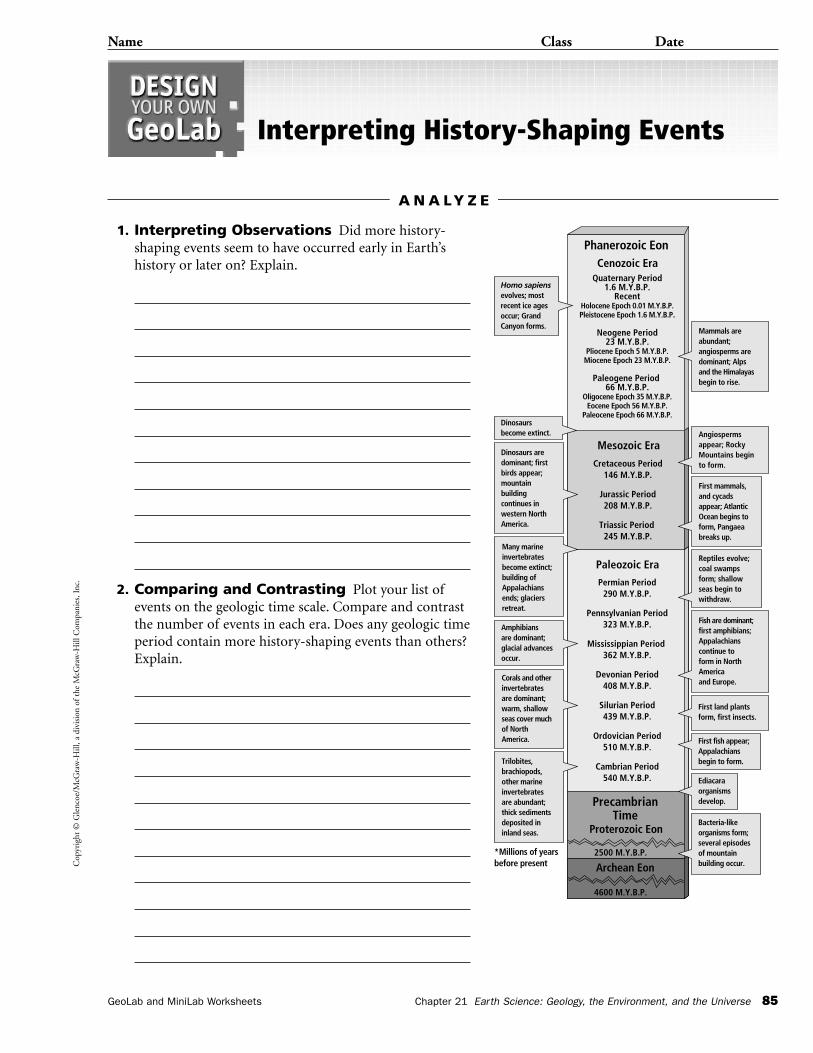
Cop
yrig
ht ©
Gle
ncoe
/McG
raw
-Hill
, a d
ivis
ion
of t
he M
cGra
w-H
ill C
ompa
nies
, Inc
.
Name Class Date
GeoLab and MiniLab Worksheets Chapter 21 Earth Science: Geology, the Environment, and the Universe 85
Interpreting History-Shaping Events
1. Interpreting Observations Did more history-shaping events seem to have occurred early in Earth’shistory or later on? Explain.
2. Comparing and Contrasting Plot your list ofevents on the geologic time scale. Compare and contrastthe number of events in each era. Does any geologic timeperiod contain more history-shaping events than others?Explain.
A N A LY Z E
*Millions of yearsbefore present
4600 M.Y.B.P.
2500 M.Y.B.P.
Cretaceous Period146 M.Y.B.P.
Jurassic Period208 M.Y.B.P.
Triassic Period 245 M.Y.B.P.
Quaternary Period1.6 M.Y.B.P.
RecentHolocene Epoch 0.01 M.Y.B.P.Pleistocene Epoch 1.6 M.Y.B.P.
Neogene Period23 M.Y.B.P.
Pliocene Epoch 5 M.Y.B.P.Miocene Epoch 23 M.Y.B.P.
Paleogene Period 66 M.Y.B.P.
Oligocene Epoch 35 M.Y.B.P.Eocene Epoch 56 M.Y.B.P.
Paleocene Epoch 66 M.Y.B.P.
Permian Period290 M.Y.B.P.
Pennsylvanian Period323 M.Y.B.P.
Mississippian Period 362 M.Y.B.P.
Devonian Period408 M.Y.B.P.
Silurian Period439 M.Y.B.P.
Ordovician Period510 M.Y.B.P.
Cambrian Period540 M.Y.B.P.
Cenozoic Era
Paleozoic Era
PrecambrianTime
Mesozoic Era
Phanerozoic Eon
Proterozoic Eon
Archean Eon
Mammals areabundant;angiosperms aredominant; Alpsand the Himalayasbegin to rise.
Homo sapiensevolves; mostrecent ice agesoccur; GrandCanyon forms.
Many marineinvertebratesbecome extinct;building ofAppalachiansends; glaciersretreat.
Amphibiansare dominant;glacial advancesoccur.
Corals and otherinvertebratesare dominant;warm, shallowseas cover muchof NorthAmerica.
Trilobites,brachiopods,other marineinvertebratesare abundant;thick sedimentsdeposited ininland seas.
Dinosaurs aredominant; firstbirds appear;mountainbuildingcontinues inwestern NorthAmerica.
Dinosaursbecome extinct. Angiosperms
appear; RockyMountains beginto form.
First mammals,and cycads appear; AtlanticOcean begins toform, Pangaeabreaks up.
Reptiles evolve;coal swampsform; shallowseas begin towithdraw.
Fish are dominant; first amphibians;Appalachians continue to form in North Americaand Europe.
First land plantsform, first insects.
First fish appear; Appalachiansbegin to form.
Ediacaraorganismsdevelop.
Bacteria-likeorganisms form; several episodes of mountainbuilding occur.
Cop
yrig
ht ©
Gle
ncoe
/McG
raw
-Hill
, a d
ivis
ion
of t
he M
cGra
w-H
ill C
ompa
nies
, Inc
.
Name Class Date
86 Chapter 21 Earth Science: Geology, the Environment, and the Universe GeoLab and MiniLab Worksheets
Interpreting History-Shaping Events
1. How do extinction events influence the development of life on Earth?
2. How do mountain-building events and glaciations affect the development of life on Earth?
3. If another planet experienced the same events that you chose, would that planet beidentical to Earth? What would be similar or different?
C O N C L U D E A N D A P P LY
A N A LY Z E
3. Observing and Inferring Choose one event in the Mesozoic and infer howEarth’s history might have progressed had the event not happened.
Cop
yrig
ht ©
Gle
ncoe
/McG
raw
-Hill
, a d
ivis
ion
of t
he M
cGra
w-H
ill C
ompa
nies
, Inc
.
GeoLab and MiniLab Worksheets Chapter 22 Earth Science: Geology, the Environment, and the Universe 87
Name Class Date
Why are red beds red?
Model the formation of red beds with iron, oxygen, and water.
Procedure
CAUTION: Steel wool can be sharp. Wear gloves in the lab.
1. Place 40 mL of white sand in a 150-mL beaker.
2. Add water so that the total volume is 120 mL.
3. Add 15 mL of bleach.
4. Place a piece of steel wool about the size of your thumbnail, in thebeaker. Cover the beaker with a petri dish and allow it to stand in a quiet place for one day.
5. Remove the steel wool and stir the contents of the beaker. Allow themixture to settle for 5 minutes after stirring.
6. Slowly pour off the water so that the iron-oxide sediment is left behind.
7. Stir the mixture again, then spoon some of the sand onto a watch glassand allow it to dry.
Analyze and Conclude
1. Describe how the color of the sediment changed.
2. Where does the iron in the experiment come from?
3. Where in nature does the red in rocks come from?
4. What do you think is the function of the bleach?
MiniLab 22MiniLab 22
Cop
yrig
ht ©
Gle
ncoe
/McG
raw
-Hill
, a d
ivis
ion
of t
he M
cGra
w-H
ill C
ompa
nies
, Inc
.
88 Chapter 22 Earth Science: Geology, the Environment, and the Universe GeoLab and MiniLab Worksheets
Name Class Date
Plotting the distribution of the ages of rocks onto a map helps geologists to reconstructthe history of continental accretion. During the Precambrian, microcontinents and
island arcs collided to form what would become the modern continents.
ProblemHow can the distribution of the ages of rocks plot-ted on a map be used to interpret the growth of acontinent?
Materialspaper colored pencils
pencil metric ruler
Mapping ContinentalGrowth
P R E P A R A T I O N
1. Your teacher will set up locations with a rocksample at each location.
2. Make an outline map of your classroomsimilar to the map on the next page, using thescale 1 cm � 100 km. Use the space below.
3. Visit each location where a rock sample hasbeen set out. Plot each location and record theage of each rock on the map.
4. After you have recorded all the locations, use apencil to draw lines on the map that separaterocks of different ages. Be careful not to simplyconnect the dots.
5. Use a different colored pencil to shade in theareas on the map that contain rocks of thesame age. These are your geologic ageprovinces.
6. Make a key for your map by drawing a smallrectangle for each different geologic ageprovince. Name the oldest province “ProvinceA,” the next oldest “Province B,” and so on forall provinces.
P R O C E D U R E
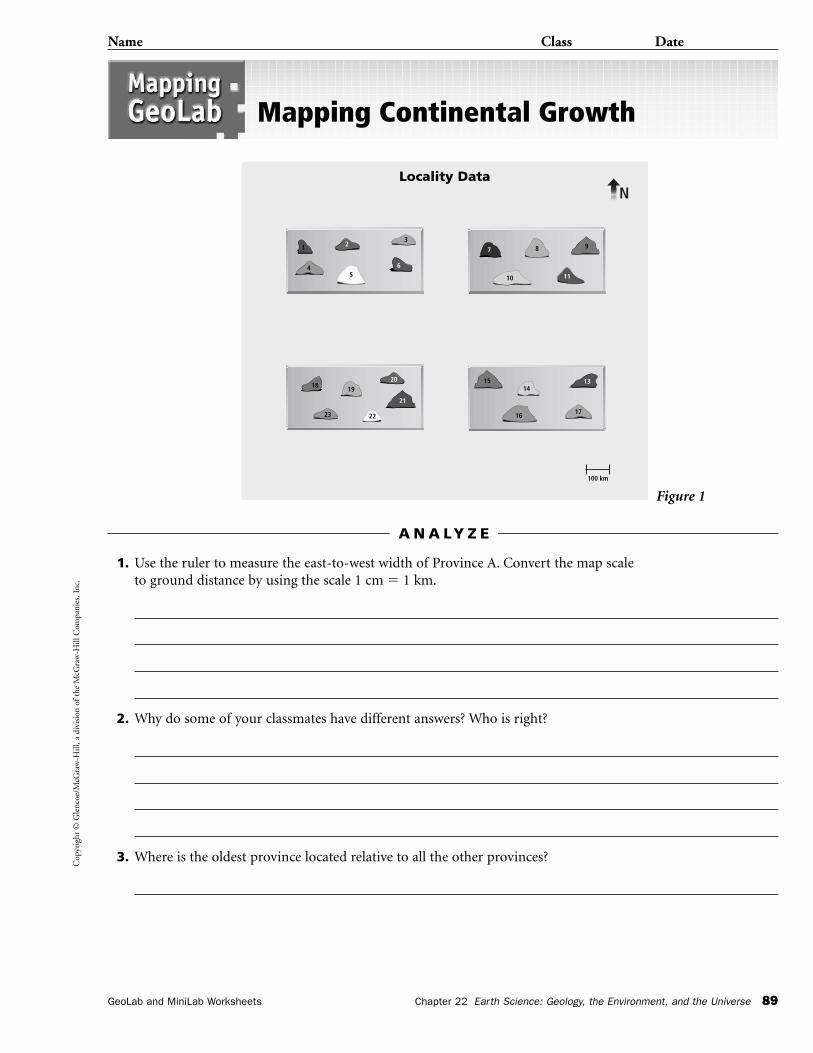
Cop
yrig
ht ©
Gle
ncoe
/McG
raw
-Hill
, a d
ivis
ion
of t
he M
cGra
w-H
ill C
ompa
nies
, Inc
.
Name Class Date
GeoLab and MiniLab Worksheets Chapter 22 Earth Science: Geology, the Environment, and the Universe 89
Mapping Continental Growth
1. Use the ruler to measure the east-to-west width of Province A. Convert the map scaleto ground distance by using the scale 1 cm � 1 km.
2. Why do some of your classmates have different answers? Who is right?
3. Where is the oldest province located relative to all the other provinces?
A N A LY Z E
1 23
45
6
7
10
8
11
9
18
23 22
19
20
21
1514
13
1716
100 km
NLocality Data
Figure 1
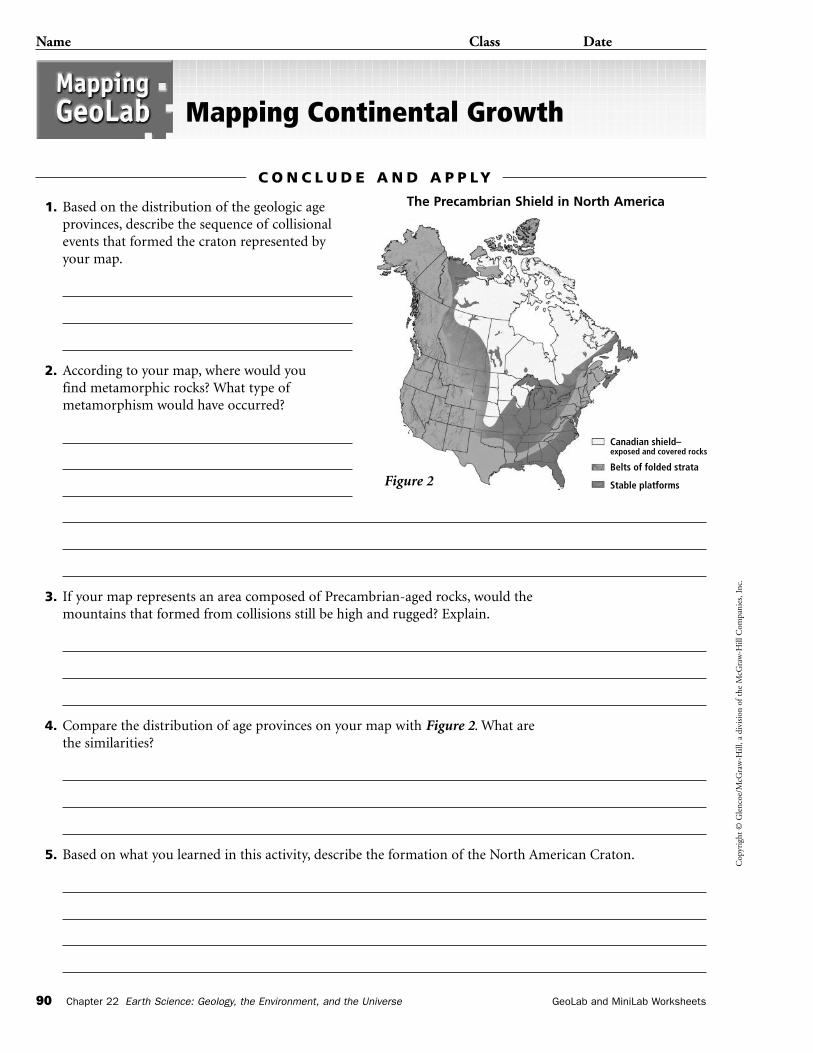
Cop
yrig
ht ©
Gle
ncoe
/McG
raw
-Hill
, a d
ivis
ion
of t
he M
cGra
w-H
ill C
ompa
nies
, Inc
.
Name Class Date
90 Chapter 22 Earth Science: Geology, the Environment, and the Universe GeoLab and MiniLab Worksheets
Mapping Continental Growth
1. Based on the distribution of the geologic ageprovinces, describe the sequence of collisionalevents that formed the craton represented byyour map.
2. According to your map, where would you find metamorphic rocks? What type ofmetamorphism would have occurred?
3. If your map represents an area composed of Precambrian-aged rocks, would themountains that formed from collisions still be high and rugged? Explain.
4. Compare the distribution of age provinces on your map with Figure 2. What are the similarities?
5. Based on what you learned in this activity, describe the formation of the North American Craton.
C O N C L U D E A N D A P P LY
Canadian shield–exposed and covered rocks
Belts of folded strata
Stable platforms
The Precambrian Shield in North America
Figure 2
Cop
yrig
ht ©
Gle
ncoe
/McG
raw
-Hill
, a d
ivis
ion
of t
he M
cGra
w-H
ill C
ompa
nies
, Inc
.
GeoLab and MiniLab Worksheets Chapter 23 Earth Science: Geology, the Environment, and the Universe 91
Name Class Date
Collisions and Shelves
Model the difference in continental shelf area between individual continents and one supercontinent.
Procedure
1. Using 250 g of modeling clay, make a sphere and flatten it into a diskthat is 1/2 cm thick. This represents a craton.
2. Divide another 250 g of clay into 2 equal spheres and flatten them as above.
3. Roll 250 g of modeling clay into 3 long cylinders with 1/2 cm diameters.Wrap the cylinders around the edges of the clay disks. These representcontinental shelves.
4. Using the formula area � �r2, calculate the area of the large craton and thearea of the large craton plus the continental shelf. Subtract the craton areafrom the total area. This equals the area of the continental shelf.
5. Repeat step 4 for each of the small models.
Analyze and Conclude
1. Which has more shelf area, two small continents or one large continent? Why?
2. Tropical oceans contain the greatest diversity of animals. If there is only onesupercontinent, how does this further limit the amount of habitat space?
3. Explain how reduced habitat space, Pangaea, and the mass extinction atthe end of the Permian are related.
MiniLab 23MiniLab 23
Cop
yrig
ht ©
Gle
ncoe
/McG
raw
-Hill
, a d
ivis
ion
of t
he M
cGra
w-H
ill C
ompa
nies
, Inc
.
92 Chapter 23 Earth Science: Geology, the Environment, and the Universe GeoLab and MiniLab Worksheets
Name Class Date
Brachiopods and bivalves have been present in Earth’s oceans since the Cambrian.Both have two shells and live in marine environments. But the similarity ends there.
How can you tell the two apart? Oysters are bivalves that are known for the pearls theysecrete inside their shells. Can you distinguish an oyster from a brachiopod? If you weresearching for pearls, you would want to know how!
ProblemDistinguish between brachiopods and bivalves andinterpret the environment where a brachiopodlived based on its shell.
Materialsfossil brachiopods (4),
each belonging to a different species
fossil bivalves (4),each belonging to a different species
paper
pencil
ObjectivesIn this GeoLab, you will:
• Determine if a fossil is a brachiopod ora bivalve.
• Describe the symmetry of fossil brachiopods and bivalves.
• Infer the environment in which different fossilbrachiopods lived.
Safety Precautions
Always wear safety goggles and an apron in the lab.
Symmetry, Shape,and Shells
P R E P A R A T I O N
1. Use the data table on the next page. If youchoose to add more columns to recordadditional data, use the blank space provided.
2. Examine the fossils provided by your teacher.
3. Determine where the plane of symmetry is foreach specimen. An organism that can bedivided into two nearly identical halves hasbilateral symmetry.
4. Identify the specimens as brachiopods orbivalves based on their symmetry and recordthis in your data table. Brachiopod symmetryruns across both shells. Bivalve symmetry runsbetween the shells.
5. Divide the brachiopods into two groups basedon whether you think they lived in a deeperwater, low-energy environment, or in a shallowwater, high-energy environment. Record thisin your data table.
P R O C E D U R E
Cop
yrig
ht ©
Gle
ncoe
/McG
raw
-Hill
, a d
ivis
ion
of t
he M
cGra
w-H
ill C
ompa
nies
, Inc
.
Name Class Date
GeoLab and MiniLab Worksheets Chapter 23 Earth Science: Geology, the Environment, and the Universe 93
Symmetry, Shape, and Shells
1. Interpreting Observations Explain how symmetry is useful in determiningwhether a fossil is a brachiopod or a bivalve.
2. Applying and Interpreting If you only had one shell, how could youdetermine if it was the shell of a brachiopod or the shell of a bivalve?
3. Comparing and Contrasting Explain the similarities and differences between astreamlined auto and a smooth brachiopod, in terms of their place in wind or water.
A N A LY Z E
Deeper water, low-energy environment or Specimen Brachiopod or Bivalve shallow water, high-energy environment
1
2
3
FOSSIL DATA
Cop
yrig
ht ©
Gle
ncoe
/McG
raw
-Hill
, a d
ivis
ion
of t
he M
cGra
w-H
ill C
ompa
nies
, Inc
.
Name Class Date
94 Chapter 23 Earth Science: Geology, the Environment, and the Universe GeoLab and MiniLab Worksheets
Symmetry, Shape, and Shells
1. What principle did you use to determine the environment in which the fossilbrachiopods lived? Explain.
2. Hypothesize about the reasons for the different shell types for brachiopods that live indifferent environments.
3. All living brachiopods pump water through their shells and filter organic particlesout of that water to feed. Some brachiopod shells close along a straight line, whereasothers close along a zigzag line. What is the benefit of having a zigzag opening fora filter feeding brachiopod?
C O N C L U D E A N D A P P LY
Cop
yrig
ht ©
Gle
ncoe
/McG
raw
-Hill
, a d
ivis
ion
of t
he M
cGra
w-H
ill C
ompa
nies
, Inc
.
GeoLab and MiniLab Worksheets Chapter 24 Earth Science: Geology, the Environment, and the Universe 95
Name Class Date
Glaciers and Deposition
Model the deposition of sediment by melting glaciers.
Procedure
1. Pour water into a large, wide-mouthed jar until it is approximately 3/4 full.
2. Add a mixture of clay, silt, sand, and pebbles to the jar. Put the lid tightlyon the jar.
3. Shake the jar for 30 seconds and allow the contents to settle.
4. Finely crush enough ice to fill approximately three-fourths of a secondlarge, wide-mouthed jar. Stir a mixture of clay, silt, sand, and pebbles into the ice and pour the mixture into the jar.
5. Allow the ice to melt and the particles to settle overnight.
Analyze and Conclude
1. Describe the differences in the way the sediments settled in the two jars.
2. Compare and contrast the sorting of the grain sizes in the two jars.
3. How could geologists use this information to determine whethersediment had been deposited by a glacier or by running water?
MiniLab 24MiniLab 24
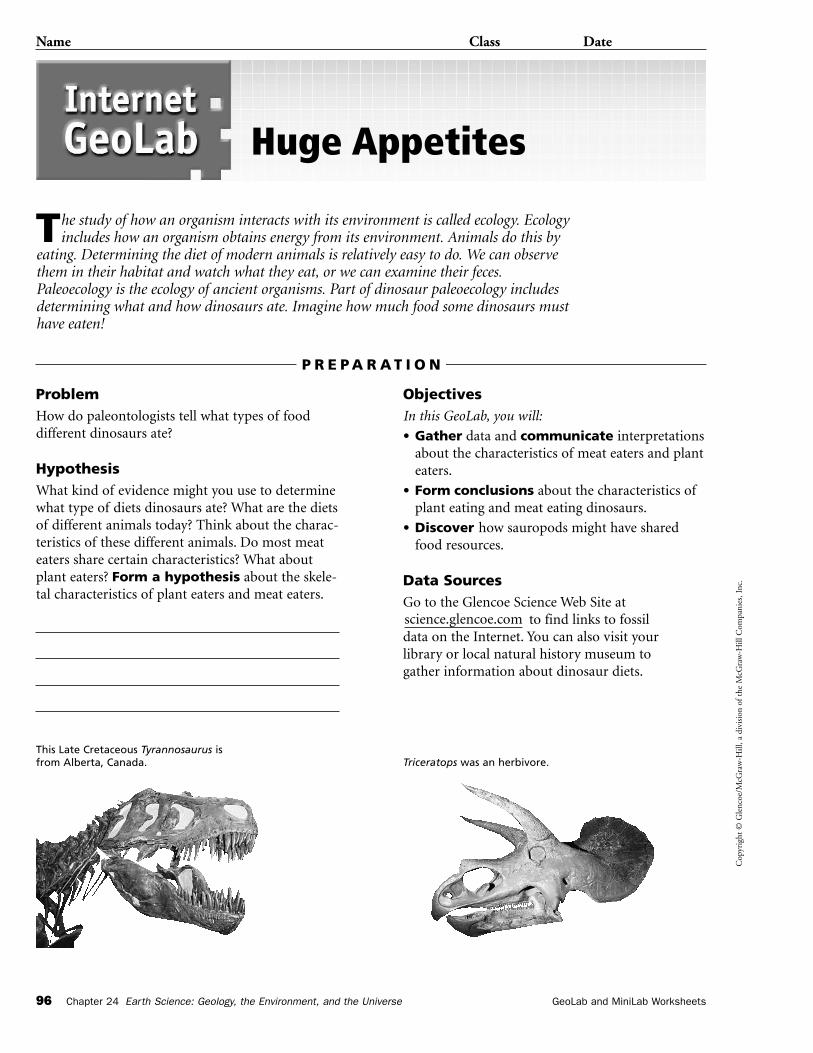
Cop
yrig
ht ©
Gle
ncoe
/McG
raw
-Hill
, a d
ivis
ion
of t
he M
cGra
w-H
ill C
ompa
nies
, Inc
.
96 Chapter 24 Earth Science: Geology, the Environment, and the Universe GeoLab and MiniLab Worksheets
Name Class Date
The study of how an organism interacts with its environment is called ecology. Ecologyincludes how an organism obtains energy from its environment. Animals do this by
eating. Determining the diet of modern animals is relatively easy to do. We can observethem in their habitat and watch what they eat, or we can examine their feces.Paleoecology is the ecology of ancient organisms. Part of dinosaur paleoecology includesdetermining what and how dinosaurs ate. Imagine how much food some dinosaurs musthave eaten!
ProblemHow do paleontologists tell what types of food different dinosaurs ate?
HypothesisWhat kind of evidence might you use to determinewhat type of diets dinosaurs ate? What are the dietsof different animals today? Think about the charac-teristics of these different animals. Do most meateaters share certain characteristics? What aboutplant eaters? Form a hypothesis about the skele-tal characteristics of plant eaters and meat eaters.
ObjectivesIn this GeoLab, you will:
• Gather data and communicate interpretationsabout the characteristics of meat eaters and planteaters.
• Form conclusions about the characteristics ofplant eating and meat eating dinosaurs.
• Discover how sauropods might have sharedfood resources.
Data SourcesGo to the Glencoe Science Web Site at
to find links to fossil data on the Internet. You can also visit your library or local natural history museum to gather information about dinosaur diets.
science.glencoe.com
Huge Appetites
P R E P A R A T I O N
This Late Cretaceous Tyrannosaurus isfrom Alberta, Canada. Triceratops was an herbivore.
Cop
yrig
ht ©
Gle
ncoe
/McG
raw
-Hill
, a d
ivis
ion
of t
he M
cGra
w-H
ill C
ompa
nies
, Inc
.
Name Class Date
GeoLab and MiniLab Worksheets Chapter 24 Earth Science: Geology, the Environment, and the Universe 97
Huge Appetites
1. Find a resource that describes skeletalcharacteristics of meat-eating and plant-eatingdinosaurs. The Glencoe Science Web Site listssites with information about dinosaurs.
2. Gather information from the links on theGlencoe Science Web Site or the library aboutthe environments that these two types ofdinosaurs lived in and which dinosaurs livedin the same environments.
3. Design a data table in the space below torecord your research results. Include categoriessuch as Dinosaur Name, Meat or Plant Eater,Food Preference, Skeletal Characteristics, Jawand Teeth Characteristics, and so on.
P L A N T H E E X P E R I M E N T
1. Complete your data table, including allinformation that you think is important.
2. Go to the Glencoe Science Web Site atto post your data.
3. Visit sites listed on the Glencoe Science WebSite for more information on the diets ofdinosaurs.
science.glencoe.com
P R O C E D U R E
DATA TABLE
Cop
yrig
ht ©
Gle
ncoe
/McG
raw
-Hill
, a d
ivis
ion
of t
he M
cGra
w-H
ill C
ompa
nies
, Inc
.
Name Class Date
98 Chapter 24 Earth Science: Geology, the Environment, and the Universe GeoLab and MiniLab Worksheets
Huge Appetites
Sharing Your Data Find this Internet GeoLab on the Glencoe Science Web Site at Post your data in the table provided for this activity. Use the additional data from other students to complete your chart and answer the Conclude and Apply questions.
1. What part of a dinosaur skeleton is most important in determining its diet? Why?What is the likelihood that this part of a skeleton will be preserved?
2. What are some other characteristics associated with dinosaur skeletons that helppaleontologists determine what their diets were like?
3. Which were more abundant, meat-eating dinosaurs or plant-eating dinosaurs? Why?
4. How did sauropods share food resources? Describe the evidence used bypaleontologists to determine how sauropods shared food resources.
5. How could the same evidence that is used to determine the diets of dinosaurs be usedfor other animals?
science.glencoe.com.
C O N C L U D E A N D A P P LY
Cop
yrig
ht ©
Gle
ncoe
/McG
raw
-Hill
, a d
ivis
ion
of t
he M
cGra
w-H
ill C
ompa
nies
, Inc
.
GeoLab and MiniLab Worksheets Chapter 25 Earth Science: Geology, the Environment, and the Universe 99
Name Class Date
Hard Water
Determine the hardness of water samples by observing how easily soap suds can be produced.
Procedure
1. Obtain six clean baby-food jars. Label them A through F.
2. Measure 20 mL of one water sample. Pour the water into the jar marked A.
3. Repeat step 2 four more times, using a different water sample for jars B through E.
4. Measure 20 mL of distilled water. Pour this water into jar F.
5. Place one drop of liquid soap in sample jars A through E. Do not place any soapin jar F. Tighten the lids. Then shake each jar vigorously for 5 seconds.
6. Using the following rating scale, record in your data table the amount ofsuds in each jar: 1—no suds, 2—few suds, 3—moderate amount of suds,4—lots of suds.
Analyze and Conclude
1. List the water samples in order from hardest to softest.
2. What is the difference between hard and soft water?
3. What are some disadvantages of hard water?
MiniLab 25MiniLab 25
Jar Amount of Suds
A
B
C
D
E
F
Cop
yrig
ht ©
Gle
ncoe
/McG
raw
-Hill
, a d
ivis
ion
of t
he M
cGra
w-H
ill C
ompa
nies
, Inc
.
100 Chapter 25 Earth Science: Geology, the Environment, and the Universe GeoLab and MiniLab Worksheets
Name Class Date
Most of Earth’s surface is covered with salty ocean water. Ocean water can be usedfor drinking water and other purposes if the salts are first removed. Solar energy
can be used to evaporate water from seawater, leaving the salts behind. The evaporatedwater can then be condensed into freshwater.
ProblemHow can you build a small-scale, working solardesalinator?
Possible Materialsclear plastic or Plexiglas
large pans to hold water
salt water
collecting containers
lamp
glass pan or beaker
hot plate
HypothesisThe Sun’s energy can be collected to desalinate salt water.
ObjectivesIn this GeoLab, you will:
• Design a model of a working solar desalinator.
• Assemble the model from design plans.
• Test the effectiveness of the design model.
• Analyze the model to suggest possible improvements.
Safety Precautions
Always wear safety goggles and an apron in the lab.Be careful when handling hot materials.
Designing a SolarDesalinator
P R E P A R A T I O N
Cop
yrig
ht ©
Gle
ncoe
/McG
raw
-Hill
, a d
ivis
ion
of t
he M
cGra
w-H
ill C
ompa
nies
, Inc
.
Name Class Date
GeoLab and MiniLab Worksheets Chapter 25 Earth Science: Geology, the Environment, and the Universe 101
Designing a Solar Desalinator
1. Use the library and go to to identify designs of solar desalinators.
2. Draw a design for your model desalinatorbelow. (Hint: Solar energy must be collectedin some way that allows sunlight to enter andcauses an increase in temperature inside thecontainer so that water in saturated air cancondense and be collected.)
3. Make a list of the materials you will need, andthen collect them.
4. Construct the desalinator you designed.
5. Test the desalinator by recording how long ittakes to collect the purified water and howmuch water was collected.
6. Test the water to see if it has been purified byboiling the water away. If any salt remains inthe container after the water has evaporated,your desalinator did not remove all of the saltsfrom the salt water.
science.glencoe.com
P L A N T H E E X P E R I M E N T
1. Interpreting Scientific Illustrations Draw the desalinator that you constructed.
A N A LY Z E
Cop
yrig
ht ©
Gle
ncoe
/McG
raw
-Hill
, a d
ivis
ion
of t
he M
cGra
w-H
ill C
ompa
nies
, Inc
.
Name Class Date
102 Chapter 25 Earth Science: Geology, the Environment, and the Universe GeoLab and MiniLab Worksheets
Designing a Solar Desalinator
1. What factors affected the efficiency of the desalinator?
2. How did your solar desalinator’s efficiency compare with the efficiencies of other students’ models?
3. How could you improve your desalinator?
4. What conclusions could be drawn from your investigation regarding the viability anduse of solar-powered desalinators?
C O N C L U D E A N D A P P LY
A N A LY Z E
2. Interpreting Observations How well did your desalinator work? On whatcriteria did you base the effectiveness of your desalinator?
3. Observing and Inferring What problems did you encounter in this investigation?
4. Comparing and Contrasting Compare and contrast your desalinator with oneof your classmate’s. What were the advantages or disadvantages of your design?
Cop
yrig
ht ©
Gle
ncoe
/McG
raw
-Hill
, a d
ivis
ion
of t
he M
cGra
w-H
ill C
ompa
nies
, Inc
.
GeoLab and MiniLab Worksheets Chapter 26 Earth Science: Geology, the Environment, and the Universe 103
Name Class Date
Oil Migration
Model the migration of oil and natural gas upward through layers of porous rocks.
Procedure
1. Pour 20 mL of cooking oil into a 100-mL graduated cylinder.
2. Carefully pour sand into the graduated cylinder until the sand-oil mixturereaches the 40-mL mark.
3. Now add a layer of colored aquarium gravel above the sand until thegravel reaches the 70-mL mark.
4. Pour tap water into the graduated cylinder until the water reaches the100-mL mark.
5. Let stand and observe for 5 minutes.
Analyze and Conclude
1. What does the cooking oil represent? What do the sand and aquariumgravel represent?
2. What happens when water is added to the mixture in the graduatedcylinder? Why does adding water cause this change?
3. Predict what might occur in the graduated cylinder if a carbonated softdrink was added to the mixture instead of water. What would thebubbles represent?
MiniLab 26MiniLab 26
Cop
yrig
ht ©
Gle
ncoe
/McG
raw
-Hill
, a d
ivis
ion
of t
he M
cGra
w-H
ill C
ompa
nies
, Inc
.
104 Chapter 26 Earth Science: Geology, the Environment, and the Universe GeoLab and MiniLab Worksheets
Name Class Date
Buildings can be designed to conserve heat energy. Some considerations involved inthe design of a building that conserves heat include the materials that will be used
in construction, the materials that will store heat, and the overall layout of the building.
ProblemHow can a building be designed to conserveenergy? What building materials will work best,and what other factors need to be considered?
Possible Materialsglass or clear plasticsturdy cardboard boxespaints of various colorsthermometersmaterials to cover the building
(paper, aluminum foil, foamboard, and so on)interior materials
(stones, mirrors, fabric, and so on )light source
HypothesisBrainstorm a list of design features that might contribute to the energy efficiency of a building.Hypothesize how you could incorporate some ofthese features into an energy-efficient building.Find out what materials are used in heat-efficienthomes and research local sources of materials for
your design. Decide how you will determine theheat efficiency of the building you construct. Besure to plan for a control building for comparison.
ObjectivesIn this GeoLab, you will:
• Research what materials are used in the construction of energy-efficient buildings.
• Design a building that is energy efficient.
• Construct the building that you design.
• Determine the heat efficiency of the buildingby comparing it to a control building.
• Interpret the data that you collect to determineyour success in developing an energy-efficientbuilding.
Safety Precautions
Be careful when you are using scissors.Make sure to handle the light source carefully when it is hot. Always wear safety goggles and an apron in the lab.
scissorstapeglue
Designing an Energy-Efficient Building
P R E P A R A T I O N
1. Review the data that you collected aboutbuilding energy-efficient buildings. Alsoreview your list of possible design features.
2. Design your building. Make a list of the heat-conserving issues that you addressed.
3. Decide on the materials that you will use tobuild your house. Collect those materials.
4. Construct the building and a control buildingfor comparison.
5. Devise a way to test the heat-holding ability ofeach building.
6. Proceed with the test on each building. To testthe buildings’ heat energy efficiency, it may benecessary to heat the buildings and determine
P L A N T H E E X P E R I M E N T
Cop
yrig
ht ©
Gle
ncoe
/McG
raw
-Hill
, a d
ivis
ion
of t
he M
cGra
w-H
ill C
ompa
nies
, Inc
.
Name Class Date
GeoLab and MiniLab Worksheets Chapter 26 Earth Science: Geology, the Environment, and the Universe 105
Designing an Energy-Efficient Building
P L A N T H E E X P E R I M E N T
TABLE
GRAPH
how long heat is conserved within each one.CAUTION: Make sure the heat source is farenough away from the building materials so that they do not burn or melt.
7. Draw a table and record your data.Then, make a graph of your data.
8. Make modifications to the design to improvethe building’s efficiency.
A N A LY Z E
1. Checking Your Hypothesis Was the building that you designed more energy-efficient than the control building? Why did you construct a control building?
Cop
yrig
ht ©
Gle
ncoe
/McG
raw
-Hill
, a d
ivis
ion
of t
he M
cGra
w-H
ill C
ompa
nies
, Inc
.
Name Class Date
106 Chapter 26 Earth Science: Geology, the Environment, and the Universe GeoLab and MiniLab Worksheets
Designing an Energy-Efficient Building
1. How could you incorporate some of your design elements in your own home?
2. How could your design be improved?
3. How could using different energy sources affect your results?
C O N C L U D E A N D A P P LY
2. Interpreting Observations What problems did you encounter, and how did you solve them?
3. Observing and Inferring How did your observations affect decisions that you mightmake if you were to repeat this lab? Why do you think your design worked or did not work?
4. Comparing and Contrasting Compare and contrast the building you designed and thecontrol building. Compare and contrast your design and the designs of your classmates.
5. Thinking Critically Suppose you could use only naturally occurring materials.Would that limit your design? Explain your answer.
A N A LY Z E
Cop
yrig
ht ©
Gle
ncoe
/McG
raw
-Hill
, a d
ivis
ion
of t
he M
cGra
w-H
ill C
ompa
nies
, Inc
.
GeoLab and MiniLab Worksheets Chapter 27 Earth Science: Geology, the Environment, and the Universe 107
Name Class Date
Reclamation
Model the procedure used by mining companies to reclaim an area after strip-mining.
Procedure
1. Using a plastic knife, make four or five cuts across the icing of one cream-filled, iced cupcake. Remove the pieces of icing.
2. Make four or five cuts down into the cake until you reach the creamfilling. Cut horizontally just above the cream filling and remove the cake pieces.
3. Remove the cream filling. To restore the area, use the pieces of cake thatyou cut out to fill in the hole left when you removed the cream filling.Make the surface of the cupcake as level as possible.
4. Replace the icing so that it covers the surface of the restored cupcake.
Analyze and Conclude
1. On the restored cupcake, what does the icing represent? What does thecream filling represent?
2. Does the reclaimed cupcake resemble the original, untouched cupcake?
3. Can reclamation of an area that has been strip-mined restore the land toits original contours? Explain your answer.
MiniLab 27MiniLab 27
Cop
yrig
ht ©
Gle
ncoe
/McG
raw
-Hill
, a d
ivis
ion
of t
he M
cGra
w-H
ill C
ompa
nies
, Inc
.
108 Chapter 27 Earth Science: Geology, the Environment, and the Universe GeoLab and MiniLab Worksheets
Name Class Date
Iris City and the surrounding region are shown in the map on the facing page. Iris City is a medium-sized city of 100 000. It is experiencing many types of environmental impacts.
Study the map and the information given to identify these problems and possible solutions.
ProblemHow can the residents of Iris City identify thesource of local water pollution?
Materialsmetric ruler
pencil
Pinpointing a Source ofPollution
P R E P A R A T I O N
1. Iris City obtains its drinking water from OpalLake. Studies of the lake have detected increasedlevels of nitrogen, phosphorus, hydrocarbons,sewage, and silt. The northwest end of OpalLake is experiencing increased development,while the remainder of the watershed is a mixof forest and logging clear-cuts.
2. Last spring, blooms of cyanobacteria chokedparts of the Vista Estuary Nature Preserve.Commercial shellfish beds in Iris Bay havebeen closed because of sewage contamination.
3. A natural-gas power plant has been proposed forlocation A, near the Vista Cutoff, an abandonedchannel of the Vista River. The plant wouldprovide jobs as well as generate electricity. Thecompany plans to divert 25 percent of the VistaRiver down the Vista Cutoff.
4. The Lucky Mine was abandoned 60 years ago.A mining company has applied for permits to reopen the mine. An estimated 1 millionounces of gold can be recovered using modern techniques.
P R O C E D U R E
1. What are some possible sources of water pollution in Opal Lake? What steps mightthe residents of Iris City take to protect their drinking water?
2. How are the blooms of cyanobacteria and the closing of the shellfish beds in Iris Bay related?
A N A LY Z E
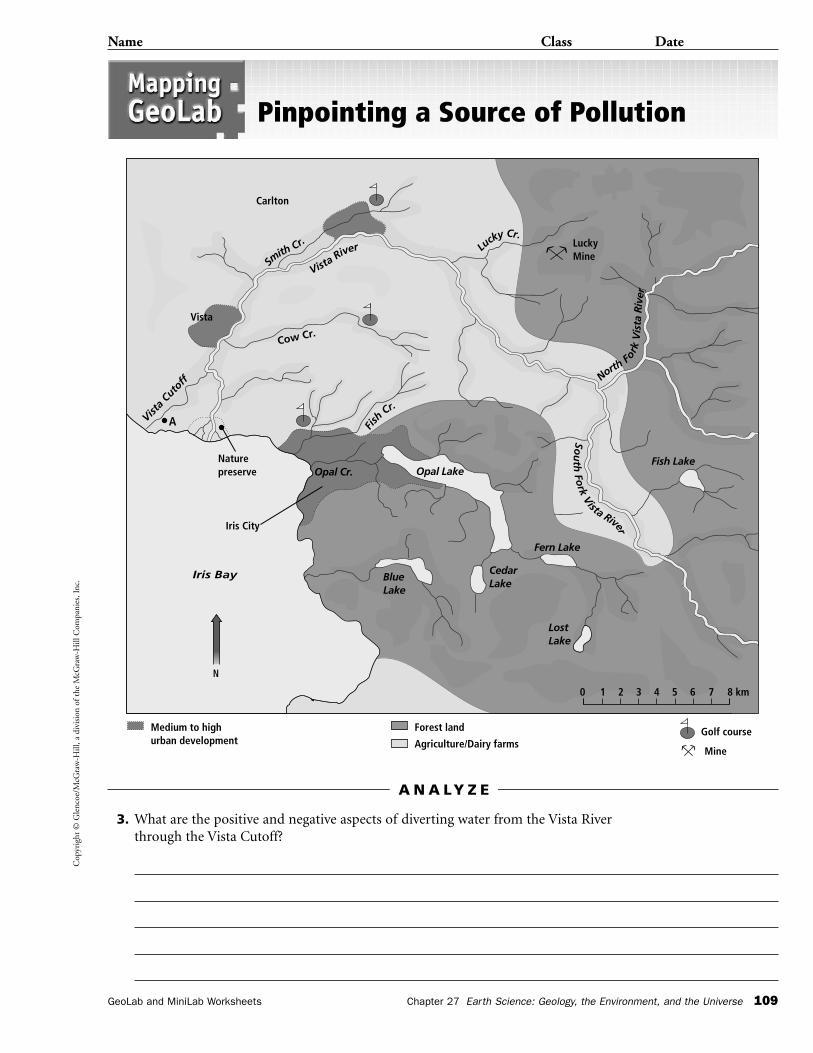
Cop
yrig
ht ©
Gle
ncoe
/McG
raw
-Hill
, a d
ivis
ion
of t
he M
cGra
w-H
ill C
ompa
nies
, Inc
.
Name Class Date
GeoLab and MiniLab Worksheets Chapter 27 Earth Science: Geology, the Environment, and the Universe 109
Pinpointing a Source of Pollution
Naturepreserve
Vista
Cutoff
Iris City
Iris Bay
Opal Cr. Opal Lake
BlueLake
LuckyMine
CedarLake
LostLake
Fern Lake
Vista
Carlton
Cow Cr.
A
VistaRiver
Fish
Cr.
NorthFor
kV
ista
Rive
r
Sou
thFo
rkVista River
Fish Lake
Smith
Cr. Lucky Cr.
0 8 km7654321
Medium to highurban development
Golf course
Mine
Forest land
Agriculture/Dairy farms
N
3. What are the positive and negative aspects of diverting water from the Vista Riverthrough the Vista Cutoff?
A N A LY Z E
Cop
yrig
ht ©
Gle
ncoe
/McG
raw
-Hill
, a d
ivis
ion
of t
he M
cGra
w-H
ill C
ompa
nies
, Inc
.
Name Class Date
110 Chapter 27 Earth Science: Geology, the Environment, and the Universe GeoLab and MiniLab Worksheets
Pinpointing a Source of Pollution
1. Identify the sources of water pollution in Iris Bay. Are these point or nonpoint sources of pollution?
2. How could you identify the source of pollution causing cyanobacteria blooms in the Vista Estuary?
3. If the Vista Cutoff is used to divert water from the Vista River, how will the aquatichabitats of the river be affected?
4. If the Lucky Mine is reopened, what could the mining company do to minimizenegative environmental impacts?
C O N C L U D E A N D A P P LY
A N A LY Z E
4. If the Lucky Mine is reopened, what effects might it have on the populations ofCarlton, Vista, and Iris City?
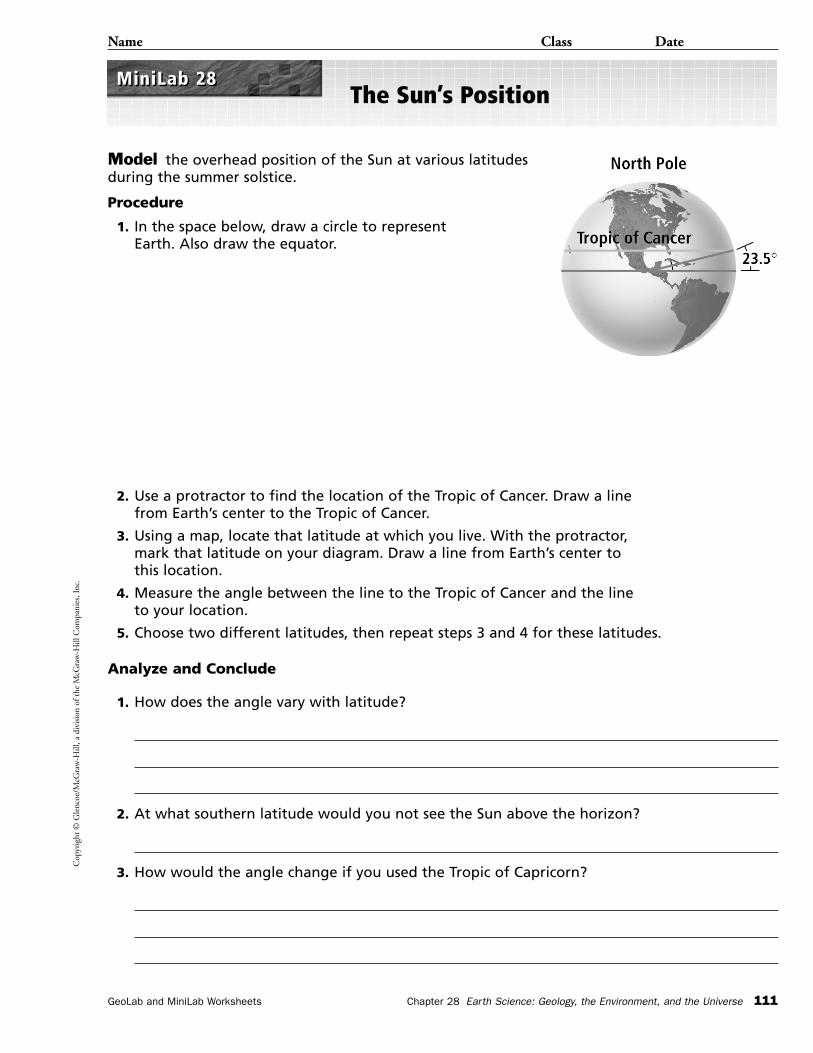
Cop
yrig
ht ©
Gle
ncoe
/McG
raw
-Hill
, a d
ivis
ion
of t
he M
cGra
w-H
ill C
ompa
nies
, Inc
.
GeoLab and MiniLab Worksheets Chapter 28 Earth Science: Geology, the Environment, and the Universe 111
Name Class Date
The Sun’s Position
Model the overhead position of the Sun at various latitudesduring the summer solstice.
Procedure
1. In the space below, draw a circle to representEarth. Also draw the equator.
2. Use a protractor to find the location of the Tropic of Cancer. Draw a linefrom Earth’s center to the Tropic of Cancer.
3. Using a map, locate that latitude at which you live. With the protractor,mark that latitude on your diagram. Draw a line from Earth’s center tothis location.
4. Measure the angle between the line to the Tropic of Cancer and the lineto your location.
5. Choose two different latitudes, then repeat steps 3 and 4 for these latitudes.
Analyze and Conclude
1. How does the angle vary with latitude?
2. At what southern latitude would you not see the Sun above the horizon?
3. How would the angle change if you used the Tropic of Capricorn?
MiniLab 28MiniLab 28
1. What problems did you encounter?
2. Based on information from all the photos, what features are usually the oldest? The youngest?
A N A LY Z E
Cop
yrig
ht ©
Gle
ncoe
/McG
raw
-Hill
, a d
ivis
ion
of t
he M
cGra
w-H
ill C
ompa
nies
, Inc
.
112 Chapter 28 Earth Science: Geology, the Environment, and the Universe GeoLab and MiniLab Worksheets
Name Class Date
It is possible to use the principle of cross-cutting relationships, discussed in Chapter 21,to determine the relative ages of surface features on the Moon. By observing which
features cross-cut others, you can infer which is older.
ProblemHow can you use images of the Moon to interpretrelative ages of lunar features?
Materialsmetric ruler
pencil
Relative Ages of LunarFeatures
P R E P A R A T I O N
1. Observe photos I and II. Use the letters to identify the oldest feature in each photousing the principle of cross-cutting relationships. List the other features in order oftheir relative ages.
2. Observe photo III. List the mare, rille, and craters in order of their relative ages.
3. Observe photo IV. Use the principle of cross-cutting relationships, along with your knowledgeof lunar history, to identify the features and list them in order of their relative ages.
P R O C E D U R E
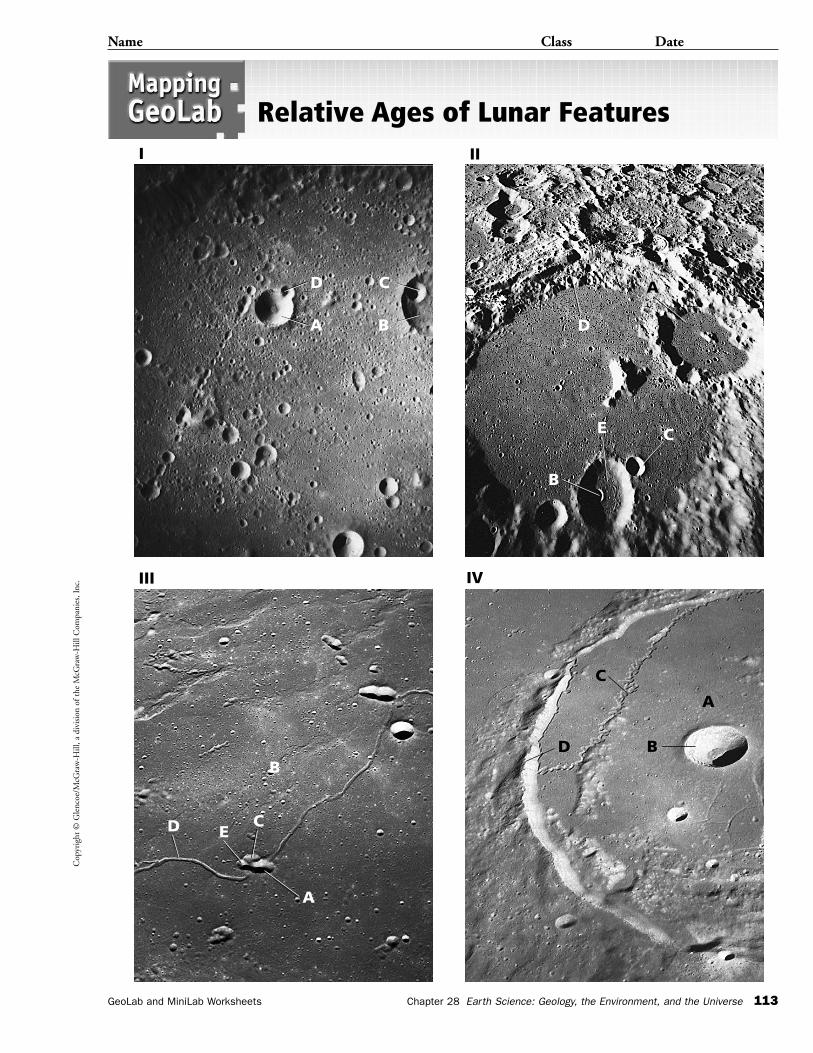
Cop
yrig
ht ©
Gle
ncoe
/McG
raw
-Hill
, a d
ivis
ion
of t
he M
cGra
w-H
ill C
ompa
nies
, Inc
.
Name Class Date
GeoLab and MiniLab Worksheets Chapter 28 Earth Science: Geology, the Environment, and the Universe 113
Relative Ages of Lunar Features
D
C
B
A
I II
IV
C
B
D
A
A
B
D
CE
D
B
CE
A
III
Cop
yrig
ht ©
Gle
ncoe
/McG
raw
-Hill
, a d
ivis
ion
of t
he M
cGra
w-H
ill C
ompa
nies
, Inc
.
Name Class Date
114 Chapter 28 Earth Science: Geology, the Environment, and the Universe GeoLab and MiniLab Worksheets
Relative Ages of Lunar Features
3. Could scientists use the process you did to determine the exact age difference betweentwo overlapping craters? Why or why not?
4. If the small crater in photo II, labeled A, is 44 km across, what is the scale for thatphoto? What is the size of the large crater, labeled D?
A N A LY Z E
1. Which would be older, a crater that had rays crossing it or the crater that caused the rays? Explain.
2. Is there some type of relative-age dating that scientists can use to analyze craters on Earth? Explain.
3. What do you think caused the chain of craters in photo I? If the crater labeled A isapproximately 17 km across, how long is the chain of craters?
C O N C L U D E A N D A P P LY
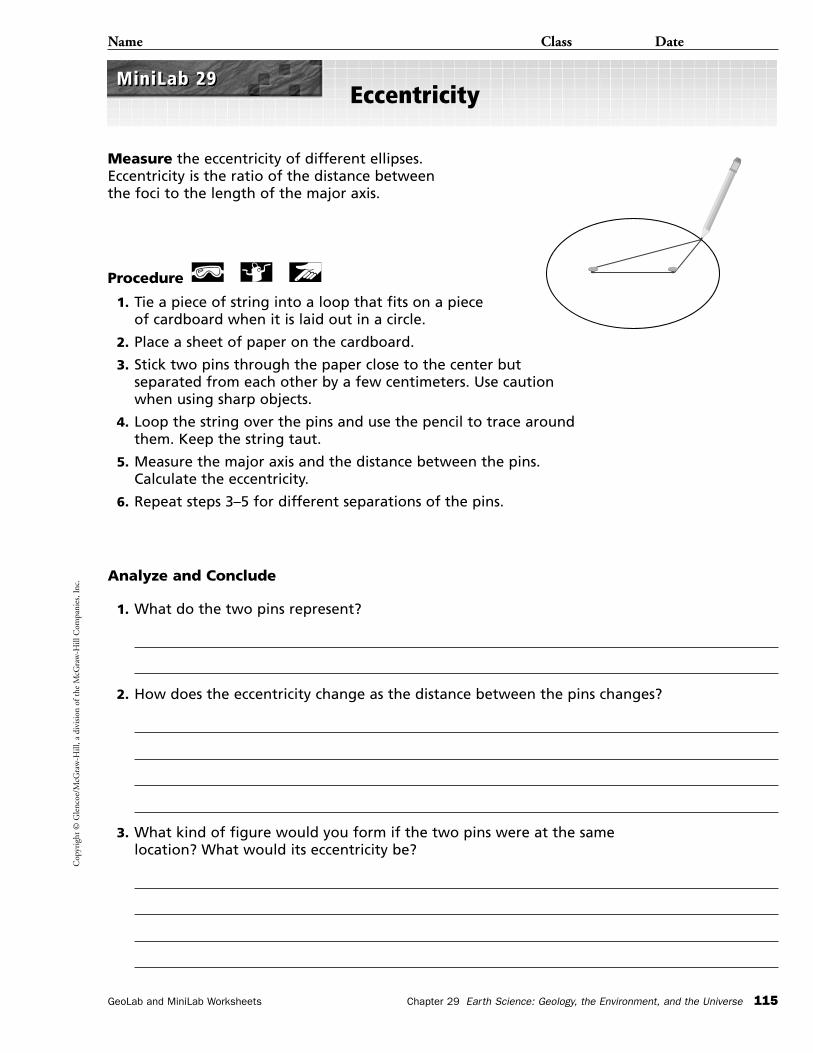
Cop
yrig
ht ©
Gle
ncoe
/McG
raw
-Hill
, a d
ivis
ion
of t
he M
cGra
w-H
ill C
ompa
nies
, Inc
.
GeoLab and MiniLab Worksheets Chapter 29 Earth Science: Geology, the Environment, and the Universe 115
Name Class Date
Eccentricity
Measure the eccentricity of different ellipses.Eccentricity is the ratio of the distance betweenthe foci to the length of the major axis.
Procedure
1. Tie a piece of string into a loop that fits on a piece of cardboard when it is laid out in a circle.
2. Place a sheet of paper on the cardboard.
3. Stick two pins through the paper close to the center butseparated from each other by a few centimeters. Use cautionwhen using sharp objects.
4. Loop the string over the pins and use the pencil to trace aroundthem. Keep the string taut.
5. Measure the major axis and the distance between the pins.Calculate the eccentricity.
6. Repeat steps 3–5 for different separations of the pins.
Analyze and Conclude
1. What do the two pins represent?
2. How does the eccentricity change as the distance between the pins changes?
3. What kind of figure would you form if the two pins were at the samelocation? What would its eccentricity be?
MiniLab 29MiniLab 29
Cop
yrig
ht ©
Gle
ncoe
/McG
raw
-Hill
, a d
ivis
ion
of t
he M
cGra
w-H
ill C
ompa
nies
, Inc
.
116 Chapter 29 Earth Science: Geology, the Environment, and the Universe GeoLab and MiniLab Worksheets
Name Class Date
Astronomers are familiar with both the small, such as interstellar dust particles, andthe large, such as the solar system. In order to understand the variety of sizes in the
solar system, astronomers use models. These models can be as simple as putting people orobjects in marked places or as complex as elaborate computer simulations. The mostdifficult task with many models is choosing a scale that will display all the informationneeded, such as distance, rotation rates, and size.
ProblemHow can the size of the solar system be convertedto a scale that will easily demonstrate relative distances between objects in the solar system? Is distance the only measurement that can bedemonstrated in a scale model?
Possible Materialscalculator
tape measure
meterstick
stopwatches
marker
masking tape
variety of sizes of common round objects
HypothesisBrainstorm about possible models and data neededto create them. Determine where these data areavailable, and collect them to use as a reference foryour model. To have your model fit in your chosenarea, make a hypothesis on the appropriate scale to use for distance from the Sun to each planet.
Hypothesize how additional solar system measurements can be included in your model. Forexample, think about including planet diameters,rotation rates, etc.
ObjectivesIn this GeoLab, you will:
• Calculate the distance from the Sun for eachplanet based on your scale.
• Determine how to incorporate additional solarsystem measurements into your model, or designanother model to show that information.
• Interpret your results based on your scale, anddecide if your scale was an appropriate one basedon the problems that may have resulted.
Scaling the Solar System
P R E P A R A T I O N
Cop
yrig
ht ©
Gle
ncoe
/McG
raw
-Hill
, a d
ivis
ion
of t
he M
cGra
w-H
ill C
ompa
nies
, Inc
.
Name Class Date
GeoLab and MiniLab Worksheets Chapter 29 Earth Science: Geology, the Environment, and the Universe 117
Scaling the Solar System
1. As a group, use a separate sheet of paper tomake a list of possible ways you might testyour hypotheses. Keep the available materialsin mind as you plan your procedure.
2. Be sure your scale is appropriate for theinformation you are representing. Rememberthat a model should have the same scalethroughout. You may have to try more thanone scale before you are successful.
3. Record your procedure and list every step.Determine what materials are needed andthe amounts of each.
4. Design and construct a data table for recordingyour original data and your scaled data, usingthe space below.
5. Check the plan. Make sure your teacher hasapproved your plan before you proceed withyour experiment.
6. Carry out your plan.
P L A N T H E E X P E R I M E N T
Cop
yrig
ht ©
Gle
ncoe
/McG
raw
-Hill
, a d
ivis
ion
of t
he M
cGra
w-H
ill C
ompa
nies
, Inc
.
Name Class Date
118 Chapter 29 Earth Science: Geology, the Environment, and the Universe GeoLab and MiniLab Worksheets
Scaling the Solar System
1. Checking Your Hypothesis Which scale worked the best for your model?Explain.
2. Interpreting Observations What problems did you have in finding a scale?Explain how you corrected the problems.
3. Calculating Results List and explain the conversions that you used to create yourscale model. If multiple steps were necessary to convert to your scale units, how couldthey be combined to make the process simpler?
4. Observing and Inferring What possible problems could result from using avery large scale? A small scale? Explain why depicting a scale model of the solar systemon a sheet of notebook paper is extremely difficult.
A N A LY Z E
Cop
yrig
ht ©
Gle
ncoe
/McG
raw
-Hill
, a d
ivis
ion
of t
he M
cGra
w-H
ill C
ompa
nies
, Inc
.
Name Class Date
GeoLab and MiniLab Worksheets Chapter 29 Earth Science: Geology, the Environment, and the Universe 119
Scaling the Solar System
1. Proxima Centauri, the closest star to our Sun, is about 4.01 � 1013 km from the Sun. Based on yourscale, how far would Proxima Centauri be from the sun in your model? If you were to fit the distancebetween the Sun and Proxima Centauri into your classroom, how small would the scaled distancebetween Pluto and the Sun be?
2. An interstellar dust particle is 1.0 � 10�6 m in length. Convert this measurement to your scale.How many dust particles could fit in the distance between the Sun and Jupiter? Between Marsand Uranus?
C O N C L U D E A N D A P P LY
5. Compare and Contrast Compare and contrast your model with one of your classmates’.What were the advantages of the scale you used? What were the disadvantages? How wouldyou improve your model?
6. Thinking Critically Suppose that the outer planets are three times farther awaythan they are now. How would this affect your model? What scale would you choosenow? Explain.
A N A LY Z E

Cop
yrig
ht ©
Gle
ncoe
/McG
raw
-Hill
, a d
ivis
ion
of t
he M
cGra
w-H
ill C
ompa
nies
, Inc
.
GeoLab and MiniLab Worksheets Chapter 30 Earth Science: Geology, the Environment, and the Universe 121
Name Class Date
Parallax in the Classroom
Model stellar parallax and the change in parallax angle with distance.
Procedure
1. Place a meterstick at a fixed position and attach a 4-m piece of string toeach end.
2. Stand away from the meterstick and hold the two strings together to forma triangle. Be sure to hold the strings taut. Measure your distance from themeterstick. Record your measurement.
3. Measure the angle between the two pieces of string with a protractor.Record your measurement of the angle.
4. Repeat steps 2 and 3 for different distances from the meterstick byshortening or lengthening the string.
5. Make a graph in the space below of the angles versus their distance fromthe meterstick.
Analyze and Conclude
1. What does the length of the meterstick represent? The angle?
2. What does the graph show? How does parallax angle depend on distance?
3. Are the angles that you measured similar to actual stellar parallaxangles? Explain.
MiniLab 30MiniLab 30
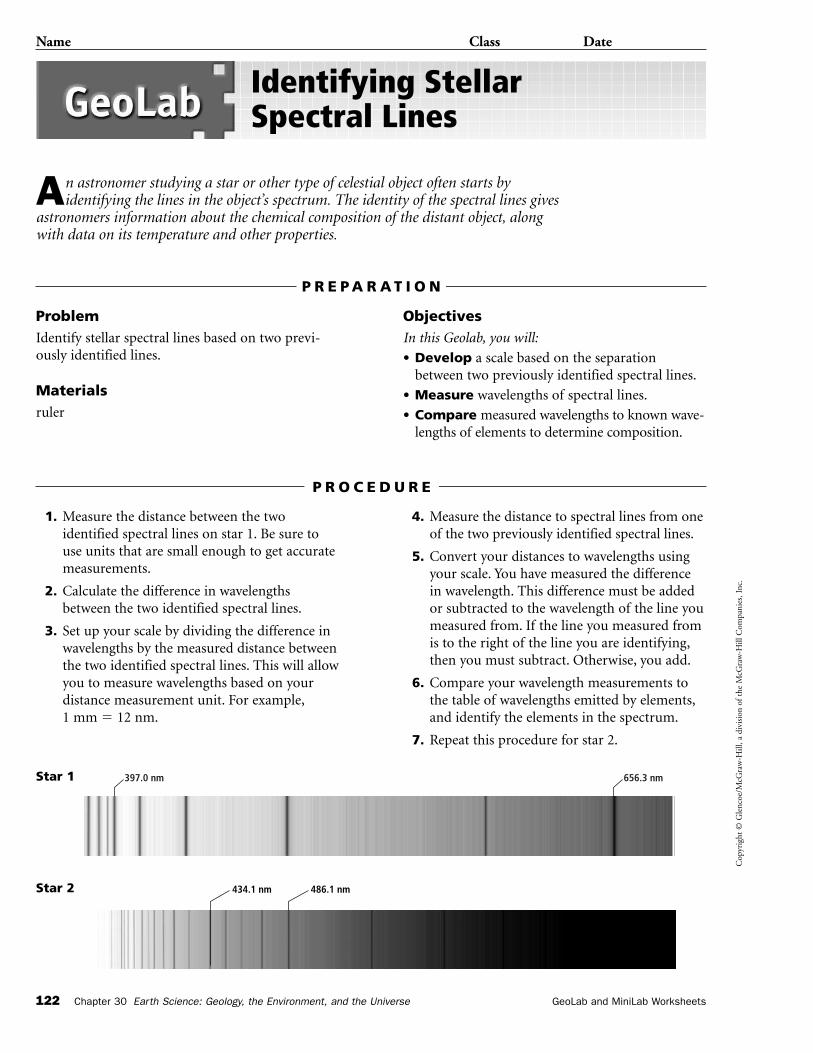
Cop
yrig
ht ©
Gle
ncoe
/McG
raw
-Hill
, a d
ivis
ion
of t
he M
cGra
w-H
ill C
ompa
nies
, Inc
.
122 Chapter 30 Earth Science: Geology, the Environment, and the Universe GeoLab and MiniLab Worksheets
Name Class Date
An astronomer studying a star or other type of celestial object often starts byidentifying the lines in the object’s spectrum. The identity of the spectral lines gives
astronomers information about the chemical composition of the distant object, alongwith data on its temperature and other properties.
ProblemIdentify stellar spectral lines based on two previ-ously identified lines.
Materialsruler
ObjectivesIn this Geolab, you will:
• Develop a scale based on the separationbetween two previously identified spectral lines.
• Measure wavelengths of spectral lines.
• Compare measured wavelengths to known wave-lengths of elements to determine composition.
Identifying Stellar Spectral Lines
P R E P A R A T I O N
1. Measure the distance between the twoidentified spectral lines on star 1. Be sure touse units that are small enough to get accuratemeasurements.
2. Calculate the difference in wavelengthsbetween the two identified spectral lines.
3. Set up your scale by dividing the difference inwavelengths by the measured distance betweenthe two identified spectral lines. This will allowyou to measure wavelengths based on yourdistance measurement unit. For example,1 mm � 12 nm.
4. Measure the distance to spectral lines from oneof the two previously identified spectral lines.
5. Convert your distances to wavelengths usingyour scale. You have measured the differencein wavelength. This difference must be addedor subtracted to the wavelength of the line youmeasured from. If the line you measured fromis to the right of the line you are identifying,then you must subtract. Otherwise, you add.
6. Compare your wavelength measurements tothe table of wavelengths emitted by elements,and identify the elements in the spectrum.
7. Repeat this procedure for star 2.
P R O C E D U R E
Star 1
Star 2
397.0 nm 656.3 nm
486.1 nm434.1 nm
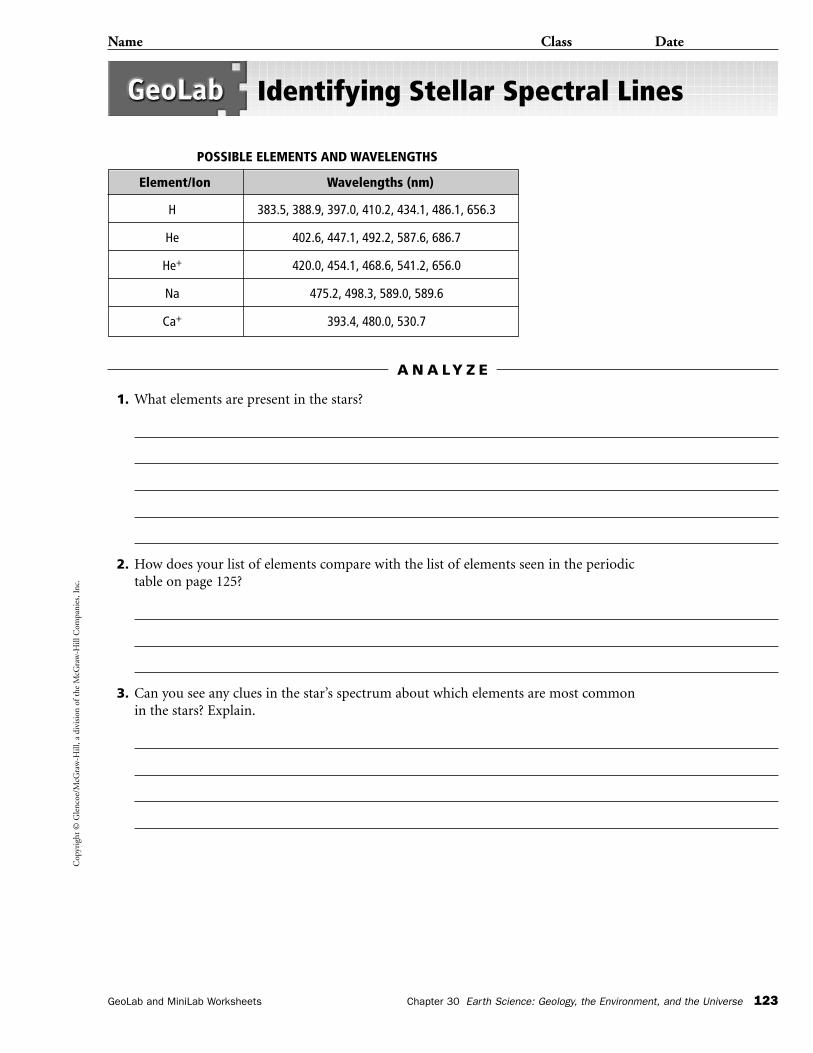
Cop
yrig
ht ©
Gle
ncoe
/McG
raw
-Hill
, a d
ivis
ion
of t
he M
cGra
w-H
ill C
ompa
nies
, Inc
.
Name Class Date
GeoLab and MiniLab Worksheets Chapter 30 Earth Science: Geology, the Environment, and the Universe 123
Identifying Stellar Spectral Lines
1. What elements are present in the stars?
2. How does your list of elements compare with the list of elements seen in the periodictable on page 125?
3. Can you see any clues in the star’s spectrum about which elements are most commonin the stars? Explain.
A N A LY Z E
Element/Ion Wavelengths (nm)
H 383.5, 388.9, 397.0, 410.2, 434.1, 486.1, 656.3
He 402.6, 447.1, 492.2, 587.6, 686.7
He+ 420.0, 454.1, 468.6, 541.2, 656.0
Na 475.2, 498.3, 589.0, 589.6
Ca+ 393.4, 480.0, 530.7
POSSIBLE ELEMENTS AND WAVELENGTHS
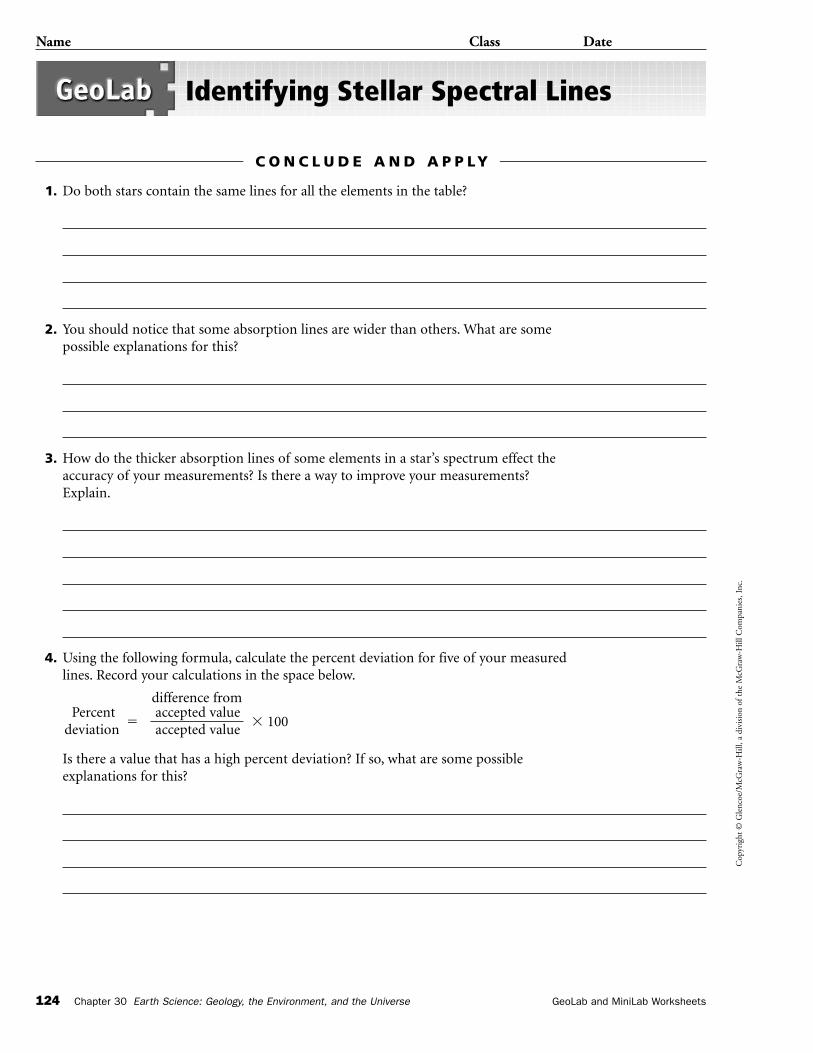
Cop
yrig
ht ©
Gle
ncoe
/McG
raw
-Hill
, a d
ivis
ion
of t
he M
cGra
w-H
ill C
ompa
nies
, Inc
.
Name Class Date
124 Chapter 30 Earth Science: Geology, the Environment, and the Universe GeoLab and MiniLab Worksheets
Identifying Stellar Spectral Lines
1. Do both stars contain the same lines for all the elements in the table?
2. You should notice that some absorption lines are wider than others. What are somepossible explanations for this?
3. How do the thicker absorption lines of some elements in a star’s spectrum effect theaccuracy of your measurements? Is there a way to improve your measurements?Explain.
4. Using the following formula, calculate the percent deviation for five of your measuredlines. Record your calculations in the space below.
difference from Percent
�accepted value
� 100deviation accepted value
Is there a value that has a high percent deviation? If so, what are some possibleexplanations for this?
C O N C L U D E A N D A P P LY
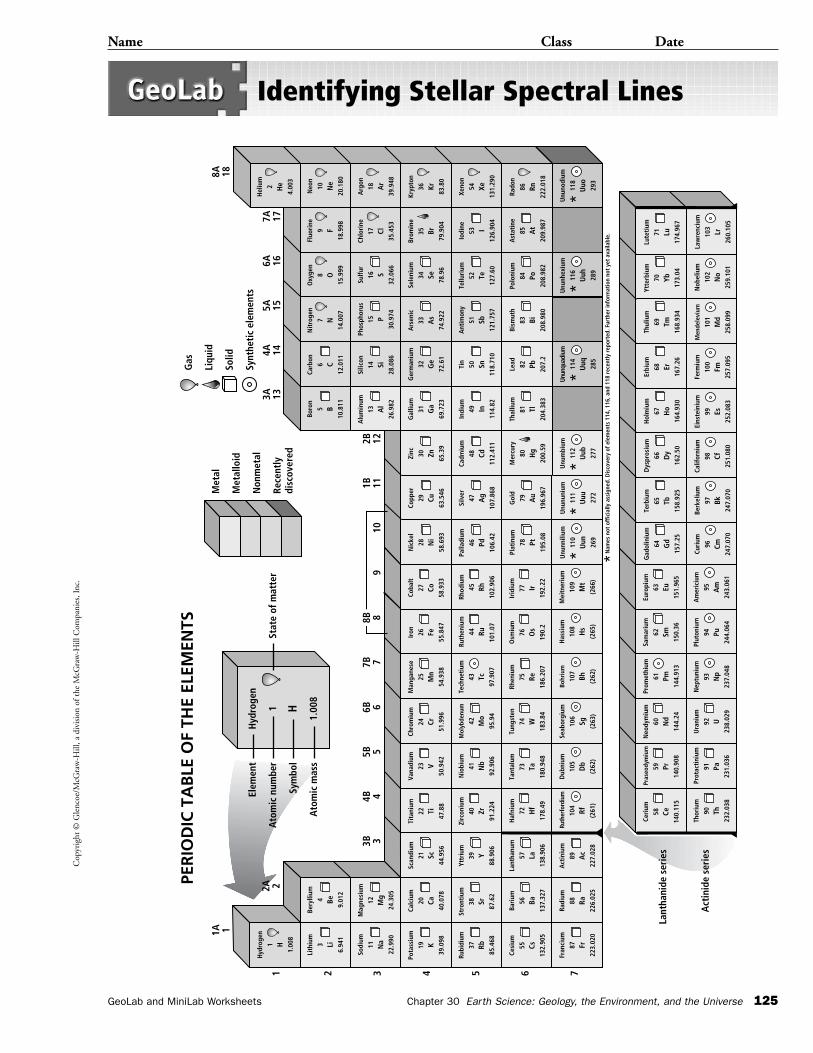
Cop
yrig
ht ©
Gle
ncoe
/McG
raw
-Hill
, a d
ivis
ion
of t
he M
cGra
w-H
ill C
ompa
nies
, Inc
.
Name Class Date
GeoLab and MiniLab Worksheets Chapter 30 Earth Science: Geology, the Environment, and the Universe 125
Identifying Stellar Spectral Lines
PER
IOD
IC T
AB
LE O
F TH
E EL
EMEN
TS
Hyd
roge
n
1 H
1.00
8
Elem
ent
Ato
mic
num
ber
Sym
bol
Ato
mic
mas
s
Stat
e of
mat
ter
Met
al
Met
allo
id
Non
met
al
Rece
ntly
di
scov
ered
Gas
Liqu
id
Solid
Synt
heti
c el
emen
tsH
ydro
gen
1 H1.
008
Hel
ium
2 He
4.00
3
Lith
ium
3 Li6.
941
Sodi
um
11 Na
22.9
90
Pota
ssiu
m
19 K39
.098
Rubi
dium
37 Rb85
.468
Cesi
um
55 Cs13
2.90
5
Fran
cium
87 Fr22
3.02
0
Radi
um
88 Ra22
6.02
5
Ceri
um
58 Ce14
0.11
5
Thor
ium
90 Th23
2.03
8
Ura
nium
92 U23
8.02
9
Nep
tuni
um
93 Np
237.
048
Plut
oniu
m
94 Pu24
4.06
4
Am
eric
ium
95 Am
243.
061
Curi
um
96 Cm24
7.07
0
Berk
eliu
m
97 Bk24
7.07
0
Calif
orni
um
98 Cf25
1.08
0
Eins
tein
ium
99 Es25
2.08
3
Ferm
ium
100
Fm25
7.09
5
Nob
eliu
m
102
No
259.
101
Law
renc
ium
103
Lr26
0.10
5
Men
dele
vium
101
Md
258.
099
Neo
dym
ium
60 Nd
144.
24
Prom
ethi
um
61 Pm14
4.91
3
Sam
ariu
m
62 Sm15
0.36
Euro
pium
63 Eu15
1.96
5
Gad
olin
ium
64 Gd
157.
25
Terb
ium
65 Tb15
8.92
5
Dys
pros
ium
66 Dy
162.
50
Hol
miu
m
67 Ho
164.
930
Erbi
um
68 Er16
7.26
Thul
ium
69 Tm16
8.93
4
Ytte
rbiu
m
70 Yb17
3.04
Lute
tium
71 Lu17
4.96
7
Pra
seod
ymiu
m
59 Pr14
0.90
8
Pro
tact
iniu
m
91 Pa23
1.03
6
Act
iniu
m
89 Ac
227.
028
Rut
herf
ordi
um
104
Rf (261
)
Bari
um
56 Ba13
7.32
7
Lant
hanu
m
57 La13
8.90
6
Haf
nium
72 Hf
178.
49
Tant
alum
73 Ta18
0.94
8
Dub
nium
105
Db
(262
)
Seab
orgi
um
106
Sg (263
)
Has
sium
108
Hs
(265
)
Mei
tner
ium
109
Mt
(266
)
Unu
nnili
um
110
Uun 269
Unu
nuni
um
111
Uuu 272
Unu
mbi
um
112
Uub 277
Unun
quad
ium
114
Uuq 285
Unu
nhex
ium
116
Uuh 289
Unu
nodi
um
118
Uuo 293
Bohr
ium
107
Bh (262
)
Tung
sten
74 W18
3.84
Rhen
ium
75 Re18
6.20
7
Osm
ium
76 Os
190.
2
Irid
ium
77 Ir19
2.22
Plat
inum
78 Pt19
5.08
Gol
d
79 Au
196.
967
Mer
cury
80 Hg
200.
59
Thal
lium
81 Tl20
4.38
3
Lead 82 Pb 207.
2
Bism
uth
83 Bi20
8.98
0
Ast
atin
e
85 At
209.
987
Rado
n
86 Rn22
2.01
8
Stro
ntiu
m
38 Sr87
.62
Yttr
ium
39 Y88
.906
Zirc
oniu
m
40 Zr91
.224
Nio
bium
41 Nb
92.9
06
Mol
ybde
num
42 Mo
95.9
4
Calc
ium
20 Ca40
.078
Scan
dium
21 Sc44
.956
Tita
nium
22 Ti47
.88
Vana
dium
23 V50
.942
Chro
miu
m
24 Cr51
.996
Tech
neti
um
43 Tc97
.907
Ruth
eniu
m
44 Ru10
1.07
Man
gane
se
25 Mn
54.9
38
Iron 26 Fe
55.8
47
Coba
lt
27 Co58
.933
Nic
kel
28 Ni
58.6
93
Copp
er
29 Cu63
.546
Zinc 30 Zn
65.3
9
Gal
lium
31 Ga
69.7
23
Ger
man
ium
32 Ge
72.6
1
Ars
enic
33 As
74.9
22
Sele
nium
34 Se78
.96
Brom
ine
35 Br79
.904
Kryp
ton
36 Kr83
.80
Rhod
ium
45 Rh10
2.90
6
Palla
dium
46 Pd10
6.42
Silv
er
47 Ag
107.
868
Cadm
ium
48 Cd11
2.41
1
Indi
um
49 In11
4.82
Tin
50 Sn11
8.71
0
Ant
imon
y
51 Sb12
1.75
7
Tellu
rium
52 Te12
7.60
Iodi
ne
53 I12
6.90
4
Xeno
n
54 Xe13
1.29
0
Mag
nesi
um
12 Mg
24.3
05
Alu
min
um
13 Al
26.9
82
Silic
on
14 Si28
.086
Phos
phor
us
15 P30
.974
Sulfu
r
16 S32
.066
Chlo
rine
17 Cl35
.453
Arg
on
18 Ar
39.9
48
Bery
llium
4 Be 9.01
2
Boro
n
5 B10
.811
Carb
on
6 C12
.011
Nit
roge
n
7 N14
.007
Oxy
gen
8 O15
.999
Fluo
rine
9 F18
.998
Neo
n
10 Ne
20.1
80
Lant
hani
de s
erie
s
Act
inid
e se
ries
1A 1
12A 2
2 3 4 5 6 7
910
1B 112B 12
3A 134A 14
5A 156A 16
7A 17
8A 18
3B 34B 4
5B 56B 6
7B 7
Polo
nium
84 Po20
8.98
2
Nam
es n
ot o
ffic
ially
ass
igne
d. D
isco
very
of e
lem
ents
114
, 116
, and
118
rec
entl
y re
port
ed. F
urth
er in
form
atio
n no
t ye
t av
aila
ble.
***
**
**
8B 8

Cop
yrig
ht ©
Gle
ncoe
/McG
raw
-Hill
, a d
ivis
ion
of t
he M
cGra
w-H
ill C
ompa
nies
, Inc
.
GeoLab and MiniLab Worksheets Chapter 31 Earth Science: Geology, the Environment, and the Universe 127
Name Class Date
Measuring Redshifts
Model uniform expansion of the universe and the redshifts of galaxies that result from expansion.
Procedure
1. Use a felt tip marking pen to make four dots in a row, each separated by 1 cm, on the surface of an uninflated balloon. Label the dots 1, 2, 3, and 4.
2. Partially inflate the balloon. Using a piece of string and a meterstick,measure the distance from dot 1 to each of the other dots. Record yourmeasurements.
3. Inflate the balloon further, and again measure the distance from dot 1 to each of the other dots. Record your measurements.
4. Repeat step 3 with the balloon fully inflated.
Analyze and Conclude
1. Are the dots still separated from each other by equal distances? Explain.
2. How far did each dot move away from dot 1 after each inflation?
3. What would be the result if you had measured the distances from dot 4instead of dot 1? From dot 2?
4. How does this activity illustrate uniform expansion of the universe andredshifts of galaxies?
MiniLab 31MiniLab 31
Cop
yrig
ht ©
Gle
ncoe
/McG
raw
-Hill
, a d
ivis
ion
of t
he M
cGra
w-H
ill C
ompa
nies
, Inc
.
128 Chapter 31 Earth Science: Geology, the Environment, and the Universe GeoLab and MiniLab Worksheets
Name Class Date
Edwin Hubble developed rules for classifying galaxies according to their shapes as seenin telescopic images. Astronomers are interested in the classification of galaxies. This
information can indicate whether a certain type of galaxy is more likely to form thananother and helps astronomers unravel the mystery of galaxy formation in the universe.Using the resources of the Internet and sharing data with your peers, you can learn howgalaxies are classified.
ProblemHow can different galaxies be classified?
HypothesisHow might galaxies be classified using Hubble’sclassification system? Are there absolute classifica-tions based solely on shape? Form a hypothesisabout how you can apply Hubble’s galaxy classifica-tion system to galaxy images on the Internet.
ObjectivesIn this Geolab, you will:
• Gather and communicate details about galaxyimages on the Internet.
• Form conclusions about the classification ofdifferent galaxies.
• Reconstruct the tuning-fork diagram withimages that you find.
Data SourcesGo to the Glencoe Science Web Site at
to find links to galaxy images on the Internet. You can also visit a local library or observatory to gather images of galaxies and information about them.
science.glencoe.com
Classifying Galaxies
P R E P A R A T I O N
1. Find a resource with multiple images ofgalaxies and, if possible, names or catalognumbers for the galaxies. The Glencoe ScienceWeb Site lists sites that have galaxy images.
2. Choose one of the following types of galaxiesto start your classification: spirals, ellipticals,or irregular galaxies.
3. Gather images and information, such ascatalog numbers and names of galaxies, fromthe links on the Glencoe Science Web Site orthe library.
4. Sort the images by basic types: spirals,ellipticals, or irregular galaxies.
5. For each basic type, compare the galaxiesto each other and decide which galaxy bestrepresents each class and subclass of Hubble’sgalaxy classification system: Sa, Sb, Sc, SBa,SBb, SBc, S0, E0–E7, and Irr. Try to find atleast one galaxy for each subclass.
6. Arrange the galaxy images to construct atuning-fork diagram like Hubble’s.
P L A N T H E E X P E R I M E N T
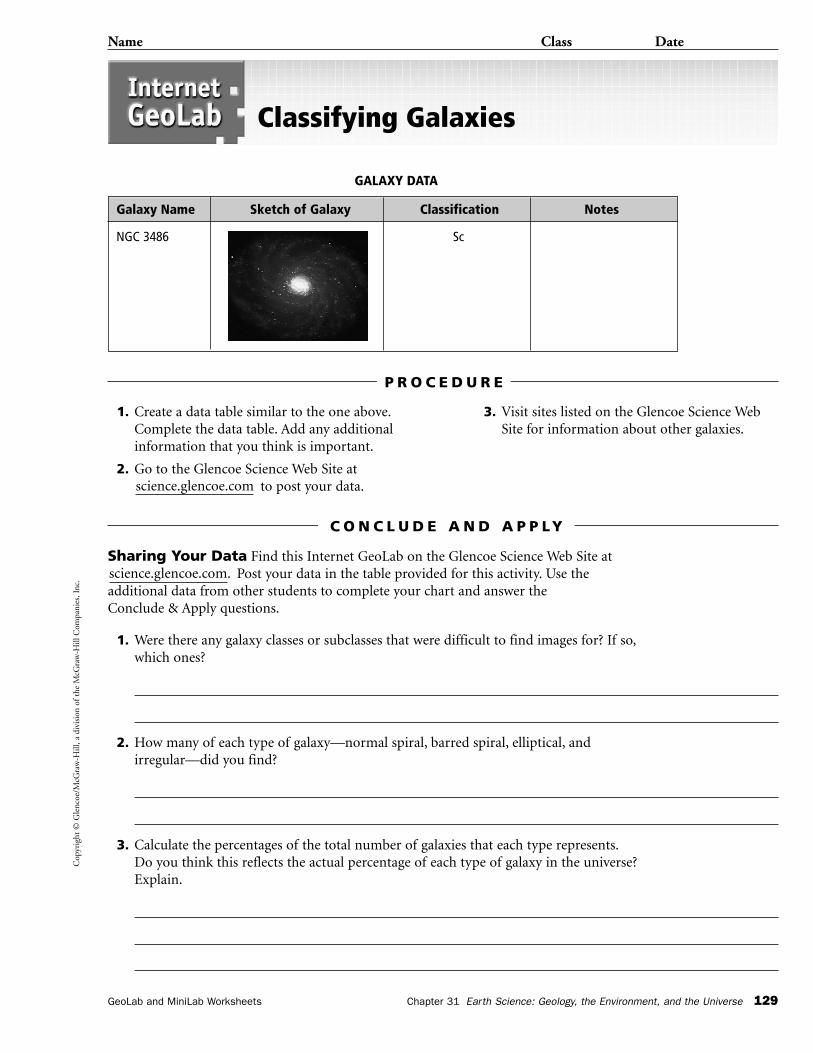
Cop
yrig
ht ©
Gle
ncoe
/McG
raw
-Hill
, a d
ivis
ion
of t
he M
cGra
w-H
ill C
ompa
nies
, Inc
.
Name Class Date
GeoLab and MiniLab Worksheets Chapter 31 Earth Science: Geology, the Environment, and the Universe 129
Classifying Galaxies
1. Create a data table similar to the one above.Complete the data table. Add any additionalinformation that you think is important.
2. Go to the Glencoe Science Web Site atto post your data.
3. Visit sites listed on the Glencoe Science WebSite for information about other galaxies.
science.glencoe.com
P R O C E D U R E
Sharing Your Data Find this Internet GeoLab on the Glencoe Science Web Site at Post your data in the table provided for this activity. Use the
additional data from other students to complete your chart and answer the Conclude & Apply questions.
1. Were there any galaxy classes or subclasses that were difficult to find images for? If so,which ones?
2. How many of each type of galaxy—normal spiral, barred spiral, elliptical, andirregular—did you find?
3. Calculate the percentages of the total number of galaxies that each type represents.Do you think this reflects the actual percentage of each type of galaxy in the universe?Explain.
science.glencoe.com.
C O N C L U D E A N D A P P LY
Galaxy Name Sketch of Galaxy Classification Notes
NGC 3486 Sc
GALAXY DATA
Cop
yrig
ht ©
Gle
ncoe
/McG
raw
-Hill
, a d
ivis
ion
of t
he M
cGra
w-H
ill C
ompa
nies
, Inc
.
Name Class Date
130 Chapter 31 Earth Science: Geology, the Environment, and the Universe GeoLab and MiniLab Worksheets
Classifying Galaxies
4. Were there any galaxy images that you found that didn’t fit your classification scheme?If so, why?
5. Was it difficult to distinguish between a normal spiral and a barred spiral in somecases? Explain your method.
6. What problems did you have with galaxies that are edge-on as seen from Earth?
7. Ellipticals are usually a difficult type of galaxy to classify. Why?
C O N C L U D E A N D A P P LY
Cop
yrig
ht ©
Gle
ncoe
/McG
raw
-Hill
, a d
ivis
ion
of t
he M
cGra
w-H
ill C
ompa
nies
, Inc
.
ANSWER PAGESGeoLab and MiniLab Worksheets
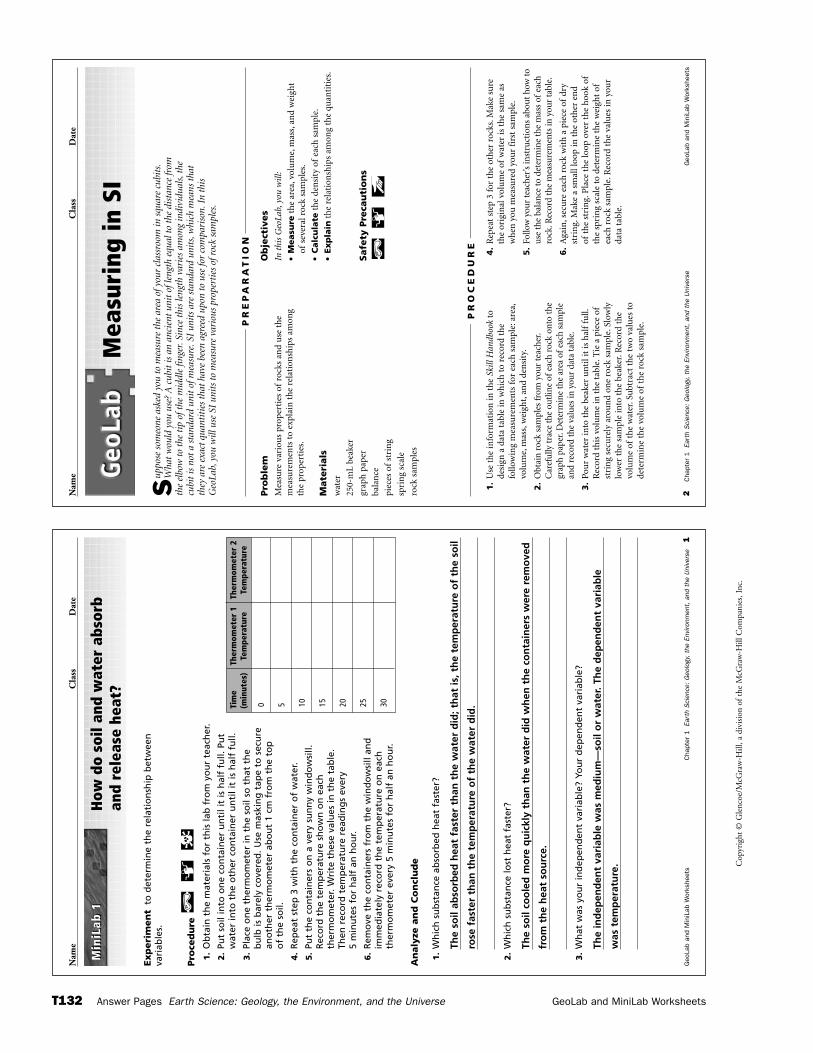
Cop
yrig
ht ©
Gle
ncoe
/McG
raw
-Hill
, a d
ivis
ion
of t
he M
cGra
w-H
ill C
ompa
nies
, Inc
.
T132 Answer Pages Earth Science: Geology, the Environment, and the Universe GeoLab and MiniLab Worksheets
2C
hapt
er 1
Eart
h S
cien
ce:
Geo
logy
, th
e En
viro
nmen
t, a
nd t
he U
nive
rse
Geo
Lab
and
Min
iLab
Wor
kshe
ets
Nam
eC
lass
Dat
e
Sup
pose
som
eone
ask
ed y
ou t
o m
easu
re t
he a
rea
ofyo
ur c
lass
room
in s
quar
e cu
bits
.W
hat
wou
ld y
ou u
se?
A c
ubit
is a
n an
cien
t un
it o
flen
gth
equa
l to
the
dist
ance
from
the
elbo
w t
o th
e ti
p of
the
mid
dle
finge
r.Si
nce
this
leng
th v
arie
s am
ong
indi
vidu
als,
the
cubi
t is
not
a s
tand
ard
unit
ofm
easu
re.S
I un
its
are
stan
dard
uni
ts,w
hich
mea
ns t
hat
they
are
exa
ct q
uant
itie
s th
at h
ave
been
agr
eed
upon
to
use
for
com
pari
son.
In t
his
Geo
Lab,
you
will
use
SI
unit
s to
mea
sure
var
ious
pro
pert
ies
ofro
ck s
ampl
es.
Pro
ble
mM
easu
re v
ario
us
prop
erti
es o
fro
cks
and
use
th
em
easu
rem
ents
to
expl
ain
th
e re
lati
onsh
ips
amon
gth
e pr
oper
ties
.
Mate
rials
wat
er
250-
mL
beak
er
grap
h p
aper
bala
nce
piec
es o
fst
rin
g
spri
ng
scal
e
rock
sam
ples
Ob
ject
ives
In t
his
Geo
Lab,
you
will
:
•M
easu
reth
e ar
ea,v
olu
me,
mas
s,an
d w
eigh
tof
seve
ral r
ock
sam
ples
.
•C
alc
ula
teth
e de
nsi
ty o
fea
ch s
ampl
e.
•Exp
lain
the
rela
tion
ship
s am
ong
the
quan
titi
es.
Safe
ty P
reca
uti
on
s
Mea
suri
ng in
SI
PR
EP
AR
AT
ION
1.
Use
th
e in
form
atio
n in
th
e Sk
ill H
andb
ook
tode
sign
a d
ata
tabl
e in
wh
ich
to
reco
rd t
he
follo
win
g m
easu
rem
ents
for
eac
h s
ampl
e:ar
ea,
volu
me,
mas
s,w
eigh
t,an
d de
nsi
ty.
2.
Obt
ain
roc
k sa
mpl
es fr
om y
our
teac
her.
Car
eful
ly t
race
the
out
line
ofea
ch r
ock
onto
the
grap
h pa
per.
Det
erm
ine
the
area
of
each
sam
ple
and
reco
rd t
he v
alue
s in
you
r da
ta t
able
.
3.
Pou
r w
ater
into
th
e be
aker
un
til i
t is
hal
ffu
ll.R
ecor
d th
is v
olu
me
in t
he
tabl
e.T
ie a
pie
ce o
fst
rin
g se
cure
ly a
rou
nd
one
rock
sam
ple.
Slow
lylo
wer
th
e sa
mpl
e in
to t
he
beak
er.R
ecor
d th
evo
lum
e of
the
wat
er.S
ubt
ract
th
e tw
o va
lues
to
dete
rmin
e th
e vo
lum
e of
the
rock
sam
ple.
4.
Rep
eat
step
3 f
or t
he
oth
er r
ocks
.Mak
e su
reth
e or
igin
al v
olu
me
ofw
ater
is t
he
sam
e as
wh
en y
ou m
easu
red
you
r fi
rst
sam
ple.
5.
Follo
w y
our
teac
her’
s in
stru
ctio
ns
abou
t ho
w t
ous
e th
e ba
lan
ce t
o de
term
ine
the
mas
s of
each
rock
.Rec
ord
the
mea
sure
men
ts in
you
r ta
ble.
6.
Aga
in,s
ecu
re e
ach
roc
k w
ith
a p
iece
of
dry
stri
ng.
Mak
e a
smal
l loo
p in
th
e ot
her
en
dof
the
stri
ng.
Pla
ce t
he
loop
ove
r th
e h
ook
ofth
e sp
rin
g sc
ale
to d
eter
min
e th
e w
eigh
t of
each
roc
k sa
mpl
e.R
ecor
d th
e va
lues
in y
our
data
tab
le.
PR
OC
ED
UR
E
Geo
Lab
and
Min
iLab
Wor
kshe
ets
Cha
pter
1Ea
rth
Sci
ence
: G
eolo
gy,
the
Envi
ronm
ent,
and
the
Uni
vers
e1
Nam
eC
lass
Dat
e
How
do
soil
and
wat
er a
bsor
b an
d re
leas
e he
at?
Exp
eri
men
tto
det
erm
ine
the
rela
tio
nsh
ip b
etw
een
vari
able
s.
Pro
ced
ure
1.
Ob
tain
th
e m
ater
ials
fo
r th
is la
b f
rom
yo
ur
teac
her
.
2.
Put
soil
into
on
e co
nta
iner
un
til i
t is
hal
f fu
ll. P
ut
wat
er in
to t
he
oth
er c
on
tain
er u
nti
l it
is h
alf
full.
3.
Plac
e o
ne
ther
mo
met
er in
th
e so
il so
th
at t
he
bu
lb is
bar
ely
cove
red
. Use
mas
kin
g t
ape
to s
ecu
rean
oth
er t
her
mo
met
er a
bo
ut
1 cm
fro
m t
he
top
of
the
soil.
4.
Rep
eat
step
3 w
ith
th
e co
nta
iner
of
wat
er.
5.
Put
the
con
tain
ers
on
a v
ery
sun
ny
win
do
wsi
ll.R
eco
rd t
he
tem
per
atu
re s
ho
wn
on
eac
hth
erm
om
eter
. Wri
te t
hes
e va
lues
in t
he
tab
le.
Then
rec
ord
tem
per
atu
re r
ead
ing
s ev
ery
5 m
inu
tes
for
hal
f an
ho
ur.
6.
Rem
ove
th
e co
nta
iner
s fr
om
th
e w
ind
ow
sill
and
imm
edia
tely
rec
ord
th
e te
mp
erat
ure
on
eac
hth
erm
om
eter
eve
ry 5
min
ute
s fo
r h
alf
an h
ou
r.
An
aly
ze a
nd
Co
ncl
ud
e
1.
Wh
ich
su
bst
ance
ab
sorb
ed h
eat
fast
er?
The
soil
abso
rbed
hea
t fa
ster
th
an t
he
wat
er d
id; t
hat
is, t
he
tem
per
atu
re o
f th
e so
il
rose
fas
ter
than
th
e te
mp
erat
ure
of
the
wat
er d
id.
2.
Wh
ich
su
bst
ance
lost
hea
t fa
ster
?
The
soil
coo
led
mo
re q
uic
kly
than
th
e w
ater
did
wh
en t
he
con
tain
ers
wer
e re
mo
ved
fro
m t
he
hea
t so
urc
e.
3.
Wh
at w
as y
ou
r in
dep
end
ent
vari
able
? Yo
ur
dep
end
ent
vari
able
?
The
ind
epen
den
t va
riab
le w
as m
ediu
m—
soil
or
wat
er. T
he
dep
end
ent
vari
able
was
tem
per
atu
re.
Min
iLab
1M
iniL
ab 1
Tim
eTh
erm
omet
er 1
Ther
mom
eter
2(m
inut
es)
Tem
pera
ture
Tem
pera
ture
0 5 10 15 20 25 30
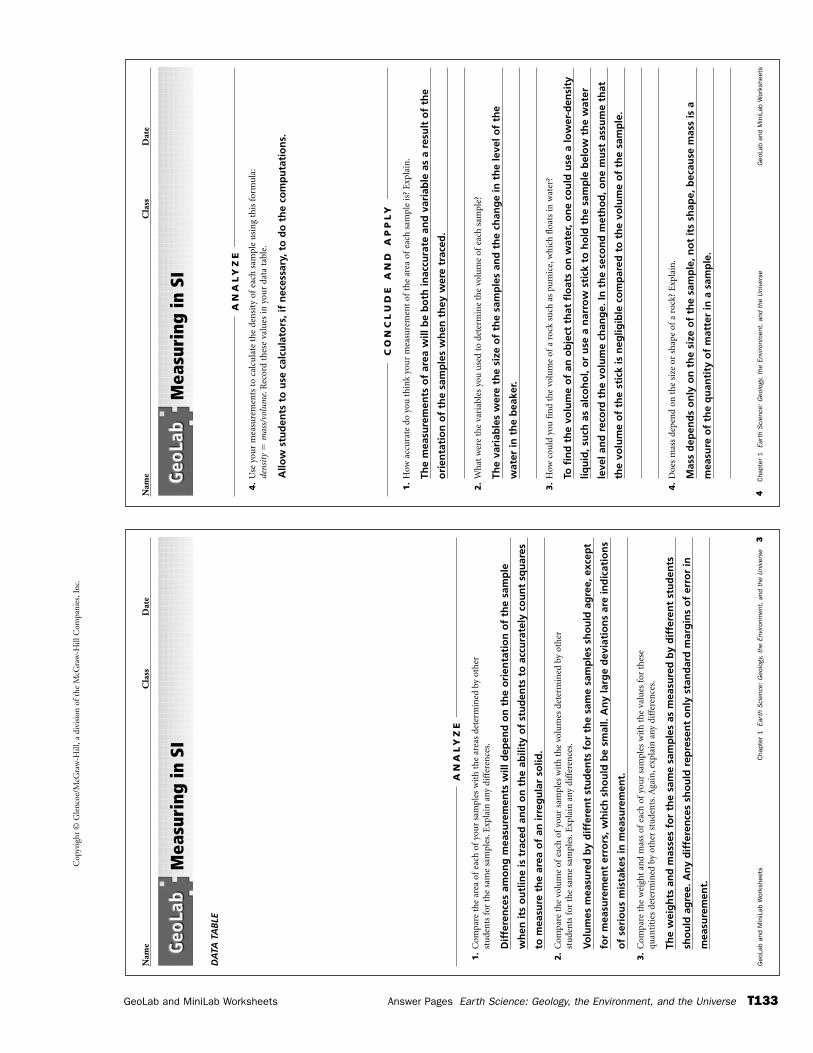
Cop
yrig
ht ©
Gle
ncoe
/McG
raw
-Hill
, a d
ivis
ion
of t
he M
cGra
w-H
ill C
ompa
nies
, Inc
.
GeoLab and MiniLab Worksheets Answer Pages Earth Science: Geology, the Environment, and the Universe T133
Nam
eC
lass
Dat
e
4C
hapt
er 1
Eart
h S
cien
ce:
Geo
logy
, th
e En
viro
nmen
t, a
nd t
he U
nive
rse
Geo
Lab
and
Min
iLab
Wor
kshe
ets
Mea
suri
ng in
SI
4.
Use
you
r m
easu
rem
ents
to
calc
ula
te t
he
den
sity
of
each
sam
ple
usi
ng
this
for
mu
la:
dens
ity
�m
ass/
volu
me.
Rec
ord
thes
e va
lues
in y
our
data
tab
le.
1.
How
acc
ura
te d
o yo
u t
hin
k yo
ur
mea
sure
men
t of
the
area
of
each
sam
ple
is?
Exp
lain
.
The
mea
sure
men
ts o
f ar
ea w
ill b
e b
oth
inac
cura
te a
nd
var
iab
le a
s a
resu
lt o
f th
e
ori
enta
tio
n o
f th
e sa
mp
les
wh
en t
hey
wer
e tr
aced
.
2.
Wh
at w
ere
the
vari
able
s yo
u u
sed
to d
eter
min
e th
e vo
lum
e of
each
sam
ple?
The
vari
able
s w
ere
the
size
of
the
sam
ple
s an
d t
he
chan
ge
in t
he
leve
l of
the
wat
er in
th
e b
eake
r.
3.
How
cou
ld y
ou f
ind
the
volu
me
ofa
rock
su
ch a
s pu
mic
e,w
hic
h f
loat
s in
wat
er?
To f
ind
th
e vo
lum
e o
f an
ob
ject
th
at f
loat
s o
n w
ater
, on
e co
uld
use
a lo
wer
-den
sity
liqu
id, s
uch
as
alco
ho
l, o
r u
se a
nar
row
sti
ck t
o h
old
th
e sa
mp
le b
elo
w t
he
wat
er
leve
l an
d r
eco
rd t
he
volu
me
chan
ge.
In t
he
seco
nd
met
ho
d, o
ne
mu
st a
ssu
me
that
the
volu
me
of
the
stic
k is
neg
ligib
le c
om
par
ed t
o t
he
volu
me
of
the
sam
ple
.
4.
Doe
s m
ass
depe
nd
on t
he
size
or
shap
e of
a ro
ck?
Exp
lain
.
Mas
s d
epen
ds
on
ly o
n t
he
size
of
the
sam
ple
, no
t it
s sh
ape,
bec
ause
mas
s is
a
mea
sure
of
the
qu
anti
ty o
f m
atte
r in
a s
amp
le.
CO
NC
LU
DE
AN
D A
PP
LY
AN
AL
YZ
E
Allo
w s
tud
ents
to
use
cal
cula
tors
, if
nec
essa
ry, t
o d
o t
he
com
pu
tati
on
s.
Nam
eC
lass
Dat
e
Geo
Lab
and
Min
iLab
Wor
kshe
ets
Cha
pter
1Ea
rth
Sci
ence
: G
eolo
gy,
the
Envi
ronm
ent,
and
the
Uni
vers
e3
Mea
suri
ng in
SI
1.
Com
pare
th
e ar
ea o
fea
ch o
fyo
ur
sam
ples
wit
h t
he
area
s de
term
ined
by
oth
erst
ude
nts
for
th
e sa
me
sam
ples
.Exp
lain
any
dif
fere
nce
s.
Dif
fere
nce
s am
on
g m
easu
rem
ents
will
dep
end
on
th
e o
rien
tati
on
of
the
sam
ple
wh
en it
s o
utl
ine
is t
race
d a
nd
on
th
e ab
ility
of
stu
den
ts t
o a
ccu
rate
ly c
ou
nt
squ
ares
to m
easu
re t
he
area
of
an ir
reg
ula
r so
lid.
2.
Com
pare
th
e vo
lum
e of
each
of
you
r sa
mpl
es w
ith
th
e vo
lum
es d
eter
min
ed b
y ot
her
stu
den
ts f
or t
he
sam
e sa
mpl
es.E
xpla
in a
ny d
iffe
ren
ces.
Vo
lum
es m
easu
red
by
dif
fere
nt
stu
den
ts f
or
the
sam
e sa
mp
les
sho
uld
ag
ree,
exc
ept
for
mea
sure
men
t er
rors
, wh
ich
sh
ou
ld b
e sm
all.
An
y la
rge
dev
iati
on
s ar
e in
dic
atio
ns
of
seri
ou
s m
ista
kes
in m
easu
rem
ent.
3.
Com
pare
th
e w
eigh
t an
d m
ass
ofea
ch o
fyo
ur
sam
ples
wit
h t
he
valu
es f
or t
hes
equ
anti
ties
det
erm
ined
by
oth
er s
tude
nts
.Aga
in,e
xpla
in a
ny d
iffe
ren
ces.
The
wei
gh
ts a
nd
mas
ses
for
the
sam
e sa
mp
les
as m
easu
red
by
dif
fere
nt
stu
den
ts
sho
uld
ag
ree.
An
y d
iffe
ren
ces
sho
uld
rep
rese
nt
on
ly s
tan
dar
d m
arg
ins
of
erro
r in
mea
sure
men
t.
AN
AL
YZ
E
DA
TATA
BLE
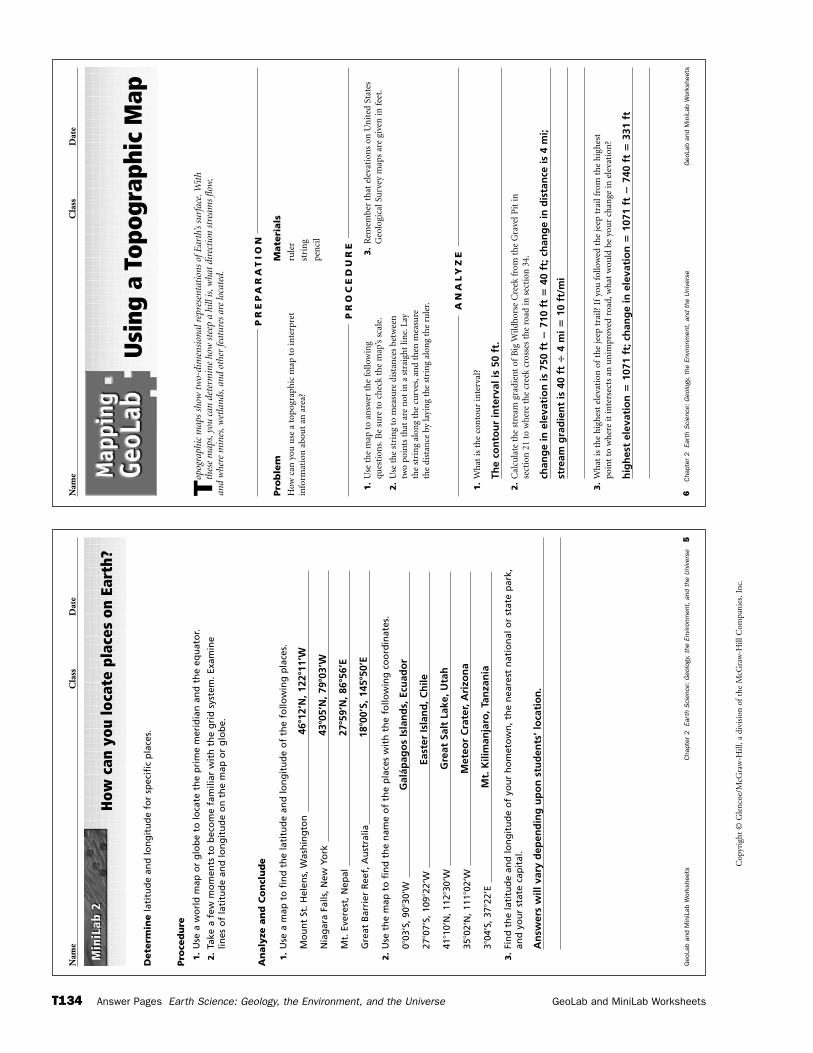
Cop
yrig
ht ©
Gle
ncoe
/McG
raw
-Hill
, a d
ivis
ion
of t
he M
cGra
w-H
ill C
ompa
nies
, Inc
.
T134 Answer Pages Earth Science: Geology, the Environment, and the Universe GeoLab and MiniLab Worksheets
1.
Wh
at is
th
e co
nto
ur
inte
rval
?
The
con
tou
r in
terv
al is
50
ft.
2.
Cal
cula
te t
he
stre
am g
radi
ent
ofB
ig W
ildh
orse
Cre
ek f
rom
th
e G
rave
l Pit
inse
ctio
n21
to
wh
ere
the
cree
k cr
osse
s th
e ro
ad in
sec
tion
34.
chan
ge
in e
leva
tio
n is
750
ft
�71
0 ft
�40
ft;
ch
ang
e in
dis
tan
ce is
4 m
i;
stre
am g
rad
ien
t is
40
ft �
4 m
i �10
ft/
mi
3.
Wh
at is
th
e h
igh
est
elev
atio
n o
fth
e je
ep t
rail?
If
you
fol
low
ed t
he
jeep
tra
il fr
om t
he
hig
hes
tpo
int
to w
her
e it
inte
rsec
ts a
n u
nim
prov
ed r
oad,
wh
at w
ould
be
you
r ch
ange
in e
leva
tion
?
hig
hes
t el
evat
ion
�10
71 f
t; c
han
ge
in e
leva
tio
n �
1071
ft
�74
0 ft
�33
1 ft
AN
AL
YZ
E
6C
hapt
er 2
Eart
h S
cien
ce:
Geo
logy
, th
e En
viro
nmen
t, a
nd t
he U
nive
rse
Geo
Lab
and
Min
iLab
Wor
kshe
ets
Nam
eC
lass
Dat
e
Top
ogra
phic
map
s sh
ow t
wo-
dim
ensi
onal
rep
rese
ntat
ions
ofE
arth
’s su
rfac
e.W
ith
thes
e m
aps,
you
can
dete
rmin
e ho
w s
teep
a h
ill is
,wha
t di
rect
ion
stre
ams
flow
,an
dw
here
min
es,w
etla
nds,
and
othe
r fe
atur
es a
re lo
cate
d.
Pro
ble
mH
ow c
an y
ou u
se a
top
ogra
phic
map
to
inte
rpre
tin
form
atio
n a
bou
t an
are
a?
Mate
rials
rule
r
stri
ng
pen
cil
Usi
ng a
Top
ogra
phic
Map
PR
EP
AR
AT
ION
1.
Use
th
e m
ap t
o an
swer
th
e fo
llow
ing
ques
tion
s.B
e su
re t
o ch
eck
the
map
’s s
cale
.
2.
Use
the
str
ing
to m
easu
re d
ista
nce
s be
twee
ntw
o po
ints
tha
t ar
e n
ot in
a s
trai
ght
line.
Lay
the
stri
ng
alon
g th
e cu
rves
,an
d th
en m
easu
reth
e di
stan
ce b
y la
yin
g th
e st
rin
g al
ong
the
rule
r.
3.
Rem
embe
r th
at e
leva
tion
s on
Un
ited
Sta
tes
Geo
logi
cal S
urv
ey m
aps
are
give
n in
fee
t.
PR
OC
ED
UR
E
Geo
Lab
and
Min
iLab
Wor
kshe
ets
Cha
pter
2Ea
rth
Sci
ence
: G
eolo
gy,
the
Envi
ronm
ent,
and
the
Uni
vers
e5
Nam
eC
lass
Dat
e
How
can
you
loca
te p
lace
s on
Ear
th?
Dete
rmin
ela
titu
de
and
lon
git
ud
e fo
r sp
ecif
ic p
lace
s.
Pro
ced
ure
1.
Use
a w
orl
d m
ap o
r g
lob
e to
loca
te t
he
pri
me
mer
idia
n a
nd
th
e eq
uat
or.
2.
Take
a f
ew m
om
ents
to
bec
om
e fa
mili
ar w
ith
th
eg
rid
sys
tem
. Exa
min
elin
es o
f la
titu
de
and
lon
git
ud
e o
n t
he
map
or
glo
be.
An
aly
ze a
nd
Co
ncl
ud
e
1.
Use
a m
ap t
o f
ind
th
e la
titu
de
and
lon
git
ud
e o
f th
e fo
llow
ing
pla
ces.
Mo
un
t St
. Hel
ens,
Was
hin
gto
n
Nia
gar
a Fa
lls, N
ew Y
ork
Mt.
Eve
rest
, Nep
al
Gre
at B
arri
er R
eef,
Au
stra
lia
2.
Use
th
e m
ap t
o f
ind
th
e n
ame
of
the
pla
ces
wit
h t
he
follo
win
g c
oo
rdin
ates
.
0�03
’S, 9
0�30
’W
27�0
7’S,
109
�22’
W
41�1
0’N
, 112
�30’
W
35�0
2’N
, 111
�02’
W
3�04
’S, 3
7�22
’E
3.
Fin
d t
he
lati
tud
e an
d lo
ng
itu
de
of
you
r h
om
eto
wn
, th
e n
eare
st n
atio
nal
or
stat
e p
ark,
and
you
r st
ate
cap
ital
.
An
swer
s w
ill v
ary
dep
end
ing
up
on
stu
den
ts’ l
oca
tio
n.
Mt.
Kili
man
jaro
, Tan
zan
ia
Met
eor
Cra
ter,
Ari
zon
a
Gre
at S
alt
Lake
, Uta
h
East
er Is
lan
d, C
hile
Gal
ápag
os
Isla
nd
s, E
cuad
or
18�0
0’S,
145
�50’
E
27�5
9’N
, 86�
56’E
43�0
5’N
, 79�
03’W
46�1
2’N
, 122
�11’
W
Min
iLab
2M
iniL
ab 2
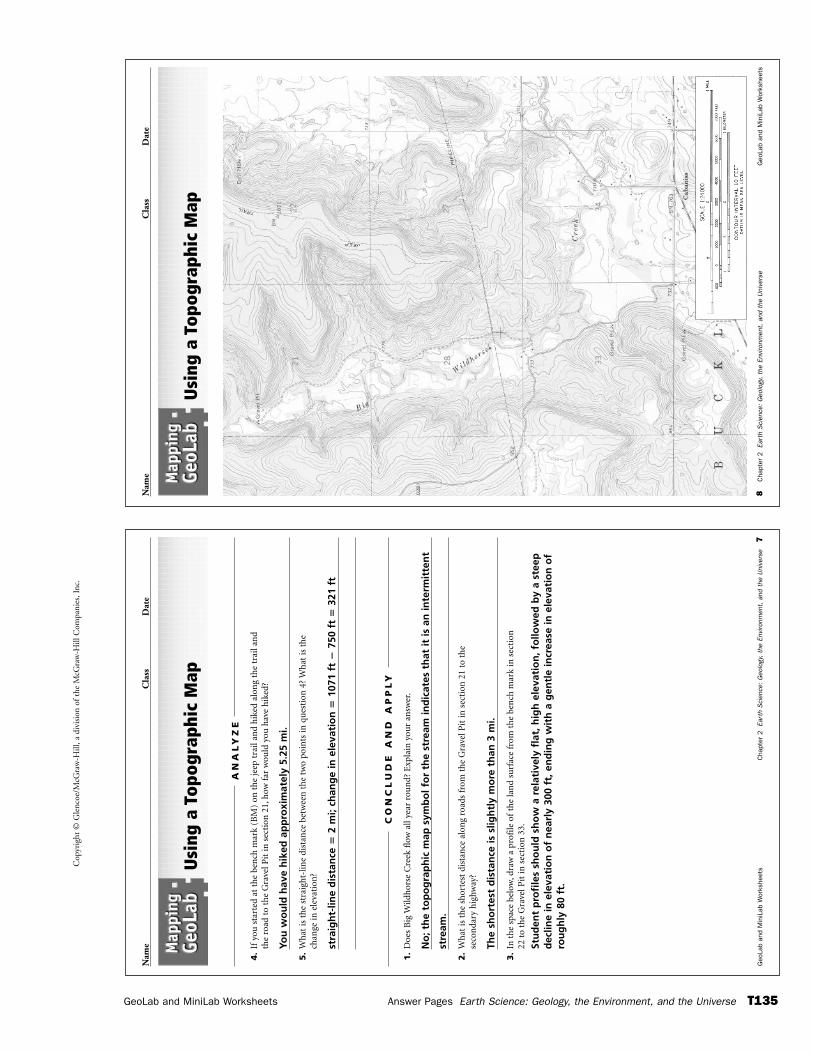
Cop
yrig
ht ©
Gle
ncoe
/McG
raw
-Hill
, a d
ivis
ion
of t
he M
cGra
w-H
ill C
ompa
nies
, Inc
.
GeoLab and MiniLab Worksheets Answer Pages Earth Science: Geology, the Environment, and the Universe T135
Nam
eC
lass
Dat
e
8C
hapt
er 2
Eart
h S
cien
ce:
Geo
logy
, th
e En
viro
nmen
t, a
nd t
he U
nive
rse
Geo
Lab
and
Min
iLab
Wor
kshe
ets
Usi
ng a
Top
ogra
phic
Map
Nam
eC
lass
Dat
e
Geo
Lab
and
Min
iLab
Wor
kshe
ets
Cha
pter
2Ea
rth
Sci
ence
: G
eolo
gy,
the
Envi
ronm
ent,
and
the
Uni
vers
e7
Usi
ng a
Top
ogra
phic
Map
1.
Doe
s B
ig W
ildh
orse
Cre
ek f
low
all
year
rou
nd?
Exp
lain
you
r an
swer
.
No
; th
e to
po
gra
ph
ic m
ap s
ymb
ol f
or
the
stre
am in
dic
ates
th
at it
is a
n in
term
itte
nt
stre
am.
2.
Wh
at is
th
e sh
orte
st d
ista
nce
alo
ng
road
s fr
om t
he
Gra
vel P
it in
sec
tion
21
to t
he
seco
nda
ry h
ighw
ay?
The
sho
rtes
t d
ista
nce
is s
ligh
tly
mo
re t
han
3 m
i.
3.
In t
he
spac
e be
low
,dra
w a
pro
file
of
the
lan
d su
rfac
e fr
om t
he
ben
ch m
ark
in s
ecti
on22
to
the
Gra
vel P
it in
sec
tion
33.
Stu
den
t p
rofi
les
sho
uld
sh
ow
a r
elat
ivel
y fl
at, h
igh
ele
vati
on
, fo
llow
ed b
y a
stee
pd
eclin
e in
ele
vati
on
of
nea
rly
300
ft, e
nd
ing
wit
h a
gen
tle
incr
ease
in e
leva
tio
n o
fro
ug
hly
80
ft.
CO
NC
LU
DE
AN
D A
PP
LY
4.
Ifyo
u s
tart
ed a
t th
e be
nch
mar
k (B
M)
on t
he
jeep
tra
il an
d h
iked
alo
ng
the
trai
l an
dth
e ro
ad t
o th
e G
rave
l Pit
in s
ecti
on 2
1,h
ow f
ar w
ould
you
hav
e h
iked
?
You
wo
uld
hav
e h
iked
ap
pro
xim
atel
y 5.
25 m
i.
5.
Wh
at is
th
e st
raig
ht-
line
dist
ance
bet
wee
n t
he
two
poin
ts in
qu
esti
on 4
? W
hat
is t
he
chan
ge in
ele
vati
on?
stra
igh
t-lin
e d
ista
nce
�2
mi;
chan
ge
in e
leva
tio
n �
1071
ft
�75
0 ft
�32
1 ft
AN
AL
YZ
E
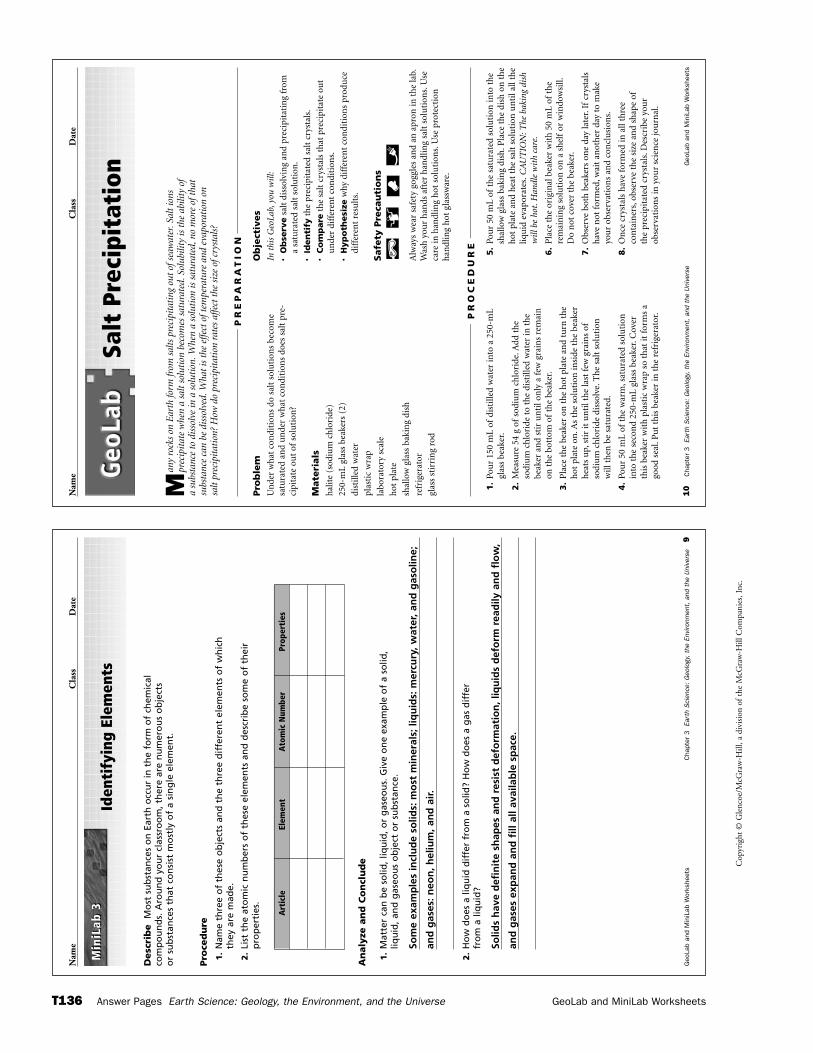
Cop
yrig
ht ©
Gle
ncoe
/McG
raw
-Hill
, a d
ivis
ion
of t
he M
cGra
w-H
ill C
ompa
nies
, Inc
.
T136 Answer Pages Earth Science: Geology, the Environment, and the Universe GeoLab and MiniLab Worksheets
10
Cha
pter
3Ea
rth
Sci
ence
: G
eolo
gy,
the
Envi
ronm
ent,
and
the
Uni
vers
eG
eoLa
b an
d M
iniL
ab W
orks
heet
s
Nam
eC
lass
Dat
e
Man
y ro
cks
on E
arth
form
from
sal
ts p
reci
pita
ting
out
ofs
eaw
ater
.Sal
t io
nspr
ecip
itat
e w
hen
a sa
lt so
luti
on b
ecom
es s
atur
ated
.Sol
ubili
ty is
the
abi
lity
ofa
subs
tanc
e to
dis
solv
e in
a s
olut
ion.
Whe
n a
solu
tion
is s
atur
ated
,no
mor
e of
that
subs
tanc
e ca
n be
dis
solv
ed.W
hat
is t
he e
ffect
oft
empe
ratu
re a
nd e
vapo
rati
on o
nsa
ltpr
ecip
itat
ion?
How
do
prec
ipit
atio
n ra
tes
affe
ct t
he s
ize
ofcr
ysta
ls?
Pro
ble
mU
nde
r w
hat
con
diti
ons
do s
alt
solu
tion
s be
com
esa
tura
ted
and
un
der
wh
at c
ondi
tion
s do
es s
alt
pre-
cipi
tate
ou
t of
solu
tion
?
Mate
rials
hal
ite
(sod
ium
ch
lori
de)
250-
mL
glas
s be
aker
s (2
)
dist
illed
wat
er
plas
tic
wra
p
labo
rato
ry s
cale
hot
pla
te
shal
low
gla
ss b
akin
g di
sh
refr
iger
ator
glas
s st
irri
ng
rod
Ob
ject
ives
In t
his
Geo
Lab,
you
will
:
•O
bse
rve
salt
dis
solv
ing
and
prec
ipit
atin
g fr
oma
satu
rate
d sa
lt s
olu
tion
.
•Id
en
tify
the
prec
ipit
ated
sal
t cr
ysta
ls.
•C
om
pare
the
salt
cry
stal
s th
at p
reci
pita
te o
ut
un
der
diff
eren
t co
ndi
tion
s.
•H
yp
oth
esi
zew
hy d
iffe
ren
t co
ndi
tion
s pr
odu
cedi
ffer
ent
resu
lts.
Safe
ty P
reca
uti
on
s
Alw
ays
wea
r sa
fety
gog
gles
an
d an
apr
on in
th
e la
b.W
ash
you
r h
ands
aft
er h
andl
ing
salt
sol
uti
ons.
Use
care
in h
andl
ing
hot
sol
uti
ons.
Use
pro
tect
ion
h
andl
ing
hot
gla
ssw
are.
Salt
Pre
cipi
tati
on
PR
EP
AR
AT
ION
1.
Pou
r 15
0 m
L of
dist
illed
wat
er in
to a
250
-mL
glas
s be
aker
.
2.
Mea
sure
54
g of
sodi
um
ch
lori
de.A
dd t
he
sodi
um
ch
lori
de t
o th
e di
still
ed w
ater
in t
he
beak
er a
nd
stir
un
til o
nly
a f
ew g
rain
s re
mai
non
th
e bo
ttom
of
the
beak
er.
3.
Pla
ce t
he
beak
er o
n t
he
hot
pla
te a
nd
turn
th
eh
ot p
late
on
.As
the
solu
tion
insi
de t
he
beak
erh
eats
up,
stir
it u
nti
l th
e la
st f
ew g
rain
s of
sodi
um
ch
lori
de d
isso
lve.
Th
e sa
lt s
olu
tion
will
then
be
satu
rate
d.
4.
Pou
r 50
mL
ofth
e w
arm
,sat
ura
ted
solu
tion
into
th
e se
con
d 25
0-m
L gl
ass
beak
er.C
over
this
bea
ker
wit
h p
last
ic w
rap
so t
hat
it f
orm
s a
good
sea
l.P
ut
this
bea
ker
in t
he
refr
iger
ator
.
5.
Pou
r 50
mL
ofth
e sa
tura
ted
solu
tion
into
th
esh
allo
w g
lass
bak
ing
dish
.Pla
ce t
he
dish
on
th
eh
ot p
late
an
d h
eat
the
salt
sol
uti
on u
nti
l all
the
liqu
id e
vapo
rate
s.C
AU
TIO
N: T
he b
akin
g di
shw
ill b
e ho
t.H
andl
e w
ith
care
.
6.
Pla
ce t
he
orig
inal
bea
ker
wit
h 5
0 m
L of
the
rem
ain
ing
solu
tion
on
a s
hel
for
win
dow
sill.
Do
not
cov
er t
he
beak
er.
7.
Obs
erve
bot
h b
eake
rs o
ne
day
late
r.If
crys
tals
hav
e n
ot f
orm
ed,w
ait
anot
her
day
to
mak
eyo
ur
obse
rvat
ion
s an
d co
ncl
usi
ons.
8.
On
ce c
ryst
als
hav
e fo
rmed
in a
ll th
ree
con
tain
ers,
obse
rve
the
size
an
d sh
ape
ofth
epr
ecip
itat
ed c
ryst
als.
Des
crib
e yo
ur
obse
rvat
ion
s in
you
r sc
ien
ce jo
urn
al.
PR
OC
ED
UR
E
Geo
Lab
and
Min
iLab
Wor
kshe
ets
Cha
pter
3Ea
rth
Sci
ence
: G
eolo
gy,
the
Envi
ronm
ent,
and
the
Uni
vers
e9
Nam
eC
lass
Dat
e
Iden
tify
ing
Elem
ents
Desc
rib
eM
ost
su
bst
ance
s o
n E
arth
occ
ur
in t
he
form
of
chem
ical
co
mp
ou
nd
s. A
rou
nd
yo
ur
clas
sro
om
, th
ere
are
nu
mer
ou
s o
bje
cts
or
sub
stan
ces
that
co
nsi
st m
ost
ly o
f a
sin
gle
ele
men
t.
Pro
ced
ure
1.
Nam
e th
ree
of
thes
e o
bje
cts
and
th
e th
ree
dif
fere
nt
elem
ents
of
wh
ich
they
are
mad
e.
2.
List
th
e at
om
ic n
um
ber
s o
f th
ese
elem
ents
an
d d
escr
ibe
som
e o
f th
eir
pro
per
ties
.
An
aly
ze a
nd
Co
ncl
ud
e
1.
Mat
ter
can
be
solid
, liq
uid
, or
gas
eou
s. G
ive
on
e ex
amp
le o
f a
solid
,liq
uid
, an
d g
aseo
us
ob
ject
or
sub
stan
ce.
Som
e ex
amp
les
incl
ud
e so
lids:
mo
st m
iner
als;
liq
uid
s: m
ercu
ry, w
ater
, an
d g
aso
line;
and
gas
es: n
eon
, hel
ium
, an
d a
ir.
2.
Ho
w d
oes
a li
qu
id d
iffe
r fr
om
a s
olid
? H
ow
do
es a
gas
dif
fer
fro
m a
liq
uid
?
Solid
s h
ave
def
init
e sh
apes
an
d r
esis
t d
efo
rmat
ion
, liq
uid
s d
efo
rm r
ead
ily a
nd
flo
w,
and
gas
es e
xpan
d a
nd
fill
all
avai
lab
le s
pac
e.
Min
iLab
3M
iniL
ab 3 Art
icle
Elem
ent
Ato
mic
Num
ber
Prop
erti
es
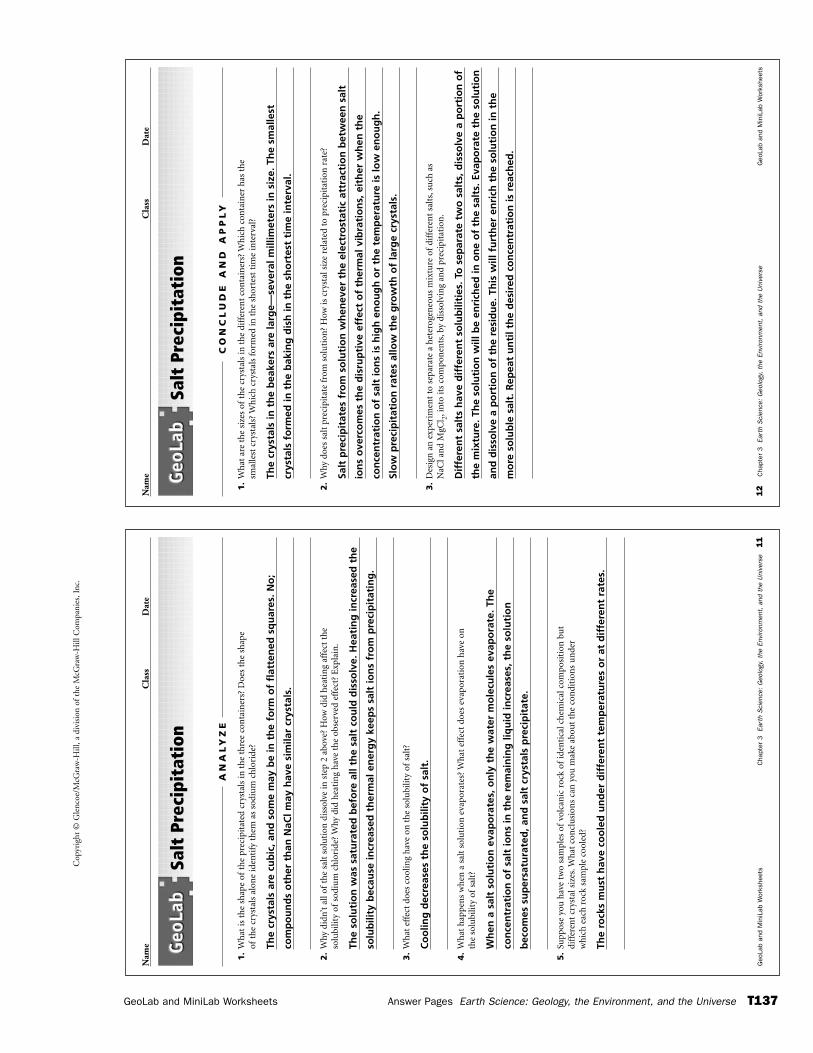
Cop
yrig
ht ©
Gle
ncoe
/McG
raw
-Hill
, a d
ivis
ion
of t
he M
cGra
w-H
ill C
ompa
nies
, Inc
.
GeoLab and MiniLab Worksheets Answer Pages Earth Science: Geology, the Environment, and the Universe T137
Nam
eC
lass
Dat
e
12
Cha
pter
3Ea
rth
Sci
ence
: G
eolo
gy,
the
Envi
ronm
ent,
and
the
Uni
vers
eG
eoLa
b an
d M
iniL
ab W
orks
heet
s
Salt
Pre
cipi
tati
on
1.
Wh
at a
re t
he
size
s of
the
crys
tals
in t
he
diff
eren
t co
nta
iner
s? W
hic
h c
onta
iner
has
th
esm
alle
st c
ryst
als?
Wh
ich
cry
stal
s fo
rmed
in t
he
shor
test
tim
e in
terv
al?
The
crys
tals
in t
he
bea
kers
are
larg
e—se
vera
l mill
imet
ers
in s
ize.
Th
e sm
alle
st
crys
tals
fo
rmed
in t
he
bak
ing
dis
h in
th
e sh
ort
est
tim
e in
terv
al.
2.
Why
doe
s sa
lt p
reci
pita
te f
rom
sol
uti
on?
How
is c
ryst
al s
ize
rela
ted
to p
reci
pita
tion
rat
e?
Salt
pre
cip
itat
es f
rom
so
luti
on
wh
enev
er t
he
elec
tro
stat
ic a
ttra
ctio
n b
etw
een
sal
t
ion
s o
verc
om
es t
he
dis
rup
tive
eff
ect
of
ther
mal
vib
rati
on
s, e
ith
er w
hen
th
e
con
cen
trat
ion
of
salt
ion
s is
hig
h e
no
ug
h o
r th
e te
mp
erat
ure
is lo
w e
no
ug
h.
Slo
w p
reci
pit
atio
n r
ates
allo
w t
he
gro
wth
of
larg
e cr
ysta
ls.
3.
Des
ign
an
exp
erim
ent
to s
epar
ate
a h
eter
ogen
eou
s m
ixtu
re o
fdi
ffer
ent
salt
s,su
ch a
sN
aCl a
nd
MgC
l 2,in
to it
s co
mpo
nen
ts,b
y di
ssol
vin
g an
d pr
ecip
itat
ion
.
Dif
fere
nt
salt
s h
ave
dif
fere
nt
solu
bili
ties
. To
sep
arat
e tw
o s
alts
, dis
solv
e a
po
rtio
n o
f
the
mix
ture
. Th
e so
luti
on
will
be
enri
ched
in o
ne
of
the
salt
s. E
vap
ora
te t
he
solu
tio
n
and
dis
solv
e a
po
rtio
n o
f th
e re
sid
ue.
Th
is w
ill f
urt
her
en
rich
th
e so
luti
on
in t
he
mo
re s
olu
ble
sal
t. R
epea
t u
nti
l th
e d
esir
ed c
on
cen
trat
ion
is r
each
ed.
CO
NC
LU
DE
AN
D A
PP
LY
Nam
eC
lass
Dat
e
Geo
Lab
and
Min
iLab
Wor
kshe
ets
Cha
pter
3Ea
rth
Sci
ence
: G
eolo
gy,
the
Envi
ronm
ent,
and
the
Uni
vers
e11
Salt
Pre
cipi
tati
on
1.
Wh
at is
th
e sh
ape
ofth
e pr
ecip
itat
ed c
ryst
als
in t
he
thre
e co
nta
iner
s? D
oes
the
shap
eof
the
crys
tals
alo
ne
iden
tify
th
em a
s so
diu
m c
hlo
ride
?
The
crys
tals
are
cu
bic
, an
d s
om
e m
ay b
e in
th
e fo
rm o
f fl
atte
ned
sq
uar
es. N
o;
com
po
un
ds
oth
er t
han
NaC
l may
hav
e si
mila
r cr
ysta
ls.
2.
Why
did
n’t
all o
fth
e sa
lt s
olu
tion
dis
solv
e in
ste
p 2
abov
e? H
ow d
id h
eati
ng
affe
ct t
he
solu
bilit
y of
sodi
um
ch
lori
de?
Why
did
hea
tin
g h
ave
the
obse
rved
eff
ect?
Exp
lain
.
The
solu
tio
n w
as s
atu
rate
d b
efo
re a
ll th
e sa
lt c
ou
ld d
isso
lve.
Hea
tin
g in
crea
sed
th
e
solu
bili
ty b
ecau
se in
crea
sed
th
erm
al e
ner
gy
keep
s sa
lt io
ns
fro
m p
reci
pit
atin
g.
3.
Wh
at e
ffec
t do
es c
oolin
g h
ave
on t
he
solu
bilit
y of
salt
?
Co
olin
g d
ecre
ases
th
e so
lub
ility
of
salt
.
4.
Wh
at h
appe
ns
wh
en a
sal
t so
luti
on e
vapo
rate
s? W
hat
eff
ect
does
eva
pora
tion
hav
e on
the
solu
bilit
y of
salt
?
Wh
en a
sal
t so
luti
on
eva
po
rate
s, o
nly
th
e w
ater
mo
lecu
les
evap
ora
te. T
he
con
cen
trat
ion
of
salt
ion
s in
th
e re
mai
nin
g li
qu
id in
crea
ses,
th
e so
luti
on
bec
om
es s
up
ersa
tura
ted
, an
d s
alt
crys
tals
pre
cip
itat
e.
5.
Supp
ose
you
hav
e tw
o sa
mpl
es o
fvo
lcan
ic r
ock
ofid
enti
cal c
hem
ical
com
posi
tion
bu
tdi
ffer
ent
crys
tal s
izes
.Wh
at c
oncl
usi
ons
can
you
mak
e ab
out
the
con
diti
ons
un
der
wh
ich
eac
h r
ock
sam
ple
cool
ed?
The
rock
s m
ust
hav
e co
ole
d u
nd
er d
iffe
ren
t te
mp
erat
ure
s o
r at
dif
fere
nt
rate
s.
AN
AL
YZ
E
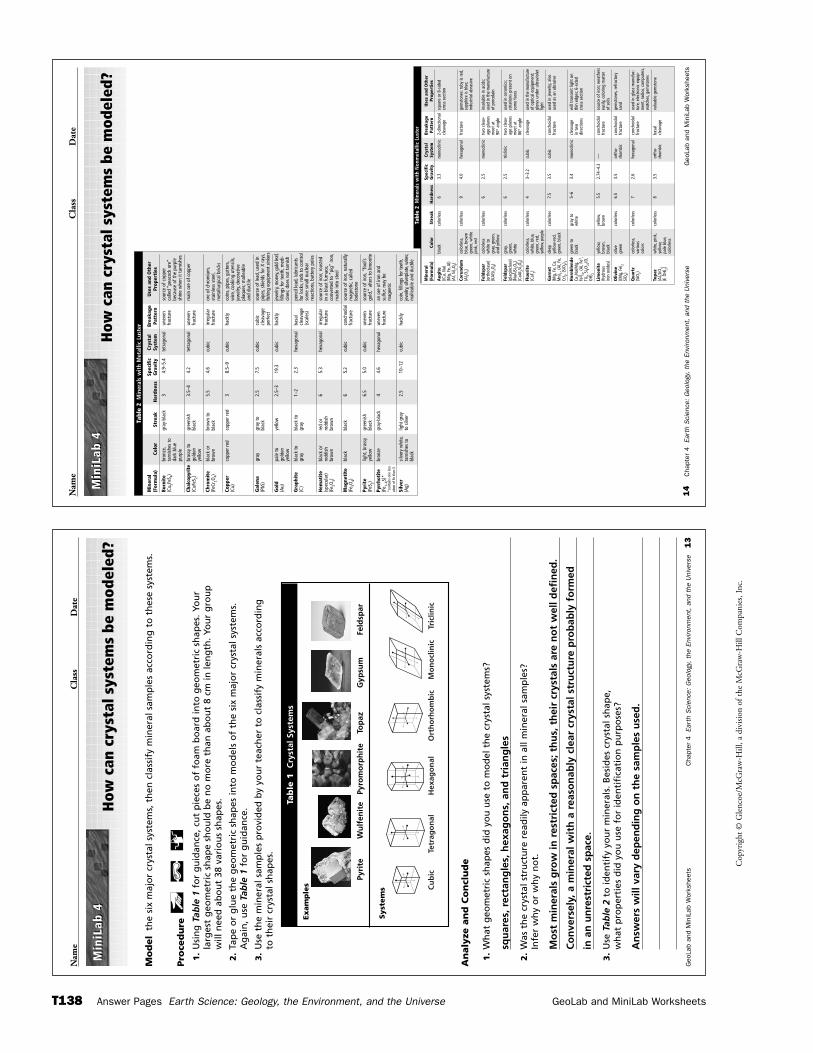
Cop
yrig
ht ©
Gle
ncoe
/McG
raw
-Hill
, a d
ivis
ion
of t
he M
cGra
w-H
ill C
ompa
nies
, Inc
.
T138 Answer Pages Earth Science: Geology, the Environment, and the Universe GeoLab and MiniLab Worksheets
14
Cha
pter
4Ea
rth
Sci
ence
: G
eolo
gy,
the
Envi
ronm
ent,
and
the
Uni
vers
eG
eoLa
b an
d M
iniL
ab W
orks
heet
s
Nam
eC
lass
Dat
e
How
can
cry
stal
sys
tem
s be
mod
eled
?M
iniL
ab 4
Min
iLab
4
Tabl
e 2
Min
eral
s w
ith
Non
met
allic
Lus
ter
Min
eral
Spec
ific
Crys
tal
Brea
kage
Use
s an
d O
ther
(For
mul
a)Co
lor
Stre
akH
ardn
ess
Gra
vity
Syst
emPa
tter
nPr
oper
ties
Aug
ite
blac
kco
lorle
ss6
3.3
mon
oclin
ic2-
dire
ctio
nal
squa
re o
r 8-s
ided
((Ca,
Na)
clea
vage
cros
s se
ctio
n(M
g,Fe
,Al)
(Al,
Si) 2O
6)
Coru
ndum
colo
rless
,co
lorle
ss9
4.0
hexa
gona
lfra
ctur
ege
mst
ones
:rub
y is
red,
(Al 2O
3)bl
ue,b
row
nsa
pphi
re is
blu
e;gr
een,
whi
tein
dust
rial a
bras
ive
pink
,red
Feld
spar
colo
rless
colo
rless
62.
5m
onoc
linic
two
clea
v-in
solu
ble
in a
cids
;(o
rtho
clas
e)w
hite
toag
e pl
anes
used
in th
e m
anuf
actu
re
(KAl
Si3O
8)gr
ay,g
reen
,m
eet a
tof
por
cela
inan
d ye
llow
90°
angl
e
Feld
spar
gray
,co
lorle
ss6
2.5
tric
linic
two
clea
v-us
ed in
cer
amic
s;(p
lagi
ocla
se)
gree
n,ag
e pl
anes
stria
tions
pre
sent
on
(NaA
ISi 3O
8)w
hite
mee
t at
som
e fa
ces
(CaA
I 2Si 3O
8)86
°an
gle
Fluo
rite
colo
rless
,co
lorle
ss4
3–3.
2cu
bic
clea
vage
used
in th
e m
anuf
actu
re(C
aF2)
whi
te,b
lue,
of o
ptic
al e
quip
men
t;gr
een,
red,
glow
s un
der u
ltrav
iole
tye
llow
,pur
ple
light
Gar
net
deep
colo
rless
7.5
3.5
cubi
cco
ncho
idal
used
in je
wel
ry;a
lso
(Mg,
Fe,C
a,ye
llow
-red
,fra
ctur
eus
ed a
s an
abr
asiv
eM
n)3
,(Al
,Fe,
gree
n,bl
ack
Cr) 2,
(SiO
4)3
Hor
nble
nde
gree
n to
gray
to5–
63.
4m
onoc
linic
clea
vage
will
tran
smit
light
on
Ca2N
a(M
g,bl
ack
whi
tein
two
thin
edg
es;6
-sid
edFe
2 )4,
(Al,
Fe3 ,
dire
ctio
nscr
oss
sect
ion
Ti) 3,
Si8O
22(O
,O
H)2
Lim
onit
eye
llow
,ye
llow
,5.
52.
74–4
.3—
conc
hoid
also
urce
of i
ron;
wea
ther
s(h
ydro
usbr
own,
brow
nfra
ctur
eea
sily,
colo
ring
mat
ter
iron
oxid
es)
blac
kof
soi
ls
Oliv
ine
oliv
eco
lorle
ss6.
53.
5or
tho-
conc
hoid
alge
mst
ones
,ref
ract
ory
((Mg,
Fe) 2
gree
nrh
ombi
cfra
ctur
esa
ndSi
O4)
Qua
rtz
colo
rless
,co
lorle
ss7
2.6
hexa
gona
lco
ncho
idal
used
in g
lass
man
ufac
-(S
iO2)
vario
usfra
ctur
etu
re,e
lect
roni
c eq
uip-
colo
rsm
ent,
radi
os,c
ompu
ters
,w
atch
es,g
emst
ones
Topa
zw
hite
,pin
k,co
lorle
ss8
3.5
orth
o-ba
sal
valu
able
gem
ston
e(A
l 2SiO
4ye
llow
,rh
ombi
ccl
eava
ge(F,
OH)
2)pa
le b
lue,
colo
rless
Tabl
e 2
Min
eral
s w
ith
Met
allic
Lus
ter
Min
eral
Spec
ific
Crys
tal
Brea
kage
Use
s an
d O
ther
(For
mul
a)Co
lor
Stre
akH
ardn
ess
Gra
vity
Syst
emPa
tter
nPr
oper
ties
Born
ite
bron
ze,
gray
-bla
ck3
4.9–
5.4
tetr
agon
alun
even
sour
ce o
f cop
per
(Cu 5F
eS4)
tarn
ishe
s to
fract
ure
calle
d “p
eaco
ck o
re”
dark
blu
ebe
caus
e of
the
purp
lepu
rple
shin
e w
hen
it ta
rnis
hes
Chal
copy
rite
bras
sy to
gree
nish
3.5–
44.
2te
trag
onal
unev
enm
ain
ore
of c
oppe
r(C
uFeS
2)go
lden
blac
kfra
ctur
eye
llow
Chro
mit
ebl
ack
orbr
own
to5.
54.
6cu
bic
irreg
ular
ore
of c
hrom
ium
,(F
eCr 2O
4)br
own
blac
kfra
ctur
est
ainl
ess
stee
l,m
etal
lurg
ical
bric
ks
Copp
erco
pper
red
copp
er re
d3
8.5–
9cu
bic
hack
lyco
ins,
pipe
s,gu
tter
s,(C
u)w
ire,c
ooki
ng u
tens
ils,
jew
elry
,dec
orat
ive
plaq
ues;
mal
leab
lean
d du
ctile
Gal
ena
gray
gray
to2.
57.
5cu
bic
cubi
cso
urce
of l
ead,
used
in(P
bS)
blac
kcl
eava
gepi
pes,
shie
lds
for X
rays
,pe
rfect
fishi
ng e
quip
men
t sin
kers
Gol
dpa
le to
yello
w2.
5–3
19.3
cubi
cha
ckly
jew
elry
,mon
ey,g
old
leaf
,(A
u)go
lden
fillin
gs fo
r tee
th,m
edi-
yello
wci
nes;
does
not
tarn
ish
Gra
phit
ebl
ack
tobl
ack
to1–
22.
3he
xago
nal
basa
lpe
ncil
lead
,lub
rican
ts(C
)gr
aygr
aycl
eava
gefo
r loc
ks,r
ods
to c
ontr
ol(s
cale
s)so
me
smal
l nuc
lear
reac
tions
,bat
tery
pol
es
Hem
atit
ebl
ack
orre
d or
65.
3he
xago
nal
irreg
ular
sour
ce o
f iro
n;ro
aste
d(s
pecu
lar)
redd
ish
redd
ish
fract
ure
in a
bla
st fu
rnac
e,(F
e 2O3)
brow
nbr
own
conv
erte
d to
“pi
g”iro
n,m
ade
into
ste
el
Mag
neti
tebl
ack
blac
k6
5.2
cubi
cco
ncho
dial
sour
ce o
f iro
n,na
tura
lly(F
e 3O4)
fract
ure
mag
netic
,cal
led
lode
ston
e
Pyri
telig
ht,b
rass
ygr
eeni
sh6.
55.
0cu
bic
unev
enso
urce
of i
ron,
“foo
l’s(F
eS2)
yello
wbl
ack
fract
ure
gold
,”al
ters
to li
mon
ite
Pyrr
hoti
tebr
onze
gray
-bla
ck4
4.6
hexa
gona
lun
even
an o
re o
f iro
n an
d (F
e 1–XS
)*fra
ctur
esu
lfur;
may
be
mag
netic
Silv
ersil
very
whi
te,
light
gra
y2.
510
–12
cubi
cha
ckly
coin
,fill
ings
for t
eeth
,(A
g)ta
rnish
es to
to s
ilver
jew
elry,
silve
rpla
te,w
ires;
blac
km
alle
able
and
duc
tile
*con
tain
s on
e le
ssat
om o
f Fe
than
S
Geo
Lab
and
Min
iLab
Wor
kshe
ets
Cha
pter
4Ea
rth
Sci
ence
: G
eolo
gy,
the
Envi
ronm
ent,
and
the
Uni
vers
e13
Nam
eC
lass
Dat
e
How
can
cry
stal
sys
tem
s be
mod
eled
?
Mo
del
the
six
maj
or
crys
tal s
yste
ms,
th
en c
lass
ify
min
eral
sam
ple
s ac
cord
ing
to
th
ese
syst
ems.
Pro
ced
ure
1.
Usi
ng
Tab
le 1
for
gu
idan
ce, c
ut
pie
ces
of
foam
bo
ard
into
geo
met
ric
shap
es. Y
ou
rla
rges
t g
eom
etri
c sh
ape
sho
uld
be
no
mo
re t
han
ab
ou
t 8
cm in
len
gth
. Yo
ur
gro
up
will
nee
d a
bo
ut
38 v
ario
us
shap
es.
2.
Tap
e o
r g
lue
the
geo
met
ric
shap
es in
to m
od
els
of
the
six
maj
or
crys
tal s
yste
ms.
Ag
ain
, use
Tab
le 1
for
gu
idan
ce.
3.
Use
th
e m
iner
al s
amp
les
pro
vid
ed b
y yo
ur
teac
her
to
cla
ssif
y m
iner
als
acco
rdin
gto
th
eir
crys
tal s
hap
es.
An
aly
ze a
nd
Co
ncl
ud
e
1.
Wh
at g
eom
etri
c sh
apes
did
yo
u u
se t
o m
od
el t
he
crys
tal s
yste
ms?
squ
ares
, rec
tan
gle
s, h
exag
on
s, a
nd
tri
ang
les
2.
Was
th
e cr
ysta
l str
uct
ure
rea
dily
ap
par
ent
in a
ll m
iner
al s
amp
les?
In
fer
wh
y o
r w
hy
no
t.
Mo
st m
iner
als
gro
w in
res
tric
ted
sp
aces
; th
us,
th
eir
crys
tals
are
no
t w
ell d
efin
ed.
Co
nve
rsel
y, a
min
eral
wit
h a
rea
son
ably
cle
ar c
ryst
al s
tru
ctu
re p
rob
ably
fo
rmed
in a
n u
nre
stri
cted
sp
ace.
3.
Use
Tab
le 2
to id
enti
fy y
ou
r m
iner
als.
Bes
ides
cry
stal
sh
ape,
w
hat
pro
per
ties
did
yo
u u
se f
or
iden
tifi
cati
on
pu
rpo
ses?
An
swer
s w
ill v
ary
dep
end
ing
on
th
e sa
mp
les
use
d.
Min
iLab
4M
iniL
ab 4
Tab
le 1
Cry
stal
Sys
tem
s
Cu
bic
Tet
rag
on
al
Hex
ago
nal
Ort
ho
rho
mb
ic
Mo
no
clin
ic
Tri
clin
ic
Pyri
teW
ulf
enit
ePy
rom
orp
hit
eTo
paz
Gyp
sum
Feld
spar
Exam
ple
s
Syst
em
s
Cop
yrig
ht ©
Gle
ncoe
/McG
raw
-Hill
, a d
ivis
ion
of t
he M
cGra
w-H
ill C
ompa
nies
, Inc
.
GeoLab and MiniLab Worksheets Answer Pages Earth Science: Geology, the Environment, and the Universe T139
Nam
eC
lass
Dat
e
16
Cha
pter
4Ea
rth
Sci
ence
: G
eolo
gy,
the
Envi
ronm
ent,
and
the
Uni
vers
eG
eoLa
b an
d M
iniL
ab W
orks
heet
s
Mak
ing
a Fi
eld
Gui
de t
o M
iner
als
1.
As
a gr
oup,
list
the
step
s th
at y
ou w
ill t
ake
to t
est
you
r hy
poth
esis
.Kee
p th
e av
aila
ble
mat
eria
lsin
min
d as
you
pla
n y
our
proc
edu
re.B
e sp
ecif
ic,d
escr
ibin
g ex
actl
y w
hat
you
will
do
at e
ach
step
.Pro
pert
ies
that
you
may
wan
t to
tes
t in
clu
de lu
ster
,col
or,r
eact
ion
to
HC
l,m
agn
etis
m,
clea
vage
,fra
ctu
re,t
extu
re,h
ardn
ess,
stre
ak,d
oubl
e re
frac
tion
,an
d de
nsi
ty.
2.
Shou
ld y
ou t
est
any
ofth
e pr
oper
ties
mor
e th
an o
nce
for
any
of
the
min
eral
s?
How
will
you
det
erm
ine
wh
eth
er c
erta
in p
rope
rtie
s in
dica
te a
spe
cifi
c m
iner
al?
3.
Des
ign
a d
ata
tabl
e to
su
mm
ariz
e yo
ur
resu
lts.
You
can
use
th
is t
able
as
the
basi
s fo
ryo
ur
fiel
d gu
ide.
Dra
w t
he
tabl
e in
th
e sp
ace
belo
w.
4.
Rea
d ov
er y
our
enti
re e
xper
imen
t to
mak
e su
re t
hat
all
step
s ar
e in
a lo
gica
l ord
er.
5.
Hav
e yo
u in
clu
ded
a st
ep f
or a
ddit
ion
al r
esea
rch
? Yo
u m
ay h
ave
to u
se t
he
libra
ry o
r th
eG
len
coe
Scie
nce
Web
Sit
e to
gat
her
all
the
nec
essa
ry in
form
atio
n f
or y
our
fiel
d gu
ide.
6.
Wh
at in
form
atio
n w
ill b
e in
clu
ded
in t
he
fiel
d gu
ide?
Pos
sibl
e da
ta in
clu
de h
ow e
ach
min
eral
for
med
,its
use
s,it
s ch
emic
al f
orm
ula
,an
d a
labe
led
phot
ogra
ph o
r dr
awin
gof
the
min
eral
.
7.
Mak
e su
re y
our
teac
her
app
rove
s yo
ur
plan
bef
ore
you
pro
ceed
wit
h y
our
expe
rim
ent.
PL
AN
TH
E E
XP
ER
IME
NT
Geo
Lab
and
Min
iLab
Wor
kshe
ets
Cha
pter
4Ea
rth
Sci
ence
: G
eolo
gy,
the
Envi
ronm
ent,
and
the
Uni
vers
e15
Nam
eC
lass
Dat
e
Hav
e yo
u ev
er u
sed
a fie
ld g
uide
to
iden
tify
a b
ird,
flow
er,r
ock,
or in
sect
? If
so,y
oukn
ow t
hat
field
gui
des
incl
ude
far
mor
e th
an s
impl
y ph
otog
raph
s.A
typ
ical
fiel
dgu
ide
for
min
eral
s m
ight
incl
ude
back
grou
nd in
form
atio
n ab
out
min
eral
s in
gen
eral
,pl
us s
peci
fic in
form
atio
n ab
out
the
form
atio
n,pr
oper
ties
,and
use
s of
each
min
eral
.In
this
act
ivit
y,yo
u’ll
crea
te a
fiel
d gu
ide
to m
iner
als.
Pro
ble
mH
ow w
ould
you
go
abou
t id
enti
fyin
g m
iner
als?
Wh
at p
hysi
cal a
nd
chem
ical
pro
pert
ies
wou
ld y
oute
st?
Wh
ich
of
thes
e pr
oper
ties
sh
ould
be
incl
ude
din
a f
ield
gu
ide
to h
elp
oth
ers
to id
enti
fy u
nkn
own
min
eral
s?
Po
ssib
le M
ate
rials
min
eral
sam
ples
App
endi
x H
han
d le
ns
stee
l file
or
nai
l
glas
s pl
ate
piec
e of
copp
er
stre
ak p
late
pape
r cl
ip
Moh
s sc
ale
ofm
agn
etm
iner
al h
ardn
ess
5 pe
rcen
t hy
droc
hlo
ric
acid
(H
Cl)
wit
h d
ropp
er
Hyp
oth
esi
sA
s a
grou
p,fo
rm a
hyp
oth
esis
abo
ut
wh
ich
pr
oper
ty o
r pr
oper
ties
mig
ht
be m
ost
use
ful i
nid
enti
fyin
g m
iner
als.
Wri
te y
our
hypo
thes
is in
th
esp
ace
belo
w.
Ob
ject
ives
In t
his
Geo
Lab,
you
will
:
•C
on
du
ct t
ests
on
un
know
n m
iner
als
to d
eter
-m
ine
thei
r ph
ysic
al a
nd
chem
ical
pro
pert
ies.
•Id
en
tify
min
eral
s ba
sed
on t
he
resu
lts
ofyo
ur
test
s.
•D
esi
gn
a fi
eld
guid
e fo
r m
iner
als.
Safe
ty P
reca
uti
on
s
Rev
iew
th
e sa
fe u
se o
fac
ids.
HC
l may
cau
se b
urn
s.If
a sp
ill o
ccu
rs,r
inse
you
r sk
in w
ith
wat
er a
nd
not
ify
you
r te
ach
er im
med
iate
ly.
Mak
ing
a Fi
eld
Gui
de
to M
iner
als
PR
EP
AR
AT
ION
Cop
yrig
ht ©
Gle
ncoe
/McG
raw
-Hill
, a d
ivis
ion
of t
he M
cGra
w-H
ill C
ompa
nies
, Inc
.
T140 Answer Pages Earth Science: Geology, the Environment, and the Universe GeoLab and MiniLab Worksheets
Nam
eC
lass
Dat
e
18
Cha
pter
4Ea
rth
Sci
ence
: G
eolo
gy,
the
Envi
ronm
ent,
and
the
Uni
vers
eG
eoLa
b an
d M
iniL
ab W
orks
heet
s
Mak
ing
a Fi
eld
Gui
de t
o M
iner
als
1.
Com
pare
an
d co
ntr
ast
you
r fi
eld
guid
e w
ith
th
ose
ofot
her
gro
ups
.How
cou
ld y
ouim
prov
e yo
ur
fiel
d gu
ide?
An
swer
s w
ill v
ary
gre
atly
. Use
th
is o
pp
ort
un
ity
to e
nco
ura
ge
a liv
ely
clas
s
dis
cuss
ion
ab
ou
t th
e b
est
feat
ure
s to
incl
ud
e in
a f
ield
gu
ide
to m
iner
als.
2.
Wh
at a
re t
he
adva
nta
ges
and
disa
dvan
tage
s of
fiel
d gu
ides
?
An
swer
s w
ill v
ary.
Th
e m
ain
ad
van
tag
e o
f a
fiel
d g
uid
e is
th
at it
can
be
use
d t
o
iden
tify
an
d c
lass
ify
ob
ject
s u
sin
g b
oth
ph
ysic
al a
nd
ch
emic
al p
rop
erti
es. T
he
mai
n
dis
adva
nta
ge
is t
hat
it o
ffer
s in
form
atio
n in
an
ab
rid
ged
fo
rm.
3.
Bas
ed o
n y
our
resu
lts,
is t
her
e an
y on
e de
fin
itiv
e te
st t
hat
can
alw
ays
be u
sed
toid
enti
fy a
min
eral
? E
xpla
in.
Stu
den
ts w
ill li
kely
fin
d t
hat
a c
om
bin
atio
n o
f te
sts
wo
rked
bet
ter
than
an
y o
ne
par
ticu
lar
test
.
CO
NC
LU
DE
AN
D A
PP
LY
Nam
eC
lass
Dat
e
Geo
Lab
and
Min
iLab
Wor
kshe
ets
Cha
pter
4Ea
rth
Sci
ence
: G
eolo
gy,
the
Envi
ronm
ent,
and
the
Uni
vers
e17
Mak
ing
a Fi
eld
Gui
de t
o M
iner
als
1.
Inte
rpre
tin
g R
esu
lts
Wh
ich
pro
pert
ies
wer
e m
ost
relia
ble
for
iden
tify
ing
min
eral
s? W
hic
hpr
oper
ties
wer
e le
ast
relia
ble?
Dis
cuss
rea
son
s w
hy o
ne
prop
erty
ism
ore
use
ful t
han
oth
ers.
An
swer
s w
ill v
ary.
Sp
ecia
l pro
per
ties
are
mo
st r
elia
ble
fo
r m
iner
al id
enti
fica
tio
n
bec
ause
usu
ally
on
ly o
ne
or
two
min
eral
s sh
are
spec
ific
sp
ecia
l pro
per
ties
. Th
e le
ast
relia
ble
pro
per
ties
fo
r id
enti
fica
tio
n o
f a
min
eral
are
co
lor,
lust
er, a
nd
tex
ture
bec
ause
man
y m
iner
als
shar
e th
ese
sam
e p
rop
erti
es.
2.
Defe
nd
ing
Yo
ur
Hyp
oth
esi
sW
as y
our
hypo
thes
is s
upp
orte
d? W
hy o
r w
hy n
ot?
An
swer
s w
ill v
ary.
3.
Thin
kin
g C
riti
call
yH
ow c
ould
you
use
a p
iece
of
pape
r,a
stee
l kn
ife,
and
agl
ass
bott
le t
o di
stin
guis
h b
etw
een
Ice
lan
d sp
ar a
nd
quar
tz?
The
Icel
and
sp
ar w
ill t
ear
the
pap
er, b
ut
it w
ill n
ot
scra
tch
th
e kn
ife
or
gla
ss.
The
qu
artz
will
tea
r th
e p
aper
, an
d s
crat
ch t
he
stee
l kn
ife
and
gla
ss b
ott
le. T
his
ind
icat
es t
hat
th
e q
uar
tz is
har
der
th
an t
he
Icel
and
sp
ar.
4.
Ob
serv
ing
an
d I
nfe
rrin
gW
hat
min
eral
rea
cted
wit
h t
he
HC
l? W
hy d
id t
he
min
eral
bu
bble
? W
rite
th
e ba
lan
ced
equ
atio
n t
hat
des
crib
es t
he
chem
ical
rea
ctio
n t
hat
took
pla
ce b
etw
een
th
e m
iner
al a
nd
the
acid
.
Cal
cite
rea
cts
wit
h H
Cl.
The
HC
l an
d c
alci
um
car
bo
nat
e fo
un
d in
th
e ca
lcit
e
reac
t to
rel
ease
car
bo
n d
ioxi
de
gas
in t
he
form
of
bu
bb
les.
Th
e eq
uat
ion
is
CaC
O3
�2H
Cl →
CaC
l 2�
H2O
�C
O2.
5.
Co
nd
uct
ing
Rese
arc
hW
hat
info
rmat
ion
did
you
incl
ude
in t
he
fiel
d gu
ide?
Wh
atre
sou
rces
did
you
use
to
gath
er y
our
data
? D
escr
ibe
the
layo
ut
ofyo
ur
fiel
d gu
ide.
Stu
den
ts s
ho
uld
hav
e in
clu
ded
th
e n
ame
of
each
min
eral
, its
pro
per
ties
, its
use
s, it
s
chem
ical
fo
rmu
la, a
nd
a p
ho
tog
rap
h o
r sk
etch
of
the
min
eral
. Stu
den
ts li
kely
colle
cted
dat
a fr
om
th
eir
test
s, t
he
libra
ry, t
he
Inte
rnet
, mag
azin
es, f
ield
gu
ides
, an
d
min
eral
co
llect
ion
s. L
ayo
uts
sh
ou
ld b
e cl
ear
and
eas
y to
fo
llow
.
AN
AL
YZ
E
Cop
yrig
ht ©
Gle
ncoe
/McG
raw
-Hill
, a d
ivis
ion
of t
he M
cGra
w-H
ill C
ompa
nies
, Inc
.
GeoLab and MiniLab Worksheets Answer Pages Earth Science: Geology, the Environment, and the Universe T141
20
Cha
pter
5Ea
rth
Sci
ence
: G
eolo
gy,
the
Envi
ronm
ent,
and
the
Uni
vers
eG
eoLa
b an
d M
iniL
ab W
orks
heet
s
Nam
eC
lass
Dat
e
The
rat
e at
whi
ch m
agm
a co
ols
has
an e
ffect
on
the
grai
n si
ze o
fthe
res
ulti
ng ig
neou
s ro
ck.
Obs
ervi
ng t
he c
ryst
alliz
atio
n of
mag
ma
is d
iffic
ult
beca
use
mol
ten
rock
is v
ery
hot
and
the
crys
talli
zati
on p
roce
ss is
som
etim
es v
ery
slow
.Oth
er m
ater
ials
,how
ever
,cry
stal
lize
at lo
wer
tem
pera
ture
s.T
hese
mat
eria
ls c
an b
e us
ed t
o m
odel
cry
stal
form
atio
n.
Pro
ble
mM
odel
th
e cr
ysta
lliza
tion
of
min
eral
s fr
om m
agm
a.
Mate
rials
clea
n,p
last
ic p
etri
dis
hes
satu
rate
d al
um
sol
uti
on
200-
mL
glas
s be
aker
mag
nif
yin
g gl
ass
piec
e of
dark
-col
ored
con
stru
ctio
n p
aper
ther
mom
eter
pape
r to
wel
s
wat
er
hot
pla
te
Ob
ject
ives
In t
his
Geo
Lab,
you
will
:
•D
ete
rmin
eth
e re
lati
onsh
ip b
etw
een
coo
ling
rate
an
d cr
ysta
l siz
e.
•C
om
pare
and
con
trast
diff
eren
t cr
ysta
l sh
apes
.
Safe
ty P
reca
uti
on
s
Th
e al
um
mix
ture
can
cau
se s
kin
irri
tati
on a
nd
will
be h
ot w
hen
it is
fir
st p
oure
d in
to t
he
petr
i dis
hes
.If
spla
tter
ing
occu
rs,w
ash
ski
n w
ith
col
d w
ater
.A
lway
s w
ear
safe
ty g
oggl
es a
nd
an a
pron
in t
he
lab.
Mod
elin
g Cr
ysta
l For
mat
ion
PR
EP
AR
AT
ION
1.
As
a gr
oup,
plan
how
you
cou
ld c
han
ge t
he
cool
ing
rate
of
a h
ot s
olu
tion
pou
red
into
ape
tri d
ish
.For
inst
ance
,you
may
wan
t to
pu
ton
e sa
mpl
e in
a f
reez
er o
r re
frig
erat
or f
or a
desi
gnat
ed p
erio
d of
tim
e.A
ssig
n e
ach
gro
up
mem
ber
a pe
tri d
ish
to
obse
rve
duri
ng
the
expe
rim
ent.
2.
Pla
ce a
pie
ce o
fda
rk-c
olor
ed c
onst
ruct
ion
pape
r on
a le
vel s
urf
ace
wh
ere
it w
on’t
be
dist
urb
ed.P
lace
th
e pe
tri d
ish
es o
n t
op o
fth
epa
per.
3.
Car
efu
lly p
our
a sa
tura
ted
alu
m s
olu
tion
th
atis
abo
ut
95°C
to
98°C
,or
just
bel
ow b
oilin
gte
mpe
ratu
re,i
nto
eac
h p
etri
dis
h s
o th
at it
ish
alf-
full.
Use
cau
tion
wh
en p
ouri
ng
the
hot
liqu
id t
o av
oid
spla
tter
s an
d bu
rns.
4.
Obs
erve
th
e pe
tri d
ish
es.O
n t
he
nex
t pa
ge,
draw
a d
ata
tabl
e on
wh
ich
to
reco
rd y
our
obse
rvat
ion
s.B
elow
you
r da
ta t
able
,dra
w w
hat
you
obs
erve
hap
pen
ing
in t
he
petr
i dis
has
sign
ed t
o yo
u.
5.
Ever
y 5
min
ute
s fo
r 30
min
ute
s,re
cord
you
rob
serv
atio
ns
ofyo
ur
petr
i dis
h.M
ake
accu
rate
,fu
ll-si
zed
draw
ings
of
any
crys
tals
th
at b
egin
to f
orm
.
PR
OC
ED
UR
E
Geo
Lab
and
Min
iLab
Wor
kshe
ets
Cha
pter
5Ea
rth
Sci
ence
: G
eolo
gy,
the
Envi
ronm
ent,
and
the
Uni
vers
e19
Nam
eC
lass
Dat
e
How
do
igne
ous
rock
s di
ffer
?
Co
mp
are
and
co
ntr
ast
the
dif
fere
nt
char
acte
rist
ics
of
ign
eou
s ro
cks.
Pro
ced
ure
1.
Usi
ng
th
e ig
neo
us
rock
sam
ple
s p
rovi
ded
by
you
r te
ach
er, c
aref
ully
ob
serv
e th
e fo
llow
ing
ch
arac
teri
stic
s o
f ea
ch r
ock
: co
lor,
gra
in s
ize,
text
ure
, an
d, i
f p
oss
ible
, min
eral
co
mp
osi
tio
n.
2.
Des
ign
a d
ata
tab
le t
o r
eco
rd y
ou
r o
bse
rvat
ion
s.
An
aly
ze a
nd
Co
ncl
ud
e
1.
Cla
ssif
y yo
ur
rock
sam
ple
s as
ext
rusi
ve o
r in
tru
sive
ro
cks.
An
swer
s w
ill v
ary
dep
end
ing
on
th
e sa
mp
les
use
d. T
he
coar
se-g
rain
ed s
amp
les
such
as
gra
nit
e, d
iori
te, a
nd
gab
bro
are
intr
usi
ve. T
he
fin
e-g
rain
ed s
amp
les
such
as o
bsi
dia
n, r
hyo
lite,
an
des
ite,
an
d b
asal
t ar
e ex
tru
sive
.
2.
Wh
at c
har
acte
rist
ics
do
th
e ex
tru
sive
ro
cks
shar
e? H
ow
do
th
ey d
iffe
r?W
hat
ch
arac
teri
stic
s d
o t
he
intr
usi
ve r
ock
s sh
are?
Ho
w d
o t
hey
dif
fer?
Extr
usi
ve r
ock
s ar
e fi
ne
gra
ined
. Th
ey d
iffe
r in
co
lor
and
so
me
may
sh
ow
a
po
rph
yrit
ic t
extu
re. I
ntr
usi
ve r
ock
s ar
e co
arse
gra
ined
. Th
ey d
iffe
r in
co
lor
and
min
eral
co
mp
osi
tio
n.
3.
Cla
ssif
y yo
ur
rock
sam
ple
s as
fel
sic,
inte
rmed
iate
, maf
ic, o
r u
ltra
maf
ic.
An
swer
s w
ill v
ary
dep
end
ing
on
th
e sa
mp
les
use
d. L
igh
t-co
lore
d s
amp
les
such
as g
ran
ite
and
rh
yolit
e ar
e fe
lsic
. Med
ium
-co
lore
d s
amp
les
are
inte
rmed
iate
, an
d
dar
k-co
lore
d s
amp
les—
oth
er t
han
ob
sid
ian
—ar
e m
afic
.
Min
iLab
5M
iniL
ab 5
Cop
yrig
ht ©
Gle
ncoe
/McG
raw
-Hill
, a d
ivis
ion
of t
he M
cGra
w-H
ill C
ompa
nies
, Inc
.
T142 Answer Pages Earth Science: Geology, the Environment, and the Universe GeoLab and MiniLab Worksheets
Nam
eC
lass
Dat
e
22
Cha
pter
5Ea
rth
Sci
ence
: G
eolo
gy,
the
Envi
ronm
ent,
and
the
Uni
vers
eG
eoLa
b an
d M
iniL
ab W
orks
heet
s
Mod
elin
g Cr
ysta
l For
mat
ion
1.
Wh
at f
acto
rs a
ffec
ted
the
size
of
the
crys
tals
in t
he
diff
eren
t pe
tri d
ish
es?
How
do
you
kn
ow?
The
coo
ling
rat
e af
fect
ed t
he
crys
tal s
ize.
Th
is is
evi
den
t b
ecau
se it
is t
he
on
ly
vari
able
tes
ted
.
2.
Infe
r w
hy t
he
crys
tals
ch
ange
d sh
ape
as t
hey
gre
w.
The
crys
tals
gre
w la
rger
bu
t m
ain
tain
ed a
sim
ilar
shap
e u
nti
l th
ey b
egan
to
inte
rfer
e
wit
h e
ach
oth
er. T
hei
r sh
apes
bec
ame
dis
tort
ed a
s th
ey g
rew
to
get
her
.
3.
How
is t
his
exp
erim
ent
diff
eren
t fr
om m
agm
a cr
ysta
lliza
tion
? H
ow is
it t
he
sam
e?
The
exp
erim
ent
is d
iffe
ren
t fr
om
mag
ma
crys
talli
zati
on
in t
hat
mag
ma
crys
talli
zati
on
invo
lves
th
e co
olin
g o
f m
elte
d m
iner
als,
wh
erea
s th
is e
xper
imen
t in
volv
es t
he
coo
ling
of
a h
ot
solu
tio
n c
on
tain
ing
dis
solv
ed m
iner
als.
Th
e ex
per
imen
t is
sim
ilar
to
mag
ma
crys
talli
zati
on
in t
hat
th
e co
olin
g r
ate
affe
cted
cry
stal
siz
e in
bo
th c
ases
, an
d
the
crys
tals
gre
w b
y ad
din
g a
tom
s to
th
eir
surf
aces
.
4.
Des
crib
e th
e re
lati
onsh
ip b
etw
een
coo
ling
rate
an
d cr
ysta
l for
mat
ion
.
A f
ast
coo
ling
rat
e re
sult
s in
sm
all c
ryst
als;
a s
low
co
olin
g r
ate
resu
lts
in
larg
e cr
ysta
ls.
CO
NC
LU
DE
AN
D A
PP
LY
AN
AL
YZ
E
3.
Com
pare
you
r dr
awin
gs a
nd
petr
i dis
h w
ith
th
ose
ofot
her
stu
den
ts in
you
r gr
oup.
Wh
ich
pet
ri d
ish
had
th
e sm
alle
st a
vera
ge c
ryst
al s
ize?
Des
crib
e th
e co
ndi
tion
s u
nde
r w
hic
h t
hat
pet
ri d
ish
coo
led.
The
pet
ri d
ish
th
at c
oo
led
mo
st q
uic
kly
will
hav
e th
e sm
alle
st c
ryst
als.
Th
e co
nd
itio
ns
un
der
wh
ich
th
e p
etri
dis
h c
oo
led
will
var
y, d
epen
din
g o
n t
he
coo
ling
met
ho
d u
sed
.
4.
Do
all t
he
crys
tals
hav
e th
e sa
me
shap
e? D
raw
th
e m
ost
com
mon
sh
ape.
Shar
e yo
ur
draw
ings
wit
h o
ther
gro
ups
.Des
crib
e an
y pa
tter
ns
that
you
see
.
The
maj
ori
ty o
f th
e cr
ysta
ls w
ill h
ave
the
sam
e sh
ape
un
til t
hey
beg
in t
o g
row
tog
eth
er.
Nam
eC
lass
Dat
e
Geo
Lab
and
Min
iLab
Wor
kshe
ets
Cha
pter
5Ea
rth
Sci
ence
: G
eolo
gy,
the
Envi
ronm
ent,
and
the
Uni
vers
e21
Mod
elin
g Cr
ysta
l For
mat
ion
DA
TATA
BLE
OB
SERV
ATI
ON
S
1.
How
did
you
var
y th
e co
olin
g ra
te o
fth
e so
luti
ons
in t
he
petr
i dis
hes
? C
ompa
re y
our
met
hod
sw
ith
th
ose
ofot
her
gro
ups
.Did
on
e m
eth
od a
ppea
r to
wor
k be
tter
th
an o
ther
s? E
xpla
in.
An
swer
s w
ill v
ary
dep
end
ing
on
th
e co
olin
g m
eth
od
use
d. P
oss
ible
met
ho
ds
are
liste
d u
nd
er D
ata
and
Ob
serv
atio
ns.
2.
Use
a m
agn
ifyi
ng
glas
s or
bin
ocu
lar
mic
rosc
ope
to o
bser
ve y
our
alu
m c
ryst
als.
Wh
atdo
th
e cr
ysta
ls lo
ok li
ke?
Are
all
the
crys
tals
th
e sa
me
size
?
Alu
m c
ryst
als
are
tab
ula
r an
d h
ave
six
sid
es. T
hey
loo
k lik
e tr
ian
gle
s w
ith
th
e
corn
ers
cut
off
. Th
e cr
ysta
ls m
ay b
e d
iffe
ren
t si
zes.
AN
AL
YZ
E
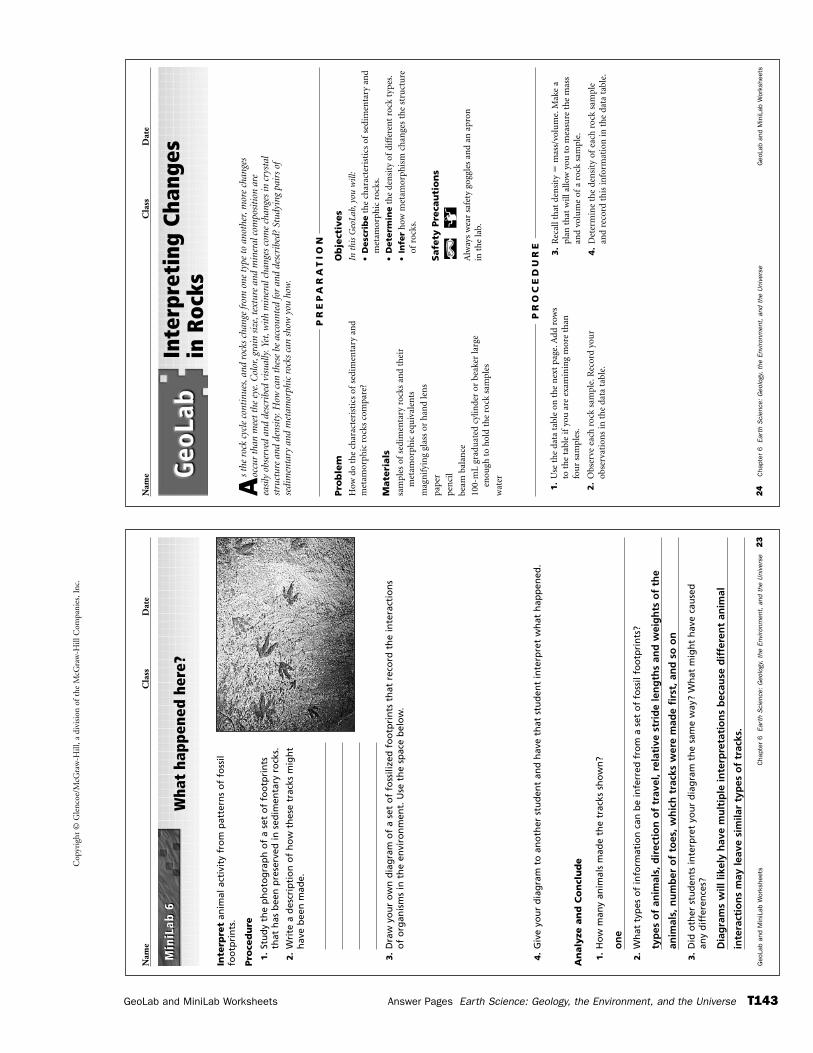
Cop
yrig
ht ©
Gle
ncoe
/McG
raw
-Hill
, a d
ivis
ion
of t
he M
cGra
w-H
ill C
ompa
nies
, Inc
.
GeoLab and MiniLab Worksheets Answer Pages Earth Science: Geology, the Environment, and the Universe T143
24
Cha
pter
6Ea
rth
Sci
ence
: G
eolo
gy,
the
Envi
ronm
ent,
and
the
Uni
vers
eG
eoLa
b an
d M
iniL
ab W
orks
heet
s
Nam
eC
lass
Dat
e
As
the
rock
cyc
le c
onti
nues
,and
roc
ks c
hang
e fr
om o
ne t
ype
to a
noth
er,m
ore
chan
ges
occu
r th
an m
eet
the
eye.
Col
or,g
rain
siz
e,te
xtur
e an
d m
iner
al c
ompo
siti
on a
reea
sily
obs
erve
d an
d de
scri
bed
visu
ally
.Yet
,wit
h m
iner
al c
hang
es c
ome
chan
ges
in c
ryst
alst
ruct
ure
and
dens
ity.
How
can
the
se b
e ac
coun
ted
for
and
desc
ribe
d? S
tudy
ing
pair
s of
sedi
men
tary
and
met
amor
phic
roc
ks c
an s
how
you
how
.
Pro
ble
mH
ow d
o th
e ch
arac
teri
stic
s of
sedi
men
tary
an
dm
etam
orph
ic r
ocks
com
pare
?
Mate
rials
sam
ples
of
sedi
men
tary
roc
ks a
nd
thei
r m
etam
orph
ic e
quiv
alen
ts
mag
nif
yin
g gl
ass
or h
and
len
s
pape
r
pen
cil
beam
bal
ance
100-
mL
grad
uat
ed c
ylin
der
or b
eake
r la
rge
enou
gh t
o h
old
the
rock
sam
ples
wat
er
Ob
ject
ives
In t
his
Geo
Lab,
you
will
:
•D
esc
rib
eth
e ch
arac
teri
stic
s of
sedi
men
tary
an
dm
etam
orph
ic r
ocks
.
•D
ete
rmin
eth
e de
nsi
ty o
fdi
ffer
ent
rock
typ
es.
•In
fer
how
met
amor
phis
m c
han
ges
the
stru
ctu
reof
rock
s.
Safe
ty P
reca
uti
on
s
Alw
ays
wea
r sa
fety
gog
gles
an
d an
apr
on
in t
he
lab.
Inte
rpre
ting
Cha
nges
in
Roc
ks
PR
EP
AR
AT
ION
1.
Use
th
e da
ta t
able
on
th
e n
ext
page
.Add
row
sto
th
e ta
ble
ifyo
u a
re e
xam
inin
g m
ore
than
fou
r sa
mpl
es.
2.
Obs
erve
eac
h r
ock
sam
ple.
Rec
ord
you
rob
serv
atio
ns
in t
he
data
tab
le.
3.
Rec
all t
hat
den
sity
�m
ass/
volu
me.
Mak
e a
plan
th
at w
ill a
llow
you
to
mea
sure
th
e m
ass
and
volu
me
ofa
rock
sam
ple.
4.
Det
erm
ine
the
den
sity
of
each
roc
k sa
mpl
ean
d re
cord
th
is in
form
atio
n in
th
e da
ta t
able
.
PR
OC
ED
UR
E
Geo
Lab
and
Min
iLab
Wor
kshe
ets
Cha
pter
6Ea
rth
Sci
ence
: G
eolo
gy,
the
Envi
ronm
ent,
and
the
Uni
vers
e23
Nam
eC
lass
Dat
e
Wha
t ha
ppen
ed h
ere?
Inte
rpre
tan
imal
act
ivit
y fr
om
pat
tern
s o
f fo
ssil
foo
tpri
nts
.
Pro
ced
ure
1.
Stu
dy
the
ph
oto
gra
ph
of
a se
t o
f fo
otp
rin
tsth
at h
as b
een
pre
serv
ed in
sed
imen
tary
ro
cks.
2.
Wri
te a
des
crip
tio
n o
f h
ow
th
ese
trac
ks m
igh
th
ave
bee
n m
ade.
3.
Dra
w y
ou
r o
wn
dia
gra
m o
f a
set
of
foss
ilize
d f
oo
tpri
nts
th
at r
eco
rd t
he
inte
ract
ion
so
fo
rgan
ism
s in
th
e en
viro
nm
ent.
Use
th
e sp
ace
bel
ow
.
4.
Giv
e yo
ur
dia
gra
m t
o a
no
ther
stu
den
t an
d h
ave
that
stu
den
t in
terp
ret
wh
at h
app
ened
.
An
aly
ze a
nd
Co
ncl
ud
e
1.
Ho
w m
any
anim
als
mad
e th
e tr
acks
sh
ow
n?
on
e
2.
Wh
at t
ypes
of
info
rmat
ion
can
be
infe
rred
fro
m a
set
of
foss
il fo
otp
rin
ts?
typ
es o
f an
imal
s, d
irec
tio
n o
f tr
avel
, rel
ativ
e st
rid
e le
ng
ths
and
wei
gh
ts o
f th
e
anim
als,
nu
mb
er o
f to
es, w
hic
h t
rack
s w
ere
mad
e fi
rst,
an
d s
o o
n
3.
Did
oth
er s
tud
ents
inte
rpre
t yo
ur
dia
gra
m t
he
sam
e w
ay?
Wh
at m
igh
t h
ave
cau
sed
an
y d
iffe
ren
ces?
Dia
gra
ms
will
like
ly h
ave
mu
ltip
le in
terp
reta
tio
ns
bec
ause
dif
fere
nt
anim
al
inte
ract
ion
s m
ay le
ave
sim
ilar
typ
es o
f tr
acks
.
Min
iLab
6M
iniL
ab 6
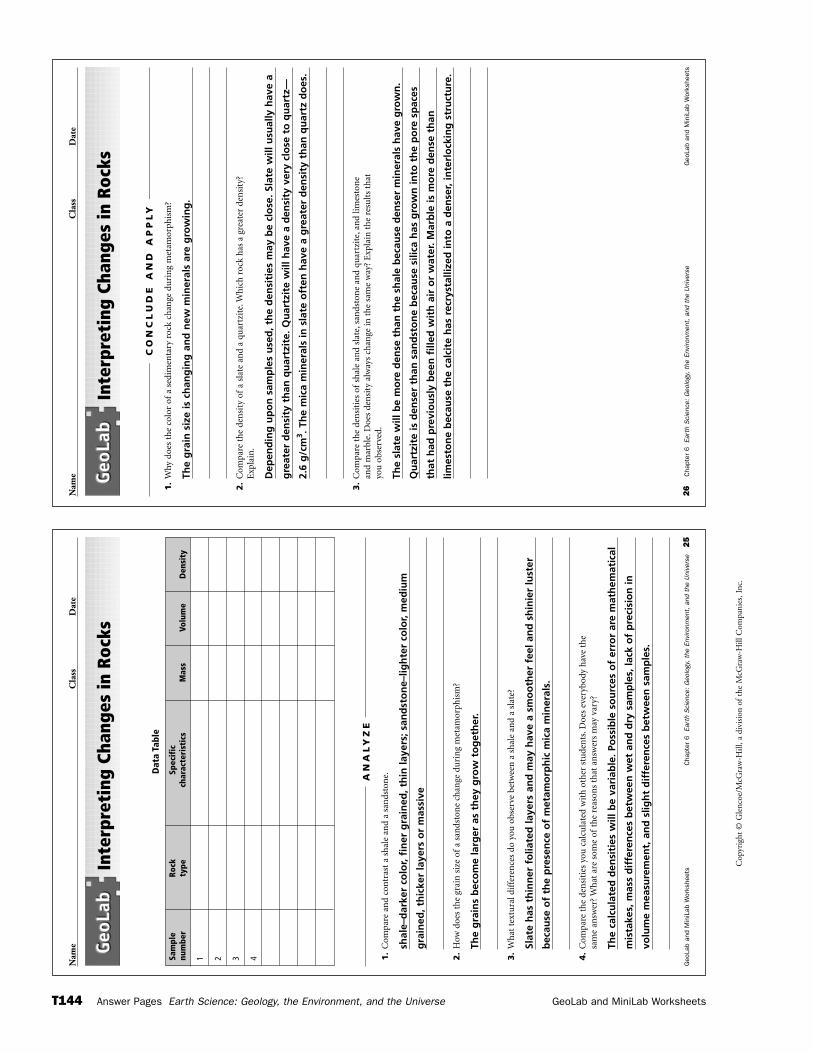
Cop
yrig
ht ©
Gle
ncoe
/McG
raw
-Hill
, a d
ivis
ion
of t
he M
cGra
w-H
ill C
ompa
nies
, Inc
.
T144 Answer Pages Earth Science: Geology, the Environment, and the Universe GeoLab and MiniLab Worksheets
Nam
eC
lass
Dat
e
26
Cha
pter
6Ea
rth
Sci
ence
: G
eolo
gy,
the
Envi
ronm
ent,
and
the
Uni
vers
eG
eoLa
b an
d M
iniL
ab W
orks
heet
s
Inte
rpre
ting
Cha
nges
in R
ocks
1.
Why
doe
s th
e co
lor
ofa
sedi
men
tary
roc
k ch
ange
du
rin
g m
etam
orph
ism
?
The
gra
in s
ize
is c
han
gin
g a
nd
new
min
eral
s ar
e g
row
ing
.
2.
Com
pare
th
e de
nsi
ty o
fa
slat
e an
d a
quar
tzit
e.W
hic
h r
ock
has
a g
reat
er d
ensi
ty?
Exp
lain
.
Dep
end
ing
up
on
sam
ple
s u
sed
, th
e d
ensi
ties
may
be
clo
se. S
late
will
usu
ally
hav
e a
gre
ater
den
sity
th
an q
uar
tzit
e. Q
uar
tzit
e w
ill h
ave
a d
ensi
ty v
ery
clo
se t
o q
uar
tz—
2.6
g/c
m3 . T
he
mic
a m
iner
als
in s
late
oft
en h
ave
a g
reat
er d
ensi
ty t
han
qu
artz
do
es.
3.
Com
pare
th
e de
nsi
ties
of
shal
e an
d sl
ate,
san
dsto
ne
and
quar
tzit
e,an
d lim
esto
ne
and
mar
ble.
Doe
s de
nsi
ty a
lway
s ch
ange
in t
he
sam
e w
ay?
Exp
lain
th
e re
sult
s th
at
you
obs
erve
d.
The
slat
e w
ill b
e m
ore
den
se t
han
th
e sh
ale
bec
ause
den
ser
min
eral
s h
ave
gro
wn
.
Qu
artz
ite
is d
ense
r th
an s
and
sto
ne
bec
ause
sili
ca h
as g
row
n in
to t
he
po
re s
pac
es
that
had
pre
vio
usl
y b
een
fill
ed w
ith
air
or
wat
er. M
arb
le is
mo
re d
ense
th
an
limes
ton
e b
ecau
se t
he
calc
ite
has
rec
ryst
alliz
ed in
to a
den
ser,
inte
rlo
ckin
g s
tru
ctu
re.
CO
NC
LU
DE
AN
D A
PP
LY
Nam
eC
lass
Dat
e
Geo
Lab
and
Min
iLab
Wor
kshe
ets
Cha
pter
6Ea
rth
Sci
ence
: G
eolo
gy,
the
Envi
ronm
ent,
and
the
Uni
vers
e25
Inte
rpre
ting
Cha
nges
in R
ocks
1.
Com
pare
an
d co
ntr
ast
a sh
ale
and
a sa
nds
ton
e.
shal
e–d
arke
r co
lor,
fin
er g
rain
ed, t
hin
laye
rs; s
and
sto
ne–
ligh
ter
colo
r, m
ediu
m
gra
ined
, th
icke
r la
yers
or
mas
sive
2.
How
doe
s th
e gr
ain
siz
e of
a sa
nds
ton
e ch
ange
du
rin
g m
etam
orph
ism
?
The
gra
ins
bec
om
e la
rger
as
they
gro
w t
og
eth
er.
3.
Wh
at t
extu
ral d
iffe
ren
ces
do y
ou o
bser
ve b
etw
een
a s
hal
e an
d a
slat
e?
Slat
e h
as t
hin
ner
fo
liate
d la
yers
an
d m
ay h
ave
a sm
oo
ther
fee
l an
d s
hin
ier
lust
er
bec
ause
of
the
pre
sen
ce o
f m
etam
orp
hic
mic
a m
iner
als.
4.
Com
pare
th
e de
nsi
ties
you
cal
cula
ted
wit
h o
ther
stu
den
ts.D
oes
ever
ybod
y h
ave
the
sam
e an
swer
? W
hat
are
som
e of
the
reas
ons
that
an
swer
s m
ay v
ary?
The
calc
ula
ted
den
siti
es w
ill b
e va
riab
le. P
oss
ible
so
urc
es o
f er
ror
are
mat
hem
atic
al
mis
take
s, m
ass
dif
fere
nce
s b
etw
een
wet
an
d d
ry s
amp
les,
lack
of
pre
cisi
on
in
volu
me
mea
sure
men
t, a
nd
slig
ht
dif
fere
nce
s b
etw
een
sam
ple
s.
AN
AL
YZ
E
Sam
ple
Rock
Spec
ific
num
ber
type
char
acte
rist
ics
Mas
sVo
lum
eD
ensi
ty
1 2 3 4
Dat
a Ta
ble
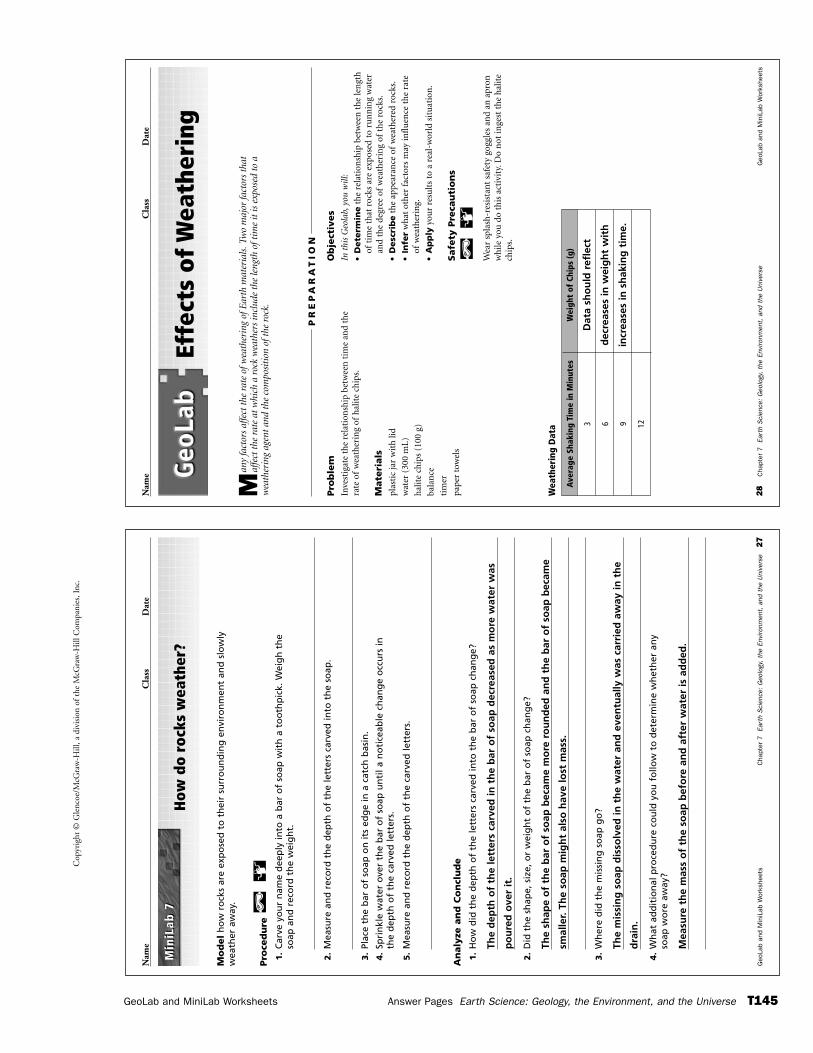
Cop
yrig
ht ©
Gle
ncoe
/McG
raw
-Hill
, a d
ivis
ion
of t
he M
cGra
w-H
ill C
ompa
nies
, Inc
.
GeoLab and MiniLab Worksheets Answer Pages Earth Science: Geology, the Environment, and the Universe T145
28
Cha
pter
7Ea
rth
Sci
ence
: G
eolo
gy,
the
Envi
ronm
ent,
and
the
Uni
vers
eG
eoLa
b an
d M
iniL
ab W
orks
heet
s
Nam
eC
lass
Dat
e
Man
y fa
ctor
s af
fect
the
rat
e of
wea
ther
ing
ofE
arth
mat
eria
ls.T
wo
maj
or fa
ctor
s th
ataf
fect
the
rat
e at
whi
ch a
roc
k w
eath
ers
incl
ude
the
leng
th o
ftim
e it
is e
xpos
ed t
o a
wea
ther
ing
agen
t an
d th
e co
mpo
siti
on o
fthe
roc
k.
Pro
ble
mIn
vest
igat
e th
e re
lati
onsh
ip b
etw
een
tim
e an
d th
era
te o
fw
eath
erin
g of
hal
ite
chip
s.
Mate
rials
plas
tic
jar
wit
h li
d
wat
er (
300
mL)
hal
ite
chip
s (1
00 g
)
bala
nce
tim
er
pape
r to
wel
s
Ob
ject
ives
In t
his
Geo
lab,
you
will
:
•D
ete
rmin
eth
e re
lati
onsh
ip b
etw
een
th
e le
ngt
hof
tim
e th
at r
ocks
are
exp
osed
to
run
nin
g w
ater
and
the
degr
ee o
fw
eath
erin
g of
the
rock
s.
•D
esc
rib
eth
e ap
pear
ance
of
wea
ther
ed r
ocks
.
•In
fer
wh
at o
ther
fac
tors
may
infl
uen
ce t
he
rate
ofw
eath
erin
g.
•A
pp
lyyo
ur
resu
lts
to a
rea
l-w
orld
sit
uat
ion
.
Safe
ty P
reca
uti
on
s
Wea
r sp
lash
-res
ista
nt
safe
ty g
oggl
es a
nd
an a
pron
wh
ile y
ou d
o th
is a
ctiv
ity.
Do
not
inge
st t
he
hal
ite
chip
s.
Effe
cts
of W
eath
erin
g
PR
EP
AR
AT
ION
Ave
rage
Sha
king
Tim
e in
Min
utes
Wei
ght
of C
hips
(g)
3D
ata
sho
uld
ref
lect
6d
ecre
ases
in w
eig
ht
wit
h
9in
crea
ses
in s
hak
ing
tim
e.
12
Wea
ther
ing
Dat
a
Geo
Lab
and
Min
iLab
Wor
kshe
ets
Cha
pter
7Ea
rth
Sci
ence
: G
eolo
gy,
the
Envi
ronm
ent,
and
the
Uni
vers
e27
Nam
eC
lass
Dat
e
How
do
rock
s w
eath
er?
Mo
del
ho
w r
ock
s ar
e ex
po
sed
to
th
eir
surr
ou
nd
ing
en
viro
nm
ent
and
slo
wly
wea
ther
aw
ay.
Pro
ced
ure
1.
Car
ve y
ou
r n
ame
dee
ply
into
a b
ar o
f so
ap w
ith
a t
oo
thp
ick.
Wei
gh
th
eso
ap a
nd
rec
ord
th
e w
eig
ht.
2.
Mea
sure
an
d r
eco
rd t
he
dep
th o
f th
e le
tter
s ca
rved
into
th
e so
ap.
3.
Plac
e th
e b
ar o
f so
ap o
n it
s ed
ge
in a
cat
ch b
asin
.
4.
Spri
nkl
e w
ater
ove
r th
e b
ar o
f so
ap u
nti
l a n
oti
ceab
le c
han
ge
occ
urs
inth
e d
epth
of
the
carv
ed le
tter
s.
5.
Mea
sure
an
d r
eco
rd t
he
dep
th o
f th
e ca
rved
lett
ers.
An
aly
ze a
nd
Co
ncl
ud
e
1.
Ho
w d
id t
he
dep
th o
f th
e le
tter
s ca
rved
into
th
e b
ar o
f so
ap c
han
ge?
The
dep
th o
f th
e le
tter
s ca
rved
in t
he
bar
of
soap
dec
reas
ed a
s m
ore
wat
er w
as
po
ure
d o
ver
it.
2.
Did
th
e sh
ape,
siz
e, o
r w
eig
ht
of
the
bar
of
soap
ch
ang
e?
The
shap
e o
f th
e b
ar o
f so
ap b
ecam
e m
ore
ro
un
ded
an
d t
he
bar
of
soap
bec
ame
smal
ler.
The
soap
mig
ht
also
hav
e lo
st m
ass.
3.
Wh
ere
did
th
e m
issi
ng
so
ap g
o?
The
mis
sin
g s
oap
dis
solv
ed in
th
e w
ater
an
d e
ven
tual
ly w
as c
arri
ed a
way
in t
he
dra
in.
4.
Wh
at a
dd
itio
nal
pro
ced
ure
co
uld
yo
u f
ollo
w t
o d
eter
min
e w
het
her
an
yso
ap w
ore
aw
ay?
Mea
sure
th
e m
ass
of
the
soap
bef
ore
an
d a
fter
wat
er is
ad
ded
.
Min
iLab
7M
iniL
ab 7
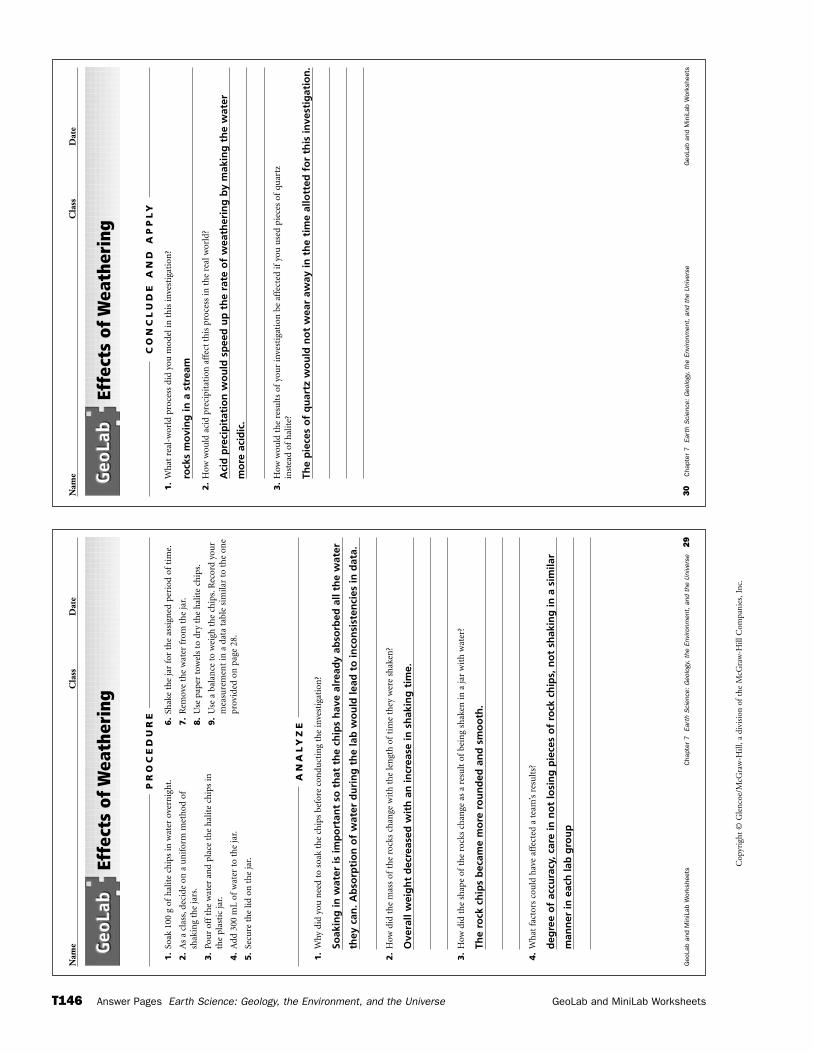
Cop
yrig
ht ©
Gle
ncoe
/McG
raw
-Hill
, a d
ivis
ion
of t
he M
cGra
w-H
ill C
ompa
nies
, Inc
.
T146 Answer Pages Earth Science: Geology, the Environment, and the Universe GeoLab and MiniLab Worksheets
Nam
eC
lass
Dat
e
30
Cha
pter
7Ea
rth
Sci
ence
: G
eolo
gy,
the
Envi
ronm
ent,
and
the
Uni
vers
eG
eoLa
b an
d M
iniL
ab W
orks
heet
s
Effe
cts
of W
eath
erin
g
1.
Wh
at r
eal-
wor
ld p
roce
ss d
id y
ou m
odel
in t
his
inve
stig
atio
n?
rock
s m
ovi
ng
in a
str
eam
2.
How
wou
ld a
cid
prec
ipit
atio
n a
ffec
t th
is p
roce
ss in
th
e re
al w
orld
?
Aci
d p
reci
pit
atio
n w
ou
ld s
pee
d u
p t
he
rate
of
wea
ther
ing
by
mak
ing
th
e w
ater
mo
re a
cid
ic.
3.
How
wou
ld t
he
resu
lts
ofyo
ur
inve
stig
atio
n b
e af
fect
ed if
you
use
d pi
eces
of
quar
tzin
stea
d of
hal
ite?
The
pie
ces
of
qu
artz
wo
uld
no
t w
ear
away
in t
he
tim
e al
lott
ed f
or
this
inve
stig
atio
n.
CO
NC
LU
DE
AN
D A
PP
LY
Nam
eC
lass
Dat
e
Geo
Lab
and
Min
iLab
Wor
kshe
ets
Cha
pter
7Ea
rth
Sci
ence
: G
eolo
gy,
the
Envi
ronm
ent,
and
the
Uni
vers
e29
Effe
cts
of W
eath
erin
g
1.
Why
did
you
nee
d to
soa
k th
e ch
ips
befo
re c
ondu
ctin
g th
e in
vest
igat
ion
?
Soak
ing
in w
ater
is im
po
rtan
t so
th
at t
he
chip
s h
ave
alre
ady
abso
rbed
all
the
wat
er
they
can
. Ab
sorp
tio
n o
f w
ater
du
rin
g t
he
lab
wo
uld
lead
to
inco
nsi
sten
cies
in d
ata.
2.
How
did
th
e m
ass
ofth
e ro
cks
chan
ge w
ith
th
e le
ngt
h o
fti
me
they
wer
e sh
aken
?
Ove
rall
wei
gh
t d
ecre
ased
wit
h a
n in
crea
se in
sh
akin
g t
ime.
3.
How
did
th
e sh
ape
ofth
e ro
cks
chan
ge a
s a
resu
lt o
fbe
ing
shak
en in
a ja
r w
ith
wat
er?
The
rock
ch
ips
bec
ame
mo
re r
ou
nd
ed a
nd
sm
oo
th.
4.
Wh
at f
acto
rs c
ould
hav
e af
fect
ed a
tea
m’s
res
ult
s?
deg
ree
of
accu
racy
, car
e in
no
t lo
sin
g p
iece
s o
f ro
ck c
hip
s, n
ot
shak
ing
in a
sim
ilar
man
ner
in e
ach
lab
gro
up
AN
AL
YZ
E
1.
Soak
100
g o
fh
alit
e ch
ips
in w
ater
ove
rnig
ht.
2.
As
a cl
ass,
deci
de o
n a
un
ifor
m m
eth
od o
fsh
akin
g th
e ja
rs.
3.
Pou
r of
fth
e w
ater
an
d pl
ace
the
hal
ite
chip
s in
the
plas
tic
jar.
4.
Add
300
mL
ofw
ater
to
the
jar.
5.
Secu
re t
he
lid o
n t
he
jar.
6.
Shak
e th
e ja
r fo
r th
e as
sign
ed p
erio
d of
tim
e.
7.
Rem
ove
the
wat
er f
rom
th
e ja
r.
8.
Use
pap
er t
owel
s to
dry
th
e h
alit
e ch
ips.
9.
Use
a b
alan
ce t
o w
eigh
th
e ch
ips.
Rec
ord
you
rm
easu
rem
ent
in a
dat
a ta
ble
sim
ilar
to t
he
one
prov
ided
on
pag
e 28
.
PR
OC
ED
UR
E
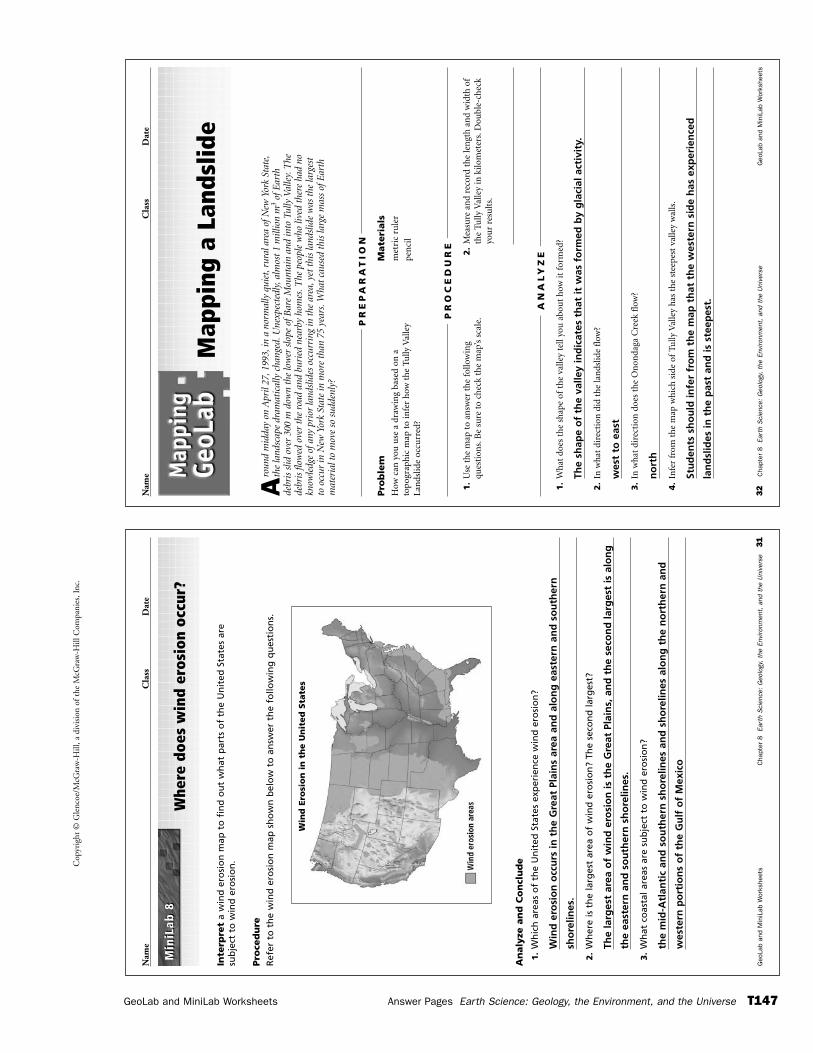
Cop
yrig
ht ©
Gle
ncoe
/McG
raw
-Hill
, a d
ivis
ion
of t
he M
cGra
w-H
ill C
ompa
nies
, Inc
.
GeoLab and MiniLab Worksheets Answer Pages Earth Science: Geology, the Environment, and the Universe T147
32
Cha
pter
8Ea
rth
Sci
ence
: G
eolo
gy,
the
Envi
ronm
ent,
and
the
Uni
vers
eG
eoLa
b an
d M
iniL
ab W
orks
heet
s
Nam
eC
lass
Dat
e
Aro
und
mid
day
on A
pril
27,1
993,
in a
nor
mal
ly q
uiet
,rur
al a
rea
ofN
ew Y
ork
Stat
e,th
e la
ndsc
ape
dram
atic
ally
cha
nged
.Une
xpec
tedl
y,al
mos
t 1
mill
ion
m3
ofE
arth
debr
is s
lid o
ver
300
m d
own
the
low
er s
lope
ofB
are
Mou
ntai
n an
d in
to T
ully
Val
ley.
The
debr
is fl
owed
ove
r th
e ro
ad a
nd b
urie
d ne
arby
hom
es.T
he p
eopl
e w
ho li
ved
ther
e ha
d no
know
ledg
e of
any
prio
r la
ndsl
ides
occ
urri
ng in
the
are
a,ye
t th
is la
ndsl
ide
was
the
larg
est
to o
ccur
in N
ew Y
ork
Stat
e in
mor
e th
an 7
5 ye
ars.
Wha
t ca
used
thi
s la
rge
mas
s of
Ear
thm
ater
ial t
o m
ove
so s
udde
nly?
Pro
ble
mH
ow c
an y
ou u
se a
dra
win
g ba
sed
on a
to
pogr
aph
ic m
ap t
o in
fer
how
th
e Tu
lly V
alle
yLa
nds
lide
occu
rred
?
Mate
rials
m
etri
c ru
ler
pen
cil
Map
ping
a L
ands
lide
PR
EP
AR
AT
ION
1.
Use
th
e m
ap t
o an
swer
th
e fo
llow
ing
ques
tion
s.B
e su
re t
o ch
eck
the
map
’s s
cale
.2.
Mea
sure
an
d re
cord
th
e le
ngt
h a
nd
wid
th o
fth
e Tu
lly V
alle
y in
kilo
met
ers.
Dou
ble-
chec
kyo
ur
resu
lts.
PR
OC
ED
UR
E
1.
Wh
at d
oes
the
shap
e of
the
valle
y te
ll yo
u a
bou
t h
ow it
for
med
?
The
shap
e o
f th
e va
lley
ind
icat
es t
hat
it w
as f
orm
ed b
y g
laci
al a
ctiv
ity.
2.
In w
hat
dir
ecti
on d
id t
he
lan
dslid
e fl
ow?
wes
t to
eas
t
3.
In w
hat
dir
ecti
on d
oes
the
On
onda
ga C
reek
flo
w?
no
rth
4.
Infe
r fr
om t
he
map
wh
ich
sid
e of
Tully
Val
ley
has
th
e st
eepe
st v
alle
y w
alls
.
Stu
den
ts s
ho
uld
infe
r fr
om
th
e m
ap t
hat
th
e w
este
rn s
ide
has
exp
erie
nce
d
lan
dsl
ides
in t
he
pas
t an
d is
ste
epes
t.AN
AL
YZ
E
Geo
Lab
and
Min
iLab
Wor
kshe
ets
Cha
pter
8Ea
rth
Sci
ence
: G
eolo
gy,
the
Envi
ronm
ent,
and
the
Uni
vers
e31
Nam
eC
lass
Dat
e
Whe
re d
oes
win
d er
osio
n oc
cur?
Inte
rpre
ta
win
d e
rosi
on
map
to
fin
d o
ut
wh
at p
arts
of
the
Un
ited
Sta
tes
are
sub
ject
to
win
d e
rosi
on
.
Pro
ced
ure
Ref
er t
o t
he
win
d e
rosi
on
map
sh
ow
n b
elo
w t
o a
nsw
er t
he
follo
win
g q
ues
tio
ns.
An
aly
ze a
nd
Co
ncl
ud
e
1.
Wh
ich
are
as o
f th
e U
nit
ed S
tate
s ex
per
ien
ce w
ind
ero
sio
n?
Win
d e
rosi
on
occ
urs
in t
he
Gre
at P
lain
s ar
ea a
nd
alo
ng
eas
tern
an
d s
ou
ther
n
sho
relin
es.
2.
Wh
ere
is t
he
larg
est
area
of
win
d e
rosi
on
? Th
e se
con
d la
rges
t?
The
larg
est
area
of
win
d e
rosi
on
is t
he
Gre
at P
lain
s, a
nd
th
e se
con
d la
rges
t is
alo
ng
the
east
ern
an
d s
ou
ther
n s
ho
relin
es.
3.
Wh
at c
oas
tal a
reas
are
su
bje
ct t
o w
ind
ero
sio
n?
the
mid
-Atl
anti
c an
d s
ou
ther
n s
ho
relin
es a
nd
sh
ore
lines
alo
ng
th
e n
ort
her
n a
nd
wes
tern
po
rtio
ns
of
the
Gu
lf o
f M
exic
o
Min
iLab
8M
iniL
ab 8
Win
d E
rosi
on
in
th
e U
nit
ed
Sta
tes
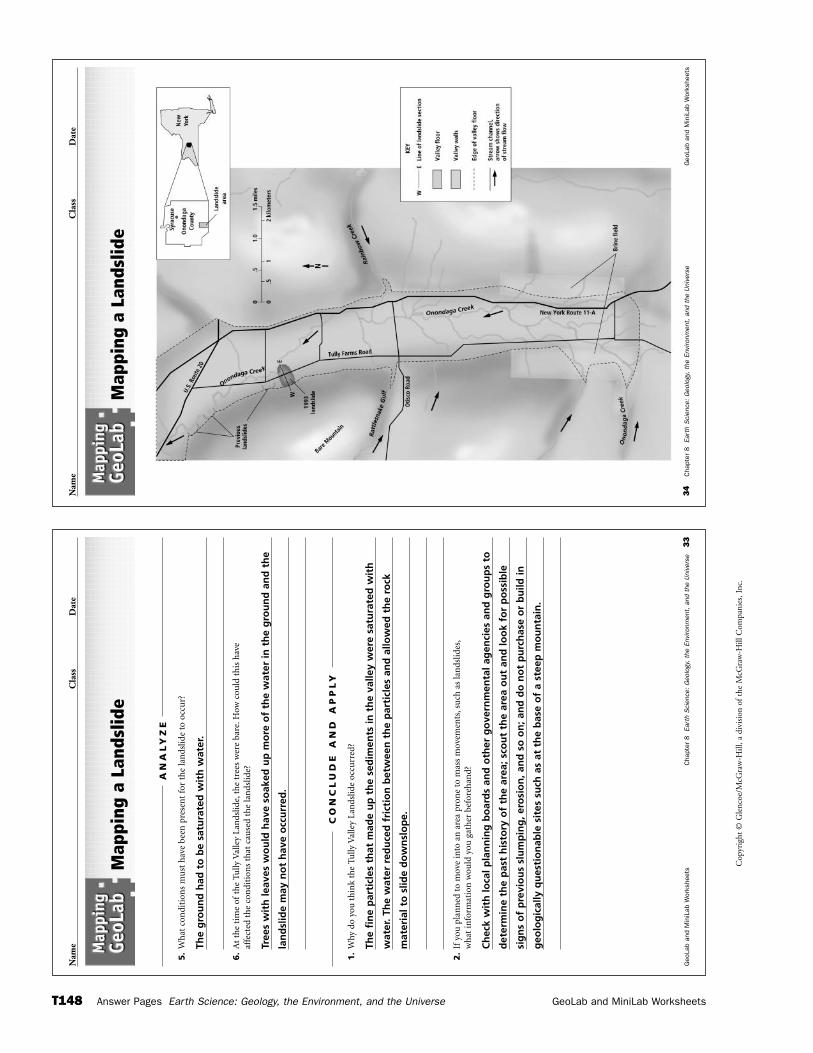
Cop
yrig
ht ©
Gle
ncoe
/McG
raw
-Hill
, a d
ivis
ion
of t
he M
cGra
w-H
ill C
ompa
nies
, Inc
.
T148 Answer Pages Earth Science: Geology, the Environment, and the Universe GeoLab and MiniLab Worksheets
Nam
eC
lass
Dat
e
34
Cha
pter
8Ea
rth
Sci
ence
: G
eolo
gy,
the
Envi
ronm
ent,
and
the
Uni
vers
eG
eoLa
b an
d M
iniL
ab W
orks
heet
s
Map
ping
a L
ands
lide
Nam
eC
lass
Dat
e
Geo
Lab
and
Min
iLab
Wor
kshe
ets
Cha
pter
8Ea
rth
Sci
ence
: G
eolo
gy,
the
Envi
ronm
ent,
and
the
Uni
vers
e33
Map
ping
a L
ands
lide
5.
Wh
at c
ondi
tion
s m
ust
hav
e be
en p
rese
nt
for
the
lan
dslid
e to
occ
ur?
The
gro
un
d h
ad t
o b
e sa
tura
ted
wit
h w
ater
.
6.
At
the
tim
e of
the
Tully
Val
ley
Lan
dslid
e,th
e tr
ees
wer
e ba
re.H
ow c
ould
th
is h
ave
affe
cted
th
e co
ndi
tion
s th
at c
ause
d th
e la
nds
lide?
Tree
s w
ith
leav
es w
ou
ld h
ave
soak
ed u
p m
ore
of
the
wat
er in
th
e g
rou
nd
an
d t
he
lan
dsl
ide
may
no
t h
ave
occ
urr
ed.
AN
AL
YZ
E
1.
Why
do
you
th
ink
the
Tully
Val
ley
Lan
dslid
e oc
curr
ed?
The
fin
e p
arti
cles
th
at m
ade
up
th
e se
dim
ents
in t
he
valle
y w
ere
satu
rate
d w
ith
wat
er. T
he
wat
er r
edu
ced
fri
ctio
n b
etw
een
th
e p
arti
cles
an
d a
llow
ed t
he
rock
mat
eria
l to
slid
e d
ow
nsl
op
e.
2.
Ifyo
u p
lan
ned
to
mov
e in
to a
n a
rea
pron
e to
mas
s m
ovem
ents
,su
ch a
s la
nds
lides
,w
hat
info
rmat
ion
wou
ld y
ou g
ath
er b
efor
ehan
d?
Ch
eck
wit
h lo
cal p
lan
nin
g b
oar
ds
and
oth
er g
ove
rnm
enta
l ag
enci
es a
nd
gro
up
s to
det
erm
ine
the
pas
t h
isto
ry o
f th
e ar
ea; s
cou
t th
e ar
ea o
ut
and
loo
k fo
r p
oss
ible
sig
ns
of
pre
vio
us
slu
mp
ing
, ero
sio
n, a
nd
so
on
; an
d d
o n
ot
pu
rch
ase
or
bu
ild in
geo
log
ical
ly q
ues
tio
nab
le s
ites
su
ch a
s at
th
e b
ase
of
a st
eep
mo
un
tain
.
CO
NC
LU
DE
AN
D A
PP
LY
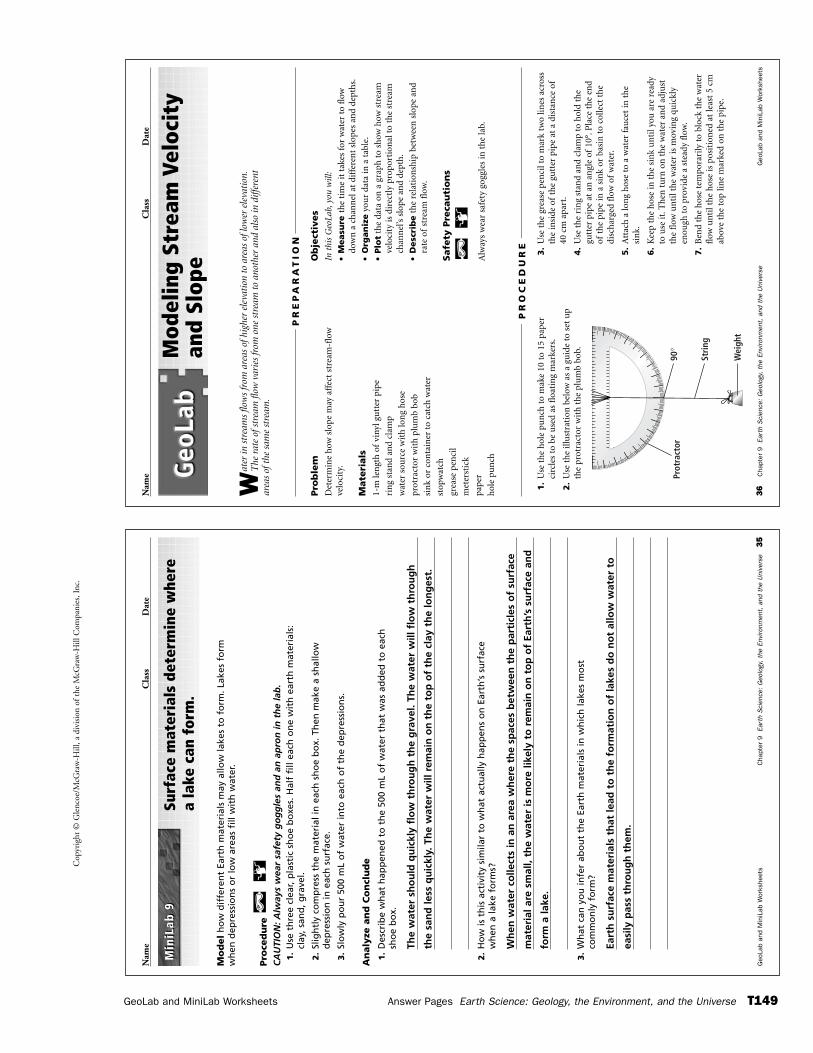
Cop
yrig
ht ©
Gle
ncoe
/McG
raw
-Hill
, a d
ivis
ion
of t
he M
cGra
w-H
ill C
ompa
nies
, Inc
.
GeoLab and MiniLab Worksheets Answer Pages Earth Science: Geology, the Environment, and the Universe T149
36
Cha
pter
9Ea
rth
Sci
ence
: G
eolo
gy,
the
Envi
ronm
ent,
and
the
Uni
vers
eG
eoLa
b an
d M
iniL
ab W
orks
heet
s
Nam
eC
lass
Dat
e
Wat
er in
str
eam
s flo
ws
from
are
as o
fhig
her
elev
atio
n to
are
as o
flow
er e
leva
tion
.T
he r
ate
ofst
ream
flow
var
ies
from
one
str
eam
to
anot
her
and
also
in d
iffer
ent
area
s of
the
sam
e st
ream
.
Pro
ble
mD
eter
min
e h
ow s
lope
may
aff
ect
stre
am-f
low
ve
loci
ty.
Mate
rials
1-m
len
gth
of
viny
l gu
tter
pip
e
rin
g st
and
and
clam
p
wat
er s
ourc
e w
ith
lon
g h
ose
prot
ract
or w
ith
plu
mb
bob
sin
k or
con
tain
er t
o ca
tch
wat
er
stop
wat
ch
grea
se p
enci
l
met
erst
ick
pape
r
hol
e pu
nch
Ob
ject
ives
In t
his
Geo
Lab,
you
will
:
•M
easu
re t
he
tim
e it
tak
es f
or w
ater
to
flow
dow
n a
ch
ann
el a
t di
ffer
ent
slop
es a
nd
dept
hs.
•O
rgan
ize
you
r da
ta in
a t
able
.
•Plo
tth
e da
ta o
n a
gra
ph t
o sh
ow h
ow s
trea
mve
loci
ty is
dir
ectl
y pr
opor
tion
al t
o th
e st
ream
chan
nel
’s s
lope
an
d de
pth
.
•D
esc
rib
eth
e re
lati
onsh
ip b
etw
een
slo
pe a
nd
rate
of
stre
am f
low
.
Safe
ty P
reca
uti
on
s
Alw
ays
wea
r sa
fety
gog
gles
in t
he
lab.
Mod
elin
g St
ream
Vel
ocit
yan
d Sl
ope
PR
EP
AR
AT
ION
1.
Use
th
e h
ole
pun
ch t
o m
ake
10 t
o 15
pap
erci
rcle
s to
be
use
d as
flo
atin
g m
arke
rs.
2.
Use
th
e ill
ust
rati
on b
elow
as
a gu
ide
to s
et u
pth
e pr
otra
ctor
wit
h t
he
plu
mb
bob.
3.
Use
th
e gr
ease
pen
cil t
o m
ark
two
lines
acr
oss
the
insi
de o
fth
e gu
tter
pip
e at
a d
ista
nce
of
40 c
m a
part
.
4.
Use
th
e ri
ng
stan
d an
d cl
amp
to h
old
the
gutt
er p
ipe
at a
n a
ngl
e of
10°.
Pla
ce t
he
end
ofth
e pi
pe in
a s
ink
or b
asin
to
colle
ct t
he
disc
har
ged
flow
of
wat
er.
5.
Att
ach
a lo
ng
hos
e to
a w
ater
fau
cet
in t
he
sin
k.
6.
Kee
p th
e h
ose
in t
he
sin
k u
nti
l you
are
rea
dyto
use
it.T
hen
tu
rn o
n t
he
wat
er a
nd
adju
stth
e fl
ow u
nti
l th
e w
ater
is m
ovin
g qu
ickl
yen
ough
to
prov
ide
a st
eady
flo
w.
7.
Ben
d th
e h
ose
tem
pora
rily
to
bloc
k th
e w
ater
flow
un
til t
he
hos
e is
pos
itio
ned
at
leas
t 5
cmab
ove
the
top
line
mar
ked
on t
he
pipe
.
PR
OC
ED
UR
E
Stri
ng
Prot
ract
or
Wei
ght
90°
Geo
Lab
and
Min
iLab
Wor
kshe
ets
Cha
pter
9Ea
rth
Sci
ence
: G
eolo
gy,
the
Envi
ronm
ent,
and
the
Uni
vers
e35
Nam
eC
lass
Dat
e
Surf
ace
mat
eria
ls d
eter
min
e w
here
a
lake
can
for
m.
Mo
del
ho
w d
iffe
ren
t Ea
rth
mat
eria
ls m
ay a
llow
lake
s to
fo
rm. L
akes
fo
rmw
hen
dep
ress
ion
s o
r lo
w a
reas
fill
wit
h w
ater
.
Pro
ced
ure
C
AU
TIO
N: A
lway
s w
ear
safe
ty g
og
gle
s an
d a
n a
pro
n in
th
e la
b.
1.
Use
th
ree
clea
r, p
last
ic s
ho
e b
oxe
s. H
alf
fill
each
on
e w
ith
ear
th m
ater
ials
:cl
ay, s
and
, gra
vel.
2.
Slig
htl
y co
mp
ress
th
e m
ater
ial i
n e
ach
sh
oe
bo
x. T
hen
mak
e a
shal
low
dep
ress
ion
in e
ach
su
rfac
e.
3.
Slo
wly
po
ur
500
mL
of
wat
er in
to e
ach
of
the
dep
ress
ion
s.
An
aly
ze a
nd
Co
ncl
ud
e
1.
Des
crib
e w
hat
hap
pen
ed t
o t
he
500
mL
of
wat
er t
hat
was
ad
ded
to
eac
hsh
oe
bo
x.
The
wat
er s
ho
uld
qu
ickl
y fl
ow
th
rou
gh
th
e g
rave
l. Th
e w
ater
will
flo
w t
hro
ug
h
the
san
d le
ss q
uic
kly.
Th
e w
ater
will
rem
ain
on
th
e to
p o
f th
e cl
ay t
he
lon
ges
t.
2.
Ho
w is
th
is a
ctiv
ity
sim
ilar
to w
hat
act
ual
ly h
app
ens
on
Ear
th’s
su
rfac
ew
hen
a la
ke f
orm
s?
Wh
en w
ater
co
llect
s in
an
are
a w
her
e th
e sp
aces
bet
wee
n t
he
par
ticl
es o
f su
rfac
e
mat
eria
l are
sm
all,
the
wat
er is
mo
re li
kely
to
rem
ain
on
to
p o
f Ea
rth
’s s
urf
ace
and
form
a la
ke.
3.
Wh
at c
an y
ou
infe
r ab
ou
t th
e Ea
rth
mat
eria
ls in
wh
ich
lake
s m
ost
com
mo
nly
fo
rm?
Eart
h s
urf
ace
mat
eria
ls t
hat
lead
to
th
e fo
rmat
ion
of
lake
s d
o n
ot
allo
w w
ater
to
easi
ly p
ass
thro
ug
h t
hem
.
Min
iLab
9M
iniL
ab 9
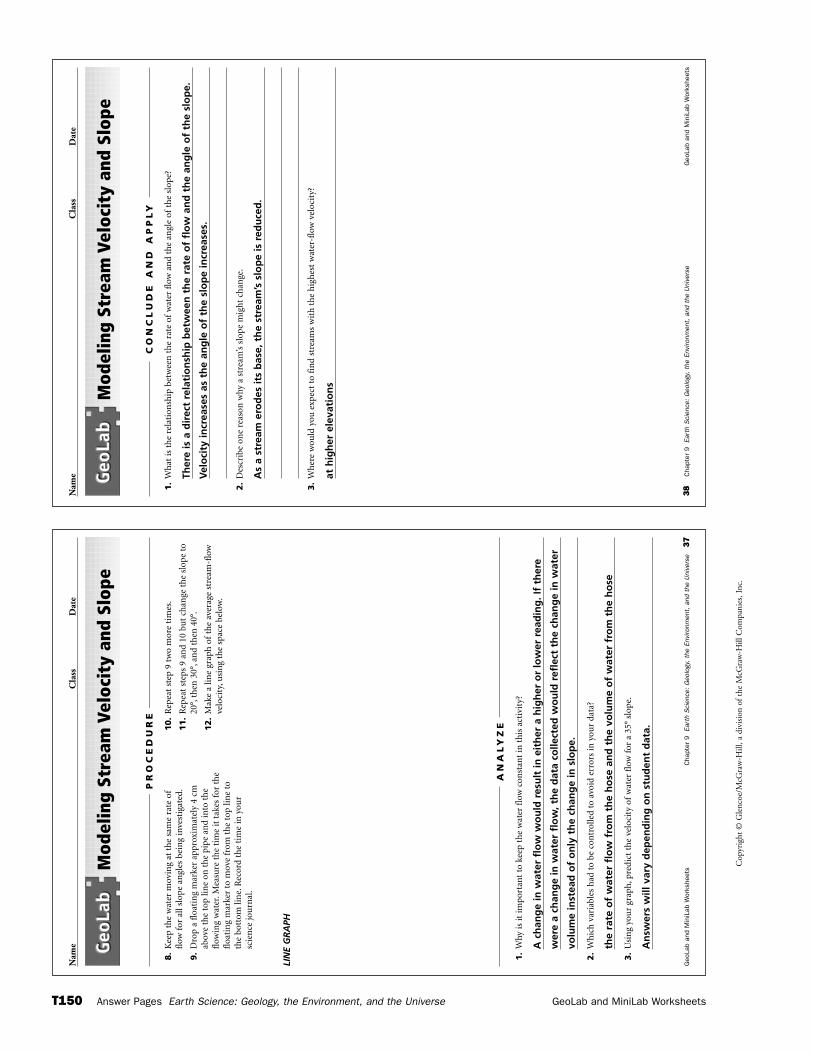
Cop
yrig
ht ©
Gle
ncoe
/McG
raw
-Hill
, a d
ivis
ion
of t
he M
cGra
w-H
ill C
ompa
nies
, Inc
.
T150 Answer Pages Earth Science: Geology, the Environment, and the Universe GeoLab and MiniLab Worksheets
Nam
eC
lass
Dat
e
38
Cha
pter
9Ea
rth
Sci
ence
: G
eolo
gy,
the
Envi
ronm
ent,
and
the
Uni
vers
eG
eoLa
b an
d M
iniL
ab W
orks
heet
s
Mod
elin
g St
ream
Vel
ocit
y an
d Sl
ope
1.
Wh
at is
th
e re
lati
onsh
ip b
etw
een
th
e ra
te o
fw
ater
flo
w a
nd
the
angl
e of
the
slop
e?
Ther
e is
a d
irec
t re
lati
on
ship
bet
wee
n t
he
rate
of
flo
w a
nd
th
e an
gle
of
the
slo
pe.
Vel
oci
ty in
crea
ses
as t
he
ang
le o
f th
e sl
op
e in
crea
ses.
2.
Des
crib
e on
e re
ason
why
a s
trea
m’s
slo
pe m
igh
t ch
ange
.
As
a st
ream
ero
des
its
bas
e, t
he
stre
am’s
slo
pe
is r
edu
ced
.
3.
Wh
ere
wou
ld y
ou e
xpec
t to
fin
d st
ream
s w
ith
th
e h
igh
est
wat
er-f
low
vel
ocit
y?
at h
igh
er e
leva
tio
ns
CO
NC
LU
DE
AN
D A
PP
LY
Nam
eC
lass
Dat
e
Geo
Lab
and
Min
iLab
Wor
kshe
ets
Cha
pter
9Ea
rth
Sci
ence
: G
eolo
gy,
the
Envi
ronm
ent,
and
the
Uni
vers
e37
Mod
elin
g St
ream
Vel
ocit
y an
d Sl
ope
1.
Why
is it
impo
rtan
t to
kee
p th
e w
ater
flo
w c
onst
ant
in t
his
act
ivit
y?
A c
han
ge
in w
ater
flo
w w
ou
ld r
esu
lt in
eit
her
a h
igh
er o
r lo
wer
rea
din
g. I
f th
ere
wer
e a
chan
ge
in w
ater
flo
w, t
he
dat
a co
llect
ed w
ou
ld r
efle
ct t
he
chan
ge
in w
ater
volu
me
inst
ead
of
on
ly t
he
chan
ge
in s
lop
e.
2.
Wh
ich
var
iabl
es h
ad t
o be
con
trol
led
to a
void
err
ors
in y
our
data
?
the
rate
of
wat
er f
low
fro
m t
he
ho
se a
nd
th
e vo
lum
e o
f w
ater
fro
m t
he
ho
se
3.
Usi
ng
you
r gr
aph
,pre
dict
th
e ve
loci
ty o
fw
ater
flo
w f
or a
35°
slop
e.
An
swer
s w
ill v
ary
dep
end
ing
on
stu
den
t d
ata.
AN
AL
YZ
E
LIN
E G
RA
PH
8.
Kee
p th
e w
ater
mov
ing
at t
he
sam
e ra
te o
ffl
ow f
or a
ll sl
ope
angl
es b
ein
g in
vest
igat
ed.
9.
Dro
p a
floa
tin
g m
arke
r ap
prox
imat
ely
4 cm
abov
e th
e to
p lin
e on
th
e pi
pe a
nd
into
th
efl
owin
g w
ater
.Mea
sure
th
e ti
me
it t
akes
for
th
efl
oati
ng
mar
ker
to m
ove
from
th
e to
p lin
e to
the
bott
om li
ne.
Rec
ord
the
tim
e in
you
rsc
ien
ce jo
urn
al.
10.
Rep
eat
step
9 t
wo
mor
e ti
mes
.
11.
Rep
eat
step
s 9
and
10 b
ut
chan
ge t
he
slop
e to
20°,
then
30°
,an
d th
en 4
0°.
12.
Mak
e a
line
grap
h o
fth
e av
erag
e st
ream
-flo
wve
loci
ty,u
sin
g th
e sp
ace
belo
w.
PR
OC
ED
UR
E
Cop
yrig
ht ©
Gle
ncoe
/McG
raw
-Hill
, a d
ivis
ion
of t
he M
cGra
w-H
ill C
ompa
nies
, Inc
.
GeoLab and MiniLab Worksheets Answer Pages Earth Science: Geology, the Environment, and the Universe T151
1.
Wh
at is
th
e sl
ope
ofth
e w
ater
tab
le a
t Ji
m’s
Gas
Sta
tion
?
at m
ost
, 1/1
00 (
10′/1
000′
)
2.
Wh
at is
th
e ap
prox
imat
e di
rect
ion
of
the
wat
er t
able
slo
pe a
t Ji
m’s
Gas
Sta
tion
?
no
rth
wes
t
3.
In w
hic
h d
irec
tion
will
th
e po
lluti
on p
lum
e m
ove?
no
rth
wes
t
4.
Wh
ich
set
tlem
ents
or
hou
ses
are
thre
aten
ed b
y th
is p
ollu
tion
plu
me?
no
ne
AN
AL
YZ
E
40
Cha
pter
10
Eart
h S
cien
ce:
Geo
logy
, th
e En
viro
nmen
t, a
nd t
he U
nive
rse
Geo
Lab
and
Min
iLab
Wor
kshe
ets
Nam
eC
lass
Dat
e
You
can
use
the
map
to
esti
mat
e th
e di
rect
ion
ofgr
ound
wat
er fl
ow a
nd t
hem
ovem
ent
ofa
pollu
tion
plu
me
from
its
sour
ce,s
uch
as a
leak
ing
unde
rgro
und
gaso
line
stor
age
tank
.
Pro
ble
mA
maj
or g
asol
ine
spill
occ
urr
ed a
t Ji
m’s
Gas
St
atio
n n
ear
Riv
ersi
de A
cres
,Flo
rida
.How
can
yo
u d
eter
min
e th
e m
ovem
ent
ofth
e re
sult
ing
pollu
tion
plu
me?
Mate
rials
USG
S to
pogr
aph
ic m
ap o
fFo
rest
Cit
y,Fl
orid
a
tran
spar
ent
pape
r
grap
h p
aper
rule
r
calc
ula
tor
Map
ping
Pol
luti
on
PR
EP
AR
AT
ION
1.
Iden
tify
th
e la
kes
and
swam
ps in
th
e so
uth
east
corn
er o
fth
is m
ap,a
nd
list
thei
r n
ames
an
del
evat
ion
s in
th
e da
ta t
able
on
th
e n
ext
page
.N
ote:
Th
e el
evat
ion
s ar
e gi
ven
or
can
be
esti
mat
ed f
rom
th
e co
nto
ur
lines
.
2.
Pla
ce t
he
tran
spar
ent
pape
r ov
er t
he
sou
thea
stpa
rt o
fth
e m
ap a
nd
trac
e th
e ap
prox
imat
eou
tlin
es o
fth
ese
lake
s or
sw
amps
,as
wel
l as
the
maj
or r
oads
.En
ter
lake
or
swam
pel
evat
ion
s on
you
r ov
erla
y,an
d in
dica
te t
he
loca
tion
of
Jim
’s G
as S
tati
on o
n F
ores
t C
ity
Rd.
,abo
ut
1400
fee
t n
orth
of
the
Sem
inol
eC
oun
ty li
ne
(at
the
96 f
oot
elev
atio
n m
ark)
.
3.
Add
con
tou
r lin
es t
o yo
ur
over
lay
usi
ng
aco
nto
ur
inte
rval
of
10 f
eet.
4.
Con
stru
ct a
cro
ss s
ecti
on o
fth
e su
rfac
eto
pogr
aphy
an
d th
e w
ater
tab
le f
rom
Lak
eLo
tus
to L
ake
Luci
en (
thro
ugh
Jim
’s G
asSt
atio
n).
PR
OC
ED
UR
E
Geo
Lab
and
Min
iLab
Wor
kshe
ets
Cha
pter
10
Eart
h S
cien
ce:
Geo
logy
, th
e En
viro
nmen
t, a
nd t
he U
nive
rse
39
Nam
eC
lass
Dat
e
How
doe
s an
art
esia
n w
ell w
ork?
Mo
del
the
chan
ges
th
at a
n a
rtes
ian
aq
uif
er u
nd
erg
oes
wh
en a
wel
l is
du
gin
to it
. Wh
at c
ause
s th
e w
ater
to
ris
e ab
ove
th
e g
rou
nd
su
rfac
e?
Pro
ced
ure
CA
UTI
ON
: Alw
ays
wea
r sa
fety
go
gg
les
and
an
ap
ron
in t
he
lab
.
1.
Hal
f fi
ll a
pla
stic
sh
oe
bo
x o
r o
ther
co
nta
iner
wit
h s
and
. Ad
d e
no
ug
hw
ater
to
sat
ura
te t
he
san
d. C
ove
r th
e sa
nd
co
mp
lete
ly w
ith
a 1
- o
r 2-
cmla
yer
of
clay
or
a si
mila
r im
per
mea
ble
mat
eria
l.
2.
Tilt
th
e b
ox
at a
n a
ng
le o
f ab
ou
t 10
°. U
se a
bo
ok
for
a p
rop
.
3.
Pun
ch t
hre
e h
ole
s th
rou
gh
th
e cl
ay, o
ne
each
nea
r th
e lo
w e
nd
, th
em
idd
le, a
nd
th
e h
igh
en
d o
f th
e b
ox.
Inse
rt a
cle
ar s
traw
th
rou
gh
eac
hh
ole
into
th
e sa
nd
bel
ow
. Sea
l th
e h
ole
s ar
ou
nd
th
e st
raw
s.
An
aly
ze a
nd
Co
ncl
ud
e
1.
Ob
serv
e th
e w
ater
leve
ls in
th
e st
raw
s. W
her
e is
th
e w
ater
leve
l th
eh
igh
est?
Th
e lo
wes
t?
hig
hes
t in
th
e lo
wes
t st
raw
, lo
wes
t in
th
e h
igh
est
stra
w
2.
Wh
ere
is t
he
wat
er t
able
in t
he
bo
x?
bel
ow
th
e si
lico
ne
pu
tty
3.
Wh
ere
is t
he
wat
er u
nd
er g
reat
est
pre
ssu
re?
Exp
lain
.
at lo
w e
nd
of
con
tain
er b
ecau
se o
f th
e h
ydro
stat
ic p
ress
ure
pro
du
ced
by
the
wei
gh
t o
f th
e w
ater
ab
ove
th
at le
vel
4.
Pred
ict
wh
at w
ill h
app
en t
o t
he
wat
er t
able
an
d t
he
surf
ace
to w
hic
h t
he
wat
er f
low
s fr
om
on
e o
f th
e st
raw
s.
Bo
th t
he
wat
er t
able
in t
he
san
d a
nd
th
e p
ress
ure
su
rfac
e w
ill b
e lo
wer
ed.
Min
iLab
10
Min
iLab
10
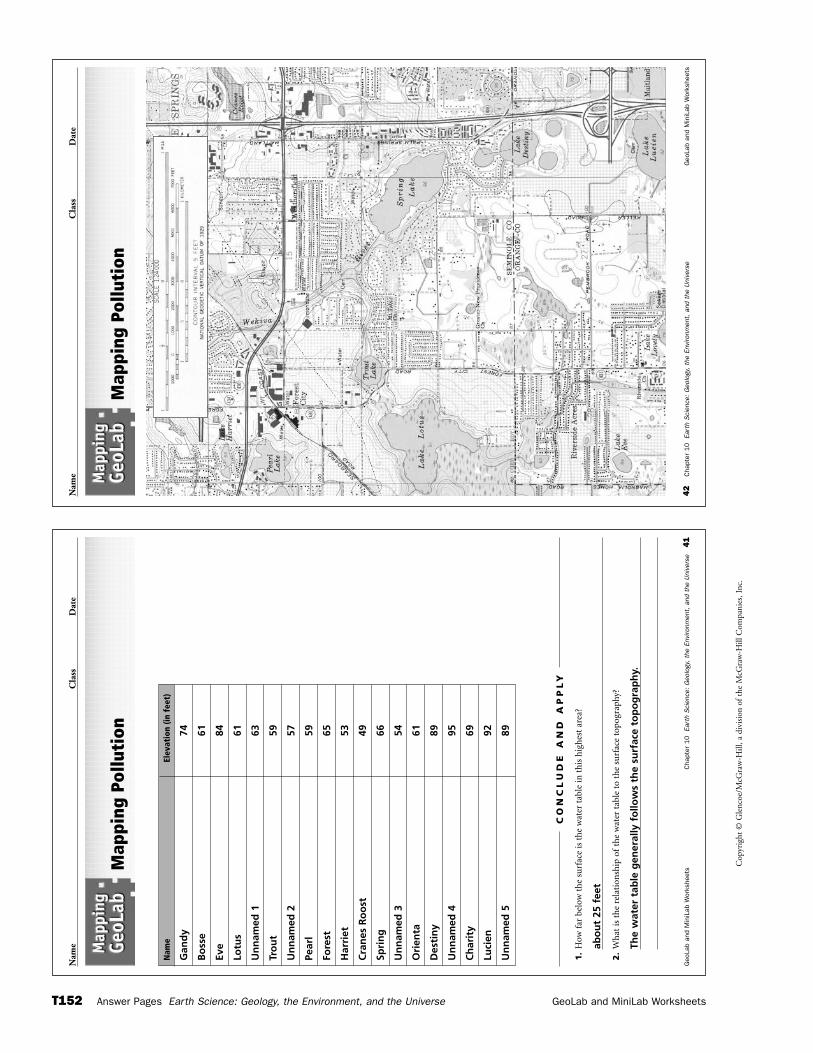
Cop
yrig
ht ©
Gle
ncoe
/McG
raw
-Hill
, a d
ivis
ion
of t
he M
cGra
w-H
ill C
ompa
nies
, Inc
.
T152 Answer Pages Earth Science: Geology, the Environment, and the Universe GeoLab and MiniLab Worksheets
Nam
eC
lass
Dat
e
42
Cha
pter
10
Eart
h S
cien
ce:
Geo
logy
, th
e En
viro
nmen
t, a
nd t
he U
nive
rse
Geo
Lab
and
Min
iLab
Wor
kshe
ets
Map
ping
Pol
luti
on
Nam
eC
lass
Dat
e
Geo
Lab
and
Min
iLab
Wor
kshe
ets
Cha
pter
10
Eart
h S
cien
ce:
Geo
logy
, th
e En
viro
nmen
t, a
nd t
he U
nive
rse
41
Map
ping
Pol
luti
on
1.
How
far
bel
ow t
he
surf
ace
is t
he
wat
er t
able
in t
his
hig
hes
t ar
ea?
abo
ut
25 f
eet
2.
Wh
at is
th
e re
lati
onsh
ip o
fth
e w
ater
tab
le t
o th
e su
rfac
e to
pogr
aphy
?
The
wat
er t
able
gen
eral
ly f
ollo
ws
the
surf
ace
top
og
rap
hy.
CO
NC
LU
DE
AN
D A
PP
LY
Nam
eEl
evat
ion
(in f
eet)
Gan
dy
74
Bo
sse
61
Eve
84
Lotu
s61
Un
nam
ed 1
63
Tro
ut
59
Un
nam
ed 2
57
Pear
l59
Fore
st65
Har
riet
53
Cra
nes
Ro
ost
49
Spri
ng
66
Un
nam
ed 3
54
Ori
enta
61
Des
tin
y89
Un
nam
ed 4
95
Ch
arit
y69
Luci
en92
Un
nam
ed 5
89
Cop
yrig
ht ©
Gle
ncoe
/McG
raw
-Hill
, a d
ivis
ion
of t
he M
cGra
w-H
ill C
ompa
nies
, Inc
.
GeoLab and MiniLab Worksheets Answer Pages Earth Science: Geology, the Environment, and the Universe T153
44
Cha
pter
11
Eart
h S
cien
ce:
Geo
logy
, th
e En
viro
nmen
t, a
nd t
he U
nive
rse
Geo
Lab
and
Min
iLab
Wor
kshe
ets
Nam
eC
lass
Dat
e
As
you
go u
p a
mou
ntai
n,bo
th t
empe
ratu
re a
nd a
ir p
ress
ure
decr
ease
.The
se e
ffect
sar
e ea
sily
exp
lain
ed.T
empe
ratu
re d
ecre
ases
as
you
get
fart
her
away
from
the
atm
osph
ere’s
hea
t so
urce
,Ear
th’s
surf
ace.
Pre
ssur
e de
crea
ses
as y
ou a
scen
d th
e m
ount
ain
beca
use
ther
e ar
e fe
wer
and
few
er p
arti
cles
ofa
ir a
bove
you
.Pre
ssur
e an
d te
mpe
ratu
re,
how
ever
,are
als
o re
late
d th
roug
h th
e ex
pans
ion
and
com
pres
sion
ofa
ir,r
egar
dles
s of
heig
ht.I
n th
is a
ctiv
ity,
you
will
dem
onst
rate
tha
t re
lati
onsh
ip.
Pro
ble
mD
emon
stra
te t
he
rela
tion
ship
bet
wee
n t
empe
ratu
rean
d pr
essu
re.
Ob
ject
ives
In t
his
Geo
Lab,
you
will
:
•M
od
el
the
tem
pera
ture
an
d pr
essu
re c
han
ges
that
tak
e pl
ace
as a
res
ult
of
the
expa
nsi
on
and
com
pres
sion
of
air.
•R
ela
teth
e ch
ange
s to
pro
cess
es in
th
e at
mos
pher
e.
Mate
rials
clea
n,c
lear
,pla
stic
2-L
bot
tle
wit
h c
ap
plas
tic
stra
ws
scis
sors
thin
,liq
uid
-cry
stal
tem
pera
ture
str
ip
tape
wat
ch o
r ti
mer
Safe
ty P
reca
uti
on
s
Alw
ays
wea
r sa
fety
gog
gles
an
d an
ap
ron
in t
he
lab.
Inte
rpre
ting
Pre
ssur
e-Te
mpe
ratu
re R
elat
ions
hips
PR
EP
AR
AT
ION
1.
Cu
t tw
o pi
eces
of
stra
w,e
ach
th
e le
ngt
h o
fth
ete
mpe
ratu
re s
trip
.Th
en c
ut
two
2-cm
pie
ces
ofst
raw
.Lay
th
e tw
o lo
ng
piec
es o
n a
tab
le.P
lace
the
two
shor
ter
piec
es w
ith
in t
he
spac
e cr
eate
dby
th
e lo
nge
r pi
eces
so
that
th
e fo
ur
piec
esfo
rm a
su
ppor
tive
str
uct
ure
for
th
ete
mpe
ratu
re s
trip
.
2.
Tape
th
e fo
ur
piec
es o
fst
raw
tog
eth
er.P
lace
the
tem
pera
ture
str
ip le
ngt
hwis
e u
pon
th
est
raw
s.Ta
pe t
he
stri
p to
th
e st
raw
s.
3.
Slid
e th
e te
mpe
ratu
re s
trip
-str
aw a
ssem
bly
into
th
e cl
ean
,dry
bot
tle.
Scre
w t
he
cap
onti
ghtl
y.
4.
Pla
ce t
he
seal
ed b
ottl
e on
th
e ta
ble
so t
hat
th
ete
mpe
ratu
re s
trip
fac
es y
ou a
nd
is e
asy
to r
ead.
Do
not
han
dle
the
bott
le a
ny m
ore
than
isn
eces
sary
so
that
th
e te
mpe
ratu
re in
side
will
not
be
affe
cted
by
the
war
mth
of
you
r h
ands
.
5.
Rec
ord
the
tem
pera
ture
of
the
air
insi
de t
he
bott
le a
s in
dica
ted
by t
he
tem
pera
ture
str
ip.
6.
Nex
t,po
siti
on t
he
bott
le s
o th
at a
bou
t h
alf
its
len
gth
ext
ends
bey
ond
the
edge
of
the
tabl
e.P
laci
ng
one
han
d on
eac
h e
nd
ofth
e bo
ttle
,pu
sh d
own
on
bot
h e
nds
so
that
th
e bo
ttle
ben
ds in
th
e m
iddl
e.H
old
the
bott
le t
his
w
ay f
or 2
min
ute
s.D
uri
ng
this
tim
e,yo
ur
part
ner
sh
ould
rec
ord
the
tem
pera
ture
eve
ry15
sec
onds
.
7.
Rel
ease
th
e pr
essu
re o
n t
he
bott
le.O
bser
vean
d re
cord
th
e te
mpe
ratu
re e
very
15
seco
nds
for
the
nex
t 2
min
ute
s.
PR
OC
ED
UR
E
Geo
Lab
and
Min
iLab
Wor
kshe
ets
Cha
pter
11
Eart
h S
cien
ce:
Geo
logy
, th
e En
viro
nmen
t, a
nd t
he U
nive
rse
43
Nam
eC
lass
Dat
e
Wha
t af
fect
s th
e fo
rmat
ion
of
clou
ds a
nd p
reci
pita
tion
?
Mo
del
the
wat
er c
ycle
.
Pro
ced
ure
1.
Pou
r ab
ou
t 12
5 m
L o
f w
arm
wat
er in
to a
cle
ar, p
last
ic b
ow
l.
2.
Loo
sely
co
ver
the
top
of
the
bo
wl w
ith
pla
stic
wra
p. O
verl
ap t
he
edg
esb
y ab
ou
t 5
cm.
3.
Fill
a se
lf-s
ealin
g p
last
ic b
ag w
ith
ice
cub
es, s
eal i
t, a
nd
pla
ce it
in t
he
cen
ter
of
the
pla
stic
wra
p o
n t
op
of
the
bo
wl.
Push
th
e b
ag o
f ic
e d
ow
nso
th
at t
he
pla
stic
wra
p s
ags
in t
he
cen
ter,
bu
t d
oes
n’t
to
uch
th
e su
rfac
eo
f th
e w
ater
.
4.
Use
tap
e to
sea
l th
e p
last
ic w
rap
aro
un
d t
he
bo
wl.
5.
Ob
serv
e th
e su
rfac
e o
f th
e p
last
ic w
rap
dir
ectl
y u
nd
er t
he
ice
cub
es e
very
15 m
inu
tes
for
on
e h
ou
r, o
r u
nti
l th
e ic
e m
elts
.
An
aly
ze a
nd
Co
ncl
ud
e
1.
Wh
at f
orm
ed o
n t
he
un
der
sid
e o
f th
e w
rap
? In
fer
wh
y th
is h
app
ened
.
Wat
er d
rop
lets
fo
rmed
as
risi
ng
, war
m a
ir c
on
den
sed
nea
r th
e ic
e.
2.
Rel
ate
you
r o
bse
rvat
ion
s to
pro
cess
es in
th
e at
mo
sph
ere.
The
risi
ng
, war
m a
ir m
od
els
evap
ora
tio
n, t
he
wat
er d
rop
lets
mo
del
co
nd
ensa
tio
n,
and
th
e fa
llin
g d
rop
lets
mo
del
pre
cip
itat
ion
.
3.
Pred
ict
wh
at w
ou
ld h
app
en if
yo
u r
epea
ted
th
is a
ctiv
ity
wit
h
ho
tter
wat
er.
Mo
re p
reci
pit
atio
n w
ou
ld h
ave
form
ed m
ore
rap
idly
. Th
e ai
r w
ou
ld h
ave
rise
n m
ore
qu
ickl
y, w
hic
h in
tu
rn w
ou
ld h
ave
cau
sed
a f
aste
r ra
te o
f co
nd
ensa
tio
n.
Min
iLab
11
Min
iLab
11
Cop
yrig
ht ©
Gle
ncoe
/McG
raw
-Hill
, a d
ivis
ion
of t
he M
cGra
w-H
ill C
ompa
nies
, Inc
.
T154 Answer Pages Earth Science: Geology, the Environment, and the Universe GeoLab and MiniLab Worksheets
Nam
eC
lass
Dat
e
Geo
Lab
and
Min
iLab
Wor
kshe
ets
Cha
pter
11
Eart
h S
cien
ce:
Geo
logy
, th
e En
viro
nmen
t, a
nd t
he U
nive
rse
45
Inte
rpre
ting
Pre
ssur
e-Te
mpe
ratu
re R
elat
ions
hips
1.
Wh
at w
as t
he
aver
age
tem
pera
ture
of
the
air
insi
de t
he
bott
le a
s yo
u a
pplie
d pr
essu
reto
th
e bo
ttle
? H
ow d
id t
his
dif
fer
from
th
e av
erag
e te
mpe
ratu
re o
fth
e bo
ttle
d ai
rw
hen
you
rel
ease
d th
e pr
essu
re o
n t
he
bott
le?
Ave
rag
e te
mp
erat
ure
s w
ill d
iffe
r. H
ow
ever
, in
all
case
s, t
emp
erat
ure
sh
ou
ld h
ave
dec
reas
ed w
hen
pre
ssu
re w
as r
elea
sed
.2.
Mak
e a
grap
h o
fth
e te
mpe
ratu
re c
han
ges
you
rec
orde
d th
rou
ghou
t th
e ex
peri
men
t,u
sin
g th
e sp
ace
belo
w.
Gra
ph
s w
ill v
ary,
bu
t al
l sh
ou
ld s
ho
w t
hat
tem
per
atu
re in
crea
sed
wh
en
pre
ssu
re w
as a
pp
lied
an
d d
ecre
ased
wh
en p
ress
ure
was
rel
ease
d.
3.
Exp
lain
how
th
ese
tem
pera
ture
ch
ange
s ar
e re
late
d to
ch
ange
s in
pre
ssu
re.
As
pre
ssu
re in
crea
ses,
th
e m
ole
cule
s th
at m
ake
up
air
are
pac
ked
mo
re t
igh
tly
tog
eth
er. T
his
cre
ates
mo
re c
olli
sio
ns
and
pro
du
ces
mo
re h
eat.
AN
AL
YZ
E
1.
Pre
dict
how
th
e ex
peri
men
t w
ould
ch
ange
ifyo
u t
ook
the
cap
off
the
bott
le.
Air
wo
uld
esc
ape
wh
en p
ress
ure
was
ap
plie
d o
n t
he
bo
ttle
. Th
ere
wo
uld
be
no
chan
ge
in p
ress
ure
an
d t
hu
s n
o c
han
ge
in t
emp
erat
ure
.
2.
Giv
en y
our
obse
rvat
ion
s an
d w
hat
you
kn
ow a
bou
t th
e be
hav
ior
ofw
arm
air
,wou
ld y
ouex
pect
th
e ai
r ov
er a
n e
quat
oria
l des
ert
at m
idda
y to
be
char
acte
rize
d by
hig
h o
r lo
w p
ress
ure
?
Low
pre
ssu
re; i
n t
he
atm
osp
her
e, t
he
ho
t d
eser
t ai
r w
ou
ld b
e le
ss d
ense
th
an t
he
air
aro
un
d it
an
d t
her
efo
re w
ou
ld r
ise.
Wh
en a
ir r
ises
, it
pu
shes
do
wn
wit
h le
ss
forc
e, w
hic
h lo
wer
s at
mo
sph
eric
pre
ssu
re.
CO
NC
LU
DE
AN
D A
PP
LY
Geo
Lab
and
Min
iLab
Wor
kshe
ets
Cha
pter
12
Eart
h S
cien
ce:
Geo
logy
, th
e En
viro
nmen
t, a
nd t
he U
nive
rse
47
Nam
eC
lass
Dat
e
How
doe
s th
e an
gle
of t
he S
un’s
ra
ys d
iffe
r?
Mo
del
the
ang
le a
t w
hic
h s
un
ligh
t re
ach
es E
arth
’s s
urf
ace.
Th
is a
ng
le g
reat
lyaf
fect
s th
e in
ten
sity
of
sola
r en
erg
y re
ceiv
ed in
an
y o
ne
pla
ce.
Pro
ced
ure
1.
Ho
ld a
fla
shlig
ht
seve
ral c
enti
met
ers
abo
ve a
pie
ce o
f p
aper
an
d p
oin
tth
e fl
ash
ligh
t st
raig
ht
do
wn
.
2.
Use
a p
enci
l to
tra
ce t
he
ou
tlin
e o
f th
e lig
ht
on
th
e p
aper
. Th
e o
utl
ine
mo
del
s h
ow
th
e Su
n’s
ray
s st
rike
th
e eq
uat
or.
3.
Kee
pin
g t
he
flas
hlig
ht
at t
he
sam
e d
ista
nce
ab
ove
th
e p
aper
, tilt
th
e to
po
f th
e fl
ash
ligh
t to
ro
ug
hly
a 3
0°an
gle
.
4.
Trac
e th
e n
ew o
utl
ine
of
the
ligh
t. T
his
is s
imila
r to
ho
w t
he
Sun
’s r
ays
are
rece
ived
at
the
po
les.
An
aly
ze a
nd
Co
ncl
ud
e
1.
Des
crib
e h
ow
th
e o
utl
ine
of
the
ligh
t d
iffe
red
bet
wee
n s
tep
1 a
nd
ste
p 3
.Ex
pla
in w
hy
it d
iffe
red
.
The
ou
tlin
e o
f th
e lig
ht
was
larg
er in
ste
p 3
. It
chan
ged
bec
ause
th
e lig
ht
cove
red
a la
rger
are
a.
2.
Ho
w d
o y
ou
th
ink
the
chan
ge
in a
rea
cove
red
by
the
ligh
t af
fect
s th
ein
ten
sity
of
ligh
t re
ceiv
ed a
t an
y o
ne
pla
ce?
The
amo
un
t o
f lig
ht
rece
ived
at
any
on
e p
lace
dec
reas
es w
hen
th
e lig
ht
cove
rs a
larg
er a
rea.
3.
The
flas
hlig
ht
mo
del
s so
lar
rad
iati
on
str
ikin
g t
he
surf
ace
of
Eart
h.
Kn
ow
ing
th
is, c
om
par
e h
ow
mu
ch h
eat
ener
gy
is a
bso
rbed
nea
r th
eeq
uat
or
and
nea
r th
e p
ole
s.
Sola
r en
erg
y is
sp
read
ove
r a
larg
e ar
ea a
t th
e p
ole
s; t
hu
s, p
ola
r re
gio
ns
rece
ive
less
so
lar
rad
iati
on
th
an d
o a
reas
nea
r th
e eq
uat
or.
Min
iLab
12
Min
iLab
12
Cop
yrig
ht ©
Gle
ncoe
/McG
raw
-Hill
, a d
ivis
ion
of t
he M
cGra
w-H
ill C
ompa
nies
, Inc
.
Chapter Assessment Answer Pages Earth Science: Geology, the Environment, and the Universe T155
1.
Wh
at is
th
e co
nto
ur
inte
rval
of
the
isob
ars?
4 m
b
2.
Wh
at a
re t
he
hig
hes
t an
d lo
wes
t is
obar
s? W
her
e ar
e th
ey lo
cate
d?
The
hig
hes
t is
ob
ar is
104
0 m
b a
nd
is a
rou
nd
th
e h
igh
-pre
ssu
re c
ente
r in
Sou
th-C
entr
al C
anad
a. T
he
low
est
iso
bar
is 9
88 m
b a
nd
is a
rou
nd
th
e
low
-pre
ssu
re c
ente
r o
ff t
he
coas
t o
f O
reg
on
.
3.
In w
hic
h d
irec
tion
are
th
e w
inds
blo
win
g ac
ross
Tex
as a
nd
Lou
isia
na?
They
are
blo
win
g m
ain
ly f
rom
th
e so
uth
or
sou
thea
st.
4.
Wh
at a
nd
wh
ere
are
the
cold
est
and
war
mes
t te
mpe
ratu
res
that
you
can
fin
d in
th
eco
nti
nen
tal U
nit
ed S
tate
s?
The
cold
est
is �
12°F
at
Farg
o, N
ort
h D
ako
ta. T
he
war
mes
t is
65°
F at
bo
th M
iam
i an
d
Key
Wes
t, F
lori
da.
AN
AL
YZ
E
48
Cha
pter
12
Eart
h S
cien
ce:
Geo
logy
, th
e En
viro
nmen
t, a
nd t
he U
nive
rse
Geo
Lab
and
Min
iLab
Wor
kshe
ets
Nam
eC
lass
Dat
e
It’s t
ime
to p
ut y
our
know
ledg
e of
met
eoro
logy
into
act
ion.
The
sur
face
wea
ther
map
on
the
follo
win
g pa
ge s
how
s ac
tual
wea
ther
dat
a fo
r th
e U
nite
d St
ates
.In
this
act
ivit
y,yo
u w
ill u
se t
he s
tati
on m
odel
s,is
obar
s,an
d pr
essu
re s
yste
ms
on t
he m
ap t
o fo
reca
st
the
wea
ther
.
Pro
ble
mH
ow c
an y
ou u
se a
su
rfac
e w
eath
er m
ap t
o in
ter-
pret
info
rmat
ion
abo
ut
curr
ent
wea
ther
an
d to
fore
cast
fu
ture
wea
ther
?
Mate
rials
pen
cil
rule
r
Inte
rpre
ting
a W
eath
er M
ap
PR
EP
AR
AT
ION
1.
Th
e m
ap s
cale
is g
iven
in n
auti
cal m
iles.
Ref
erto
th
e sc
ale
wh
en c
alcu
lati
ng
dist
ance
s.
2.
Th
e u
nit
for
isob
ars
is m
illib
ars
(mb)
.In
stat
ion
mod
els,
pres
sure
rea
din
gs a
re
abbr
evia
ted.
For
exam
ple,
1021
.9 m
b is
plo
tted
on a
sta
tion
mod
el a
s 21
9 bu
t re
ad a
s 10
21.9
.
3.
Win
d sh
afts
poi
nt
in t
he
dire
ctio
n f
rom
wh
ich
the
win
d is
blo
win
g.
PR
OC
ED
UR
E
Nam
eC
lass
Dat
e
Geo
Lab
and
Min
iLab
Wor
kshe
ets
Cha
pter
12
Eart
h S
cien
ce:
Geo
logy
, th
e En
viro
nmen
t, a
nd t
he U
nive
rse
49
Inte
rpre
ting
a W
eath
er M
ap
1.
Wou
ld y
ou e
xpec
t th
e w
eath
er in
Geo
rgia
an
d Fl
orid
a to
be
clea
r or
rai
ny?
Why
?
It w
ou
ld p
rob
ably
be
clea
r b
ecau
se t
he
hig
h-p
ress
ure
sys
tem
alo
ng
th
e co
ast
wo
uld
cau
se a
ir t
o s
ink
and
dry
ou
t.
2.
Bot
h o
fth
e lo
w-p
ress
ure
sys
tem
s in
eas
tern
Can
ada
and
off
the
Ore
gon
coa
st a
rem
ovin
g to
war
d th
e ea
st a
t ab
out
15 m
ph.W
hat
kin
d of
wea
ther
wou
ld y
ou p
redi
ct f
orO
rego
n a
nd
for
nor
ther
n N
ew Y
ork
for
the
nex
t fe
w h
ours
? E
xpla
in.
The
low
-pre
ssu
re s
yste
ms
wo
uld
cau
se a
ir t
o r
ise
and
pro
du
ce c
lou
ds
and
rai
n.
CO
NC
LU
DE
AN
D A
PP
LY
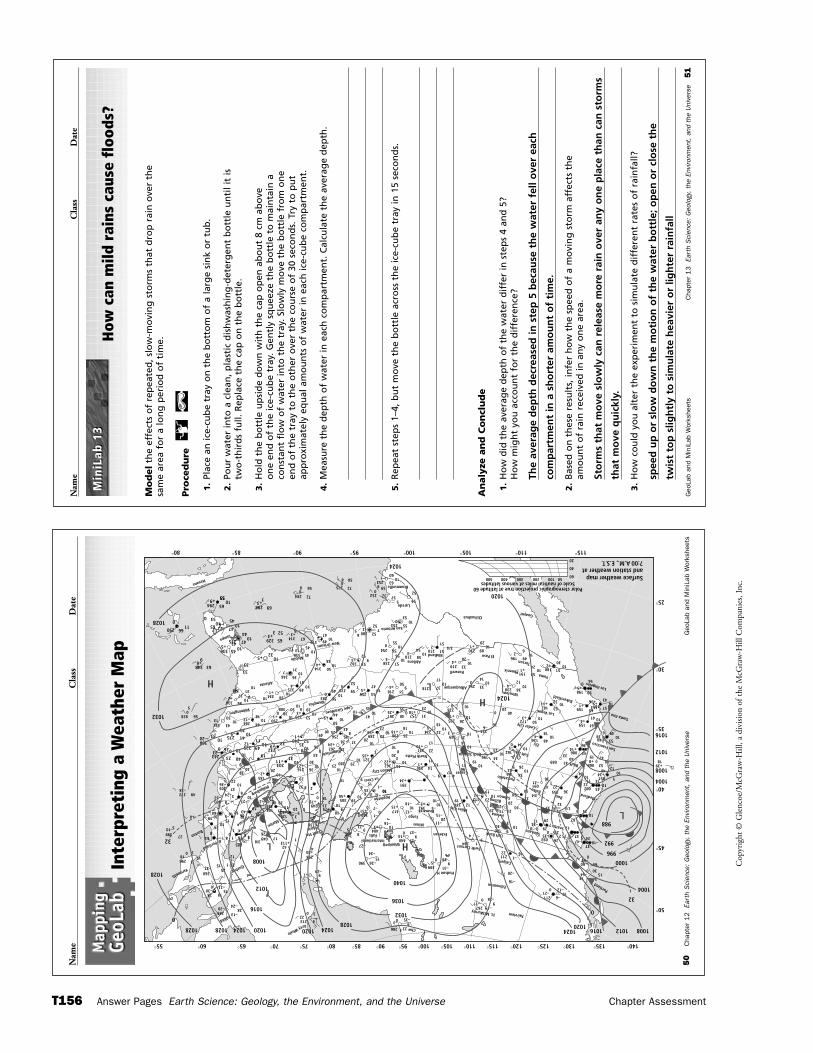
Geo
Lab
and
Min
iLab
Wor
kshe
ets
Cha
pter
13
Eart
h S
cien
ce:
Geo
logy
, th
e En
viro
nmen
t, a
nd t
he U
nive
rse
51
Nam
eC
lass
Dat
e
How
can
mild
rai
ns c
ause
flo
ods?
Mo
del
the
effe
cts
of
rep
eate
d, s
low
-mo
vin
g s
torm
s th
at d
rop
rai
n o
ver
the
sam
e ar
ea f
or
a lo
ng
per
iod
of
tim
e.
Pro
ced
ure
1.
Plac
e an
ice-
cub
e tr
ay o
n t
he
bo
tto
m o
f a
larg
e si
nk
or
tub
.
2.
Pou
r w
ater
into
a c
lean
, pla
stic
dis
hw
ash
ing
-det
erg
ent
bo
ttle
un
til i
t is
tw
o-t
hir
ds
full.
Rep
lace
th
e ca
p o
n t
he
bo
ttle
.
3.
Ho
ld t
he
bo
ttle
up
sid
e d
ow
n w
ith
th
e ca
p o
pen
ab
ou
t 8
cm a
bo
veo
ne
end
of
the
ice-
cub
e tr
ay. G
entl
y sq
uee
ze t
he
bo
ttle
to
mai
nta
in a
con
stan
t fl
ow
of
wat
er in
to t
he
tray
. Slo
wly
mo
ve t
he
bo
ttle
fro
m o
ne
end
of
the
tray
to
th
e o
ther
ove
r th
e co
urs
e o
f 30
sec
on
ds.
Try
to
pu
tap
pro
xim
atel
y eq
ual
am
ou
nts
of
wat
er in
eac
h ic
e-cu
be
com
par
tmen
t.
4.
Mea
sure
th
e d
epth
of
wat
er in
eac
h c
om
par
tmen
t. C
alcu
late
th
e av
erag
e d
epth
.
5.
Rep
eat
step
s 1–
4, b
ut
mo
ve t
he
bo
ttle
acr
oss
th
e ic
e-cu
be
tray
in 1
5se
con
ds.
An
aly
ze a
nd
Co
ncl
ud
e
1.
Ho
w d
id t
he
aver
age
dep
th o
f th
e w
ater
dif
fer
in s
tep
s 4
and
5?
Ho
w m
igh
t yo
u a
cco
un
t fo
r th
e d
iffe
ren
ce?
The
aver
age
dep
th d
ecre
ased
in s
tep
5 b
ecau
se t
he
wat
er f
ell o
ver
each
com
par
tmen
t in
a s
ho
rter
am
ou
nt
of
tim
e.
2.
Bas
ed o
n t
hes
e re
sult
s, in
fer
ho
w t
he
spee
d o
f a
mo
vin
g s
torm
aff
ects
th
eam
ou
nt
of
rain
rec
eive
d in
an
y o
ne
area
.
Sto
rms
that
mo
ve s
low
ly c
an r
elea
se m
ore
rai
n o
ver
any
on
e p
lace
th
an c
an s
torm
s
that
mo
ve q
uic
kly.
3.
Ho
w c
ou
ld y
ou
alt
er t
he
exp
erim
ent
to s
imu
late
dif
fere
nt
rate
s o
f ra
infa
ll?
spee
d u
p o
r sl
ow
do
wn
th
e m
oti
on
of
the
wat
er b
ott
le; o
pen
or
clo
se t
he
twis
t to
p s
ligh
tly
to s
imu
late
hea
vier
or
ligh
ter
rain
fall
Min
iLab
13
Min
iLab
13
Cop
yrig
ht ©
Gle
ncoe
/McG
raw
-Hill
, a d
ivis
ion
of t
he M
cGra
w-H
ill C
ompa
nies
, Inc
.
T156 Answer Pages Earth Science: Geology, the Environment, and the Universe Chapter Assessment
Nam
eC
lass
Dat
e
50
Cha
pter
12
Eart
h S
cien
ce:
Geo
logy
, th
e En
viro
nmen
t, a
nd t
he U
nive
rse
Geo
Lab
and
Min
iLab
Wor
kshe
ets
Inte
rpre
ting
a W
eath
er M
apFt. McMurray
Havana
Fairview
PortlandEdmonton
Calgary
Left Bank
Burr Medford
Bluff
Salt lake San Francisco
Santa Ana
Los Angeles
Bakersfield
Yuma
Tucson
Phoenix
Winslow
El Paso
GuayntChihuahua
Laredo
Brownsville
Boise
Portatello
Rock SpringsNorth Platte
Cape Girardeau
Bloomfield
Memphis
Atlanta
Wilmington
Mason City
Salmon
Cedar City
Ely
Las Vegas
Helena
Spokane
Miles City
Billing
–19
–16
–6
315
30
18–64
–6460
–1034
37–47
37
82
45002
089
086
4838
67
5310
6110
10
41
159
15910
32
53182
1050
+340
172–6213
26
020
+11
198 59
56
52
1060
63
5957
5
252
5880
72275
284
69298
55 75510
10
65294
00
1166290
+9 +372
5680
32
59253
80
511801053
+1191
1012
38230–4
4910
6–2196
8910
29
+224 1030
0+5
65163+9
10+36
+143
57
+4
1048
18–4126
1034
16223
196
22311
11
174
+1330 14
391
362321+35
1029280
1023
35262+34
256+2510
49
7
16+22
1036
1019
–910
305+56
18
0 356
+245 9
10
+1017
102227410
1810
10
10
820
3
23
289
102031
+5626298
+1830
518
26295+1
2283125740
1047
1050
+544
10
438
4528
45
519
50+421810
47
53
251+180
3510
23+25
10
10
3310
14
3310
219
28
230+13/4
51
5121010
54–3
58
1053
550253
752
52
52
52+4279
1049
056283
3910
0+3
50
38
4932510
33410+1
10
50314+4
105327010
48290
0+1
1018
–1343
10 30
13335
33368–20
56
63
45336+5
+4
47
45
22–665
1053
1047
348+69
8280
5
0
10
38308
256
759 +5
953282
10
1045
1033
+5
10
1086338
34837
+2
313
33
32
3110
36246
–4
7
81
45
67314+3
653291044
43335+3
3 52 5
3303
47
4810
49319
+3
280825
21810
57
56
238–3
254 5610
550 –2
+4
2563710
17
2183
0
0
10
101625
10249
3 +
19
9611
1034
–50
49
+14366
33
22 105
10
131110
1240
1047
43
068+8
051
52
19
+2434
4140
10356
1/432
36055–27
–21
1034
26–22166
5
091
3/432
3047
36
33
12
5
600
0
211–21
–1210
0
–1
–20
267
1024
9–28
–11
–31–26
15–34
83869
–27
–235
390
–29
258+804
1
42+113
173/8
4
085
188
1
10
4
12
15125
15
157
888
88 04926
+7 9
399
284 1
2111622
093–35
29
290
00–3412
7
26
5 25752
910
2910
24
20
1019
2321210–129
12274
–1120
–15
–510–10
392–12417
10+9404
–1361
6
–110
1510
–1
+7523249
+79
236
3120
15+3037
2900365
29+2
18–43
10
10
8
83–2437
185+2
27
06
10
10
15–52010
–60
203–52
49272–38 205
0 22
1039
9
10
–12
1020
41275–9
284 44
20225
2324333
–36
40
26 0
1010
1108
520
218
36216+27
31
1020
203+11 10 30
430
361035
240+1
52
11823210
11
49 +9
19
33
10
0
0
28
29
115 37
9
+31–70
0
+3–16
+15–18
10+2
19–201710
4
–24
3
180–30
9–74
–5
–29
–370
440+14 9
09
39
0
Churchill 22286Grey Whale
Island
QuebecYarmouth
Boston
Syracuse
9–35
–3421322
–13–20
151828
260
29618
27 63
240
+8
399–10 5
0 3
3
–37
–300 –21
–2428
289 0 3
0
Hudson H
InternationalFalls
La Cross
Appleton
Winnipeg
Sault Ste.
Marie
Marion
Philipsburg
Estevan
Bismarck
Swift Current
Minas
Fargo
Casper
Albuquerque
Roswell
Midland
San Antonio
Mobile
TampaNew Orleans
Abilene
+3918
1028
1032
10241020
0
1016 1012 1008
1024
1016
1012
1008
1004
1004
32
1000
996
992
988
1020
1036
1040
1008
1032
1028
102410201020
1016
1028
32
1012
102410281028
0
95° 100° 105° 110° 115° 120° 125° 130° 135° 140°90°85°75°70°65°60°55°
80° 85° 90° 95° 100° 105° 110° 115°
25°
30°
40°
45°
50°
80°
35°
Seattle
Portland
Burlington
5060
40
20
100Scale of nautical miles at various latitudes
Polar stereographic projection true at latitude 60
Surface weather mapand station weather at7:00 A.M., E.S.T.
200300400500
H
H
H L
L
L
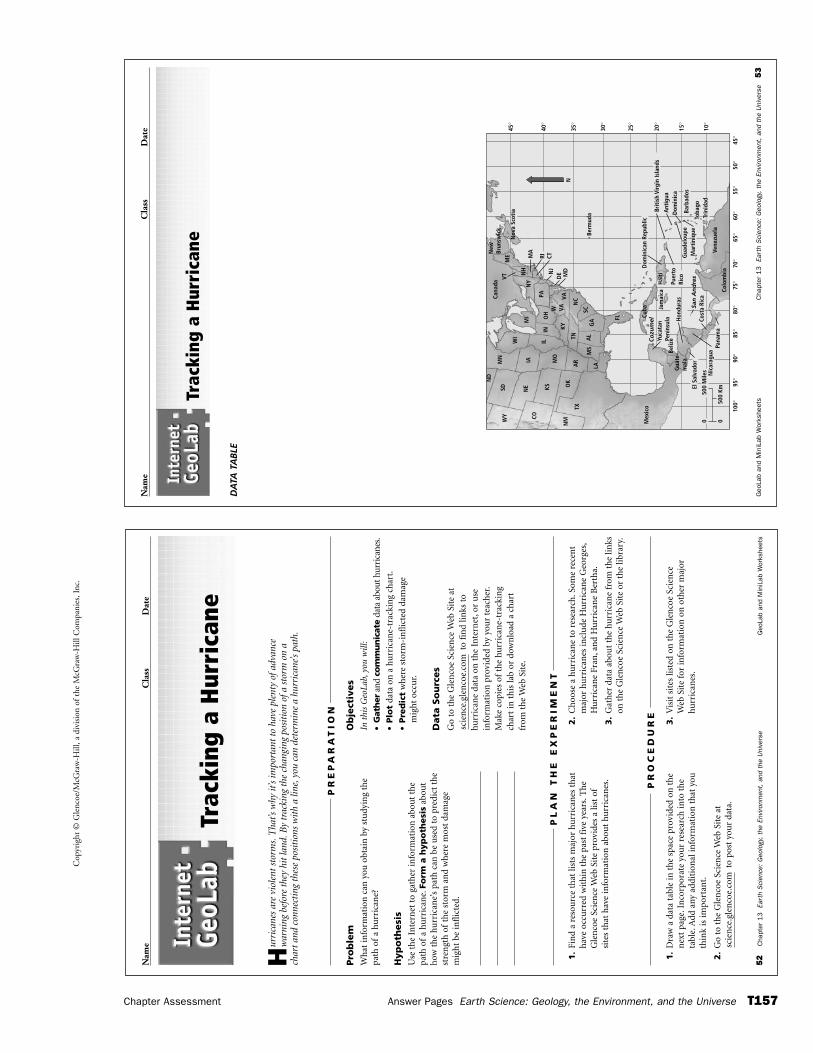
Cop
yrig
ht ©
Gle
ncoe
/McG
raw
-Hill
, a d
ivis
ion
of t
he M
cGra
w-H
ill C
ompa
nies
, Inc
.
Chapter Assessment Answer Pages Earth Science: Geology, the Environment, and the Universe T157
52
Cha
pter
13
Eart
h S
cien
ce:
Geo
logy
, th
e En
viro
nmen
t, a
nd t
he U
nive
rse
Geo
Lab
and
Min
iLab
Wor
kshe
ets
Nam
eC
lass
Dat
e
Hur
rica
nes
are
viol
ent
stor
ms.
Tha
t’s w
hy it
’s im
port
ant
to h
ave
plen
ty o
fadv
ance
war
ning
bef
ore
they
hit
land
.By
trac
king
the
cha
ngin
g po
siti
on o
fa s
torm
on
ach
art
and
conn
ecti
ng t
hese
pos
itio
ns w
ith
a lin
e,yo
u ca
n de
term
ine
a hu
rric
ane’s
pat
h.
Pro
ble
mW
hat
info
rmat
ion
can
you
obt
ain
by
stu
dyin
g th
epa
th o
fa
hurr
ican
e?
Hyp
oth
esi
sU
se t
he
Inte
rnet
to
gath
er in
form
atio
n a
bou
t th
epa
th o
fa
hurr
ican
e.Fo
rm a
hyp
oth
esi
sab
out
how
th
e hu
rric
ane’
s pa
th c
an b
e u
sed
to p
redi
ct t
he
stre
ngt
h o
fth
e st
orm
an
d w
her
e m
ost
dam
age
mig
ht
be in
flic
ted.
Ob
ject
ives
In t
his
Geo
Lab,
you
will
:
•G
ath
eran
d co
mm
un
icat
eda
ta a
bout
hur
rica
nes.
•Plo
tda
ta o
n a
hu
rric
ane-
trac
kin
g ch
art.
•Pre
dic
tw
her
e st
orm
-in
flic
ted
dam
age
mig
ht
occu
r.
Data
So
urc
es
Go
to t
he
Gle
nco
e Sc
ien
ce W
eb S
ite
at
to f
ind
links
to
hurr
ican
e da
ta o
n t
he
Inte
rnet
,or
use
in
form
atio
n p
rovi
ded
by y
our
teac
her
.M
ake
copi
es o
fth
e hu
rric
ane-
trac
kin
g ch
art
in t
his
lab
or d
own
load
a c
har
t fr
om t
he
Web
Sit
e.
scie
nce
.gle
nco
e.co
m
Trac
king
a H
urri
cane
PR
EP
AR
AT
ION
1.
Dra
w a
dat
a ta
ble
in t
he
spac
e pr
ovid
ed o
n t
he
nex
t pa
ge.I
nco
rpor
ate
you
r re
sear
ch in
to t
he
tabl
e.A
dd a
ny a
ddit
ion
al in
form
atio
n t
hat
you
thin
k is
impo
rtan
t.
2.
Go
to t
he
Gle
nco
e Sc
ien
ce W
eb S
ite
atto
pos
t yo
ur
data
.
3.
Vis
it s
ites
list
ed o
n t
he
Gle
nco
e Sc
ien
ceW
ebSi
te f
or in
form
atio
n o
n o
ther
maj
orhu
rric
anes
.
scie
nce
.gle
nco
e.co
m
PR
OC
ED
UR
E
PL
AN
TH
E E
XP
ER
IME
NT
1.
Fin
d a
reso
urc
e th
at li
sts
maj
or h
urr
ican
es t
hat
hav
e oc
curr
ed w
ith
in t
he
past
fiv
e ye
ars.
Th
eG
len
coe
Scie
nce
Web
Sit
e pr
ovid
es a
list
of
site
s th
at h
ave
info
rmat
ion
abo
ut
hurr
ican
es.
2.
Ch
oose
a h
urr
ican
e to
res
earc
h.S
ome
rece
nt
maj
or h
urr
ican
es in
clu
de H
urr
ican
e G
eorg
es,
Hu
rric
ane
Fran
,an
d H
urr
ican
e B
erth
a.
3.
Gat
her
dat
a ab
out
the
hurr
ican
e fr
om t
he
links
on t
he
Gle
nco
e Sc
ien
ce W
eb S
ite
or t
he
libra
ry.
Nam
eC
lass
Dat
e
Geo
Lab
and
Min
iLab
Wor
kshe
ets
Cha
pter
13
Eart
h S
cien
ce:
Geo
logy
, th
e En
viro
nmen
t, a
nd t
he U
nive
rse
53
Trac
king
a H
urri
cane
DA
TA T
AB
LE
500
Km0
500
Mile
s
45°
40°
35°
30°
25°
20°
15°
10°
60°
65°
70°
75°
80°
85°
90°
95°
100°
Berm
uda
Cana
da
Nov
a Sc
otia
ME
NH
MA
NY
PAO
H
VT
New
Brun
swic
k
0
NKY
W VAVA
NC
SCG
AA
L
FL
Co
zum
el
Beliz
e
WY CO
NM
TX
Mex
ico
Yuca
tan
Peni
nsul
a
Gua
te-
mal
a
Nic
arag
ua
Hon
dura
s
Cost
a Ri
ca
Pana
ma
Colo
mbi
a
Vene
zuel
a
Cuba
Hai
ti
Puer
toRi
co
Brit
ish
Virg
in Is
land
s
Barb
ados
Dom
inic
a
Toba
goTr
inid
ad
Ant
igua
Gua
delo
upe
Mar
tini
que
Dom
inic
an R
epub
lic
Jam
aica
San
An
dre
s
OK
AR
ND
SD NE KS
LAM
S
MN
WI
IA MO
ILIN
MI
RI
El S
alva
dor
55°
50°
45°
CTN
JD
E MD
TN
Geo
Lab
and
Min
iLab
Wor
kshe
ets
Cha
pter
14
Eart
h S
cien
ce:
Geo
logy
, th
e En
viro
nmen
t, a
nd t
he U
nive
rse
55
Nam
eC
lass
Dat
e
How
doe
s th
e at
mos
pher
e af
fect
th
e tr
ansf
er o
f en
ergy
?
Mo
del
the
gre
enh
ou
se e
ffec
t.
Pro
ced
ure
1.
On
a c
lear
day
, pla
ce a
car
db
oar
d b
ox
ou
tsid
e in
a s
had
ed a
rea.
Pro
p t
wo
th
erm
om
eter
sag
ain
st t
he
bo
x. M
ake
sure
th
e th
erm
om
eter
s ar
e n
ot
in d
irec
t su
n.
2.
Co
ver
on
e th
erm
om
eter
wit
h a
cle
an g
lass
jar.
3.
Ob
serv
e an
d r
eco
rd t
he
tem
per
atu
re c
han
ges
of
each
th
erm
om
eter
eve
ry 2
min
ute
s o
ver
a 30
-min
ute
per
iod
.
An
aly
ze a
nd
Co
ncl
ud
e
1.
Mak
e a
gra
ph
sh
ow
ing
ho
w t
he
tem
per
atu
res
of
the
two
th
erm
om
eter
s ch
ang
ed o
ver
tim
e, u
sin
g t
he
spac
e b
elo
w.
Gra
ph
s w
ill v
ary
dep
end
ing
on
stu
den
t m
easu
rem
ents
.
2.
Bas
ed o
n y
ou
r g
rap
h, w
hic
h t
her
mo
met
er e
xper
ien
ced
th
e g
reat
est
incr
ease
in
tem
per
atu
re?
Wh
y?
The
ther
mo
met
er in
th
e ja
r sh
ou
ld s
ho
w h
igh
er r
ead
ing
s th
an d
oes
th
e u
nco
vere
d
ther
mo
met
er. T
he
air
was
tra
pp
ed in
sid
e th
e ja
r.
3.
Rel
ate
you
r o
bse
rvat
ion
s to
th
e g
reen
ho
use
eff
ect
in t
he
atm
osp
her
e.
In t
he
atm
osp
her
e, g
reen
ho
use
gas
es a
bso
rb a
nd
tra
p s
ola
r ra
dia
tio
n, m
uch
like
the
gla
ss ja
r ab
sorb
ed a
nd
tra
pp
ed e
ner
gy
fro
m t
he
Sun
.
Min
iLab
14
Min
iLab
14
Cop
yrig
ht ©
Gle
ncoe
/McG
raw
-Hill
, a d
ivis
ion
of t
he M
cGra
w-H
ill C
ompa
nies
, Inc
.
T158 Answer Pages Earth Science: Geology, the Environment, and the Universe Chapter Assessment
Nam
eC
lass
Dat
e
54
Cha
pter
13
Eart
h S
cien
ce:
Geo
logy
, th
e En
viro
nmen
t, a
nd t
he U
nive
rse
Geo
Lab
and
Min
iLab
Wor
kshe
ets
Trac
king
a H
urri
cane
Sh
ari
ng
Yo
ur
Data
Fin
d th
is I
nter
net
Geo
Lab
on t
he
Gle
nco
e Sc
ien
ce W
eb S
ite
atPo
st y
our
data
in t
he
tabl
e pr
ovid
ed f
or t
his
act
ivit
y.U
se t
he
addi
tion
alda
ta f
rom
oth
er s
tude
nts
to
com
plet
e yo
ur
char
t an
d an
swer
th
e C
oncl
ude
an
d A
pply
qu
esti
ons.
1.
Plo
t th
e po
siti
on,a
ir p
ress
ure
,win
d sp
eed,
and
stag
e of
the
hurr
ican
e at
six
-hou
rin
terv
als
thro
ugh
out
its
exis
ten
ce.
2.
Plo
t th
e ch
angi
ng
posi
tion
of
the
hurr
ican
e on
you
r hu
rric
ane-
trac
kin
g ch
art.
3.
Wh
at w
as t
he
max
imu
m w
ind
spee
d in
kn
ots
that
th
e hu
rric
ane
reac
hed
?
An
swer
s w
ill v
ary
dep
end
ing
on
wh
ich
hu
rric
ane
stu
den
ts r
esea
rch
ed.
4.
Mu
ltip
ly t
he
valu
e fr
om q
ues
tion
3 b
y 1.
15 t
o fi
nd
the
win
d sp
eed
in m
iles
per
hou
r.B
ased
on
th
is v
alu
e,h
ow w
ould
th
e hu
rric
ane
be c
lass
ifie
d on
th
e Sa
ffir
-Sim
pson
sca
le?
An
swer
s w
ill v
ary
dep
end
ing
on
wh
ich
hu
rric
ane
stu
den
ts r
esea
rch
ed.
5.
Usi
ng
you
r co
mpl
eted
hu
rric
ane-
trac
kin
g ch
art,
list
the
lan
dmas
ses
over
wh
ich
th
e hu
rric
ane
pass
ed.
An
swer
s w
ill v
ary
dep
end
ing
on
wh
ich
hu
rric
ane
stu
den
ts r
esea
rch
ed.
6.
Wh
ere
wou
ld y
ou e
xpec
t th
e st
orm
su
rge
to h
ave
been
gre
ates
t? E
xpla
in.C
ompa
re y
our
answ
er
to t
he
info
rmat
ion
you
gat
her
ed o
n t
he
dam
age
infl
icte
d by
th
e st
orm
.Was
you
r an
swer
cor
rect
?
The
sto
rm s
urg
e w
ou
ld b
e st
ron
ges
t o
n t
he
sid
e o
f th
e st
orm
wh
ere
on
sho
re
win
ds
dev
elo
ped
as
the
sto
rm c
ente
r m
ove
d in
lan
d.
7.
How
was
th
e hu
rric
ane’
s st
ren
gth
aff
ecte
d w
hen
its
cen
ter
pass
ed o
ver
lan
d?
Win
d s
pee
ds
dec
reas
e ra
pid
ly w
hen
a s
torm
cen
ter
mo
ves
inla
nd
bec
ause
the
sto
rm b
eco
mes
cu
t o
ff f
rom
its
ener
gy
sou
rce
and
wea
ken
s.
scie
nce
.gle
nco
e.co
m.
CO
NC
LU
DE
AN
D A
PP
LY
Cop
yrig
ht ©
Gle
ncoe
/McG
raw
-Hill
, a d
ivis
ion
of t
he M
cGra
w-H
ill C
ompa
nies
, Inc
.
Chapter Assessment Answer Pages Earth Science: Geology, the Environment, and the Universe T159
56
Cha
pter
14
Eart
h S
cien
ce:
Geo
logy
, th
e En
viro
nmen
t, a
nd t
he U
nive
rse
Geo
Lab
and
Min
iLab
Wor
kshe
ets
Nam
eC
lass
Dat
e
Mic
rocl
imat
es c
an b
e ca
used
by
tall
build
ings
,lar
ge b
odie
s of
wat
er,a
nd m
ount
ains
,am
ong
othe
r th
ings
.In
this
act
ivit
y,yo
u’ll
obse
rve
diffe
rent
mic
rocl
imat
es a
nd t
hen
atte
mpt
to
dete
rmin
e w
hich
fact
ors
stre
ngth
en m
icro
clim
ates
and
how
the
se fa
ctor
sch
ange
wit
h di
stan
ce fr
om E
arth
’s su
rfac
e.
Pro
ble
mW
hic
h t
ype
ofsu
rfac
e cr
eate
s th
e m
ost
pron
oun
ced
mic
rocl
imat
e?
Po
ssib
le M
ate
rials
ther
mom
eter
psyc
hro
met
er
pape
r st
rip
or w
ind
sock
met
erst
ick
rela
tive
hu
mid
ity
char
t (A
ppen
dix
F)
Hyp
oth
esi
sH
ypot
hes
ize
how
dif
fere
nt
area
s of
Ear
th’s
su
rfac
e,su
ch a
s gr
assy
law
ns,
asph
alt
park
ing
lots
,an
d bo
d-ie
s of
wat
er,a
ffec
t lo
cal c
limat
es.C
onsi
der
also
wh
eth
er d
ista
nce
fro
m t
he
grou
nd
mig
ht
affe
ctte
mpe
ratu
re,r
elat
ive
hum
idit
y,an
d w
ind
spee
d.
Ob
ject
ives
In t
his
Geo
Lab,
you
will
:
•D
esi
gn
and
carr
y o
ut
an e
xper
imen
t to
stu
dym
icro
clim
ates
bot
h a
t E
arth
’s s
urf
ace
and
abov
eit
s su
rfac
e.
•O
bse
rve
and
reco
rdte
mpe
ratu
re,r
elat
ive
hum
idit
y,an
d w
ind
spee
d.
•In
fer
how
dif
fere
nt
surf
aces
an
d ch
ange
s in
hei
ght
abov
e th
ese
surf
aces
aff
ect
mic
rocl
imat
es.
Safe
ty P
reca
uti
on
s
Be
care
ful w
hen
you
han
dle
glas
s th
erm
omet
ers,
espe
cial
ly t
hose
tha
t co
nta
in m
ercu
ry.I
fth
e th
er-
mom
eter
bre
aks,
do n
ot t
ouch
it.H
ave
you
r te
ache
rpr
oper
ly d
ispo
se o
fth
e gl
ass
and
the
mer
cury
.
Mic
rocl
imat
es
PR
EP
AR
AT
ION
1.
As
a gr
oup,
wri
te o
ut y
our
hypo
thes
is.L
ist t
hest
eps
need
ed to
test
you
r hy
poth
esis
.Inc
lude
inyo
ur p
lan
how
you
will
use
you
r eq
uipm
ent t
om
easu
re te
mpe
ratu
re,r
elat
ive
hum
idit
y,an
dw
ind
spee
d at
diff
eren
t sur
face
s an
d at
var
ious
heig
hts
abov
e th
ese
surf
aces
.
2.
Sele
ct y
our
site
s.Po
ssib
le s
ites
incl
ude
a g
rass
ypl
aygr
oun
d ar
ea,a
pav
ed p
arki
ng
lot,
and
asw
imm
ing
pool
.
3.
Be
sure
to
con
trol
var
iabl
es.F
or in
stan
ce,
diff
eren
t m
embe
rs o
fyo
ur
grou
p sh
ould
mak
eob
serv
atio
ns
at e
ach
sit
e at
th
e sa
me
tim
eof
day.
You’
ll al
so n
eed
to r
ecor
d w
eath
erva
riab
les
at s
ever
al d
iffe
ren
t di
stan
ces
abov
eea
ch s
urf
ace.
Poss
ible
dis
tan
ces
incl
ude
5 c
m,
1m
,an
d 2
m.
4.
Mak
e a
map
of
you
r te
st s
ites
.Des
ign
an
dco
nst
ruct
dat
a ta
bles
for
rec
ordi
ng
you
rob
serv
atio
ns.
You’
ll n
eed
sepa
rate
dat
a ta
bles
for
each
sit
e.D
raw
you
r m
ap a
nd
data
tab
les
in t
he
spac
e on
th
e n
ext
page
.
PR
OC
ED
UR
E
Nam
eC
lass
Dat
e
Geo
Lab
and
Min
iLab
Wor
kshe
ets
Cha
pter
14
Eart
h S
cien
ce:
Geo
logy
, th
e En
viro
nmen
t, a
nd t
he U
nive
rse
57
Mic
rocl
imat
es
MA
PS, G
RA
PHS,
AN
D D
ATA
TAB
LE
5.
Rea
d ov
er y
our
enti
re p
lan
to
mak
e ce
rtai
n a
llst
eps
are
in lo
gica
l ord
er.I
den
tify
con
stan
tsan
d va
riab
les
in y
our
plan
.
6.
Mak
e su
re y
our
teac
her
app
rove
s yo
ur
plan
befo
re y
ou p
roce
ed w
ith
you
r ex
peri
men
t.
7.
Car
ry o
ut
you
r pl
an.
PR
OC
ED
UR
E
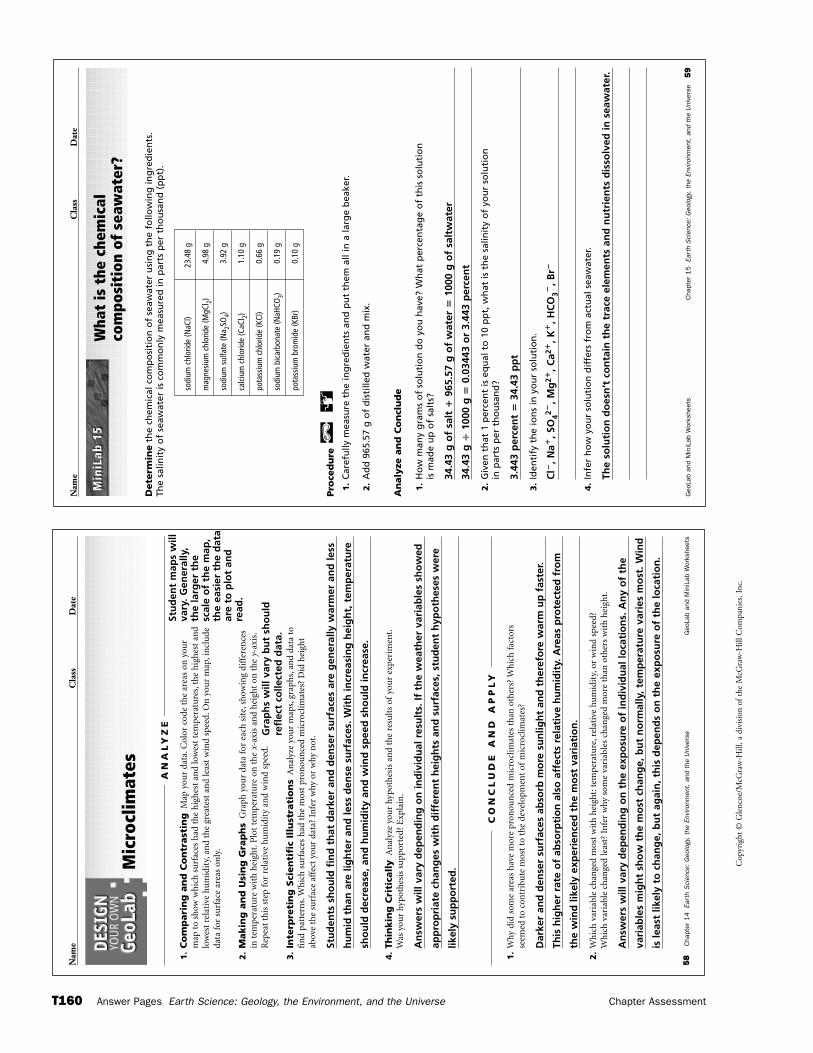
Geo
Lab
and
Min
iLab
Wor
kshe
ets
Cha
pter
15
Eart
h S
cien
ce:
Geo
logy
, th
e En
viro
nmen
t, a
nd t
he U
nive
rse
59
Nam
eC
lass
Dat
e
Wha
t is
the
che
mic
al
com
posi
tion
of
seaw
ater
?
Dete
rmin
eth
e ch
emic
al c
om
po
siti
on
of
seaw
ater
usi
ng
th
e fo
llow
ing
ing
red
ien
ts.
The
salin
ity
of
seaw
ater
is c
om
mo
nly
mea
sure
d in
par
ts p
er t
ho
usa
nd
(p
pt)
.
Pro
ced
ure
1.
Car
efu
lly m
easu
re t
he
ing
red
ien
ts a
nd
pu
t th
em a
ll in
a la
rge
bea
ker.
2.
Ad
d 9
65.5
7 g
of
dis
tille
d w
ater
an
d m
ix.
An
aly
ze a
nd
Co
ncl
ud
e
1.
Ho
w m
any
gra
ms
of
solu
tio
n d
o y
ou
hav
e? W
hat
per
cen
tag
e o
f th
is s
olu
tio
n
is m
ade
up
of
salt
s?
34.4
3 g
of
salt
�96
5.57
g o
f w
ater
�10
00 g
of
salt
wat
er
34.4
3 g
�10
00 g
�0.
0344
3 o
r 3.
443
per
cen
t
2.
Giv
en t
hat
1 p
erce
nt
is e
qu
al t
o 1
0 p
pt,
wh
at is
th
e sa
linit
y o
f yo
ur
solu
tio
n
in p
arts
per
th
ou
san
d?
3.44
3 p
erce
nt
�34
.43
pp
t
3.
Iden
tify
th
e io
ns
in y
ou
r so
luti
on
.
Cl�
, Na�
, SO
42�, M
g2�
, Ca2
�, K
�, H
CO
3�, B
r�
4.
Infe
r h
ow
yo
ur
solu
tio
n d
iffe
rs f
rom
act
ual
sea
wat
er.
The
solu
tio
n d
oes
n’t
co
nta
in t
he
trac
e el
emen
ts a
nd
nu
trie
nts
dis
solv
ed in
sea
wat
er.
Min
iLab
15
Min
iLab
15
sodi
um c
hlor
ide
(NaC
l)23
.48
g
mag
nesi
um c
hlor
ide
(MgC
l 2)4.
98 g
sodi
um s
ulfa
te (N
a 2SO
4)3.
92 g
calc
ium
chl
orid
e (C
aCl 2)
1.10
g
pota
ssiu
m c
hlor
ide
(KCl
)0.
66 g
sodi
um b
icar
bona
te (N
aHCO
3)0.
19 g
pota
ssiu
m b
rom
ide
(KBr
)0.
10 g
Cop
yrig
ht ©
Gle
ncoe
/McG
raw
-Hill
, a d
ivis
ion
of t
he M
cGra
w-H
ill C
ompa
nies
, Inc
.
T160 Answer Pages Earth Science: Geology, the Environment, and the Universe Chapter Assessment
Nam
eC
lass
Dat
e
58
Cha
pter
14
Eart
h S
cien
ce:
Geo
logy
, th
e En
viro
nmen
t, a
nd t
he U
nive
rse
Geo
Lab
and
Min
iLab
Wor
kshe
ets
Mic
rocl
imat
es
1.
Co
mp
ari
ng
an
d C
on
trast
ing
Map
you
r da
ta.C
olor
cod
e th
e ar
eas
on y
our
map
to
show
wh
ich
su
rfac
es h
ad t
he
hig
hes
t an
d lo
wes
t te
mpe
ratu
res,
the
hig
hes
t an
dlo
wes
t re
lati
ve h
um
idit
y,an
d th
e gr
eate
st a
nd
leas
t w
ind
spee
d.O
n y
our
map
,in
clu
deda
ta f
or s
urf
ace
area
s on
ly.
2.
Makin
g a
nd
Usi
ng
Gra
ph
sG
raph
you
r da
ta f
or e
ach
sit
e,sh
owin
g di
ffer
ence
sin
tem
pera
ture
wit
h h
eigh
t.P
lot
tem
pera
ture
on
th
e x-
axis
an
d h
eigh
t on
th
e y-
axis
.R
epea
t th
is s
tep
for
rela
tive
hu
mid
ity
and
win
d sp
eed.
3.
Inte
rpre
tin
g S
cien
tifi
c Il
lust
rati
on
sA
nal
yze
you
r m
aps,
grap
hs,
and
data
to
fin
d pa
tter
ns.
Wh
ich
su
rfac
es h
ad t
he
mos
t pr
onou
nce
d m
icro
clim
ates
? D
id h
eigh
tab
ove
the
surf
ace
affe
ct y
our
data
? In
fer
why
or
why
not
.
Stu
den
ts s
ho
uld
fin
d t
hat
dar
ker
and
den
ser
surf
aces
are
gen
eral
ly w
arm
er a
nd
less
hu
mid
th
an a
re li
gh
ter
and
less
den
se s
urf
aces
. Wit
h in
crea
sin
g h
eig
ht,
tem
per
atu
re
sho
uld
dec
reas
e, a
nd
hu
mid
ity
and
win
d s
pee
d s
ho
uld
incr
ease
.
4.
Thin
kin
g C
riti
call
yA
nal
yze
you
r hy
poth
esis
an
d th
e re
sult
s of
you
r ex
peri
men
t.W
as y
our
hypo
thes
is s
upp
orte
d? E
xpla
in.
An
swer
s w
ill v
ary
dep
end
ing
on
ind
ivid
ual
res
ult
s. If
th
e w
eath
er v
aria
ble
s sh
ow
ed
app
rop
riat
e ch
ang
es w
ith
dif
fere
nt
hei
gh
ts a
nd
su
rfac
es, s
tud
ent
hyp
oth
eses
wer
e
likel
y su
pp
ort
ed.
AN
AL
YZ
E
1.
Why
did
som
e ar
eas
hav
e m
ore
pron
oun
ced
mic
rocl
imat
es t
han
oth
ers?
Wh
ich
fac
tors
seem
ed t
o co
ntr
ibu
te m
ost
to t
he
deve
lopm
ent
ofm
icro
clim
ates
?
Dar
ker
and
den
ser
surf
aces
ab
sorb
mo
re s
un
ligh
t an
d t
her
efo
re w
arm
up
fas
ter.
This
hig
her
rat
e o
f ab
sorp
tio
n a
lso
aff
ects
rel
ativ
e h
um
idit
y. A
reas
pro
tect
ed f
rom
the
win
d li
kely
exp
erie
nce
d t
he
mo
st v
aria
tio
n.
2.
Wh
ich
var
iabl
e ch
ange
d m
ost
wit
h h
eigh
t:te
mpe
ratu
re,r
elat
ive
hum
idit
y,or
win
d sp
eed?
W
hic
h v
aria
ble
chan
ged
leas
t? I
nfe
r w
hy s
ome
vari
able
s ch
ange
d m
ore
than
oth
ers
wit
h h
eigh
t.
An
swer
s w
ill v
ary
dep
end
ing
on
th
e ex
po
sure
of
ind
ivid
ual
loca
tio
ns.
An
y o
f th
e
vari
able
s m
igh
t sh
ow
th
e m
ost
ch
ang
e, b
ut
no
rmal
ly, t
emp
erat
ure
var
ies
mo
st. W
ind
is le
ast
likel
y to
ch
ang
e, b
ut
agai
n, t
his
dep
end
s o
n t
he
exp
osu
re o
f th
e lo
cati
on
.
CO
NC
LU
DE
AN
D A
PP
LY
Stu
den
t m
aps
will
vary
. Gen
eral
ly,
the
larg
er t
he
scal
e o
f th
e m
ap,
the
easi
er t
he
dat
aar
e to
plo
t an
dre
ad.
Gra
ph
s w
ill v
ary
bu
t sh
ou
ldre
flec
t co
llect
ed d
ata.
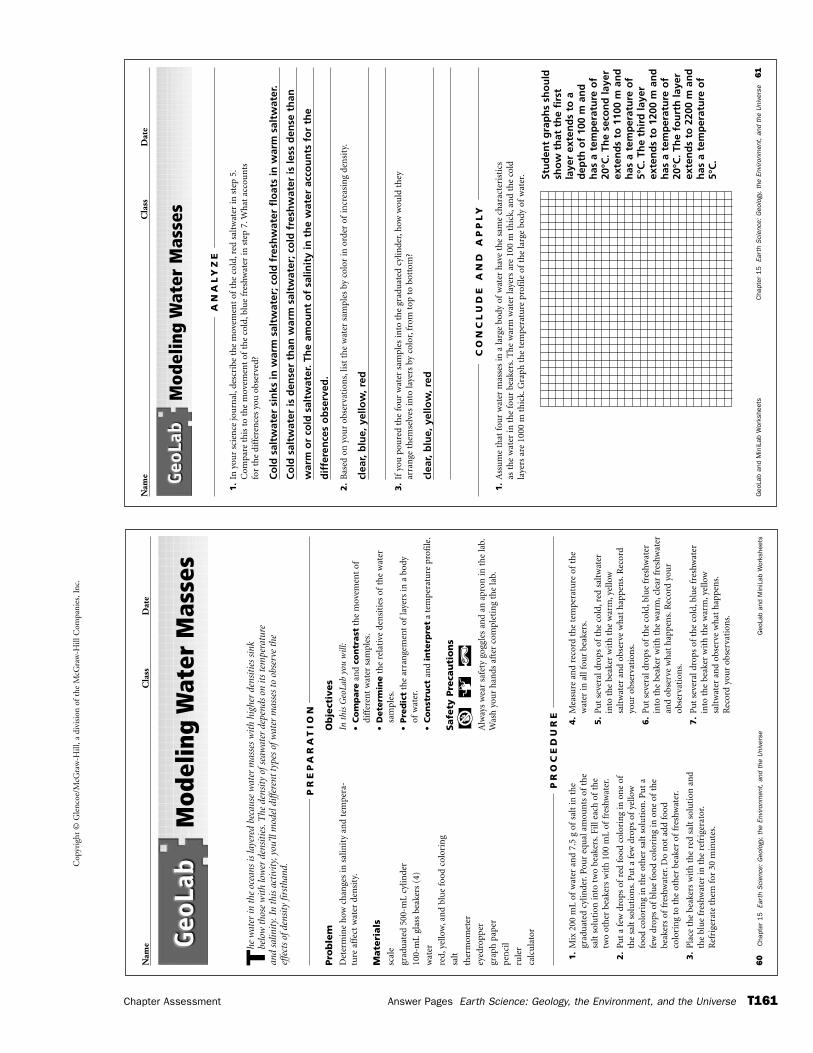
Cop
yrig
ht ©
Gle
ncoe
/McG
raw
-Hill
, a d
ivis
ion
of t
he M
cGra
w-H
ill C
ompa
nies
, Inc
.
Chapter Assessment Answer Pages Earth Science: Geology, the Environment, and the Universe T161
60
Cha
pter
15
Eart
h S
cien
ce:
Geo
logy
, th
e En
viro
nmen
t, a
nd t
he U
nive
rse
Geo
Lab
and
Min
iLab
Wor
kshe
ets
Nam
eC
lass
Dat
e
The
wat
er in
the
oce
ans
is la
yere
d be
caus
e w
ater
mas
ses
wit
h hi
gher
den
siti
es s
ink
belo
w t
hose
wit
h lo
wer
den
siti
es.T
he d
ensi
ty o
fsea
wat
er d
epen
ds o
n it
s te
mpe
ratu
rean
d sa
linit
y.In
thi
s ac
tivi
ty,y
ou’ll
mod
el d
iffer
ent
type
s of
wat
er m
asse
s to
obs
erve
the
effe
cts
ofde
nsit
y fir
stha
nd.
Pro
ble
mD
eter
min
e h
ow c
han
ges
in s
alin
ity
and
tem
pera
-tu
re a
ffec
t w
ater
den
sity
.
Mate
rials
scal
e
grad
uat
ed 5
00-m
L cy
linde
r
100-
mL
glas
s be
aker
s (4
)
wat
er
red,
yello
w,a
nd
blu
e fo
od c
olor
ing
salt
ther
mom
eter
eyed
ropp
er
grap
h p
aper
pen
cil
rule
r
calc
ula
tor
Ob
ject
ives
In t
his
Geo
Lab
you
will
:
•C
om
pare
and
con
trast
the
mov
emen
t of
diff
eren
t w
ater
sam
ples
.
•D
ete
rmin
eth
e re
lati
ve d
ensi
ties
of
the
wat
ersa
mpl
es.
•Pre
dic
tth
e ar
ran
gem
ent
ofla
yers
in a
bod
y of
wat
er.
•C
on
stru
ct a
nd
inte
rpre
ta
tem
pera
ture
pro
file
.
Safe
ty P
reca
uti
on
s
Alw
ays
wea
r sa
fety
gog
gles
an
d an
apr
on in
th
e la
b.W
ash
you
r h
ands
aft
er c
ompl
etin
g th
e la
b.
Mod
elin
g W
ater
Mas
ses
PR
EP
AR
AT
ION
1.
Mix
200
mL
ofw
ater
an
d 7.
5 g
ofsa
lt in
th
egr
adu
ated
cyl
inde
r.Po
ur
equ
al a
mou
nts
of
the
salt
sol
uti
on in
to t
wo
beak
ers.
Fill
each
of
the
two
oth
er b
eake
rs w
ith
100
mL
offr
eshw
ater
.
2.
Pu
t a
few
dro
ps o
fre
d fo
od c
olor
ing
in o
ne
ofth
e sa
lt s
olu
tion
s.P
ut
a fe
w d
rops
of
yello
wfo
od c
olor
ing
in t
he
oth
er s
alt
solu
tion
.Pu
t a
few
dro
ps o
fbl
ue
food
col
orin
g in
on
e of
the
beak
ers
offr
eshw
ater
.Do
not
add
foo
dco
lori
ng
to t
he
oth
er b
eake
r of
fres
hwat
er.
3.
Pla
ce t
he
beak
ers
wit
h t
he
red
salt
sol
uti
on a
nd
the
blu
e fr
eshw
ater
in t
he
refr
iger
ator
.R
efri
gera
te t
hem
for
30
min
ute
s.
4.
Mea
sure
an
d re
cord
th
e te
mpe
ratu
re o
fth
ew
ater
in a
ll fo
ur
beak
ers.
5.
Pu
t se
vera
l dro
ps o
fth
e co
ld,r
ed s
altw
ater
in
to t
he
beak
er w
ith
th
e w
arm
,yel
low
salt
wat
er a
nd
obse
rve
wh
at h
appe
ns.
Rec
ord
you
r ob
serv
atio
ns.
6.
Pu
t se
vera
l dro
ps o
fth
e co
ld,b
lue
fres
hwat
erin
to t
he
beak
er w
ith
th
e w
arm
,cle
ar f
resh
wat
eran
d ob
serv
e w
hat
hap
pen
s.R
ecor
d yo
ur
obse
rvat
ion
s.
7.
Pu
t se
vera
l dro
ps o
fth
e co
ld,b
lue
fres
hwat
erin
to t
he
beak
er w
ith
th
e w
arm
,yel
low
salt
wat
er a
nd
obse
rve
wh
at h
appe
ns.
Rec
ord
you
r ob
serv
atio
ns.
PR
OC
ED
UR
E
Nam
eC
lass
Dat
e
Geo
Lab
and
Min
iLab
Wor
kshe
ets
Cha
pter
15
Eart
h S
cien
ce:
Geo
logy
, th
e En
viro
nmen
t, a
nd t
he U
nive
rse
61
Mod
elin
g W
ater
Mas
ses
1.
In y
our
scie
nce
jou
rnal
,des
crib
e th
e m
ovem
ent
ofth
e co
ld,r
ed s
altw
ater
in s
tep
5.C
ompa
re t
his
to
the
mov
emen
t of
the
cold
,blu
e fr
eshw
ater
in s
tep
7.W
hat
acc
oun
tsfo
r th
e di
ffer
ence
s yo
u o
bser
ved?
Co
ld s
altw
ater
sin
ks in
war
m s
altw
ater
; co
ld f
resh
wat
er f
loat
s in
war
m s
altw
ater
.
Co
ld s
altw
ater
is d
ense
r th
an w
arm
sal
twat
er; c
old
fre
shw
ater
is le
ss d
ense
th
an
war
m o
r co
ld s
altw
ater
. Th
e am
ou
nt
of
salin
ity
in t
he
wat
er a
cco
un
ts f
or
the
dif
fere
nce
s o
bse
rved
.
2.
Bas
ed o
n y
our
obse
rvat
ion
s,lis
t th
e w
ater
sam
ples
by
colo
r in
ord
er o
fin
crea
sin
g de
nsi
ty.
clea
r, b
lue,
yel
low
, red
3.
Ifyo
u p
oure
d th
e fo
ur
wat
er s
ampl
es in
to t
he
grad
uat
ed c
ylin
der,
how
wou
ld t
hey
arra
nge
th
emse
lves
into
laye
rs b
y co
lor,
from
top
to
bott
om?
clea
r, b
lue,
yel
low
, red
AN
AL
YZ
E
1.
Ass
um
e th
at f
our
wat
er m
asse
s in
a la
rge
body
of
wat
er h
ave
the
sam
e ch
arac
teri
stic
sas
th
e w
ater
in t
he
fou
r be
aker
s.T
he
war
m w
ater
laye
rs a
re 1
00 m
th
ick,
and
the
cold
laye
rs a
re 1
000
m t
hic
k.G
raph
th
e te
mpe
ratu
re p
rofi
le o
fth
e la
rge
body
of
wat
er.
CO
NC
LU
DE
AN
D A
PP
LY
Stu
den
t g
rap
hs
sho
uld
sho
w t
hat
th
e fi
rst
laye
r ex
ten
ds
to a
dep
th o
f 10
0 m
an
dh
as a
tem
per
atu
re o
f20
°C. T
he
seco
nd
laye
rex
ten
ds
to 1
100
m a
nd
has
a t
emp
erat
ure
of
5°C
. Th
e th
ird
laye
rex
ten
ds
to 1
200
m a
nd
has
a t
emp
erat
ure
of
20°C
. Th
e fo
urt
h la
yer
exte
nd
s to
220
0 m
an
dh
as a
tem
per
atu
re o
f5°
C.
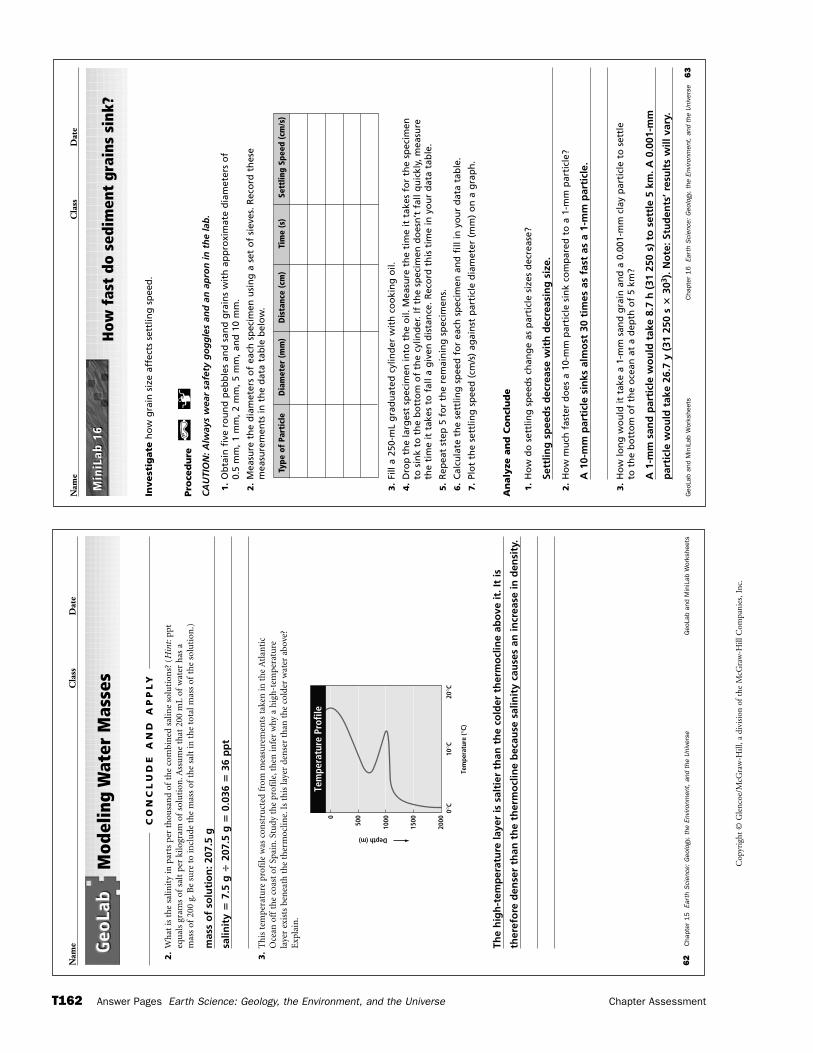
Geo
Lab
and
Min
iLab
Wor
kshe
ets
Cha
pter
16
Eart
h S
cien
ce:
Geo
logy
, th
e En
viro
nmen
t, a
nd t
he U
nive
rse
63
Nam
eC
lass
Dat
e
How
fas
t do
sed
imen
t gr
ains
sin
k?
Invest
igate
ho
w g
rain
siz
e af
fect
s se
ttlin
g s
pee
d.
Pro
ced
ure
CA
UTI
ON
: Alw
ays
wea
r sa
fety
go
gg
les
and
an
ap
ron
in t
he
lab
.
1.
Ob
tain
fiv
e ro
un
d p
ebb
les
and
san
d g
rain
s w
ith
ap
pro
xim
ate
dia
met
ers
of
0.5
mm
, 1 m
m, 2
mm
, 5 m
m, a
nd
10
mm
.
2.
Mea
sure
th
e d
iam
eter
s o
f ea
ch s
pec
imen
usi
ng
a s
et o
f si
eves
. Rec
ord
th
ese
mea
sure
men
ts in
th
e d
ata
tab
le b
elo
w.
3.
Fill
a 25
0-m
L g
rad
uat
ed c
ylin
der
wit
h c
oo
kin
g o
il.
4.
Dro
p t
he
larg
est
spec
imen
into
th
e o
il. M
easu
re t
he
tim
e it
tak
es f
or
the
spec
imen
to
sin
k to
th
e b
ott
om
of
the
cylin
der
. If
the
spec
imen
do
esn
’t f
all q
uic
kly,
mea
sure
th
e ti
me
it t
akes
to
fal
l a g
iven
dis
tan
ce. R
eco
rd t
his
tim
e in
yo
ur
dat
a ta
ble
.
5.
Rep
eat
step
5 f
or
the
rem
ain
ing
sp
ecim
ens.
6.
Cal
cula
te t
he
sett
ling
sp
eed
fo
r ea
ch s
pec
imen
an
d f
ill in
yo
ur
dat
a ta
ble
.
7.
Plo
t th
e se
ttlin
g s
pee
d (
cm/s
) ag
ain
st p
arti
cle
dia
met
er (
mm
) o
n a
gra
ph
.
An
aly
ze a
nd
Co
ncl
ud
e
1.
Ho
w d
o s
ettl
ing
sp
eed
s ch
ang
e as
par
ticl
e si
zes
dec
reas
e?
Sett
ling
sp
eed
s d
ecre
ase
wit
h d
ecre
asin
g s
ize.
2.
Ho
w m
uch
fas
ter
do
es a
10-
mm
par
ticl
e si
nk
com
par
ed t
o a
1-m
m p
arti
cle?
A 1
0-m
m p
arti
cle
sin
ks a
lmo
st 3
0 ti
mes
as
fast
as
a 1-
mm
par
ticl
e.
3.
Ho
w lo
ng
wo
uld
it t
ake
a 1-
mm
san
d g
rain
an
d a
0.0
01-m
m c
lay
par
ticl
e to
set
tle
to t
he
bo
tto
m o
f th
e o
cean
at
a d
epth
of
5 km
?
A 1
-mm
san
d p
arti
cle
wo
uld
tak
e 8.
7 h
(31
250
s)
to s
ettl
e 5
km. A
0.0
01-m
m
par
ticl
e w
ou
ld t
ake
26.7
y (
31 2
50 s
�30
3 ). N
ote
: Stu
den
ts’ r
esu
lts
will
var
y.
Min
iLab
16
Min
iLab
16
Type
of
Part
icle
Dia
met
er (
mm
)D
ista
nce
(cm
)Ti
me
(s)
Sett
ling
Spee
d (c
m/s
)
Cop
yrig
ht ©
Gle
ncoe
/McG
raw
-Hill
, a d
ivis
ion
of t
he M
cGra
w-H
ill C
ompa
nies
, Inc
.
T162 Answer Pages Earth Science: Geology, the Environment, and the Universe Chapter Assessment
Nam
eC
lass
Dat
e
62
Cha
pter
15
Eart
h S
cien
ce:
Geo
logy
, th
e En
viro
nmen
t, a
nd t
he U
nive
rse
Geo
Lab
and
Min
iLab
Wor
kshe
ets
Mod
elin
g W
ater
Mas
ses
CO
NC
LU
DE
AN
D A
PP
LY
2.
Wh
at is
th
e sa
linit
y in
par
ts p
er t
hou
san
d of
the
com
bin
ed s
alin
e so
luti
ons?
(H
int:
ppt
equ
als
gram
s of
salt
per
kilo
gram
of
solu
tion
.Ass
um
e th
at 2
00 m
L of
wat
er h
as a
mas
s of
200
g.B
e su
re t
o in
clu
de t
he
mas
s of
the
salt
in t
he
tota
l mas
s of
the
solu
tion
.)
mas
s o
f so
luti
on
: 207
.5 g
salin
ity
�7.
5 g
�20
7.5
g �
0.03
6 �
36 p
pt
3.
Th
is t
empe
ratu
re p
rofi
le w
as c
onst
ruct
ed f
rom
mea
sure
men
ts t
aken
in t
he
Atl
anti
cO
cean
off
the
coas
t of
Spai
n.S
tudy
th
e pr
ofile
,th
en in
fer
why
a h
igh
-tem
pera
ture
laye
r ex
ists
ben
eath
th
e th
erm
oclin
e.Is
th
is la
yer
den
ser
than
th
e co
lder
wat
er a
bove
?E
xpla
in.
The
hig
h-t
emp
erat
ure
laye
r is
sal
tier
th
an t
he
cold
er t
her
mo
clin
e ab
ove
it. I
t is
ther
efo
re d
ense
r th
an t
he
ther
mo
clin
e b
ecau
se s
alin
ity
cau
ses
an in
crea
se in
den
sity
.
1000
2000
150050
0
Tem
pera
ture
Pro
file
Depth (m)
Tem
pera
ture
(°C)
0
0°C
10°C
20°C
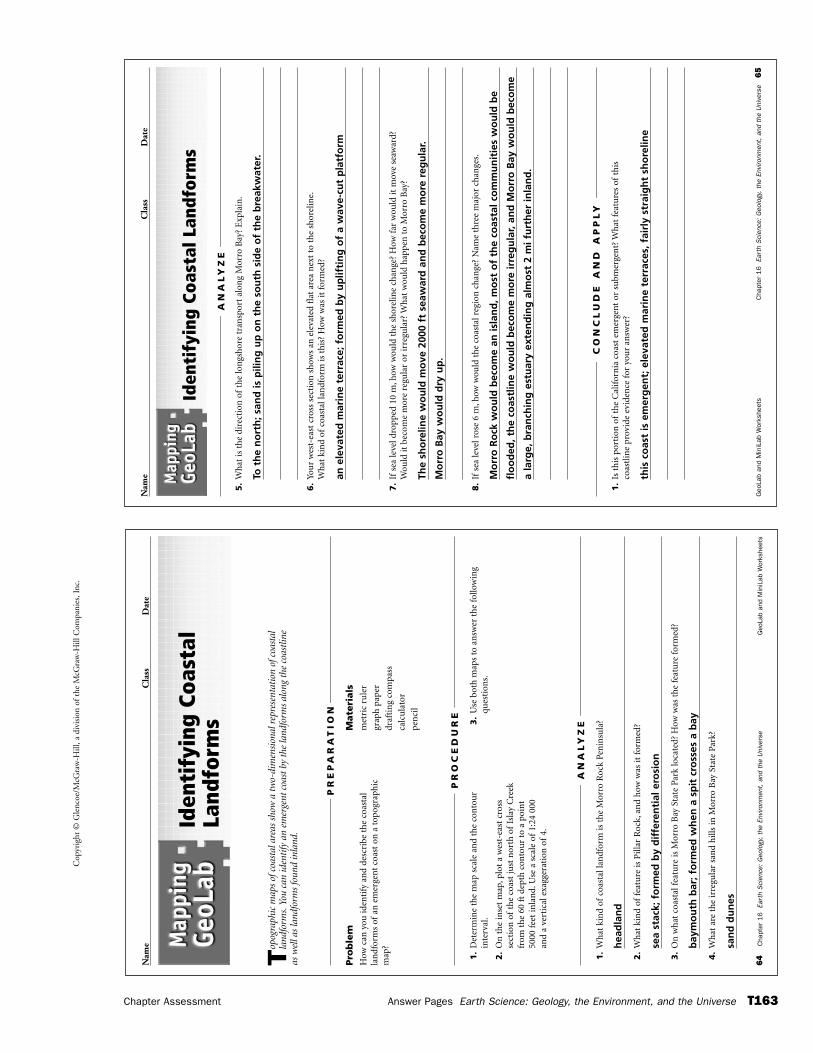
Cop
yrig
ht ©
Gle
ncoe
/McG
raw
-Hill
, a d
ivis
ion
of t
he M
cGra
w-H
ill C
ompa
nies
, Inc
.
Chapter Assessment Answer Pages Earth Science: Geology, the Environment, and the Universe T163
1.
Wh
at k
ind
ofco
asta
l lan
dfor
m is
th
e M
orro
Roc
k Pe
nin
sula
?
hea
dla
nd
2.
Wh
at k
ind
offe
atu
re is
Pill
ar R
ock,
and
how
was
it f
orm
ed?
sea
stac
k; f
orm
ed b
y d
iffe
ren
tial
ero
sio
n
3.
On
wh
at c
oast
al f
eatu
re is
Mor
ro B
ay S
tate
Par
k lo
cate
d? H
ow w
as t
he
feat
ure
for
med
?
bay
mo
uth
bar
; fo
rmed
wh
en a
sp
it c
ross
es a
bay
4.
Wh
at a
re t
he
irre
gula
r sa
nd
hill
s in
Mor
ro B
ay S
tate
Par
k?
san
d d
un
es
AN
AL
YZ
E
64
Cha
pter
16
Eart
h S
cien
ce:
Geo
logy
, th
e En
viro
nmen
t, a
nd t
he U
nive
rse
Geo
Lab
and
Min
iLab
Wor
kshe
ets
Nam
eC
lass
Dat
e
Top
ogra
phic
map
s of
coas
tal a
reas
sho
w a
tw
o-di
men
sion
al r
epre
sent
atio
n of
coas
tal
land
form
s.Yo
u ca
n id
enti
fy a
n em
erge
nt c
oast
by
the
land
form
s al
ong
the
coas
tline
as w
ell a
s la
ndfo
rms
foun
d in
land
.
Pro
ble
mH
ow c
an y
ou id
enti
fy a
nd
desc
ribe
th
e co
asta
lla
ndf
orm
s of
an e
mer
gen
t co
ast
on a
top
ogra
phic
map
?
Mate
rials
met
ric
rule
r
grap
h p
aper
draf
tin
g co
mpa
ss
calc
ula
tor
pen
cil
Iden
tify
ing
Coas
tal
Land
form
s
PR
EP
AR
AT
ION
1.
Det
erm
ine
the
map
sca
le a
nd
the
con
tou
rin
terv
al.
2.
On
th
e in
set
map
,plo
t a
wes
t-ea
st c
ross
sect
ion
of
the
coas
t ju
st n
orth
of
Isla
y C
reek
from
th
e 60
ft
dept
h c
onto
ur
to a
poi
nt
5000
feet
inla
nd.
Use
a s
cale
of
1:24
000
and
ave
rtic
al e
xagg
erat
ion
of
4.
3.
Use
bot
h m
aps
to a
nsw
er t
he
follo
win
gqu
esti
ons.
PR
OC
ED
UR
E
Nam
eC
lass
Dat
e
Geo
Lab
and
Min
iLab
Wor
kshe
ets
Cha
pter
16
Eart
h S
cien
ce:
Geo
logy
, th
e En
viro
nmen
t, a
nd t
he U
nive
rse
65
Iden
tify
ing
Coas
tal L
andf
orm
s
AN
AL
YZ
E
1.
Is t
his
por
tion
of
the
Cal
ifor
nia
coa
st e
mer
gen
t or
su
bmer
gen
t? W
hat
fea
ture
s of
this
coas
tlin
e pr
ovid
e ev
iden
ce f
or y
our
answ
er?
this
co
ast
is e
mer
gen
t; e
leva
ted
mar
ine
terr
aces
, fai
rly
stra
igh
t sh
ore
line
CO
NC
LU
DE
AN
D A
PP
LY
5.
Wh
at is
th
e di
rect
ion
of
the
lon
gsh
ore
tran
spor
t al
ong
Mor
ro B
ay?
Exp
lain
.
To t
he
no
rth
; san
d is
pili
ng
up
on
th
e so
uth
sid
e o
f th
e b
reak
wat
er.
6.
You
r w
est-
east
cro
ss s
ecti
on s
how
s an
ele
vate
d fl
at a
rea
nex
t to
th
e sh
orel
ine.
Wh
at k
ind
ofco
asta
l lan
dfor
m is
th
is?
How
was
it f
orm
ed?
an e
leva
ted
mar
ine
terr
ace;
fo
rmed
by
up
lifti
ng
of
a w
ave-
cut
pla
tfo
rm
7.
Ifse
a le
vel d
ropp
ed 1
0 m
,how
wou
ld t
he
shor
elin
e ch
ange
? H
ow f
ar w
ould
it m
ove
seaw
ard?
Wou
ld it
bec
ome
mor
e re
gula
r or
irre
gula
r? W
hat
wou
ld h
appe
n t
o M
orro
Bay
?
The
sho
relin
e w
ou
ld m
ove
200
0 ft
sea
war
d a
nd
bec
om
e m
ore
reg
ula
r.
Mo
rro
Bay
wo
uld
dry
up
.
8.
Ifse
a le
vel r
ose
6 m
,how
wou
ld t
he
coas
tal r
egio
n c
han
ge?
Nam
e th
ree
maj
or c
han
ges.
Mo
rro
Ro
ck w
ou
ld b
eco
me
an is
lan
d, m
ost
of
the
coas
tal c
om
mu
nit
ies
wo
uld
be
flo
od
ed, t
he
coas
tlin
e w
ou
ld b
eco
me
mo
re ir
reg
ula
r, an
d M
orr
o B
ay w
ou
ld b
eco
me
a la
rge,
bra
nch
ing
est
uar
y ex
ten
din
g a
lmo
st 2
mi f
urt
her
inla
nd
.
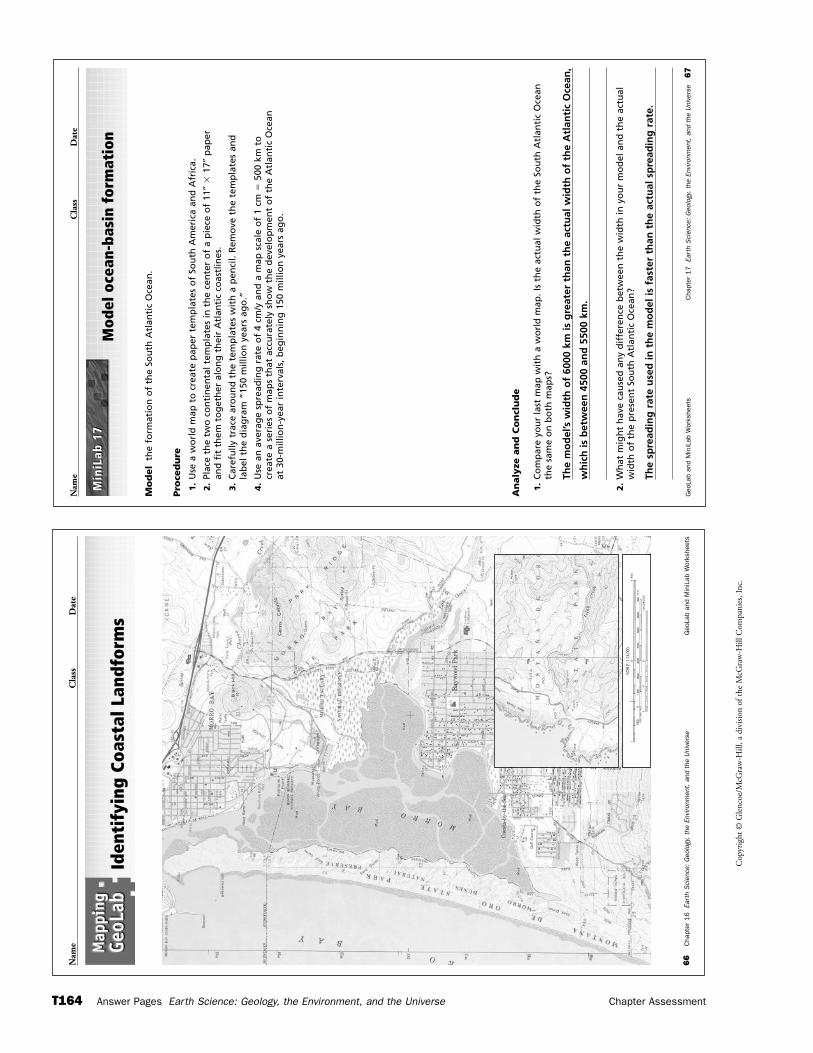
Geo
Lab
and
Min
iLab
Wor
kshe
ets
Cha
pter
17
Eart
h S
cien
ce:
Geo
logy
, th
e En
viro
nmen
t, a
nd t
he U
nive
rse
67
Nam
eC
lass
Dat
e
Mod
el o
cean
-bas
in f
orm
atio
n
Mo
del
the
form
atio
n o
f th
e So
uth
Atl
anti
c O
cean
.
Pro
ced
ure
1.
Use
a w
orl
d m
ap t
o c
reat
e p
aper
tem
pla
tes
of
Sou
th A
mer
ica
and
Afr
ica.
2.
Plac
e th
e tw
o c
on
tin
enta
l tem
pla
tes
in t
he
cen
ter
of
a p
iece
of
11″
�17
″p
aper
an
d f
it t
hem
to
get
her
alo
ng
th
eir
Atl
anti
c co
astl
ines
.
3.
Car
efu
lly t
race
aro
un
d t
he
tem
pla
tes
wit
h a
pen
cil.
Rem
ove
th
e te
mp
late
s an
d
lab
el t
he
dia
gra
m “
150
mill
ion
yea
rs a
go
.”
4.
Use
an
ave
rag
e sp
read
ing
rat
e o
f 4
cm/y
an
d a
map
sca
le o
f 1
cm �
500
km t
o
crea
te a
ser
ies
of
map
s th
at a
ccu
rate
ly s
ho
w t
he
dev
elo
pm
ent
of
the
Atl
anti
c O
cean
at
30-
mill
ion
-yea
r in
terv
als,
beg
inn
ing
150
mill
ion
yea
rs a
go
.
An
aly
ze a
nd
Co
ncl
ud
e
1.
Co
mp
are
you
r la
st m
ap w
ith
a w
orl
d m
ap. I
s th
e ac
tual
wid
th o
f th
e So
uth
Atl
anti
c O
cean
the
sam
e o
n b
oth
map
s?
The
mo
del
’s w
idth
of
6000
km
is g
reat
er t
han
th
e ac
tual
wid
th o
f th
e A
tlan
tic
Oce
an,
wh
ich
is b
etw
een
450
0 an
d 5
500
km.
2.
Wh
at m
igh
t h
ave
cau
sed
an
y d
iffe
ren
ce b
etw
een
th
e w
idth
in y
ou
r m
od
el a
nd
th
e ac
tual
wid
th o
f th
e p
rese
nt
Sou
th A
tlan
tic
Oce
an?
The
spre
adin
g r
ate
use
d in
th
e m
od
el is
fas
ter
than
th
e ac
tual
sp
read
ing
rat
e.
Min
iLab
17
Min
iLab
17
Cop
yrig
ht ©
Gle
ncoe
/McG
raw
-Hill
, a d
ivis
ion
of t
he M
cGra
w-H
ill C
ompa
nies
, Inc
.
T164 Answer Pages Earth Science: Geology, the Environment, and the Universe Chapter Assessment
Nam
eC
lass
Dat
e
66
Cha
pter
16
Eart
h S
cien
ce:
Geo
logy
, th
e En
viro
nmen
t, a
nd t
he U
nive
rse
Geo
Lab
and
Min
iLab
Wor
kshe
ets
Iden
tify
ing
Coas
tal L
andf
orm
s
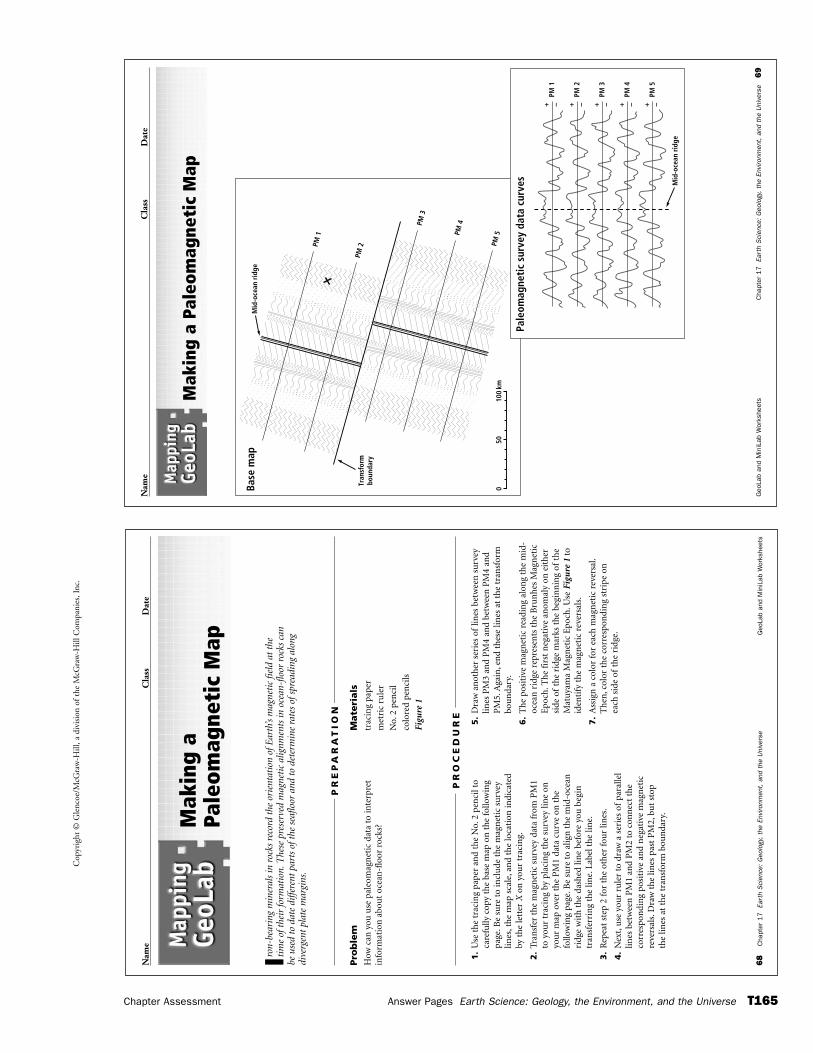
Cop
yrig
ht ©
Gle
ncoe
/McG
raw
-Hill
, a d
ivis
ion
of t
he M
cGra
w-H
ill C
ompa
nies
, Inc
.
Chapter Assessment Answer Pages Earth Science: Geology, the Environment, and the Universe T165
68
Cha
pter
17
Eart
h S
cien
ce:
Geo
logy
, th
e En
viro
nmen
t, a
nd t
he U
nive
rse
Geo
Lab
and
Min
iLab
Wor
kshe
ets
Nam
eC
lass
Dat
e
Iron-
bear
ing
min
eral
s in
roc
ks r
ecor
d th
e or
ient
atio
n of
Ear
th’s
mag
neti
c fie
ld a
t th
eti
me
ofth
eir
form
atio
n.T
hese
pre
serv
ed m
agne
tic
alig
nmen
ts in
oce
an-f
loor
roc
ks c
anbe
use
d to
dat
e di
ffere
nt p
arts
oft
he s
eaflo
or a
nd t
o de
term
ine
rate
s of
spre
adin
g al
ong
dive
rgen
t pl
ate
mar
gins
.
Pro
ble
mH
ow c
an y
ou u
se p
aleo
mag
net
ic d
ata
to in
terp
ret
info
rmat
ion
abo
ut
ocea
n-f
loor
roc
ks?
Mate
rials
trac
ing
pape
r
met
ric
rule
r
No.
2 pe
nci
l
colo
red
pen
cils
Figu
re 1
Mak
ing
a Pa
leom
agne
tic
Map
PR
EP
AR
AT
ION
1.
Use
th
e tr
acin
g pa
per
and
the
No.
2 pe
nci
l to
care
fully
cop
y th
e ba
se m
ap o
n t
he
follo
win
gpa
ge.B
e su
re t
o in
clu
de t
he
mag
net
ic s
urv
eylin
es,t
he
map
sca
le,a
nd
the
loca
tion
indi
cate
dby
th
e le
tter
Xon
you
r tr
acin
g.
2.
Tran
sfer
th
e m
agn
etic
su
rvey
dat
a fr
om P
M1
to y
our
trac
ing
by p
laci
ng
the
surv
ey li
ne
onyo
ur
map
ove
r th
e P
M1
data
cu
rve
on t
he
follo
win
g pa
ge.B
e su
re t
o al
ign
th
e m
id-o
cean
ridg
e w
ith
th
e da
shed
lin
e be
fore
you
beg
intr
ansf
erri
ng
the
line.
Labe
l th
e lin
e.
3.
Rep
eat
step
2 f
or t
he
oth
er f
our
lines
.
4.
Nex
t,u
se y
our
rule
r to
dra
w a
ser
ies
ofpa
ralle
llin
es b
etw
een
PM
1 an
d P
M2
to c
onn
ect
the
corr
espo
ndi
ng
posi
tive
an
d n
egat
ive
mag
net
icre
vers
als.
Dra
w t
he
lines
pas
t P
M2,
but
stop
the
lines
at
the
tran
sfor
m b
oun
dary
.
5.
Dra
w a
not
her
ser
ies
oflin
es b
etw
een
su
rvey
lines
PM
3 an
d P
M4
and
betw
een
PM
4 an
dP
M5.
Aga
in,e
nd
thes
e lin
es a
t th
e tr
ansf
orm
bou
nda
ry.
6.
Th
e po
siti
ve m
agn
etic
rea
din
g al
ong
the
mid
-oc
ean
rid
ge r
epre
sen
ts t
he
Bru
nh
es M
agn
etic
Epo
ch.T
he
firs
t n
egat
ive
anom
aly
on e
ith
ersi
de o
fth
e ri
dge
mar
ks t
he
begi
nn
ing
ofth
eM
atuy
ama
Mag
net
ic E
poch
.Use
Fig
ure
1to
iden
tify
th
e m
agn
etic
rev
ersa
ls.
7.
Ass
ign
a c
olor
for
eac
h m
agn
etic
rev
ersa
l.T
hen
,col
or t
he
corr
espo
ndi
ng
stri
pe o
nea
chsi
de o
fth
e ri
dge.
PR
OC
ED
UR
E
Nam
eC
lass
Dat
e
Geo
Lab
and
Min
iLab
Wor
kshe
ets
Cha
pter
17
Eart
h S
cien
ce:
Geo
logy
, th
e En
viro
nmen
t, a
nd t
he U
nive
rse
69
Mak
ing
a Pa
leom
agne
tic
Map
Base
map
Pale
omag
neti
c su
rvey
dat
a cu
rves
050
100
km
Tran
sfor
mbo
unda
ry
Mid
-oce
an r
idge
PM 1
PM 2
PM 3
PM 4
PM 5
Mid
-oce
an r
idge
PM 1
PM 2
PM 3
PM 4
PM 5
+ – + – + – + – + –
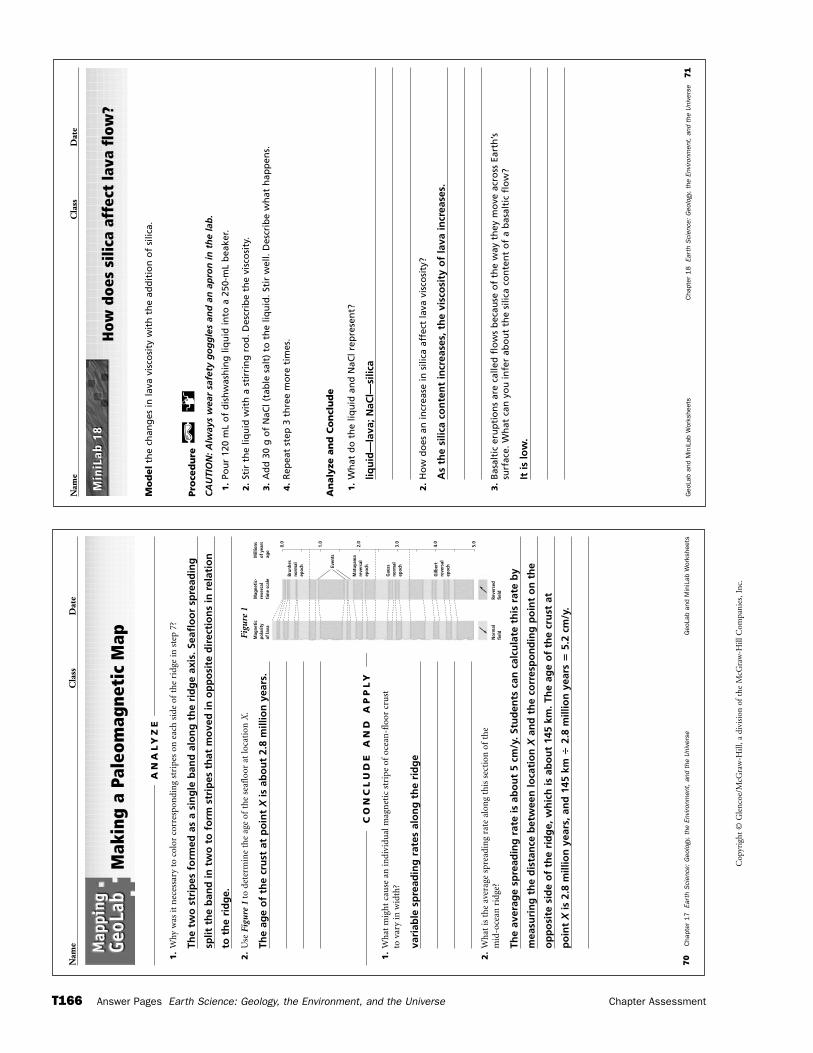
Geo
Lab
and
Min
iLab
Wor
kshe
ets
Cha
pter
18
Eart
h S
cien
ce:
Geo
logy
, th
e En
viro
nmen
t, a
nd t
he U
nive
rse
71
Nam
eC
lass
Dat
e
How
doe
s si
lica
affe
ct la
va f
low
?
Mo
del
the
chan
ges
in la
va v
isco
sity
wit
h t
he
add
itio
n o
f si
lica.
Pro
ced
ure
CA
UTI
ON
: Alw
ays
wea
r sa
fety
go
gg
les
and
an
ap
ron
in t
he
lab
.
1.
Pou
r 12
0 m
L o
f d
ish
was
hin
g li
qu
id in
to a
250
-mL
bea
ker.
2.
Stir
th
e liq
uid
wit
h a
sti
rrin
g r
od
. Des
crib
e th
e vi
sco
sity
.
3.
Ad
d 3
0 g
of
NaC
l (ta
ble
sal
t) t
o t
he
liqu
id. S
tir
wel
l. D
escr
ibe
wh
at h
app
ens.
4.
Rep
eat
step
3 t
hre
e m
ore
tim
es.
An
aly
ze a
nd
Co
ncl
ud
e
1.
Wh
at d
o t
he
liqu
id a
nd
NaC
l rep
rese
nt?
liqu
id—
lava
; NaC
l—si
lica
2.
Ho
w d
oes
an
incr
ease
in s
ilica
aff
ect
lava
vis
cosi
ty?
As
the
silic
a co
nte
nt
incr
ease
s, t
he
visc
osi
ty o
f la
va in
crea
ses.
3.
Bas
alti
c er
up
tio
ns
are
calle
d f
low
s b
ecau
se o
f th
e w
ay t
hey
mo
ve a
cro
ss E
arth
’s
surf
ace.
Wh
at c
an y
ou
infe
r ab
ou
t th
e si
lica
con
ten
t o
f a
bas
alti
c fl
ow
?
It is
low
.
Min
iLab
18
Min
iLab
18
Cop
yrig
ht ©
Gle
ncoe
/McG
raw
-Hill
, a d
ivis
ion
of t
he M
cGra
w-H
ill C
ompa
nies
, Inc
.
T166 Answer Pages Earth Science: Geology, the Environment, and the Universe Chapter Assessment
Nam
eC
lass
Dat
e
70
Cha
pter
17
Eart
h S
cien
ce:
Geo
logy
, th
e En
viro
nmen
t, a
nd t
he U
nive
rse
Geo
Lab
and
Min
iLab
Wor
kshe
ets
Mak
ing
a Pa
leom
agne
tic
Map
1.
Why
was
it n
eces
sary
to
colo
r co
rres
pon
din
g st
ripe
s on
eac
h s
ide
ofth
e ri
dge
in s
tep
7?
The
two
str
ipes
fo
rmed
as
a si
ng
le b
and
alo
ng
th
e ri
dg
e ax
is. S
eafl
oo
r sp
read
ing
split
th
e b
and
in t
wo
to
fo
rm s
trip
es t
hat
mo
ved
in o
pp
osi
te d
irec
tio
ns
in r
elat
ion
to t
he
rid
ge.
2.
Use
Fig
ure
1to
det
erm
ine
the
age
ofth
e se
aflo
or a
t lo
cati
on X
.
The
age
of
the
cru
st a
t p
oin
t X
is a
bo
ut
2.8
mill
ion
yea
rs.
AN
AL
YZ
E
1.
Wh
at m
igh
t ca
use
an
indi
vidu
al m
agn
etic
str
ipe
ofoc
ean
-flo
or c
rust
to
var
y in
wid
th?
vari
able
sp
read
ing
rat
es a
lon
g t
he
rid
ge
2.
Wh
at is
th
e av
erag
e sp
read
ing
rate
alo
ng
this
sec
tion
of
the
mid
-oce
an r
idge
?
The
aver
age
spre
adin
g r
ate
is a
bo
ut
5 cm
/y. S
tud
ents
can
cal
cula
te t
his
rat
e b
y
mea
suri
ng
th
e d
ista
nce
bet
wee
n lo
cati
on
Xan
d t
he
corr
esp
on
din
g p
oin
t o
n t
he
op
po
site
sid
e o
f th
e ri
dg
e, w
hic
h is
ab
ou
t 14
5 km
. Th
e ag
e o
f th
e cr
ust
at
po
int
Xis
2.8
mill
ion
yea
rs, a
nd
145
km
�2.
8 m
illio
n y
ears
�5.
2 cm
/y.
CO
NC
LU
DE
AN
D A
PP
LY
Mag
neti
cpo
lari
tyof
lava
Mag
neti
c-re
vers
alti
me
scal
e
Mill
ions
of y
ears
ago
Brun
hes
norm
alep
och
Gau
ssno
rmal
epoc
hEven
ts
Mat
uyam
are
vers
alep
och
Gilb
ert
reve
rsal
epoc
h
Nor
mal
field
Reve
rsed
field
0.0
1.0
2.0
3.0
4.0
5.0
Figu
re 1
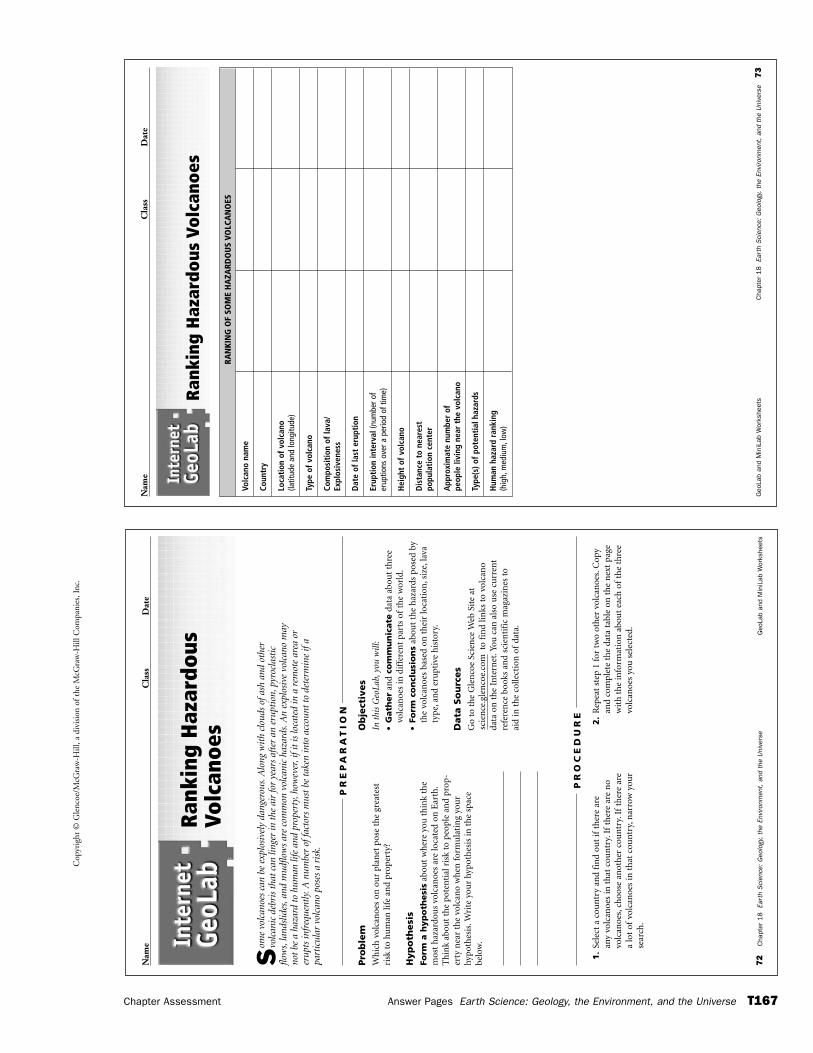
Cop
yrig
ht ©
Gle
ncoe
/McG
raw
-Hill
, a d
ivis
ion
of t
he M
cGra
w-H
ill C
ompa
nies
, Inc
.
Chapter Assessment Answer Pages Earth Science: Geology, the Environment, and the Universe T167
72
Cha
pter
18
Eart
h S
cien
ce:
Geo
logy
, th
e En
viro
nmen
t, a
nd t
he U
nive
rse
Geo
Lab
and
Min
iLab
Wor
kshe
ets
Nam
eC
lass
Dat
e
Som
e vo
lcan
oes
can
be e
xplo
sive
ly d
ange
rous
.Alo
ng w
ith
clou
ds o
fash
and
oth
ervo
lcan
ic d
ebri
s th
at c
an li
nger
in t
he a
ir fo
r ye
ars
afte
r an
eru
ptio
n,py
rocl
asti
cflo
ws,
land
slid
es,a
nd m
udflo
ws
are
com
mon
vol
cani
c ha
zard
s.A
n ex
plos
ive
volc
ano
may
not
be a
haz
ard
to h
uman
life
and
pro
pert
y,ho
wev
er,i
fit
is lo
cate
d in
a r
emot
e ar
ea o
rer
upts
infr
eque
ntly
.A n
umbe
r of
fact
ors
mus
t be
tak
en in
to a
ccou
nt t
o de
term
ine
ifa
part
icul
ar v
olca
no p
oses
a r
isk.
Pro
ble
mW
hic
h v
olca
noe
s on
ou
r pl
anet
pos
e th
e gr
eate
stri
sk t
o hu
man
life
an
d pr
oper
ty?
Hyp
oth
esi
sFo
rm a
hyp
oth
esi
sab
out
wh
ere
you
th
ink
the
mos
t h
azar
dou
s vo
lcan
oes
are
loca
ted
on E
arth
.T
hin
k ab
out
the
pote
nti
al r
isk
to p
eopl
e an
d pr
op-
erty
nea
r th
e vo
lcan
o w
hen
for
mu
lati
ng
you
rhy
poth
esis
.Wri
te y
our
hypo
thes
is in
th
e sp
ace
belo
w.
Ob
ject
ives
In t
his
Geo
Lab,
you
will
:
•G
ath
er
and
com
mu
nic
ate
data
abo
ut
thre
evo
lcan
oes
in d
iffe
ren
t pa
rts
ofth
e w
orld
.
•Fo
rm c
on
clu
sio
ns
abou
t th
e h
azar
ds p
osed
by
the
volc
anoe
s ba
sed
on t
hei
r lo
cati
on,s
ize,
lava
type
,an
d er
upt
ive
his
tory
.
Data
So
urc
es
Go
to t
he
Gle
nco
e Sc
ien
ce W
eb S
ite
at
to f
ind
links
to
volc
ano
data
on
th
e In
tern
et.Y
ou c
an a
lso
use
cu
rren
t re
fere
nce
boo
ks a
nd
scie
nti
fic
mag
azin
es t
o ai
d in
th
e co
llect
ion
of
data
.
scie
nce
.gle
nco
e.co
m
Ran
king
Haz
ardo
usVo
lcan
oes
PR
EP
AR
AT
ION
1.
Sele
ct a
cou
ntr
y an
d fi
nd
out
ifth
ere
are
any
volc
anoe
s in
th
at c
oun
try.
Ifth
ere
are
no
volc
anoe
s,ch
oose
an
oth
er c
oun
try.
Ifth
ere
are
a lo
t of
volc
anoe
s in
th
at c
oun
try,
nar
row
you
rse
arch
.
2.
Rep
eat
step
1 f
or t
wo
oth
er v
olca
noe
s.C
opy
and
com
plet
e th
e da
ta t
able
on
th
e n
ext
page
wit
h t
he
info
rmat
ion
abo
ut
each
of
the
thre
evo
lcan
oes
you
sel
ecte
d.
PR
OC
ED
UR
E
Nam
eC
lass
Dat
e
Geo
Lab
and
Min
iLab
Wor
kshe
ets
Cha
pter
18
Eart
h S
cien
ce:
Geo
logy
, th
e En
viro
nmen
t, a
nd t
he U
nive
rse
73
Ran
king
Haz
ardo
us V
olca
noes
RAN
KIN
G O
F SO
ME
HA
ZARD
OU
S VO
LCA
NO
ES
Volc
ano
nam
e
Coun
try
Loca
tion
of
volc
ano
(latit
ude
and
long
itude
)
Type
of
volc
ano
Com
posi
tion
of
lava
/Ex
plos
iven
ess
Dat
e of
last
eru
ptio
n
Erup
tion
inte
rval
(num
ber o
f er
uptio
ns o
ver a
per
iod
of ti
me)
Hei
ght
of v
olca
no
Dis
tanc
e to
nea
rest
po
pula
tion
cen
ter
App
roxi
mat
e nu
mbe
r of
pe
ople
livi
ng n
ear
the
volc
ano
Type
(s) o
f po
tent
ial h
azar
ds
Hum
an h
azar
d ra
nkin
g(h
igh,
med
ium
,low
)
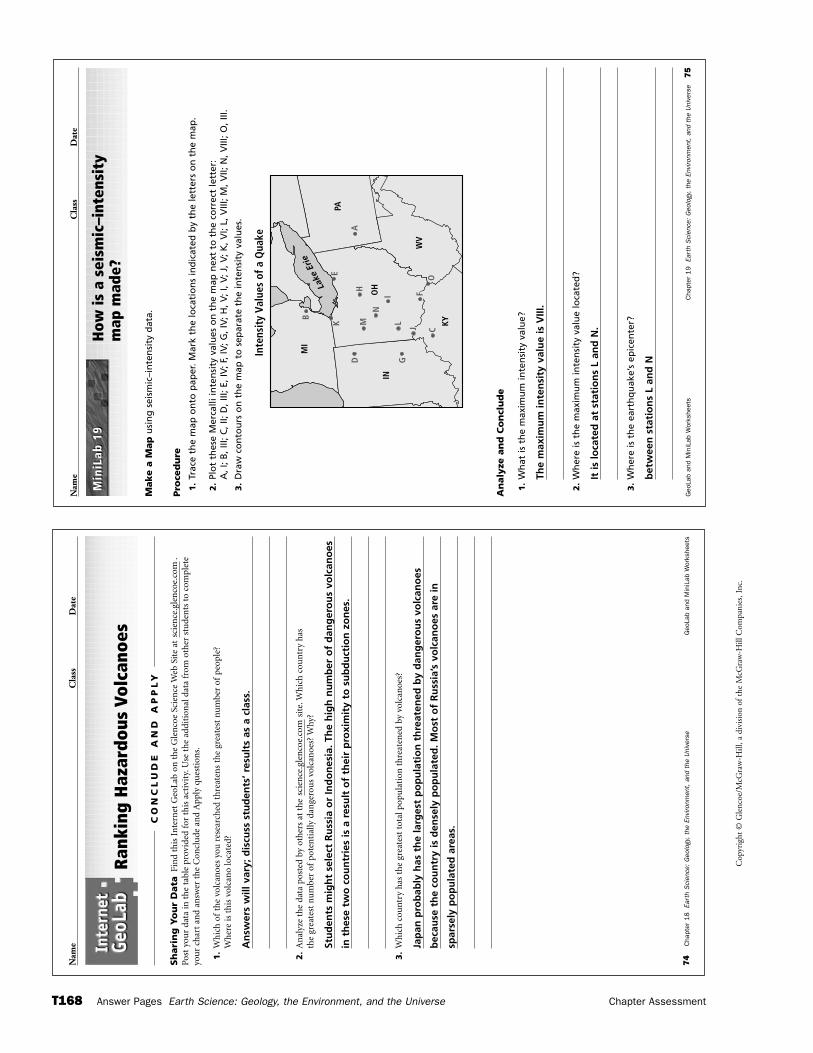
Geo
Lab
and
Min
iLab
Wor
kshe
ets
Cha
pter
19
Eart
h S
cien
ce:
Geo
logy
, th
e En
viro
nmen
t, a
nd t
he U
nive
rse
75
Nam
eC
lass
Dat
e
How
is a
sei
smic
–int
ensi
ty
map
mad
e?
Make a
Map
usi
ng
sei
smic
–in
ten
sity
dat
a.
Pro
ced
ure
1.
Trac
e th
e m
ap o
nto
pap
er. M
ark
the
loca
tio
ns
ind
icat
ed b
y th
e le
tter
s o
n t
he
map
.
2.
Plo
t th
ese
Mer
calli
inte
nsi
ty v
alu
es o
n t
he
map
nex
t to
th
e co
rrec
t le
tter
: A
, I; B
, III;
C, I
I; D
, III;
E, I
V; F
, IV
; G, I
V; H
, V; I
, V; J
, V; K
, VI;
L, V
III; M
, VII;
N, V
III; O
, III.
3.
Dra
w c
on
tou
rs o
n t
he
map
to
sep
arat
e th
e in
ten
sity
val
ues
.
An
aly
ze a
nd
Co
ncl
ud
e
1.
Wh
at is
th
e m
axim
um
inte
nsi
ty v
alu
e?
The
max
imu
m in
ten
sity
val
ue
is V
III.
2.
Wh
ere
is t
he
max
imu
m in
ten
sity
val
ue
loca
ted
?
It is
loca
ted
at
stat
ion
s L
and
N.
3.
Wh
ere
is t
he
eart
hq
uak
e’s
epic
ente
r?
bet
wee
n s
tati
on
s L
and
N
Min
iLab
19
Min
iLab
19
MI
PA
Lake
Erie
OH
MKE
N
D
IN
KY
WV
H
I
A
LG
FJ C
O
B
Inte
nsit
y Va
lues
of a
Qua
ke
Cop
yrig
ht ©
Gle
ncoe
/McG
raw
-Hill
, a d
ivis
ion
of t
he M
cGra
w-H
ill C
ompa
nies
, Inc
.
T168 Answer Pages Earth Science: Geology, the Environment, and the Universe Chapter Assessment
Nam
eC
lass
Dat
e
74
Cha
pter
18
Eart
h S
cien
ce:
Geo
logy
, th
e En
viro
nmen
t, a
nd t
he U
nive
rse
Geo
Lab
and
Min
iLab
Wor
kshe
ets
Ran
king
Haz
ardo
us V
olca
noes
Sh
ari
ng
Yo
ur
Data
Fin
d th
is I
nte
rnet
Geo
Lab
on t
he
Gle
nco
e Sc
ien
ce W
eb S
ite
at
.Po
st y
our
data
in t
he
tabl
e pr
ovid
ed f
or t
his
act
ivit
y.U
se t
he
addi
tion
al d
ata
from
oth
er s
tude
nts
to
com
plet
e yo
ur
char
t an
d an
swer
th
e C
oncl
ude
an
d A
pply
qu
esti
ons.
1.
Wh
ich
of
the
volc
anoe
s yo
u r
esea
rch
ed t
hre
aten
s th
e gr
eate
st n
um
ber
ofpe
ople
?W
her
e is
th
is v
olca
no
loca
ted?
An
swer
s w
ill v
ary;
dis
cuss
stu
den
ts’ r
esu
lts
as a
cla
ss.
2.
An
alyz
e th
e da
ta p
oste
d by
oth
ers
at t
he
site
.Wh
ich
cou
ntr
y h
asth
e gr
eate
st n
um
ber
ofpo
ten
tial
ly d
ange
rou
s vo
lcan
oes?
Why
?
Stu
den
ts m
igh
t se
lect
Ru
ssia
or
Ind
on
esia
. Th
e h
igh
nu
mb
er o
f d
ang
ero
us
volc
ano
es
in t
hes
e tw
o c
ou
ntr
ies
is a
res
ult
of
thei
r p
roxi
mit
y to
su
bd
uct
ion
zo
nes
.
3.
Wh
ich
cou
ntr
y h
as t
he
grea
test
tot
al p
opu
lati
on t
hre
aten
ed b
y vo
lcan
oes?
Jap
an p
rob
ably
has
th
e la
rges
t p
op
ula
tio
n t
hre
aten
ed b
y d
ang
ero
us
volc
ano
es
bec
ause
th
e co
un
try
is d
ense
ly p
op
ula
ted
. Mo
st o
f R
uss
ia’s
vo
lcan
oes
are
in
spar
sely
po
pu
late
d a
reas
.
scie
nce
.gle
nco
e.co
m
scie
nce
.gle
nco
e.co
m
CO
NC
LU
DE
AN
D A
PP
LY
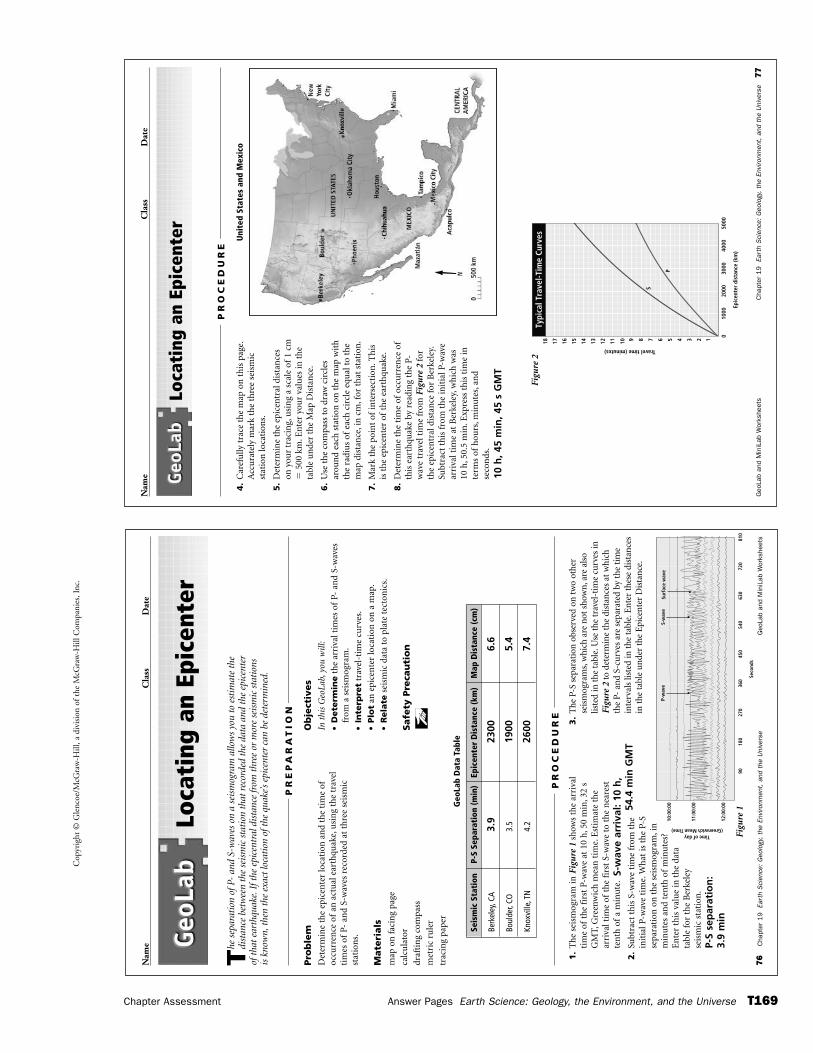
Cop
yrig
ht ©
Gle
ncoe
/McG
raw
-Hill
, a d
ivis
ion
of t
he M
cGra
w-H
ill C
ompa
nies
, Inc
.
Chapter Assessment Answer Pages Earth Science: Geology, the Environment, and the Universe T169
10:0
0:00
P-w
ave
11:0
0:00
Time of day(Greenwich Mean Time)
12:0
0:00
9018
027
036
045
0
Seco
nds
540
630
720
810
S-w
ave
Surf
ace
wav
e
76
Cha
pter
19
Eart
h S
cien
ce:
Geo
logy
, th
e En
viro
nmen
t, a
nd t
he U
nive
rse
Geo
Lab
and
Min
iLab
Wor
kshe
ets
Nam
eC
lass
Dat
e
The
sep
arat
ion
ofP-
and
S-w
aves
on
a se
ism
ogra
m a
llow
s yo
u to
est
imat
e th
edi
stan
cebe
twee
n th
e se
ism
ic s
tati
on t
hat
reco
rded
the
dat
a an
d th
e ep
icen
ter
ofth
atea
rthq
uake
.Ift
he e
pice
ntra
l dis
tanc
e fr
om t
hree
or
mor
e se
ism
ic s
tati
ons
iskn
own,
then
the
exa
ct lo
cati
on o
fthe
qua
ke’s
epic
ente
r ca
n be
det
erm
ined
.
Pro
ble
mD
eter
min
e th
e ep
icen
ter
loca
tion
an
d th
e ti
me
ofoc
curr
ence
of
an a
ctu
al e
arth
quak
e,u
sin
g th
e tr
avel
tim
es o
fP-
an
d S-
wav
es r
ecor
ded
at t
hre
e se
ism
icst
atio
ns.
Mate
rials
map
on
fac
ing
page
calc
ula
tor
draf
tin
g co
mpa
ss
met
ric
rule
r
trac
ing
pape
r
Ob
ject
ives
In t
his
Geo
Lab,
you
will
:
•D
ete
rmin
eth
e ar
riva
l tim
es o
fP-
an
d S-
wav
esfr
om a
sei
smog
ram
.
•In
terp
ret
trav
el-t
ime
curv
es.
•Plo
tan
epi
cen
ter
loca
tion
on
a m
ap.
•R
ela
tese
ism
ic d
ata
to p
late
tec
ton
ics.
Safe
ty P
reca
uti
on
Loca
ting
an
Epic
ente
r
PR
EP
AR
AT
ION
1.
Th
e se
ism
ogra
m in
Fig
ure
1sh
ows
the
arri
val
tim
e of
the
firs
t P-
wav
e at
10
h,5
0 m
in,3
2 s
GM
T,G
reen
wic
h m
ean
tim
e.E
stim
ate
the
arri
val t
ime
ofth
e fi
rst
S-w
ave
to t
he
nea
rest
ten
th o
fa
min
ute
.
2.
Subt
ract
th
is S
-wav
e ti
me
from
th
e in
itia
l P-w
ave
tim
e.W
hat
is t
he
P-S
sepa
rati
on o
n t
he
seis
mog
ram
,in
m
inu
tes
and
ten
th o
fm
inu
tes?
E
nte
r th
is v
alu
e in
th
e da
ta
tabl
e fo
r th
e B
erke
ley
seis
mic
sta
tion
.
3.
The
P-S
sep
arat
ion
obs
erve
d on
tw
o ot
her
seis
mog
ram
s,w
hich
are
not
sho
wn
,are
als
olis
ted
in t
he t
able
.Use
the
tra
vel-
tim
e cu
rves
inFi
gure
2to
det
erm
ine
the
dist
ance
s at
whi
chth
eP-
an
d S-
curv
es a
re s
epar
ated
by
the
tim
ein
terv
als
liste
d in
the
tab
le.E
nte
r th
ese
dist
ance
sin
the
tab
le u
nde
r th
e E
pice
nte
r D
ista
nce
.
PR
OC
ED
UR
E
Seis
mic
Sta
tion
P-S
Sepa
rati
on (
min
)Ep
icen
ter
Dis
tanc
e (k
m)
Map
Dis
tanc
e (c
m)
Berk
eley
,CA
3.9
2300
6.6
Boul
der,
CO3.
519
005.
4
Knox
ville
,TN
4.2
2600
7.4
Geo
Lab
Dat
a Ta
ble
Figu
re 1
P-S
sep
arat
ion
:3.
9 m
in
S-w
ave
arri
val:
10 h
, 54
.4 m
in G
MT
Nam
eC
lass
Dat
e
Geo
Lab
and
Min
iLab
Wor
kshe
ets
Cha
pter
19
Eart
h S
cien
ce:
Geo
logy
, th
e En
viro
nmen
t, a
nd t
he U
nive
rse
77
Loca
ting
an
Epic
ente
r
PR
OC
ED
UR
E
4.
Car
efu
lly t
race
th
e m
ap o
n t
his
pag
e.A
ccu
rate
ly m
ark
the
thre
e se
ism
icst
atio
n lo
cati
ons.
5.
Det
erm
ine
the
epic
entr
al d
ista
nce
son
you
r tr
acin
g,u
sin
g a
scal
e of
1 cm
�50
0 km
.En
ter
you
r va
lues
in t
he
tabl
e u
nde
r th
e M
ap D
ista
nce
.
6.
Use
th
e co
mpa
ss t
o dr
aw c
ircl
esar
oun
d ea
ch s
tati
on o
n t
he
map
wit
hth
e ra
diu
s of
each
cir
cle
equ
al t
o th
em
ap d
ista
nce
,in
cm
,for
th
at s
tati
on.
7.
Mar
k th
e po
int
ofin
ters
ecti
on.T
his
is t
he
epic
ente
r of
the
eart
hqu
ake.
8.
Det
erm
ine
the
tim
e of
occu
rren
ce o
fth
is e
arth
quak
e by
rea
din
g th
e P-
wav
e tr
avel
tim
e fr
om F
igu
re 2
for
the
epic
entr
al d
ista
nce
for
Ber
kele
y.Su
btra
ct t
his
fro
m t
he
init
ial P
-wav
ear
riva
l tim
e at
Ber
kele
y,w
hic
h w
as10
h,5
0.5
min
.Exp
ress
th
is t
ime
inte
rms
ofh
ours
,min
ute
s,an
dse
con
ds.
1
1000
020
0030
00
S
P
Epic
ente
r di
stan
ce (k
m)40
0050
00
23456789
Travel time (minutes)
101112131415161718Ty
pica
l Tra
vel-T
ime
Curv
esFi
gure
2
Uni
ted
Stat
es a
nd M
exic
o
10 h
, 45
min
, 45
s G
MT
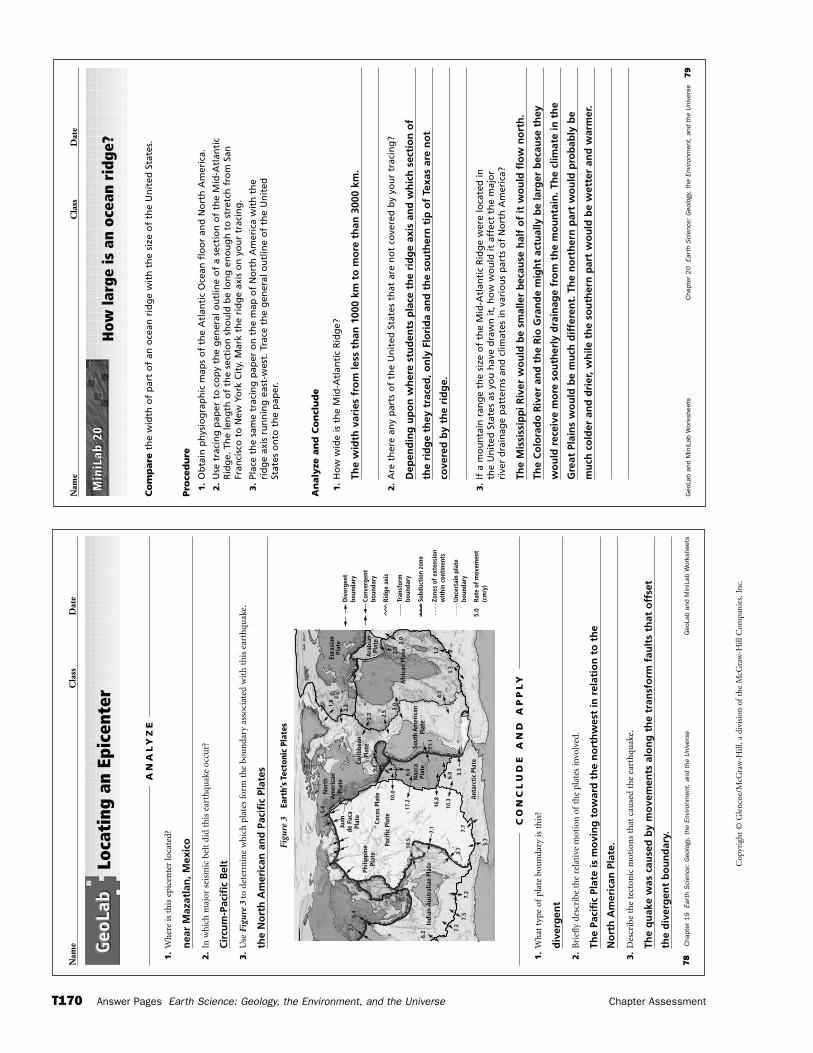
Geo
Lab
and
Min
iLab
Wor
kshe
ets
Cha
pter
20
Eart
h S
cien
ce:
Geo
logy
, th
e En
viro
nmen
t, a
nd t
he U
nive
rse
79
Nam
eC
lass
Dat
e
How
larg
e is
an
ocea
n ri
dge?
Co
mp
are
the
wid
th o
f p
art
of
an o
cean
rid
ge
wit
h t
he
size
of
the
Un
ited
Sta
tes.
Pro
ced
ure
1.
Ob
tain
ph
ysio
gra
ph
ic m
aps
of
the
Atl
anti
c O
cean
flo
or
and
No
rth
Am
eric
a.
2.
Use
tra
cin
g p
aper
to
co
py
the
gen
eral
ou
tlin
e o
f a
sect
ion
of
the
Mid
-Atl
anti
cR
idg
e. T
he
len
gth
of
the
sect
ion
sh
ou
ld b
e lo
ng
en
ou
gh
to
str
etch
fro
m S
anFr
anci
sco
to
New
Yo
rk C
ity.
Mar
k th
e ri
dg
e ax
is o
n y
ou
r tr
acin
g.
3.
Plac
e th
e sa
me
trac
ing
pap
er o
n t
he
map
of
No
rth
Am
eric
a w
ith
th
eri
dg
e ax
is r
un
nin
g e
ast-
wes
t. T
race
th
e g
ener
al o
utl
ine
of
the
Un
ited
Stat
es o
nto
th
e p
aper
.
An
aly
ze a
nd
Co
ncl
ud
e
1.
Ho
w w
ide
is t
he
Mid
-Atl
anti
c R
idg
e?
The
wid
th v
arie
s fr
om
less
th
an 1
000
km t
o m
ore
th
an 3
000
km.
2.
Are
th
ere
any
par
ts o
f th
e U
nit
ed S
tate
s th
at a
re n
ot
cove
red
by
you
r tr
acin
g?
Dep
end
ing
up
on
wh
ere
stu
den
ts p
lace
th
e ri
dg
e ax
is a
nd
wh
ich
sec
tio
n o
f
the
rid
ge
they
tra
ced
, on
ly F
lori
da
and
th
e so
uth
ern
tip
of
Texa
s ar
e n
ot
cove
red
by
the
rid
ge.
3.
If a
mo
un
tain
ran
ge
the
size
of
the
Mid
-Atl
anti
c R
idg
e w
ere
loca
ted
inth
e U
nit
ed S
tate
s as
yo
u h
ave
dra
wn
it, h
ow
wo
uld
it a
ffec
t th
e m
ajo
rri
ver
dra
inag
e p
atte
rns
and
clim
ates
in v
ario
us
par
ts o
f N
ort
h A
mer
ica?
The
Mis
siss
ipp
i Riv
er w
ou
ld b
e sm
alle
r b
ecau
se h
alf
of
it w
ou
ld f
low
no
rth
.
The
Co
lora
do
Riv
er a
nd
th
e R
io G
ran
de
mig
ht
actu
ally
be
larg
er b
ecau
se t
hey
wo
uld
rec
eive
mo
re s
ou
ther
ly d
rain
age
fro
m t
he
mo
un
tain
. Th
e cl
imat
e in
th
e
Gre
at P
lain
s w
ou
ld b
e m
uch
dif
fere
nt.
Th
e n
ort
her
n p
art
wo
uld
pro
bab
ly b
e
mu
ch c
old
er a
nd
dri
er, w
hile
th
e so
uth
ern
par
t w
ou
ld b
e w
ette
r an
d w
arm
er.
Min
iLab
20
Min
iLab
20
Cop
yrig
ht ©
Gle
ncoe
/McG
raw
-Hill
, a d
ivis
ion
of t
he M
cGra
w-H
ill C
ompa
nies
, Inc
.
T170 Answer Pages Earth Science: Geology, the Environment, and the Universe Chapter Assessment
Nam
eC
lass
Dat
e
78
Cha
pter
19
Eart
h S
cien
ce:
Geo
logy
, th
e En
viro
nmen
t, a
nd t
he U
nive
rse
Geo
Lab
and
Min
iLab
Wor
kshe
ets
Loca
ting
an
Epic
ente
r
1.
Wh
ere
is t
his
epi
cen
ter
loca
ted?
nea
r M
azat
lan
, Mex
ico
2.
In w
hic
h m
ajor
sei
smic
bel
t di
d th
is e
arth
quak
e oc
cur?
Cir
cum
-Pac
ific
Bel
t
3.
Use
Fig
ure
3to
det
erm
ine
wh
ich
pla
tes
form
th
e bo
un
dary
ass
ocia
ted
wit
h t
his
ear
thqu
ake.
the
No
rth
Am
eric
an a
nd
Pac
ific
Pla
tes
AN
AL
YZ
E
1.
Wh
at t
ype
ofpl
ate
bou
nda
ry is
th
is?
div
erg
ent
2.
Bri
efly
des
crib
e th
e re
lati
ve m
otio
n o
fth
e pl
ates
invo
lved
.
The
Paci
fic
Plat
e is
mo
vin
g t
ow
ard
th
e n
ort
hw
est
in r
elat
ion
to
th
e
No
rth
Am
eric
an P
late
.
3.
Des
crib
e th
e te
cton
ic m
otio
ns
that
cau
sed
the
eart
hqu
ake.
The
qu
ake
was
cau
sed
by
mo
vem
ents
alo
ng
th
e tr
ansf
orm
fau
lts
that
off
set
the
div
erg
ent
bo
un
dar
y.
CO
NC
LU
DE
AN
D A
PP
LY
Phili
ppin
ePl
ate
5.4
7.3
3.7
5.4
Paci
fic P
late
Indi
an-A
ustr
alia
n Pl
ate
Ant
arct
ic P
late
Sout
h A
mer
ican
Plat
e
Nor
thA
mer
ican
Plat
e Naz
caPl
ate
Coco
s Pl
ate
Juan
de F
uca
Plat
eCa
ribb
ean
Plat
e
Afr
ican
Pla
teAra
bian
Plat
e
Eura
sian
Plat
e
2.0
2.0
1.3
4.1
1.7
6.2
7.5
7.2
3.7
7.1
10.5 5.7
7.7
10.3
16.8
3.3
6.0 6.
0 17
.2
11.1
9.2
2.31.
8
10.0
2.3 2.5 3.
0
Div
erge
ntbo
unda
ry
Conv
erge
ntbo
unda
ry
Ridg
e ax
is
Tran
sfor
mbo
unda
ry
Zone
s of
ext
ensi
onw
ithi
n co
ntin
ents
Subd
ucti
on z
one
Unc
erta
in p
late
boun
dary
Rate
of m
ovem
ent
(cm
/y)
5.0
Figu
re 3
Eart
h’s
Tect
onic
Pla
tes
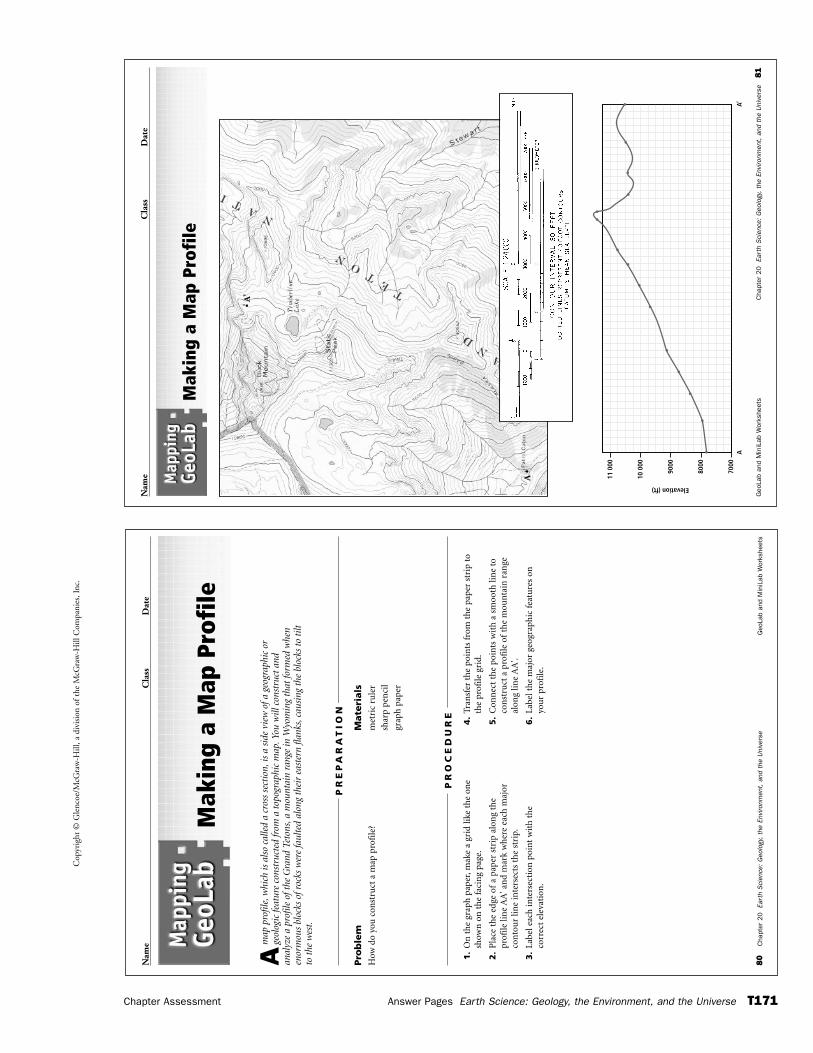
Cop
yrig
ht ©
Gle
ncoe
/McG
raw
-Hill
, a d
ivis
ion
of t
he M
cGra
w-H
ill C
ompa
nies
, Inc
.
Chapter Assessment Answer Pages Earth Science: Geology, the Environment, and the Universe T171
80
Cha
pter
20
Eart
h S
cien
ce:
Geo
logy
, th
e En
viro
nmen
t, a
nd t
he U
nive
rse
Geo
Lab
and
Min
iLab
Wor
kshe
ets
Nam
eC
lass
Dat
e
Am
ap p
rofil
e,w
hich
is a
lso
calle
d a
cros
s se
ctio
n,is
a s
ide
view
ofa
geo
grap
hic
orge
olog
ic fe
atur
e co
nstr
ucte
d fr
om a
top
ogra
phic
map
.You
will
con
stru
ct a
ndan
alyz
e a
prof
ile o
fthe
Gra
nd T
eton
s,a
mou
ntai
n ra
nge
in W
yom
ing
that
form
ed w
hen
enor
mou
s bl
ocks
ofr
ocks
wer
e fa
ulte
d al
ong
thei
r ea
ster
n fla
nks,
caus
ing
the
bloc
ks t
o ti
ltto
the
wes
t.
Pro
ble
mH
ow d
o yo
u c
onst
ruct
a m
ap p
rofi
le?
Mate
rials
met
ric
rule
r
shar
p pe
nci
l
grap
h p
aper
Mak
ing
a M
ap P
rofi
le
PR
EP
AR
AT
ION
1.
On
th
e gr
aph
pap
er,m
ake
a gr
id li
ke t
he
one
show
n o
n t
he
faci
ng
page
.
2.
Pla
ce t
he
edge
of
a pa
per
stri
p al
ong
the
prof
ile li
ne
AA
' an
d m
ark
wh
ere
each
maj
orco
nto
ur
line
inte
rsec
ts t
he
stri
p.
3.
Lab
el e
ach
inte
rsec
tion
poi
nt
wit
h t
he
corr
ect
elev
atio
n.
4.
Tran
sfer
th
e po
ints
fro
m t
he
pape
r st
rip
toth
epr
ofile
gri
d.
5.
Con
nec
t th
e po
ints
wit
h a
sm
ooth
lin
e to
con
stru
ct a
pro
file
of
the
mou
nta
in r
ange
alon
g lin
e A
A'.
6.
Labe
l th
e m
ajor
geo
grap
hic
fea
ture
s on
you
rpr
ofile
.
PR
OC
ED
UR
E
Nam
eC
lass
Dat
e
Geo
Lab
and
Min
iLab
Wor
kshe
ets
Cha
pter
20
Eart
h S
cien
ce:
Geo
logy
, th
e En
viro
nmen
t, a
nd t
he U
nive
rse
81
Mak
ing
a M
ap P
rofi
le
11 0
00
10 0
00
9000
8000
7000
AA‘
Elevation (ft)
•A'
A •
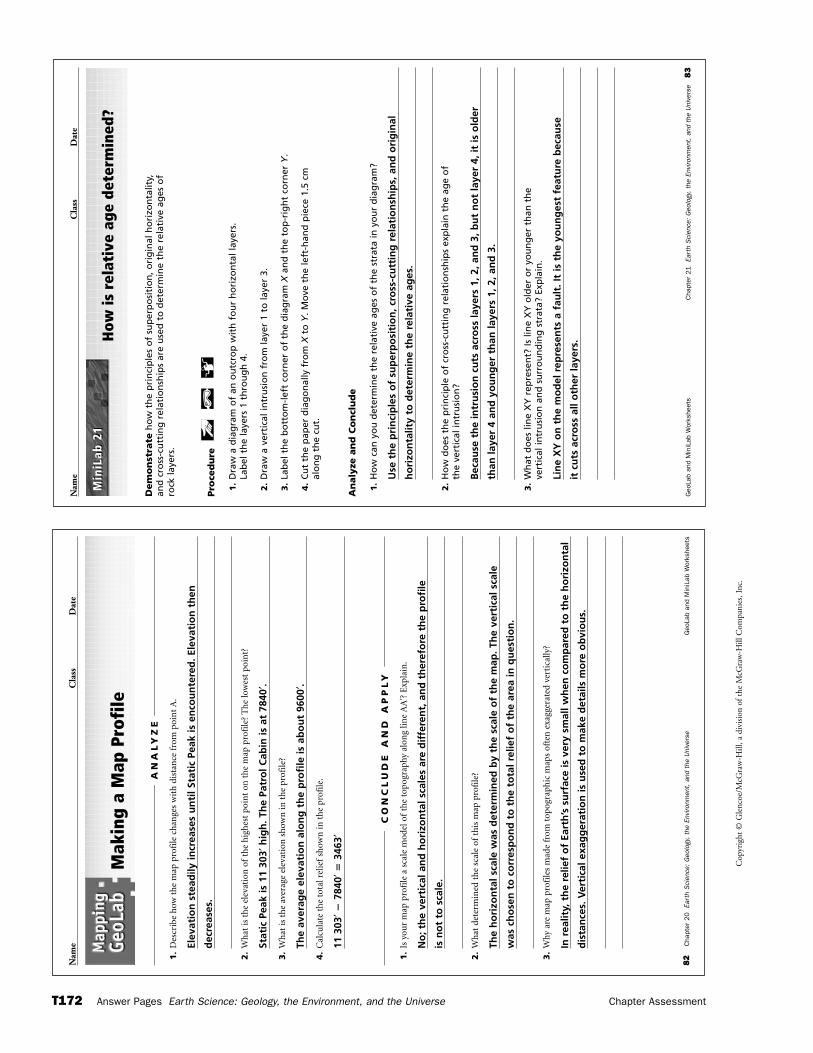
Geo
Lab
and
Min
iLab
Wor
kshe
ets
Cha
pter
21
Eart
h S
cien
ce:
Geo
logy
, th
e En
viro
nmen
t, a
nd t
he U
nive
rse
83
Nam
eC
lass
Dat
e
How
is r
elat
ive
age
dete
rmin
ed?
Dem
on
stra
teh
ow
th
e p
rin
cip
les
of
sup
erp
osi
tio
n, o
rig
inal
ho
rizo
nta
lity,
and
cro
ss-c
utt
ing
rel
atio
nsh
ips
are
use
d t
o d
eter
min
e th
e re
lati
ve a
ges
of
rock
laye
rs.
Pro
ced
ure
1.
Dra
w a
dia
gra
m o
f an
ou
tcro
p w
ith
fo
ur
ho
rizo
nta
l lay
ers.
La
bel
th
e la
yers
1 t
hro
ug
h 4
.
2.
Dra
w a
ver
tica
l in
tru
sio
n f
rom
laye
r 1
to la
yer
3.
3.
Lab
el t
he
bo
tto
m-l
eft
corn
er o
f th
e d
iag
ram
Xan
d t
he
top
-rig
ht
corn
er Y
.
4.
Cu
t th
e p
aper
dia
go
nal
ly f
rom
Xto
Y. M
ove
th
e le
ft-h
and
pie
ce 1
.5 c
mal
on
g t
he
cut.
An
aly
ze a
nd
Co
ncl
ud
e
1.
Ho
w c
an y
ou
det
erm
ine
the
rela
tive
ag
es o
f th
e st
rata
in y
ou
r d
iag
ram
?
Use
th
e p
rin
cip
les
of
sup
erp
osi
tio
n, c
ross
-cu
ttin
g r
elat
ion
ship
s, a
nd
ori
gin
al
ho
rizo
nta
lity
to d
eter
min
e th
e re
lati
ve a
ges
.
2.
Ho
w d
oes
th
e p
rin
cip
le o
f cr
oss
-cu
ttin
g r
elat
ion
ship
s ex
pla
in t
he
age
of
the
vert
ical
intr
usi
on
?
Bec
ause
th
e in
tru
sio
n c
uts
acr
oss
laye
rs 1
, 2, a
nd
3, b
ut
no
t la
yer
4, it
is o
lder
than
laye
r 4
and
yo
un
ger
th
an la
yers
1, 2
, an
d 3
.
3.
Wh
at d
oes
lin
e X
Y r
epre
sen
t? Is
lin
e X
Y o
lder
or
you
ng
er t
han
th
eve
rtic
al in
tru
sio
n a
nd
su
rro
un
din
g s
trat
a? E
xpla
in.
Lin
e X
Y o
n t
he
mo
del
rep
rese
nts
a f
ault
. It
is t
he
you
ng
est
feat
ure
bec
ause
it c
uts
acr
oss
all
oth
er la
yers
.
Min
iLab
21
Min
iLab
21
Cop
yrig
ht ©
Gle
ncoe
/McG
raw
-Hill
, a d
ivis
ion
of t
he M
cGra
w-H
ill C
ompa
nies
, Inc
.
T172 Answer Pages Earth Science: Geology, the Environment, and the Universe Chapter Assessment
Nam
eC
lass
Dat
e
82
Cha
pter
20
Eart
h S
cien
ce:
Geo
logy
, th
e En
viro
nmen
t, a
nd t
he U
nive
rse
Geo
Lab
and
Min
iLab
Wor
kshe
ets
Mak
ing
a M
ap P
rofi
le
1.
Des
crib
e h
ow t
he
map
pro
file
ch
ange
s w
ith
dis
tan
ce f
rom
poi
nt
A.
Elev
atio
n s
tead
ily in
crea
ses
un
til S
tati
c Pe
ak is
en
cou
nte
red
. Ele
vati
on
th
en
dec
reas
es.
2.
Wh
at is
th
e el
evat
ion
of
the
hig
hes
t po
int
on t
he
map
pro
file
? T
he
low
est
poin
t?
Stat
ic P
eak
is 1
1 30
3′h
igh
. Th
e Pa
tro
l Cab
in is
at
7840
′.
3.
Wh
at is
th
e av
erag
e el
evat
ion
sh
own
in t
he
prof
ile?
The
aver
age
elev
atio
n a
lon
g t
he
pro
file
is a
bo
ut
9600
′.
4.
Cal
cula
te t
he
tota
l rel
ief
show
n in
th
e pr
ofile
.
11 3
03′�
7840
′�34
63′
AN
AL
YZ
E
1.
Is y
our
map
pro
file
a s
cale
mod
el o
fth
e to
pogr
aphy
alo
ng
line
AA
'? E
xpla
in.
No
; th
e ve
rtic
al a
nd
ho
rizo
nta
l sca
les
are
dif
fere
nt,
an
d t
her
efo
re t
he
pro
file
is n
ot
to s
cale
.
2.
Wh
at d
eter
min
ed t
he
scal
e of
this
map
pro
file
?
The
ho
rizo
nta
l sca
le w
as d
eter
min
ed b
y th
e sc
ale
of
the
map
. Th
e ve
rtic
al s
cale
was
ch
ose
n t
o c
orr
esp
on
d t
o t
he
tota
l rel
ief
of
the
area
in q
ues
tio
n.
3.
Why
are
map
pro
file
s m
ade
from
top
ogra
phic
map
s of
ten
exa
gger
ated
ver
tica
lly?
In r
ealit
y, t
he
relie
f o
f Ea
rth
’s s
urf
ace
is v
ery
smal
l wh
en c
om
par
ed t
o t
he
ho
rizo
nta
l
dis
tan
ces.
Ver
tica
l exa
gg
erat
ion
is u
sed
to
mak
e d
etai
ls m
ore
ob
vio
us.
CO
NC
LU
DE
AN
D A
PP
LY
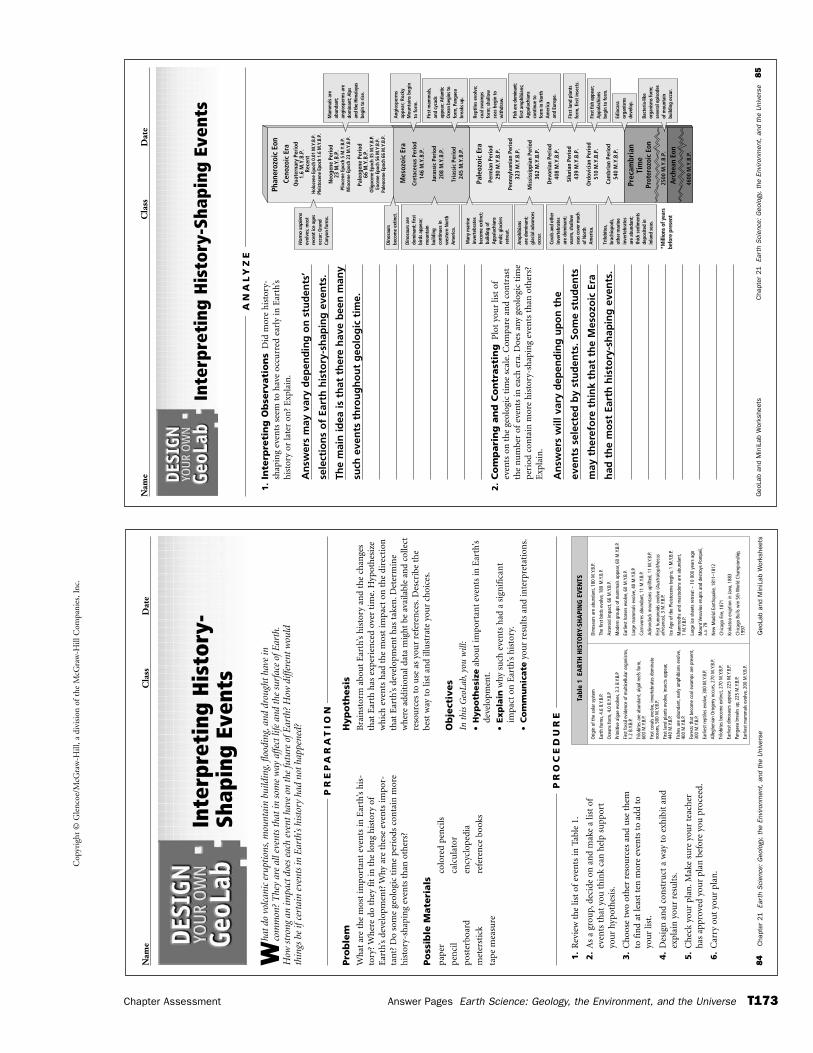
Cop
yrig
ht ©
Gle
ncoe
/McG
raw
-Hill
, a d
ivis
ion
of t
he M
cGra
w-H
ill C
ompa
nies
, Inc
.
Chapter Assessment Answer Pages Earth Science: Geology, the Environment, and the Universe T173
84
Cha
pter
21
Eart
h S
cien
ce:
Geo
logy
, th
e En
viro
nmen
t, a
nd t
he U
nive
rse
Geo
Lab
and
Min
iLab
Wor
kshe
ets
Nam
eC
lass
Dat
e
Wha
t do
vol
cani
c er
upti
ons,
mou
ntai
n bu
ildin
g,flo
odin
g,an
d dr
ough
t ha
ve in
com
mon
? T
hey
are
all e
vent
s th
at in
som
e w
ay a
ffect
life
and
the
sur
face
ofE
arth
.H
ow s
tron
g an
impa
ct d
oes
each
eve
nt h
ave
on t
he fu
ture
ofE
arth
? H
ow d
iffer
ent
wou
ldth
ings
be
ifce
rtai
n ev
ents
in E
arth
’s hi
stor
y ha
d no
t ha
ppen
ed?
Pro
ble
mW
hat
are
th
e m
ost
impo
rtan
t ev
ents
in E
arth
’s h
is-
tory
? W
her
e do
th
ey f
it in
th
e lo
ng
his
tory
of
Ear
th’s
dev
elop
men
t? W
hy a
re t
hes
e ev
ents
impo
r-ta
nt?
Do
som
e ge
olog
ic t
ime
peri
ods
con
tain
mor
eh
isto
ry-s
hap
ing
even
ts t
han
oth
ers?
Po
ssib
le M
ate
rials
pape
rco
lore
d pe
nci
ls
pen
cil
calc
ula
tor
post
erbo
ard
ency
clop
edia
met
erst
ick
refe
ren
ce b
ooks
tape
mea
sure
Hyp
oth
esi
sB
rain
stor
m a
bou
t E
arth
’s h
isto
ry a
nd
the
chan
ges
that
Ear
th h
as e
xper
ien
ced
over
tim
e.H
ypot
hes
ize
wh
ich
eve
nts
had
th
e m
ost
impa
ct o
n t
he
dire
ctio
nth
at E
arth
’s d
evel
opm
ent
has
tak
en.D
eter
min
ew
here
add
itio
nal
dat
a m
ight
be
avai
labl
e an
d co
llect
reso
urc
es t
o u
se a
s yo
ur
refe
ren
ces.
Des
crib
e th
ebe
st w
ay t
o lis
t an
d ill
ust
rate
you
r ch
oice
s.
Ob
ject
ives
In t
his
Geo
Lab,
you
will
:
•H
yp
oth
esi
zeab
out
impo
rtan
t ev
ents
in E
arth
’sde
velo
pmen
t.
•Exp
lain
why
su
ch e
ven
ts h
ad a
sig
nif
ican
tim
pact
on
Ear
th’s
his
tory
.
•C
om
mu
nic
ate
you
r re
sult
s an
d in
terp
reta
tion
s.
Inte
rpre
ting
His
tory
-Sh
apin
g Ev
ents
PR
EP
AR
AT
ION
1.
Rev
iew
th
e lis
t of
even
ts in
Tab
le 1
.
2.
As
a gr
oup,
deci
de o
n a
nd
mak
e a
list
ofev
ents
th
at y
ou t
hin
k ca
n h
elp
supp
ort
you
r hy
poth
esis
.
3.
Ch
oose
tw
o ot
her
res
ourc
es a
nd
use
th
em
to f
ind
at le
ast
ten
mor
e ev
ents
to
add
to
you
r lis
t.
4.
Des
ign
an
d co
nst
ruct
a w
ay t
o ex
hib
it a
nd
expl
ain
you
r re
sult
s.
5.
Ch
eck
you
r pl
an.M
ake
sure
you
r te
ach
er
has
app
rove
d yo
ur
plan
bef
ore
you
pro
ceed
.
6.
Car
ry o
ut
you
r pl
an.
PR
OC
ED
UR
E
Tabl
e 1
EART
H H
ISTO
RY-S
HA
PIN
G E
VEN
TS
Orig
in o
f the
sol
ar s
yste
m
Eart
h fo
rms,
4.6
B.Y.
B.P.
Oce
ans
form
,4.0
B.Y
.B.P
Prim
itive
alg
ae e
volv
es,3
.3 B
.Y.B
.P
Firs
t fos
sil e
vide
nce
of m
ultic
ellu
lar o
rgan
ism
s,1.
2 B.
Y.B.
P.
Trilo
bite
s ar
e ab
unda
nt,a
lgal
reef
s fo
rm,
600
M.Y
.B.P
.
Firs
t cor
als
evol
ve,i
nver
tebr
ates
dom
inat
e oc
eans
,500
M.Y
.B.P
.
Firs
t lan
d pl
ants
evo
lve,
inse
cts
appe
ar,
440
M.Y
.B.P
.
Fish
es a
re a
bund
ant,
early
am
phib
ians
evo
lve,
400
M.Y
.B.P
.
Fore
sts
that
bec
ome
coal
sw
amps
are
pre
sent
,30
0 M
.Y.B
.P.
Earli
est r
eptil
es e
volv
e,30
0 M
.Y.B
.P.
Alle
ghen
ian
Oro
geny
occ
urs,
270
M.Y
.B.P
.
Trilo
bite
s be
com
e ex
tinct
,270
M.Y
.B.P
.
Earli
est d
inos
aurs
app
ear,
225
M.Y
.B.P
.
Pang
aea
brea
ks u
p,22
5 M
.Y.B
.P.
Earli
est m
amm
als
evol
ve,2
00 M
.Y.B
.P.
Dino
saur
s ar
e ab
unda
nt,1
80 M
.Y.B
.P.
The
first
bird
s ev
olve
,180
M.Y
.B.P
.
Aste
roid
impa
ct,6
6 M
.Y.B
.P.
Mod
ern
grou
ps o
f mam
mal
s ap
pear
,60
M.Y
.B.P
.
Earli
est h
orse
s ev
olve
,60
M.Y
.B.P
.
Larg
e m
amm
als
evol
ve,4
0 M
.Y.B
.P.
Carn
ivor
es a
bund
ant,
11 M
.Y.B
.P.
Adiro
ndac
k m
ount
ains
upl
ifted
,11
M.Y
.B.P
.
Firs
t hum
anoi
ds e
volv
e ( A
ustr
alop
ithec
usaf
rican
us),
3 M
.Y.B
.P.
Ice
Age
of th
e Pl
eist
ocen
e be
gins
,1 M
.Y.B
.P.
Mam
mot
hs a
nd m
asto
dons
are
abu
ndan
t,1
M.Y
.B.P
.
Larg
e ic
e sh
eets
retr
eat ~
10
000
year
s ag
o
Mou
nt V
esuv
ius
erup
ts a
nd d
estr
oys
Pom
peii,
A.D.
79
New
Mad
rid E
arth
quak
e,18
11–1
812
Chic
ago
Fire
,187
1
Krak
atoa
eru
ptio
n in
Java
,188
3
Chic
ago
Bulls
win
5th
Wor
ld C
ham
pion
ship
,19
97
Nam
eC
lass
Dat
e
Geo
Lab
and
Min
iLab
Wor
kshe
ets
Cha
pter
21
Eart
h S
cien
ce:
Geo
logy
, th
e En
viro
nmen
t, a
nd t
he U
nive
rse
85
Inte
rpre
ting
His
tory
-Sha
ping
Eve
nts
1.
Inte
rpre
tin
g O
bse
rvati
on
sD
id m
ore
his
tory
-sh
apin
g ev
ents
see
m t
o h
ave
occu
rred
ear
ly in
Ear
th’s
his
tory
or
late
r on
? E
xpla
in.
An
swer
s m
ay v
ary
dep
end
ing
on
stu
den
ts’
sele
ctio
ns
of
Eart
h h
isto
ry-s
hap
ing
eve
nts
.
The
mai
n id
ea is
th
at t
her
e h
ave
bee
n m
any
such
eve
nts
th
rou
gh
ou
t g
eolo
gic
tim
e.
2.
Co
mp
ari
ng
an
d C
on
trast
ing
Plo
t yo
ur
list
ofev
ents
on
th
e ge
olog
ic t
ime
scal
e.C
ompa
re a
nd
con
tras
tth
e n
um
ber
ofev
ents
in e
ach
era
.Doe
s an
yge
olog
ic t
ime
peri
od c
onta
in m
ore
his
tory
-sh
apin
g ev
ents
th
an o
ther
s?E
xpla
in.
An
swer
s w
ill v
ary
dep
end
ing
up
on
th
e
even
ts s
elec
ted
by
stu
den
ts. S
om
e st
ud
ents
may
th
eref
ore
th
ink
that
th
e M
eso
zoic
Era
had
th
e m
ost
Ear
th h
isto
ry-s
hap
ing
eve
nts
.
AN
AL
YZ
E
*Mill
ions
of y
ears
befo
re p
rese
nt
4600
M.Y
.B.P
.
2500
M.Y
.B.P
.
Cret
aceo
us P
erio
d14
6 M
.Y.B
.P.
Jura
ssic
Per
iod
208
M.Y
.B.P
.
Tria
ssic
Per
iod
245
M.Y
.B.P
.
Qua
tern
ary
Peri
od1.
6 M
.Y.B
.P.
Rece
ntHo
loce
ne E
poch
0.0
1 M
.Y.B
.P.
Plei
stoc
ene
Epoc
h 1.
6 M
.Y.B
.P.
Neo
gene
Per
iod
23 M
.Y.B
.P.
Plio
cene
Epo
ch 5
M.Y
.B.P
.M
ioce
ne E
poch
23
M.Y
.B.P
.
Pale
ogen
e Pe
riod
66
M.Y
.B.P
.O
ligoc
ene
Epoc
h 35
M.Y
.B.P
.Eo
cene
Epo
ch 5
6 M
.Y.B
.P.
Pale
ocen
e Ep
och
66 M
.Y.B
.P.
Perm
ian
Peri
od29
0 M
.Y.B
.P.
Penn
sylv
ania
n Pe
riod
323
M.Y
.B.P
.
Mis
siss
ippi
an P
erio
d 36
2 M
.Y.B
.P.
Dev
onia
n Pe
riod
408
M.Y
.B.P
.
Silu
rian
Per
iod
439
M.Y
.B.P
.
Ord
ovic
ian
Peri
od51
0 M
.Y.B
.P.
Cam
bria
n Pe
riod
540
M.Y
.B.P
.
Ceno
zoic
Era
Pale
ozoi
c Er
a
Prec
ambr
ian
Tim
e
Mes
ozoi
c Er
a
Phan
eroz
oic
Eon
Prot
eroz
oic
Eon
Arc
hean
Eon
Mam
mal
s ar
eab
unda
nt;
angi
ospe
rms
are
dom
inan
t; Al
psan
d th
e Hi
mal
ayas
begi
n to
rise
.
Hom
o sa
pien
sev
olve
s; m
ost
rece
nt ic
e ag
esoc
cur;
Gra
ndCa
nyon
form
s.
Man
y m
arin
ein
vert
ebra
tes
beco
me
extin
ct;
build
ing
ofAp
pala
chia
nsen
ds; g
laci
ers
retr
eat.
Amph
ibia
nsar
e do
min
ant;
glac
ial a
dvan
ces
occu
r.
Cora
ls an
d ot
her
inve
rteb
rate
sar
e do
min
ant;
war
m, s
hallo
wse
as c
over
muc
hof
Nor
thAm
eric
a.
Trilo
bite
s,br
achi
opod
s,ot
her m
arin
ein
vert
ebra
tes
are
abun
dant
;th
ick
sedi
men
tsde
posi
ted
inin
land
sea
s.
Din
osau
rs a
redo
min
ant;
first
bird
s ap
pear
;m
ount
ain
build
ing
cont
inue
s in
wes
tern
Nor
thAm
eric
a.
Din
osau
rsbe
com
e ex
tinct
.A
ngio
sper
ms
appe
ar; R
ocky
Mou
ntai
ns b
egin
to fo
rm.
Firs
t mam
mal
s,an
d cy
cads
ap
pear
; Atla
ntic
Oce
an b
egin
s to
form
, Pan
gaea
brea
ks u
p.
Rept
iles
evol
ve;
coal
sw
amps
form
; sha
llow
seas
beg
in to
with
draw
.
Fish
are
dom
inan
t; fir
st a
mph
ibia
ns;
Appa
lach
ians
co
ntin
ue to
fo
rm in
Nor
th
Amer
ica
and
Euro
pe.
Firs
t lan
d pl
ants
form
, firs
t ins
ects
.
Firs
t fis
h ap
pear
; Ap
pala
chia
nsbe
gin
to fo
rm.
Edia
cara
orga
nism
sde
velo
p.
Bact
eria
-like
orga
nism
s fo
rm;
seve
ral e
piso
des
of m
ount
ain
build
ing
occu
r.
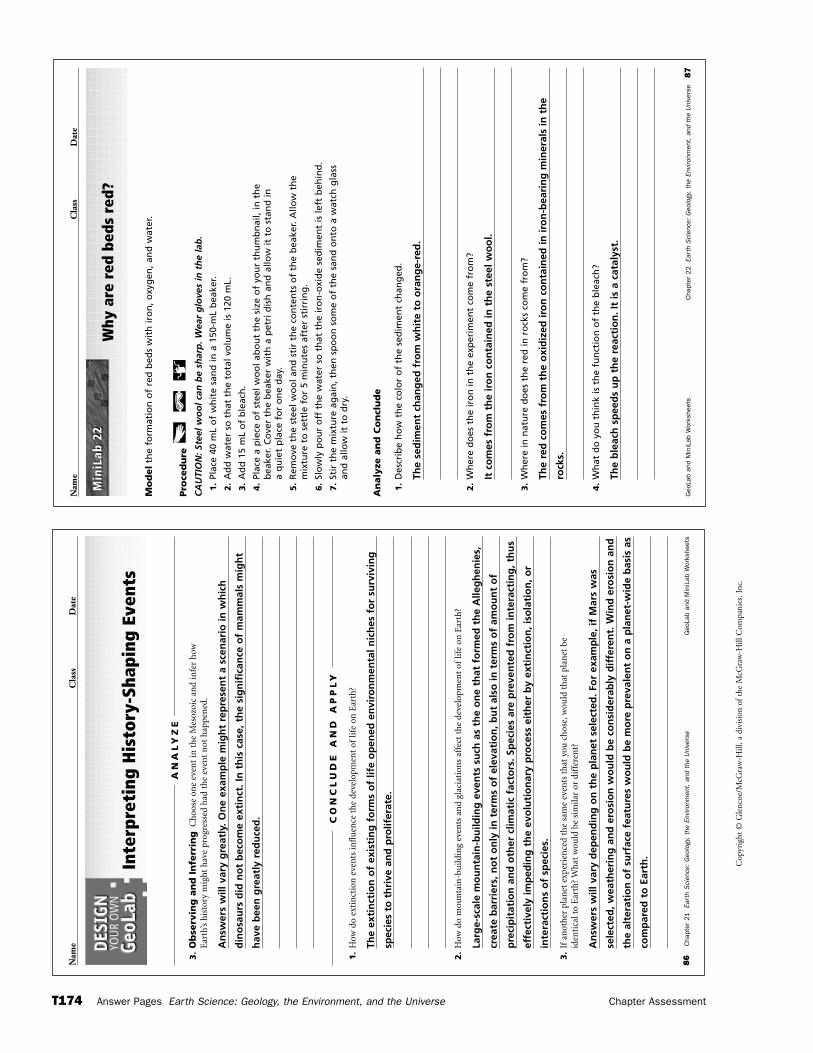
Geo
Lab
and
Min
iLab
Wor
kshe
ets
Cha
pter
22
Eart
h S
cien
ce:
Geo
logy
, th
e En
viro
nmen
t, a
nd t
he U
nive
rse
87
Nam
eC
lass
Dat
e
Why
are
red
bed
s re
d?
Mo
del
the
form
atio
n o
f re
d b
eds
wit
h ir
on
, oxy
gen
, an
d w
ater
.
Pro
ced
ure
CA
UTI
ON
: Ste
el w
oo
l can
be
shar
p. W
ear
glo
ves
in t
he
lab
.
1.
Plac
e 40
mL
of
wh
ite
san
d in
a 1
50-m
L b
eake
r.
2.
Ad
d w
ater
so
th
at t
he
tota
l vo
lum
e is
120
mL.
3.
Ad
d 1
5 m
L o
f b
leac
h.
4.
Plac
e a
pie
ce o
f st
eel w
oo
l ab
ou
t th
e si
ze o
f yo
ur
thu
mb
nai
l, in
th
eb
eake
r. C
ove
r th
e b
eake
r w
ith
a p
etri
dis
h a
nd
allo
w it
to
sta
nd
in
a q
uie
t p
lace
fo
r o
ne
day
.
5.
Rem
ove
th
e st
eel w
oo
l an
d s
tir
the
con
ten
ts o
f th
e b
eake
r. A
llow
th
em
ixtu
re t
o s
ettl
e fo
r 5
min
ute
s af
ter
stir
rin
g.
6.
Slo
wly
po
ur
off
th
e w
ater
so
th
at t
he
iro
n-o
xid
e se
dim
ent
is le
ft b
ehin
d.
7.
Stir
th
e m
ixtu
re a
gai
n, t
hen
sp
oo
n s
om
e o
f th
e sa
nd
on
to a
wat
ch g
lass
and
allo
w it
to
dry
.
An
aly
ze a
nd
Co
ncl
ud
e
1.
Des
crib
e h
ow
th
e co
lor
of
the
sed
imen
t ch
ang
ed.
The
sed
imen
t ch
ang
ed f
rom
wh
ite
to o
ran
ge-
red
.
2.
Wh
ere
do
es t
he
iro
n in
th
e ex
per
imen
t co
me
fro
m?
It c
om
es f
rom
th
e ir
on
co
nta
ined
in t
he
stee
l wo
ol.
3.
Wh
ere
in n
atu
re d
oes
th
e re
d in
ro
cks
com
e fr
om
?
The
red
co
mes
fro
m t
he
oxi
diz
ed ir
on
co
nta
ined
in ir
on
-bea
rin
g m
iner
als
in t
he
rock
s.
4.
Wh
at d
o y
ou
th
ink
is t
he
fun
ctio
n o
f th
e b
leac
h?
The
ble
ach
sp
eed
s u
p t
he
reac
tio
n. I
t is
a c
atal
yst.
Min
iLab
22
Min
iLab
22
Cop
yrig
ht ©
Gle
ncoe
/McG
raw
-Hill
, a d
ivis
ion
of t
he M
cGra
w-H
ill C
ompa
nies
, Inc
.
T174 Answer Pages Earth Science: Geology, the Environment, and the Universe Chapter Assessment
Nam
eC
lass
Dat
e
86
Cha
pter
21
Eart
h S
cien
ce:
Geo
logy
, th
e En
viro
nmen
t, a
nd t
he U
nive
rse
Geo
Lab
and
Min
iLab
Wor
kshe
ets
Inte
rpre
ting
His
tory
-Sha
ping
Eve
nts
1.
How
do
exti
nct
ion
eve
nts
infl
uen
ce t
he
deve
lopm
ent
oflif
e on
Ear
th?
The
exti
nct
ion
of
exis
tin
g f
orm
s o
f lif
e o
pen
ed e
nvi
ron
men
tal n
ich
es f
or
surv
ivin
g
spec
ies
to t
hri
ve a
nd
pro
lifer
ate.
2.
How
do
mou
nta
in-b
uild
ing
even
ts a
nd
glac
iati
ons
affe
ct t
he
deve
lopm
ent
oflif
e on
Ear
th?
Larg
e-sc
ale
mo
un
tain
-bu
ildin
g e
ven
ts s
uch
as
the
on
e th
at f
orm
ed t
he
Alle
gh
enie
s,
crea
te b
arri
ers,
no
t o
nly
in t
erm
s o
f el
evat
ion
, bu
t al
so in
ter
ms
of
amo
un
t o
f
pre
cip
itat
ion
an
d o
ther
clim
atic
fac
tors
. Sp
ecie
s ar
e p
reve
nte
d f
rom
inte
ract
ing
, th
us
effe
ctiv
ely
imp
edin
g t
he
evo
luti
on
ary
pro
cess
eit
her
by
exti
nct
ion
, iso
lati
on
, or
inte
ract
ion
s o
f sp
ecie
s.
3.
Ifan
oth
er p
lan
et e
xper
ien
ced
the
sam
e ev
ents
th
at y
ou c
hos
e,w
ould
th
at p
lan
et b
eid
enti
cal t
o E
arth
? W
hat
wou
ld b
e si
mila
r or
dif
fere
nt?
An
swer
s w
ill v
ary
dep
end
ing
on
th
e p
lan
et s
elec
ted
. Fo
r ex
amp
le, i
f M
ars
was
sele
cted
, wea
ther
ing
an
d e
rosi
on
wo
uld
be
con
sid
erab
ly d
iffe
ren
t. W
ind
ero
sio
n a
nd
the
alte
rati
on
of
surf
ace
feat
ure
s w
ou
ld b
e m
ore
pre
vale
nt
on
a p
lan
et-w
ide
bas
is a
s
com
par
ed t
o E
arth
.
CO
NC
LU
DE
AN
D A
PP
LY
AN
AL
YZ
E
3.
Ob
serv
ing
an
d I
nfe
rrin
gC
hoo
se o
ne
even
t in
th
eM
esoz
oic
and
infe
r h
owE
arth
’s h
isto
ry m
igh
t h
ave
prog
ress
ed h
ad t
he
even
t n
ot h
appe
ned
.
An
swer
s w
ill v
ary
gre
atly
. On
e ex
amp
le m
igh
t re
pre
sen
t a
scen
ario
in w
hic
h
din
osa
urs
did
no
t b
eco
me
exti
nct
. In
th
is c
ase,
th
e si
gn
ific
ance
of
mam
mal
s m
igh
t
hav
e b
een
gre
atly
red
uce
d.
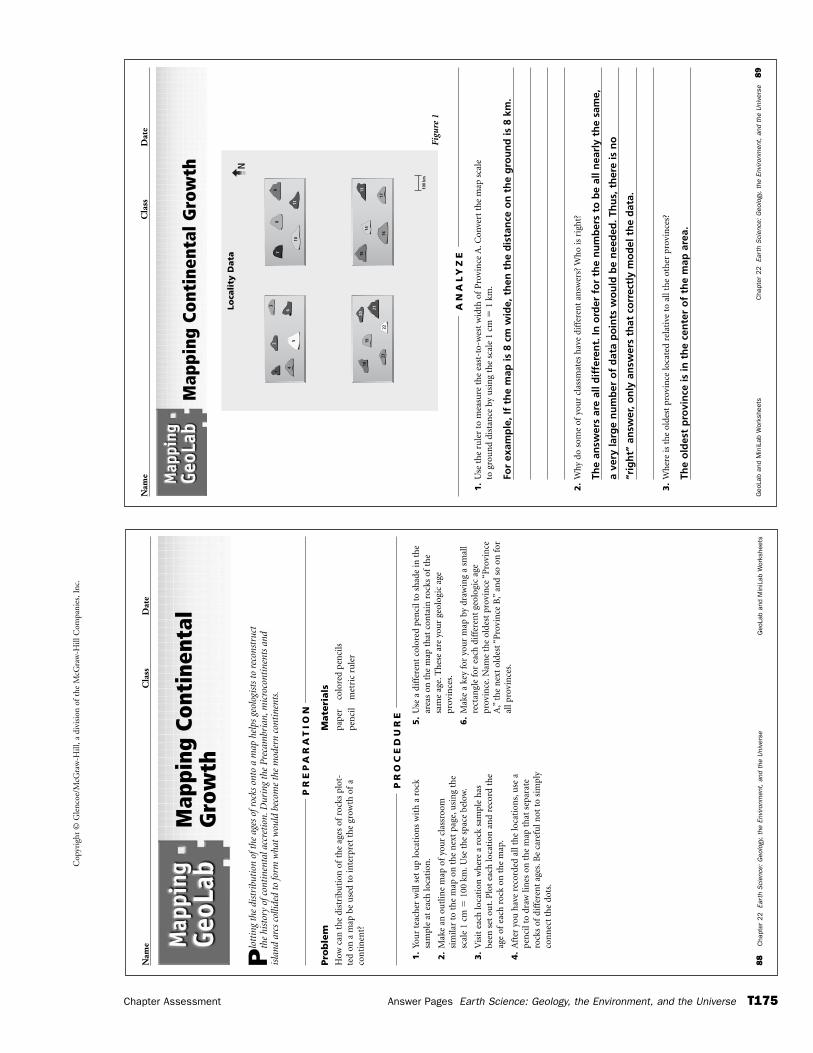
Cop
yrig
ht ©
Gle
ncoe
/McG
raw
-Hill
, a d
ivis
ion
of t
he M
cGra
w-H
ill C
ompa
nies
, Inc
.
Chapter Assessment Answer Pages Earth Science: Geology, the Environment, and the Universe T175
88
Cha
pter
22
Eart
h S
cien
ce:
Geo
logy
, th
e En
viro
nmen
t, a
nd t
he U
nive
rse
Geo
Lab
and
Min
iLab
Wor
kshe
ets
Nam
eC
lass
Dat
e
Plo
ttin
g th
e di
stri
buti
on o
fthe
age
s of
rock
s on
to a
map
hel
ps g
eolo
gist
s to
rec
onst
ruct
the
hist
ory
ofco
ntin
enta
l acc
reti
on.D
urin
g th
e P
reca
mbr
ian,
mic
roco
ntin
ents
and
isla
nd a
rcs
colli
ded
to fo
rm w
hat
wou
ld b
ecom
e th
e m
oder
n co
ntin
ents
.
Pro
ble
mH
ow c
an t
he
dist
ribu
tion
of
the
ages
of
rock
s pl
ot-
ted
on a
map
be
use
d to
inte
rpre
t th
e gr
owth
of
aco
nti
nen
t?
Mate
rials
pape
rco
lore
d pe
nci
ls
pen
cil
met
ric
rule
r
Map
ping
Con
tine
ntal
Gro
wth
PR
EP
AR
AT
ION
1.
You
r te
ach
er w
ill s
et u
p lo
cati
ons
wit
h a
roc
ksa
mpl
e at
eac
h lo
cati
on.
2.
Mak
e an
ou
tlin
e m
ap o
fyo
ur
clas
sroo
msi
mila
r to
th
e m
ap o
n t
he
nex
t pa
ge,u
sin
g th
esc
ale
1 cm
�10
0 km
.Use
th
e sp
ace
belo
w.
3.
Vis
it e
ach
loca
tion
wh
ere
a ro
ck s
ampl
e h
asbe
en s
et o
ut.
Plo
t ea
ch lo
cati
on a
nd
reco
rd t
he
age
ofea
ch r
ock
on t
he
map
.
4.
Aft
er y
ou h
ave
reco
rded
all
the
loca
tion
s,u
se a
pen
cil t
o dr
aw li
nes
on
th
e m
ap t
hat
sep
arat
ero
cks
ofdi
ffer
ent
ages
.Be
care
ful n
ot t
o si
mpl
yco
nn
ect
the
dots
.
5.
Use
a d
iffe
ren
t co
lore
d pe
nci
l to
shad
e in
th
ear
eas
on t
he
map
th
at c
onta
in r
ocks
of
the
sam
e ag
e.T
hes
e ar
e yo
ur
geol
ogic
age
prov
ince
s.
6.
Mak
e a
key
for
you
r m
ap b
y dr
awin
g a
smal
lre
ctan
gle
for
each
dif
fere
nt
geol
ogic
age
prov
ince
.Nam
e th
e ol
dest
pro
vin
ce “
Pro
vin
ceA
,”th
e n
ext
olde
st “
Pro
vin
ce B
,”an
d so
on
for
all p
rovi
nce
s.
PR
OC
ED
UR
E
Nam
eC
lass
Dat
e
Geo
Lab
and
Min
iLab
Wor
kshe
ets
Cha
pter
22
Eart
h S
cien
ce:
Geo
logy
, th
e En
viro
nmen
t, a
nd t
he U
nive
rse
89
Map
ping
Con
tine
ntal
Gro
wth
1.
Use
th
e ru
ler
to m
easu
re t
he
east
-to-
wes
t w
idth
of
Pro
vin
ce A
.Con
vert
th
e m
ap s
cale
to g
rou
nd
dist
ance
by
usi
ng
the
scal
e 1
cm �
1 km
.
For
exam
ple
, If
the
map
is 8
cm
wid
e, t
hen
th
e d
ista
nce
on
th
e g
rou
nd
is 8
km
.
2.
Why
do
som
e of
you
r cl
assm
ates
hav
e di
ffer
ent
answ
ers?
Wh
o is
rig
ht?
The
answ
ers
are
all d
iffe
ren
t. In
ord
er f
or
the
nu
mb
ers
to b
e al
l nea
rly
the
sam
e,
a ve
ry la
rge
nu
mb
er o
f d
ata
po
ints
wo
uld
be
nee
ded
. Th
us,
th
ere
is n
o
“rig
ht”
an
swer
, on
ly a
nsw
ers
that
co
rrec
tly
mo
del
th
e d
ata.
3.
Wh
ere
is t
he
olde
st p
rovi
nce
loca
ted
rela
tive
to
all t
he
oth
er p
rovi
nce
s?
The
old
est
pro
vin
ce is
in t
he
cen
ter
of
the
map
are
a.
AN
AL
YZ
E
12
3
45
6
7
10
8
11
9
18
2322
19
20
21
1514
13
1716
100
km
NLo
cali
ty D
ata
Figu
re 1
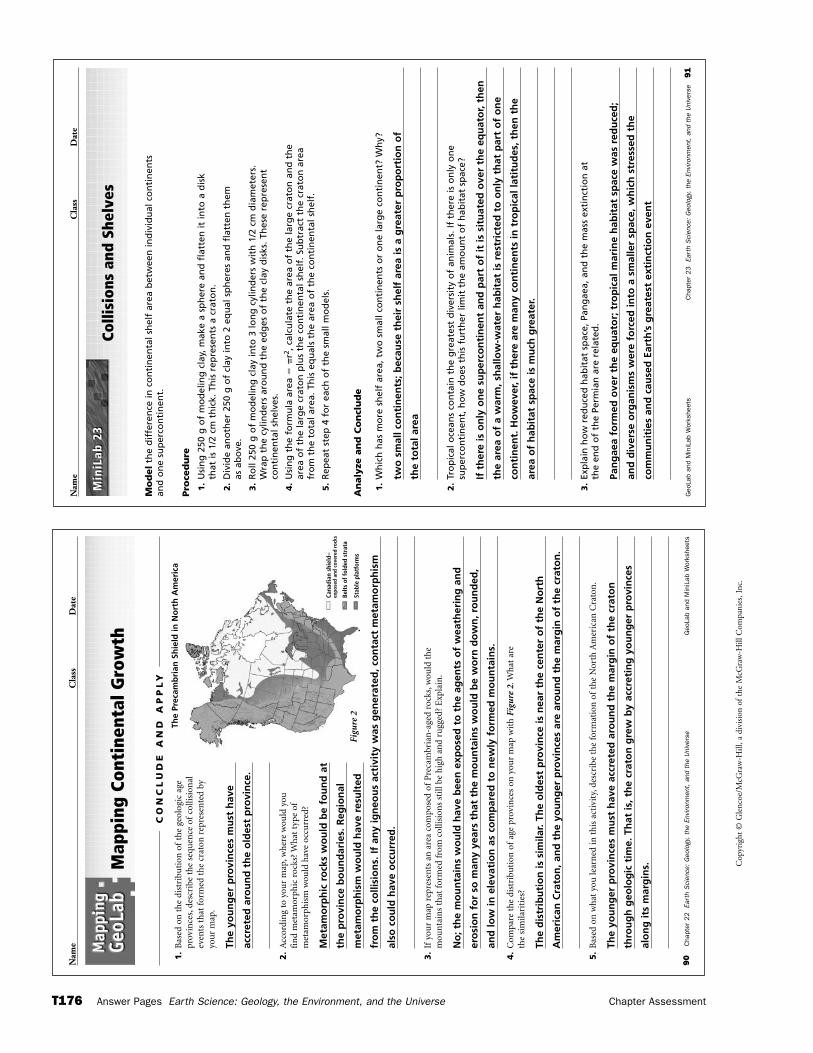
Geo
Lab
and
Min
iLab
Wor
kshe
ets
Cha
pter
23
Eart
h S
cien
ce:
Geo
logy
, th
e En
viro
nmen
t, a
nd t
he U
nive
rse
91
Nam
eC
lass
Dat
e
Colli
sion
s an
d Sh
elve
s
Mo
del
the
dif
fere
nce
in c
on
tin
enta
l sh
elf
area
bet
wee
n in
div
idu
al c
on
tin
ents
an
d o
ne
sup
erco
nti
nen
t.
Pro
ced
ure
1.
Usi
ng
250
g o
f m
od
elin
g c
lay,
mak
e a
sph
ere
and
fla
tten
it in
to a
dis
kth
at is
1/2
cm
th
ick.
Th
is r
epre
sen
ts a
cra
ton
.
2.
Div
ide
ano
ther
250
g o
f cl
ay in
to 2
eq
ual
sp
her
es a
nd
fla
tten
th
em
as a
bo
ve.
3.
Ro
ll 25
0 g
of
mo
del
ing
cla
y in
to 3
lon
g c
ylin
der
s w
ith
1/2
cm
dia
met
ers.
Wra
p t
he
cylin
der
s ar
ou
nd
th
e ed
ges
of
the
clay
dis
ks. T
hes
e re
pre
sen
tco
nti
nen
tal s
hel
ves.
4.
Usi
ng
th
e fo
rmu
la a
rea
��
r2, c
alcu
late
th
e ar
ea o
f th
e la
rge
crat
on
an
d t
he
area
of
the
larg
e cr
ato
n p
lus
the
con
tin
enta
l sh
elf.
Su
btr
act
the
crat
on
are
afr
om
th
e to
tal a
rea.
Th
is e
qu
als
the
area
of
the
con
tin
enta
l sh
elf.
5.
Rep
eat
step
4 f
or
each
of
the
smal
l mo
del
s.
An
aly
ze a
nd
Co
ncl
ud
e
1.
Wh
ich
has
mo
re s
hel
f ar
ea, t
wo
sm
all c
on
tin
ents
or
on
e la
rge
con
tin
ent?
Wh
y?
two
sm
all c
on
tin
ents
; bec
ause
th
eir
shel
f ar
ea is
a g
reat
er p
rop
ort
ion
of
the
tota
l are
a
2.
Tro
pic
al o
cean
s co
nta
in t
he
gre
ates
t d
iver
sity
of
anim
als.
If t
her
e is
on
ly o
ne
sup
erco
nti
nen
t, h
ow
do
es t
his
fu
rth
er li
mit
th
e am
ou
nt
of
hab
itat
sp
ace?
If t
her
e is
on
ly o
ne
sup
erco
nti
nen
t an
d p
art
of
it is
sit
uat
ed o
ver
the
equ
ato
r, th
en
the
area
of
a w
arm
, sh
allo
w-w
ater
hab
itat
is r
estr
icte
d t
o o
nly
th
at p
art
of
on
e
con
tin
ent.
Ho
wev
er, i
f th
ere
are
man
y co
nti
nen
ts in
tro
pic
al la
titu
des
, th
en t
he
area
of
hab
itat
sp
ace
is m
uch
gre
ater
.
3.
Exp
lain
ho
w r
edu
ced
hab
itat
sp
ace,
Pan
gae
a, a
nd
th
e m
ass
exti
nct
ion
at
the
end
of
the
Perm
ian
are
rel
ated
.
Pan
gae
a fo
rmed
ove
r th
e eq
uat
or;
tro
pic
al m
arin
e h
abit
at s
pac
e w
as r
edu
ced
;
and
div
erse
org
anis
ms
wer
e fo
rced
into
a s
mal
ler
spac
e, w
hic
h s
tres
sed
th
e
com
mu
nit
ies
and
cau
sed
Ear
th’s
gre
ates
t ex
tin
ctio
n e
ven
t
Min
iLab
23
Min
iLab
23
Cop
yrig
ht ©
Gle
ncoe
/McG
raw
-Hill
, a d
ivis
ion
of t
he M
cGra
w-H
ill C
ompa
nies
, Inc
.
T176 Answer Pages Earth Science: Geology, the Environment, and the Universe Chapter Assessment
Nam
eC
lass
Dat
e
90
Cha
pter
22
Eart
h S
cien
ce:
Geo
logy
, th
e En
viro
nmen
t, a
nd t
he U
nive
rse
Geo
Lab
and
Min
iLab
Wor
kshe
ets
Map
ping
Con
tine
ntal
Gro
wth
1.
Bas
ed o
n t
he
dist
ribu
tion
of
the
geol
ogic
age
prov
ince
s,de
scri
be t
he
sequ
ence
of
colli
sion
alev
ents
th
at f
orm
ed t
he
crat
on r
epre
sen
ted
byyo
ur
map
.
The
you
ng
er p
rovi
nce
s m
ust
hav
e
accr
eted
aro
un
d t
he
old
est
pro
vin
ce.
2.
Acc
ordi
ng
to y
our
map
,wh
ere
wou
ld y
ou
fin
d m
etam
orph
ic r
ocks
? W
hat
typ
e of
met
amor
phis
m w
ould
hav
e oc
curr
ed?
Met
amo
rph
ic r
ock
s w
ou
ld b
e fo
un
d a
t
the
pro
vin
ce b
ou
nd
arie
s. R
egio
nal
met
amo
rph
ism
wo
uld
hav
e re
sult
ed
fro
m t
he
colli
sio
ns.
If a
ny
ign
eou
s ac
tivi
ty w
as g
ener
ated
, co
nta
ct m
etam
orp
his
m
also
co
uld
hav
e o
ccu
rred
.
3.
Ifyo
ur
map
rep
rese
nts
an
are
a co
mpo
sed
ofP
reca
mbr
ian
-age
d ro
cks,
wou
ld t
he
mou
nta
ins
that
for
med
fro
m c
ollis
ion
s st
ill b
e h
igh
an
d ru
gged
? E
xpla
in.
No
; th
e m
ou
nta
ins
wo
uld
hav
e b
een
exp
ose
d t
o t
he
agen
ts o
f w
eath
erin
g a
nd
ero
sio
n f
or
so m
any
year
s th
at t
he
mo
un
tain
s w
ou
ld b
e w
orn
do
wn
, ro
un
ded
,
and
low
in e
leva
tio
n a
s co
mp
ared
to
new
ly f
orm
ed m
ou
nta
ins.
4.
Com
pare
th
e di
stri
buti
on o
fag
e pr
ovin
ces
on y
our
map
wit
h F
igu
re 2
.Wh
at a
re
the
sim
ilari
ties
?
The
dis
trib
uti
on
is s
imila
r. Th
e o
ldes
t p
rovi
nce
is n
ear
the
cen
ter
of
the
No
rth
Am
eric
an C
rato
n, a
nd
th
e yo
un
ger
pro
vin
ces
are
aro
un
d t
he
mar
gin
of
the
crat
on
.
5.
Bas
ed o
n w
hat
you
lear
ned
in t
his
act
ivit
y,de
scri
be t
he
form
atio
n o
fth
e N
orth
Am
eric
an C
rato
n.
The
you
ng
er p
rovi
nce
s m
ust
hav
e ac
cret
ed a
rou
nd
th
e m
arg
in o
f th
e cr
ato
n
thro
ug
h g
eolo
gic
tim
e. T
hat
is, t
he
crat
on
gre
w b
y ac
cret
ing
yo
un
ger
pro
vin
ces
alo
ng
its
mar
gin
s.
CO
NC
LU
DE
AN
D A
PP
LY
Cana
dian
shi
eld–
expo
sed
and
cove
red
rock
s
Belt
s of
fold
ed s
trat
a
Stab
le p
latf
orm
s
The
Prec
amb
rian
Sh
ield
in N
ort
h A
mer
ica
Figu
re 2
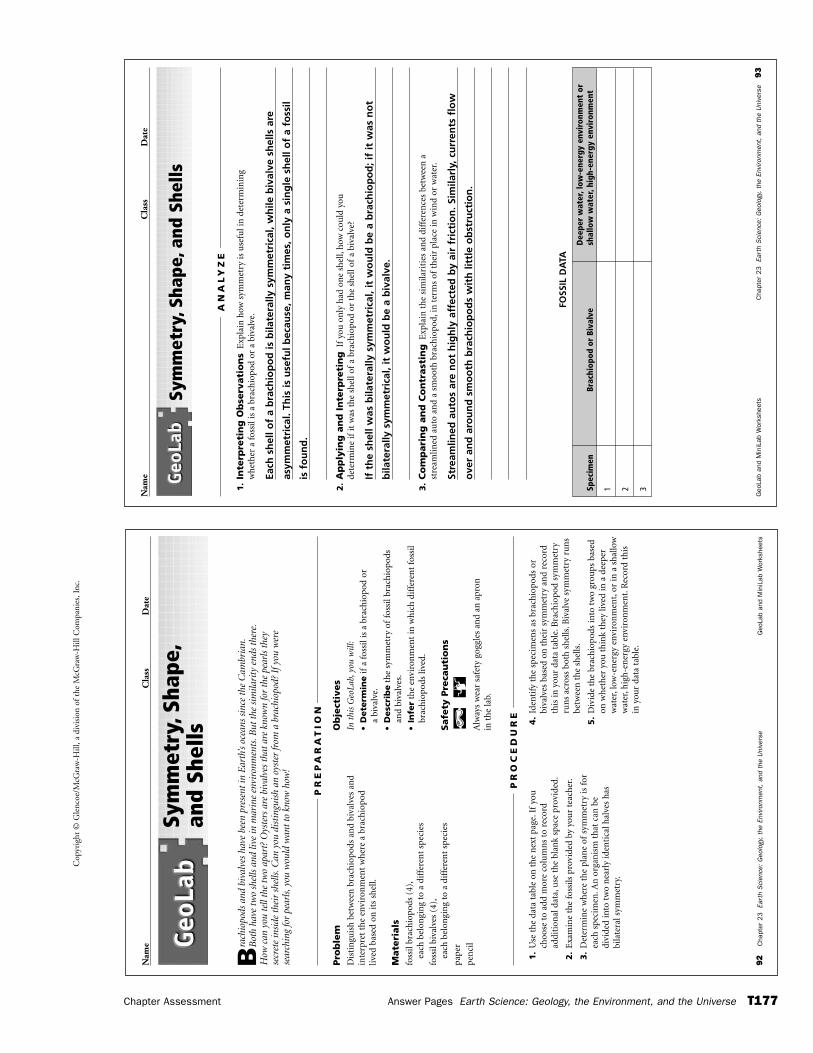
Cop
yrig
ht ©
Gle
ncoe
/McG
raw
-Hill
, a d
ivis
ion
of t
he M
cGra
w-H
ill C
ompa
nies
, Inc
.
Chapter Assessment Answer Pages Earth Science: Geology, the Environment, and the Universe T177
92
Cha
pter
23
Eart
h S
cien
ce:
Geo
logy
, th
e En
viro
nmen
t, a
nd t
he U
nive
rse
Geo
Lab
and
Min
iLab
Wor
kshe
ets
Nam
eC
lass
Dat
e
Bra
chio
pods
and
biv
alve
s ha
ve b
een
pres
ent
in E
arth
’s oc
eans
sin
ce t
he C
ambr
ian.
Bot
h ha
ve t
wo
shel
ls a
nd li
ve in
mar
ine
envi
ronm
ents
.But
the
sim
ilari
ty e
nds
ther
e.H
ow c
an y
ou t
ell t
he t
wo
apar
t? O
yste
rs a
re b
ival
ves
that
are
kno
wn
for
the
pear
ls t
hey
secr
ete
insi
de t
heir
she
lls.C
an y
ou d
isti
ngui
sh a
n oy
ster
from
a b
rach
iopo
d? I
fyou
wer
ese
arch
ing
for
pear
ls,y
ou w
ould
wan
t to
kno
w h
ow!
Pro
ble
mD
isti
ngu
ish
bet
wee
n b
rach
iopo
ds a
nd
biva
lves
an
din
terp
ret
the
envi
ron
men
t w
her
e a
brac
hio
pod
lived
bas
ed o
n it
s sh
ell.
Mate
rials
foss
il br
ach
iopo
ds (
4),
each
bel
ongi
ng
to a
dif
fere
nt
spec
ies
foss
il bi
valv
es (
4),
each
bel
ongi
ng
to a
dif
fere
nt
spec
ies
pape
r
pen
cil
Ob
ject
ives
In t
his
Geo
Lab,
you
will
:
•D
ete
rmin
eif
a fo
ssil
is a
bra
chio
pod
ora
biva
lve.
•D
esc
rib
eth
e sy
mm
etry
of
foss
il br
ach
iopo
ds
and
biva
lves
.
•In
fer
the
envi
ron
men
t in
wh
ich
dif
fere
nt
foss
ilbr
ach
iopo
ds li
ved.
Safe
ty P
reca
uti
on
s
Alw
ays
wea
r sa
fety
gog
gles
an
d an
apr
on
in t
he
lab.
Sym
met
ry,S
hape
,an
d Sh
ells
PR
EP
AR
AT
ION
1.
Use
th
e da
ta t
able
on
th
e n
ext
page
.If
you
choo
se t
o ad
d m
ore
colu
mn
s to
rec
ord
addi
tion
al d
ata,
use
th
e bl
ank
spac
e pr
ovid
ed.
2.
Exa
min
e th
e fo
ssils
pro
vide
d by
you
r te
ach
er.
3.
Det
erm
ine
wh
ere
the
plan
e of
sym
met
ry is
for
each
spe
cim
en.A
n o
rgan
ism
th
at c
an b
edi
vide
d in
to t
wo
nea
rly
iden
tica
l hal
ves
has
bila
tera
l sym
met
ry.
4.
Iden
tify
th
e sp
ecim
ens
as b
rach
iopo
ds o
rbi
valv
es b
ased
on
th
eir
sym
met
ry a
nd
reco
rdth
is in
you
r da
ta t
able
.Bra
chio
pod
sym
met
ryru
ns
acro
ss b
oth
sh
ells
.Biv
alve
sym
met
ry r
un
sbe
twee
n t
he
shel
ls.
5.
Div
ide
the
brac
hio
pods
into
tw
o gr
oups
bas
edon
wh
eth
er y
ou t
hin
k th
ey li
ved
in a
dee
per
wat
er,l
ow-e
ner
gy e
nvir
onm
ent,
or in
a s
hal
low
wat
er,h
igh
-en
ergy
env
iron
men
t.R
ecor
d th
isin
you
r da
ta t
able
.
PR
OC
ED
UR
E
Nam
eC
lass
Dat
e
Geo
Lab
and
Min
iLab
Wor
kshe
ets
Cha
pter
23
Eart
h S
cien
ce:
Geo
logy
, th
e En
viro
nmen
t, a
nd t
he U
nive
rse
93
Sym
met
ry,S
hape
,and
She
lls
1.
Inte
rpre
tin
g O
bse
rvati
on
sE
xpla
in h
ow s
ymm
etry
is u
sefu
l in
det
erm
inin
gw
het
her
afo
ssil
is a
bra
chio
pod
or a
biv
alve
.
Each
sh
ell o
f a
bra
chio
po
d is
bila
tera
lly s
ymm
etri
cal,
wh
ile b
ival
ve s
hel
ls a
re
asym
met
rica
l. Th
is is
use
ful b
ecau
se, m
any
tim
es, o
nly
a s
ing
le s
hel
l of
a fo
ssil
is f
ou
nd
.
2.
Ap
ply
ing
an
d I
nte
rpre
tin
gIf
you
on
ly h
ad o
ne
shel
l,h
ow c
ould
you
dete
rmin
e if
it w
as t
he
shel
l of
a br
ach
iopo
d or
th
e sh
ell o
fa
biva
lve?
If t
he
shel
l was
bila
tera
lly s
ymm
etri
cal,
it w
ou
ld b
e a
bra
chio
po
d; i
f it
was
no
t
bila
tera
lly s
ymm
etri
cal,
it w
ou
ld b
e a
biv
alve
.
3.
Co
mp
ari
ng
an
d C
on
trast
ing
Exp
lain
th
e si
mila
riti
es a
nd
diff
eren
ces
betw
een
ast
ream
lined
au
to a
nd
a sm
ooth
bra
chio
pod,
in t
erm
s of
thei
r pl
ace
in w
ind
or w
ater
.
Stre
amlin
ed a
uto
s ar
e n
ot
hig
hly
aff
ecte
d b
y ai
r fr
icti
on
. Sim
ilarl
y, c
urr
ents
flo
w
ove
r an
d a
rou
nd
sm
oo
th b
rach
iop
od
s w
ith
litt
le o
bst
ruct
ion
.
AN
AL
YZ
E
Dee
per
wat
er,l
ow-e
nerg
y en
viro
nmen
t or
Sp
ecim
enBr
achi
opod
or
Biva
lve
shal
low
wat
er,h
igh-
ener
gy e
nvir
onm
ent
1 2 3
FOSS
IL D
ATA
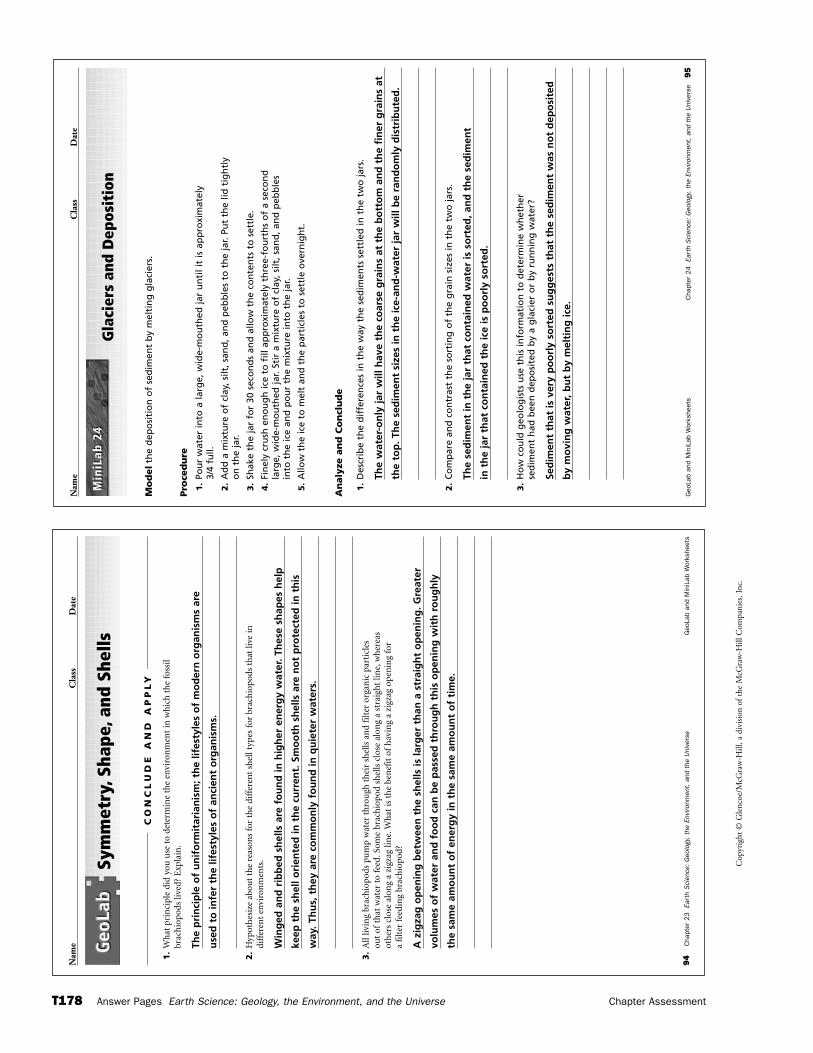
Geo
Lab
and
Min
iLab
Wor
kshe
ets
Cha
pter
24
Eart
h S
cien
ce:
Geo
logy
, th
e En
viro
nmen
t, a
nd t
he U
nive
rse
95
Nam
eC
lass
Dat
e
Gla
cier
s an
d D
epos
itio
n
Mo
del
the
dep
osi
tio
n o
f se
dim
ent
by
mel
tin
g g
laci
ers.
Pro
ced
ure
1.
Pou
r w
ater
into
a la
rge,
wid
e-m
ou
thed
jar
un
til i
t is
ap
pro
xim
atel
y 3/
4 fu
ll.
2.
Ad
d a
mix
ture
of
clay
, silt
, san
d, a
nd
peb
ble
s to
th
e ja
r. Pu
t th
e lid
tig
htl
yo
n t
he
jar.
3.
Shak
e th
e ja
r fo
r 30
sec
on
ds
and
allo
w t
he
con
ten
ts t
o s
ettl
e.
4.
Fin
ely
cru
sh e
no
ug
h ic
e to
fill
ap
pro
xim
atel
y th
ree-
fou
rth
s o
f a
seco
nd
larg
e, w
ide-
mo
uth
ed ja
r. St
ir a
mix
ture
of
clay
, silt
, san
d, a
nd
peb
ble
s in
to t
he
ice
and
po
ur
the
mix
ture
into
th
e ja
r.
5.
Allo
w t
he
ice
to m
elt
and
th
e p
arti
cles
to
set
tle
ove
rnig
ht.
An
aly
ze a
nd
Co
ncl
ud
e
1.
Des
crib
e th
e d
iffe
ren
ces
in t
he
way
th
e se
dim
ents
set
tled
in t
he
two
jars
.
The
wat
er-o
nly
jar
will
hav
e th
e co
arse
gra
ins
at t
he
bo
tto
m a
nd
th
e fi
ner
gra
ins
at
the
top
. Th
e se
dim
ent
size
s in
th
e ic
e-an
d-w
ater
jar
will
be
ran
do
mly
dis
trib
ute
d.
2.
Co
mp
are
and
co
ntr
ast
the
sort
ing
of
the
gra
in s
izes
in t
he
two
jars
.
The
sed
imen
t in
th
e ja
r th
at c
on
tain
ed w
ater
is s
ort
ed, a
nd
th
e se
dim
ent
in t
he
jar
that
co
nta
ined
th
e ic
e is
po
orl
y so
rted
.
3.
Ho
w c
ou
ld g
eolo
gis
ts u
se t
his
info
rmat
ion
to
det
erm
ine
wh
eth
erse
dim
ent
had
bee
n d
epo
site
d b
y a
gla
cier
or
by
run
nin
g w
ater
?
Sed
imen
t th
at is
ver
y p
oo
rly
sort
ed s
ug
ges
ts t
hat
th
e se
dim
ent
was
no
t d
epo
site
d
by
mo
vin
g w
ater
, bu
t b
y m
elti
ng
ice.
Min
iLab
24
Min
iLab
24
Cop
yrig
ht ©
Gle
ncoe
/McG
raw
-Hill
, a d
ivis
ion
of t
he M
cGra
w-H
ill C
ompa
nies
, Inc
.
T178 Answer Pages Earth Science: Geology, the Environment, and the Universe Chapter Assessment
Nam
eC
lass
Dat
e
94
Cha
pter
23
Eart
h S
cien
ce:
Geo
logy
, th
e En
viro
nmen
t, a
nd t
he U
nive
rse
Geo
Lab
and
Min
iLab
Wor
kshe
ets
Sym
met
ry,S
hape
,and
She
lls
1.
Wh
at p
rin
cipl
e di
d yo
u u
se t
o de
term
ine
the
envi
ron
men
t in
wh
ich
th
e fo
ssil
brac
hio
pods
live
d? E
xpla
in.
The
pri
nci
ple
of
un
ifo
rmit
aria
nis
m; t
he
lifes
tyle
s o
f m
od
ern
org
anis
ms
are
use
d t
o in
fer
the
lifes
tyle
s o
f an
cien
t o
rgan
ism
s.
2.
Hyp
oth
esiz
e ab
out
the
reas
ons
for
the
diff
eren
t sh
ell t
ypes
for
bra
chio
pods
th
at li
ve in
diff
eren
t en
viro
nm
ents
.
Win
ged
an
d r
ibb
ed s
hel
ls a
re f
ou
nd
in h
igh
er e
ner
gy
wat
er. T
hes
e sh
apes
hel
p
keep
th
e sh
ell o
rien
ted
in t
he
curr
ent.
Sm
oo
th s
hel
ls a
re n
ot
pro
tect
ed in
th
is
way
. Th
us,
th
ey a
re c
om
mo
nly
fo
un
d in
qu
iete
r w
ater
s.
3.
All
livin
g br
ach
iopo
ds p
um
p w
ater
th
rou
gh t
hei
r sh
ells
an
d fi
lter
org
anic
par
ticl
esou
tof
that
wat
er t
o fe
ed.S
ome
brac
hio
pod
shel
ls c
lose
alo
ng
a st
raig
ht
line,
wh
erea
sot
her
s cl
ose
alon
g a
zigz
ag li
ne.
Wh
at is
th
e be
nef
it o
fh
avin
g a
zigz
ag o
pen
ing
for
afi
lter
fee
din
g br
ach
iopo
d?
A z
igza
g o
pen
ing
bet
wee
n t
he
shel
ls is
larg
er t
han
a s
trai
gh
t o
pen
ing
. Gre
ater
volu
mes
of
wat
er a
nd
fo
od
can
be
pas
sed
th
rou
gh
th
is o
pen
ing
wit
h r
ou
gh
ly
the
sam
e am
ou
nt
of
ener
gy
in t
he
sam
e am
ou
nt
of
tim
e.
CO
NC
LU
DE
AN
D A
PP
LY
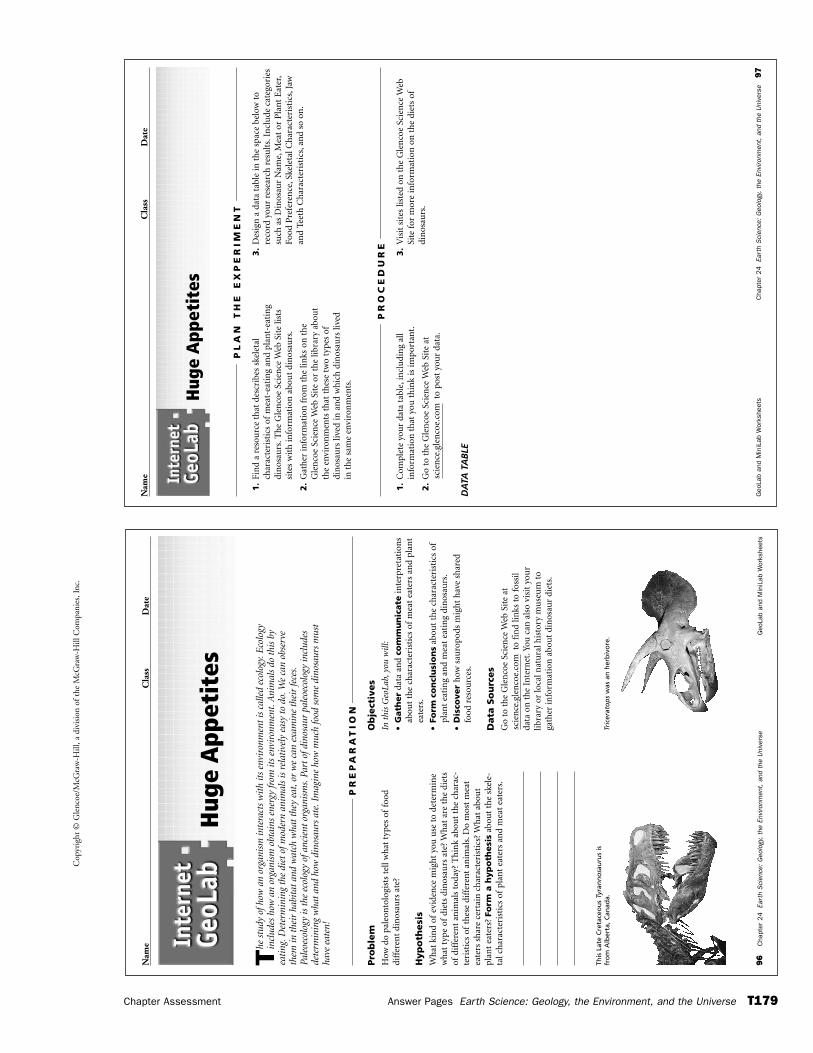
Cop
yrig
ht ©
Gle
ncoe
/McG
raw
-Hill
, a d
ivis
ion
of t
he M
cGra
w-H
ill C
ompa
nies
, Inc
.
Chapter Assessment Answer Pages Earth Science: Geology, the Environment, and the Universe T179
96
Cha
pter
24
Eart
h S
cien
ce:
Geo
logy
, th
e En
viro
nmen
t, a
nd t
he U
nive
rse
Geo
Lab
and
Min
iLab
Wor
kshe
ets
Nam
eC
lass
Dat
e
The
stu
dy o
fhow
an
orga
nism
inte
ract
s w
ith
its
envi
ronm
ent
is c
alle
d ec
olog
y.E
colo
gyin
clud
es h
ow a
n or
gani
sm o
btai
ns e
nerg
y fr
om it
s en
viro
nmen
t.A
nim
als
do t
his
byea
ting
.Det
erm
inin
g th
e di
et o
fmod
ern
anim
als
is r
elat
ivel
y ea
sy t
o do
.We
can
obse
rve
them
in t
heir
hab
itat
and
wat
ch w
hat
they
eat
,or
we
can
exam
ine
thei
r fe
ces.
Pale
oeco
logy
is t
he e
colo
gy o
fanc
ient
org
anis
ms.
Part
ofd
inos
aur
pale
oeco
logy
incl
udes
dete
rmin
ing
wha
t an
d ho
w d
inos
aurs
ate
.Im
agin
e ho
w m
uch
food
som
e di
nosa
urs
mus
tha
ve e
aten
!
Pro
ble
mH
ow d
o pa
leon
tolo
gist
s te
ll w
hat
typ
es o
ffo
od
diff
eren
t di
nos
aurs
ate
?
Hyp
oth
esi
sW
hat
kin
d of
evid
ence
mig
ht
you
use
to
dete
rmin
ew
hat
typ
e of
diet
s di
nos
aurs
ate
? W
hat
are
th
e di
ets
ofdi
ffer
ent
anim
als
toda
y? T
hin
k ab
out
the
char
ac-
teri
stic
s of
thes
e di
ffer
ent
anim
als.
Do
mos
t m
eat
eate
rs s
har
e ce
rtai
n c
har
acte
rist
ics?
Wh
at a
bou
tpl
ant
eate
rs?
Form
a h
yp
oth
esi
sab
out
the
skel
e-ta
l ch
arac
teri
stic
s of
plan
t ea
ters
an
d m
eat
eate
rs.
Ob
ject
ives
In t
his
Geo
Lab,
you
will
:
•G
ath
er
data
an
d co
mm
un
icate
inte
rpre
tati
ons
abou
t th
e ch
arac
teri
stic
s of
mea
t ea
ters
an
d pl
ant
eate
rs.
•Fo
rmco
ncl
usi
on
sab
out
the
char
acte
rist
ics
ofpl
ant
eati
ng
and
mea
t ea
tin
g di
nos
aurs
.
•D
isco
ver
how
sau
ropo
ds m
igh
t h
ave
shar
edfo
od r
esou
rces
.
Data
So
urc
es
Go
to t
he
Gle
nco
e Sc
ien
ce W
eb S
ite
at
to f
ind
links
to
foss
il da
ta o
n t
he
Inte
rnet
.You
can
als
o vi
sit
you
r lib
rary
or
loca
l nat
ura
l his
tory
mu
seu
m t
o ga
ther
info
rmat
ion
abo
ut
din
osau
r di
ets.
scie
nce
.gle
nco
e.co
m
Hug
e A
ppet
ites
PR
EP
AR
AT
ION
This
Lat
e C
reta
ceo
us
Tyra
nn
osa
uru
sis
fro
m A
lber
ta, C
anad
a.Tr
icer
ato
ps
was
an
her
biv
ore
.
Nam
eC
lass
Dat
e
Geo
Lab
and
Min
iLab
Wor
kshe
ets
Cha
pter
24
Eart
h S
cien
ce:
Geo
logy
, th
e En
viro
nmen
t, a
nd t
he U
nive
rse
97
Hug
e A
ppet
ites
1.
Fin
d a
reso
urc
e th
at d
escr
ibes
ske
leta
lch
arac
teri
stic
s of
mea
t-ea
tin
g an
d pl
ant-
eati
ng
din
osau
rs.T
he
Gle
nco
e Sc
ien
ce W
eb S
ite
lists
site
s w
ith
info
rmat
ion
abo
ut
din
osau
rs.
2.
Gat
her
info
rmat
ion
fro
m t
he
links
on
th
eG
len
coe
Scie
nce
Web
Sit
e or
th
e lib
rary
abo
ut
the
envi
ron
men
ts t
hat
th
ese
two
type
s of
din
osau
rs li
ved
in a
nd
wh
ich
din
osau
rs li
ved
in t
he
sam
e en
viro
nm
ents
.
3.
Des
ign
a d
ata
tabl
e in
th
e sp
ace
belo
w t
ore
cord
you
r re
sear
ch r
esu
lts.
Incl
ude
cat
egor
ies
such
as
Din
osau
r N
ame,
Mea
t or
Pla
nt
Eat
er,
Food
Pre
fere
nce
,Ske
leta
l Ch
arac
teri
stic
s,Ja
wan
d Te
eth
Ch
arac
teri
stic
s,an
d so
on
.
PL
AN
TH
E E
XP
ER
IME
NT
1.
Com
plet
e yo
ur
data
tab
le,i
ncl
udi
ng
all
info
rmat
ion
th
at y
ou t
hin
k is
impo
rtan
t.
2.
Go
to t
he
Gle
nco
e Sc
ien
ce W
eb S
ite
atto
pos
t yo
ur
data
.
3.
Vis
it s
ites
list
ed o
n t
he
Gle
nco
e Sc
ien
ce W
ebSi
te f
or m
ore
info
rmat
ion
on
th
e di
ets
ofdi
nos
aurs
.
scie
nce
.gle
nco
e.co
m
PR
OC
ED
UR
E
DA
TATA
BLE
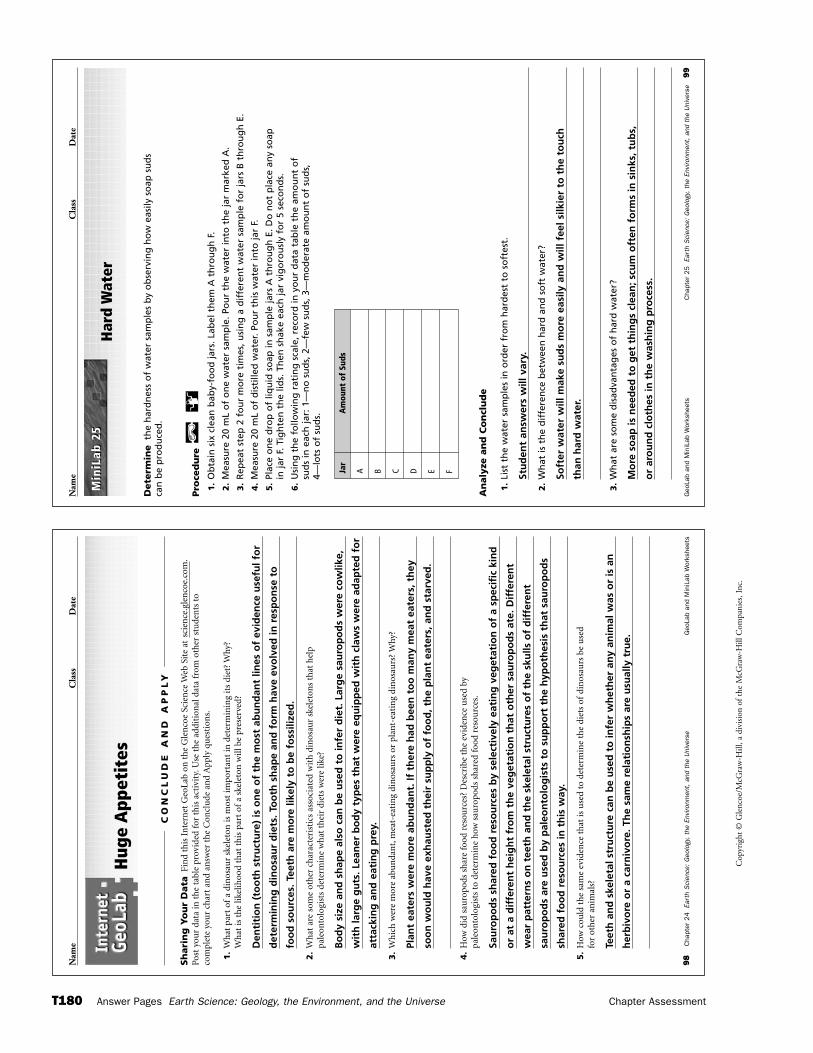
Cop
yrig
ht ©
Gle
ncoe
/McG
raw
-Hill
, a d
ivis
ion
of t
he M
cGra
w-H
ill C
ompa
nies
, Inc
.
T180 Answer Pages Earth Science: Geology, the Environment, and the Universe Chapter Assessment
Nam
eC
lass
Dat
e
98
Cha
pter
24
Eart
h S
cien
ce:
Geo
logy
, th
e En
viro
nmen
t, a
nd t
he U
nive
rse
Geo
Lab
and
Min
iLab
Wor
kshe
ets
Hug
e A
ppet
ites
Sh
ari
ng
Yo
ur
Data
Fin
d th
is I
nte
rnet
Geo
Lab
on t
he
Gle
nco
e Sc
ien
ce W
eb S
ite
at
Post
you
r da
ta in
th
e ta
ble
prov
ided
for
th
is a
ctiv
ity.
Use
th
e ad
diti
onal
dat
a fr
om o
ther
stu
den
ts t
o co
mpl
ete
you
r ch
art
and
answ
er t
he
Con
clu
de a
nd
App
ly q
ues
tion
s.
1.
Wh
at p
art
ofa
din
osau
r sk
elet
on is
mos
t im
port
ant
in d
eter
min
ing
its
diet
? W
hy?
Wh
at is
th
e lik
elih
ood
that
th
is p
art
ofa
skel
eton
will
be
pres
erve
d?
Den
titi
on
(to
oth
str
uct
ure
) is
on
e o
f th
e m
ost
ab
un
dan
t lin
es o
f ev
iden
ce u
sefu
l fo
r
det
erm
inin
g d
ino
sau
r d
iets
. To
oth
sh
ape
and
fo
rm h
ave
evo
lved
in r
esp
on
se t
o
foo
d s
ou
rces
. Tee
th a
re m
ore
like
ly t
o b
e fo
ssili
zed
.
2.
Wh
at a
re s
ome
oth
er c
har
acte
rist
ics
asso
ciat
ed w
ith
din
osau
r sk
elet
ons
that
hel
ppa
leon
tolo
gist
s de
term
ine
wh
at t
hei
r di
ets
wer
e lik
e?
Bo
dy
size
an
d s
hap
e al
so c
an b
e u
sed
to
infe
r d
iet.
Lar
ge
sau
rop
od
s w
ere
cow
like,
wit
h la
rge
gu
ts. L
ean
er b
od
y ty
pes
th
at w
ere
equ
ipp
ed w
ith
cla
ws
wer
e ad
apte
d f
or
atta
ckin
g a
nd
eat
ing
pre
y.
3.
Wh
ich
wer
e m
ore
abu
nda
nt,
mea
t-ea
tin
g di
nos
aurs
or
plan
t-ea
tin
g di
nos
aurs
? W
hy?
Plan
t ea
ters
wer
e m
ore
ab
un
dan
t. If
th
ere
had
bee
n t
oo
man
y m
eat
eate
rs, t
hey
soo
n w
ou
ld h
ave
exh
aust
ed t
hei
r su
pp
ly o
f fo
od
, th
e p
lan
t ea
ters
, an
d s
tarv
ed.
4.
How
did
sau
ropo
ds s
har
e fo
od r
esou
rces
? D
escr
ibe
the
evid
ence
use
d by
pale
onto
logi
sts
to d
eter
min
e h
ow s
auro
pods
sh
ared
foo
d re
sou
rces
.
Sau
rop
od
s sh
ared
fo
od
res
ou
rces
by
sele
ctiv
ely
eati
ng
veg
etat
ion
of
a sp
ecif
ic k
ind
or
at a
dif
fere
nt
hei
gh
t fr
om
th
e ve
get
atio
n t
hat
oth
er s
auro
po
ds
ate.
Dif
fere
nt
wea
r p
atte
rns
on
tee
th a
nd
th
e sk
elet
al s
tru
ctu
res
of
the
sku
lls o
f d
iffe
ren
t
sau
rop
od
s ar
e u
sed
by
pal
eon
tolo
gis
ts t
o s
up
po
rt t
he
hyp
oth
esis
th
at s
auro
po
ds
shar
ed f
oo
d r
eso
urc
es in
th
is w
ay.
5.
How
cou
ld t
he
sam
e ev
iden
ce t
hat
is u
sed
to d
eter
min
e th
e di
ets
ofdi
nos
aurs
be
use
dfo
r ot
her
an
imal
s?
Teet
h a
nd
ske
leta
l str
uct
ure
can
be
use
d t
o in
fer
wh
eth
er a
ny
anim
al w
as o
r is
an
her
biv
ore
or
a ca
rniv
ore
. Th
e sa
me
rela
tio
nsh
ips
are
usu
ally
tru
e.scie
nce
.gle
nco
e.co
m.
CO
NC
LU
DE
AN
D A
PP
LY
Geo
Lab
and
Min
iLab
Wor
kshe
ets
Cha
pter
25
Eart
h S
cien
ce:
Geo
logy
, th
e En
viro
nmen
t, a
nd t
he U
nive
rse
99
Nam
eC
lass
Dat
e
Har
d W
ater
Dete
rmin
eth
e h
ard
nes
s o
f w
ater
sam
ple
s b
y o
bse
rvin
g h
ow
eas
ily s
oap
su
ds
can
be
pro
du
ced
.
Pro
ced
ure
1.
Ob
tain
six
cle
an b
aby-
foo
d ja
rs. L
abel
th
em A
th
rou
gh
F.
2.
Mea
sure
20
mL
of
on
e w
ater
sam
ple
. Po
ur
the
wat
er in
to t
he
jar
mar
ked
A.
3.
Rep
eat
step
2 f
ou
r m
ore
tim
es, u
sin
g a
dif
fere
nt
wat
er s
amp
le f
or
jars
B t
hro
ug
h E
.
4.
Mea
sure
20
mL
of
dis
tille
d w
ater
. Po
ur
this
wat
er in
to ja
r F.
5.
Plac
e o
ne
dro
p o
f liq
uid
so
ap in
sam
ple
jars
A t
hro
ug
h E
. Do
no
t p
lace
an
y so
apin
jar
F. T
igh
ten
th
e lid
s. T
hen
sh
ake
each
jar
vig
oro
usl
y fo
r 5
seco
nd
s.
6.
Usi
ng
th
e fo
llow
ing
rat
ing
sca
le, r
eco
rd in
yo
ur
dat
a ta
ble
th
e am
ou
nt
of
sud
s in
eac
h ja
r: 1
—n
o s
ud
s, 2
—fe
w s
ud
s, 3
—m
od
erat
e am
ou
nt
of
sud
s,4—
lots
of
sud
s.
An
aly
ze a
nd
Co
ncl
ud
e
1.
List
th
e w
ater
sam
ple
s in
ord
er f
rom
har
des
t to
so
ftes
t.
Stu
den
t an
swer
s w
ill v
ary.
2.
Wh
at is
th
e d
iffe
ren
ce b
etw
een
har
d a
nd
so
ft w
ater
?
Soft
er w
ater
will
mak
e su
ds
mo
re e
asily
an
d w
ill f
eel s
ilkie
r to
th
e to
uch
than
har
d w
ater
.
3.
Wh
at a
re s
om
e d
isad
van
tag
es o
f h
ard
wat
er?
Mo
re s
oap
is n
eed
ed t
o g
et t
hin
gs
clea
n; s
cum
oft
en f
orm
s in
sin
ks, t
ub
s,
or
aro
un
d c
loth
es in
th
e w
ash
ing
pro
cess
.
Min
iLab
25
Min
iLab
25
Jar
Am
ount
of
Suds
A B C D E F
Cop
yrig
ht ©
Gle
ncoe
/McG
raw
-Hill
, a d
ivis
ion
of t
he M
cGra
w-H
ill C
ompa
nies
, Inc
.
Chapter Assessment Answer Pages Earth Science: Geology, the Environment, and the Universe T181
100
Cha
pter
25
Eart
h S
cien
ce:
Geo
logy
, th
e En
viro
nmen
t, a
nd t
he U
nive
rse
Geo
Lab
and
Min
iLab
Wor
kshe
ets
Nam
eC
lass
Dat
e
Mos
t of
Ear
th’s
surf
ace
is c
over
ed w
ith
salt
y oc
ean
wat
er.O
cean
wat
er c
an b
e us
edfo
r dr
inki
ng w
ater
and
oth
er p
urpo
ses
ifth
e sa
lts a
re fi
rst
rem
oved
.Sol
ar e
nerg
yca
n be
use
d to
eva
pora
te w
ater
from
sea
wat
er,l
eavi
ng t
he s
alts
beh
ind.
The
eva
pora
ted
wat
er c
an t
hen
be c
onde
nsed
into
fres
hwat
er.
Pro
ble
mH
ow c
an y
ou b
uild
a s
mal
l-sc
ale,
wor
kin
g so
lar
desa
linat
or?
Po
ssib
le M
ate
rials
clea
r pl
asti
c or
Ple
xigl
as
larg
e pa
ns
to h
old
wat
er
salt
wat
er
colle
ctin
g co
nta
iner
s
lam
p
glas
s pa
n o
r be
aker
hot
pla
te
Hyp
oth
esi
sT
he
Sun’
s en
ergy
can
be
colle
cted
to
desa
linat
e sa
lt w
ater
.
Ob
ject
ives
In t
his
Geo
Lab,
you
will
:
•D
esi
gn
a m
odel
of
a w
orki
ng
sola
r de
salin
ator
.
•A
ssem
ble
the
mod
el f
rom
des
ign
pla
ns.
•Te
stth
e ef
fect
iven
ess
ofth
e de
sign
mod
el.
•A
naly
zeth
e m
odel
to
sugg
est
poss
ible
im
prov
emen
ts.
Safe
ty P
reca
uti
on
s
Alw
ays
wea
r sa
fety
gog
gles
an
d an
apr
on in
th
e la
b.B
e ca
refu
l wh
en h
andl
ing
hot
mat
eria
ls.
Des
igni
ng a
Sol
arD
esal
inat
or
PR
EP
AR
AT
ION
Nam
eC
lass
Dat
e
Geo
Lab
and
Min
iLab
Wor
kshe
ets
Cha
pter
25
Eart
h S
cien
ce:
Geo
logy
, th
e En
viro
nmen
t, a
nd t
he U
nive
rse
101
Des
igni
ng a
Sol
ar D
esal
inat
or
1.
Use
th
e lib
rary
an
d go
to
to id
enti
fy d
esig
ns
ofso
lar
desa
linat
ors.
2.
Dra
w a
des
ign
for
you
r m
odel
des
alin
ator
belo
w.(
Hin
t:So
lar
ener
gy m
ust
be
colle
cted
inso
me
way
th
at a
llow
s su
nlig
ht
to e
nte
r an
dca
use
s an
incr
ease
in t
empe
ratu
re in
side
th
eco
nta
iner
so
that
wat
er in
sat
ura
ted
air
can
con
den
se a
nd
be c
olle
cted
.)
3.
Mak
e a
list
ofth
e m
ater
ials
you
will
nee
d,an
dth
en c
olle
ct t
hem
.
4.
Con
stru
ct t
he
desa
linat
or y
ou d
esig
ned
.
5.
Test
th
e de
salin
ator
by
reco
rdin
g h
ow lo
ng
itta
kes
to c
olle
ct t
he
puri
fied
wat
er a
nd
how
mu
ch w
ater
was
col
lect
ed.
6.
Test
th
e w
ater
to
see
ifit
has
bee
n p
uri
fied
by
boili
ng
the
wat
er a
way
.If
any
salt
rem
ain
s in
the
con
tain
er a
fter
th
e w
ater
has
eva
pora
ted,
you
r de
salin
ator
did
not
rem
ove
all o
fth
e sa
lts
from
th
e sa
lt w
ater
.
scie
nce
.gle
nco
e.co
m
PL
AN
TH
E E
XP
ER
IME
NT
1.
Inte
rpre
tin
g S
cien
tifi
c Il
lust
rati
on
sD
raw
th
e de
salin
ator
th
at y
ou c
onst
ruct
ed.
AN
AL
YZ
E
Mo
del
s sh
ou
ld b
e d
raw
n t
o s
cale
an
d b
e ac
com
pan
ied
by
a lis
t o
f m
ater
ials
use
d.
Geo
Lab
and
Min
iLab
Wor
kshe
ets
Cha
pter
26
Eart
h S
cien
ce:
Geo
logy
, th
e En
viro
nmen
t, a
nd t
he U
nive
rse
103
Nam
eC
lass
Dat
e
Oil
Mig
rati
on
Mo
del
the
mig
rati
on
of
oil
and
nat
ura
l gas
up
war
d t
hro
ug
h la
yers
of
po
rou
s ro
cks.
Pro
ced
ure
1.
Pou
r 20
mL
of
coo
kin
g o
il in
to a
100
-mL
gra
du
ated
cyl
ind
er.
2.
Car
efu
lly p
ou
r sa
nd
into
th
e g
rad
uat
ed c
ylin
der
un
til t
he
san
d-o
il m
ixtu
rere
ach
es t
he
40-m
L m
ark.
3.
No
w a
dd
a la
yer
of
colo
red
aq
uar
ium
gra
vel a
bo
ve t
he
san
d u
nti
l th
eg
rave
l rea
ches
th
e 70
-mL
mar
k.
4.
Pou
r ta
p w
ater
into
th
e g
rad
uat
ed c
ylin
der
un
til t
he
wat
er r
each
es t
he
100-
mL
mar
k.
5.
Let
stan
d a
nd
ob
serv
e fo
r 5
min
ute
s.
An
aly
ze a
nd
Co
ncl
ud
e
1.
Wh
at d
oes
th
e co
oki
ng
oil
rep
rese
nt?
Wh
at d
o t
he
san
d a
nd
aq
uar
ium
gra
vel r
epre
sen
t?
cru
de
oil;
laye
rs o
f ro
cks
and
th
eir
po
res
2.
Wh
at h
app
ens
wh
en w
ater
is a
dd
ed t
o t
he
mix
ture
in t
he
gra
du
ated
cylin
der
? W
hy
do
es a
dd
ing
wat
er c
ause
th
is c
han
ge?
The
oil
mo
ves
un
til i
t is
flo
atin
g o
n t
op
of
the
wat
er. I
t is
less
den
se t
han
wat
er.
3.
Pred
ict
wh
at m
igh
t o
ccu
r in
th
e g
rad
uat
ed c
ylin
der
if a
car
bo
nat
ed s
oft
dri
nk
was
ad
ded
to
th
e m
ixtu
re in
stea
d o
f w
ater
. Wh
at w
ou
ld t
he
bu
bb
les
rep
rese
nt?
Stu
den
ts m
ay p
red
ict
that
th
e b
ub
ble
s o
f th
e so
ft d
rin
k w
ill r
ise
to t
he
top
as
the
dri
nk
sin
ks t
o t
he
bo
tto
m o
f th
e cy
lind
er. T
he
bu
bb
les
in t
he
soft
dri
nk
rep
rese
nt
nat
ura
l gas
.
Min
iLab
26
Min
iLab
26
Cop
yrig
ht ©
Gle
ncoe
/McG
raw
-Hill
, a d
ivis
ion
of t
he M
cGra
w-H
ill C
ompa
nies
, Inc
.
T182 Answer Pages Earth Science: Geology, the Environment, and the Universe Chapter Assessment
Nam
eC
lass
Dat
e
102
Cha
pter
25
Eart
h S
cien
ce:
Geo
logy
, th
e En
viro
nmen
t, a
nd t
he U
nive
rse
Geo
Lab
and
Min
iLab
Wor
kshe
ets
Des
igni
ng a
Sol
ar D
esal
inat
or
1.
Wh
at f
acto
rs a
ffec
ted
the
effi
cien
cy o
fth
e de
salin
ator
?
Fact
ors
th
at c
an a
ffec
t a
des
alin
ato
r’s
effi
cien
cy m
ay in
clu
de
its
abili
ty t
o h
old
in
sola
r h
eat
and
th
e w
ater
-co
llect
ion
des
ign
.
2.
How
did
you
r so
lar
desa
linat
or’s
eff
icie
ncy
com
pare
wit
h t
he
effi
cien
cies
of
oth
er s
tude
nts
’mod
els?
An
swer
s w
ill v
ary.
3.
How
cou
ld y
ou im
prov
e yo
ur
desa
linat
or?
Poss
ible
su
gg
esti
on
s fo
r fu
ture
mo
del
s m
ay in
clu
de
mak
ing
it la
rger
or
insu
lati
ng
it b
ette
r.
4.
Wh
at c
oncl
usi
ons
cou
ld b
e dr
awn
fro
m y
our
inve
stig
atio
n r
egar
din
g th
e vi
abili
ty a
nd
use
of
sola
r-po
wer
ed d
esal
inat
ors?
Sola
r-p
ow
ered
des
alin
ato
rs m
ay b
e vi
able
in c
on
sist
entl
y su
nn
y lo
cati
on
s.
CO
NC
LU
DE
AN
D A
PP
LY
AN
AL
YZ
E
2.
Inte
rpre
tin
g O
bse
rvati
on
sH
ow w
ell d
id y
our
desa
linat
or w
ork?
On
wh
atcr
iter
ia d
id y
ou b
ase
the
effe
ctiv
enes
s of
you
r de
salin
ator
?
The
len
gth
of
tim
e n
eed
ed t
o c
olle
ct a
su
itab
le s
amp
le m
ay b
e th
e cr
iter
ion
use
d
to d
eter
min
e ef
fect
iven
ess.
Wat
er q
ual
ity
may
als
o b
e a
crit
erio
n.
3.
Ob
serv
ing
an
d I
nfe
rrin
gW
hat
pro
blem
s di
d yo
u e
nco
un
ter
in t
his
inve
stig
atio
n?
Pro
ble
ms
will
var
y. S
tud
ents
may
ru
n in
to d
iffi
cult
y su
stai
nin
g a
war
m e
no
ug
h
envi
ron
men
t to
kee
p t
he
evap
ora
tio
n a
nd
co
nd
ensa
tio
n c
ycle
go
ing
.
4.
Co
mp
ari
ng
an
d C
on
trast
ing
Com
pare
an
d co
ntr
ast
you
r de
salin
ator
wit
h o
ne
ofyo
ur
clas
smat
e’s.
Wh
at w
ere
the
adva
nta
ges
or d
isad
van
tage
s of
you
r de
sign
?
An
swer
s w
ill v
ary.
Cop
yrig
ht ©
Gle
ncoe
/McG
raw
-Hill
, a d
ivis
ion
of t
he M
cGra
w-H
ill C
ompa
nies
, Inc
.
Chapter Assessment Answer Pages Earth Science: Geology, the Environment, and the Universe T183
104
Cha
pter
26
Eart
h S
cien
ce:
Geo
logy
, th
e En
viro
nmen
t, a
nd t
he U
nive
rse
Geo
Lab
and
Min
iLab
Wor
kshe
ets
Nam
eC
lass
Dat
e
Bui
ldin
gs c
an b
e de
sign
ed t
o co
nser
ve h
eat
ener
gy.S
ome
cons
ider
atio
ns in
volv
ed in
the
desi
gn o
fa b
uild
ing
that
con
serv
es h
eat
incl
ude
the
mat
eria
ls t
hat
will
be
used
in c
onst
ruct
ion,
the
mat
eria
ls t
hat
will
sto
re h
eat,
and
the
over
all l
ayou
t of
the
build
ing.
Pro
ble
mH
ow c
an a
bu
ildin
g be
des
ign
ed t
o co
nse
rve
ener
gy?
Wh
at b
uild
ing
mat
eria
ls w
ill w
ork
best
,an
d w
hat
oth
er f
acto
rs n
eed
to b
e co
nsi
dere
d?
Po
ssib
le M
ate
rials
glas
s or
cle
ar p
last
icst
urd
y ca
rdbo
ard
boxe
spa
ints
of
vari
ous
colo
rsth
erm
omet
ers
mat
eria
ls t
o co
ver
the
build
ing
(pap
er,a
lum
inu
m f
oil,
foam
boar
d,an
d so
on
)in
teri
or m
ater
ials
(s
ton
es,m
irro
rs,f
abri
c,an
d so
on
)lig
ht
sou
rce
Hyp
oth
esi
sB
rain
stor
m a
list
of
desi
gn f
eatu
res
that
mig
ht
con
trib
ute
to
the
ener
gy e
ffic
ien
cy o
fa
build
ing.
Hyp
oth
esiz
e h
ow y
ou c
ould
inco
rpor
ate
som
e of
thes
e fe
atu
res
into
an
en
ergy
-eff
icie
nt
build
ing.
Fin
d ou
t w
hat
mat
eria
ls a
re u
sed
in h
eat-
effi
cien
th
omes
an
d re
sear
ch lo
cal s
ourc
es o
fm
ater
ials
for
you
r de
sign
.Dec
ide
how
you
will
det
erm
ine
the
hea
t ef
fici
ency
of
the
build
ing
you
con
stru
ct.B
esu
re t
o pl
an f
or a
con
trol
bu
ildin
g fo
r co
mpa
riso
n.
Ob
ject
ives
In t
his
Geo
Lab,
you
will
:
•R
ese
arc
hw
hat
mat
eria
ls a
re u
sed
in t
he
con
stru
ctio
n o
fen
ergy
-eff
icie
nt
build
ings
.
•D
esi
gn
a bu
ildin
g th
at is
en
ergy
eff
icie
nt.
•C
on
stru
ctth
e bu
ildin
g th
at y
ou d
esig
n.
•D
ete
rmin
eth
e h
eat
effi
cien
cy o
fth
e bu
ildin
gby
com
pari
ng
it t
o a
con
trol
bu
ildin
g.
•In
terp
ret
the
data
th
at y
ou c
olle
ct t
o de
term
ine
you
r su
cces
s in
dev
elop
ing
an e
ner
gy-e
ffic
ien
tbu
ildin
g.
Safe
ty P
reca
uti
on
s
Be
care
ful w
hen
you
are
usi
ng
scis
sors
.M
ake
sure
to
han
dle
the
ligh
t so
urc
e ca
refu
lly w
hen
it is
hot
.Alw
ays
wea
r sa
fety
gog
gles
an
d an
apr
on in
th
e la
b.
scis
sors
tape
glu
eDes
igni
ng a
n En
ergy
-Ef
fici
ent
Build
ing
PR
EP
AR
AT
ION
1.
Rev
iew
th
e da
ta t
hat
you
col
lect
ed a
bou
tbu
ildin
g en
ergy
-eff
icie
nt
build
ings
.Als
ore
view
you
r lis
t of
poss
ible
des
ign
fea
ture
s.
2.
Des
ign
you
r bu
ildin
g.M
ake
a lis
t of
the
hea
t-co
nse
rvin
g is
sues
th
at y
ou a
ddre
ssed
.
3.
Dec
ide
on t
he
mat
eria
ls t
hat
you
will
use
to
build
you
r h
ouse
.Col
lect
th
ose
mat
eria
ls.
4.
Con
stru
ct t
he
build
ing
and
a co
ntr
ol b
uild
ing
for
com
pari
son
.
5.
Dev
ise
a w
ay t
o te
st t
he
hea
t-h
oldi
ng
abili
ty o
fea
ch b
uild
ing.
6.
Pro
ceed
wit
h t
he
test
on
eac
h b
uild
ing.
To t
est
the
build
ings
’hea
t en
ergy
eff
icie
ncy
,it
may
be
nec
essa
ry t
o h
eat
the
build
ings
an
d de
term
ine
PL
AN
TH
E E
XP
ER
IME
NT
Nam
eC
lass
Dat
e
Geo
Lab
and
Min
iLab
Wor
kshe
ets
Cha
pter
26
Eart
h S
cien
ce:
Geo
logy
, th
e En
viro
nmen
t, a
nd t
he U
nive
rse
105
Des
igni
ng a
n En
ergy
-Eff
icie
nt B
uild
ing
PL
AN
TH
E E
XP
ER
IME
NT
TAB
LE
GR
APHhow
lon
g h
eat
is c
onse
rved
wit
hin
eac
h o
ne.
CA
UT
ION
:Mak
e su
re t
he h
eat
sour
ce is
far
enou
gh a
way
from
the
bui
ldin
g m
ater
ials
so
that
the
y do
not
bur
n or
mel
t.
7.
Dra
w a
tab
le a
nd
reco
rd y
our
data
.T
hen
,mak
e a
grap
h o
fyo
ur
data
.
8.
Mak
e m
odif
icat
ion
s to
th
e de
sign
to
impr
ove
the
build
ing’
s ef
fici
ency
.
AN
AL
YZ
E
1.
Ch
eck
ing
Yo
ur
Hyp
oth
esi
sW
as t
he
build
ing
that
you
des
ign
ed m
ore
ener
gy-
effi
cien
t th
an t
he
con
trol
bu
ildin
g? W
hy d
id y
ou c
onst
ruct
a c
ontr
ol b
uild
ing?
Stu
den
ts s
ho
uld
be
able
to
use
th
e d
ata
that
th
ey c
olle
cted
fro
m t
hei
r m
od
els
and
the
con
tro
l to
det
erm
ine
the
effe
ctiv
enes
s o
f th
eir
des
ign
s.
Geo
Lab
and
Min
iLab
Wor
kshe
ets
Cha
pter
27
Eart
h S
cien
ce:
Geo
logy
, th
e En
viro
nmen
t, a
nd t
he U
nive
rse
107
Nam
eC
lass
Dat
e
Rec
lam
atio
n
Mo
del
the
pro
ced
ure
use
d b
y m
inin
g c
om
pan
ies
to r
ecla
im a
n a
rea
afte
r st
rip
-min
ing
.
Pro
ced
ure
1.
Usi
ng
a p
last
ic k
nif
e, m
ake
fou
r o
r fi
ve c
uts
acr
oss
th
e ic
ing
of
on
e cr
eam
-fill
ed, i
ced
cu
pca
ke. R
emo
ve t
he
pie
ces
of
icin
g.
2.
Mak
e fo
ur
or
five
cu
ts d
ow
n in
to t
he
cake
un
til y
ou
rea
ch t
he
crea
mfi
llin
g. C
ut
ho
rizo
nta
lly ju
st a
bo
ve t
he
crea
m f
illin
g a
nd
rem
ove
th
e ca
ke p
iece
s.
3.
Rem
ove
th
e cr
eam
fill
ing
. To
res
tore
th
e ar
ea, u
se t
he
pie
ces
of
cake
th
atyo
u c
ut
ou
t to
fill
in t
he
ho
le le
ft w
hen
yo
u r
emo
ved
th
e cr
eam
fill
ing
.M
ake
the
surf
ace
of
the
cup
cake
as
leve
l as
po
ssib
le.
4.
Rep
lace
th
e ic
ing
so
th
at it
co
vers
th
e su
rfac
e o
f th
e re
sto
red
cu
pca
ke.
An
aly
ze a
nd
Co
ncl
ud
e
1.
On
th
e re
sto
red
cu
pca
ke, w
hat
do
es t
he
icin
g r
epre
sen
t? W
hat
do
es t
he
crea
m f
illin
g r
epre
sen
t?
The
icin
g r
epre
sen
ts t
he
top
soil;
th
e cr
eam
rep
rese
nts
th
e ex
trac
ted
res
ou
rce.
2.
Do
es t
he
recl
aim
ed c
up
cake
res
emb
le t
he
ori
gin
al, u
nto
uch
ed c
up
cake
?
The
recl
aim
ed c
up
cake
res
emb
les
the
un
tou
ched
cu
pca
ke b
ut
it is
sh
ort
er a
nd
has
a b
roke
n s
urf
ace.
3.
Can
rec
lam
atio
n o
f an
are
a th
at h
as b
een
str
ip-m
ined
res
tore
th
e la
nd
to
its
ori
gin
al c
on
tou
rs?
Exp
lain
yo
ur
answ
er.
Rec
lam
atio
n c
ann
ot
rest
ore
th
e o
rig
inal
co
nto
urs
bec
ause
so
me
mat
eria
l has
bee
n r
emo
ved
.
Min
iLab
27
Min
iLab
27
Cop
yrig
ht ©
Gle
ncoe
/McG
raw
-Hill
, a d
ivis
ion
of t
he M
cGra
w-H
ill C
ompa
nies
, Inc
.
T184 Answer Pages Earth Science: Geology, the Environment, and the Universe Chapter Assessment
Nam
eC
lass
Dat
e
106
Cha
pter
26
Eart
h S
cien
ce:
Geo
logy
, th
e En
viro
nmen
t, a
nd t
he U
nive
rse
Geo
Lab
and
Min
iLab
Wor
kshe
ets
Des
igni
ng a
n En
ergy
-Eff
icie
nt B
uild
ing
1.
How
cou
ld y
ou in
corp
orat
e so
me
ofyo
ur
desi
gn e
lem
ents
in y
our
own
hom
e?
2.
How
cou
ld y
our
desi
gn b
e im
prov
ed?
3.
How
cou
ld u
sin
g di
ffer
ent
ener
gy s
ourc
es a
ffec
t yo
ur
resu
lts?
CO
NC
LU
DE
AN
D A
PP
LY
2.
Inte
rpre
tin
g O
bse
rvati
on
sW
hat
pro
blem
s di
d yo
u e
nco
un
ter,
and
how
did
you
sol
ve t
hem
?
Stu
den
ts m
ust
be
assu
red
th
at li
stin
g p
rob
lem
s is
imp
ort
ant
in a
ny
exp
erim
ent.
3.
Ob
serv
ing
an
d I
nfe
rrin
gH
ow d
id y
our
obse
rvat
ion
s af
fect
dec
isio
ns
that
you
mig
ht
mak
e if
you
wer
e to
rep
eat
this
lab?
Why
do
you
th
ink
you
r de
sign
wor
ked
or d
id n
ot w
ork?
Eval
uat
ing
by
ob
serv
ing
an
d in
ferr
ing
hel
ps
stu
den
ts t
o m
ake
con
cret
e ap
plic
atio
ns
of
the
con
cep
t o
f h
eat
sto
rag
e an
d o
f th
e sc
ien
tifi
c p
roce
ss.
4.
Co
mp
ari
ng
an
d C
on
trast
ing
Com
pare
an
d co
ntr
ast
the
build
ing
you
des
ign
ed a
nd
the
con
trol
bu
ildin
g.C
ompa
re a
nd
con
tras
t yo
ur
desi
gn a
nd
the
desi
gns
ofyo
ur
clas
smat
es.
Lead
stu
den
ts t
o u
nd
erst
and
th
at if
th
e co
ntr
ol a
nd
des
ign
mo
del
s sh
ow
ed n
o
dif
fere
nce
, th
en t
he
met
ho
ds
emp
loye
d li
kely
did
no
t af
fect
wh
at w
as b
ein
g
mea
sure
d—
eith
er h
eat
abso
rbed
or
hea
t re
tain
ed.
5.
Thin
kin
g C
riti
call
ySu
ppos
e yo
u c
ould
use
on
ly n
atu
rally
occ
urr
ing
mat
eria
ls.
Wou
ld t
hat
lim
it y
our
desi
gn?
Exp
lain
you
r an
swer
.
Ask
ing
stu
den
ts t
o c
on
sid
er s
pec
ific
mat
eria
ls w
ill h
elp
th
em r
ealiz
e th
at d
ecis
ion
s
som
etim
es h
ave
to b
e m
ade
afte
r b
alan
cin
g t
he
op
tio
ns.
To
mak
e a
dec
isio
n o
f th
is
typ
e, p
rio
riti
es m
ay n
eed
to
be
esta
blis
hed
an
d c
om
pro
mis
es m
ade.
AN
AL
YZ
E
Stu
den
t an
swer
s w
ill v
ary
dep
end
ing
on
th
eir
des
ign
s an
d t
hei
r su
cces
s. In
all
case
s,im
pro
vem
ents
will
be
po
ssib
leei
ther
in t
he
typ
e o
r am
ou
nt
of
mat
eria
l use
d a
nd
in t
he
ori
en-
tati
on
of
the
bu
ildin
gs.
Po
ssib
leso
urc
es o
r er
ror
in t
he
test
ing
ph
ases
are
als
o im
po
rtan
t to
loo
k fo
r an
d c
on
sid
er w
hen
an
alyz
ing
th
e re
sult
s o
bta
ined
.
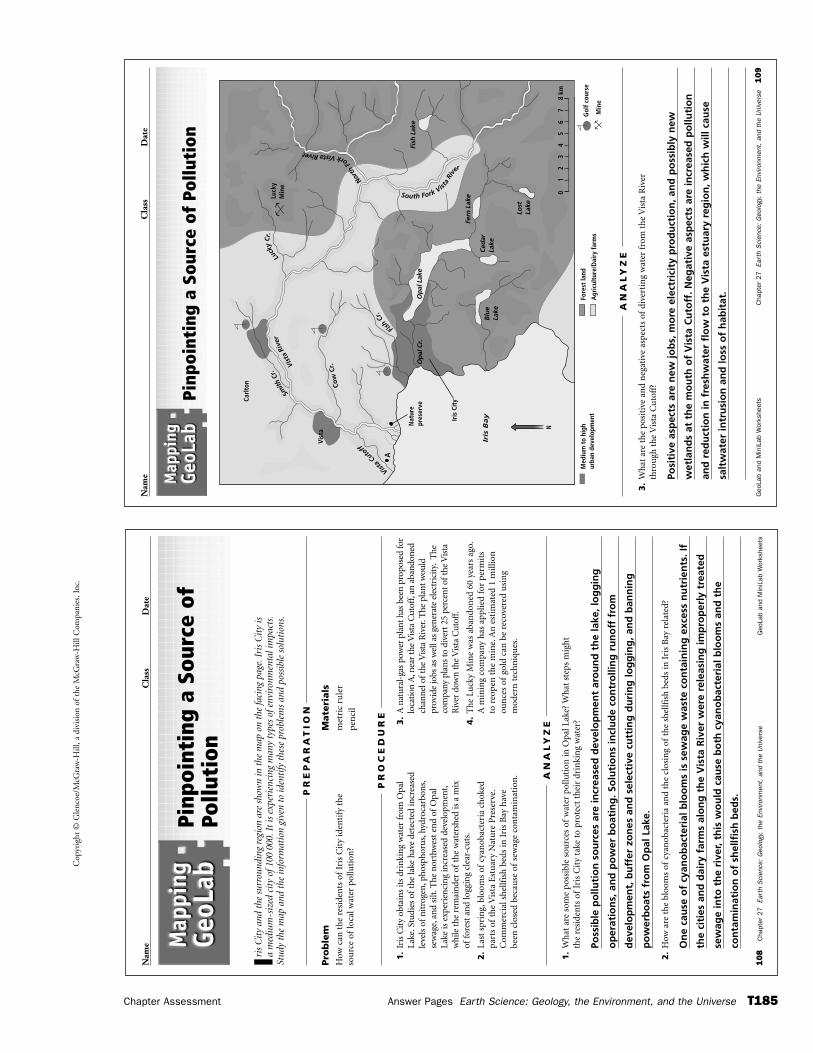
Cop
yrig
ht ©
Gle
ncoe
/McG
raw
-Hill
, a d
ivis
ion
of t
he M
cGra
w-H
ill C
ompa
nies
, Inc
.
Chapter Assessment Answer Pages Earth Science: Geology, the Environment, and the Universe T185
108
Cha
pter
27
Eart
h S
cien
ce:
Geo
logy
, th
e En
viro
nmen
t, a
nd t
he U
nive
rse
Geo
Lab
and
Min
iLab
Wor
kshe
ets
Nam
eC
lass
Dat
e
Iris
Cit
y an
d th
e su
rrou
ndin
g re
gion
are
sho
wn
in t
he m
ap o
n th
e fa
cing
pag
e.Ir
is C
ity
is
a m
ediu
m-s
ized
cit
y of
100
000.
It is
exp
erie
ncin
g m
any
type
s of
envi
ronm
enta
l im
pact
s.St
udy
the
map
and
the
info
rmat
ion
give
n to
iden
tify
the
se p
robl
ems
and
poss
ible
sol
utio
ns.
Pro
ble
mH
ow c
an t
he
resi
den
ts o
fIr
is C
ity
iden
tify
th
eso
urc
e of
loca
l wat
er p
ollu
tion
?
Mate
rials
met
ric
rule
r
pen
cil
Pinp
oint
ing
a So
urce
of
Pollu
tion
PR
EP
AR
AT
ION
1.
Iris
Cit
y ob
tain
s it
s dr
inki
ng
wat
er fr
om O
pal
Lake
.Stu
dies
of
the
lake
hav
e de
tect
ed in
crea
sed
leve
ls o
fn
itro
gen
,pho
spho
rus,
hydr
ocar
bon
s,se
wag
e,an
d si
lt.T
he n
orth
wes
t en
d of
Opa
lLa
ke is
exp
erie
nci
ng
incr
ease
d de
velo
pmen
t,w
hile
the
rem
ain
der
ofth
e w
ater
shed
is a
mix
offo
rest
an
d lo
ggin
g cl
ear-
cuts
.
2.
Last
spr
ing,
bloo
ms
ofcy
anob
acte
ria
chok
edpa
rts
ofth
e V
ista
Est
uar
y N
atu
re P
rese
rve.
Com
mer
cial
sh
ellf
ish
bed
s in
Iri
s B
ay h
ave
been
clo
sed
beca
use
of
sew
age
con
tam
inat
ion
.
3.
A n
atur
al-g
as p
ower
pla
nt h
as b
een
prop
osed
for
loca
tion
A,n
ear
the
Vis
ta C
utof
f,an
aba
ndon
edch
anne
l of
the
Vis
ta R
iver
.The
pla
nt w
ould
prov
ide
jobs
as
wel
l as
gene
rate
ele
ctri
city
.T
heco
mpa
ny p
lans
to d
iver
t 25
perc
ent o
fth
e V
ista
Riv
er d
own
the
Vis
ta C
utof
f.
4.
Th
e Lu
cky
Min
e w
as a
ban
don
ed 6
0 ye
ars
ago.
A m
inin
g co
mpa
ny h
as a
pplie
d fo
r pe
rmit
s to
reo
pen
th
e m
ine.
An
est
imat
ed 1
mill
ion
oun
ces
ofgo
ld c
an b
e re
cove
red
usi
ng
mod
ern
tec
hn
iqu
es.
PR
OC
ED
UR
E
1.
Wh
at a
re s
ome
poss
ible
sou
rces
of
wat
er p
ollu
tion
in O
pal L
ake?
Wh
at s
teps
mig
ht
the
resi
den
ts o
fIr
is C
ity
take
to
prot
ect
thei
r dr
inki
ng
wat
er?
Poss
ible
po
lluti
on
so
urc
es a
re in
crea
sed
dev
elo
pm
ent
aro
un
d t
he
lake
, lo
gg
ing
op
erat
ion
s, a
nd
po
wer
bo
atin
g. S
olu
tio
ns
incl
ud
e co
ntr
olli
ng
ru
no
ff f
rom
dev
elo
pm
ent,
bu
ffer
zo
nes
an
d s
elec
tive
cu
ttin
g d
uri
ng
log
gin
g, a
nd
ban
nin
g
po
wer
bo
ats
fro
m O
pal
Lak
e.
2.
How
are
th
e bl
oom
s of
cyan
obac
teri
a an
d th
e cl
osin
g of
the
shel
lfis
h b
eds
in I
ris
Bay
rel
ated
?
On
e ca
use
of
cyan
ob
acte
rial
blo
om
s is
sew
age
was
te c
on
tain
ing
exc
ess
nu
trie
nts
. If
the
citi
es a
nd
dai
ry f
arm
s al
on
g t
he
Vis
ta R
iver
wer
e re
leas
ing
imp
rop
erly
tre
ated
sew
age
into
th
e ri
ver,
this
wo
uld
cau
se b
oth
cya
no
bac
teri
al b
loo
ms
and
th
e
con
tam
inat
ion
of
shel
lfis
h b
eds.
AN
AL
YZ
E
Nam
eC
lass
Dat
e
Geo
Lab
and
Min
iLab
Wor
kshe
ets
Cha
pter
27
Eart
h S
cien
ce:
Geo
logy
, th
e En
viro
nmen
t, a
nd t
he U
nive
rse
109
Pinp
oint
ing
a So
urce
of
Pollu
tion
Nat
ure
pres
erve
Vista C
utoff
Iris
Cit
y
Iris
Ba
y
Opa
l Cr.
Opa
l Lak
e
Blue
Lake
Luck
yM
ine
Ceda
rLa
ke
Lost
Lake
Fern
Lak
e
Vist
a
Carl
ton Co
w C
r.
A
Vis
taRi
ver
Fis
hCr
.
North
ForkVistaRiver
South Fork Vista
Rive
r
Fish
Lak
e
Smith
Cr.
Luck
yCr
.
08
km7
65
43
21
Med
ium
to
high
urba
n de
velo
pmen
tG
olf c
ours
e
Min
e
Fore
st la
nd
Agr
icul
ture
/Dai
ry fa
rms
N
3.
Wh
at a
re t
he
posi
tive
an
d n
egat
ive
aspe
cts
ofdi
vert
ing
wat
er f
rom
th
e V
ista
Riv
erth
rou
gh t
he
Vis
ta C
uto
ff?
Posi
tive
asp
ects
are
new
job
s, m
ore
ele
ctri
city
pro
du
ctio
n, a
nd
po
ssib
ly n
ew
wet
lan
ds
at t
he
mo
uth
of
Vis
ta C
uto
ff. N
egat
ive
asp
ects
are
incr
ease
d p
ollu
tio
n
and
red
uct
ion
in f
resh
wat
er f
low
to
th
e V
ista
est
uar
y re
gio
n, w
hic
h w
ill c
ause
salt
wat
er in
tru
sio
n a
nd
loss
of
hab
itat
.
AN
AL
YZ
E
Geo
Lab
and
Min
iLab
Wor
kshe
ets
Cha
pter
28
Eart
h S
cien
ce:
Geo
logy
, th
e En
viro
nmen
t, a
nd t
he U
nive
rse
111
Nam
eC
lass
Dat
e
The
Sun’
s Po
siti
on
Mod
elth
e o
verh
ead
po
siti
on
of
the
Sun
at
vari
ou
s la
titu
des
du
rin
g t
he
sum
mer
so
lsti
ce.
Pro
ced
ure
1.
In t
he
spac
e b
elo
w, d
raw
a c
ircl
e to
rep
rese
nt
Eart
h. A
lso
dra
w t
he
equ
ato
r.
2.
Use
a p
rotr
acto
r to
fin
d t
he
loca
tio
n o
f th
e Tr
op
ic o
f C
ance
r. D
raw
a li
ne
fro
m E
arth
’s c
ente
r to
th
e Tr
op
ic o
f C
ance
r.
3.
Usi
ng
a m
ap, l
oca
te t
hat
lati
tud
e at
wh
ich
yo
u li
ve. W
ith
th
e p
rotr
acto
r,m
ark
that
lati
tud
e o
n y
ou
r d
iag
ram
. Dra
w a
lin
e fr
om
Ear
th’s
cen
ter
toth
is lo
cati
on
.
4.
Mea
sure
th
e an
gle
bet
wee
n t
he
line
to t
he
Tro
pic
of
Can
cer
and
th
e lin
eto
yo
ur
loca
tio
n.
5.
Ch
oo
se t
wo
dif
fere
nt
lati
tud
es, t
hen
rep
eat
step
s 3
and
4 f
or
thes
e la
titu
des
.
An
aly
ze a
nd
Co
ncl
ud
e
1.
Ho
w d
oes
th
e an
gle
var
y w
ith
lati
tud
e?
The
fart
her
no
rth
yo
ur
loca
tio
n, t
he
mo
re t
he
ang
le b
etw
een
th
e lin
e to
th
e
Tro
pic
of
Can
cer
and
th
e lin
e to
yo
ur
loca
tio
n in
crea
ses.
Hen
ce, t
he
Sun
is
low
er in
th
e sk
y o
n t
he
sols
tice
s fo
r m
ore
no
rth
erly
lati
tud
es.
2.
At
wh
at s
ou
ther
n la
titu
de
wo
uld
yo
u n
ot
see
the
Sun
ab
ove
th
e h
ori
zon
?
66.5
°so
uth
lati
tud
e
3.
Ho
w w
ou
ld t
he
ang
le c
han
ge
if y
ou
use
d t
he
Tro
pic
of
Cap
rico
rn?
The
ang
le w
ou
ld b
e la
rger
. Fo
r an
y la
titu
des
ab
ove
66.
5°n
ort
h, t
he
ang
le
wo
uld
be
mo
re t
han
90°
.
Min
iLab
28
Min
iLab
28
Cop
yrig
ht ©
Gle
ncoe
/McG
raw
-Hill
, a d
ivis
ion
of t
he M
cGra
w-H
ill C
ompa
nies
, Inc
.
T186 Answer Pages Earth Science: Geology, the Environment, and the Universe Chapter Assessment
Nam
eC
lass
Dat
e
110
Cha
pter
27
Eart
h S
cien
ce:
Geo
logy
, th
e En
viro
nmen
t, a
nd t
he U
nive
rse
Geo
Lab
and
Min
iLab
Wor
kshe
ets
Pinp
oint
ing
a So
urce
of
Pollu
tion
1.
Iden
tify
th
e so
urc
es o
fw
ater
pol
luti
on in
Iri
s B
ay.A
re t
hes
e po
int
or n
onpo
int
sou
rces
of
pollu
tion
?
Fert
ilize
r an
d p
esti
cid
es c
an c
om
e fr
om
far
min
g o
per
atio
ns,
go
lf c
ou
rses
, an
d
gen
eral
urb
an d
evel
op
men
t.O
il an
d g
aso
line
po
lluti
on
co
mes
fro
m s
tree
t ru
no
ff,
po
wer
bo
ats,
an
d h
arb
or
op
erat
ion
s. E
xces
s si
lt c
om
es f
rom
urb
an d
evel
op
men
t an
d
log
gin
g. U
nfo
rtu
nat
ely,
mo
st o
f th
ese
are
no
np
oin
t so
urc
es a
nd
dif
ficu
lt t
o c
on
tro
l.
Each
go
lf c
ou
rse
and
far
m c
ou
ld b
e co
nsi
der
ed a
po
int
sou
rce.
2.
How
cou
ld y
ou id
enti
fy t
he
sou
rce
ofpo
lluti
on c
ausi
ng
cyan
obac
teri
a bl
oom
s in
th
e V
ista
Est
uar
y?
The
sou
rce
of
po
lluti
on
co
uld
be
loca
ted
by
anal
yzin
g w
ater
sam
ple
s w
hile
trav
elin
g u
p t
he
Vis
ta R
iver
un
til t
he
sou
rce
was
iden
tifi
ed.
3.
Ifth
e V
ista
Cu
toff
is u
sed
to d
iver
t w
ater
fro
m t
he
Vis
ta R
iver
,how
will
th
e aq
uat
ich
abit
ats
ofth
e ri
ver
be a
ffec
ted?
The
Vis
ta R
iver
will
hav
e lo
wer
flo
w d
ow
nst
ream
of
the
div
ersi
on
. Th
is c
ou
ld r
esu
lt
in s
hal
low
er w
ater
an
d in
crea
sed
tem
per
atu
re. A
lso
, th
e fr
esh
wat
er-s
altw
ater
bal
ance
in t
he
estu
ary
wo
uld
be
chan
ged
, res
ult
ing
in lo
ss o
f h
abit
at a
nd
org
anis
ms.
4.
Ifth
e Lu
cky
Min
e is
reo
pen
ed,w
hat
cou
ld t
he
min
ing
com
pany
do
to m
inim
ize
neg
ativ
e en
viro
nm
enta
l im
pact
s?
The
min
ing
co
mp
any
cou
ld b
uild
co
nta
inm
ent
po
nd
s an
d f
iltra
tio
n b
arri
ers
to
pre
ven
t liq
uid
was
tes
fro
m e
nte
rin
g t
he
stre
ams.
Th
e ta
ilin
g p
ipes
co
uld
be
lan
dsc
aped
to
hel
p r
epla
ce t
he
hab
itat
th
at w
as b
uri
ed.
CO
NC
LU
DE
AN
D A
PP
LY
AN
AL
YZ
E
4.
Ifth
e Lu
cky
Min
e is
reo
pen
ed,w
hat
eff
ects
mig
ht
it h
ave
on t
he
popu
lati
ons
ofC
arlt
on,V
ista
,an
d Ir
is C
ity?
Ther
e w
ill b
e ec
on
om
ic b
enef
its
for
all t
hre
e ci
ties
. Po
lluti
on
pro
ble
ms
fro
m m
inin
g
acti
viti
es w
ill p
rim
arily
aff
ect
Vis
ta a
nd
Car
lto
n b
ecau
se t
hey
are
loca
ted
alo
ng
th
e
rive
r.
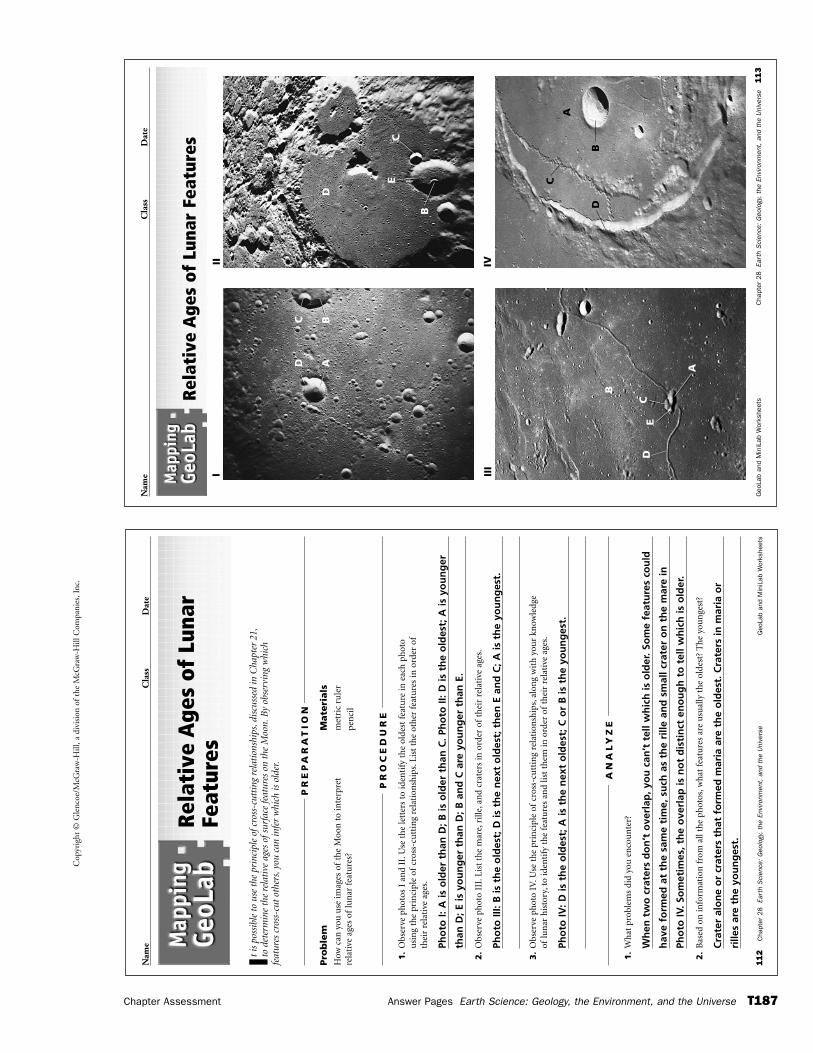
Cop
yrig
ht ©
Gle
ncoe
/McG
raw
-Hill
, a d
ivis
ion
of t
he M
cGra
w-H
ill C
ompa
nies
, Inc
.
Chapter Assessment Answer Pages Earth Science: Geology, the Environment, and the Universe T187
1.
Wh
at p
robl
ems
did
you
en
cou
nte
r?
Wh
en t
wo
cra
ters
do
n’t
ove
rlap
, yo
u c
an’t
tel
l wh
ich
is o
lder
. So
me
feat
ure
s co
uld
hav
e fo
rmed
at
the
sam
e ti
me,
su
ch a
s th
e ri
lle a
nd
sm
all c
rate
r o
n t
he
mar
e in
Pho
to IV
. So
met
imes
, th
e o
verl
ap is
no
t d
isti
nct
en
ou
gh
to
tel
l wh
ich
is o
lder
.
2.
Bas
ed o
n in
form
atio
n f
rom
all
the
phot
os,w
hat
fea
ture
s ar
e u
sual
ly t
he
olde
st?
Th
e yo
un
gest
?
Cra
ter
alo
ne
or
crat
ers
that
fo
rmed
mar
ia a
re t
he
old
est.
Cra
ters
in m
aria
or
rille
s ar
e th
e yo
un
ges
t.
AN
AL
YZ
E
112
Cha
pter
28
Eart
h S
cien
ce:
Geo
logy
, th
e En
viro
nmen
t, a
nd t
he U
nive
rse
Geo
Lab
and
Min
iLab
Wor
kshe
ets
Nam
eC
lass
Dat
e
It is
pos
sibl
e to
use
the
pri
ncip
le o
fcro
ss-c
utti
ng r
elat
ions
hips
,dis
cuss
ed in
Cha
pter
21,
to d
eter
min
e th
e re
lati
ve a
ges
ofsu
rfac
e fe
atur
es o
n th
e M
oon.
By
obse
rvin
g w
hich
feat
ures
cro
ss-c
ut o
ther
s,yo
u ca
n in
fer
whi
ch is
old
er.
Pro
ble
mH
ow c
an y
ou u
se im
ages
of
the
Moo
n t
o in
terp
ret
rela
tive
age
s of
lun
ar f
eatu
res?
Mate
rials
met
ric
rule
r
pen
cil
Rel
ativ
e A
ges
of L
unar
Feat
ures
PR
EP
AR
AT
ION
1.
Obs
erve
ph
otos
I a
nd
II.U
se t
he
lett
ers
to id
enti
fy t
he
olde
st f
eatu
re in
eac
h p
hot
ou
sin
g th
e pr
inci
ple
ofcr
oss-
cutt
ing
rela
tion
ship
s.Li
st t
he
oth
er f
eatu
res
in o
rder
of
thei
r re
lati
ve a
ges.
Pho
to I:
A is
old
er t
han
D; B
is o
lder
th
an C
. Ph
oto
II: D
is t
he
old
est;
A is
yo
un
ger
than
D; E
is y
ou
ng
er t
han
D; B
an
d C
are
yo
un
ger
th
an E
.
2.
Obs
erve
ph
oto
III.
List
th
e m
are,
rille
,an
d cr
ater
s in
ord
er o
fth
eir
rela
tive
age
s.
Pho
to II
I: B
is t
he
old
est;
D is
th
e n
ext
old
est;
th
en E
an
d C
; A is
th
e yo
un
ges
t.
3.
Obs
erve
ph
oto
IV.U
se t
he
prin
cipl
e of
cros
s-cu
ttin
g re
lati
onsh
ips,
alon
g w
ith
you
r kn
owle
dge
oflu
nar
his
tory
,to
iden
tify
th
e fe
atu
res
and
list
them
in o
rder
of
thei
r re
lati
ve a
ges.
Pho
to IV
: D is
th
e o
ldes
t; A
is t
he
nex
t o
ldes
t; C
or
B is
th
e yo
un
ges
t.
PR
OC
ED
UR
E
Nam
eC
lass
Dat
e
Geo
Lab
and
Min
iLab
Wor
kshe
ets
Cha
pter
28
Eart
h S
cien
ce:
Geo
logy
, th
e En
viro
nmen
t, a
nd t
he U
nive
rse
113
Rel
ativ
e A
ges
of L
unar
Fea
ture
s
D
C
B
A
III IV
C B
D A
A
B
D
CE
D
B
CE
A
III
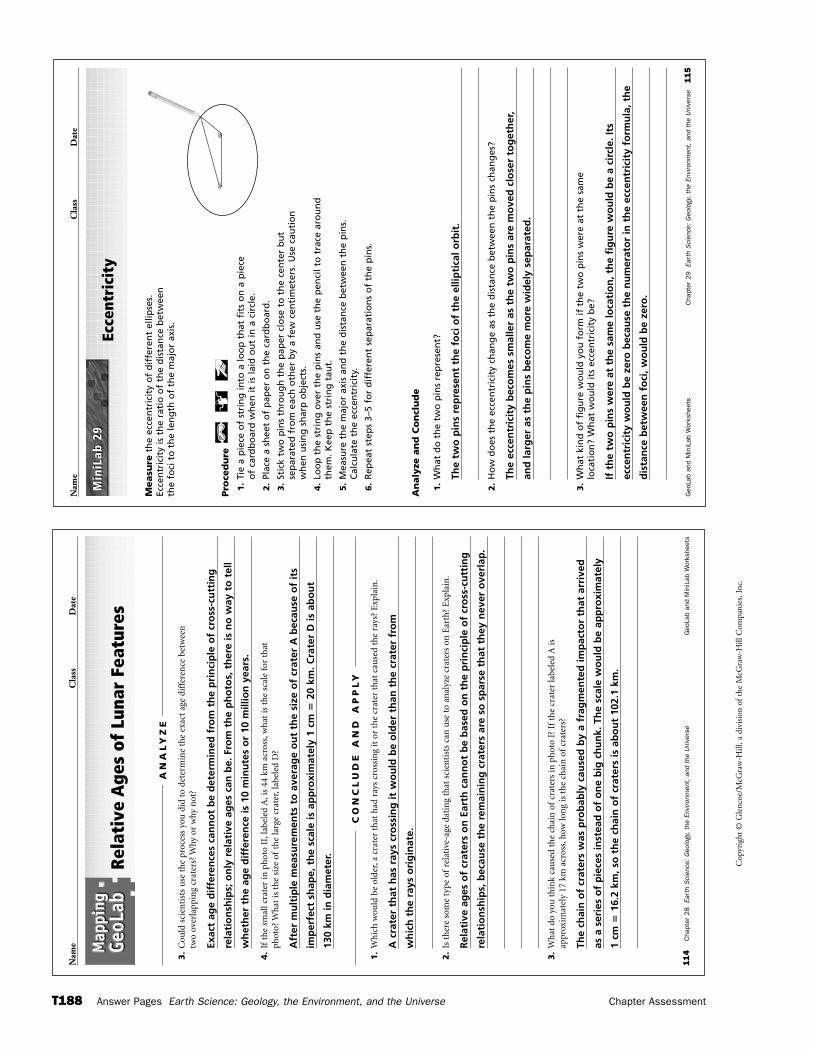
Geo
Lab
and
Min
iLab
Wor
kshe
ets
Cha
pter
29
Eart
h S
cien
ce:
Geo
logy
, th
e En
viro
nmen
t, a
nd t
he U
nive
rse
115
Nam
eC
lass
Dat
e
Ecce
ntri
city
Measu
reth
e ec
cen
tric
ity
of
dif
fere
nt
ellip
ses.
Ecce
ntr
icit
y is
th
e ra
tio
of
the
dis
tan
ce b
etw
een
the
foci
to
th
e le
ng
th o
f th
e m
ajo
r ax
is.
Pro
ced
ure
1.
Tie
a p
iece
of
stri
ng
into
a lo
op
th
at f
its
on
a p
iece
o
f ca
rdb
oar
d w
hen
it is
laid
ou
t in
a c
ircl
e.
2.
Plac
e a
shee
t o
f p
aper
on
th
e ca
rdb
oar
d.
3.
Stic
k tw
o p
ins
thro
ug
h t
he
pap
er c
lose
to
th
e ce
nte
r b
ut
sep
arat
ed f
rom
eac
h o
ther
by
a fe
w c
enti
met
ers.
Use
cau
tio
nw
hen
usi
ng
sh
arp
ob
ject
s.
4.
Loo
p t
he
stri
ng
ove
r th
e p
ins
and
use
th
e p
enci
l to
tra
ce a
rou
nd
them
. Kee
p t
he
stri
ng
tau
t.
5.
Mea
sure
th
e m
ajo
r ax
is a
nd
th
e d
ista
nce
bet
wee
n t
he
pin
s.C
alcu
late
th
e ec
cen
tric
ity.
6.
Rep
eat
step
s 3–
5 fo
r d
iffe
ren
t se
par
atio
ns
of
the
pin
s.
An
aly
ze a
nd
Co
ncl
ud
e
1.
Wh
at d
o t
he
two
pin
s re
pre
sen
t?
The
two
pin
s re
pre
sen
t th
e fo
ci o
f th
e el
lipti
cal o
rbit
.
2.
Ho
w d
oes
th
e ec
cen
tric
ity
chan
ge
as t
he
dis
tan
ce b
etw
een
th
e p
ins
chan
ges
?
The
ecce
ntr
icit
y b
eco
mes
sm
alle
r as
th
e tw
o p
ins
are
mo
ved
clo
ser
tog
eth
er,
and
larg
er a
s th
e p
ins
bec
om
e m
ore
wid
ely
sep
arat
ed.
3.
Wh
at k
ind
of
fig
ure
wo
uld
yo
u f
orm
if t
he
two
pin
s w
ere
at t
he
sam
elo
cati
on
? W
hat
wo
uld
its
ecce
ntr
icit
y b
e?
If t
he
two
pin
s w
ere
at t
he
sam
e lo
cati
on
, th
e fi
gu
re w
ou
ld b
e a
circ
le. I
ts
ecce
ntr
icit
y w
ou
ld b
e ze
ro b
ecau
se t
he
nu
mer
ato
r in
th
e ec
cen
tric
ity
form
ula
, th
e
dis
tan
ce b
etw
een
fo
ci, w
ou
ld b
e ze
ro.
Min
iLab
29
Min
iLab
29
Cop
yrig
ht ©
Gle
ncoe
/McG
raw
-Hill
, a d
ivis
ion
of t
he M
cGra
w-H
ill C
ompa
nies
, Inc
.
T188 Answer Pages Earth Science: Geology, the Environment, and the Universe Chapter Assessment
Nam
eC
lass
Dat
e
114
Cha
pter
28
Eart
h S
cien
ce:
Geo
logy
, th
e En
viro
nmen
t, a
nd t
he U
nive
rse
Geo
Lab
and
Min
iLab
Wor
kshe
ets
Rel
ativ
e A
ges
of L
unar
Fea
ture
s
3.
Cou
ld s
cien
tist
s u
se t
he
proc
ess
you
did
to
dete
rmin
e th
e ex
act
age
diff
eren
ce b
etw
een
two
over
lapp
ing
crat
ers?
Why
or
why
not
?
Exac
t ag
e d
iffe
ren
ces
can
no
t b
e d
eter
min
ed f
rom
th
e p
rin
cip
le o
f cr
oss
-cu
ttin
g
rela
tio
nsh
ips;
on
ly r
elat
ive
ages
can
be.
Fro
m t
he
ph
oto
s, t
her
e is
no
way
to
tel
l
wh
eth
er t
he
age
dif
fere
nce
is 1
0 m
inu
tes
or
10 m
illio
n y
ears
.
4.
Ifth
e sm
all c
rate
r in
ph
oto
II,l
abel
ed A
,is
44 k
m a
cros
s,w
hat
is t
he
scal
e fo
r th
atph
oto?
Wh
at is
th
e si
ze o
fth
e la
rge
crat
er,l
abel
ed D
?
Aft
er m
ult
iple
mea
sure
men
ts t
o a
vera
ge
ou
t th
e si
ze o
f cr
ater
A b
ecau
se o
f it
s
imp
erfe
ct s
hap
e, t
he
scal
e is
ap
pro
xim
atel
y 1
cm �
20 k
m. C
rate
r D
is a
bo
ut
130
km in
dia
met
er.
AN
AL
YZ
E
1.
Wh
ich
wou
ld b
e ol
der,
a cr
ater
th
at h
ad r
ays
cros
sin
g it
or
the
crat
er t
hat
cau
sed
the
rays
? E
xpla
in.
A c
rate
r th
at h
as r
ays
cro
ssin
g it
wo
uld
be
old
er t
han
th
e cr
ater
fro
m
wh
ich
th
e ra
ys o
rig
inat
e.
2.
Is t
her
e so
me
type
of
rela
tive
-age
dat
ing
that
sci
enti
sts
can
use
to
anal
yze
crat
ers
on E
arth
? E
xpla
in.
Rel
ativ
e ag
es o
f cr
ater
s o
n E
arth
can
no
t b
e b
ased
on
th
e p
rin
cip
le o
f cr
oss
-cu
ttin
g
rela
tio
nsh
ips,
bec
ause
th
e re
mai
nin
g c
rate
rs a
re s
o s
par
se t
hat
th
ey n
ever
ove
rlap
.
3.
Wh
at d
o yo
u t
hin
k ca
use
d th
e ch
ain
of
crat
ers
in p
hot
o I?
If
the
crat
er la
bele
d A
isap
prox
imat
ely
17 k
m a
cros
s,h
ow lo
ng
is t
he
chai
n o
fcr
ater
s?
The
chai
n o
f cr
ater
s w
as p
rob
ably
cau
sed
by
a fr
agm
ente
d im
pac
tor
that
arr
ived
as a
ser
ies
of
pie
ces
inst
ead
of
on
e b
ig c
hu
nk.
Th
e sc
ale
wo
uld
be
app
roxi
mat
ely
1 cm
�16
.2 k
m, s
o t
he
chai
n o
f cr
ater
s is
ab
ou
t 10
2.1
km.
CO
NC
LU
DE
AN
D A
PP
LY
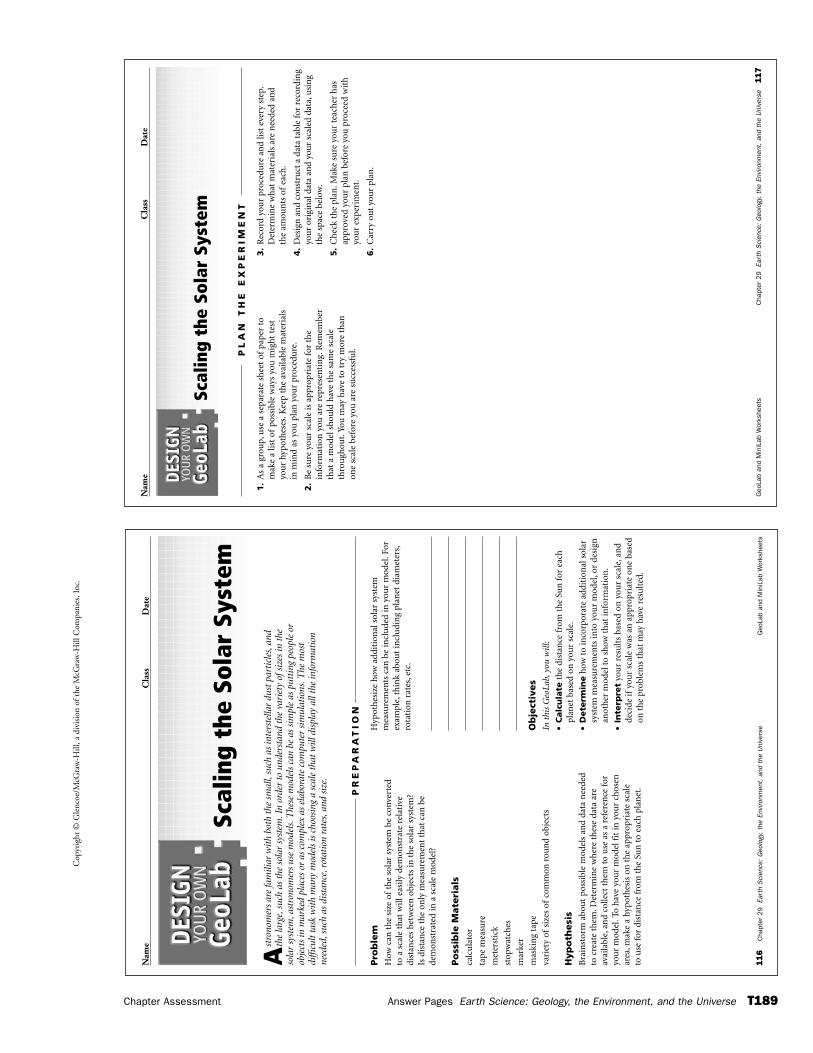
Cop
yrig
ht ©
Gle
ncoe
/McG
raw
-Hill
, a d
ivis
ion
of t
he M
cGra
w-H
ill C
ompa
nies
, Inc
.
Chapter Assessment Answer Pages Earth Science: Geology, the Environment, and the Universe T189
116
Cha
pter
29
Eart
h S
cien
ce:
Geo
logy
, th
e En
viro
nmen
t, a
nd t
he U
nive
rse
Geo
Lab
and
Min
iLab
Wor
kshe
ets
Nam
eC
lass
Dat
e
Ast
rono
mer
s ar
e fa
mili
ar w
ith
both
the
sm
all,
such
as
inte
rste
llar
dust
par
ticl
es,a
ndth
e la
rge,
such
as
the
sola
r sy
stem
.In
orde
r to
und
erst
and
the
vari
ety
ofsi
zes
in t
heso
lar
syst
em,a
stro
nom
ers
use
mod
els.
The
se m
odel
s ca
n be
as
sim
ple
as p
utti
ng p
eopl
e or
obje
cts
in m
arke
d pl
aces
or
as c
ompl
ex a
s el
abor
ate
com
pute
r si
mul
atio
ns.T
he m
ost
diffi
cult
task
wit
h m
any
mod
els
is c
hoos
ing
a sc
ale
that
will
dis
play
all
the
info
rmat
ion
need
ed,s
uch
as d
ista
nce,
rota
tion
rat
es,a
nd s
ize.
Pro
ble
mH
ow c
an t
he
size
of
the
sola
r sy
stem
be
conv
erte
dto
a s
cale
th
at w
ill e
asily
dem
onst
rate
rel
ativ
e di
stan
ces
betw
een
obj
ects
in t
he
sola
r sy
stem
? Is
dis
tan
ce t
he
only
mea
sure
men
t th
at c
an b
ede
mon
stra
ted
in a
sca
le m
odel
?
Po
ssib
le M
ate
rials
calc
ula
tor
tape
mea
sure
met
erst
ick
stop
wat
ches
mar
ker
mas
kin
g ta
pe
vari
ety
ofsi
zes
ofco
mm
on r
oun
d ob
ject
s
Hyp
oth
esi
sB
rain
stor
m a
bou
t po
ssib
le m
odel
s an
d da
ta n
eede
dto
cre
ate
them
.Det
erm
ine
wh
ere
thes
e da
ta a
reav
aila
ble,
and
colle
ct t
hem
to
use
as
a re
fere
nce
for
you
r m
odel
.To
hav
e yo
ur
mod
el f
it in
you
r ch
osen
area
,mak
e a
hypo
thes
is o
n t
he
appr
opri
ate
scal
e to
use
for
dis
tan
ce f
rom
th
e Su
n t
o ea
ch p
lan
et.
Hyp
oth
esiz
e h
ow a
ddit
ion
al s
olar
sys
tem
m
easu
rem
ents
can
be
incl
ude
d in
you
r m
odel
.For
exam
ple,
thin
k ab
out
incl
udi
ng
plan
et d
iam
eter
s,ro
tati
on r
ates
,etc
.
Ob
ject
ives
In t
his
Geo
Lab,
you
will
:
•C
alc
ula
teth
e di
stan
ce f
rom
th
e Su
n f
or e
ach
plan
et b
ased
on
you
r sc
ale.
•D
ete
rmin
eh
ow t
o in
corp
orat
e ad
diti
onal
sol
arsy
stem
mea
sure
men
ts in
to y
our
mod
el,o
r de
sign
anot
her
mod
el t
o sh
ow t
hat
info
rmat
ion
.
•In
terp
ret
you
r re
sult
s ba
sed
on y
our
scal
e,an
dde
cide
ifyo
ur
scal
e w
as a
n a
ppro
pria
te o
ne
base
don
th
e pr
oble
ms
that
may
hav
e re
sult
ed.
Scal
ing
the
Sola
r Sy
stem
PR
EP
AR
AT
ION
Nam
eC
lass
Dat
e
Geo
Lab
and
Min
iLab
Wor
kshe
ets
Cha
pter
29
Eart
h S
cien
ce:
Geo
logy
, th
e En
viro
nmen
t, a
nd t
he U
nive
rse
117
Scal
ing
the
Sola
r Sy
stem
1.
As
a gr
oup,
use
a s
epar
ate
shee
t of
pape
r to
mak
e a
list
ofpo
ssib
le w
ays
you
mig
ht
test
you
r hy
poth
eses
.Kee
p th
e av
aila
ble
mat
eria
lsin
min
d as
you
pla
n y
our
proc
edu
re.
2.
Be
sure
you
r sc
ale
is a
ppro
pria
te f
or t
he
info
rmat
ion
you
are
rep
rese
nti
ng.
Rem
embe
rth
at a
mod
el s
hou
ld h
ave
the
sam
e sc
ale
thro
ugh
out.
You
may
hav
e to
try
mor
e th
anon
e sc
ale
befo
re y
ou a
re s
ucc
essf
ul.
3.
Rec
ord
you
r pr
oced
ure
an
d lis
t ev
ery
step
.D
eter
min
e w
hat
mat
eria
ls a
re n
eede
d an
dth
eam
oun
ts o
fea
ch.
4.
Des
ign
an
d co
nst
ruct
a d
ata
tabl
e fo
r re
cord
ing
you
r or
igin
al d
ata
and
you
r sc
aled
dat
a,u
sin
gth
e sp
ace
belo
w.
5.
Ch
eck
the
plan
.Mak
e su
re y
our
teac
her
has
appr
oved
you
r pl
an b
efor
e yo
u p
roce
ed w
ith
you
r ex
peri
men
t.
6.
Car
ry o
ut
you
r pl
an.
PL
AN
TH
E E
XP
ER
IME
NT
Nam
eC
lass
Dat
e
Geo
Lab
and
Min
iLab
Wor
kshe
ets
Cha
pter
29
Eart
h S
cien
ce:
Geo
logy
, th
e En
viro
nmen
t, a
nd t
he U
nive
rse
119
Scal
ing
the
Sola
r Sy
stem
1.
Pro
xim
a C
enta
uri
,th
e cl
oses
t st
ar t
o ou
r Su
n,i
s ab
out
4.01
�10
13km
fro
m t
he
Sun
.Bas
ed o
n y
our
scal
e,h
ow f
ar w
ould
Pro
xim
a C
enta
uri
be
from
th
e su
n in
you
r m
odel
? If
you
wer
e to
fit
th
e di
stan
cebe
twee
n t
he
Sun
an
d P
roxi
ma
Cen
tau
ri in
to y
our
clas
sroo
m,h
ow s
mal
l wou
ld t
he
scal
ed d
ista
nce
betw
een
Plu
to a
nd
the
Sun
be?
An
swer
s w
ill v
ary
dep
end
ing
on
stu
den
ts’ s
cale
s.
2.
An
inte
rste
llar
dust
par
ticl
e is
1.0
�10
�6
m in
len
gth
.Con
vert
th
is m
easu
rem
ent
to y
our
scal
e.H
ow m
any
dust
par
ticl
es c
ould
fit
in t
he
dist
ance
bet
wee
n t
he
Sun
an
d Ju
pite
r? B
etw
een
Mar
san
d U
ran
us?
An
swer
s w
ill v
ary
dep
end
ing
on
stu
den
ts’ s
cale
s.
CO
NC
LU
DE
AN
D A
PP
LY
5.
Co
mp
are
an
d C
on
trast
Com
pare
an
d co
ntr
ast
you
r m
odel
wit
h o
ne
ofyo
ur
clas
smat
es’.
Wh
at w
ere
the
adva
nta
ges
ofth
e sc
ale
you
use
d? W
hat
wer
e th
e di
sadv
anta
ges?
How
wou
ldyo
uim
prov
e yo
ur
mod
el?
An
swer
s w
ill v
ary.
6.
Thin
kin
g C
riti
call
ySu
ppos
e th
at t
he
oute
r pl
anet
s ar
e th
ree
tim
es f
arth
er a
way
than
th
ey a
re n
ow.H
ow w
ould
th
is a
ffec
t yo
ur
mod
el?
Wh
at s
cale
wou
ld y
ou c
hoo
sen
ow?
Exp
lain
.
An
swer
s w
ill v
ary.
AN
AL
YZ
E
Cop
yrig
ht ©
Gle
ncoe
/McG
raw
-Hill
, a d
ivis
ion
of t
he M
cGra
w-H
ill C
ompa
nies
, Inc
.
T190 Answer Pages Earth Science: Geology, the Environment, and the Universe Chapter Assessment
Nam
eC
lass
Dat
e
118
Cha
pter
29
Eart
h S
cien
ce:
Geo
logy
, th
e En
viro
nmen
t, a
nd t
he U
nive
rse
Geo
Lab
and
Min
iLab
Wor
kshe
ets
Scal
ing
the
Sola
r Sy
stem
1.
Ch
eck
ing
Yo
ur
Hyp
oth
esi
sW
hic
h s
cale
wor
ked
the
best
for
you
r m
odel
?E
xpla
in.
Stu
den
ts’ a
nsw
ers
will
var
y. G
ener
ally
, lar
ger
sca
les
will
incl
ud
e m
ore
info
rmat
ion
.
2.
Inte
rpre
tin
g O
bse
rvati
on
sW
hat
pro
blem
s di
d yo
u h
ave
in f
indi
ng
a sc
ale?
Exp
lain
how
you
cor
rect
ed t
he
prob
lem
s.
An
swer
s w
ill v
ary.
Init
ially
, stu
den
ts w
ill t
ypic
ally
ch
oo
se a
sca
le t
hat
is t
oo
sm
all.
3.
Calc
ula
tin
g R
esu
lts
List
an
d ex
plai
n t
he
conv
ersi
ons
that
you
use
d to
cre
ate
you
rsc
ale
mod
el.I
fm
ult
iple
ste
ps w
ere
nec
essa
ry t
o co
nver
t to
you
r sc
ale
un
its,
how
cou
ldth
ey b
e co
mbi
ned
to
mak
e th
e pr
oces
s si
mpl
er?
Co
nve
rsio
ns
will
var
y. If
stu
den
ts c
on
vert
ed f
rom
AU
s to
kilo
met
ers
to m
eter
s,
they
can
mu
ltip
ly t
hei
r co
nve
rsio
n f
acto
rs t
o c
on
vert
dir
ectl
y fr
om
AU
s to
met
ers.
4.
Ob
serv
ing
an
d I
nfe
rrin
gW
hat
pos
sibl
e pr
oble
ms
cou
ld r
esu
lt f
rom
usi
ng
ave
ry la
rge
scal
e? A
sm
all s
cale
? E
xpla
in w
hy d
epic
tin
g a
scal
e m
odel
of
the
sola
r sy
stem
on a
sh
eet
ofn
oteb
ook
pape
r is
ext
rem
ely
diff
icu
lt.
An
swer
s w
ill v
ary.
Lar
ge
scal
es c
an b
e u
nm
anag
eab
le, w
hile
sm
all s
cale
s m
ake
it
dif
ficu
lt t
o f
it a
ll th
e d
etai
ls in
. Usi
ng
a s
hee
t o
f n
ote
bo
ok
pap
er m
akes
it d
iffi
cult
bec
ause
all
the
inn
er p
lan
ets
are
cru
nch
ed t
og
eth
er.
AN
AL
YZ
E
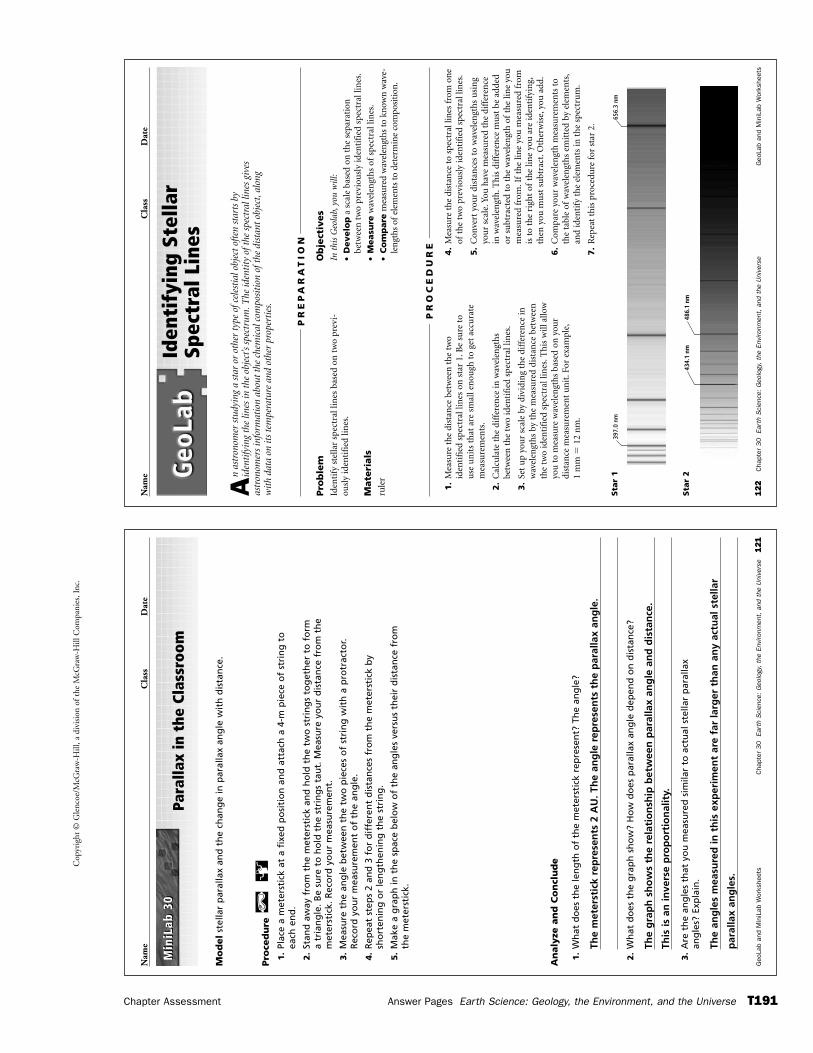
Cop
yrig
ht ©
Gle
ncoe
/McG
raw
-Hill
, a d
ivis
ion
of t
he M
cGra
w-H
ill C
ompa
nies
, Inc
.
Chapter Assessment Answer Pages Earth Science: Geology, the Environment, and the Universe T191
122
Cha
pter
30
Eart
h S
cien
ce:
Geo
logy
, th
e En
viro
nmen
t, a
nd t
he U
nive
rse
Geo
Lab
and
Min
iLab
Wor
kshe
ets
Nam
eC
lass
Dat
e
An
astr
onom
er s
tudy
ing
a st
ar o
r ot
her
type
ofc
eles
tial
obj
ect
ofte
n st
arts
by
iden
tify
ing
the
lines
in t
he o
bjec
t’s s
pect
rum
.The
iden
tity
oft
he s
pect
ral l
ines
giv
esas
tron
omer
s in
form
atio
n ab
out
the
chem
ical
com
posi
tion
oft
he d
ista
nt o
bjec
t,al
ong
wit
h da
ta o
n it
s te
mpe
ratu
re a
nd o
ther
pro
pert
ies.
Pro
ble
mId
enti
fy s
tella
r sp
ectr
al li
nes
bas
ed o
n t
wo
prev
i-ou
sly
iden
tifi
ed li
nes
.
Mate
rials
rule
r
Ob
ject
ives
In t
his
Geo
lab,
you
will
:
•D
evelo
pa
scal
e ba
sed
on t
he
sepa
rati
onbe
twee
n t
wo
prev
iou
sly
iden
tifi
ed s
pect
ral l
ines
.
•M
easu
rew
avel
engt
hs
ofsp
ectr
al li
nes
.
•C
om
pare
mea
sure
d w
avel
engt
hs t
o kn
own
wav
e-le
ngt
hs o
fel
emen
ts t
o de
term
ine
com
posi
tion
.
Iden
tify
ing
Stel
lar
Spec
tral
Lin
es
PR
EP
AR
AT
ION
1.
Mea
sure
th
e di
stan
ce b
etw
een
th
e tw
oid
enti
fied
spe
ctra
l lin
es o
n s
tar
1.B
e su
re t
ou
se u
nit
s th
at a
re s
mal
l en
ough
to
get
accu
rate
mea
sure
men
ts.
2.
Cal
cula
te t
he
diff
eren
ce in
wav
elen
gth
sbe
twee
n t
he
two
iden
tifi
ed s
pect
ral l
ines
.
3.
Set
up
you
r sc
ale
by d
ivid
ing
the
diff
eren
ce in
wav
elen
gth
s by
th
e m
easu
red
dist
ance
bet
wee
nth
e tw
o id
enti
fied
spe
ctra
l lin
es.T
his
will
allo
wyo
u t
o m
easu
re w
avel
engt
hs
base
d on
you
rdi
stan
ce m
easu
rem
ent
un
it.F
or e
xam
ple,
1 m
m �
12 n
m.
4.
Mea
sure
the
dis
tan
ce t
o sp
ectr
al li
nes
fro
m o
ne
ofth
e tw
o pr
evio
usl
y id
enti
fied
spe
ctra
l lin
es.
5.
Con
vert
you
r di
stan
ces
to w
avel
engt
hs
usi
ng
you
r sc
ale.
You
hav
e m
easu
red
the
diff
eren
cein
wav
elen
gth
.Th
is d
iffe
ren
ce m
ust
be
adde
dor
su
btra
cted
to
the
wav
elen
gth
of
the
line
you
mea
sure
d fr
om.I
fth
e lin
e yo
u m
easu
red
from
is t
o th
e ri
ght
ofth
e lin
e yo
u a
re id
enti
fyin
g,th
en y
ou m
ust
su
btra
ct.O
ther
wis
e,yo
u a
dd.
6.
Com
pare
you
r w
avel
engt
h m
easu
rem
ents
to
the
tabl
e of
wav
elen
gth
s em
itte
d by
ele
men
ts,
and
iden
tify
th
e el
emen
ts in
th
e sp
ectr
um
.
7.
Rep
eat
this
pro
cedu
re f
or s
tar
2.
PR
OC
ED
UR
E
Sta
r 1
Sta
r 2
397.
0 nm
656.
3 nm
486.
1 nm
434.
1 nm
Geo
Lab
and
Min
iLab
Wor
kshe
ets
Cha
pter
30
Eart
h S
cien
ce:
Geo
logy
, th
e En
viro
nmen
t, a
nd t
he U
nive
rse
121
Nam
eC
lass
Dat
e
Para
llax
in t
he C
lass
room
Mo
del
stel
lar
par
alla
x an
d t
he
chan
ge
in p
aral
lax
ang
le w
ith
dis
tan
ce.
Pro
ced
ure
1.
Plac
e a
met
erst
ick
at a
fix
ed p
osi
tio
n a
nd
att
ach
a 4
-m p
iece
of
stri
ng
to
each
en
d.
2.
Stan
d a
way
fro
m t
he
met
erst
ick
and
ho
ld t
he
two
str
ing
s to
get
her
to
fo
rma
tria
ng
le. B
e su
re t
o h
old
th
e st
rin
gs
tau
t. M
easu
re y
ou
r d
ista
nce
fro
m t
he
met
erst
ick.
Rec
ord
yo
ur
mea
sure
men
t.
3.
Mea
sure
th
e an
gle
bet
wee
n t
he
two
pie
ces
of
stri
ng
wit
h a
pro
trac
tor.
Rec
ord
yo
ur
mea
sure
men
t o
f th
e an
gle
.
4.
Rep
eat
step
s 2
and
3 f
or
dif
fere
nt
dis
tan
ces
fro
m t
he
met
erst
ick
by
sho
rten
ing
or
len
gth
enin
g t
he
stri
ng
.
5.
Mak
e a
gra
ph
in t
he
spac
e b
elo
w o
f th
e an
gle
s ve
rsu
s th
eir
dis
tan
ce f
rom
the
met
erst
ick.
An
aly
ze a
nd
Co
ncl
ud
e
1.
Wh
at d
oes
th
e le
ng
th o
f th
e m
eter
stic
k re
pre
sen
t? T
he
ang
le?
The
met
erst
ick
rep
rese
nts
2 A
U. T
he
ang
le r
epre
sen
ts t
he
par
alla
x an
gle
.
2.
Wh
at d
oes
th
e g
rap
h s
ho
w?
Ho
w d
oes
par
alla
x an
gle
dep
end
on
dis
tan
ce?
The
gra
ph
sh
ow
s th
e re
lati
on
ship
bet
wee
n p
aral
lax
ang
le a
nd
dis
tan
ce.
This
is a
n in
vers
e p
rop
ort
ion
alit
y.
3.
Are
th
e an
gle
s th
at y
ou
mea
sure
d s
imila
r to
act
ual
ste
llar
par
alla
xan
gle
s? E
xpla
in.
The
ang
les
mea
sure
d in
th
is e
xper
imen
t ar
e fa
r la
rger
th
an a
ny
actu
al s
tella
r
par
alla
x an
gle
s.
Min
iLab
30
Min
iLab
30
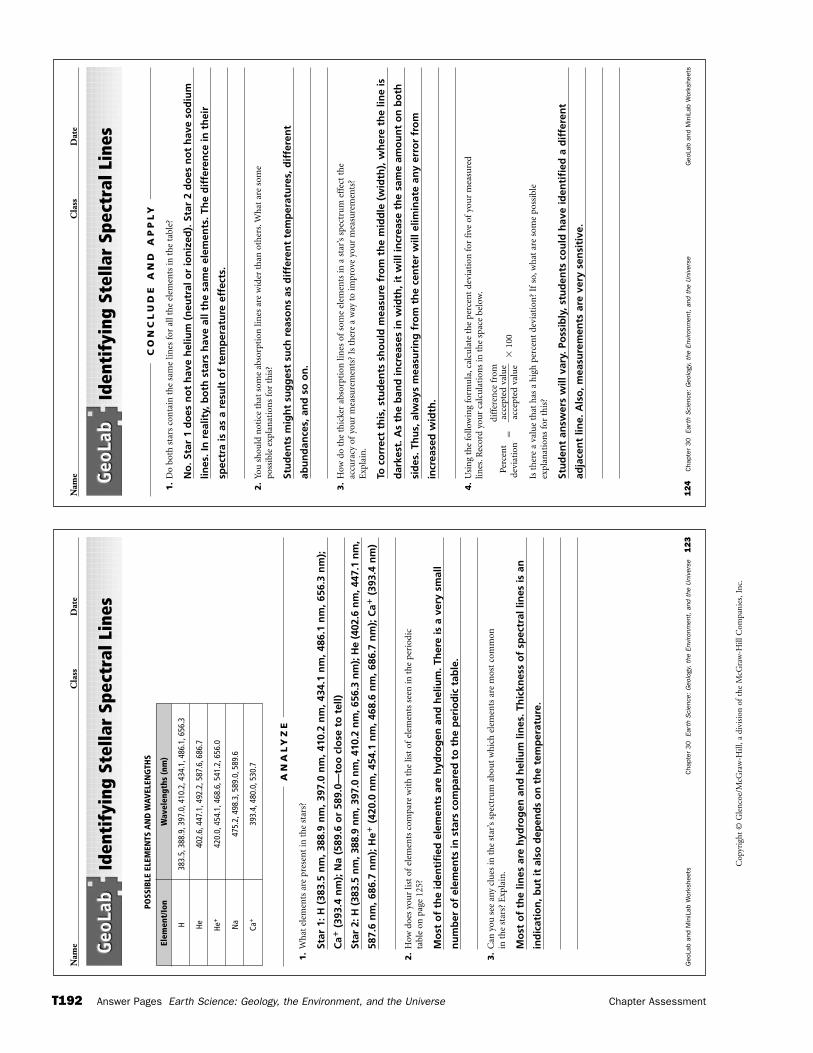
Nam
eC
lass
Dat
e
124
Cha
pter
30
Eart
h S
cien
ce:
Geo
logy
, th
e En
viro
nmen
t, a
nd t
he U
nive
rse
Geo
Lab
and
Min
iLab
Wor
kshe
ets
Iden
tify
ing
Stel
lar
Spec
tral
Lin
es
1.
Do
both
sta
rs c
onta
in t
he
sam
e lin
es f
or a
ll th
e el
emen
ts in
th
e ta
ble?
No
. Sta
r 1
do
es n
ot
hav
e h
eliu
m (
neu
tral
or
ion
ized
). S
tar
2 d
oes
no
t h
ave
sod
ium
lines
. In
rea
lity,
bo
th s
tars
hav
e al
l th
e sa
me
elem
ents
. Th
e d
iffe
ren
ce in
th
eir
spec
tra
is a
s a
resu
lt o
f te
mp
erat
ure
eff
ects
.
2.
You
sh
ould
not
ice
that
som
e ab
sorp
tion
lin
es a
re w
ider
th
an o
ther
s.W
hat
are
som
epo
ssib
le e
xpla
nat
ion
s fo
r th
is?
Stu
den
ts m
igh
t su
gg
est
such
rea
son
s as
dif
fere
nt
tem
per
atu
res,
dif
fere
nt
abu
nd
ance
s, a
nd
so
on
.
3.
How
do
the
thic
ker
abso
rpti
on li
nes
of
som
e el
emen
ts in
a s
tar’
s sp
ectr
um
eff
ect
the
accu
racy
of
you
r m
easu
rem
ents
? Is
th
ere
a w
ay t
o im
prov
e yo
ur
mea
sure
men
ts?
Exp
lain
.
To c
orr
ect
this
, stu
den
ts s
ho
uld
mea
sure
fro
m t
he
mid
dle
(w
idth
), w
her
e th
e lin
e is
dar
kest
. As
the
ban
d in
crea
ses
in w
idth
, it
will
incr
ease
th
e sa
me
amo
un
t o
n b
oth
sid
es. T
hu
s, a
lway
s m
easu
rin
g f
rom
th
e ce
nte
r w
ill e
limin
ate
any
erro
r fr
om
incr
ease
d w
idth
.
4.
Usi
ng
the
follo
win
g fo
rmu
la,c
alcu
late
th
e pe
rcen
t de
viat
ion
for
fiv
e of
you
r m
easu
red
lines
.Rec
ord
you
r ca
lcu
lati
ons
in t
he
spac
e be
low
.
diff
eren
ce f
rom
Pe
rcen
t �
acce
pted
val
ue
�10
0de
viat
ion
acce
pted
val
ue
Is t
her
e a
valu
e th
at h
as a
hig
h p
erce
nt
devi
atio
n?
Ifso
,wh
at a
re s
ome
poss
ible
expl
anat
ion
s fo
r th
is?
Stu
den
t an
swer
s w
ill v
ary.
Po
ssib
ly, s
tud
ents
co
uld
hav
e id
enti
fied
a d
iffe
ren
t
adja
cen
t lin
e. A
lso
, mea
sure
men
ts a
re v
ery
sen
siti
ve.
CO
NC
LU
DE
AN
D A
PP
LY
Nam
eC
lass
Dat
e
Geo
Lab
and
Min
iLab
Wor
kshe
ets
Cha
pter
30
Eart
h S
cien
ce:
Geo
logy
, th
e En
viro
nmen
t, a
nd t
he U
nive
rse
123
Iden
tify
ing
Stel
lar
Spec
tral
Lin
es
1.
Wh
at e
lem
ents
are
pre
sen
t in
th
e st
ars?
Star
1: H
(38
3.5
nm
, 388
.9 n
m, 3
97.0
nm
, 410
.2 n
m, 4
34.1
nm
, 486
.1 n
m, 6
56.3
nm
);
Ca�
(393
.4 n
m);
Na
(589
.6 o
r 58
9.0—
too
clo
se t
o t
ell)
Star
2: H
(38
3.5
nm
, 388
.9 n
m, 3
97.0
nm
, 410
.2 n
m, 6
56.3
nm
); H
e (4
02.6
nm
, 447
.1 n
m,
587.
6 n
m, 6
86.7
nm
); H
e�(4
20.0
nm
, 454
.1 n
m, 4
68.6
nm
, 686
.7 n
m);
Ca�
(393
.4 n
m)
2.
How
doe
s yo
ur
list
ofel
emen
ts c
ompa
re w
ith
th
e lis
t of
elem
ents
see
n in
th
e pe
riod
icta
ble
on p
age
125?
Mo
st o
f th
e id
enti
fied
ele
men
ts a
re h
ydro
gen
an
d h
eliu
m. T
her
e is
a v
ery
smal
l
nu
mb
er o
f el
emen
ts in
sta
rs c
om
par
ed t
o t
he
per
iod
ic t
able
.
3.
Can
you
see
any
clu
es in
th
e st
ar’s
spe
ctru
m a
bou
t w
hic
h e
lem
ents
are
mos
t co
mm
onin
th
e st
ars?
Exp
lain
.
Mo
st o
f th
e lin
es a
re h
ydro
gen
an
d h
eliu
m li
nes
. Th
ickn
ess
of
spec
tral
lin
es is
an
ind
icat
ion
, bu
t it
als
o d
epen
ds
on
th
e te
mp
erat
ure
.
AN
AL
YZ
E
Elem
ent/
Ion
Wav
elen
gths
(nm
)
H38
3.5,
388.
9,39
7.0,
410.
2,43
4.1,
486.
1,65
6.3
He40
2.6,
447.
1,49
2.2,
587.
6,68
6.7
He+
420.
0,45
4.1,
468.
6,54
1.2,
656.
0
Na
475.
2,49
8.3,
589.
0,58
9.6
Ca+
393.
4,48
0.0,
530.
7
POSS
IBLE
ELE
MEN
TS A
ND
WAV
ELEN
GTH
S
Cop
yrig
ht ©
Gle
ncoe
/McG
raw
-Hill
, a d
ivis
ion
of t
he M
cGra
w-H
ill C
ompa
nies
, Inc
.
T192 Answer Pages Earth Science: Geology, the Environment, and the Universe Chapter Assessment
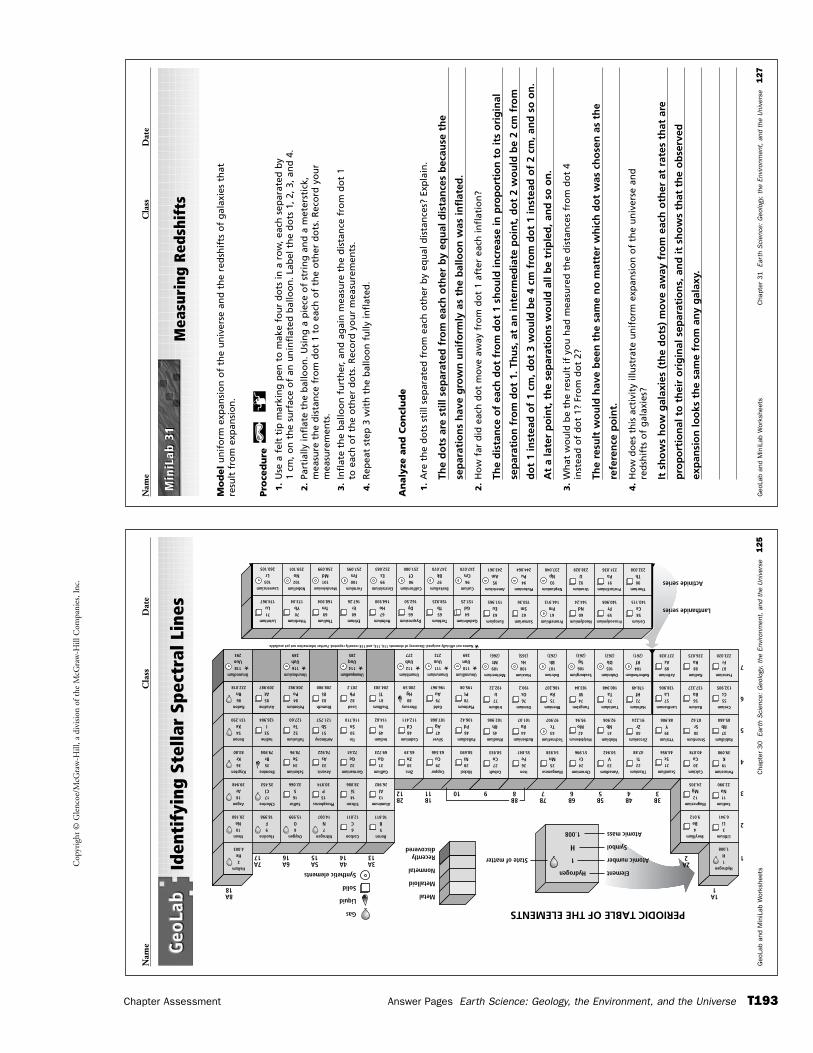
Cop
yrig
ht ©
Gle
ncoe
/McG
raw
-Hill
, a d
ivis
ion
of t
he M
cGra
w-H
ill C
ompa
nies
, Inc
.
Chapter Assessment Answer Pages Earth Science: Geology, the Environment, and the Universe T193
Geo
Lab
and
Min
iLab
Wor
kshe
ets
Cha
pter
31
Eart
h S
cien
ce:
Geo
logy
, th
e En
viro
nmen
t, a
nd t
he U
nive
rse
127
Nam
eC
lass
Dat
e
Mea
suri
ng R
edsh
ifts
Mo
del
un
ifo
rm e
xpan
sio
n o
f th
e u
niv
erse
an
d t
he
red
shif
ts o
f g
alax
ies
that
re
sult
fro
m e
xpan
sio
n.
Pro
ced
ure
1.
Use
a f
elt
tip
mar
kin
g p
en t
o m
ake
fou
r d
ots
in a
ro
w, e
ach
sep
arat
ed b
y 1
cm, o
n t
he
surf
ace
of
an u
nin
flat
ed b
allo
on
. Lab
el t
he
do
ts 1
, 2, 3
, an
d 4
.
2.
Part
ially
infl
ate
the
bal
loo
n. U
sin
g a
pie
ce o
f st
rin
g a
nd
a m
eter
stic
k,m
easu
re t
he
dis
tan
ce f
rom
do
t 1
to e
ach
of
the
oth
er d
ots
. Rec
ord
yo
ur
mea
sure
men
ts.
3.
Infl
ate
the
bal
loo
n f
urt
her
, an
d a
gai
n m
easu
re t
he
dis
tan
ce f
rom
do
t 1
to e
ach
of
the
oth
er d
ots
. Rec
ord
yo
ur
mea
sure
men
ts.
4.
Rep
eat
step
3 w
ith
th
e b
allo
on
fu
lly in
flat
ed.
An
aly
ze a
nd
Co
ncl
ud
e
1.
Are
th
e d
ots
sti
ll se
par
ated
fro
m e
ach
oth
er b
y eq
ual
dis
tan
ces?
Exp
lain
.
The
do
ts a
re s
till
sep
arat
ed f
rom
eac
h o
ther
by
equ
al d
ista
nce
s b
ecau
se t
he
sep
arat
ion
s h
ave
gro
wn
un
ifo
rmly
as
the
bal
loo
n w
as in
flat
ed.
2.
Ho
w f
ar d
id e
ach
do
t m
ove
aw
ay f
rom
do
t 1
afte
r ea
ch in
flat
ion
?
The
dis
tan
ce o
f ea
ch d
ot
fro
m d
ot
1 sh
ou
ld in
crea
se in
pro
po
rtio
n t
o it
s o
rig
inal
sep
arat
ion
fro
m d
ot
1. T
hu
s, a
t an
inte
rmed
iate
po
int,
do
t 2
wo
uld
be
2 cm
fro
m
do
t 1
inst
ead
of
1 cm
, do
t 3
wo
uld
be
4 cm
fro
m d
ot
1 in
stea
d o
f 2
cm, a
nd
so
on
.
At
a la
ter
po
int,
th
e se
par
atio
ns
wo
uld
all
be
trip
led
, an
d s
o o
n.
3.
Wh
at w
ou
ld b
e th
e re
sult
if y
ou
had
mea
sure
d t
he
dis
tan
ces
fro
m d
ot
4in
stea
d o
f d
ot
1? F
rom
do
t 2?
The
resu
lt w
ou
ld h
ave
bee
n t
he
sam
e n
o m
atte
r w
hic
h d
ot
was
ch
ose
n a
s th
e
refe
ren
ce p
oin
t.
4.
Ho
w d
oes
th
is a
ctiv
ity
illu
stra
te u
nif
orm
exp
ansi
on
of
the
un
iver
se a
nd
red
shif
ts o
f g
alax
ies?
It s
ho
ws
ho
w g
alax
ies
(th
e d
ots
) m
ove
aw
ay f
rom
eac
h o
ther
at
rate
s th
at a
re
pro
po
rtio
nal
to
th
eir
ori
gin
al s
epar
atio
ns,
an
d it
sh
ow
s th
at t
he
ob
serv
ed
exp
ansi
on
loo
ks t
he
sam
e fr
om
an
y g
alax
y.
Min
iLab
31
Min
iLab
31
Nam
eC
lass
Dat
e
Geo
Lab
and
Min
iLab
Wor
kshe
ets
Cha
pter
30
Eart
h S
cien
ce:
Geo
logy
, th
e En
viro
nmen
t, a
nd t
he U
nive
rse
125
Iden
tify
ing
Stel
lar
Spec
tral
Lin
es
PERIODIC TABLE OF THE ELEMENTS
Hydrogen
1
H
1.008
Element
Atomic number
Symbol
Atomic mass
State of matter
Metal
Metalloid
Nonmetal
Recently discovered
Gas
Liquid
Solid
Synthetic elementsHydrogen
1
H1.008
Helium
2
He4.003
Lithium
3
Li6.941
Sodium
11
Na22.990
Potassium
19
K39.098
Rubidium
37
Rb85.468
Cesium
55
Cs132.905
Francium
87
Fr223.020
Radium
88
Ra226.025
Cerium
58
Ce140.115
Thorium
90
Th232.038
Uranium
92
U238.029
Neptunium
93
Np237.048
Plutonium
94
Pu244.064
Americium
95
Am243.061
Curium
96
Cm247.070
Berkelium
97
Bk247.070
Californium
98
Cf251.080
Einsteinium
99
Es252.083
Fermium
100
Fm257.095
Nobelium
102
No259.101
Lawrencium
103
Lr260.105
Mendelevium
101
Md258.099
Neodymium
60
Nd144.24
Promethium
61
Pm144.913
Samarium
62
Sm150.36
Europium
63
Eu151.965
Gadolinium
64
Gd157.25
Terbium
65
Tb158.925
Dysprosium
66
Dy162.50
Holmium
67
Ho164.930
Erbium
68
Er167.26
Thulium
69
Tm168.934
Ytterbium
70
Yb173.04
Lutetium
71
Lu174.967
Praseodymium
59
Pr140.908
Protactinium
91
Pa231.036
Actinium
89
Ac227.028
Rutherfordium
104
Rf(261)
Barium
56
Ba137.327
Lanthanum
57
La138.906
Hafnium
72
Hf178.49
Tantalum
73
Ta180.948
Dubnium
105
Db(262)
Seaborgium
106
Sg(263)
Hassium
108
Hs(265)
Meitnerium
109
Mt(266)
Ununnilium
110
Uun269
Unununium
111
Uuu272
Unumbium
112
Uub277
Ununquadium
114
Uuq285
Ununhexium
116
Uuh289
Ununodium
118
Uuo293
Bohrium
107
Bh(262)
Tungsten
74
W183.84
Rhenium
75
Re186.207
Osmium
76
Os190.2
Iridium
77
Ir192.22
Platinum
78
Pt195.08
Gold
79
Au196.967
Mercury
80
Hg200.59
Thallium
81
Tl204.383
Lead
82
Pb207.2
Bismuth
83
Bi208.980
Astatine
85
At209.987
Radon
86
Rn222.018
Strontium
38
Sr87.62
Yttrium
39
Y88.906
Zirconium
40
Zr91.224
Niobium
41
Nb92.906
Molybdenum
42
Mo95.94
Calcium
20
Ca40.078
Scandium
21
Sc44.956
Titanium
22
Ti47.88
Vanadium
23
V50.942
Chromium
24
Cr51.996
Technetium
43
Tc97.907
Ruthenium
44
Ru101.07
Manganese
25
Mn54.938
Iron
26
Fe55.847
Cobalt
27
Co58.933
Nickel
28
Ni58.693
Copper
29
Cu63.546
Zinc
30
Zn65.39
Gallium
31
Ga69.723
Germanium
32
Ge72.61
Arsenic
33
As74.922
Selenium
34
Se78.96
Bromine
35
Br79.904
Krypton
36
Kr83.80
Rhodium
45
Rh102.906
Palladium
46
Pd106.42
Silver
47
Ag107.868
Cadmium
48
Cd112.411
Indium
49
In114.82
Tin
50
Sn118.710
Antimony
51
Sb121.757
Tellurium
52
Te127.60
Iodine
53
I126.904
Xenon
54
Xe131.290
Magnesium
12
Mg24.305
Aluminum
13
Al26.982
Silicon
14
Si28.086
Phosphorus
15
P30.974
Sulfur
16
S32.066
Chlorine
17
Cl35.453
Argon
18
Ar39.948
Beryllium
4
Be9.012
Boron
5
B10.811
Carbon
6
C12.011
Nitrogen
7
N14.007
Oxygen
8
O15.999
Fluorine
9
F18.998
Neon
10
Ne20.180
Lanthanide series
Actinide series
1A1
12A2
2
3
4
5
6
7
9101B11
2B12
3A13
4A14
5A15
6A16
7A17
8A18
3B3
4B4
5B5
6B6
7B7
Polonium
84
Po208.982
Names not officially assigned. Discovery of elements 114, 116, and 118 recently reported. Further information not yet available.*
******
8B8
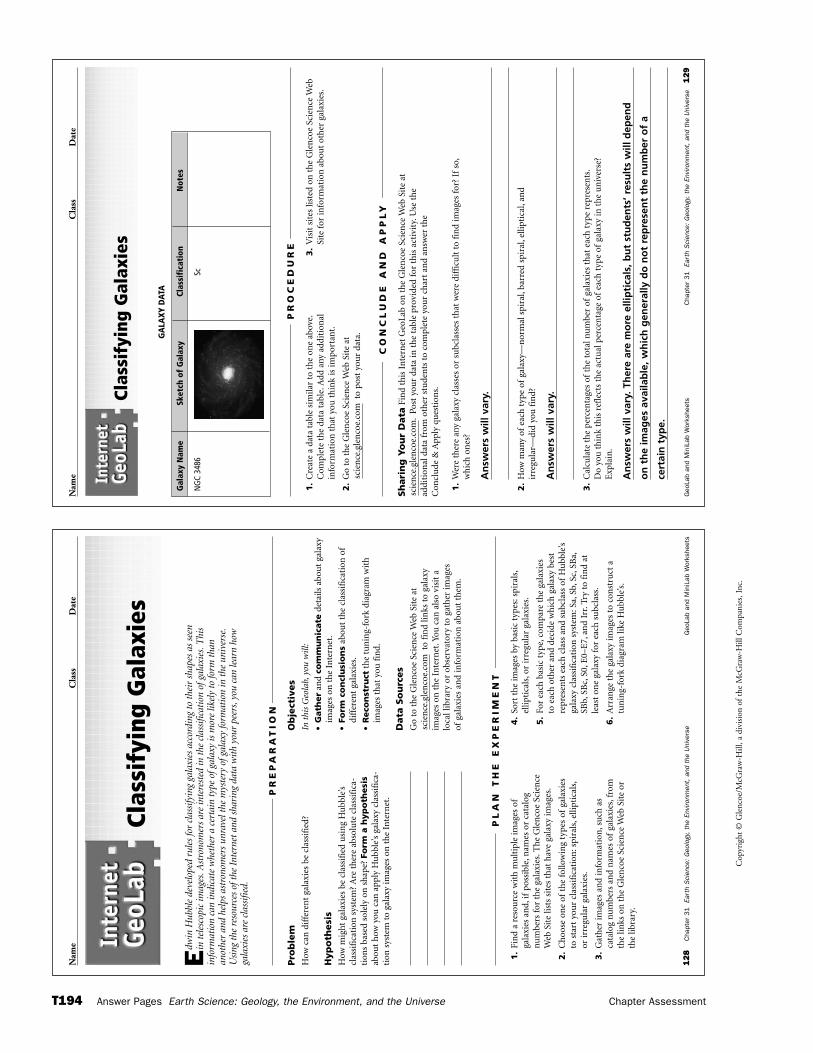
Cop
yrig
ht ©
Gle
ncoe
/McG
raw
-Hill
, a d
ivis
ion
of t
he M
cGra
w-H
ill C
ompa
nies
, Inc
.
T194 Answer Pages Earth Science: Geology, the Environment, and the Universe Chapter Assessment
Nam
eC
lass
Dat
e
Geo
Lab
and
Min
iLab
Wor
kshe
ets
Cha
pter
31
Eart
h S
cien
ce:
Geo
logy
, th
e En
viro
nmen
t, a
nd t
he U
nive
rse
129
Clas
sify
ing
Gal
axie
s
1.
Cre
ate
a da
ta t
able
sim
ilar
to t
he
one
abov
e.C
ompl
ete
the
data
tab
le.A
dd a
ny a
ddit
ion
alin
form
atio
n t
hat
you
th
ink
is im
port
ant.
2.
Go
to t
he
Gle
nco
e Sc
ien
ce W
eb S
ite
atto
pos
t yo
ur
data
.
3.
Vis
it s
ites
list
ed o
n t
he
Gle
nco
e Sc
ien
ce W
ebSi
te f
or in
form
atio
n a
bou
t ot
her
gal
axie
s.
scie
nce
.gle
nco
e.co
m
PR
OC
ED
UR
E
Sh
ari
ng
Yo
ur
Data
Fin
d th
is I
nte
rnet
Geo
Lab
on t
he
Gle
nco
e Sc
ien
ce W
eb S
ite
at
Post
you
r da
ta in
th
e ta
ble
prov
ided
for
th
is a
ctiv
ity.
Use
th
e ad
diti
onal
dat
a fr
om o
ther
stu
den
ts t
o co
mpl
ete
you
r ch
art
and
answ
er t
he
Con
clu
de &
App
ly q
ues
tion
s.
1.
Wer
e th
ere
any
gala
xy c
lass
es o
r su
bcla
sses
th
at w
ere
diff
icu
lt t
o fi
nd
imag
es f
or?
Ifso
,w
hic
h o
nes
?
An
swer
s w
ill v
ary.
2.
How
man
y of
each
typ
e of
gala
xy—
nor
mal
spi
ral,
barr
ed s
pira
l,el
lipti
cal,
and
irre
gula
r—di
d yo
u f
ind?
An
swer
s w
ill v
ary.
3.
Cal
cula
te t
he
perc
enta
ges
ofth
e to
tal n
um
ber
ofga
laxi
es t
hat
eac
h t
ype
repr
esen
ts.
Do
you
th
ink
this
ref
lect
s th
e ac
tual
per
cen
tage
of
each
typ
e of
gala
xy in
th
e u
niv
erse
?E
xpla
in.
An
swer
s w
ill v
ary.
Th
ere
are
mo
re e
llip
tica
ls, b
ut
stu
den
ts’ r
esu
lts
will
dep
end
on
th
e im
ages
ava
ilab
le, w
hic
h g
ener
ally
do
no
t re
pre
sen
t th
e n
um
ber
of
a
cert
ain
typ
e.
scie
nce
.gle
nco
e.co
m.
CO
NC
LU
DE
AN
D A
PP
LY
Gal
axy
Nam
eSk
etch
of
Gal
axy
Clas
sifi
cati
onN
otes
NG
C 34
86Sc
GA
LAX
Y D
ATA
128
Cha
pter
31
Eart
h S
cien
ce:
Geo
logy
, th
e En
viro
nmen
t, a
nd t
he U
nive
rse
Geo
Lab
and
Min
iLab
Wor
kshe
ets
Nam
eC
lass
Dat
e
Edw
in H
ubbl
e de
velo
ped
rule
s fo
r cl
assi
fyin
g ga
laxi
es a
ccor
ding
to
thei
r sh
apes
as
seen
in t
eles
copi
c im
ages
.Ast
rono
mer
s ar
e in
tere
sted
in t
he c
lass
ifica
tion
ofg
alax
ies.
Thi
sin
form
atio
n ca
n in
dica
te w
heth
er a
cer
tain
typ
e of
gala
xy is
mor
e lik
ely
to fo
rm t
han
anot
her
and
help
s as
tron
omer
s un
rave
l the
mys
tery
ofg
alax
y fo
rmat
ion
in t
he u
nive
rse.
Usi
ng t
he r
esou
rces
oft
he I
nter
net
and
shar
ing
data
wit
h yo
ur p
eers
,you
can
lear
n ho
wga
laxi
es a
re c
lass
ified
.
Pro
ble
mH
ow c
an d
iffe
ren
t ga
laxi
es b
e cl
assi
fied
?
Hyp
oth
esi
sH
ow m
igh
t ga
laxi
es b
e cl
assi
fied
usi
ng
Hu
bble
’scl
assi
fica
tion
sys
tem
? A
re t
her
e ab
solu
te c
lass
ific
a-ti
ons
base
d so
lely
on
sh
ape?
Fo
rm a
hyp
oth
esi
sab
out
how
you
can
app
ly H
ubb
le’s
gal
axy
clas
sifi
ca-
tion
sys
tem
to
gala
xy im
ages
on
th
e In
tern
et.
Ob
ject
ives
In t
his
Geo
lab,
you
will
:
•G
ath
er
and
com
mu
nic
ate
deta
ils a
bou
t ga
laxy
imag
es o
n t
he
Inte
rnet
.
•Fo
rm c
on
clu
sio
ns
abou
t th
e cl
assi
fica
tion
of
diff
eren
t ga
laxi
es.
•R
eco
nst
ruct
the
tun
ing-
fork
dia
gram
wit
him
ages
th
at y
ou f
ind.
Data
So
urc
es
Go
to t
he
Gle
nco
e Sc
ien
ce W
eb S
ite
at
to f
ind
links
to
gala
xy
imag
es o
n t
he
Inte
rnet
.You
can
als
o vi
sit
a lo
cal l
ibra
ry o
r ob
serv
ator
y to
gat
her
imag
es
ofga
laxi
es a
nd
info
rmat
ion
abo
ut
them
.
scie
nce
.gle
nco
e.co
m
Clas
sify
ing
Gal
axie
s
PR
EP
AR
AT
ION
1.
Fin
d a
reso
urc
e w
ith
mu
ltip
le im
ages
of
gala
xies
an
d,if
poss
ible
,nam
es o
r ca
talo
gn
um
bers
for
th
e ga
laxi
es.T
he
Gle
nco
e Sc
ien
ceW
eb S
ite
lists
sit
es t
hat
hav
e ga
laxy
imag
es.
2.
Ch
oose
on
e of
the
follo
win
g ty
pes
ofga
laxi
esto
sta
rt y
our
clas
sifi
cati
on:s
pira
ls,e
llipt
ical
s,or
irre
gula
r ga
laxi
es.
3.
Gat
her
imag
es a
nd
info
rmat
ion
,su
ch a
sca
talo
g n
um
bers
an
d n
ames
of
gala
xies
,fro
mth
e lin
ks o
n t
he
Gle
nco
e Sc
ien
ce W
eb S
ite
orth
e lib
rary
.
4.
Sort
th
e im
ages
by
basi
c ty
pes:
spir
als,
ellip
tica
ls,o
r ir
regu
lar
gala
xies
.
5.
For
each
bas
ic t
ype,
com
pare
th
e ga
laxi
esto
each
oth
er a
nd
deci
de w
hic
h g
alax
y be
stre
pres
ents
eac
h c
lass
an
d su
bcla
ss o
fH
ubb
le’s
gala
xy c
lass
ific
atio
n s
yste
m:S
a,Sb
,Sc,
SBa,
SBb,
SBc,
S0,E
0–E
7,an
d Ir
r.Tr
y to
fin
d at
leas
t on
e ga
laxy
for
eac
h s
ubc
lass
.
6.
Arr
ange
th
e ga
laxy
imag
es t
o co
nst
ruct
atu
nin
g-fo
rk d
iagr
am li
ke H
ubb
le’s
.
PL
AN
TH
E E
XP
ER
IME
NT
Cop
yrig
ht ©
Gle
ncoe
/McG
raw
-Hill
, a d
ivis
ion
of t
he M
cGra
w-H
ill C
ompa
nies
, Inc
.
Chapter Assessment Answer Pages Earth Science: Geology, the Environment, and the Universe T195
Nam
eC
lass
Dat
e
130
Cha
pter
31
Eart
h S
cien
ce:
Geo
logy
, th
e En
viro
nmen
t, a
nd t
he U
nive
rse
Geo
Lab
and
Min
iLab
Wor
kshe
ets
Clas
sify
ing
Gal
axie
s
4.
Wer
e th
ere
any
gala
xy im
ages
th
at y
ou f
oun
d th
at d
idn’
t fi
t yo
ur
clas
sifi
cati
on s
chem
e?If
so,w
hy?
Irre
gu
lar
gal
axie
s an
d s
om
e ac
tive
gal
axie
s w
ill n
ot
fit
into
th
e H
ub
ble
cla
ssif
icat
ion
sch
eme
bec
ause
of
thei
r u
nu
sual
sh
apes
.
5.
Was
it d
iffi
cult
to
dist
ingu
ish
bet
wee
n a
nor
mal
spi
ral a
nd
a ba
rred
spi
ral i
n s
ome
case
s? E
xpla
in y
our
met
hod
.
It c
an b
e d
iffi
cult
. Det
erm
inin
g h
ow
clo
se t
o t
he
nu
cleu
s th
e ar
ms
are
and
wh
eth
er t
he
nu
cleu
s is
elo
ng
ated
hel
ps.
6.
Wh
at p
robl
ems
did
you
hav
e w
ith
gal
axie
s th
at a
re e
dge-
on a
s se
en f
rom
Ear
th?
Edg
e-o
n g
alax
ies
are
gen
eral
ly s
pir
als.
If it
isn
’t p
oss
ible
to
see
th
e ar
ms
and
nu
cleu
s,
it is
n’t
po
ssib
le t
o c
lass
ify
an e
dg
e-o
n g
alax
y an
y fu
rth
er t
han
as
a sp
iral
.
7.
Elli
ptic
als
are
usu
ally
a d
iffi
cult
typ
e of
gala
xy t
o cl
assi
fy.W
hy?
Ther
e is
no
t a
larg
e am
ou
nt
of
vari
atio
n in
ap
pea
ran
ce b
etw
een
ad
jace
nt
sub
clas
ses.
Ast
ron
om
ers
actu
ally
use
a f
orm
ula
th
at h
elp
s to
det
erm
ine
the
sub
clas
ses
mo
re
accu
rate
ly. A
lso
, an
elli
pti
cal g
alax
y m
ay lo
ok
very
dif
fere
nt
fro
m a
dif
fere
nt
per
spec
tive
wit
hin
th
e u
niv
erse
. Bec
ause
of
this
, elli
pti
cal s
ub
clas
ses
are
no
t
def
init
ive
clas
sifi
cati
on
s.
CO
NC
LU
DE
AN
D A
PP
LY