Embed Size (px)
Citation preview

W-WO2 and W-WO3 Oxygen Fugacity Relationship at High Temperature and Pressure
Geol394 Thesis
TJ Deane
Advisor: Dr. Andrew Campbell

1
1. Abstract
There are elements within the Earth that partition between both the iron rich core and the
silicate portion of the Earth. Understanding the behavior of these elements under specific redox
conditions can help to lead to a better understanding of how these elements behaved and
partitioned themselves during core-mantle separation in the early stages of Earth’s evolution.
Tungsten is one of these partly siderophile, partly lithophile elements that are found in both the
core and silicate Earth. In addition, some scientists use the tungsten-tungsten oxide buffer to
control the oxygen fugacity in experiments at high pressures, and understanding the effect that
high pressure has on this buffer is important to better control the experiments. I have studied
tungsten and tungsten oxide in an attempt to evaluate their physical response to high
temperatures and pressures. I have experimented with tungsten and tungsten oxide in a diamond
anvil cell with a specially designed heater while using x-ray diffraction techniques to analyze the
phases. For a given temperature and pressure, the crystallographic structures of the metal and
the oxide have a specific volume, and that volume changes as the temperature and pressure
conditions change. By understanding how the x-ray diffraction patterns change we can measure
how the size of the unit cell changes with temperature and pressure. The equation of state of a
material expresses the relationship among pressure, temperature, and the volume of a phase.
This equation of state is applied to an equation for Gibbs free energy to calculate Gibbs free
energy at high pressure. The difference between the Gibbs free energies for the tungsten metal
and tungsten oxide is then related to an oxygen fugacity term which is plotted against
temperature to create what is called a buffer curve. I plotted buffer curves for both WO2 and
WO3 at varying pressures to observe how they change as I simulate conditions deeper within the
Earth. At 1 bar of pressure, the WO2 curve plots below the WO3 curve, meaning WO2 should be
more prevalent at Earth surface, but research suggests that may not be the case. As the pressure
is increased, the distance between the WO2 curve and the WO3 curve increases. This suggests
that as the pressure is increased, the WO2 phase becomes more and more stable relative to WO3.
2. Introduction
Elements within the Earth can be split into two main categories: lithophile elements and
siderophile elements. Lithophile elements are concentrated within the silicate portion of the
Earth, and siderophile elements are concentrated within the iron-rich core of the Earth. There are
some elements, however, that are partly lithophile and partly siderophile; that is, they are found
in some quantity in both. Understanding why and how these elements partition between the
metallic core and the silicate portions of the Earth is an ongoing investigation (Righter et al.,
2003). Part of the method to solving this investigation involves trying to understand the physical
and chemical properties of each of these moderately siderophile elements under a wide range of
external environmental conditions such as large changes in temperature and pressure. Iron is an
example of an element that is both lithophile and siderophile. Other moderately siderophile
elements are chromium, manganese, nickel, and tungsten, along with other transition metals
(Righter et al., 2003).
The chemical and physical properties of the tungsten-oxygen system are not well
determined at high temperatures and pressures. There is an established equation of state for
tungsten metal which is believed to be accurate, but there is no good model for tungsten dioxide

2
or tungsten trioxide. An equation of state relates the molar volume of a material to temperature
and pressure. Having an accurate, well-established equation of state is important in determining
other chemical properties of a material. Using the equation of state, Gibbs free energy is
calculated for phases in a system. The oxygen fugacity (fO2) is a measure of the chemical
potential of O2, or how readily the metal will react with oxygen to form its oxide. An oxygen
fugacity buffer curve plots lnfO2 against temperature for many phases.
Relating an equation of state to oxygen fugacity is done using a property called Gibbs
free energy. An equation relating how Gibbs free energy varies with temperature and pressure
is:
dG = -SdT + VdP
Where S = entropy
T= temperature
V = molar volume
P = pressure
Therefore, for a fixed temperature: dG = VdP
A fundamental property of Gibbs free energy is that when the system is at equilibrium, the G of
the products is equal to the G of the reactants. For the tungsten-tungsten oxide system:
G(O2) = G(WOx) - G(W)
Along the tungsten-tungsten dioxide oxygen fugacity buffer curve, G(O2) is a measured and
known quantity at 1 bar of pressure. It takes the equation:
G(O2) = RTlnfO2
The Gibbs free energy of O2 at higher temperatures and pressures is G(O2) at 1 bar plus the
integrated change in Gibbs free energy with respect to pressure. Combining the previous
equations, along an isotherm:
RTlnfO2(P,T) = RTlnfO2(1 bar, T) + ∫∆VdP
Where R = Gas Constant
lnfO2 = log oxygen fugacity
P = pressure
∆V = change in molar volume = Voxide - Vmetal
In this final equation, the only unknown term is this ∆V term, or the change in molar volume
between the oxide and the metal at temperature and pressure (Campbell et al., 2009).
Calculating ΔV allows us to calculate the oxygen fugacity using the previous equation, and plot
that oxygen fugacity against temperature to form an oxygen fugacity buffer curve at higher
pressures. Buffer curves have been established for tungsten dioxide and tungsten trioxide at 1
bar of pressure (O’Neill et al., 2008), and this research is designed to study how these buffer
curves change with pressure. Some research suggests that the valence of tungsten in silicate

3
melts changes from W+6
to W+4
as pressure in increased (Cottrell et al., 2009). This would mean
we would expect to see the oxygen fugacity buffer curves moving in relation to one another.
Calculating ΔV of tungsten and tungsten oxide at pressure and temperature can be done
mathematically if an equation of state is established for each of the phases. To establish these
equations of state, we measure how the molar volume of tungsten and tungsten oxide change
under different temperature and pressure conditions using x-ray diffraction techniques, and relate
the three terms to one equation.
X-ray diffraction is an experimental method wherein a sample is bombarded by a high
power x-ray beam, and the x-rays diffract at a given angle based upon the lattice plane with
which the x-ray interacts. Assuming the sample crystals are small and scattered in random
orientations throughout the sample chamber, it is a safe assumption that all of the varying lattice
planes will diffract equally, resulting in a suitable representation of diffraction intensity from of
each of the planes. The diffracted x-rays are recorded by a detector that sits behind the sample,
and the data appear as a series of concentric diffraction rings surrounding the central x-ray beam.
Each diffraction ring represents one 2θ angle at which the x-rays are diffracted and therefore one
lattice plane of a phase within the sample chamber. Using Bragg’s Law, we can determine the d-
spacing of a particular lattice plane.
nλ = 2d(sinθ)
Where λ = wavelength of x-ray
n = order
d = d-spacing
Sometimes, however, lattice planes of different phases
within the sample chamber diffract x-rays at the same
angle, resulting in overlapping diffraction rings. By
collecting multiple diffraction patterns at different
temperatures and pressures, we observe how these
lattice planes change as a result of the changing
temperature and pressure.
High pressures are generated by using a
diamond anvil cell, or DAC (Figure 1). The DAC
operates by placing faces of two opposing diamonds
parallel to one another, and uses screws to squeeze
them together. Eventually, the diamond faces meet,
and press against each other. Because diamond is
such a hard material, it is able to withstand the force
pressing against it, but in turn, causes anything
between the diamond faces to experience very high
pressures. If the sample is placed by itself in between
the diamonds it will experience forces and stresses
predominately in the direction of the applied force of
the diamonds. A metal gasket is placed between the
two diamond faces. A hole in the middle of the Figure 1. Schematic of a diamond anvil cell (Jacobsen, 2009)

4
gasket creates a sample chamber, and the metal gasket will become the walls of the sample
chamber. In order to accurately describe the properties of the sample phases, phases must
experience a hydrostatic environment, meaning that the force of pressure is equal in all
directions. A pressure medium is added to the sample chamber along with the sample to create
this hydrostatic environment. The pressure medium is able to direct the pressure in a hydrostatic
or quasi-hydrostatic manner. In this experiment, we use sodium chloride, NaCl, as the pressure
medium. NaCl is a solid and therefore, it does not act like a hydrostatic pressure medium;
however, it is very soft so the non-hydrostatic stresses are reduced significantly and at high
temperatures produces a much more hydrostatic environment. Pressures and temperatures
increase with depth within the Earth, rising up to 100 GPa and 4000 K near the core-mantle
boundary.
Using the DAC alone, a number of experiments can be done, all of which are considered
―room temperature compression‖ experiments. These experiments can be useful, but in order to
establish a reliable and predictive equation of state, high temperature data must also be collected.
The high temperature data in these experiments were collected using a specifically designed
heater which works in conjunction with the diamond cell. Developing this heater involved
attaching conductive metal wire to a power supply and allowing the electricity to heat the wire.
The heater was designed in a way to allow the heat to be conducted evenly throughout the
sample chamber.
Designing the heater to work in conjunction with the DAC allowed x-ray diffraction
experiments to be conducted through the sample chamber while the sample was experiencing
both increased temperature and pressure conditions. Along with the room temperature
compression data, the data collected from these experiments were used to establish an equation
of state. The x-ray diffraction patterns were analyzed by using a variety of computer programs.
These data are processed using computer software: Microsoft Excel, Fit2D, and Peakfit.
2θ angles are converted into d-spacings using Bragg’s Law. Joint Committee on Powder
Diffraction Standards (JCPDS) cards have been created for a wide variety of materials, and they
list the d-spacings and the relative intensities of the peak at room temperature and pressure.
Changes in the molar volume of each phase can be measured by analyzing the diffraction peaks
at different temperatures and pressures. Identifying any possible phase transitions that may
occur at increased temperature and pressure is important because phase changes can result in
changes to molar volume. Each d-spacing peak correlates to a specific set of Miller indices for
each phase. These Miller indices are a manifestation of the lattice parameters of each phase. By
analyzing many sets of Miller indices, one can determine the specific lattice parameters of each
phase, and thus the molar volume of that phase at that specific temperature and pressure.
Changing lattice parameters result in changes to molar volume. This changing molar volume is a
result of changing temperature and pressure conditions. The relationship among molar volume,
temperature and pressure can be expressed for each phase as an equation of state.
These experiments do not require that tungsten react with oxygen, or that tungsten and
tungsten oxide remain in equilibrium. There is no available oxygen in the system to react, so
unless there is a reaction with a component of the DAC or another phase within the sample
chamber, there will be no reaction. We make sure that tungsten and tungsten oxide remain in the
same sample chamber, however, to ensure that they are under the same conditions when we
measure the ΔV between them. This limits the error in the volume measurements and improves
the precision of the experiment as a whole. It is possible to measure tungsten and tungsten oxide
5
separately, and then apply the calculated volumes to the Gibbs free energy equations, but there
are different errors associated with each individual experiment and that could make our
calculated ΔV less precise.
3. Geologic Relevance
Understanding the physical and chemical behaviors of all materials that are believed to
reside deep within the Earth has become more important as scientists try to understand more
about how our planet formed. In order to completely understand all aspects of core formation, it
is important to fully understand all of the geochemical properties of the elements that are present
in both the core and the silicate Earth, and understand why they are where they are. Along with
a number of other elements, tungsten is an element that is partly lithophile and partly siderophile,
meaning that it is found in both the core and the silicate Earth. If we are able to better
understand some of the chemical properties of tungsten at high temperatures and pressures, we
can help to understand how tungsten partitions itself between the silicate Earth and the iron rich
core. Similar experiments to measure the effect pressure, temperature, and oxygen fugacity have
on metal-silicate partitioning have been conducted for a number of other elements (Rose-Weston
et al., 2009; Cotrell et al., 2009; Hillgren et al., 1996; Righter et al., 2003). This can also add to
the body of work that is established to determine the specific temperature, pressure, and chemical
conditions that were present during core formation of our planet. A discussion by Hillgren et al.
(1996) shows fO2 plays a large role in metal-silicate partition coefficients of some partly
siderophile elements.
Also, some scientists use tungsten + tungsten dioxide as a means to control the oxygen
fugacity within their experiments. If both tungsten metal and tungsten dioxide are present in a
system with available oxygen, and they are at equilibrium with each other, the oxygen fugacity is
a known and fixed quantifiable term based on the oxygen fugacity equations. However, if the
experiments went to higher temperatures and pressures, the oxygen fugacity may change as a
result of the changing external conditions. This change is not well documented or known, and
there are suggestions that at higher pressures the valence state of tungsten changes from W+6
to
W+4
(Cottrell et al., 2009). This would cause problems within an experiment because oxygen
fugacity is no longer a fixed term.
4. Problem and Hypothesis
I will examine the effects pressure and temperature will have on the oxygen fugacity
buffer curves of both tungsten dioxide and tungsten trioxide. Tungsten is an element which
exists naturally in different two different valence states: +4 and +6. At high pressure, there is
some ambiguity as to which oxide is the dominate oxide which coexists with the pure metal.
Some research suggests that at higher pressures, the +4 valence state dominates metal/silicate
partitioning (Cottrell et al., 2009), suggesting that the W-WO2 and the W-WO3 buffer curves
diverge from each other at high pressure. However, my hypothesis is that at higher pressure, the
tungsten dioxide and the tungsten trioxide oxygen fugacity buffer curves will move at similar
rates with respect to each other.

6
5. Methods
5.1. Diamond Anvil Cell and Heater DACs can be used to generate very high
pressures similar to those experienced deep within
the Earth (Komabayashi et al., 2009). Screws are
used to squeeze two parallel faces of opposing
diamonds (Figure 2). The metal gasket between
the diamonds is indented because of the pressure
caused by the diamonds. A hole 80-150
micrometers wide is drilled through the center of
the gasket using an electronic drilling machine
(EDM). This hole becomes the sample chamber,
and the metal gasket becomes the walls of the
sample chamber. When the screws are tightened,
and the diamonds compress the sample chamber,
pressures up to and exceeding 80 GPa can be
generated. However, there is no DAC that is able to generate heat in conjunction with pressure,
so a heater was developed. A number of different styles of heaters have been developed by other
researchers (Komabayashi et al., 2009), and after developing and testing a number of different
styles of heaters on our own, one external heater design worked the best. A full discussion of
the different designs of heaters can be
found in Appendix A.
The final design used nichrome
wire wrapped through four-hole
alumina tubing as seen in Figure 3, and
the tubing was placed outside the two
metal plates of the diamond cell. Wire
is threaded through each of the 4 holes
in a square shape and since this heater
is designed to heat the whole DAC
there is less restriction on the size of
the joints between the tubes. There is
space to ensure the wire does not
expand and short out the heaters. This
also allowed the tubes to be larger in
size and more numerous, which
allowed more wire to be wound into
the system and thus a greater amount
of heat. Another advantage to this design is that it allows the temperature gradients throughout
the system to be mimized. This more evenly distributes heat throughout the diamond cell, and
allows the temperature of the sample chamber to be more accurately measured.
Figure 2. Diamond Anvil Cell. approximately 22mm in diameter and 18 mm tall
Figure 3. Heater with 4-hole alumina tubing and nichrome wire wound through each hole. Each heater is an approximate square with sides 20mm in length

7
The entire design of the heater
revolved around the use of a smaller, more
open DAC design (Figure 2) than the
diamond cells that are typically used. This
design was chosen because it allowed
easier thermocouple access to the diamond
anvils so the temperature can be accurately
measured. However, since this is a less
commonly used diamond cell, a new
holding block needed to be manufactured
to effectively enlarge the size of the DAC
so that the center is in a similar location
along the x-ray beam line when the x-ray
diffraction data are collected. The holding
block is made of a pyrophyllite block in the
shape of a square with two inch sides
(Figure 4). A hole is drilled in the center of
Figure 4. Assembly of diamond cell, insulating block, and heater. Insulating block is made of 2inch square pyrophyllilte.
Figure 5. DAC and heater assembly in place along the x-ray beam line at NSLS
X-ray beam
Wires connecting power
supply to heater
Thermocouple to measure
temperature of sample
Detector
2”
2”

8
the block where the diamond cell sits. Pyrophyllite slabs are placed on each end and everything
is held together by screws that travel through the whole block. The screws are attached to both
the power supply and the heaters on either end of the diamond cell. Another hole is drilled
directly through the center of the top of the block so a thermocouple can travel directly to the
sample chamber on the inside and measure the temperature.
5.2.X-ray Diffraction
X-ray diffraction experiments are conducted at the National Synchotron Light Source
(NSLS) Beamline X17C at the Brookhaven National Laboratory in Brookhaven, New York
(Figure 5). The x-rays are aimed at the sample chamber, and scattered by the material in the
chamber and received at a detector which is connected to a computer. An image appears on the
computer showing the diffraction rings
around the x-ray beam (Figure 6). These
diffraction rings are each a different
distance around the center x-ray beam,
and the distance away from the center of
the x-ray beam correlates to a different 2θ
angle at which the diffraction occurred.
Using computer software (Fit2D), we can
turn the diffraction rings into graphs that
relate 2θ angle with relative intensity. On
these graphs, each peak that is seen
corresponds to a ring of a given radius on
the diffraction pattern. The sample
chamber includes NaCl as a pressure
medium, a pressure calibrant (NaCl, Au,
or Pt), and the sample materials W and
WOx (Fei et al., 2007). Each material
within the sample chamber will diffract
the x-rays at different angles based on the
crystal structure of the material.
X-ray diffraction patterns are taken
while the sample is experiencing different
temperature and pressure conditions in
order to accurately determine an equation
of state at higher temperatures and
pressures. This is done by setting the
diamond cell to a certain pressure and
methodically aligning the cell along the x-
ray beam line. A diffraction pattern is then taken at room temperature. The power supply that is
controlled by an external source is turned on and the heaters begin raising the temperature of the
system. The temperature is raised to 100 degrees Celsius, the sample alignment is verified, and
another diffraction pattern is taken. This process continues in increments of 50 to 100°C up to
roughly 450° C. Diffraction patterns are taken again as the temperature is brought back to room
temperature at similar increments in order to get multiple data points at similar temperature and
Figure 6 Image of x-ray diffraction scatter pattern collected at NSLS in Brookhaven, New York.
Microscope for aligning DAC
2”

9
pressure conditions to get a measure of precision. When the diamond cell is back to room
temperature, it is taken out of the block and the pressure is raised to a moderately higher value.
The whole cell is then put back on the x-ray beam line, and the heating cycle process is repeated.
The process of heating the cell and taking diffraction patterns is repeated for three cycles, and the
temperature – pressure range is thoroughly covered.
5.3. Data Analysis The x-ray diffraction patterns are
taken as images of diffraction rings
surrounding the central x-ray beam. This
image is input to a program called Fit2-D
which turns the image of rings into a
graph of intensity vs. two theta angle
(Figure 7). The plots are then put into a
program called PeakFit which is a
program that is able to process the graphs.
In PeakFit, the background noise of the
images must be removed first in order to
make the data relative to one even level.
When the background is subtracted,
PeakFit picks the largest of the peaks and
records their intensity, width, and
placement along the two-theta axis. The
smaller peaks must be hand picked, and a
refinement process built into the program
can help to find the precise location, width
and intensity of those peaks (Figure 8).
When all of the peaks are picked and
refined, the program outputs a file with
intensity, location, and width of each peak as a numeric file that can be read into Microsoft
Excel.
When the data are in Excel, the location as identified as a 2θ angle can be turned into a
specific d-spacing using Bragg’s Law. The d-spacing’s in each set of data are related to the
different phases within the sample chamber. JCPDS cards of the phases tungsten, tungsten
dioxide, tungsten trioxide, gold, and sodium chloride give a list of the d-spacings of each phase
at standard temperature and pressure. The d-spacings that are found within the data do not
exactly match the d-spacings listed in the JCPDS cards because the sample is at high temperature
and pressure. Miller indices are assigned to the different d-spacings for each phase using help
from the JCPDS cards.
Figure 7. Graph derived from x-ray diffraction scatter pattern plotting relative intensity on the y-axis vs. 2θ angle on the x-axis using Fit2-D

10
Because the equation of state is very well established for our pressure standard (Fei et al.,
2009), we can use the Miller indices and d-spacings of these phases to determine the lattice
parameters and the molar volume. This molar volume, along with the measured temperature of
the system is put into the equation of state for the pressure standard, and a pressure is obtained.
This calculated pressure is assumed to be the pressure that the whole sample is experiencing.
Now that both the temperature and pressure of the sample are known, the only remaining
parameter that needs to be determined in order to establish an equation of state is the molar
volume of the phase. This is done for the tungsten metal and tungsten oxide in a similar fashion
as to how it was done for the pressure standard. Using JCPDS cards, Miller indices are assigned
to peaks at different d-spacings. Tungsten metal, being a cubic system, only has one parameter
to determine which is very easy to establish. Tungsten oxide however is known to be monoclinic
at lower pressures, and possibly transitioning to orthorhombic at higher pressures. This means
that there are four lattice parameters that need to be determined: a, b, c, and β angle. There is no
simple equation that can determine all four values, so a solver program is run through Microsoft
Figure 8. Data analysis using Peakfit program to identify all diffraction peaks
11
Excel to help find them. This is a program that changes all four values simultaneously while
trying to minimize the difference between the measured d-spacings and the calculated d-spacings
that would result from the given lattice parameters. Knowing all four lattice parameters gives the
ability to determine the third component of the equation of state the tungsten oxide: molar
volume.
The uncertainties within this experiment will come from the lattice parameters that are
calculated from the diffraction patterns. When the data are processed in the Excel spreadsheet, it
instantly becomes clear that the calculated lattice parameters are not always going to match each
other. For instance, the assigned Miller indices for tungsten metal should all give 1 calculated
lattice parameter because tungsten has a cubic structure, and only 1 lattice parameter is needed to
describe cubic systems. For cubic systems, the lattice parameter is calculated by the equation:
a = d (√(h2+k
2+l
2))
Where a = lattice parameter
d = measured d-spacing
h,k,l= set of Miller indices
However, the calculated lattice parameter does not result in d-spacings of the exact same value as
the measured d-spacings. The difference between the calculated lattice parameters and the
measured lattice parameters determines the error in the measurements, and that error is then
propagated through the equation that relates the calculated lattice parameters into calculated
volumes, and further propagated through into the equation of state. For the tungsten oxide
however, calculating the lattice parameters is not as easy because the system is monoclinic, but
the same principles apply. A solver program in Microsoft Excel calculates what the d-spacing
should be based on assumed lattice parameters. The program changes the assumed lattice
parameters until the calculated d-spacings are as close as possible to the actual measured d-
spacings. It is this difference in calculated d-spacing compared to measured d-spacing that is
used to measure the error for the tungsten oxide. Similarly, this error is also propagated through
the volume calculation and into the equation of state. Errors in volume for both the tungsten
metal and the tungsten dioxide are on the order of 0.2%.
5.4. Equation of State
The Birch-Murnaghan equation of state (Fei et al., 2007) is described as:
P(V) = 3K0/2 [(V0/V)7/3
- (V0/V)5/3
]{1+3/4(K0' – 4)[ (V0/V)2/3
– 1]}
Where: P= pressure
V= Measured volume
V0= Volume at standard temperature and pressure
K0= Bulk modulus = -V(∂P/∂V)T
K0'= Bulk modulus pressure derivative

12
The bulk modulus is essentially the compressibility of a material. The lower the bulk modulus,
the easier that material is to compress. Likewise, the bulk modulus pressure derivative is a
measure of how the bulk modulus changes as the pressure is increased. The bulk modulus and
its pressure derivative are quantities that have been previously determined using room
temperature compression experiments (Shofner et al., in preparation), and are quantities that are
properties of the material, in this case tungsten and tungsten oxide, that we assume to be fixed
values.
5.5. Oxygen Fugacity Calculation The equation of state is used to determine the pressure effect on oxygen fugacity for both
tungsten dioxide and tungsten trioxide. The equation of state relates molar volume to
temperature and pressure, and it is this relationship that is needed to determine pressure effect on
oxygen fugacity. Using the oxygen fugacity equation described earlier, R, T, and lnfO2 (1bar,T) are
all terms that are either known or have been developed during previous research, and lnfO2 (P,T) is
the term we are trying to establish. The only other unknown term in this equation is the ∆V
term, relating the molar volumes of the metal and the oxide. This ∆V term will be determined
through the equations of state for each of the phases. Using this equation of state, for any
pressure and temperature we can calculate the molar volume of each phase and calculate the
difference between them. Then we apply that molar volume difference to this oxygen fugacity
equation and calculate how the oxygen fugacity changes with respect to temperature and
pressure (Campbell et al., 2009). These changes are more easily seen visually on a graph.
Oxygen fugacity is plotted versus temperature, and the curve that appears is called a buffer curve
(Figure 9).
Figure 9. Oxygen fugacity buffer curves for W-WO2 and W-WO3 in relation to other known buffer curves at 1 bar of pressure (Campbell et al., 2009; O’Neill et al., 2008)
-20
-15
-10
-5
0.0005 0.0006 0.0007 0.0008 0.0009 0.001
log f
O2
1/T (K)
Ni-NiO
FMQ
Fe-FeO
W-WO3
W-WO2
Oxygen fugacity buffer curves

13
6. WO2
6.1.Equation of State Analysis We subjected the WO2 powder to elevated temperature and pressure conditions up to 700
Kelvin and 45 GPa and performed x-ray diffraction experiments to observe how the materials
volume changed as the conditions were changed by the methods described earlier. The WO2
crystal structure behaved by shrinking as the pressure increased while expanding as the
temperature was raised, as expected. Using the processed x-ray diffraction data and Microsoft
Excel, I indexed the diffraction peaks according to JCPDS cards, allowing me to plot the changes
in lattice parameter with pressure (Figure 10).
Figure 10. Plot showing WO2 lattice parameters vs. pressure
These a, b, and c lattice parameters trend in similar directions and at similar slopes to
one another as the pressure is increased. The calculated molar volumes derived from the lattice
parameters each have associated temperature and pressure conditions under which they were
formed. To determine this relationship I create an F vs. f plot of all my data using the Birch-
Murnaghan equation of state found in section 5.4, where after rearranging:
f = ½ [(V/V0)-2/3
- 1] = negative eulerian strain
F = K0 + 3/2K0(K0’ -4)f
4.5
4.7
4.9
5.1
5.3
5.5
5.7
5.9
0 10 20 30 40
latt
ice
par
amet
er (
Å)
Pressure (GPa)
Lattice parameter vs. Pressure
WO2-a
WO2-b
WO2-c

14
This relationship takes the form of a linear equation where the y-intercept is the bulk
modulus K0 and the slope is set equal to [3/2K0(K0’ -4)] to determine K0’. A negative slope of
the trend line suggests a K0’ value less than 4, where as a positive slope suggests a value greater
than 4. If the data points seem to be along one horizontal line, which is the case for a wide
variety of materials, K0’ is inferred to be 4.0.
Figure 11. F vs. f plot of WO2 data, showing a distinct bias in the low-f data
While 2/3 of the data on the ―high-f‖ portion of the graph in Figure 11 seem to follow this
quasi-horizontal line pattern, there is a significant and consistent upswing on the low-f side of the
graph, which is a consequence of the data being measured at different temperatures and not
isothermally. Therefore, we decided to change the method of determining K0 and K0’. We
assume K0’ to be 4, simplifying the second half of the Birch-Murnaghan equation of state and
determining the temperature component of the equation of state by assuming
Ptotal = P300 + (∂P/∂T)V(ΔT)
Where: P300 = Burch-Murnaghan equation of state
dP/dT = change in pressure with respect to temperature, simple temperature correction
Rearranging this equation and inserting the Burch-Murnaghan equation of state we find:
P/ ΔT = 3K0f(1+2f)5/2
/ ΔT + (∂P/∂T)V
y = -5387.2x + 408.21
R² = 0.67
0
100
200
300
400
500
600
0 0.01 0.02 0.03 0.04 0.05 0.06
F
f
WO2 F vs. f

15
Again, we have the form of a linear equation if we plot [3f(1+2f)5/2
/ ΔT] vs. [P/ΔT] where K0
becomes the slope of the trendline and (∂P/∂T)V is the y-intercept.
Figure12. Plot used to determine the equation of state for WO2
Clearly, this graph in Figure 12 fits the data much better as shown by the R2 value. This results
in a pressure and temperature dependent equation of state for WO2 with K0 = 189.06, K0’ = 4.0,
and (∂P/∂T)V = .0067
P = 3(189.06)f(1+2f)5/2
+ .0067ΔT
6.2. WO2 oxygen fugacity calculation The calculation for oxygen fugacity for WO2 is solely dependent upon the development
of its equation of state. Now that I have established this equation of state, I calculate the
equation of state using SCILAB routines that have been previously designed and used and
proven to work effectively (Campbell et al., 2009). The oxygen fugacity equations:
RTlnfO2(P,T) = RTlnfO2(1 bar, T) + ∫∆VdP
Where R = Gas Constant
lnfO2 = log oxygen fugacity
P = pressure
∆V = change in molar volume = Voxide - Vmetal
y = 189.06x + 0.0067
R² = 0.9927
0
0.05
0.1
0.15
0.2
0.25
0.3
0.35
0.4
0.45
0.5
0 0.0005 0.001 0.0015 0.002 0.0025 0.003
P/Δ
T
(3f(1+2f)^5/2)/ΔT
WO2 Equation of State

16
Again, the only unknown on the right side of this equation is the ΔV term integrated with
respect to pressure, and this is known once the relationship between the two is determined. I
modify the preexisting scilab files by first inserting the new K0, K0’, and dP/dT terms and
modifying the 1bar oxygen fugacity equation according to the equation given for the W-WO2
buffer curve by O’Neill, et al., 2008. I also needed to modify how the temperature term is
calculated because in the previous experiments by Campbell et al. the scilab routines used a more
sophisticated temperature term in the equation of state. I wanted the simple [Ptotal = P300 +
dP/dT(ΔT)], where the temperature term is controlled solely by dP/dT.
Modifying the form of the equation of state and importing the newly acquired WO2 data, I
was able to determine the oxygen fugacity at each temperature point, and plot how this oxygen
fugacity curve moves with increasing pressure (Figure 13).
Figure13. WO2 oxygen fugacity buffer curve with changing pressure.
7. WO3
7.1. Equation of State Analysis
We determined the equation of state for WO3 in a different manner than the WO2 because we
collected room temperature compression data, and not high temperature data. These data gave us
the ability to calculate K0 and K0’ for the species, but not the temperature term. The first and
most glaring aspect of WO3 that I came across showed that WO3 had many stable phases
depending upon the temperature and pressure conditions. At room temperature and pressure
conditions there are at least three stable phases of the species, and as conditions are changed the
phases change an unknown number of times. Bouvier et al. (2002) did similar room temperature
compression experiments with WO3 and discovered a similar situation. They were able to
recognize 3 different phase changes. Above 0.15 GPa, a monoclinic ε-phase is present. Above
0.57 GPa, a different monoclinic phase (P21/c space group) is stable. This phase is stable up to
22 GPa, where another monoclinic phase (P21/a space group) is stable. Above 31 GPa a space
-140
-120
-100
-80
-60
-40
-20
0
20
40
60
80
0 0.0005 0.001 0.0015 0.002 0.0025 0.003 0.0035 0.004 0.0045
log
(fO
2)
1/T
WO2 buffer change with pressure
100 GPa
80 GPa
60 GPa
40 GPa
20 GPa
0 GPa

17
group Pm monoclinic phase is stable (Bouvier et al., 2002). Bouvier et al. (2002) gave
calculated lattice parameters and initial volumes for each of the phases at high pressures. I was
able to use their calculated lattice parameters as a base for my data, index my diffraction patterns
accordingly, and calculate volumes similar to Bouvier’s data with low errors.
Figure14. Lattice parameter plotted against pressure for the indexed WO3 diffraction patterns
Looking at the data points in Figure 14 above 10 GPa, we see that there are three distinctly
different phases with very different lattice parameters, however they are internally consistent
with similar slopes as the pressure is raised and they match the data given by Bouvier et al.
3.5
4.5
5.5
6.5
7.5
8.5
9.5
10.5
0 10 20 30 40 50
Latt
ice
Pa
ram
eter
(A
)
Pressure (GPa)
Lattice parameter vs. pressure
WO2 - a
WO2 - b
WO2 - c
18
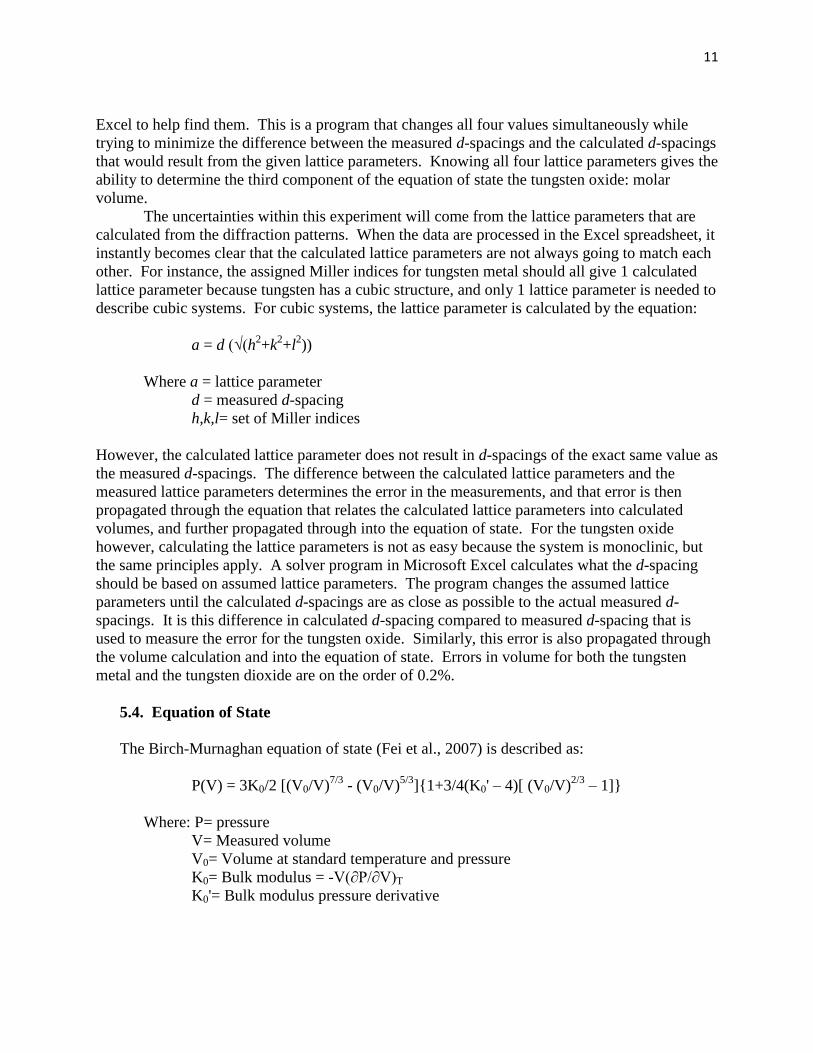
Figure15. WO3 volume plotted against pressure for indexed WO3 data as well as isothermal compression curve derived from Bouvier
By using the K0 and K0’ values derived by Bouvier for each of the species, I created an
isothermal compression curve for the individual species and plotted my data against the
compression curves (Figure 15). My data agree fairly well with the previously recorded data.
One major issue with the compression data of Bouvier et al. (2002) comes from
Dorogokupets and Oganov (2007) who identify an error in the pressure calibration used by
Bouvier. Bouvier used a method called ruby fluorescence to determine pressures within the
DAC: the R1 line shift of ruby luminescence is calibrated to changes in pressure according to the
equation
P = A/B[(λ/λ0)B – 1]
Where:
P = pressure
A = λ(δP/δλ) = 1904 GPa
B = 7.665
λ0 = 694.24 nm (Mao et al., 1986)
17
19
21
23
25
27
29
31
33
0 10 20 30 40 50
Vo
lum
e (c
c/m
ol)
Pressure (GPa)
WO3 volume vs. pressure
Bouvier data
WO3

19
Dorogokupets and Oganov (2007) found that Mao’s ruby fluorescence calibration did not fit
other means of calculating pressure, especially at higher pressures. Up until roughly 45 GPa,
Mao’s calibration resulted in a pressure about 0.75-1 GPa lower than other calculated pressures
and after 45 GPa, the calibration gives progressively lower pressure values until roughly 130
GPa where the pressure calibration is 10 GPa shy of other calibrations. I was able to back-
calculate Bouvier’s measured λ values using Mao’s original equation, and apply the raw λ into
Dorogokupets and Oganov’s new calibration equation to obtain corrected pressures for Bouvier’s
data (Figure 14).
P = 1884 * (Δλ/λ0)*(1+5.5( Δλ/λ0))
I performed the pressure correction to Bouvier et al.’s data and using a combination of their
data and my data re-ran the calculations to determine the new equation of state parameters K0
and K0’. I combined the data because he had much more data points than I did and my data
matched with his data reasonably well.
To calculate a full equation of state that relates volume to temperature and pressure, I need
data on WO3 as a function of changing temperature. Howard et al. (2001) performed very high-
resolution neutron powder diffraction experiments on WO3 at 1bar of pressure from room
temperature up to 1000 oC. At room temperature they found a monoclinic space group P21/n.
From 350 – 720 oC an orthorhombic space group Pbcn was observed. From 720 – 800
oC they
found a monoclinic P21/c space group and from 800 to 900 o C a tetragonal structure in space
group P4/ncc, and above 900 oC a second tetragonal structure in P4/nmm.
Bouvier P Pcorrected
1.060 1.051
1.560 1.547
2.310 2.293
3.270 3.249
3.990 3.968
3.460 3.439
4.000 3.978
4.800 4.777
5.690 5.669
6.380 6.361
6.840 6.823
Bouvier P Pcorrected
7.390 7.376
8.050 8.040
8.830 8.826
9.260 9.260
10.090 10.098
11.110 11.131
11.690 11.719
12.470 12.510
13.360 13.415
13.900 13.965
15.420 15.514
Bouvier P Pcorrected
16.270 16.383
17.230 17.365
18.040 18.196
19.250 19.438
19.940 20.147
20.870 21.105
21.820 22.084
22.200 22.477
23.060 23.365
Figure16. Data table of pressure correction of Bouvier's data up to 23 GPa

20
Using the data proposed by Bouvier et al. and Howard et al. we can construct a pressure-
temperature phase diagram for WO3 (Figure 17). We notice that both research teams found a
P21/c monoclinic space group within their data. We can also determine the sign of the Clapeyron
slope for the species along the temperature axis based on the known volume change of the
transitions and the fact that the higher temperature phases must have higher entropies. There is
no temperature data on the high pressure phases, so I can only assume vertical lines for the phase
boundaries, and the Clapeyron slope is positive for the high temperature phases. The Clapeyron
slope at 720 oC is negative. Howard et al. gives lattice parameters for this phase at 760
oC: a =
5.2793 Å, b = 5.2635 Å, c = 7.8329 Å, β = 90.483o. Bouvier et al. (2002) give lattice parameters
at 1.06 GPa of a = 5.2557 Å, b = 5.0986 Å, c = 7.6242 Å and β = 92.169o. Because both groups
found the same space group in their studies, the lattice parameters of these species are similar,
the molar volumes of these species are similar, and the Clapeyron slope would be in the correct
(negative) direction, I am assuming that these two species are in fact one in the same. I am
assuming only 1 monoclinic P21/c space group phase, and the space connecting the two axes is
filled with this one phase. The original motivation behind this research involved finding a
reasoning behind the statement by Cottrell et al. that at high pressures the WO species switches
Figure17. Phase diagram for WO3 based on data collected from Bouvier et al. (2002) and Howard et al. (2001)

21
from WO3 to WO2, and her experimental conditions were in the vicinity of 15 GPa, I am only
going to concern my research with the P21/c monoclinic space group of WO3 which occupies
that portion of the phase diagram.
Figure 18. WO3 space group P21/c data plotted against the corrected Bouvier data and the corrected isothermal compression curve
I determine K0 and K0’of WO3 using the corrected room temperature compression data
from Bouvier et al. in combination with my collected data (Figure 18).
K0 = 28.2 GPa
K0’ = 9.1
By combining these values with the data of the same phase from Howard et al. we can
determine the temperature component of the equation of state for this particular phase. Howard
et al. give data of molar volume as a function of temperature for each phase. We know that
α = (1/V)*(∂V/∂T)P
We can take an average of the molar volume over the P21/c temperature span and that can be
our representative V. By measuring the average slope of that section of the graph we can
determine dV/dT.
V = (54.6125+54.26775)/2 = 54.4401
23
24
25
26
27
28
29
30
31
32
33
0 5 10 15 20 25
Volu
me
(cc/
mo
l)
Pressure (GPa)
WO3 P21/c Volume vs. Pressure
Isothermal Compression Curve
WO3
Corrected Bouvier et al. data

22
(∂V/∂T)P = (54.6125-54.26775)/(790-730) = 0.005746
α = 1.055 x 10⁻⁴
Usint the same equation of state form that I used for WO2:
(∂P/∂T)v ≈ αK0
(∂P/∂T)v = .00297 x 10-3
The equation of state for WO3 space group P21/c is therefore:
P = 3(28.2)f(1+2f)5/2
[1+3/2(9.1-4)f] + .00297ΔT
7.2. Oxygen Fugacity calculation
The same oxygen fugacity calculations that were applied to WO2 within the Scilab
routines were also applied using the WO3 equation of state, with the only difference being the
1 bar oxygen fugacity equation given by O’Neill et al. (2008). Applying the changes to the
equation of state and 1 bar oxygen fugacity equation allowed me to plot an oxygen fugacity
buffer curve at different pressures for WO3, space group P21/c (Figure 19).
Figure19. WO3 space group P21/c buffer curve plotted for changing pressure
-140
-120
-100
-80
-60
-40
-20
0
20
40
60
80
100
120
0 0.001 0.002 0.003 0.004 0.005
log
(fO
2)
1/T
WO3 Space Group P21/c Buffer Curve with Changing Pressure
100 GPa
80 GPa
60 GPa
40 GPa
20 GPa
0 GPa

23
8. Buffer Curve Comparison
By looking at Figures 13 and 19 individually, it is very difficult to determine if there are any
discrepancies or differences between them. The original question asked how these two buffer
curves changed with respect to one another as the pressure was increased. The easiest way to
observe the changes between them is to plot them on the same diagram.
Figure20. WO2 and WO3 buffer curve comparison with increasing pressure
Figure 20 shows that as the pressure is increased, the WO3 buffer curve is increasing its slope
at a faster rate than the WO2 buffer curve. By looking at where 1/T = .004 (T = 250K) we see
that the log(fO2) difference between WO3 and WO2:
WO3(log(fO2)) – WO2(log(fO2)) = Δlog(fO2)
@ 0GPa : (-103.1764) - (-113.4556) = 10.2792
@ 50 GPa: 6.3600 - (-17.4174) = 23.7774
@ 100 GPa: 91.4465 - 63.1657 = 28.2808
As we can see, increasing the pressure increases the distance between the two buffer
curves, meaning that the WO3 buffer curve is moving upwards at a faster rate than the WO2
curve.
-120
-80
-40
0
40
80
120
0 0.001 0.002 0.003 0.004 0.005
log
(fO
2)
1/T (1/K)
WWO2 - WWO3 Buffer Curve Comparison
WWO2 - 100 GPaWWO3 - 100 GPaWWO2 - 50 GPaWWO3 - 50 GPaWWO2 - 0 GPaWWO3 - 0 GPa

24
9. Summary/ Discussion
In order to fully understand how and why the Earth differentiated into the iron rich core
and the silicate portions of the Earth, we must understand how elements partition between the
two. By establishing an equation of state for tungsten dioxide and tungsten trioxide I can
analyze the oxygen fugacity relationship between the two buffers at high pressure. The oxygen
fugacity relationship can help to determine whether W+4
or W+6
is more prevalent at high
pressures deep within the Earth, and add to the body of work that is compiled to better
understand the conditions that were present during core formation.
Establishing this equation of state was done using a diamond anvil cell, an external
heater, and x-ray diffraction techniques. I placed tungsten metal and tungsten oxide in the DAC
to apply pressure, heated the sample, and measured how the molar volume changed as a result.
The equation of state was related to Gibbs free energy and ultimately oxygen fugacity.
Log(fO2) is plotted against temperature to create an oxygen fugacity buffer curve for both
tungsten dioxide and tungsten trioxide, and these curves are analyzed with respect to each other
at high pressure to help to understand how the two materials behave. My hypothesis was that
the two buffer curves move similarly with respect to each other as the pressure is increased.
Ultimately, my hypothesis was incorrect. The two buffer curves both moved upwards on
the oxygen fugacity plots, but they moved at different rates from one another. The WO3 buffer
curved changed its slope at a faster rate than the WO2 buffer curve. This actually is a
phenomenon that would seem to make sense given the results of Cottrell et al. They stated that
they observed WO2 becoming more prevalent within silicate melts as they traveled deeper
within the Earth, meaning that at higher temperature and pressure conditions the WO2 phase
was becoming more stable.
By looking at Figure 20, we see that the WO2 buffer curve is below the WO3 buffer
curve, even at 0 GPa. This means the WO2 phase would have a lower Gibbs free energy than
the WO3 phase, making WO2 more stable even at 0 GPa. The increasing distance between the
two curves as pressure is increased suggests that at higher pressure, WO3 is constantly
increasing its ΔGibbs free energy with relation to WO2, making WO2 increasingly more stable
as the pressure is increased, just as Cottrell et al. stated. The only remaining question would be
that if at 0 GPa WO2 had a lower Gibbs free energy than WO3, why is WO2 not the stable phase
present in silicate melts at low pressure – and the answer must reside in their activity
coefficients.
25
Appendix A.
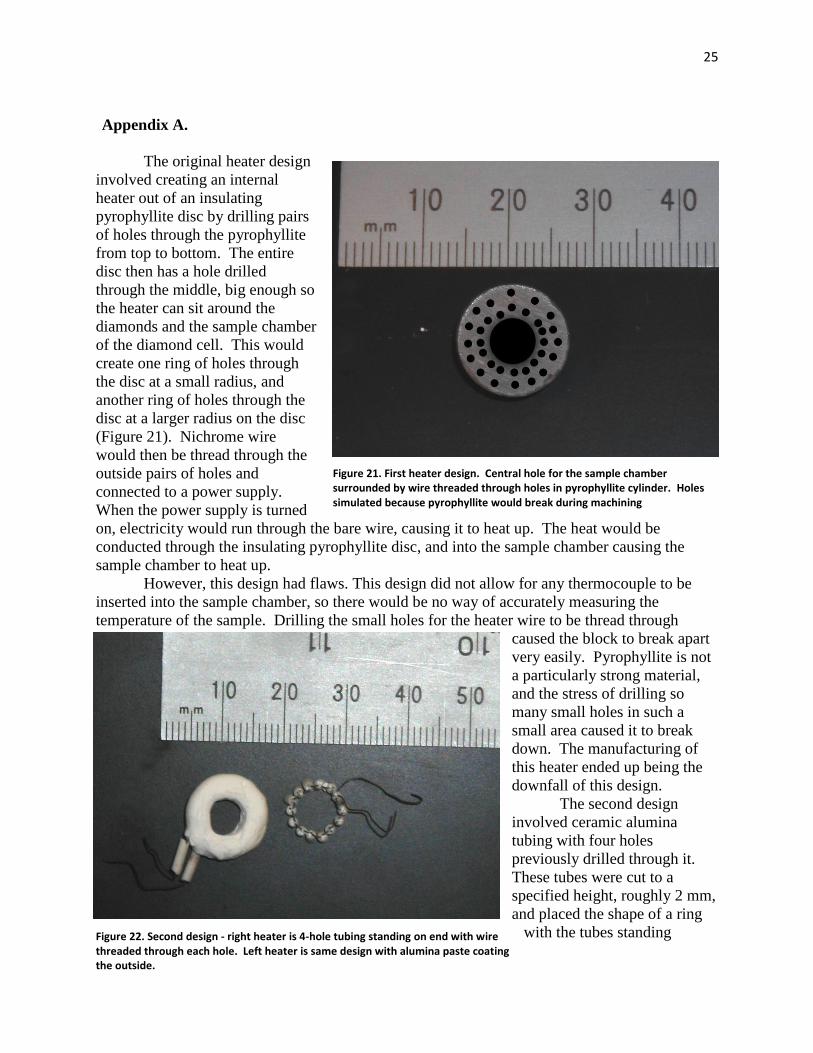
The original heater design
involved creating an internal
heater out of an insulating
pyrophyllite disc by drilling pairs
of holes through the pyrophyllite
from top to bottom. The entire
disc then has a hole drilled
through the middle, big enough so
the heater can sit around the
diamonds and the sample chamber
of the diamond cell. This would
create one ring of holes through
the disc at a small radius, and
another ring of holes through the
disc at a larger radius on the disc
(Figure 21). Nichrome wire
would then be thread through the
outside pairs of holes and
connected to a power supply.
When the power supply is turned
on, electricity would run through the bare wire, causing it to heat up. The heat would be
conducted through the insulating pyrophyllite disc, and into the sample chamber causing the
sample chamber to heat up.
However, this design had flaws. This design did not allow for any thermocouple to be
inserted into the sample chamber, so there would be no way of accurately measuring the
temperature of the sample. Drilling the small holes for the heater wire to be thread through
caused the block to break apart
very easily. Pyrophyllite is not
a particularly strong material,
and the stress of drilling so
many small holes in such a
small area caused it to break
down. The manufacturing of
this heater ended up being the
downfall of this design.
The second design
involved ceramic alumina
tubing with four holes
previously drilled through it.
These tubes were cut to a
specified height, roughly 2 mm,
and placed the shape of a ring
with the tubes standing
Figure 21. First heater design. Central hole for the sample chamber surrounded by wire threaded through holes in pyrophyllite cylinder. Holes simulated because pyrophyllite would break during machining
Figure 22. Second design - right heater is 4-hole tubing standing on end with wire threaded through each hole. Left heater is same design with alumina paste coating the outside.

26
parallel to one another (Figure 22). Similar to the previous design, nichrome wire is threaded
through all 4 holes of each of the tubes and attached to a power supply, creating a ring of wire-
threaded tubing that is placed around the sample chamber of the diamond cell. An alumina paste
was applied around the exposed wires at the end of the tubes in an effort to prevent them from
touching each other and shorting out the whole system however it seemed like this did not
prevent the wires from shorting out. The design initially worked, but when the wires got hot
enough, they expanded and because they were already in such close proximity to each other, the
small degree of thermal expansion was enough to cause them to touch and become ineffective.
There was also a similar problem to the first design as there was no way to directly measure the
temperature of the sample chamber.
Lastly, an external heater design was constructed. The 4-hole alumina tubing was placed
in a square shape in two layers, and
the nichrome wire was threaded
through each layer and attached to
the power supply (Figure 13). These
heaters are placed outside the DAC
and heat the cell as a whole. The
heaters are spread further from each
other in this design giving the added
advantage of large temperature
gradients throughout the whole
system, ensuring that the measured
temperature is more accurate.
Figure 13. Final heater design. 4-hole tubing used in squares and placed outside the diamond anvil cell rather than inside.

27
Appendix B – Data
WO2 Lattice Parameters with Pressure and Temperature
Pressure
(GPa)
Temp
(K)
WO2-
a (Å)
WO2-
a-error
WO2-
b (Å)
WO2-
b-error
WO2-c
(Å)
WO2-
c-error
WO2-β WO2-
β-error
2.27 675 5.578 0.009 4.910 0.008 5.642 0.007 120.95 0.08
2.30 675 5.574 0.004 4.895 0.005 5.653 0.006 120.78 0.07
2.41 675 5.604 0.006 4.855 0.007 5.704 0.005 121.10 0.12
2.77 675 5.610 0.010 4.847 0.013 5.711 0.022 121.01 0.24
4.28 485 5.576 0.003 4.880 0.005 5.657 0.005 121.08 0.05
7.59 300 5.545 0.015 4.847 0.010 5.640 0.015 121.09 0.25
9.97 575 5.545 0.002 4.816 0.004 5.659 0.004 120.95 0.05
10.07 575 5.553 0.008 4.841 0.012 5.658 0.015 121.21 0.21
11.61 472 5.536 0.011 4.829 0.005 5.638 0.012 121.57 0.17
12.72 375 5.504 0.033 4.801 0.009 5.624 0.011 121.53 0.19
13.12 300 5.504 0.033 4.783 0.011 5.622 0.027 121.40 0.40
13.15 300 5.492 0.006 4.792 0.003 5.597 0.002 121.21 0.08
18.58 625 5.491 0.011 4.769 0.004 5.577 0.009 122.04 0.15
19.83 575 5.444 0.005 4.763 0.004 5.567 0.006 121.70 0.08
23.31 475 5.386 0.011 4.759 0.006 5.553 0.011 122.47 0.17
24.99 300 5.379 0.024 4.745 0.005 5.533 0.010 122.00 0.11
25.00 300 5.402 0.015 4.723 0.010 5.526 0.009 121.51 0.16
25.35 300 5.397 0.009 4.714 0.008 5.507 0.007 121.53 0.12
25.62 375 5.344 0.012 4.744 0.003 5.539 0.007 121.99 0.12
26.68 575 5.379 0.004 4.737 0.006 5.487 0.004 121.32 0.07
31.75 715 5.340 0.016 4.714 0.013 5.513 0.010 121.76 0.25
32.11 715 5.403 0.010 4.689 0.004 5.548 0.004 122.73 0.08
35.13 375 5.368 0.009 4.671 0.013 5.516 0.010 123.05 0.18
37.45 300 5.339 0.014 4.688 0.014 5.516 0.009 123.48 0.21
41.50 300 5.279 0.002 4.659 0.001 5.504 0.002 122.57 0.04

28
WO2 Volume With Pressure and Temperature
Pressure
(GPa)
(Gadf(GPa)
Temperature
(K)
Volume
(Å^3)
Volume
error
Volume
(cc/mol)
Volume
error
2.27 675 132.51 0.26 19.95 0.04 2.30 675 132.52 0.13 19.95 0.02
2.41 675 132.86 0.15 20.00 0.02
2.77 675 133.11 0.26 20.04 0.04
4.28 485 131.85 0.10 19.85 0.02
7.59 300 129.81 0.39 19.54 0.06
9.97 575 129.60 0.08 19.51 0.01
10.07 575 130.09 0.30 19.58 0.04
11.61 472 128.42 0.26 19.33 0.04
12.72 375 126.82 0.31 19.09 0.05
13.12 300 126.34 0.78 19.02 0.12
13.15 300 126.00 0.10 18.97 0.02
18.58 625 123.80 0.22 18.64 0.03
19.83 575 122.80 0.14 18.49 0.02
23.31 475 120.09 0.28 18.08 0.04
24.99 300 119.77 0.48 18.03 0.07
25.00 300 120.22 0.34 18.10 0.05
25.35 300 119.41 0.18 17.98 0.03
25.62 375 119.10 0.26 17.93 0.04
26.68 575 119.42 0.13 17.98 0.02
31.75 715 117.99 0.38 17.76 0.06
32.11 715 118.26 0.17 17.80 0.03
35.13 375 115.92 0.24 17.45 0.04
37.45 300 115.15 0.29 17.34 0.04
41.50 300 114.08 0.04 17.17 0.01

29
NaCl B1 Crystal Structure Pressure Calibration
Temperature
(K)
NaCl – a
(Å)
NaCl - a -
error
Pressure
(GPa)
675 5.557 0.001 2.27 675 5.555 0.002 2.30
675 5.548 0.005 2.41
675 5.526 0.013 2.77
485 5.422 0.004 4.28
300 5.281 0.003 7.59
575 5.234 0.002 9.97
575 5.231 0.002 10.07
472 5.184 0.001 11.61
375 5.152 0.002 12.72
300 5.138 0.002 13.12
300 5.137 0.003 13.15
625 5.050 0.005 18.58
575 5.026 0.002 19.83
475 4.968 0.002 23.31
300 4.937 0.002 24.99
300 4.937 0.002 25.00
300 4.932 0.007 25.35
375 4.932 0.003 25.62
NaCl B2 Crystal Structure Pressure Calibration
Temperature
(K)
NaCl-a
(Å)
NaCl-a-
error
Pressure
(GPa)
300 2.9509 0.0048 41.50 715 3.0192 0.0005 32.11
715 3.0218 0.0028 31.75
575 3.0559 0.0063 26.68
375 2.9900 0.0025 35.13
300 2.9740 0.0051 37.45

30
WO3 Lattice Parameters with Pressure
Pressure
(GPa)
WO3-a
(Å)
WO3-a-
error
WO3-b
(Å)
WO3-b-
error
WO3-c
(Å)
WO3-c-
error
WO3-β WO3-beta-
error
10.7 5.124 0.003 4.752 0.002 7.280 0.002 95.50 0.04
16.3 5.104 0.003 4.663 0.002 7.181 0.003 96.47 0.05
20.1 5.081 0.005 4.603 0.003 7.109 0.005 97.11 0.09
22.9 5.065 0.004 4.565 0.003 7.064 0.004 97.43 0.07
25.0 6.168 0.006 4.588 0.004 5.317 0.005 101.45 0.09
29.0 6.146 0.008 4.556 0.005 5.304 0.006 101.28 0.10
29.6 6.107 0.004 4.562 0.002 5.311 0.003 101.88 0.06
32.8 6.112 0.004 4.545 0.002 5.289 0.002 101.65 0.04
34.8 10.391 0.008 3.944 0.002 9.353 0.009 99.96 0.09
40.8 10.325 0.006 3.906 0.002 9.280 0.005 99.76 0.07
44.5 10.291 0.008 3.877 0.002 9.211 0.006 99.26 0.05
WO3 Volume with Pressure
Pressure
(GPa)
Volume
(Å^3)
Volume
error
Volume
(cc/mol)
Volume
error
10.7 176.44 0.09 26.56 0.01
16.3 169.84 0.11 25.57 0.02
20.1 164.97 0.17 24.84 0.02
22.9 161.94 0.14 24.38 0.02
25.0 147.50 0.17 22.21 0.03
29.0 145.66 0.19 21.93 0.03
29.6 144.78 0.10 21.80 0.01
32.8 143.91 0.08 21.67 0.01
34.8 125.84 0.37 18.95 0.06
40.8 122.93 0.26 18.51 0.04
44.5 120.89 0.30 18.20 0.05

31
Argon Pressure Calibration
Ar-a Ar-a-error Pressure
(GPa)
4.454 0.002 10.7
4.328 0.002 16.3
4.243 0.003 20.1
4.197 0.003 22.9
4.148 0.003 25.0
4.118 0.002 29.0
4.105 0.002 29.6
4.087 0.002 32.8
4.056 0.002 34.8
3.999 0.004 40.8
3.970 0.002 44.5

h-k-l Assignments for Diffraction Patterns
Pattern P Amp 2-Θ d(Å) h k l d (calc) Δd Δd^2 sum of
Δd^2
parameters value sigma
WO2-1 13.15 28 6.9 3.3867 0 1 1 3.3869 -0.0002 3.62E-08 a 5.492 0.006
1 8.3 2.7975 -1 0 2 2.7985 -0.0010 9.84E-07 5.62E-06 b 4.792 0.003
6 9.7 2.3957 0 2 0 2.3962 -0.0005 2.75E-07 c 5.597 0.002
3 9.9 2.3485 2 0 0 2.3487 -0.0001 1.97E-08 β 121.212 0.080
3 13.6 1.7139 -2 1 3 1.7124 0.0014 2.08E-06 V 126.004 0.102
6 13.8 1.6949 0 2 2 1.6934 0.0015 2.23E-06
WO2-2 2.41 9 6.8 3.4431 0 1 1 3.4431 0.0000 8.87E-10 a 5.604 0.006
2 8.2 2.8521 -1 0 2 2.8520 0.0001 1.89E-08 2.85E-05 b 4.855 0.007
5 9.6 2.4265 -2 1 1 2.4258 0.0007 4.83E-07 c 5.704 0.005
6 13.6 1.7217 0 2 2 1.7216 0.0001 1.27E-08 β 121.104 0.124
3 13.7 1.7027 2 2 0 1.7063 -0.0036 1.28E-05 V 132.863 0.154
2 14.6 1.6003 3 0 0 1.5993 0.0010 9.71E-07
2 17.2 1.3582 -3 2 3 1.3594 -0.0012 1.32E-06
2 17.4 1.3450 2 3 0 1.3415 0.0035 1.23E-05
2 17.5 1.3348 3 2 0 1.3355 -0.0007 5.40E-07
WO2-3 2.27 15 6.8 3.4452 0 1 1 3.4464 -0.0012 1.52E-06 a 5.578 0.009
2 9.6 2.4415 -2 0 2 2.4404 0.0011 1.25E-06 3.37E-05 b 4.910 0.008
3 9.6 2.4197 0 0 2 2.4193 0.0005 2.38E-07 c 5.642 0.007
4 13.6 1.7228 0 2 2 1.7232 -0.0004 1.57E-07 β 120.947 0.082
3 13.7 1.7032 1 1 2 1.7027 0.0004 1.76E-07 V 132.514 0.262
3 15.2 1.5414 -3 1 3 1.5443 -0.0029 8.67E-06
3 15.8 1.4761 -2 2 3 1.4768 -0.0007 5.02E-07
4 19.0 1.2300 -2 3 3 1.2254 0.0046 2.11E-05
2 20.1 1.1622 4 1 0 1.1619 0.0002 5.70E-08

33
WO2-4 2.77 11 6.8 3.4467 0 1 1 3.4441 0.0026 6.59E-06 a 5.610 0.010
5 9.6 2.4273 -2 1 1 2.4272 0.0001 1.17E-08 4.65E-05 b 4.847 0.013
4 13.6 1.7209 0 2 2 1.7221 -0.0012 1.34E-06 c 5.711 0.022
2 15.1 1.5464 0 1 3 1.5464 0.0000 7.65E-12 β 121.006 0.243
3 16.0 1.4612 1 2 2 1.4618 -0.0005 2.96E-07 V 133.107 0.255
4 19.2 1.2220 -2 3 3 1.2225 -0.0006 3.30E-07
2 20.0 1.1684 3 2 1 1.1684 0.0000 3.68E-11
2 20.5 1.1432 0 3 3 1.1480 -0.0049 2.38E-05
1 21.2 1.1071 -5 0 2 1.1108 -0.0038 1.41E-05
WO2-5 2.3 6 6.8 3.4472 0 1 1 3.4477 -0.0005 2.04E-07 a 5.574 0.004
5 9.6 2.4405 -2 0 2 2.4399 0.0005 2.75E-07 3.29E-05 b 4.895 0.005
1 12.7 1.8407 -2 2 1 1.8388 0.0019 3.67E-06 c 5.653 0.006
6 13.5 1.7238 0 2 2 1.7238 0.0000 1.42E-10 β 120.776 0.068
8 17.4 1.3452 2 3 0 1.3483 -0.0032 9.94E-06 V 132.519 0.135
8 17.5 1.3390 3 2 0 1.3371 0.0019 3.60E-06
9 17.5 1.3345 2 1 2 1.3343 0.0002 4.10E-08
4 18.0 1.2978 -4 1 3 1.2987 -0.0009 8.54E-07
5 18.3 1.2819 -4 1 1 1.2849 -0.0030 8.77E-06
10 19.1 1.2250 0 4 0 1.2237 0.0013 1.76E-06
11 19.3 1.2135 -3 3 1 1.2141 -0.0005 2.75E-07
7 19.5 1.1992 4 0 0 1.1973 0.0019 3.53E-06
WO2-6 9.97 10 6.8 3.4179 0 1 1 3.4184 -0.0005 2.12E-07 a 5.545 0.002
1 9.7 2.4028 -2 1 1 2.4020 0.0008 6.48E-07 3.22E-06 b 4.816 0.004
1 9.8 2.3774 2 0 0 2.3779 -0.0005 2.26E-07 c 5.659 0.004
2 18.1 1.2926 -4 1 3 1.2932 -0.0006 3.70E-07 β 120.945 0.046
6 20.0 1.1698 1 2 3 1.1684 0.0013 1.77E-06 V 129.596 0.081

34
WO2-7 10.07 18 6.8 3.4184 0 1 1 3.4223 -0.0039 1.52E-05 a 5.553 0.008
2 9.7 2.4080 -2 1 1 2.4077 0.0004 1.39E-07 9.54E-05 b 4.841 0.012
2 16.5 1.4186 -2 0 4 1.4144 0.0042 1.73E-05 c 5.658 0.015
1 16.7 1.4014 -2 3 1 1.3949 0.0065 4.25E-05 β 121.210 0.214
2 16.9 1.3868 -4 0 2 1.3877 -0.0009 8.00E-07 V 130.088 0.298
2 17.0 1.3781 2 0 2 1.3756 0.0025 6.24E-06
3 18.1 1.2926 -4 1 3 1.2962 -0.0036 1.31E-05
WO2-8 11.61 40 6.8 3.4040 0 1 1 3.4057 -0.0018 3.08E-06 a 5.536 0.011
5 9.7 2.4014 0 0 2 2.4017 -0.0004 1.36E-07 1.23E-05 b 4.829 0.005
2 9.9 2.3578 2 0 0 2.3581 -0.0003 1.13E-07 c 5.638 0.012
4 13.7 1.7040 0 2 2 1.7029 0.0012 1.38E-06 β 121.574 0.169
4 13.9 1.6831 1 1 2 1.6816 0.0016 2.43E-06 V 128.418 0.259
3 17.5 1.3360 0 2 3 1.3344 0.0016 2.53E-06
3 19.3 1.2155 -2 3 3 1.2141 0.0015 2.10E-06
1 19.5 1.2001 0 0 4 1.2009 -0.0008 5.67E-07
9 20.2 1.1585 1 2 3 1.1584 0.0001 5.53E-09
WO2-9 12.73
2
30 6.9 3.3950 0 1 1 3.3925 0.0026 6.72E-06 a 5.510 0.011
5 9.7 2.3977 0 0 2 2.3970 0.0007 5.00E-07 4.41E-05 b 4.801 0.009
3 9.9 2.3476 2 0 0 2.3482 -0.0006 3.95E-07 c 5.624 0.011
2 13.7 1.7104 -1 1 3 1.7125 -0.0022 4.66E-06 β 121.528 0.187
6 13.8 1.6910 0 2 2 1.6962 -0.0052 2.72E-05 V 126.822 0.311
3 18.1 1.2891 -4 1 3 1.2878 0.0013 1.62E-06
4 21.8 1.0740 0 2 4 1.0723 0.0018 3.10E-06
WO2-10 13.12 11 6.9 3.3901 0 1 1 3.3877 0.0024 5.79E-06 a 5.504 0.033
1 9.7 2.4016 0 0 2 2.3995 0.0021 4.47E-06 5.18E-05 b 4.783 0.011
1 13.8 1.6894 0 2 2 1.6939 -0.0044 1.95E-05 c 5.622 0.027

35
1 17.2 1.3619 2 0 2 1.3612 0.0007 5.48E-07 β 121.398 0.401
1 19.6 1.1953 0 0 4 1.1997 -0.0045 2.02E-05 V 126.344 0.775
1 19.8 1.1818 2 2 2 1.1830 -0.0012 1.33E-06
2 20.4 1.1484 -4 2 1 1.1484 0.0000 1.63E-10
WO2-11 4.28 4 6.8 3.4396 0 1 1 3.4383 0.0013 1.76E-06 a 5.576 0.003
1 9.5 2.4440 -2 0 2 2.4449 -0.0009 7.27E-07 2.50E-05 b 4.880 0.005
1 9.6 2.4220 -2 1 1 2.4203 0.0017 2.92E-06 c 5.657 0.005
1 9.8 2.3876 2 0 0 2.3879 -0.0003 7.17E-08 β 121.082 0.050
1 13.5 1.7327 -2 1 3 1.7328 0.0000 1.05E-09 V 131.848 0.103
1 13.6 1.7191 0 2 2 1.7191 0.0000 2.14E-10
1 13.8 1.6932 2 1 1 1.6922 0.0010 1.05E-06
1 16.6 1.4059 -2 3 1 1.4050 0.0009 7.80E-07
1 16.7 1.3985 1 3 1 1.4018 -0.0032 1.03E-05
2 19.4 1.2089 -4 2 2 1.2101 -0.0013 1.59E-06
1 19.5 1.1995 2 2 2 1.2019 -0.0024 5.75E-06
WO2-12 7.59 48 6.8 3.4265 0 1 1 3.4212 0.0052 2.73E-05 a 5.545 0.015
10 9.7 2.4150 0 0 2 2.4151 -0.0001 9.71E-09 1.31E-04 b 4.847 0.010
3 9.8 2.3743 2 0 0 2.3744 -0.0001 3.86E-09 c 5.640 0.015
84 13.7 1.7005 0 2 2 1.7106 -0.0102 1.03E-04 β 121.091 0.250
2 18.3 1.2755 -4 1 1 1.2753 0.0002 3.26E-08 V 129.814 0.392
3 19.3 1.2114 0 4 0 1.2116 -0.0002 4.11E-08
2 19.5 1.2029 -4 2 2 1.2029 -0.0001 7.60E-09
WO2-13 25 144 7.0 3.3358 0 1 1 3.3356 0.0002 4.07E-08 a 5.402 0.015
10 9.8 2.3828 -1 1 2 2.3848 -0.0020 4.09E-06 7.43E-05 b 4.723 0.010
6 9.9 2.3585 0 0 2 2.3557 0.0028 8.00E-06 c 5.526 0.009
3 13.9 1.6824 -2 2 2 1.6775 0.0049 2.45E-05 β 121.508 0.162
17 14.0 1.6631 0 2 2 1.6678 -0.0047 2.23E-05 V 120.221 0.341

36
5 18.0 1.3019 2 3 0 1.2997 0.0021 4.60E-06
5 18.2 1.2843 3 2 0 1.2872 -0.0029 8.47E-06
3 18.3 1.2769 -3 1 4 1.2784 -0.0015 2.34E-06
WO2-14 24.99 34 7.0 3.3349 0 1 1 3.3366 -0.0017 2.98E-06 a 5.379 0.024
8 9.8 2.3719 0 2 0 2.3727 -0.0008 6.03E-07 3.61E-05 b 4.745 0.005
6 13.8 1.6935 -2 1 3 1.6944 -0.0010 9.32E-07 c 5.533 0.010
10 14.0 1.6726 0 2 2 1.6683 0.0043 1.82E-05 β 121.999 0.113
3 14.3 1.6380 1 1 2 1.6370 0.0010 9.72E-07 V 119.772 0.477
17 19.6 1.1948 -2 3 3 1.1922 0.0026 6.99E-06
7 20.8 1.1278 1 2 3 1.1301 -0.0023 5.45E-06
WO2-15 25.62 197 7.0 3.3387 0 1 1 3.3381 0.0006 3.76E-07 a 5.344 0.012
79 9.8 2.3724 0 2 0 2.3719 0.0005 2.53E-07 3.06E-05 b 4.744 0.003
31 13.8 1.6937 -2 1 3 1.6943 -0.0006 3.69E-07 c 5.539 0.007
50 14.0 1.6711 0 2 2 1.6690 0.0021 4.41E-06 β 121.990 0.116
7 15.6 1.4956 0 3 1 1.4986 -0.0030 9.20E-06 V 119.102 0.262
10 16.7 1.4016 1 2 2 1.4042 -0.0026 6.64E-06
3 17.3 1.3548 1 3 1 1.3562 -0.0014 2.04E-06
4 17.8 1.3125 0 3 2 1.3117 0.0008 6.19E-07
3 18.0 1.2994 2 3 0 1.2968 0.0026 6.70E-06
WO2-16 23.31 82 7.0 3.3397 0 1 1 3.3388 0.0009 7.75E-07 a 5.386 0.011
34 9.8 2.3772 0 2 0 2.3797 -0.0025 6.42E-06 1.21E-04 b 4.759 0.006
2 12.9 1.8049 -1 2 2 1.8067 -0.0018 3.18E-06 c 5.553 0.011
18 13.7 1.7003 -2 1 3 1.7018 -0.0015 2.30E-06 β 122.474 0.174
28 13.9 1.6766 0 2 2 1.6694 0.0072 5.25E-05 V 120.091 0.280
6 14.2 1.6440 2 2 0 1.6432 0.0008 5.64E-07
7 15.5 1.5074 -1 3 1 1.5061 0.0013 1.74E-06
14 16.7 1.3965 1 2 2 1.4028 -0.0063 3.94E-05

37
5 17.1 1.3695 -2 3 1 1.3662 0.0033 1.07E-05
6 17.2 1.3568 1 3 1 1.3586 -0.0018 3.30E-06
5 17.4 1.3442 -4 0 2 1.3439 0.0003 8.32E-08
WO2-17 19.83 65 6.9 3.3550 0 1 1 3.3584 -0.0033 1.11E-05 a 5.444 0.005
30 9.8 2.3835 0 2 0 2.3813 0.0022 4.63E-06 8.04E-05 b 4.763 0.004
6 10.1 2.3178 2 0 0 2.3159 0.0019 3.76E-06 c 5.567 0.006
11 13.7 1.7078 -2 1 3 1.7043 0.0035 1.20E-05 β 121.702 0.080
22 13.9 1.6796 0 2 2 1.6792 0.0005 2.10E-07 V 122.805 0.140
3 15.5 1.5098 -1 3 1 1.5075 0.0024 5.54E-06
1 17.2 1.3559 -4 0 2 1.3598 -0.0038 1.45E-05
1 18.1 1.2907 2 1 2 1.2905 0.0002 5.16E-08
5 19.6 1.1947 -2 3 3 1.1978 -0.0031 9.70E-06
3 19.7 1.1877 0 4 0 1.1907 -0.0030 8.86E-06
3 20.9 1.1226 0 3 3 1.1195 0.0032 1.00E-05
WO2-18 18.58 135 6.9 3.3570 0 1 1 3.3574 -0.0004 1.55E-07 a 5.491 0.011
47 9.8 2.3847 0 2 0 2.3845 0.0002 3.65E-08 5.58E-05 b 4.769 0.004
8 10.0 2.3277 2 0 0 2.3275 0.0002 6.16E-08 c 5.577 0.009
23 13.7 1.7100 -2 1 3 1.7099 0.0001 1.05E-08 β 122.037 0.146
33 13.9 1.6840 0 2 2 1.6787 0.0053 2.81E-05 V 123.797 0.219
5 15.5 1.5053 0 3 1 1.5068 -0.0015 2.21E-06
8 16.5 1.4142 1 2 2 1.4178 -0.0036 1.30E-05
2 17.0 1.3770 -2 3 1 1.3754 0.0017 2.74E-06
4 19.5 1.1975 -2 3 3 1.2006 -0.0031 9.50E-06
WO2-19 25.35 196 7.0 3.3240 0 1 1 3.3259 -0.0020 3.88E-06 a 5.397 0.009
113 9.8 2.3806 -1 1 2 2.3772 0.0033 1.12E-05 5.89E-05 b 4.714 0.008
15 10.1 2.3009 2 0 0 2.3002 0.0007 4.98E-07 c 5.507 0.007
13 13.0 1.7892 -1 2 2 1.7904 -0.0012 1.45E-06 β 121.532 0.124

38
62 14.0 1.6672 0 2 2 1.6630 0.0043 1.82E-05 V 119.412 0.178
19 16.7 1.4033 1 2 2 1.4062 -0.0029 8.34E-06
5 17.2 1.3584 -2 3 1 1.3576 0.0008 5.68E-07
7 18.4 1.2710 -3 1 4 1.2749 -0.0038 1.48E-05
WO2-20 41.5 55 9.8 2.3688 -1 1 2 2.3692 -0.0004 1.73E-07 a 5.279 0.002
13 10.0 2.3294 0 2 0 2.3295 -0.0001 1.70E-08 2.18E-06 b 4.659 0.001
4 10.2 2.2919 -2 1 1 2.2923 -0.0004 1.70E-07 c 5.504 0.002
1 13.4 1.7458 -2 2 1 1.7447 0.0010 1.09E-06 β 122.572 0.041
33 14.0 1.6711 -1 1 3 1.6704 0.0007 5.11E-07 V 114.080 0.044
10 14.2 1.6431 0 2 2 1.6435 -0.0005 2.20E-07
WO2-21 32.11 11 9.8 2.3871 -1 1 2 2.3866 0.0005 2.54E-07 a 5.403 0.010
2 13.0 1.7904 -1 2 2 1.7903 0.0001 1.09E-08 9.04E-06 b 4.689 0.004
6 13.9 1.6796 -1 1 3 1.6804 -0.0008 6.16E-07 c 5.548 0.004
2 17.4 1.3443 1 3 1 1.3428 0.0015 2.37E-06 β 122.732 0.085
4 18.2 1.2856 2 3 0 1.2879 -0.0023 5.35E-06 V 118.256 0.173
4 18.4 1.2732 3 2 0 1.2726 0.0007 4.41E-07
WO2-22 31.75 36 9.8 2.3837 -1 1 2 2.3794 0.0043 1.85E-05 a 5.340 0.016
2 13.0 1.7914 -1 2 2 1.7913 0.0001 5.45E-09 5.82E-05 b 4.714 0.013
22 13.9 1.6748 -1 1 3 1.6791 -0.0042 1.78E-05 c 5.513 0.010
2 17.4 1.3476 1 3 1 1.3502 -0.0026 6.78E-06 β 121.759 0.249
3 18.3 1.2763 3 2 0 1.2735 0.0028 7.94E-06 V 117.992 0.381
5 18.7 1.2501 -4 1 3 1.2528 -0.0027 7.19E-06
WO2-23 26.68 56 9.8 2.3760 -1 1 2 2.3738 0.0021 4.56E-06 a 5.379 0.004
13 10.0 2.3398 0 0 2 2.3436 -0.0037 1.38E-05 6.55E-05 b 4.737 0.006
3 10.1 2.3003 2 0 0 2.2974 0.0028 7.99E-06 c 5.487 0.004
2 13.0 1.7920 -1 2 2 1.7928 -0.0007 5.03E-07 β 121.319 0.072

39
32 13.9 1.6778 -1 1 3 1.6742 0.0037 1.35E-05 V 119.425 0.135
28 14.0 1.6709 -2 2 2 1.6744 -0.0035 1.20E-05
8 17.4 1.3416 -4 0 2 1.3438 -0.0023 5.08E-06
7 18.4 1.2698 -3 1 4 1.2701 -0.0003 1.09E-07
10 19.0 1.2345 -4 1 1 1.2358 -0.0012 1.52E-06
11 19.7 1.1889 -2 3 3 1.1863 0.0026 6.58E-06
WO2-24 35.13 8 7.1 3.2838 0 1 1 3.2857 -0.0020 3.94E-06 a 5.368 0.009
38 9.8 2.3731 -1 1 2 2.3735 -0.0004 1.97E-07 3.77E-05 b 4.671 0.013
15 13.8 1.6924 -2 1 3 1.6906 0.0017 2.97E-06 c 5.516 0.010
22 14.0 1.6702 -2 2 2 1.6706 -0.0004 1.46E-07 β 123.053 0.185
3 17.5 1.3381 -4 0 2 1.3388 -0.0007 5.56E-07 V 115.923 0.240
4 20.2 1.1571 1 3 2 1.1517 0.0055 2.99E-05
WO2-25 37.45 6 7.1 3.2851 0 1 1 3.2835 0.0016 2.54E-06 a 5.339 0.014
31 9.8 2.3702 -1 1 2 2.3756 -0.0054 2.91E-05 7.84E-05 b 4.688 0.014
6 13.8 1.6973 -2 1 3 1.6921 0.0052 2.70E-05 c 5.516 0.009
21 14.0 1.6656 -1 1 3 1.6677 -0.0021 4.42E-06 β 123.484 0.212
2 14.5 1.6123 2 2 0 1.6143 -0.0020 4.06E-06 V 115.149 0.288
3 19.7 1.1863 -2 3 3 1.1840 0.0023 5.28E-06
3 20.3 1.1526 0 0 4 1.1502 0.0025 6.02E-06
Pattern P Amp 2-Θ d(Å) h k l d (calc) Δd Δd^2 sum of
Δd^2
param p-value sigma
WO3-1 10.7 65 6.4 3.6230 0 0 2 3.6233 -0.0003 7.61E-08 a 5.124 0.003
116 6.7 3.4790 1 1 0 3.4768 0.0022 4.68E-06 4.91E-05 b 4.752 0.002
15 8.1 2.8808 0 1 2 2.8813 -0.0006 3.55E-07 c 7.280 0.002
9 8.2 2.8288 1 0 2 2.8285 0.0003 7.99E-08 β 95.501 0.039
34 9.0 2.5934 -1 1 2 2.5948 -0.0014 1.85E-06 V 176.444 0.091

40
18 9.6 2.4303 1 1 2 2.4306 -0.0003 8.85E-08
12 9.8 2.3743 0 2 0 2.3762 -0.0019 3.43E-06
5 10.8 2.1526 0 1 3 2.1533 -0.0008 5.86E-07
44 11.7 1.9889 0 2 2 1.9870 0.0019 3.44E-06
11 12.4 1.8851 -1 2 2 1.8853 -0.0002 3.92E-08
8 12.7 1.8400 2 1 2 1.8412 -0.0011 1.30E-06
4 12.9 1.8144 0 0 4 1.8116 0.0028 7.89E-06
15 13.8 1.6904 0 1 4 1.6928 -0.0024 5.84E-06
10 14.1 1.6531 -1 1 4 1.6514 0.0017 2.74E-06
25 14.5 1.6061 -2 2 2 1.6089 -0.0028 7.95E-06
13 15.4 1.5150 -3 1 2 1.5156 -0.0005 3.00E-07
14 15.9 1.4738 -2 1 4 1.4724 0.0014 1.97E-06
15 16.5 1.4128 -1 3 2 1.4104 0.0025 6.21E-06
12 18.6 1.2590 3 2 2 1.2594 -0.0005 2.35E-07
11 18.9 1.2412 2 3 2 1.2411 0.0001 1.98E-08
WO3-2 16.3 66 6.5 3.5674 0 0 2 3.5678 -0.0004 1.98E-07 a 5.104 0.003
105 6.8 3.4352 1 1 0 3.4327 0.0025 6.03E-06 1.16E-04 b 4.663 0.002
18 8.2 2.8341 0 1 2 2.8336 0.0005 2.48E-07 c 7.181 0.003
15 8.4 2.7760 1 0 2 2.7747 0.0013 1.70E-06 β 96.469 0.050
35 9.1 2.5768 -1 1 2 2.5737 0.0031 9.68E-06 V 169.842 0.112
24 9.2 2.5373 2 0 0 2.5358 0.0015 2.32E-06
18 9.8 2.3856 1 1 2 2.3845 0.0011 1.12E-06
10 10.0 2.3308 0 2 0 2.3317 -0.0009 7.99E-07
15 11.8 1.9781 -2 1 2 1.9797 -0.0016 2.65E-06
15 11.9 1.9621 2 0 2 1.9650 -0.0029 8.68E-06
28 12.3 1.8918 1 1 3 1.8888 0.0030 8.96E-06
12 12.5 1.8609 -1 2 2 1.8604 0.0005 2.65E-07
13 13.6 1.7145 2 2 0 1.7164 -0.0018 3.39E-06
11 14.0 1.6645 0 1 4 1.6662 -0.0016 2.65E-06

41
4 14.3 1.6335 -1 1 4 1.6348 -0.0012 1.45E-06
31 14.7 1.5903 -2 2 2 1.5949 -0.0047 2.18E-05
15 15.6 1.5005 2 2 2 1.5026 -0.0021 4.43E-06
17 15.7 1.4848 1 3 0 1.4862 -0.0014 2.02E-06
13 16.0 1.4641 -1 3 1 1.4647 -0.0005 2.76E-07
3 16.2 1.4434 1 3 1 1.4455 -0.0021 4.28E-06
10 16.8 1.3938 -1 3 2 1.3883 0.0055 3.03E-05
7 16.9 1.3864 2 0 4 1.3873 -0.0010 9.37E-07
8 17.3 1.3548 -1 1 5 1.3549 -0.0001 1.75E-08
10 17.5 1.3334 1 2 4 1.3340 -0.0006 3.95E-07
12 17.6 1.3289 2 1 4 1.3297 -0.0009 7.79E-07
8 18.2 1.2859 -2 2 4 1.2868 -0.0010 9.28E-07
11 18.9 1.2403 3 2 2 1.2406 -0.0002 5.00E-08
WO3-3 20.1 70 6.6 3.5259 0 0 2 3.5271 -0.0012 1.48E-06 a 5.081 0.005
98 6.9 3.3951 1 1 0 3.3993 -0.0041 1.72E-05 2.84E-04 b 4.603 0.003
19 8.3 2.8010 0 1 2 2.7996 0.0014 2.06E-06 c 7.109 0.005
8 8.5 2.7330 1 0 2 2.7355 -0.0025 6.24E-06 β 97.108 0.087
51 9.1 2.5571 -1 1 2 2.5565 0.0006 3.50E-07 V 164.969 0.166
27 9.2 2.5240 2 0 0 2.5210 0.0030 9.00E-06
25 9.9 2.3511 1 1 2 2.3515 -0.0005 2.19E-07
9 10.1 2.3023 0 2 0 2.3013 0.0011 1.10E-06
6 11.9 1.9689 1 2 1 1.9795 -0.0106 1.12E-04
14 12.1 1.9328 0 2 2 1.9273 0.0055 2.99E-05
2 12.7 1.8417 -1 2 2 1.8423 -0.0007 4.27E-07
8 13.8 1.6979 2 2 0 1.6996 -0.0017 3.06E-06
14 14.2 1.6476 0 1 4 1.6468 0.0008 6.54E-07
7 14.6 1.6037 1 0 4 1.6040 -0.0003 7.90E-08
23 14.8 1.5788 3 1 0 1.5787 0.0001 2.23E-08
11 15.7 1.4890 2 2 2 1.4835 0.0055 2.99E-05

42
11 15.9 1.4690 1 3 0 1.4677 0.0012 1.56E-06
14 16.1 1.4523 -1 3 1 1.4474 0.0049 2.44E-05
3 16.3 1.4322 -2 2 3 1.4355 -0.0033 1.06E-05
12 16.9 1.3828 3 1 2 1.3823 0.0005 2.57E-07
7 17.1 1.3689 2 0 4 1.3678 0.0011 1.21E-06
14 17.8 1.3117 -3 2 2 1.3114 0.0003 8.93E-08
11 18.8 1.2480 3 1 3 1.2454 0.0025 6.45E-06
11 19.0 1.2304 1 3 3 1.2254 0.0050 2.52E-05
WO3-4 22.9 55 6.7 3.5020 0 0 2 3.5023 -0.0003 6.27E-08 a 5.065 0.004
83 6.9 3.3762 1 1 0 3.3780 -0.0018 3.22E-06 8.15E-05 b 4.565 0.003
13 8.4 2.7795 0 1 2 2.7787 0.0008 6.08E-07 c 7.064 0.004
6 8.6 2.7157 1 0 2 2.7128 0.0029 8.47E-06 β 97.430 0.073
35 9.2 2.5448 -1 1 2 2.5444 0.0004 1.24E-07 V 161.940 0.136
16 9.3 2.5119 2 0 0 2.5110 0.0009 8.38E-07
13 10.0 2.3306 1 1 2 2.3321 -0.0015 2.35E-06
6 10.2 2.2850 0 2 0 2.2825 0.0026 6.70E-06
3 11.9 1.9632 1 2 1 1.9637 -0.0005 2.35E-07
6 13.8 1.6869 2 2 0 1.6890 -0.0021 4.37E-06
11 14.3 1.6357 0 1 4 1.6350 0.0007 4.96E-07
5 14.7 1.5898 1 0 4 1.5908 -0.0010 9.88E-07
14 14.9 1.5723 3 1 0 1.5717 0.0006 4.01E-07
7 17.0 1.3784 -1 2 4 1.3758 0.0026 6.75E-06
7 17.1 1.3664 -1 3 2 1.3629 0.0035 1.23E-05
5 17.6 1.3325 -1 1 5 1.3358 -0.0033 1.12E-05
3 17.7 1.3231 1 3 2 1.3271 -0.0040 1.60E-05
11 18.0 1.3026 1 2 4 1.3051 -0.0025 6.42E-06
WO3-5 25.0 5 6.4 3.6681 1 1 0 3.6549 0.0131 1.73E-04 a 6.168 0.006
72 6.8 3.4401 0 1 1 3.4438 -0.0037 1.40E-05 4.43E-04 b 4.588 0.004

43
16 7.3 3.1805 -1 1 1 3.1771 0.0034 1.15E-05 c 5.317 0.005
6 8.1 2.8690 -2 0 1 2.8742 -0.0052 2.68E-05 β 101.455 0.092
6 8.2 2.8365 1 1 1 2.8365 0.0000 2.47E-09 V 147.501 0.168
21 8.9 2.6090 0 0 2 2.6058 0.0032 1.04E-05
11 9.2 2.5247 2 1 0 2.5242 0.0005 2.43E-07
3 10.2 2.2898 0 2 0 2.2942 -0.0044 1.90E-05
5 10.3 2.2610 0 1 2 2.2659 -0.0049 2.41E-05
16 10.9 2.1368 2 1 1 2.1370 -0.0001 1.96E-08
7 11.7 1.9878 -2 1 2 1.9850 0.0028 7.74E-06
6 12.1 1.9305 1 2 1 1.9361 -0.0056 3.09E-05
5 12.7 1.8406 3 1 0 1.8451 -0.0045 2.01E-05
3 12.9 1.8083 2 0 2 1.8044 0.0039 1.56E-05
12 13.6 1.7173 -1 2 2 1.7165 0.0008 7.16E-07
7 14.1 1.6542 -3 1 2 1.6543 -0.0001 1.21E-08
9 14.3 1.6295 0 1 3 1.6246 0.0048 2.33E-05
6 14.6 1.5989 1 2 2 1.6016 -0.0027 7.45E-06
6 16.3 1.4359 4 1 0 1.4355 0.0004 1.89E-07
7 16.6 1.4057 1 3 1 1.4082 -0.0025 6.36E-06
10 16.9 1.3831 0 2 3 1.3849 -0.0018 3.21E-06
10 17.8 1.3127 -1 3 2 1.3166 -0.0039 1.48E-05
9 19.5 1.2017 4 0 2 1.2074 -0.0058 3.34E-05
WO3-6 29.0 89 6.8 3.4278 0 1 1 3.4273 0.0005 2.77E-07 a 6.146 0.008
19 7.4 3.1685 -1 1 1 3.1594 0.0091 8.21E-05 3.61E-04 b 4.556 0.005
5 8.2 2.8547 -2 0 1 2.8617 -0.0070 4.93E-05 c 5.304 0.006
6 8.2 2.8288 1 1 1 2.8269 0.0019 3.51E-06 β 101.277 0.104
22 9.0 2.5987 0 0 2 2.6007 -0.0020 4.04E-06 V 145.661 0.194
8 9.6 2.4248 -2 1 1 2.4234 0.0015 2.12E-06
16 10.9 2.1321 1 2 0 2.1310 0.0011 1.11E-06
6 11.8 1.9790 -2 1 2 1.9756 0.0034 1.14E-05

44
6 12.2 1.9199 1 2 1 1.9258 -0.0058 3.40E-05
2 12.9 1.8122 -2 2 0 1.8173 -0.0052 2.69E-05
11 13.7 1.7073 -1 2 2 1.7072 0.0001 2.59E-09
6 14.1 1.6565 2 2 1 1.6559 0.0005 2.85E-07
7 14.2 1.6443 -3 1 2 1.6465 -0.0021 4.52E-06
10 14.4 1.6200 0 1 3 1.6204 -0.0004 1.91E-07
10 16.3 1.4383 4 1 0 1.4307 0.0076 5.82E-05
6 16.7 1.3995 1 3 1 1.3996 -0.0001 9.52E-09
12 16.9 1.3857 3 1 2 1.3886 -0.0029 8.67E-06
14 18.0 1.3008 -1 3 2 1.3086 -0.0078 6.06E-05
8 19.4 1.2094 4 0 2 1.2056 0.0038 1.43E-05
WO3-7 29.6 85 6.8 3.4266 0 1 1 3.4284 -0.0018 3.35E-06 a 6.107 0.004
21 7.4 3.1667 -1 1 1 3.1651 0.0017 2.73E-06 1.32E-04 b 4.562 0.002
5 8.2 2.8577 -2 0 1 2.8569 0.0007 5.60E-07 c 5.311 0.003
18 9.0 2.5984 0 0 2 2.5986 -0.0002 2.94E-08 β 101.880 0.060
17 10.9 2.1309 1 2 0 2.1309 0.0000 6.10E-10 V 144.778 0.096
6 12.1 1.9244 1 2 1 1.9227 0.0017 2.87E-06
2 12.9 1.8071 -2 2 0 1.8130 -0.0059 3.49E-05
2 13.1 1.7860 -2 2 1 1.7825 0.0035 1.23E-05
14 13.7 1.7080 -1 2 2 1.7105 -0.0025 6.13E-06
8 14.2 1.6503 2 2 1 1.6490 0.0013 1.64E-06
11 14.4 1.6192 0 1 3 1.6195 -0.0003 9.91E-08
7 14.7 1.5930 1 2 2 1.5915 0.0016 2.47E-06
8 15.5 1.5072 -3 2 1 1.5050 0.0022 4.88E-06
6 15.9 1.4711 1 3 0 1.4736 -0.0026 6.67E-06
9 16.3 1.4375 -1 3 1 1.4370 0.0005 2.56E-07
4 16.6 1.4097 2 2 2 1.4067 0.0030 9.14E-06
12 16.9 1.3872 3 2 1 1.3854 0.0018 3.34E-06
10 18.0 1.3025 4 1 1 1.3062 -0.0036 1.30E-05

45
9 18.2 1.2853 2 3 1 1.2824 0.0029 8.34E-06
5 19.4 1.2063 -4 2 2 1.2106 -0.0043 1.89E-05
WO3-8 32.8 70 6.8 3.4154 0 1 1 3.4166 -0.0013 1.56E-06 a 6.112 0.004
17 7.4 3.1563 -1 1 1 3.1536 0.0027 7.34E-06 6.55E-05 b 4.545 0.002
14 9.0 2.5914 0 0 2 2.5902 0.0011 1.30E-06 c 5.289 0.002
7 9.3 2.5004 2 1 0 2.4997 0.0007 4.79E-07 β 101.653 0.043
7 9.7 2.4142 -2 1 1 2.4165 -0.0023 5.23E-06 V 143.910 0.078
15 11.0 2.1242 1 2 0 2.1246 -0.0005 2.05E-07
7 11.8 1.9718 -2 1 2 1.9726 -0.0009 7.34E-07
8 12.2 1.9151 1 2 1 1.9181 -0.0030 8.93E-06
4 13.1 1.7812 -2 2 1 1.7776 0.0036 1.26E-05
12 13.7 1.7019 -1 2 2 1.7037 -0.0018 3.31E-06
10 14.2 1.6422 -3 1 2 1.6429 -0.0007 5.31E-07
11 14.5 1.6149 0 1 3 1.6142 0.0006 3.89E-07
8 14.7 1.5891 1 2 2 1.5878 0.0012 1.49E-06
10 16.3 1.4331 -1 3 1 1.4318 0.0012 1.55E-06
7 16.6 1.4054 2 2 2 1.4052 0.0001 1.91E-08
14 16.9 1.3849 3 2 1 1.3852 -0.0003 1.10E-07
12 17.5 1.3340 -2 2 3 1.3334 0.0006 4.00E-07
11 18.0 1.2989 1 2 3 1.2954 0.0035 1.24E-05
11 18.2 1.2858 -2 0 4 1.2871 -0.0014 1.85E-06
11 20.4 1.1459 3 3 1 1.1447 0.0013 1.57E-06
8 21.5 1.0905 1 3 3 1.0924 -0.0019 3.46E-06
WO3-9 34.8 6 6.4 3.6235 0 1 1 3.6256 -0.0021 4.43E-06 a 10.391 0.008
75 6.9 3.3963 -3 0 1 3.3961 0.0001 2.04E-08 2.59E-04 b 3.944 0.002
8 8.3 2.8135 1 0 3 2.8105 0.0030 9.18E-06 c 9.353 0.009
14 9.0 2.5770 -3 1 1 2.5735 0.0035 1.21E-05 β 99.960 0.092
4 9.7 2.4003 3 1 1 2.4042 -0.0039 1.48E-05 V 377.530 0.372

46
11 11.0 2.1130 -3 1 3 2.1165 -0.0035 1.20E-05
6 11.9 1.9539 -2 1 4 1.9550 -0.0011 1.19E-06
5 12.2 1.9098 -1 2 1 1.9075 0.0023 5.22E-06
3 12.5 1.8609 3 1 3 1.8592 0.0016 2.72E-06
3 12.6 1.8465 4 1 2 1.8457 0.0007 5.62E-07
2 12.7 1.8339 2 2 0 1.8401 -0.0061 3.78E-05
4 12.8 1.8193 0 2 2 1.8128 0.0065 4.23E-05
9 13.8 1.6923 -1 1 5 1.6902 0.0022 4.83E-06
5 14.0 1.6629 -1 2 3 1.6626 0.0003 7.97E-08
8 14.3 1.6288 -2 2 3 1.6235 0.0053 2.80E-05
8 14.5 1.6111 1 2 3 1.6142 -0.0032 1.00E-05
6 16.1 1.4547 1 2 4 1.4588 -0.0041 1.70E-05
10 16.4 1.4260 0 1 6 1.4308 -0.0048 2.35E-05
11 18.1 1.2950 -1 3 1 1.2950 -0.0001 5.47E-09
8 18.3 1.2760 2 3 0 1.2733 0.0028 7.58E-06
4 19.5 1.1986 -2 3 3 1.1945 0.0040 1.63E-05
9 20.6 1.1387 0 3 4 1.1417 -0.0030 9.17E-06
3 21.9 1.0698 0 3 5 1.0702 -0.0003 1.05E-07
WO3-10 40.8 4 6.5 3.5873 0 1 1 3.5918 -0.0045 2.00E-05 a 10.325 0.006
68 6.9 3.3689 -3 0 1 3.3719 -0.0030 9.15E-06 1.40E-04 b 3.906 0.002
12 7.5 3.1019 2 1 0 3.0980 0.0039 1.50E-05 c 9.280 0.005
7 8.4 2.7923 1 0 3 2.7932 -0.0009 8.02E-07 β 99.758 0.067
13 9.1 2.5585 3 1 0 2.5609 -0.0023 5.42E-06 V 368.803 0.255
4 9.8 2.3843 3 1 1 2.3879 -0.0037 1.34E-05
8 11.1 2.0959 -3 1 3 2.0975 -0.0017 2.72E-06
3 12.1 1.9369 -2 1 4 1.9377 -0.0009 7.48E-07
4 12.2 1.9151 1 2 0 1.9178 -0.0027 7.26E-06
3 12.4 1.8892 -1 2 1 1.8891 0.0001 4.44E-09
3 12.6 1.8510 3 1 3 1.8479 0.0031 9.92E-06

47
4 12.8 1.8287 0 0 5 1.8292 -0.0005 2.87E-07
3 13.9 1.6793 -1 1 5 1.6763 0.0030 8.93E-06
5 14.5 1.6146 -2 2 3 1.6083 0.0063 4.01E-05
8 14.6 1.5972 1 1 5 1.5966 0.0006 3.15E-07
5 15.7 1.4915 -1 2 4 1.4930 -0.0015 2.35E-06
10 18.2 1.2830 -1 3 1 1.2825 0.0005 2.88E-07
8 19.6 1.1959 0 3 3 1.1973 -0.0013 1.74E-06
4 20.7 1.1325 0 3 4 1.1313 0.0012 1.46E-06
3 21.0 1.1147 1 3 4 1.1142 0.0006 3.20E-07
WO3-11 44.5 9 6.3 3.6964 -2 0 2 3.6954 0.0010 1.06E-06 a 10.291 0.008
6 6.5 3.5643 0 1 1 3.5661 -0.0018 3.16E-06 1.70E-04 b 3.877 0.002
69 7.0 3.3533 -3 0 1 3.3541 -0.0008 6.90E-07 c 9.211 0.006
12 7.6 3.0774 2 1 0 3.0815 -0.0041 1.66E-05 β 99.263 0.053
7 8.4 2.7805 1 0 3 2.7836 -0.0032 9.93E-06 V 362.682 0.301
14 9.1 2.5494 3 1 0 2.5500 -0.0006 4.00E-07
8 11.2 2.0831 -3 1 3 2.0793 0.0039 1.50E-05
4 12.2 1.9168 -2 1 4 1.9209 -0.0040 1.64E-05
6 12.7 1.8349 4 1 2 1.8320 0.0029 8.39E-06
3 12.9 1.8063 -2 0 5 1.8066 -0.0003 7.69E-08
5 14.0 1.6648 -1 1 5 1.6637 0.0012 1.37E-06
5 14.1 1.6535 2 2 2 1.6501 0.0034 1.17E-05
1 14.3 1.6384 -2 1 5 1.6375 0.0009 8.46E-07
4 14.5 1.6061 3 1 4 1.6029 0.0032 1.05E-05
8 14.7 1.5934 1 2 3 1.5907 0.0027 7.41E-06
4 14.9 1.5729 4 0 4 1.5723 0.0006 3.86E-07
9 18.3 1.2799 -1 3 1 1.2730 0.0069 4.76E-05
4 19.3 1.2156 -2 3 2 1.2198 -0.0043 1.83E-05

References
Bouvier, P. et al.; ―X-ray diffraction study of WO3 at high pressure.‖ Journal of Physics:
Condensed Matter 14 (2002) 6605-6617
Campbell, Andrew J., et. al.; ―High pressure effects on the iron–iron oxide and nickel–nickel
oxide oxygen fugacity buffers.‖ Earth and Planetary Science Letters 286 (2009): 556-564
Cottrell, Elizabeth, et. al; . "Metal-silicate partitioning of tungsten at high pressure and
temperature; implications for equilibrium core formation in Earth." Earth and Planetary
Science Letters 281.3- 4 (2009): 275-287.
Dorogokupets, Peter I., Oganov, Artem R.; ―Ruby, metals, and MgO as alternative pressure
scales: A semiemperical description of shock-wave, ultrasonic, x-ray, and
thermochemical data at high temperatures and pressures.‖ The American Physical
Society. 024115-(1-6) (2007)
Fei et al. ―Toward an internally consistent pressure scale.‖ (2007) Proc. Nat. Acad. Sci.,
doi:10.1073/pnas.0609013104.]
Hillgren, Valerie J., et al.; . "High pressure and high temperature metal-silicate partitioning of
siderophile elements; the importance of silicate liquid composition." Geochimica et
Cosmochimica Acta 60.12 (1996): 2257-2263.
Howard, Christopher J., et al.; ―High-temperature phase transitions in tungsten
trioxide—the last word?‖ Journal of Physics: Condensed Matter 14 (2002): 377-387
Jacobsen, Steven D. ―Diamond-Anvil Cell (DAC)‖ Northwestern University, Department of
Earth and Planetary Sciences. 2009
<http://www.earth.northwestern.edu/research/jacobsen/>
Komabayashi, Tetsuya et al.,: ―In-situ X-ray diffraction measurements of the γ-ε transition
boundary of iron in an internally-heated diamond anvil cell.‖ Earth and Plantetary
Science Letters 282 (2009): 252-257
Mao, H. K. et al., ―Calibration of the ruby pressure gauge to 800 kbar under quasi-hydrostatic
conditions.‖ Journal of Geophysical Research v.91, no. B5, (1986) 4673-4676
O’Neill, Hugh St.C., et al.,: ―The solubility and oxidation state of tungsten in silicate melts:
Implications for the comparative chemistry of W and Mo in planetary differentiation
processes.‖ Chemical Geology 2008

Righter, Kevin, et al.; . "Metal-silicate partitioning of siderophile elements and core formation in
the early Earth." Annual Review of Earth and Planetary Sciences 31 (2003): 135-174.
Rose-Weston, Lesley, et al.; . "Effect of pressure, temperature, and oxygen fugacity on the
metal-silicate partitioning of Te, Se, and S; implications for Earth differentiation."
Geochimica et Cosmochimica Acta 73.15 (2009): 4598-4615.
Shofner, Gregory, et al.: in preparation.
I pledge on my honor that I have not given or received any unauthorized assistance or
plagiarized on this assignment.
TJ Deane

![Tom&Jerry-Katalog WEB draft0 rev4-small - TJ Labels sticky notes ppp tj-cherry zez tj-bird tj-car tj-fruit model flags t]-garden tj-candy tj-sea](https://img.pdfslide.us/doc/110x75/5ae5d4947f8b9a9e5d8cec91/tomjerry-katalog-web-draft0-rev4-small-tj-sticky-notes-ppp-tj-cherry-zez-tj-bird.jpg)