Embed Size (px)
Citation preview
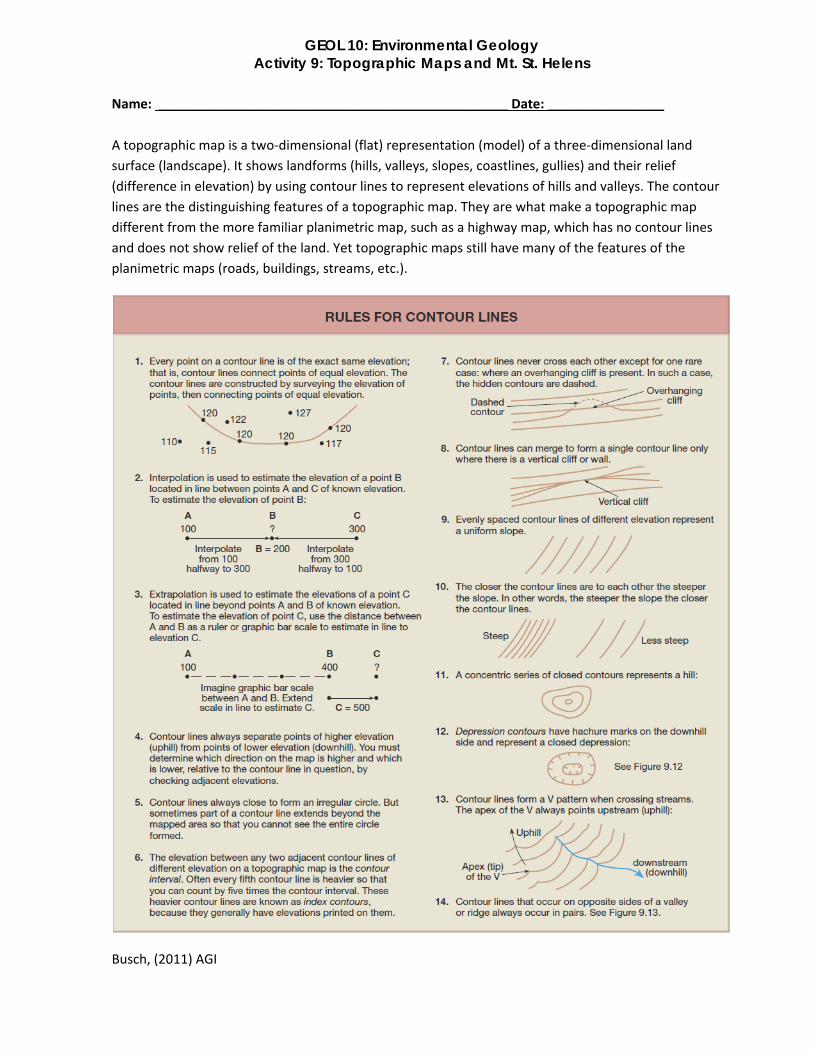
GEOL 10: Environmental Geology Activity 9: Topographic Maps and Mt. St. Helens
Name: ________________________________________________ Date: ________________ A topographic map is a two‐dimensional (flat) representation (model) of a three‐dimensional land
surface (landscape). It shows landforms (hills, valleys, slopes, coastlines, gullies) and their relief
(difference in elevation) by using contour lines to represent elevations of hills and valleys. The contour
lines are the distinguishing features of a topographic map. They are what make a topographic map
different from the more familiar planimetric map, such as a highway map, which has no contour lines
and does not show relief of the land. Yet topographic maps still have many of the features of the
planimetric maps (roads, buildings, streams, etc.).
Busch, (2011) AGI
Page | 5
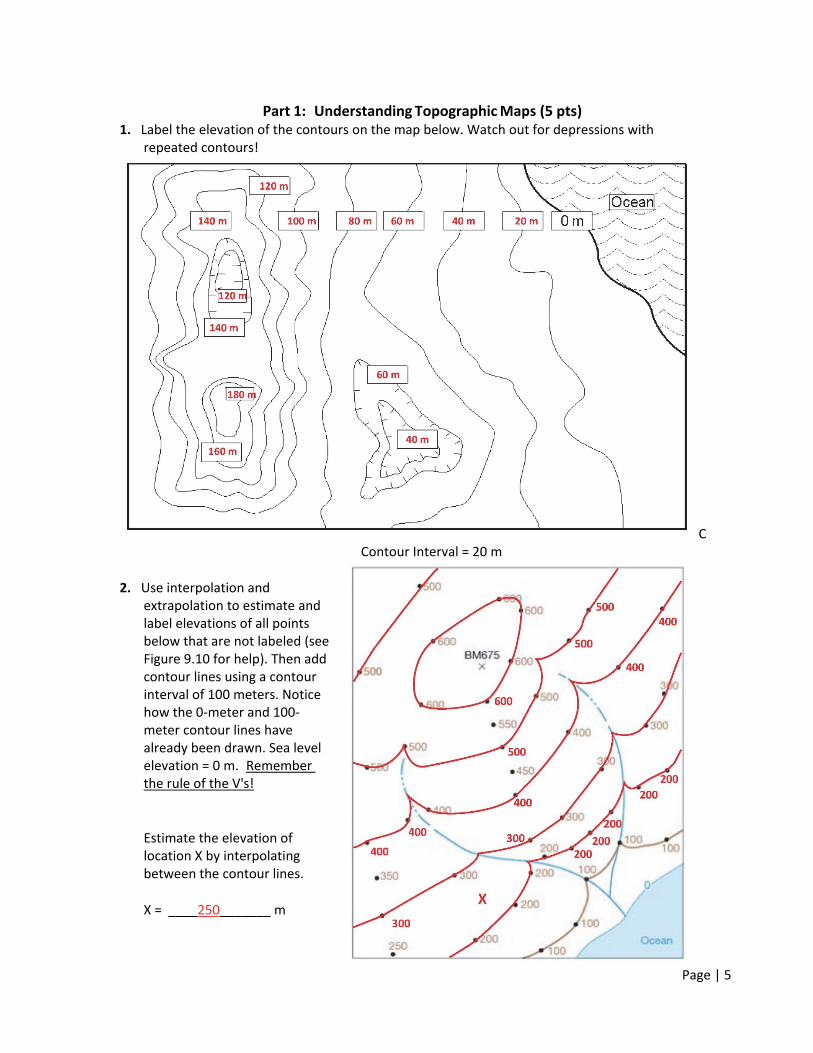
Part 1: Understanding Topographic Maps (5 pts) 1. Label the elevation of the contours on the map below. Watch out for depressions with
repeated contours! C
Contour Interval = 20 m
2. Use interpolation and
extrapolation to estimate and label elevations of all points below that are not labeled (see Figure 9.10 for help). Then add contour lines using a contour interval of 100 meters. Notice how the 0‐meter and 100‐meter contour lines have already been drawn. Sea level elevation = 0 m. Remember the rule of the V's!
Estimate the elevation of location X by interpolating between the contour lines.
X = ____250_______ m
X
Page | 6
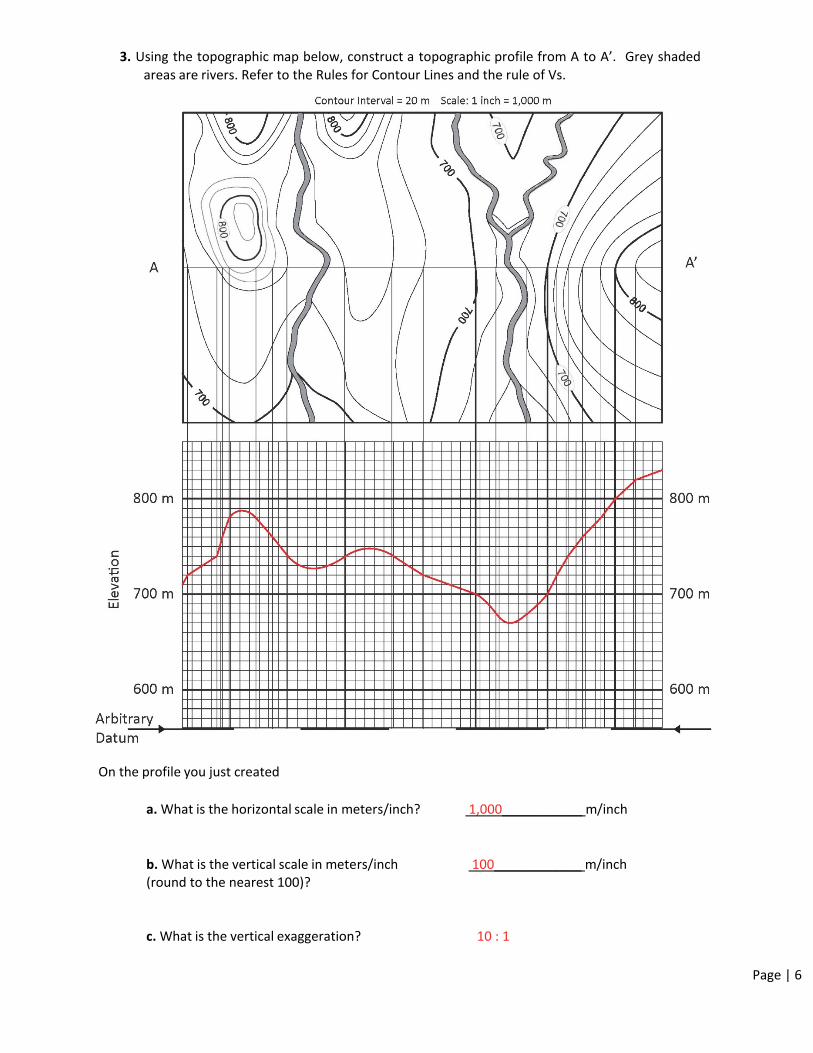
3. Using the topographic map below, construct a topographic profile from A to A’. Grey shaded
areas are rivers. Refer to the Rules for Contour Lines and the rule of Vs.
On the profile you just created
a. What is the horizontal scale in meters/inch? 1,000___________ m/inch
b. What is the vertical scale in meters/inch (round to the nearest 100)?
100____________ m/inch
c. What is the vertical exaggeration? 10 : 1
Page | 7
Part 2: Topography of Mt. Saint Helens (5 pts) This contains material adapted from Richard Abbot (Appalachian State University, Department of
Geology) and from the USGS Volcanoes! 1997 Teacher packet.
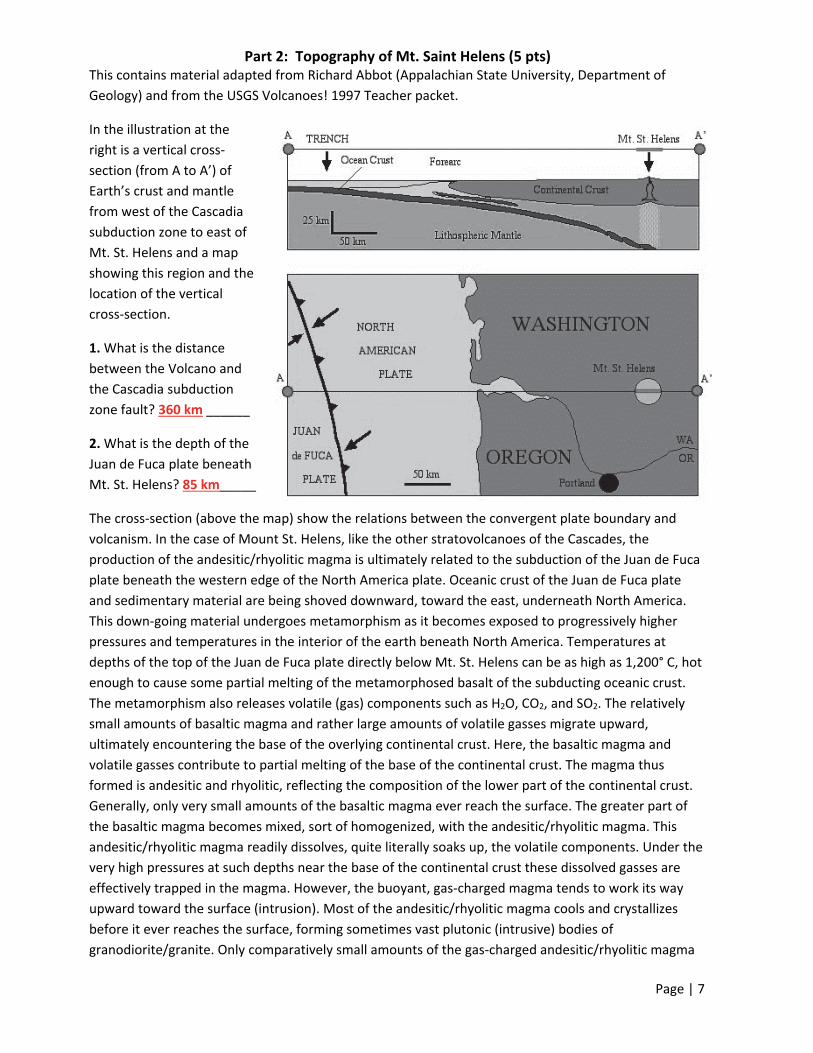
In the illustration at the
right is a vertical cross‐
section (from A to A’) of
Earth’s crust and mantle
from west of the Cascadia
subduction zone to east of
Mt. St. Helens and a map
showing this region and the
location of the vertical
cross‐section.
1. What is the distance
between the Volcano and
the Cascadia subduction
zone fault? 360 km ______
2. What is the depth of the
Juan de Fuca plate beneath
Mt. St. Helens? 85 km_____
The cross‐section (above the map) show the relations between the convergent plate boundary and
volcanism. In the case of Mount St. Helens, like the other stratovolcanoes of the Cascades, the
production of the andesitic/rhyolitic magma is ultimately related to the subduction of the Juan de Fuca
plate beneath the western edge of the North America plate. Oceanic crust of the Juan de Fuca plate
and sedimentary material are being shoved downward, toward the east, underneath North America.
This down‐going material undergoes metamorphism as it becomes exposed to progressively higher
pressures and temperatures in the interior of the earth beneath North America. Temperatures at
depths of the top of the Juan de Fuca plate directly below Mt. St. Helens can be as high as 1,200° C, hot
enough to cause some partial melting of the metamorphosed basalt of the subducting oceanic crust.
The metamorphism also releases volatile (gas) components such as H2O, CO2, and SO2. The relatively
small amounts of basaltic magma and rather large amounts of volatile gasses migrate upward,
ultimately encountering the base of the overlying continental crust. Here, the basaltic magma and
volatile gasses contribute to partial melting of the base of the continental crust. The magma thus
formed is andesitic and rhyolitic, reflecting the composition of the lower part of the continental crust.
Generally, only very small amounts of the basaltic magma ever reach the surface. The greater part of
the basaltic magma becomes mixed, sort of homogenized, with the andesitic/rhyolitic magma. This
andesitic/rhyolitic magma readily dissolves, quite literally soaks up, the volatile components. Under the
very high pressures at such depths near the base of the continental crust these dissolved gasses are
effectively trapped in the magma. However, the buoyant, gas‐charged magma tends to work its way
upward toward the surface (intrusion). Most of the andesitic/rhyolitic magma cools and crystallizes
before it ever reaches the surface, forming sometimes vast plutonic (intrusive) bodies of
granodiorite/granite. Only comparatively small amounts of the gas‐charged andesitic/rhyolitic magma
Page | 8
ever reach the surface, but when this happens ‐ LOOK OUT! The rapid formation of gas bubbles in the
magma and their explosive expansion can have catastrophic effects.
3. Stratovolcanoes are typically circular in map view. The radius of Mount St. Helens is about 6 km at
the base, and the elevation of the base is about 1 km above sea level. Before the eruption of May,
1980, the elevation at the top of Mount St. Helens was about 3 km.
Using this information, and modeling the stratovolcano as a simple cone‐shape, estimate the volume of
volcanic material in Mount St. Helens, in cubic kilometers (km3). To remind you, the volume of a cone
is given by the following formula, Volume = (1/3)*pi*r2*h, where pi = ~ 3.14, r = radius of the cone, and
h = height of the cone. Volume = _________________
(1/3) X (3.14) X (62) X 2 = ~75 km3
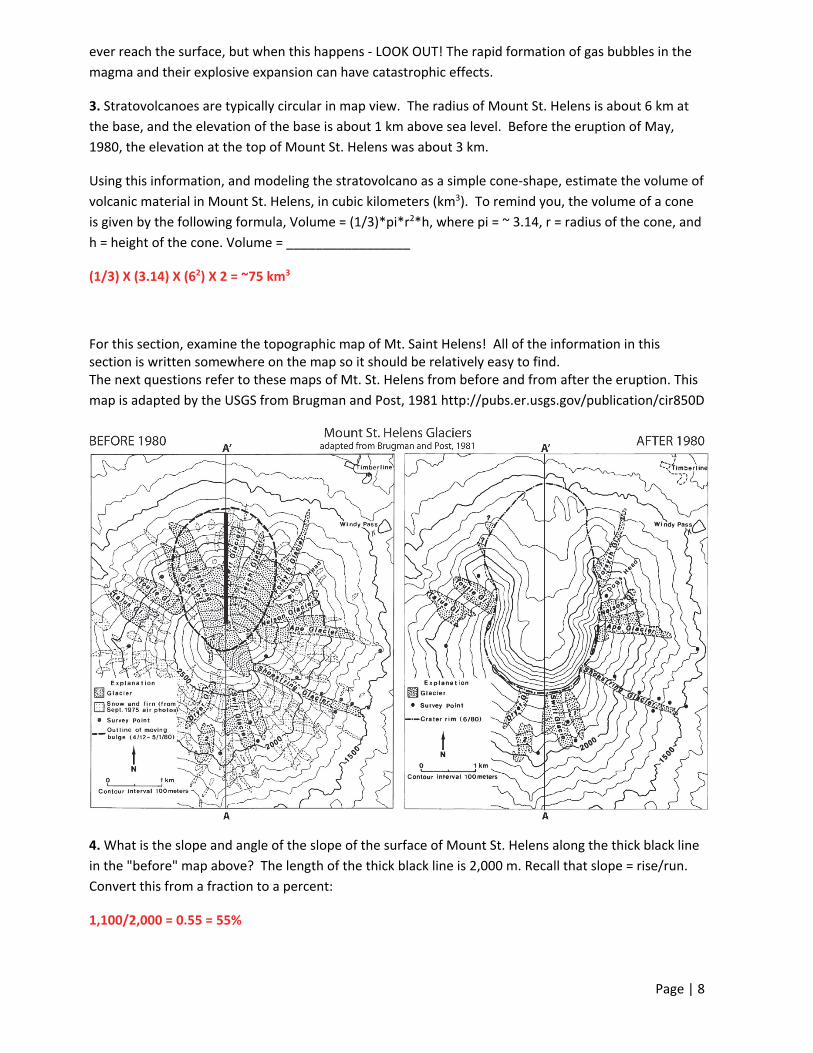
For this section, examine the topographic map of Mt. Saint Helens! All of the information in this section is written somewhere on the map so it should be relatively easy to find. The next questions refer to these maps of Mt. St. Helens from before and from after the eruption. This
map is adapted by the USGS from Brugman and Post, 1981 http://pubs.er.usgs.gov/publication/cir850D
4. What is the slope and angle of the slope of the surface of Mount St. Helens along the thick black line
in the "before" map above? The length of the thick black line is 2,000 m. Recall that slope = rise/run.
Convert this from a fraction to a percent:
1,100/2,000 = 0.55 = 55%
Page | 9
5. Shield Volcanoes have slopes that range from 9 % along their lower slopes to 18 % along their higher
slopes. How does the slope you calculated in step 3 compare with shield volcanoes?
Mt. St. Helens is steeper than the average shield volcano.
6. Why are these slopes different?
Shield volcanoes are built from lava that has a lower Silica content, so the viscosity is lower than that
of stratovolcanoes.
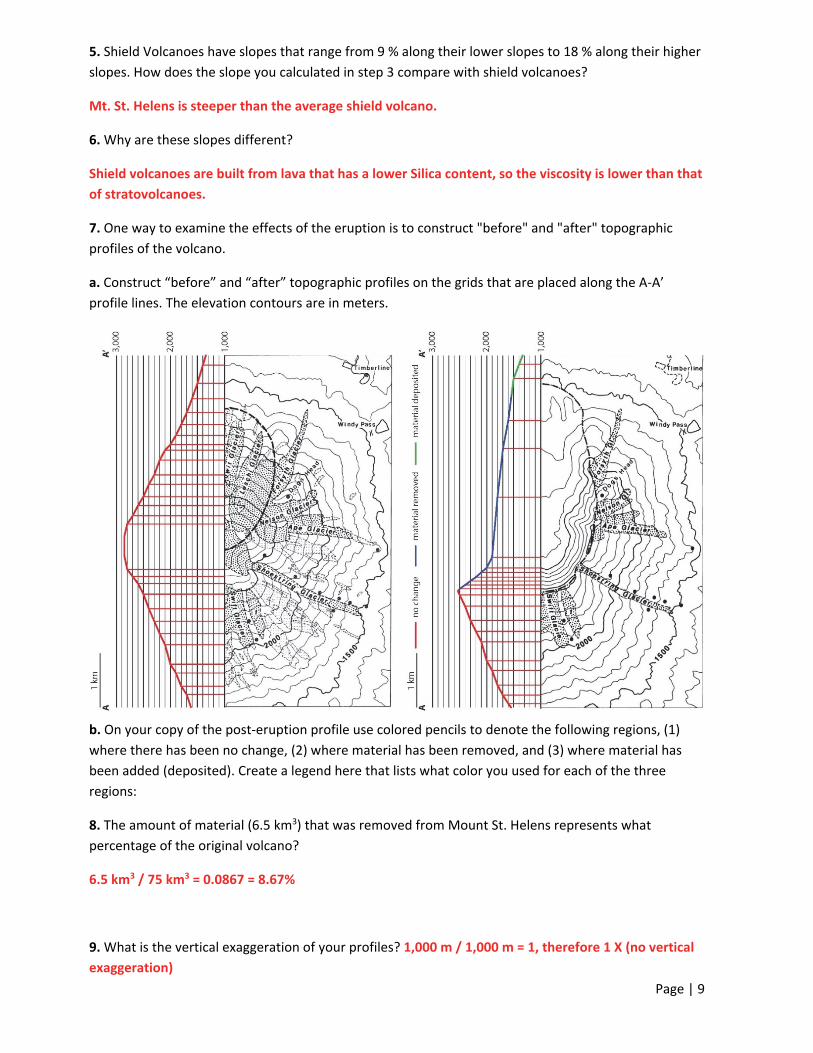
7. One way to examine the effects of the eruption is to construct "before" and "after" topographic
profiles of the volcano.
a. Construct “before” and “after” topographic profiles on the grids that are placed along the A‐A’
profile lines. The elevation contours are in meters.
b. On your copy of the post‐eruption profile use colored pencils to denote the following regions, (1)
where there has been no change, (2) where material has been removed, and (3) where material has
been added (deposited). Create a legend here that lists what color you used for each of the three
regions:
8. The amount of material (6.5 km3) that was removed from Mount St. Helens represents what
percentage of the original volcano?
6.5 km3 / 75 km3 = 0.0867 = 8.67%
9. What is the vertical exaggeration of your profiles? 1,000 m / 1,000 m = 1, therefore 1 X (no vertical
exaggeration)
Page | 10
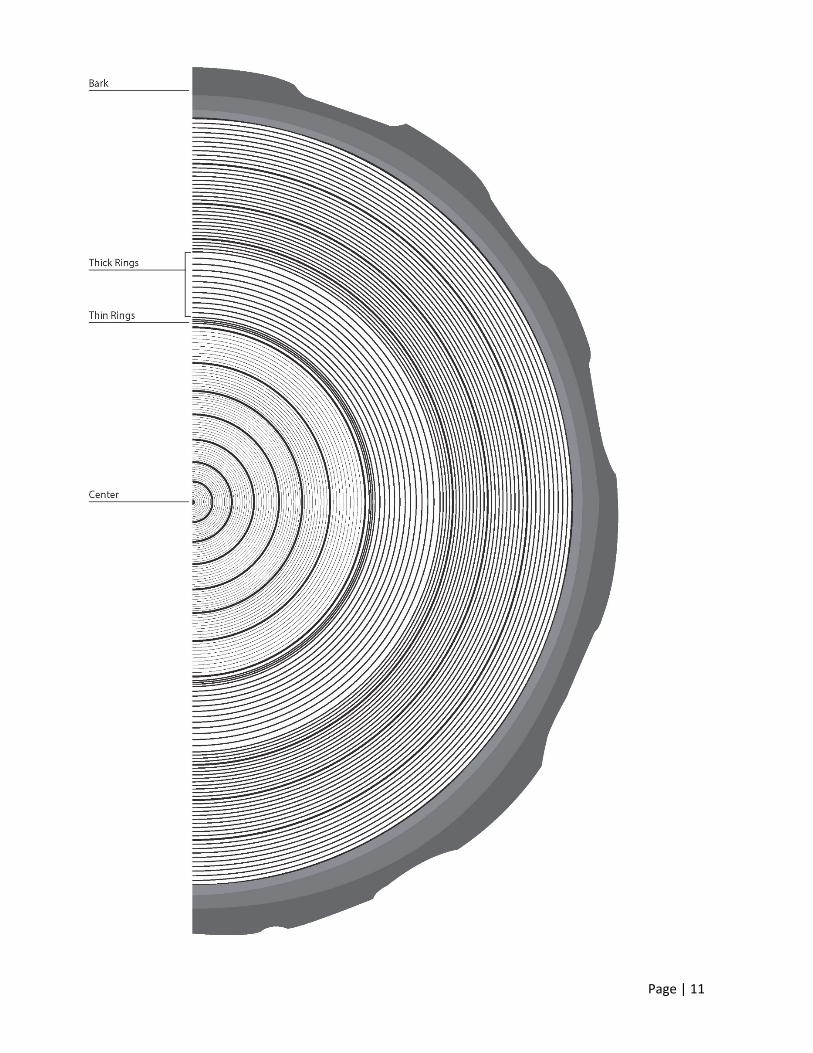
Part 3. The Age of a volcanic deposit Have you ever looked at a tree stump and noticed its rings? Count the rings and you will know how old
the tree is. Each ring represents 1 year in the life of the tree. If you look closely at tree rings, however,
you will see that the spaces between rings vary in width. Trees do not grow the same amount each
year. You can “read” these tree rings and find out what year there was an eruption of Mount Katmai in
Alaska.
What you know:
1. This tree was growing 48 kilometers (29 miles) northwest of Katmai Volcano.
2. After the eruption, the forests were blanketed in ash.
3. This tree’s growth decreased for some years after the eruption, but then it increased.
4. This tree was cut down in 1962.
What you want to find out:
1. The tree’s age: (Count the number of rings from the center of the tree to the bark. Each dark
band represents 10 years, but not all decades get a dark ring.) 120 yrs______________
2. The year the tree started to grow:
a. (the year the tree was cut) ‐ (the age of the tree) = (the year the tree started to grow)
b. 1962______ ‐ 120______ = 1842________
3. The year of the eruption: (Count the number of rings from the center to the first thin ring.)
1842 + 71 = 1913_________
4. The number of years the tree’s growth decreased: (Count the number of thin tree rings)
3_____________
5. The number of years the tree’s growth increased: (Count the number of wide rings.)
12____________
6. Why do you think the tree’s growth increased?
Page | 11