Embed Size (px)
Citation preview

GeoImaging Accelerator Pansharp Test Results

GeoImaging Accelerator Pansharpen Test Results
Executive Summary
After demonstrating the exceptional performance improvement in the orthorectification module
(approximately fourteen-fold – see GXL Ortho Performance Whitepaper), the same approach has
been applied to the pansharp module by taking advantage of newly developed code, modern,
multi-core processor architecture and nVidia Graphical Processing Units (GPUs).
Based on test results with five different datasets, an optimized server using newly developed
code and two GPUs is capable of creating fused, pansharpened data at the rate of 730GB to
1.70TB per day, depending on pixel size and datatype.
This production rate represents an eightfold improvement over the equivalent computation using
previous-generation pansharp algorithms. Further to this, an off-the-shelf desktop machine with
less memory and a slower, single GPU is still over six times faster than software-only methods.
The above results come from a combination of optimization, multithreading and GPU
performance, but fine tuning the algorithm itself can increase system performance a further 46%,
which corresponds to a speed up factor of 11.63. It is possible to further improve the
performance by an estimated 20% if alternative image statistic computations are used, leading to
a total estimated improvement of 13.96 times.
Similar to the high-speed ortho module, this demo once again shows the potential of the GPU
and multithreaded processing in addressing operations that are computationally intensive in PCI’s
field of business (DEM creation, image matching, pansharpening). The end result is faster
production and lower operational costs.
i

GeoImaging Accelerator Pansharpen Test Results
Table of Contents
1 Introduction ...............................................................................................................................1
2 Project Description....................................................................................................................1
2.1 Background ......................................................................................................................1
2.2 System Hardware.............................................................................................................2
2.3 Development Environment and Tools ..............................................................................2
2.4 Test Datasets....................................................................................................................3
3 Test Results ..............................................................................................................................4
3.1 System Throughput..........................................................................................................5
3.1.1 Performance Gain from the Hardware .........................................................................6
3.1.2 Performance Gain from Software Enhancement .........................................................6
4 Further Improvements...............................................................................................................9
5 Conclusion ..............................................................................................................................10
ii

GeoImaging Accelerator Pansharpen Test Results
iii
Figures
Figure 1: Original orthorectification workstation, now upgraded for pansharp..............................2
Figure 2: System throughput improvement by stage ....................................................................8
Tables
Table 1: Test datasets....................................................................................................................3
Table 2: Scene throughput and speed-up factor ...........................................................................5
Table 3: System setup and performance.......................................................................................6
Table 4: Software enhancements ..................................................................................................7
Table 5: Performance gain with software enhancement ...............................................................7
Table 6: Performance gain with logic enhancement......................................................................9

GeoImaging Accelerator Pansharpen Test Results
1 IntroductionBuilding on the success of the Ortho Demonstrator, the Pansharp demonstrator is a new module
for the high-performance system developed by PCI Geomatics. It takes advantage of modern
computer hardware (multi-core processors and Graphical Processing Units) and multithreaded
programming techniques to achieve much higher pansharp throughput than is possible with PCI’s
existing commercial offering of Pluggable Functions (PPFs) and desktop software (Geomatica).
In order to maintain high-quality output, the implemented pansharp algorithm is based on the PCI
Geomatics Pansharp PPF (PCI Pluggable Function). Minor changes were made for image
background handling and computation steps to improve the API and the performance. Based on
previous experience, all possible processing is performed by the GPU, with the exception of the
computation of raster statistics, which uses a parallel processing technique called reduction. A
custom thread-pool implementation is used to link individual threads to specific GPUs.
This report describes the pansharpening performance obtained from both a high-performance,
two-GPU server and a less powerful, single-GPU desktop machine. The results also provide
insight about the tradeoff between the system cost and performance. Finally, this report
discusses some issues that are unique to the pansharp operation and suggests possible
improvements.
2 Project Description 2.1 Background
Given the impressive performance of the Ortho Demonstrator, PCI has developed a commercial,
high-performance, image processing system called the GeoImaging Accelerator (GXL). The
GXL is based on the latest GPU and multi-thread processing technology, with its main
applications being orthorectification, DEM extraction, pansharpening and mosaic creation. The
GXL employs high performance ortho and pansharp processing, with planned upgrades to
mosaic, DEM and other functions. In this way we can measure and investigate the impact on
performance of various hardware and software approaches.
Page 1

GeoImaging Accelerator Pansharpen Test Results
2.2 System Hardware
The pansharp system is similar to that of the Ortho Demonstrator, but with updated GPUs and
CPUs in the machine. It features an Intel® Core2™ Extreme Quad-Core 3.2GHz X9775 CPU, 8
GB RAM and two NVIDIA GeForce Telsa C1060 GPUs with 4GB of GDDR3 SDRAM. A less
powerful desktop machine with Intel® Core2™ Extreme Quad-Core 2.66GHz Q6700 CPU, 8 GB
RAM and one NVIDIA GeForce GTX 280 GPU with 1GB of GDDR3 SDRAM is also used to
evaluate the performance.
Figure 1: Original orthorectification workstation, now upgraded for pansharp
2.3 Development Environment and Tools
The development environment is openSuSE Linux 10.3 (64-bit). All development was done
using the GCC (version 4.2.1) and Intel C++ compiler (version 11.0), using the OpenMP 2.5
libraries for multithreading and NVIDIA’s CUDA SDK release 2.1 for programming the GPUs.
Page 2

GeoImaging Accelerator Pansharpen Test Results
2.4 Test Datasets
Table 1 (below) lists the five datasets that were included in the test procedures. Each dataset
contains a high resolution panchromatic image and a lower resolution multi-spectral image. The
output is a fused image comprising the overlap region of both input images. The output image
matches the higher-resolution panchromatic input, but with full colour. Output images are stored
in TIFF format, which has a file-size limitation of 4GB. While spectral response is ensured to be
the same as the PPF version, output images larger than 4GB is not stored properly, although they
can still be used to evaluate performance while other formats are added (e.g. binary format that
supports file size larger than 4GB is planned and will be used when available). For performance
testing, the first three channels in the multispectral images are used as reference channels. The
images are were grouped by common bit depth, processing level and number of channels.
Table 1: Test datasets
Scene 1(Madrid)
2(Toronto)
3(Castle Rock)
4(Nigeria)
5(Seoul)
Product Ikonos Ikonos QuickBird Spot5 Spot5
MS File Size (MB) 710 520 440 210 260
MS Resolution 4m 2.4m 2.4m 10m 10m
Number of MS Channels 3 4 4 4 4
Data Type 16U 16U 16U 8U 8U
PAN File Size (MB) 1,210 1,980 1,730 210 1,010
PAN Resolution 1m 0.6m 0.6m 5m 2.5m
Fusion File Size (MB) 3,660 5,570 5,150 650 3,060
Page 3

GeoImaging Accelerator Pansharpen Test Results
3 Test Results In order to evaluate the impact of different hardware settings and implementation details on the
system, as well as understand the impact of different hardware and software condition,
performance was observed using several configurations. After the initial findings, two major
software improvements were carried out to improve the system throughout incrementally. After
each software modification, further tests were conducted under different hardware settings based
on the number of GPUs employed. In the server, three processor configurations were used (0, 1
and 2 GPUs); one the desktop workstation two settings were used (CPU-only and 1-GPU).
Page 4

GeoImaging Accelerator Pansharpen Test Results
3.1 System Throughput
The system performance is measured in terms of i) the processing throughput and ii) the speed-
up factor compared to the original pansharp PPF. Since the pansharp operation always converts
input data to floating point variables, an accurate measured of throughput is the number of pixels
processed per day, as opposed to MB or GB directly. The speed-up factor is also reported to
provide a reference for comparison.
For the server, the highest throughputs were obtained with 2-GPUs as expected. Averaging
across all datasets, the system could process 750x109, or 750 giga-pixels (GP) per day, which
equates to 1.5 TB of 16-bit data or 750 GB of 8-bit data. The average performance is
approximately 8 times faster than the pansharp PPF (which processes about 95GP per day).
Using zero or one GPU, the daily system throughput is 583GP and 592GP respectively, or 6.24
and 6.30 time faster. Table 2 (below) shows the comparison results between the best approach
and the pansharp PPF, and that the speed up factor is lower when background mask is used.
Table 2: Scene throughput and speed-up factor
Processing Time* Scene Mask
pansharp PPF 2-GPUs w/OpenMP Speed-up
Factor
No 24 min 10 sec 2 min 49 sec 8.57xMadrid
Yes 25 min 41 sec 3 min 14 sec 7.92x
No 39 min 17 sec 5 min 16 sec 7.45xToronto
Yes 41 min 43 sec 5 min 59 sec 6.96x
No 40 min 49 sec 4 min 40 sec 8.75xCastle Rock
Yes 38 min 43 sec 5 min 18 sec 7.30x
No 8 min 37 sec 1 min 10 sec 7.37xNigeria
Yes 6 min 56 sec 1 min 14 sec 5.56x
No 41 min 3 sec 5 min 15 sec 7.82xSeoul
Yes 35 min 13 sec 5 min 32 sec 6.36x
* Due to time constraint, results for the pansharp PPF represent a single run; the results of the GPU version are the mean of 10 runs.
Page 5

GeoImaging Accelerator Pansharpen Test Results
3.1.1 Performance Gain from the Hardware
There is no from the above results that more and faster CPU and GPU processors can process
more data in a given time frame, but there is a trade-off between the system cost and the
performance gain. To study the trade off, tests were done on the server and the desktop
workstation described in Section 2.2. As expected, the server with two GPUs provides the
highest performance with an average speed-up factor of 8 times. Using a single GPU, both
machines have similar speed up factors of 6.3 (server) and 6.6 (desktop) as the GPU in both
cases handles the majority of the processing. When no GPU is used, the server components
have higher performance compared to the desktop, with an average speed-up factor of 6.24
compared to 4.63 for the desktop – a 35% increase.
For the server alone, based on the test results of five datasets a performance gain of 27% was
obtained when using two GPUs instead of one.
The above observations suggest that a high-end server benefits from multiple GPUs, but that a
significant performance increase can be gained by adding a GPU to a desktop workstation at
modest cost.
Table 3: System setup and performance
Daily Throughput (Gigapixels) Speed Up Factor** System
2 GPU 1 GPU CPU 2 GPU 1 GPU CPUServer CPU: X9775 GPU: Telsa C1060
750.4 591.7 583.4 7.99x 6.30x 6.24x
Desktop CPU: Q6700 GPU: GeForce 8800 GTX
N/A 606.6 435.6 N/A 6.63x 4.46x
** Speed up factor is measured against the processing time using the pansharp PPF
3.1.2 Performance Gain from Software Enhancement
Based on the logic flow from the pansharp PPF, the pansharp algorithm was implemented using
the GPU and OpenMP technology as described above. The overall speed increase was due to
several incremental enhancements – the three enhancements can be found in Table 4 (below).
Page 6

GeoImaging Accelerator Pansharpen Test Results
Table 4: Software enhancements
Enhancement Definition
Stage 1: GPU & OpenMP
Uses the same logic flow as the PPF version but with GPU and OpenMP technology.
Stage 2: Buffer Load Ahead
Load and resample each raster buffer ahead of time to reduce processor idling.
Stage 3: Minimize memory transfer
Combine several resampling processes to minimize the number of host-to-device memory transfers
The incremental software enhancements represent three stages of software development applied
in the demonstrator. The first stage uses the same logic flow of the pansharp PPF with GPU
and OpenMP - This stage reflects the direct performance gain from the GPU and multi-thread
processing with no fine tuning of the programming logic. The second and third stages refine the
logic to take advantage of the GPUs and CPU utilizations. In the second stage, each upcoming
raster block in the queue was loaded ahead of time, which allowed the GPUs and CPU to perform
different tasks simultaneously. In the third stage, an enhancement of the GPU operations was
made to minimize time-consuming, host-to-device memory transfers. Results from these tests
provide information about what development affected performance gains in what way. The
system throughput and speed up factor are listed in Table 5 (below).
Table 5: Performance gain with software enhancement
Daily Throughput (Gigapixels) Speed-up Factor System
Stage 1 Stage 2 Stage 3 Stage 1 Stage 2 Stage 3 Server CPU: X9775 GPU: Telsa C1060
633.1 682.3 750.9 6.74x 7.26x 7.99x
Desktop CPU: Q6700 GPU: GeForce 8800 GTX
528.1 538.5 606.6 5.60x 5.71x 6.40x
Page 7

GeoImaging Accelerator Pansharpen Test Results
Page 8
The relative gains can be more easily seen in Figure 2 (below), which shows the system
throughput gains for different stages of software enhancement using maximum GPUs.
Figure 2: System throughput improvement by stage
Depending on the systems, the performance improvements through software modification are
quite different. By better utilization both GPU and CPU at the same time, the server was able to
gain 7.7% increase of throughout, while the desktop only gains about 1.9% increase. The result
indicates that the server was significantly underutilized compared to the desktop. By minimizing
the host-to-device memory transfer, both machines see similar increases of 10% and 12.6%, with
the desktop seeing the slightly greater increase. This shows the importance of host-to-device
memory transfers for performance gains on less powerful machines.
Stage 1 Stage 2 Stage 3 7.7% 10.0%
17.7%
Stage 1 Stage 2 Stage 3 2.0% 12.6%
14.6%
Server (CPU X9775; GPU Telsa C1060)
Desktop (CPU Q6700; GPU GeForce 8800 GTX)
GeoImaging Accelerator Pansharpen Test Results
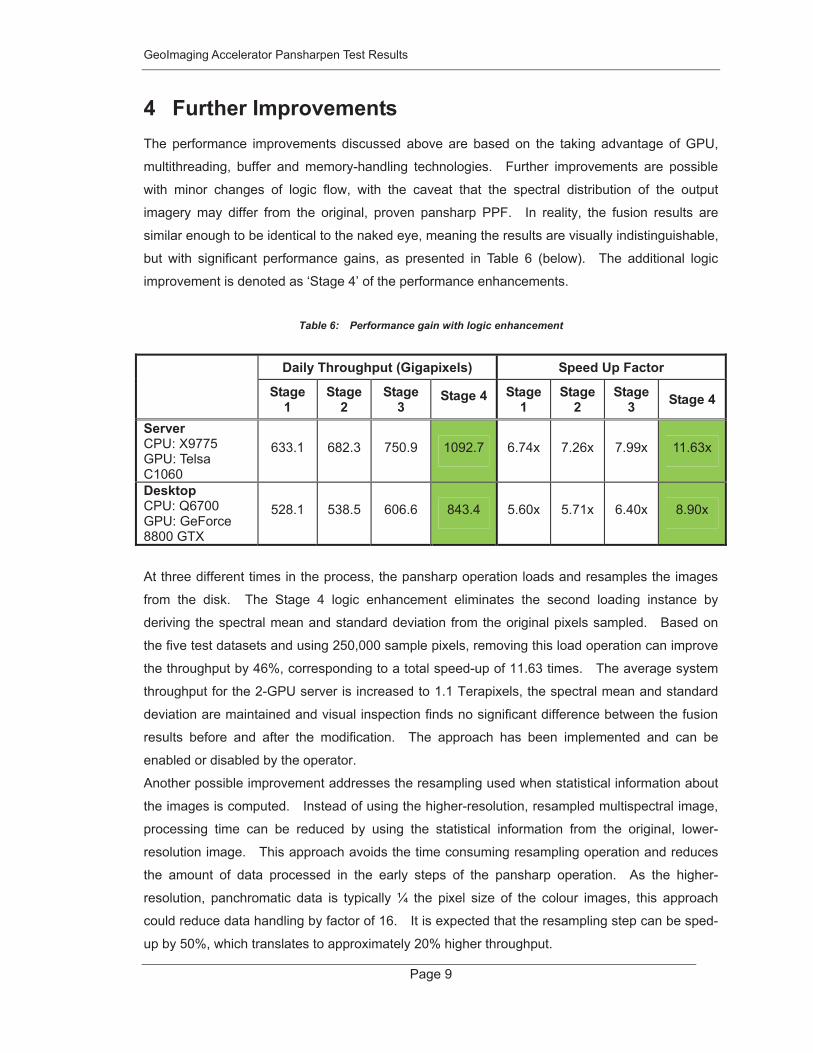
4 Further Improvements The performance improvements discussed above are based on the taking advantage of GPU,
multithreading, buffer and memory-handling technologies. Further improvements are possible
with minor changes of logic flow, with the caveat that the spectral distribution of the output
imagery may differ from the original, proven pansharp PPF. In reality, the fusion results are
similar enough to be identical to the naked eye, meaning the results are visually indistinguishable,
but with significant performance gains, as presented in Table 6 (below). The additional logic
improvement is denoted as ‘Stage 4’ of the performance enhancements.
Table 6: Performance gain with logic enhancement
Daily Throughput (Gigapixels) Speed Up Factor
Stage 1
Stage 2
Stage 3
Stage 4 Stage 1
Stage 2
Stage 3 Stage 4
Server CPU: X9775 GPU: Telsa C1060
633.1 682.3 750.9 1092.7 6.74x 7.26x 7.99x 11.63x
Desktop CPU: Q6700 GPU: GeForce 8800 GTX
528.1 538.5 606.6 843.4 5.60x 5.71x 6.40x 8.90x
At three different times in the process, the pansharp operation loads and resamples the images
from the disk. The Stage 4 logic enhancement eliminates the second loading instance by
deriving the spectral mean and standard deviation from the original pixels sampled. Based on
the five test datasets and using 250,000 sample pixels, removing this load operation can improve
the throughput by 46%, corresponding to a total speed-up of 11.63 times. The average system
throughput for the 2-GPU server is increased to 1.1 Terapixels, the spectral mean and standard
deviation are maintained and visual inspection finds no significant difference between the fusion
results before and after the modification. The approach has been implemented and can be
enabled or disabled by the operator.
Another possible improvement addresses the resampling used when statistical information about
the images is computed. Instead of using the higher-resolution, resampled multispectral image,
processing time can be reduced by using the statistical information from the original, lower-
resolution image. This approach avoids the time consuming resampling operation and reduces
the amount of data processed in the early steps of the pansharp operation. As the higher-
resolution, panchromatic data is typically ¼ the pixel size of the colour images, this approach
could reduce data handling by factor of 16. It is expected that the resampling step can be sped-
up by 50%, which translates to approximately 20% higher throughput.
Page 9

GeoImaging Accelerator Pansharpen Test Results
5 Conclusion
With GPU, multi-threading, buffer and memory-handling technologies, the pansharp operation
can be performed 6.4 to 8 times faster than the original pansharp PPF on a 1-GPU desktop and
2-GPU server respectively. For the desktop, the system throughput is 0.63TB per day for 8-bit
data and 1.17TB per day for 16-bit data. On the 2-GPU server, the throughput is 0.75TB per
day and 1.51TB per day for the 8-bit and 16-bit data respectively. While further hardware
improvement is possible by adding GPUs or memory, performance gains are difficult to predict.
Conversely, software and logic enhancements are possible without additional hardware costs, as
demonstrated by the speed-up factor of 11.63 times. It is possible to significantly improve speed
and performance by carefully fine-tuning the algorithm, with an additional 20% increase in
throughput by eliminating a resampling step. Due to project constraints, this last improvement
was not tested or implemented, but remains for future development of the pansharp operation.
Page 10

GeoImaging Accelerator Pansharpen Test Results
GeoImaging Accelerator Pansharp Test Results
A PCI Geomatics Whitepaper
Authors: Hanchevici, Piekny et al.
PCI Geomatics Enterprises Inc.
50 West Wilmot Street
Richmond Hill, Ontario
Canada, L4B 1M5
Phone: (905) 764-0614
Fax: (905) 764-9604
Email: [email protected]
Web: www.pcigeomatics.com
© 2009 PCI Geomatics Enterprises Inc.®. All rights reserved.
COPYRIGHT NOTICE
Software copyrighted © by PCI Geomatics, 50 West Wilmot St., Suite 200, Richmond Hill, ON CANADA L4B 1M5
Telephone number: (905) 764-0614
RESTRICTED RIGHTS
Canadian Government
Use, duplication, or disclosure by the Government is subject to restrictions as set forth in DSS 9400-18 "General
Conditions - Short Form - Licensed Software".
U.S. Government
Use, duplication, or disclosure by the Government is subject to restrictions set forth in subparagraph (b)(3) of the Rights in
Technical Data and Computer Software clause of DFARS 252.227-7013 or subparagraph (c)(1) and (2) of the Commercial
Computer Software-Restricted Rights clause at 48 CFR 52.227-19 as amended, or any successor regulations thereto.
PCI, PCI Geomatics, PCI and design (logo), Geomatica, Committed to GeoIntelligence Solutions, GeoGateway, FLY!,
OrthoEngine, RADARSOFT, EASI/ PACE, ImageWorks, GCPWorks, PCI Author, PCI Visual Modeler, and SPANS are
registered trademarks of PCI Geomatics Enterprises, Inc.
All other trademarks and registered trademarks are the property of their respective owners.
Page 11
1