Embed Size (px)
Citation preview

Geography 360Principles of Cartography
May 1, 2006
Flow MapReading is available at
https://courses.washington.edu/geog360/private/FlowMap.pdf

Outlines1. What is a flow map?
• Shows movement between places• Seen in continuum of measurement scale and
generalization
2. What are three types of a flow map?• Focus on node, interconnectivity, and distribution
3. How do we design and construct flow maps?• Figure-ground, map projection, line scaling, and
unique solutions

1. What is a flow map?• Map showing linear movement between places• Measurement scale
– Quantitative flow map: shows the quantity of movement (represented by width)
• Hauling tonnage across the country– Qualitative flow map: shows the kind of movement (represented
by color or pattern)• Different railway companies
• Generalization– Can show the actual route taken
• When in a large scale map or details are critical – Can show the generalized geographic route taken
• When in a small scale map or overall pattern should be emphasized

Measurement scale & generalization?
Dent Figure 12.4
Dent Figure 12.2

Similar to flow map• Linear cartogram
– Cartogram: any kind of map that purposefully uncouples location (of points, lines, areas) on a map from actual geographical location
– e.g. Subway route map, Seattle Metro bus route map– http://www.nycsubway.org/maps/route/nysubway.gif
• Measurement scale & generalization?
• Desire line– Shows interaction between aggregated zones where interaction
is portrayed as straight line– e.g. Commuting flow between traffic analysis zone– http://www.westmidlandsltp.gov.uk/2005/images/22.jpg
• Measurement scale & generalization?

Balance between organization and geographic reference frame

Demise of Napoleon’s army in Russiaby Charles Joseph Minard (1781-1870)
For description and commentary, see Electronic reading: Nyerges

2. Three types of flow maps• Radial flow maps: focus on node
– Out of or into “central places”– Dent Figure 12.6a– e.g. traffic flow
• Network flow maps: focus on interconnectivity– Between/among places on an infrastructure– Dent Figure 12.6b– e.g. airline route, telephone call between cities
• Distribution flow maps: focus on distribution– As a collection from a place to place with branching– Dent Figure 12.6c– e.g. trade flow, map showing diffusion of idea
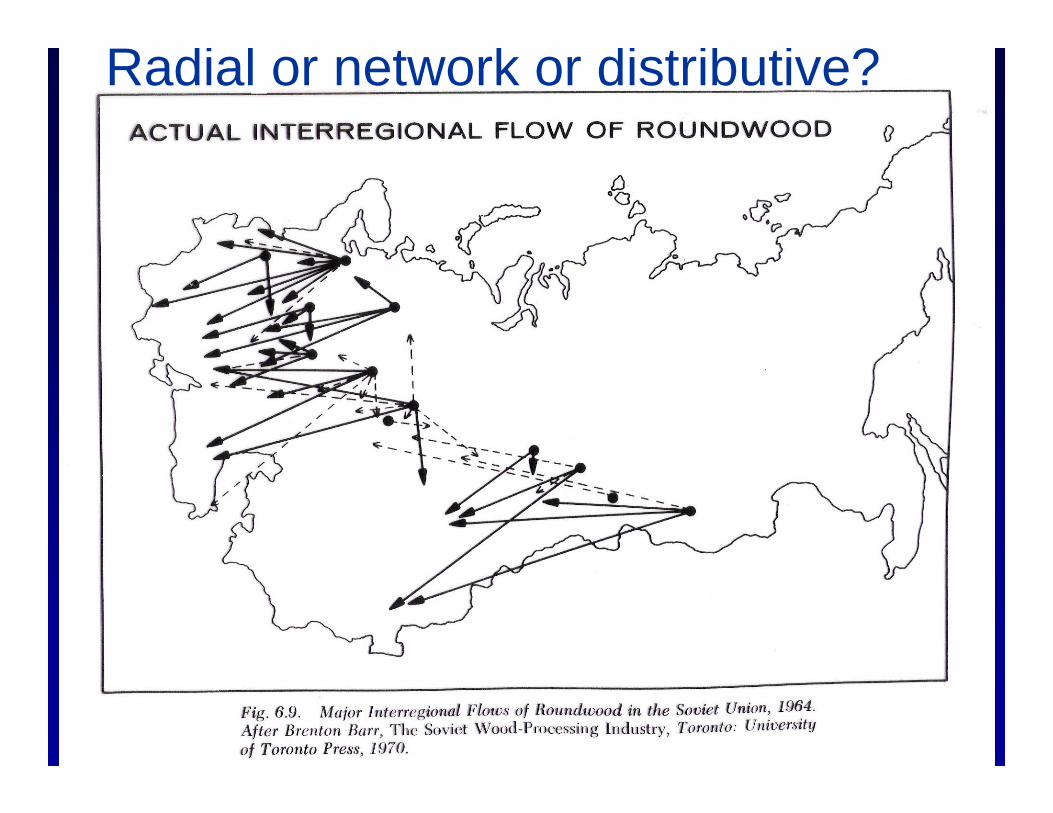
Radial or network or distributive?

Radial or network or distributive?

Radial or network or distributive?

Radial or network or distributive?

What types of flow map?Telecommunication traffic flow map in Europe
Henry Drury Harness (1804-18833) ’s flow map of transportation of passengers in Ireland

What types of flow map?
• Dent Figure 12.2• Dent Figure 12.7• Dent Figure 12.15

3. Designing flow maps
• Visual hierarchy• Map projection• Line scaling methods• Unique solutions

Visual hierarchy
• Thematic symbol should be strong in perception– Visual contrast (e.g. differentiation of value)– Opaque symbol rather than transparent symbol– Interposition (figure should not be broken)– See Dent Figure 12.7
• But should not be too dominant: meaningful base information could be masked– Also related to line scaling method

Boundary outlines help separate figure from ground

Map projection• Has consequences on what flow symbols would look like
– Relative location of origin and destination, length/direction of flow, complexity of flow
• Follow Snyder’s guideline at Slocum chapter 9– Map property– Area of interest
• Satisfy map purpose– Choose the center by standard point (direct readers’ attention)– Want overall pattern or details with less sacrifice of geographic
reference frame? – See Slocum Figure 9.13: immigration flow to the U.S. is
organized into two origins (Asia vs. Europe)

Map projection• Map projection affects the interpretation of relative
locations of features
From Electronic reserve: MacEachren Figure 2.06

Map projection• Map projection provides reference frame (or perspective)
Julie’s geographic trajectory in Mercator Julie’s geographic trajectory in Orthographic

Line scaling
• Symbol width is mostly scaled in linear fashion to data value magnitude
• Consider data range– Widest line should not disturb the integrity of the base
information– Smallest line should not be too small to draft
• What are the alternatives to proportional line scaling?– Use standard line (or threshold)– Range grading (see Dent Figure 12.9)

Other design considerations
• Alternative methods of symbolizing quantitative flow lines– See Dent Figure 12.10– A: dot method– B: line method– C: areal or pattern method
• Any unique solutions for flow mapping?– See Figure 12.16

Unique solution


![[NCERT] Principles of Geography XI(Old Edition).pdf](https://img.pdfslide.us/doc/110x75/55cf8a8755034654898b6ee6/ncert-principles-of-geography-xiold-editionpdf-5671bea5d521b.jpg)