Embed Size (px)
Citation preview
Geography 360Principles of Cartography
April 21, 2006
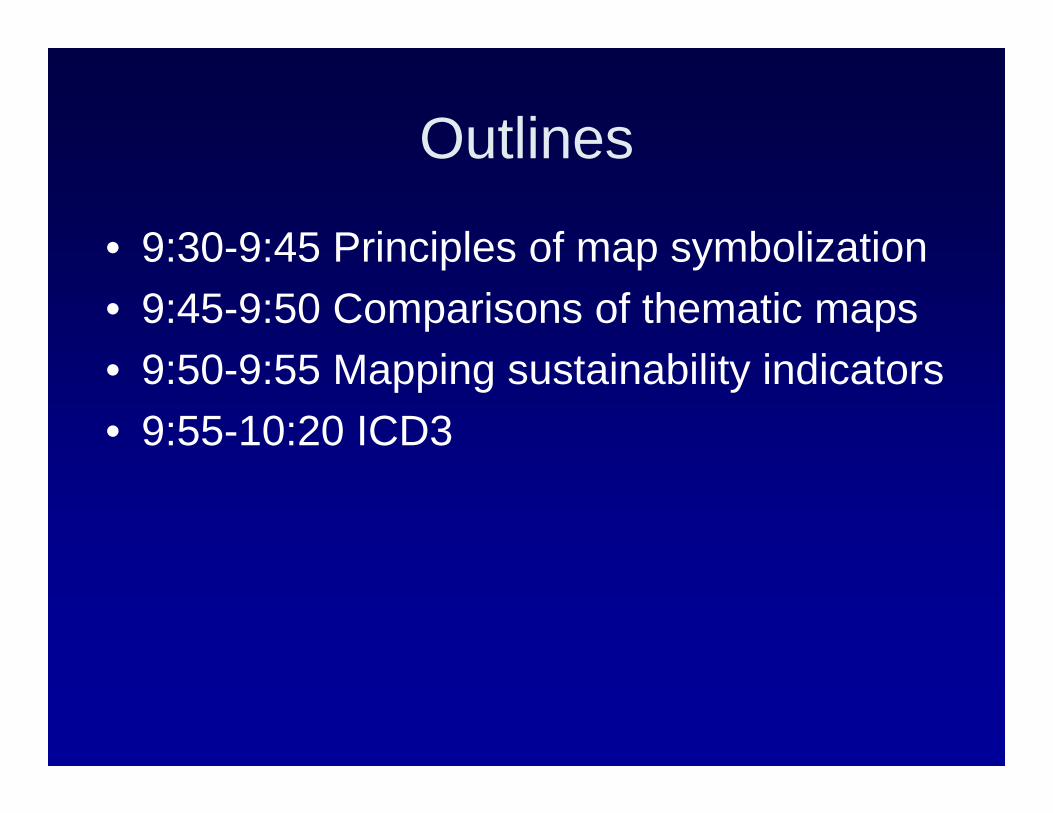
Outlines
• 9:30-9:45 Principles of map symbolization• 9:45-9:50 Comparisons of thematic maps• 9:50-9:55 Mapping sustainability indicators• 9:55-10:20 ICD3
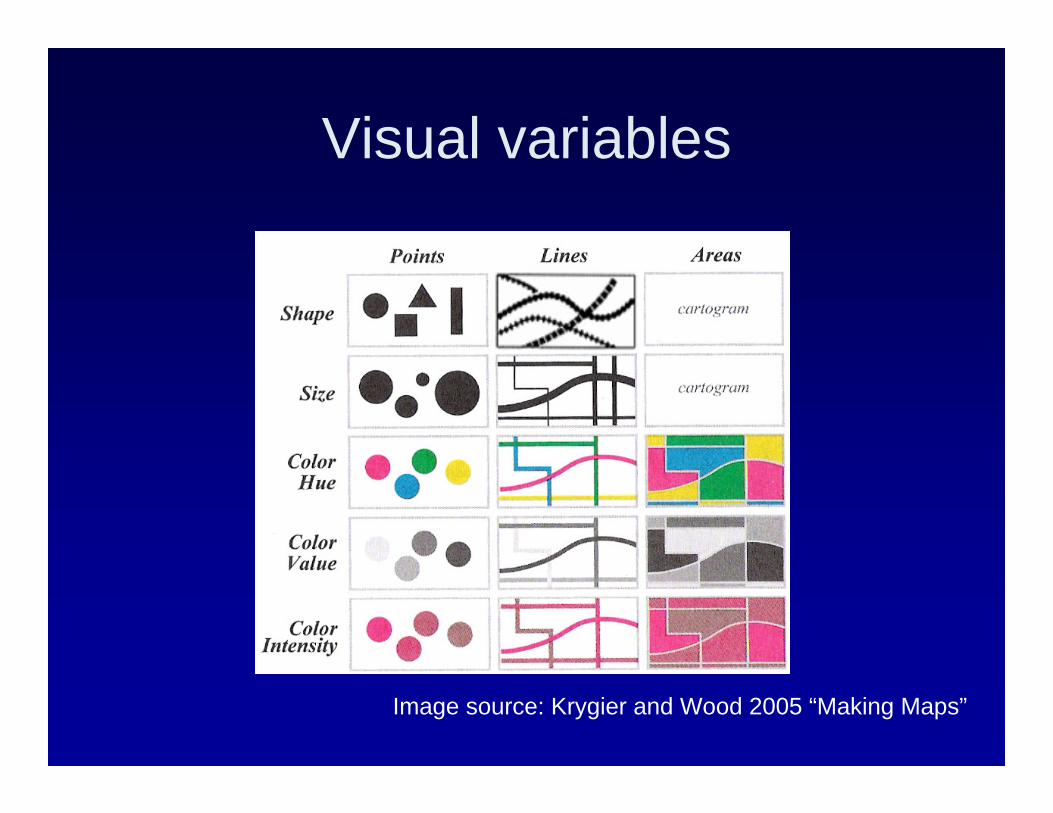
Visual variables
Image source: Krygier and Wood 2005 “Making Maps”
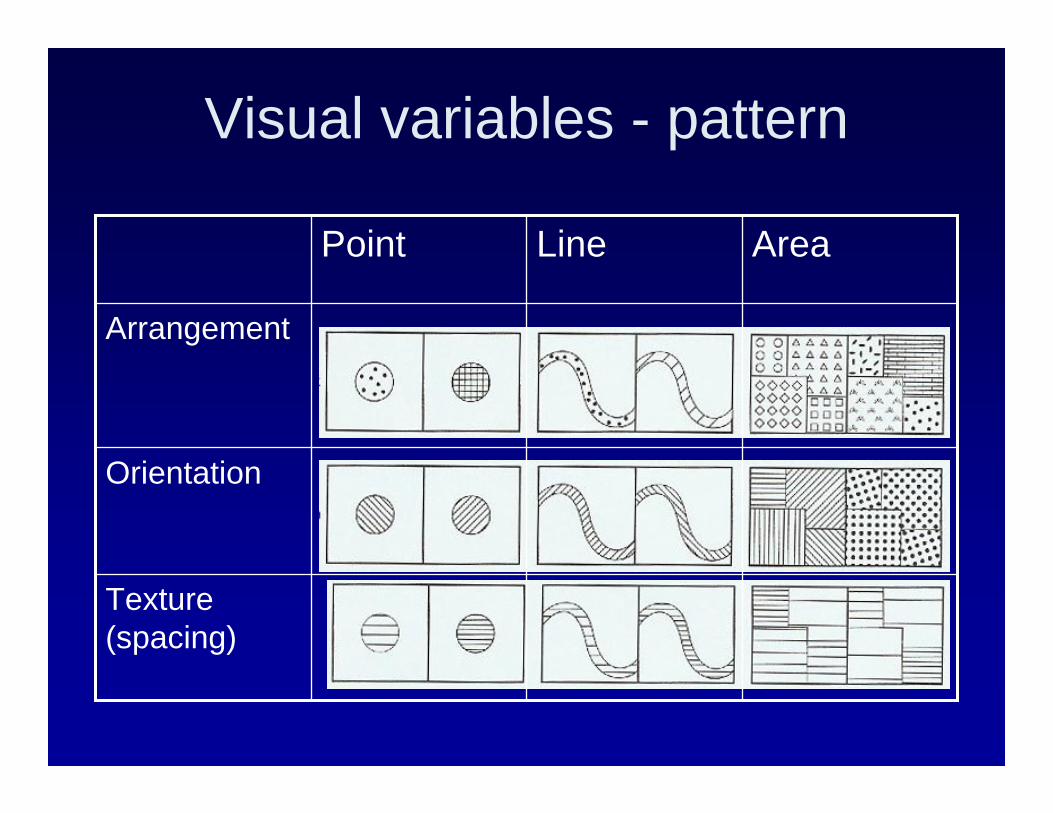
Visual variables - pattern
Texture(spacing)
Orientation
Arrangement
AreaLinePoint
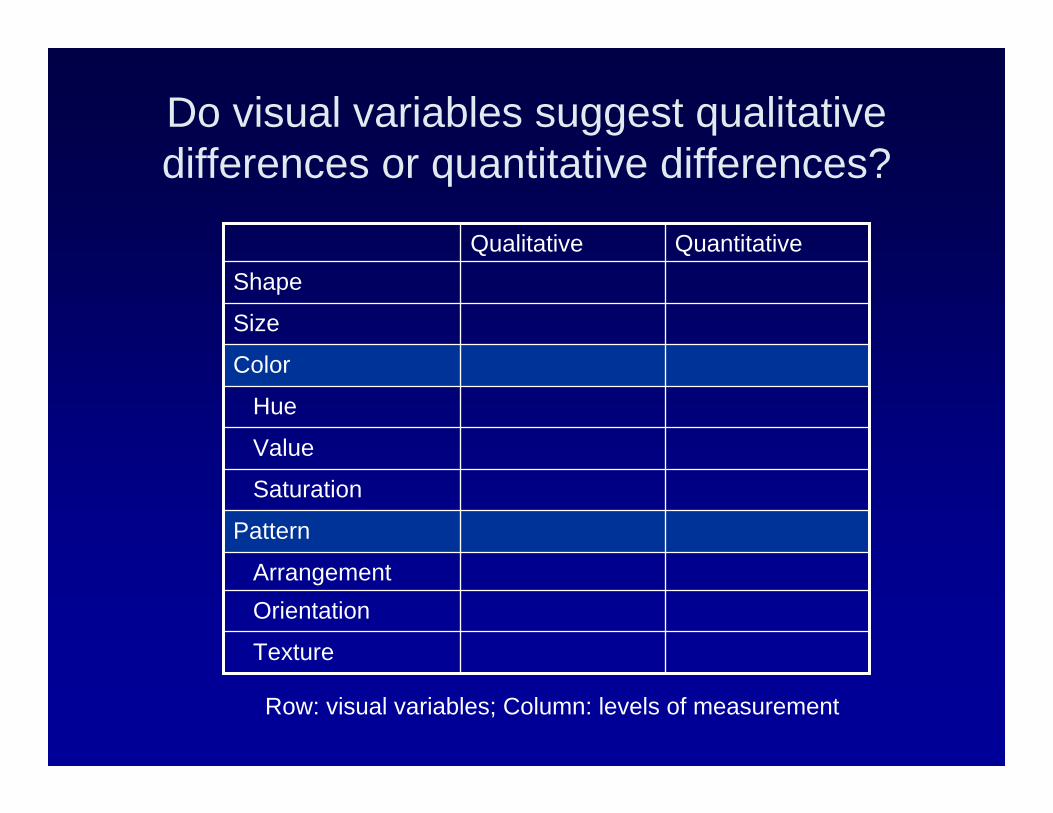
Do visual variables suggest qualitative differences or quantitative differences?
Pattern
Color
Texture
OrientationArrangement
Saturation
Value
Hue
Size
ShapeQuantitativeQualitative
Row: visual variables; Column: levels of measurement
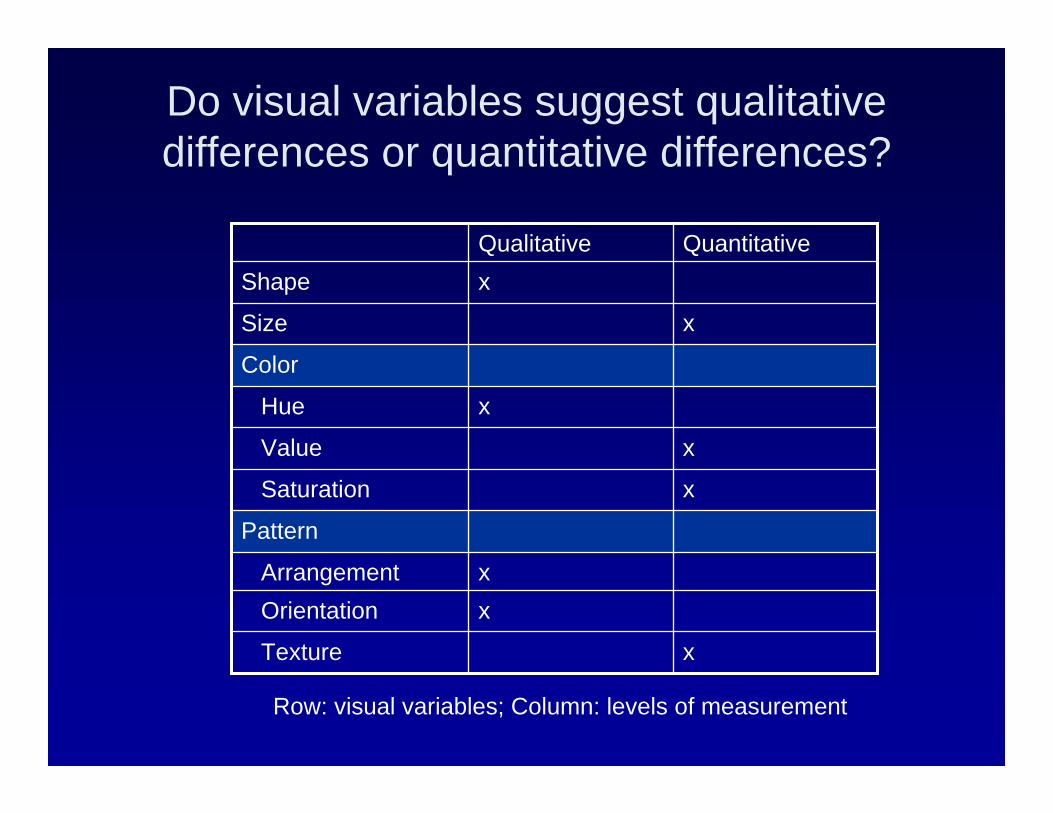
Do visual variables suggest qualitative differences or quantitative differences?
Pattern
Color
xTexture
xOrientationxArrangement
xSaturation
xValue
xHue
xSize
xShapeQuantitativeQualitative
Row: visual variables; Column: levels of measurement
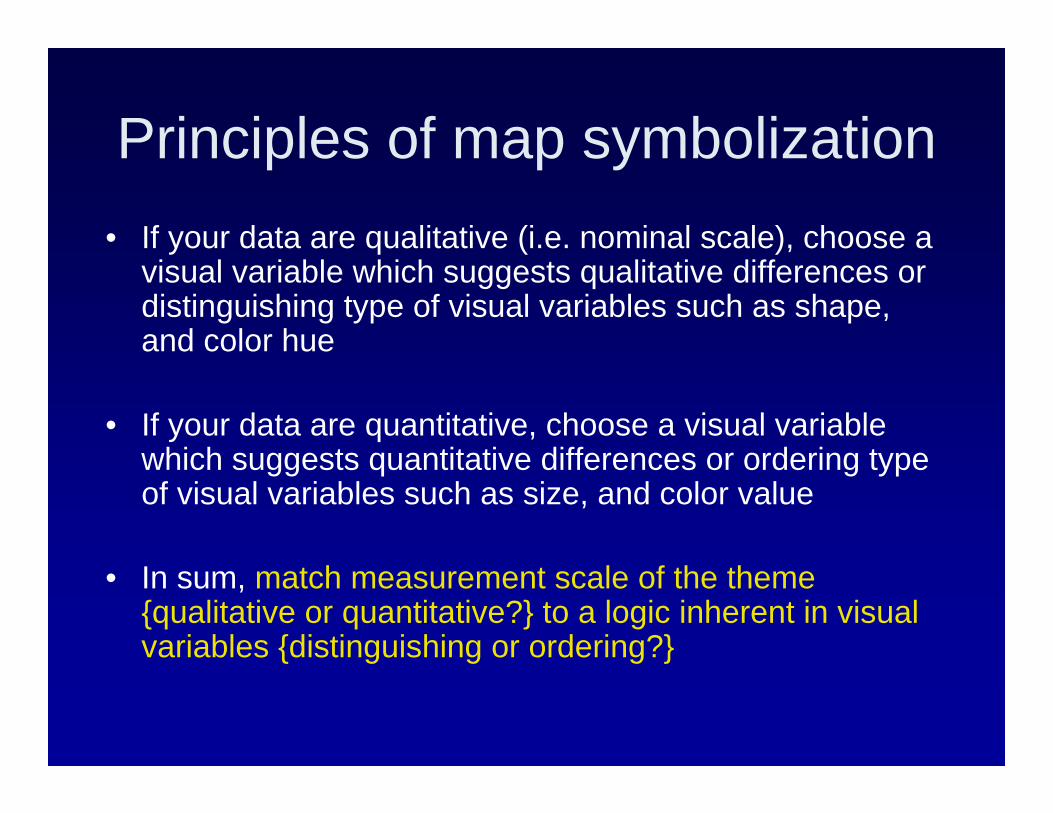
Principles of map symbolization• If your data are qualitative (i.e. nominal scale), choose a
visual variable which suggests qualitative differences or distinguishing type of visual variables such as shape, and color hue
• If your data are quantitative, choose a visual variable which suggests quantitative differences or ordering type of visual variables such as size, and color value
• In sum, match measurement scale of the theme {qualitative or quantitative?} to a logic inherent in visual variables {distinguishing or ordering?}
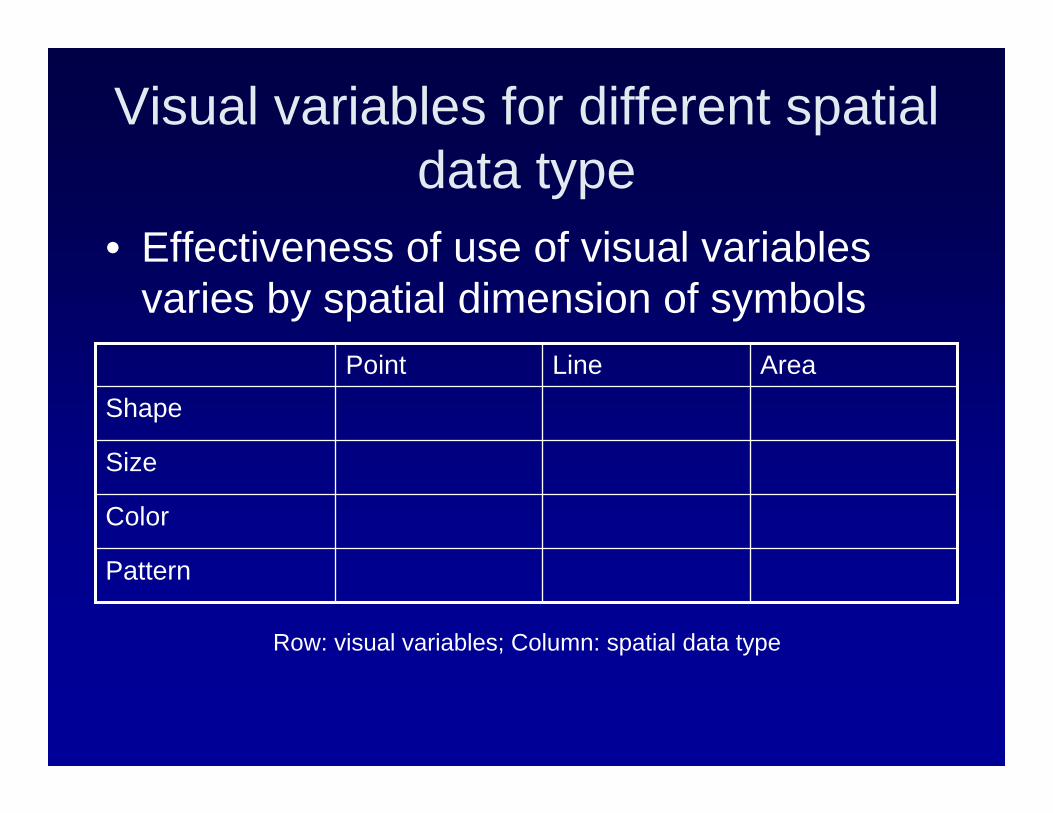
Visual variables for different spatial data type
• Effectiveness of use of visual variables varies by spatial dimension of symbols
Line
Pattern
Color
Size
ShapeAreaPoint
Row: visual variables; Column: spatial data type
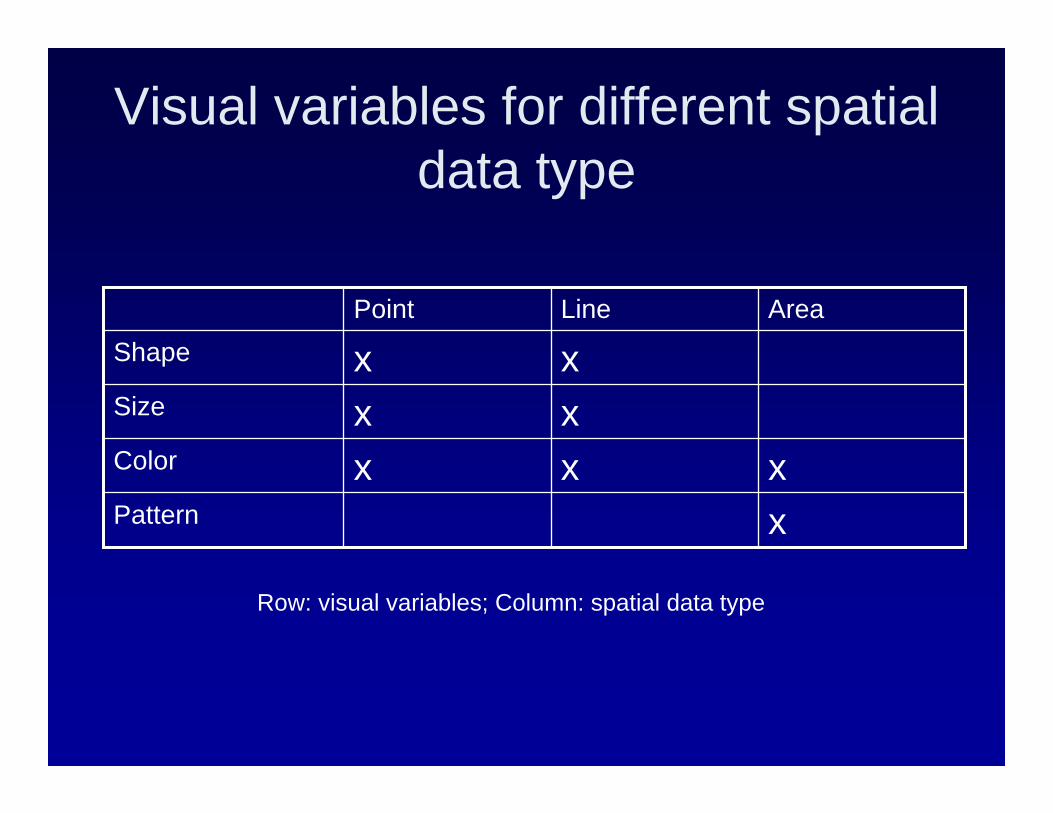
Visual variables for different spatial data type
xxxLine
xPatternxxColor
xSizexShape
AreaPoint
Row: visual variables; Column: spatial data type
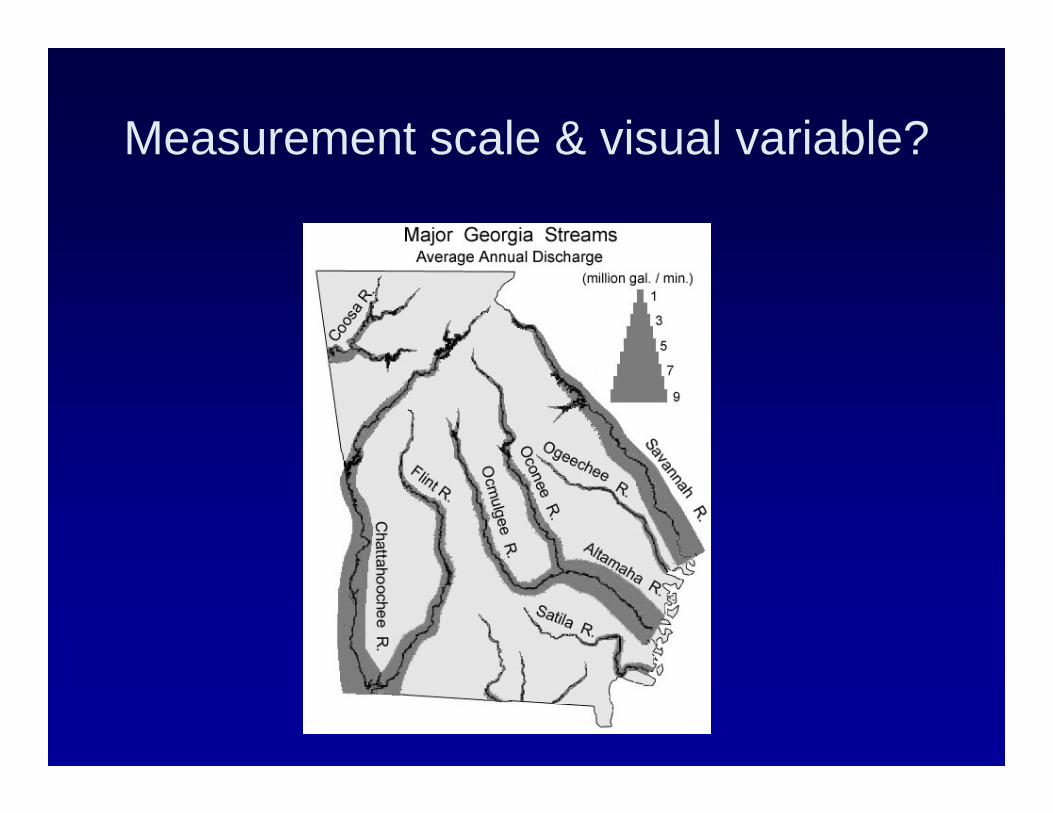
Measurement scale & visual variable?
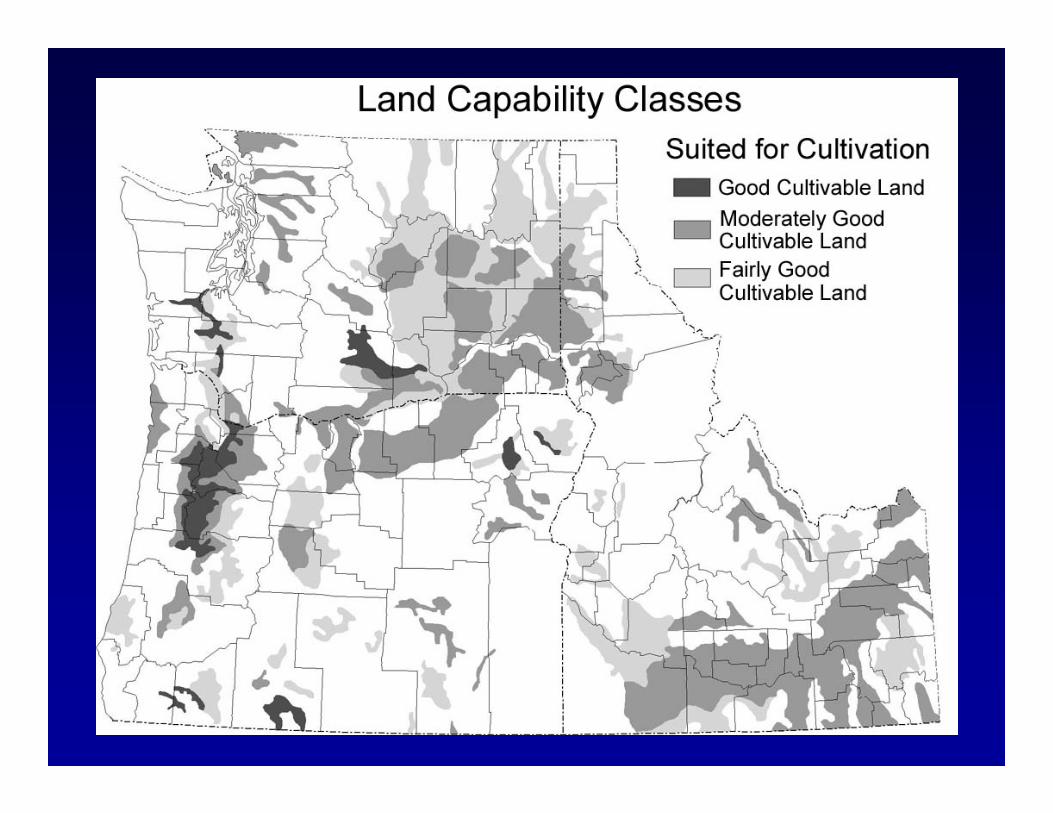
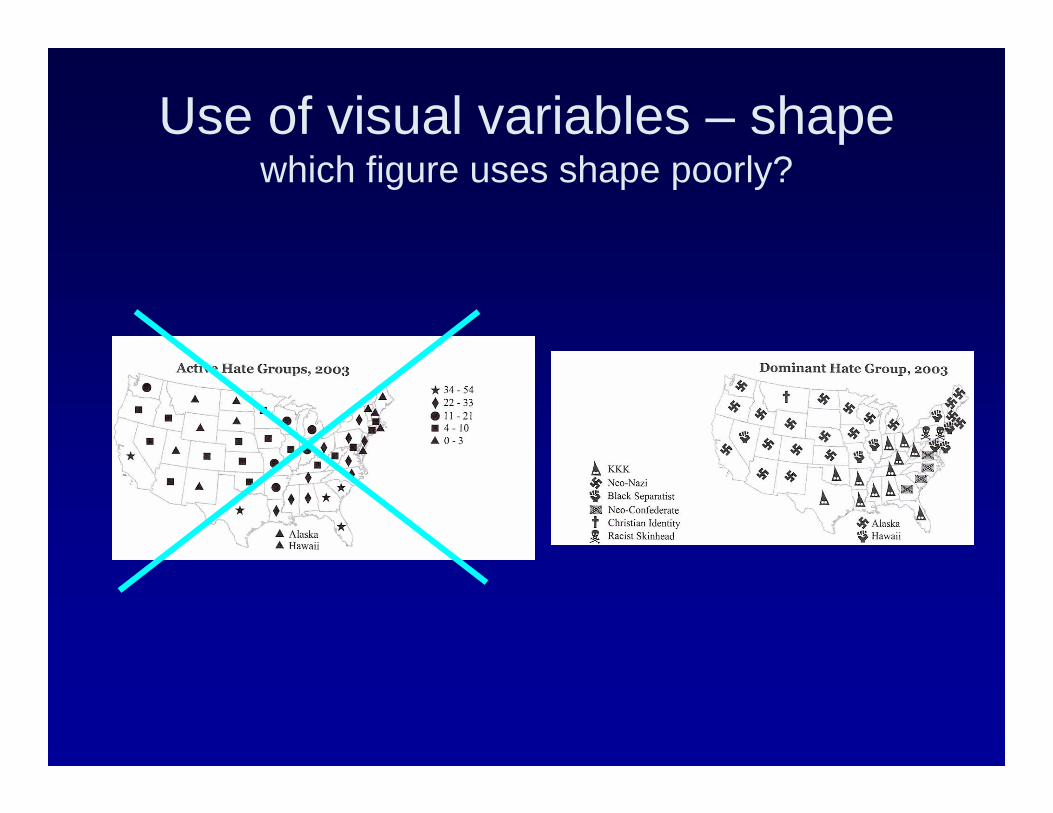
Use of visual variables – shapewhich figure uses shape poorly?
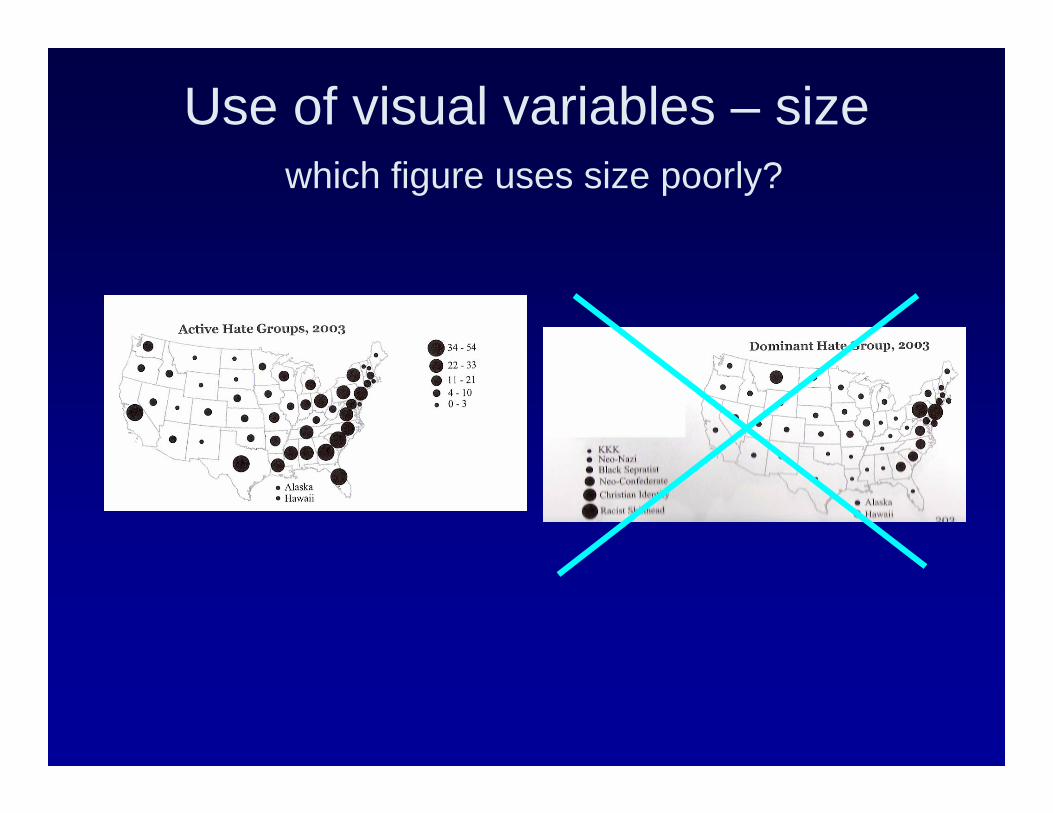
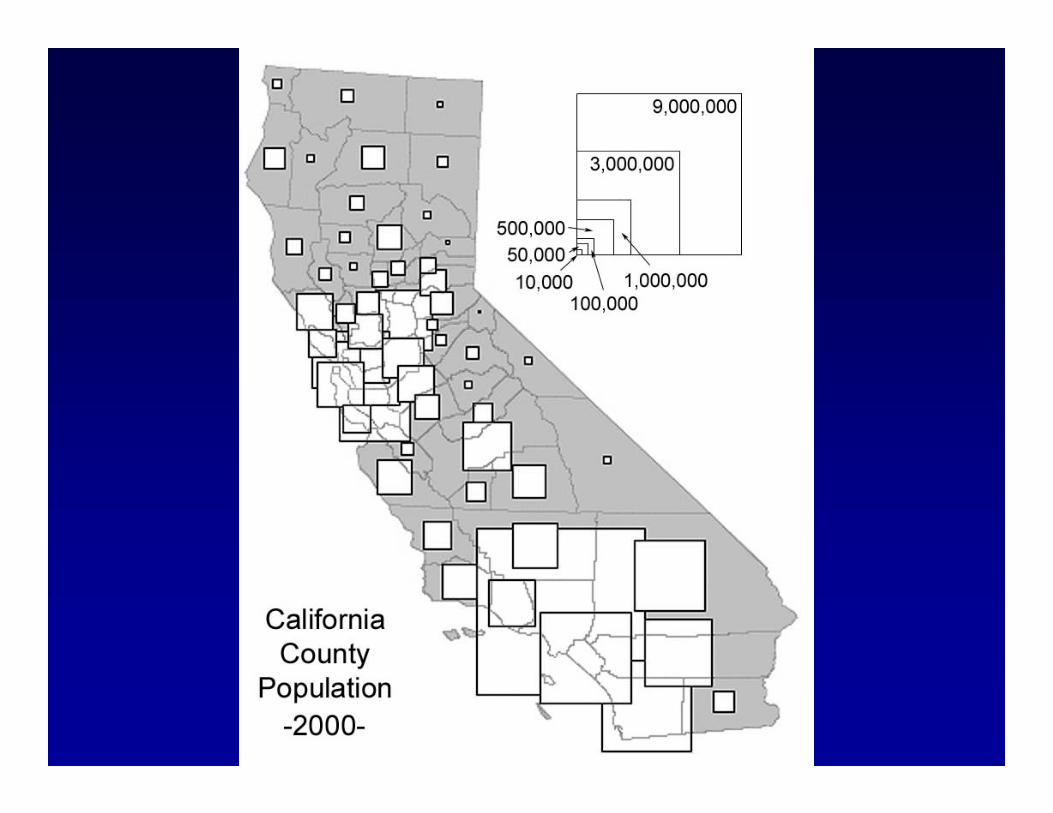
Use of visual variables – sizewhich figure uses size poorly?
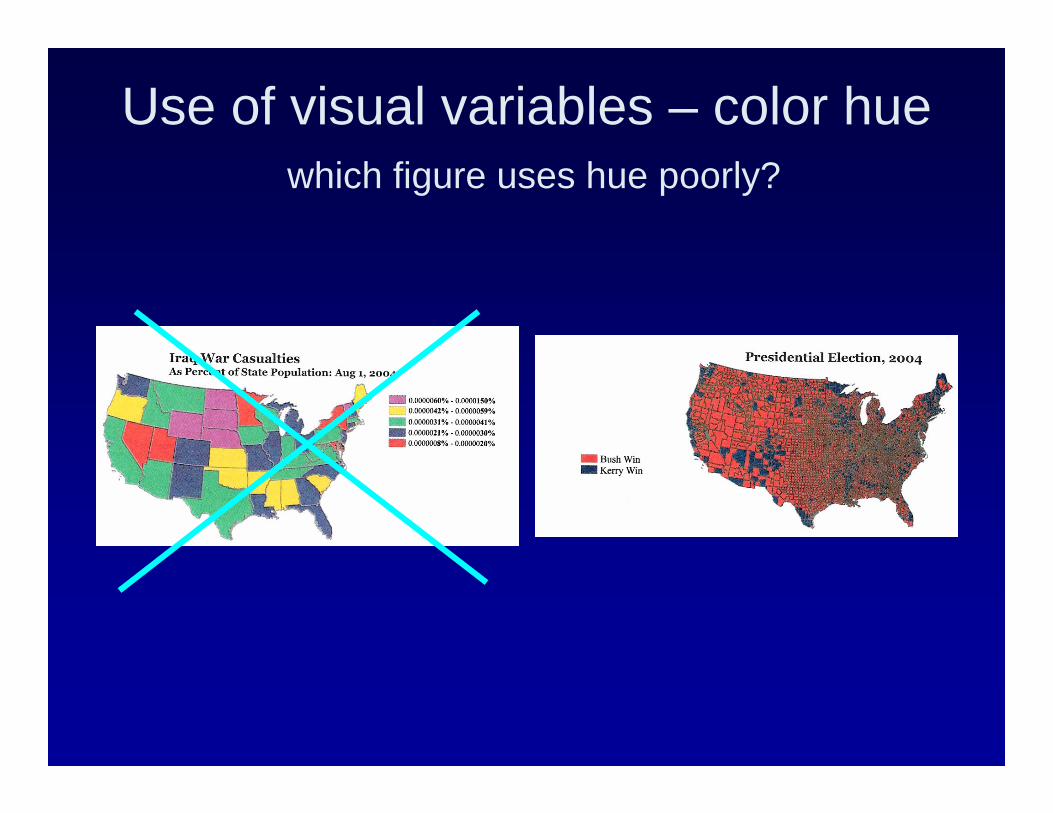
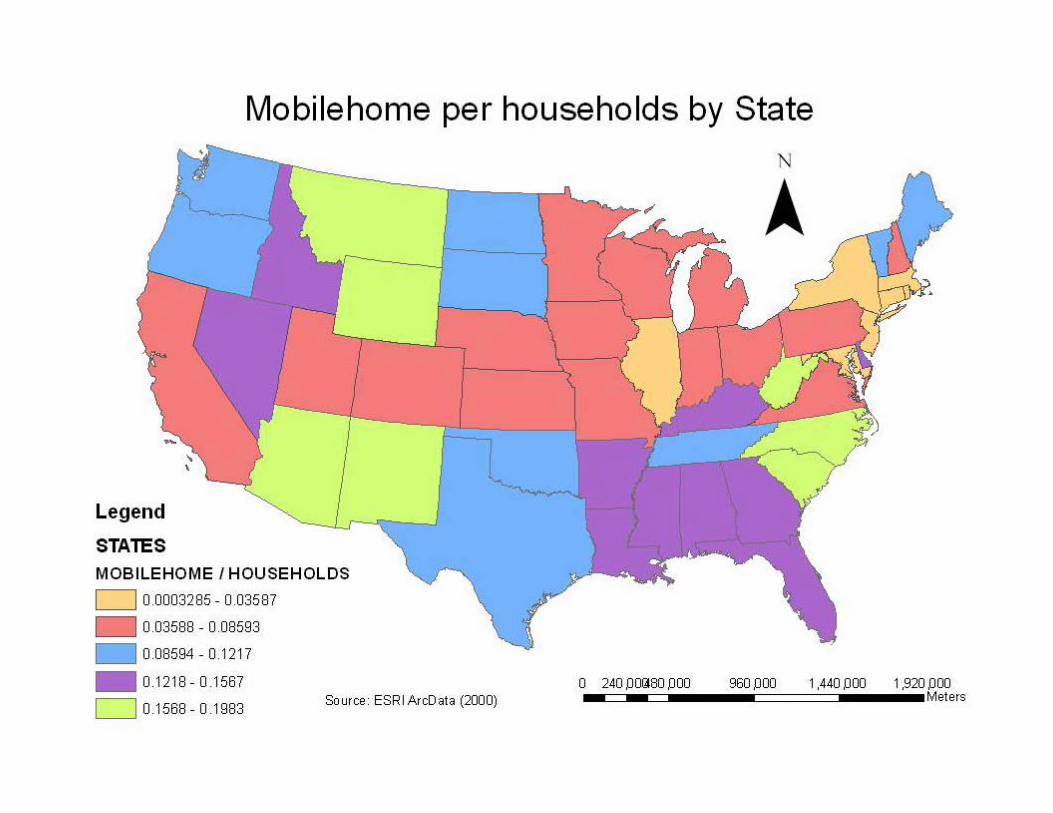
Use of visual variables – color huewhich figure uses hue poorly?
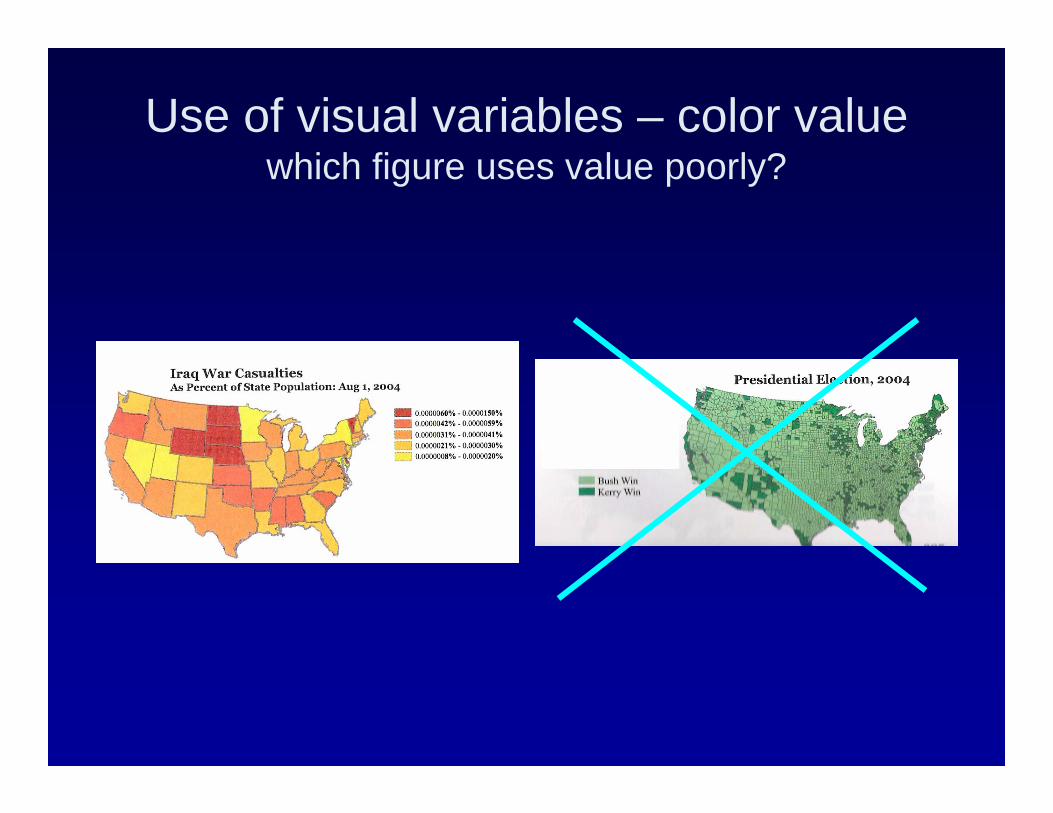
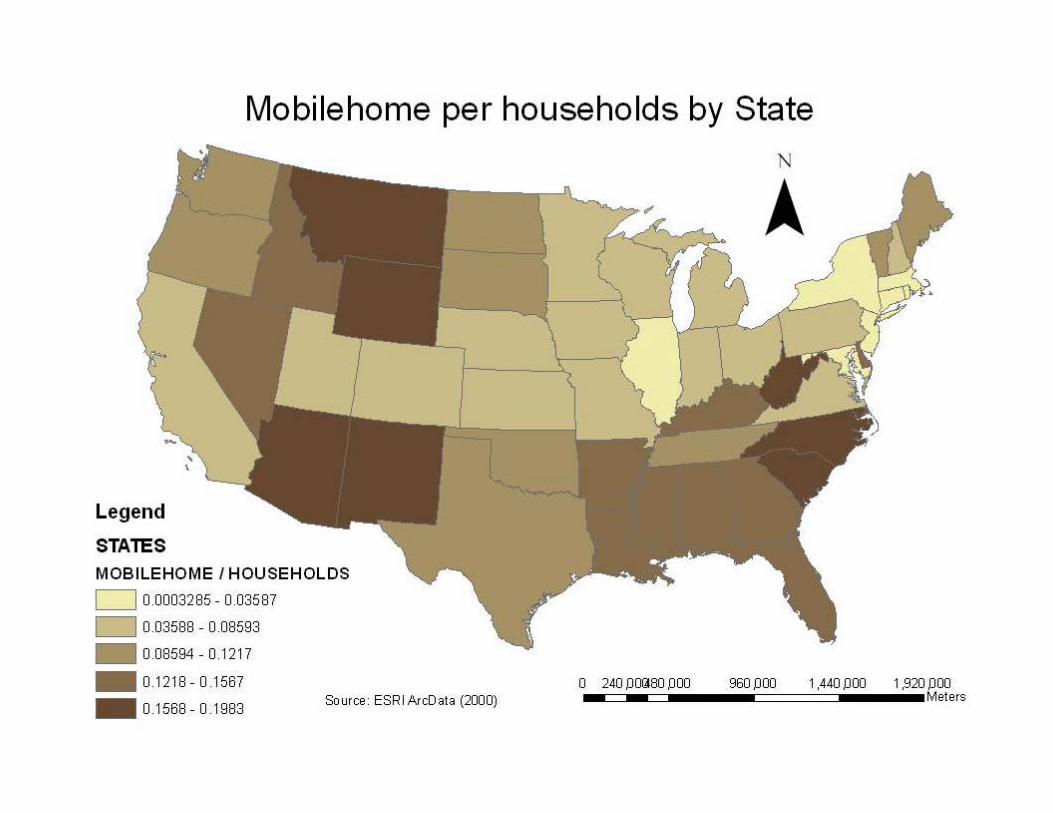
Use of visual variables – color valuewhich figure uses value poorly?
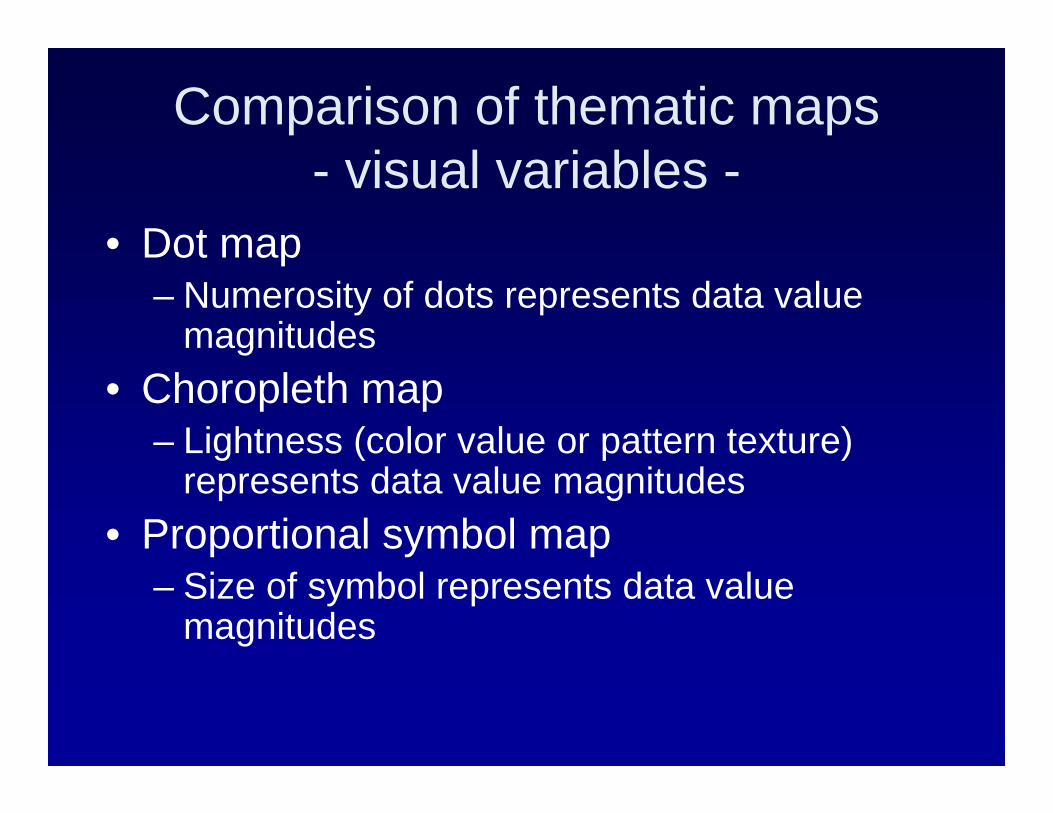
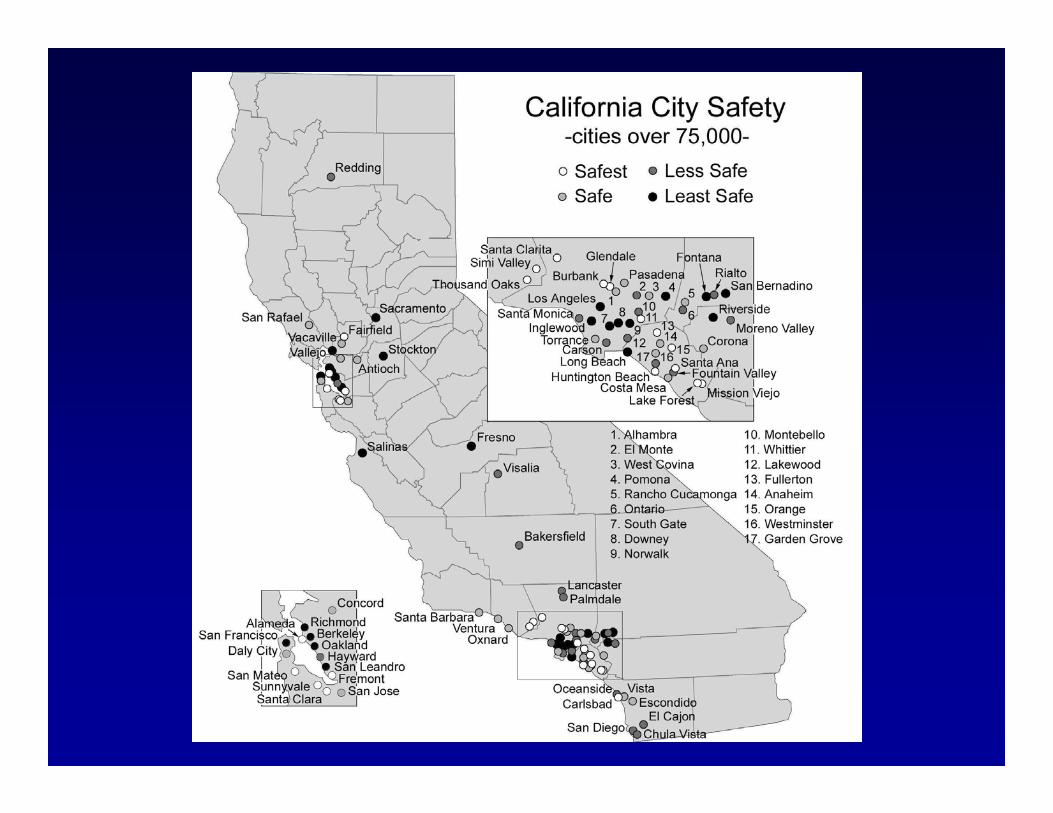
Comparison of thematic maps- visual variables -
• Dot map– Numerosity of dots represents data value
magnitudes• Choropleth map
– Lightness (color value or pattern texture) represents data value magnitudes
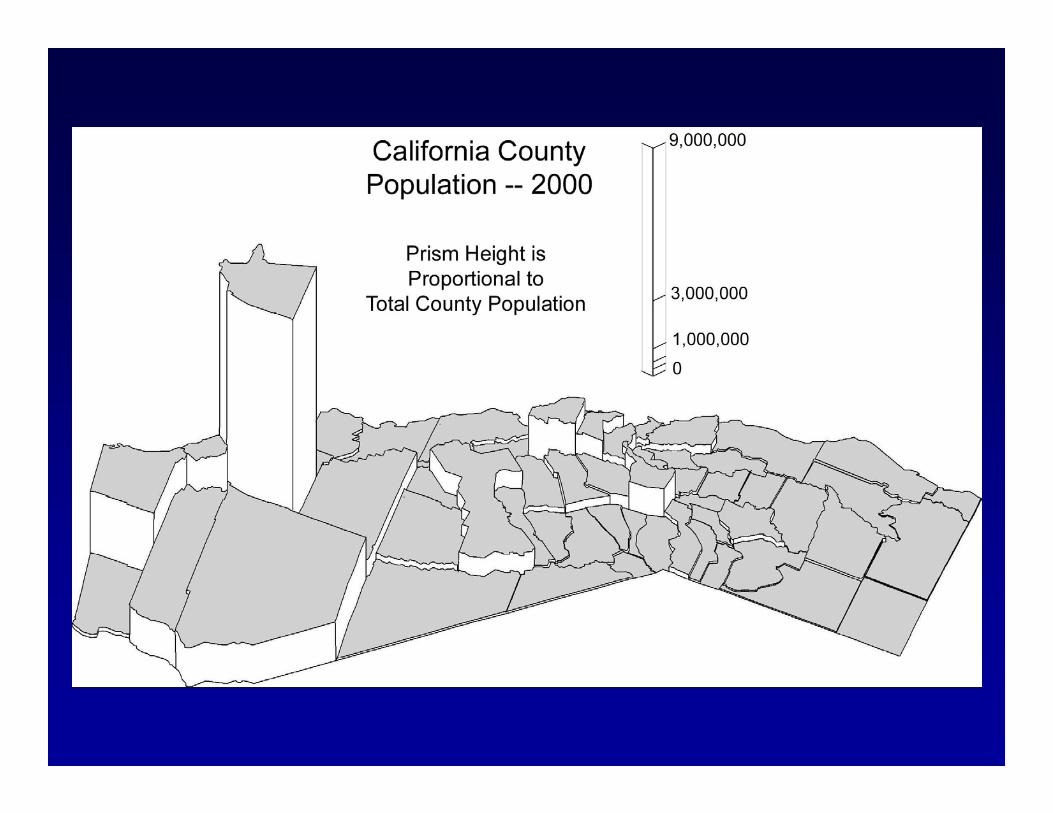
• Proportional symbol map– Size of symbol represents data value
magnitudes
Comparison of thematic maps- limitations -
• See four maps in Figure 4.9, and discuss limitations of each mapping technique
• So what would you suggest as important criteria in selecting the appropriate map?
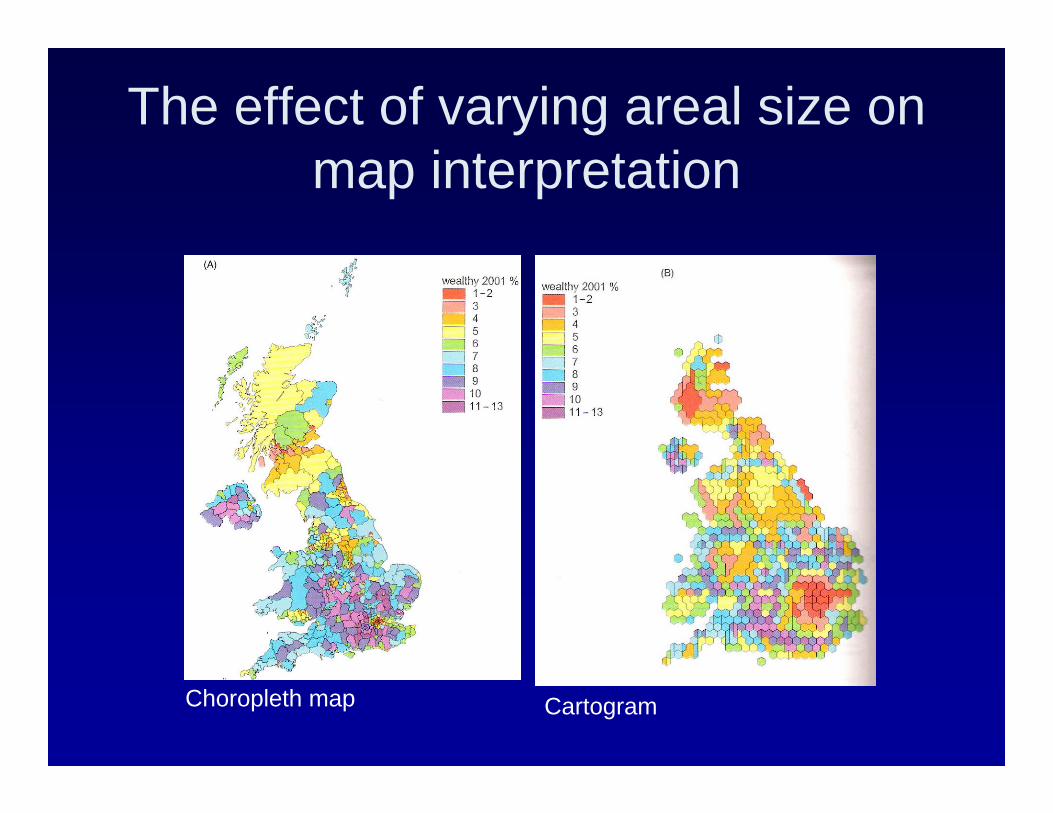
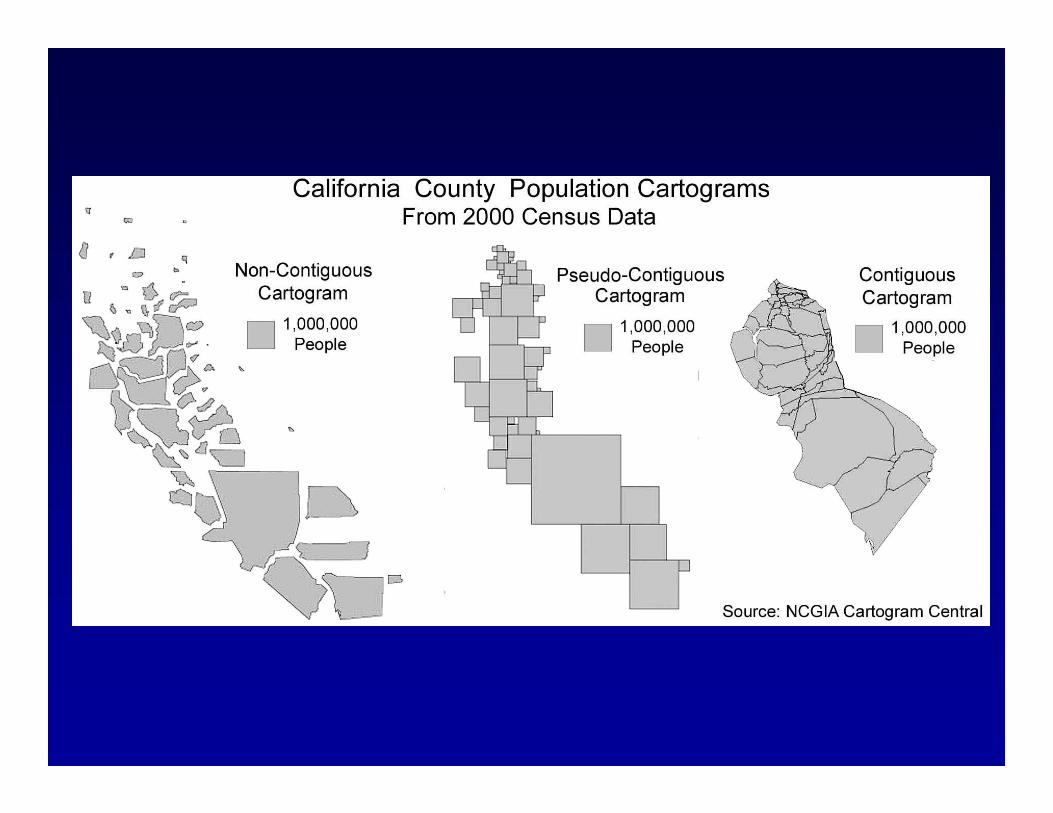
The effect of varying areal size on map interpretation
Choropleth map Cartogram
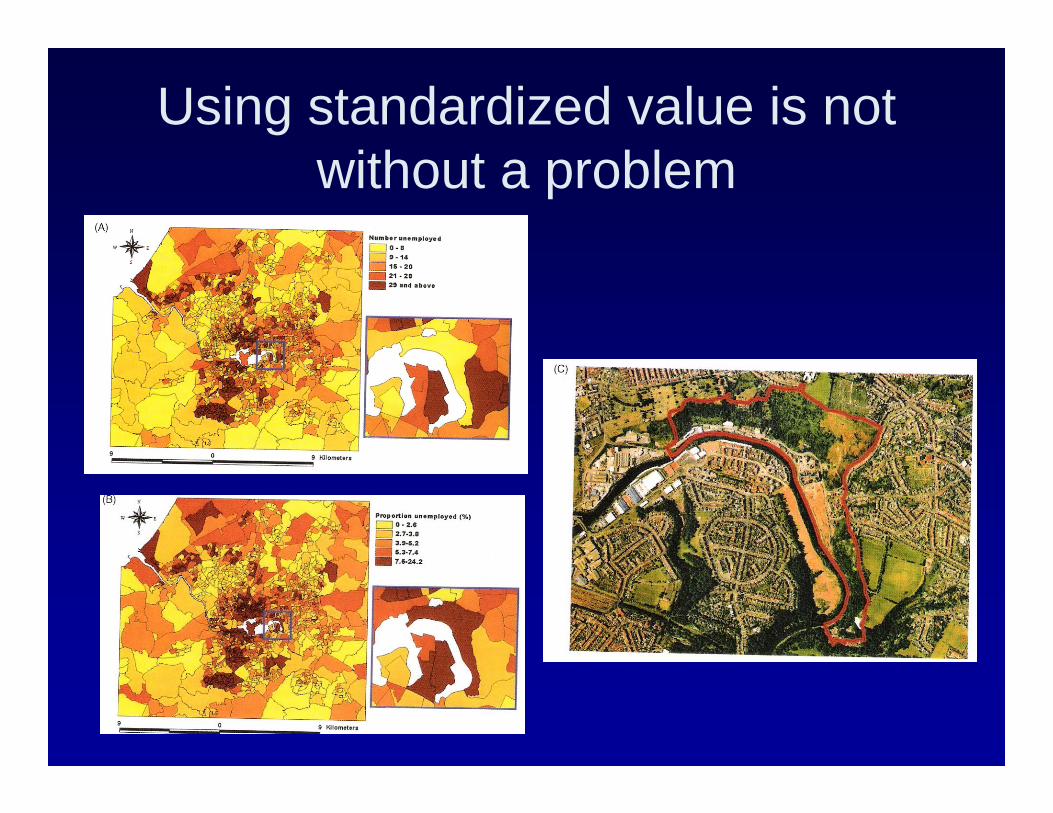
Using standardized value is not without a problem
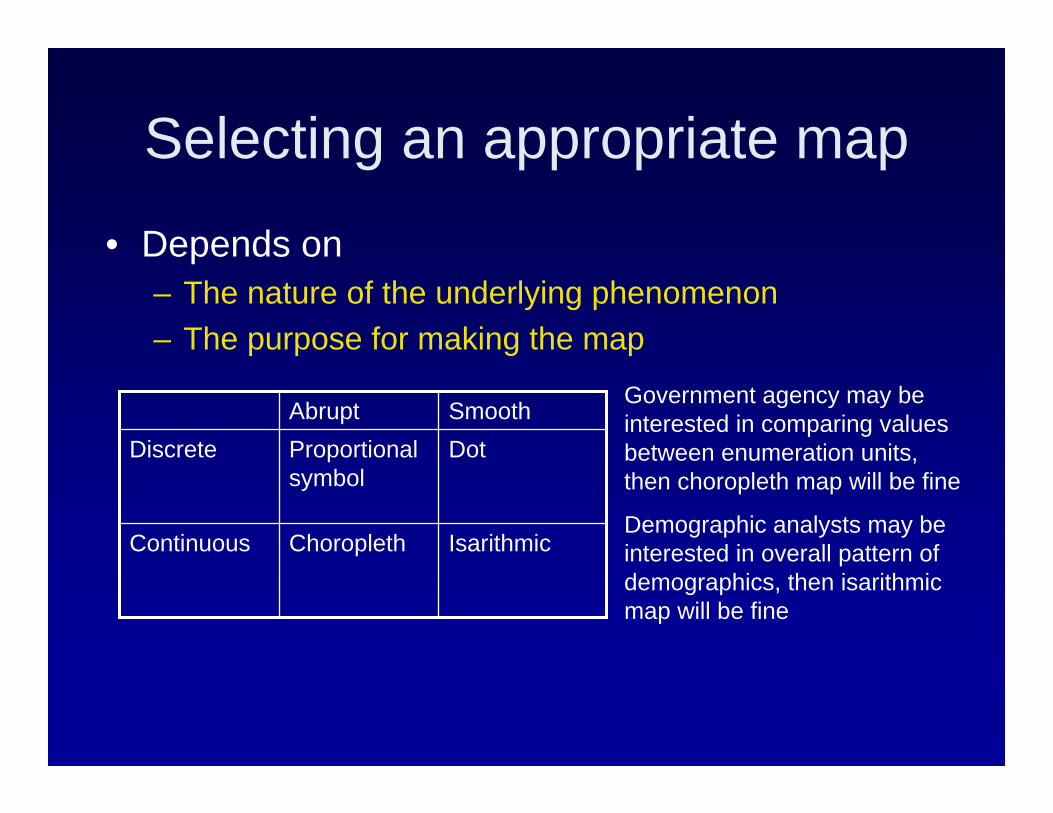
Selecting an appropriate map
• Depends on – The nature of the underlying phenomenon– The purpose for making the map
IsarithmicChoroplethContinuous
DotProportional symbol
DiscreteSmoothAbrupt
Government agency may be interested in comparing values between enumeration units, then choropleth map will be fine
Demographic analysts may be interested in overall pattern of demographics, then isarithmicmap will be fine
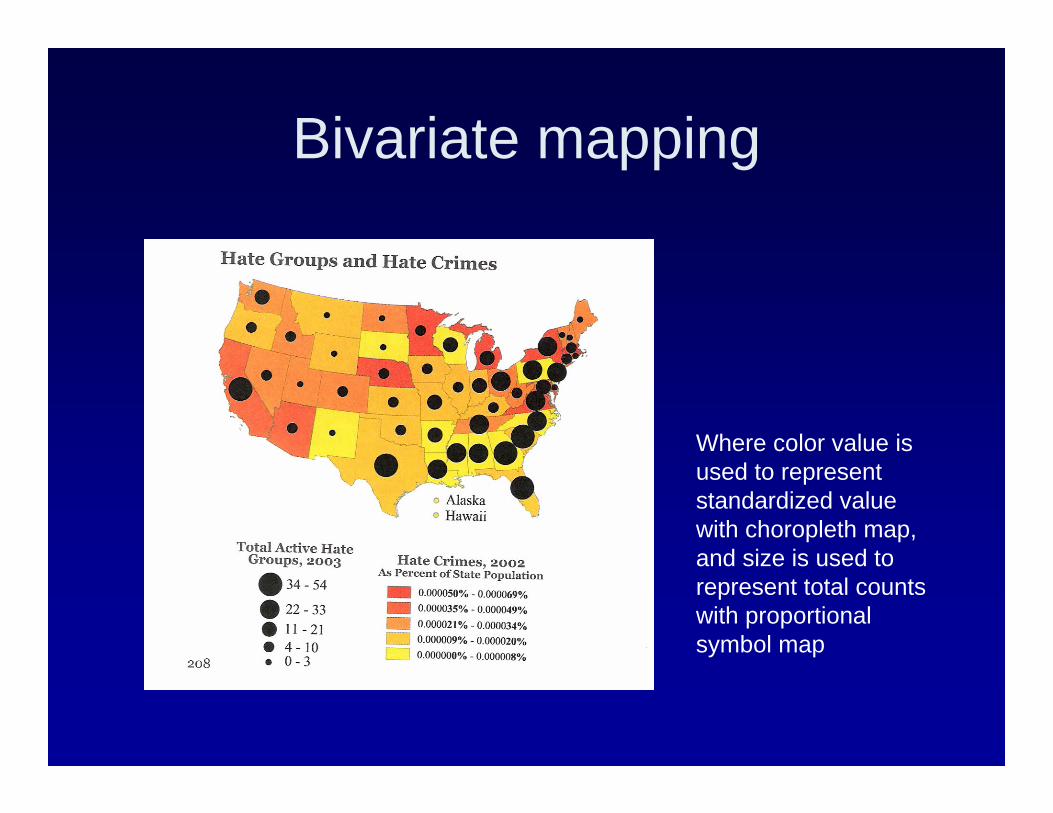
Bivariate mapping
Where color value is used to represent standardized value with choropleth map, and size is used to represent total counts with proportional symbol map
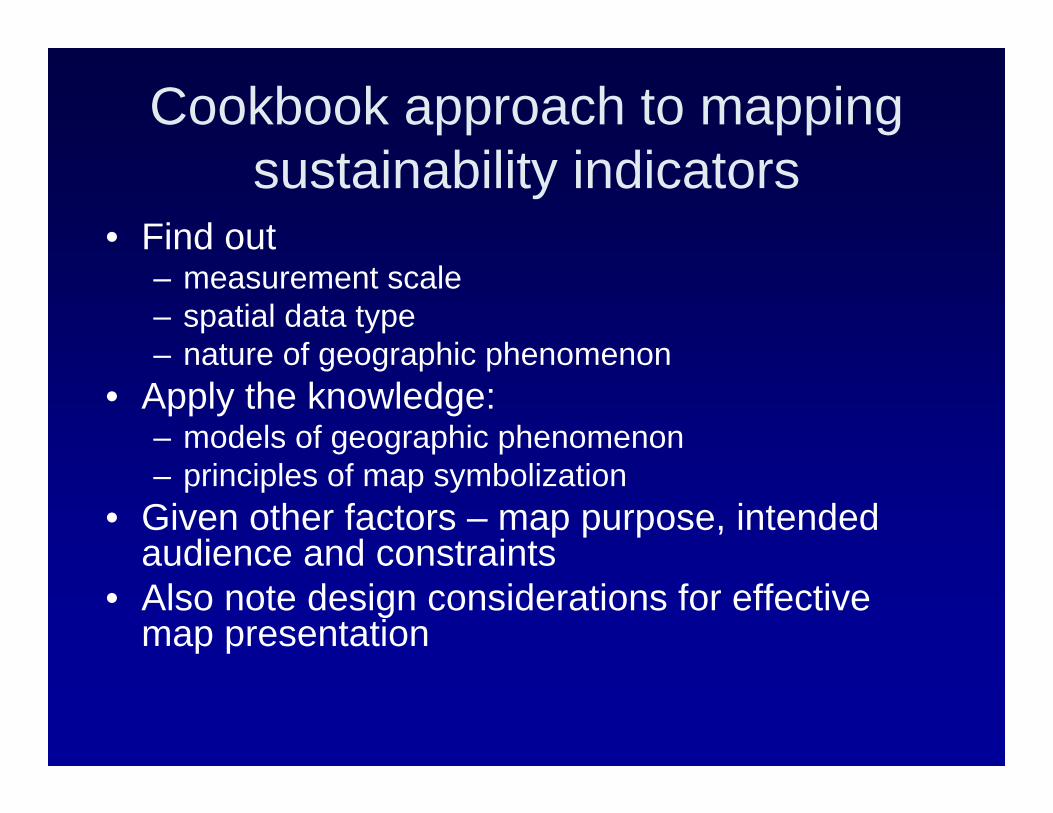
Cookbook approach to mapping sustainability indicators
• Find out– measurement scale – spatial data type – nature of geographic phenomenon
• Apply the knowledge:– models of geographic phenomenon– principles of map symbolization
• Given other factors – map purpose, intended audience and constraints
• Also note design considerations for effective map presentation
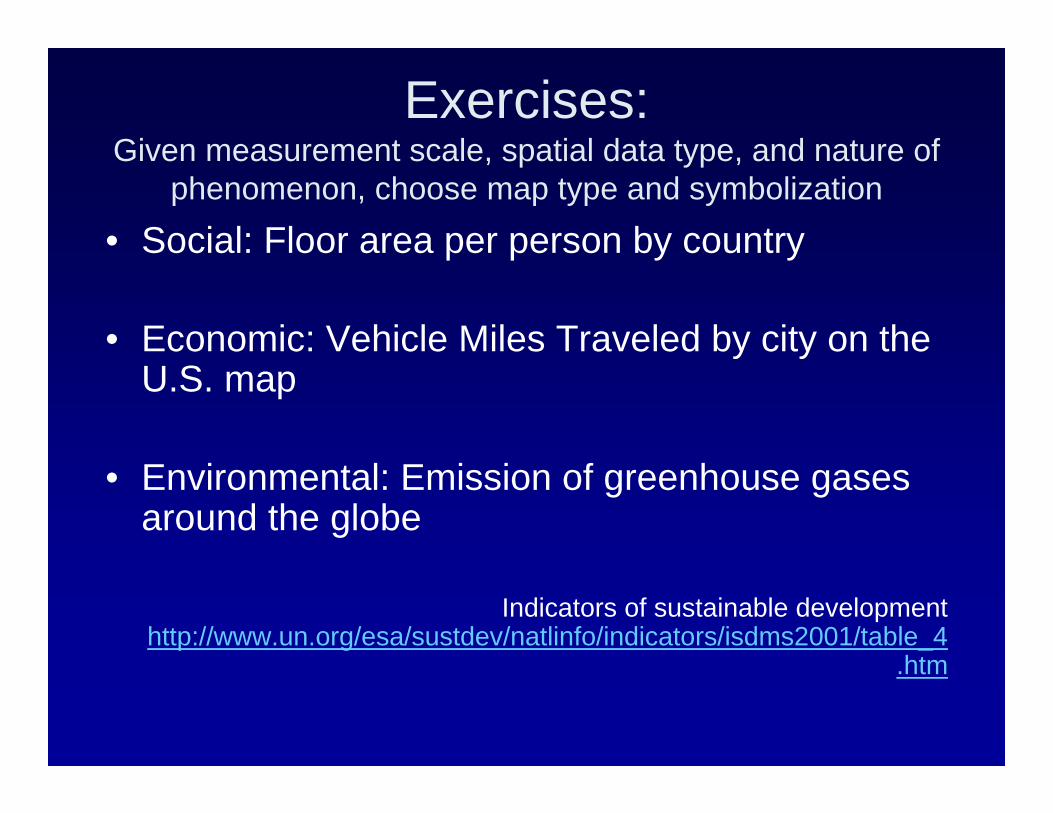
Exercises:Given measurement scale, spatial data type, and nature of
phenomenon, choose map type and symbolization
• Social: Floor area per person by country
• Economic: Vehicle Miles Traveled by city on the U.S. map
• Environmental: Emission of greenhouse gases around the globe
Indicators of sustainable development http://www.un.org/esa/sustdev/natlinfo/indicators/isdms2001/table_4
.htm
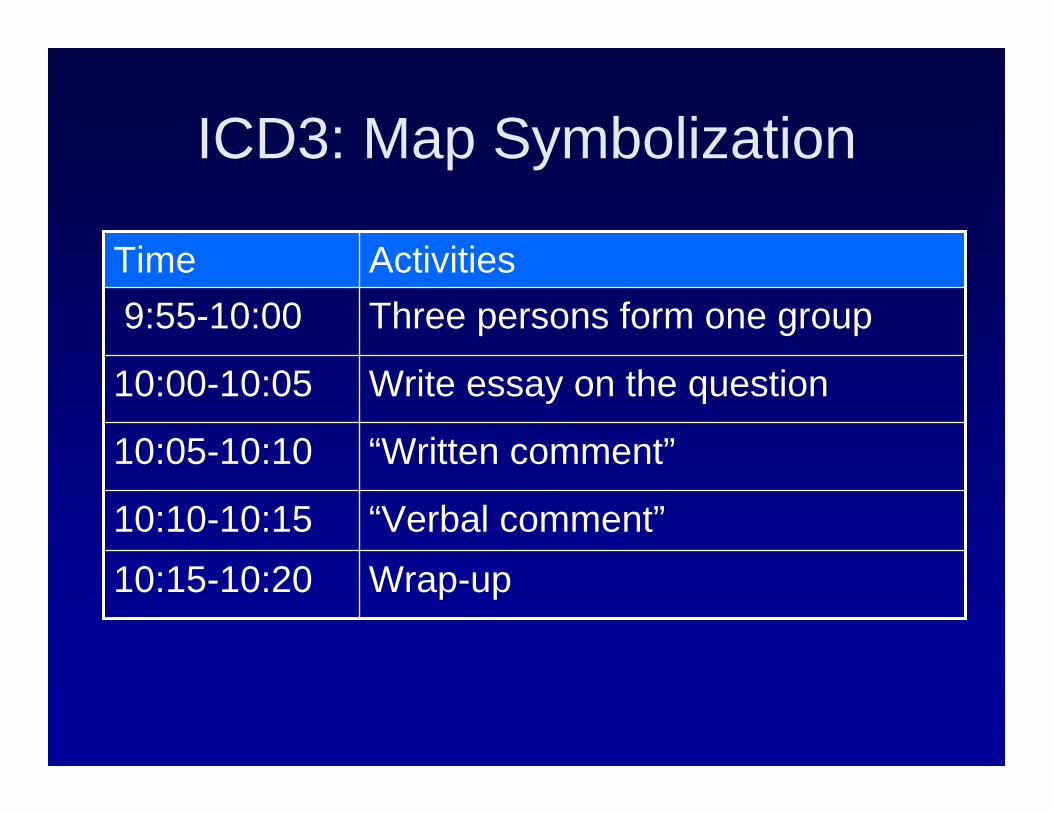
ICD3: Map Symbolization
Wrap-up10:15-10:20“Verbal comment”10:10-10:15
“Written comment”10:05-10:10
Write essay on the question10:00-10:05
Three persons form one group9:55-10:00ActivitiesTime